Article

Using Ground Targets to Validate S-NPP VIIRS Day-Night Band Calibration

1
Science Systems and Applications Incorporation, Lanham, MD 20706, USA
2
NASA Goddard Space Flight Center, Greenbelt, MD 20661, USA
*
Author to whom correspondence should be addressed.
Remote Sens. 2016, 8(12), 984; https://doi.org/10.3390/rs8120984
Submission received: 29 June 2016 / Revised: 15 November 2016 / Accepted: 22 November 2016 / Published: 30 November 2016
(This article belongs to the Collection Visible Infrared Imaging Radiometers and Applications)

Abstract

:
In this study, the observations from S-NPP VIIRS Day-Night band (DNB) and Moderate resolution bands (M bands) of Libya 4 and Dome C over the first four years of the mission are used to assess the DNB low gain calibration stability. The Sensor Data Records produced by NASA Land Product Evaluation and Algorithm Testing Element (PEATE) are acquired from nearly nadir overpasses for Libya 4 desert and Dome C snow surfaces. A kernel-driven bidirectional reflectance distribution function (BRDF) correction model is used for both Libya 4 and Dome C sites to correct the surface BRDF influence. At both sites, the simulated top-of-atmosphere (TOA) DNB reflectances based on SCIAMACHY spectral data are compared with Land PEATE TOA reflectances based on modulated Relative Spectral Response (RSR). In the Libya 4 site, the results indicate a decrease of 1.03% in Land PEATE TOA reflectance and a decrease of 1.01% in SCIAMACHY derived TOA reflectance over the period from April 2012 to January 2016. In the Dome C site, the decreases are 0.29% and 0.14%, respectively. The consistency between SCIAMACHY and Land PEATE data trends is good. The small difference between SCIAMACHY and Land PEATE derived TOA reflectances could be caused by changes in the surface targets, atmosphere status, and on-orbit calibration. The reflectances and radiances of Land PEATE DNB are also compared with matching M bands and the integral M bands based on M4, M5, and M7. The fitting trends of the DNB to integral M bands ratios indicate a 0.75% decrease at the Libya 4 site and a 1.89% decrease at the Dome C site. Part of the difference is due to an insufficient number of sampled bands available within the DNB wavelength range. The above results indicate that the Land PEATE VIIRS DNB product is accurate and stable. The methods used in this study can be used on other satellite instruments to provide quantitative assessments for calibration stability.

Graphical Abstract

1. Introduction

1.1. NPP VIIRS Sensor Overview

The Suomi National Polar-orbiting Partnership (S-NPP) is one of the modern Earth-orbiting Earth-observing weather satellites. Since S-NPP was launched successfully on 28 October 2011 from Vandenberg Air Force Base in California, it has provided observations of the entire Earth’s surface twice daily, including the land, ocean, and atmosphere. S-NPP represents a bridge providing consistent and continuous observation data between NASA’s Earth Observing System (EOS) satellites and the Joint Polar Satellite System satellites [1,2,3]. The five instruments onboard S-NPP are the Visible Infrared Imaging Radiometer Suite (VIIRS), the Cross-Track Infrared Sounder, the Ozone Mapping and Profiler Suite, the Advanced Technology Microwave Sounder, and the Cloud and Earth Radiance Energy System.
VIIRS is designed based on the Moderate Resolution Imaging Spectroradiometer (MODIS) heritage, and is a wide-swath (3034 km), cross-track scanning radiometer which observes the Earth’s surface in 22 visible and infrared spectral bands (0.4–12.5 μm). Among the 22 spectral bands, there are 15 reflective solar bands (RSB) and 7 thermal emissive bands (TEB). The VIIRS observation altitude is 828 km and its Earth view observation scan angle range is ±56.28° off nadir. The VIIRS instrument was powered on 8 November 2011 and the instrument nadir door was opened on 21 November 2011. Among the RSB, the DNB on VIIRS is a visible/near-infrared panchromatic band, which can observe the Earth during both daytime and nighttime. The spatial resolution of the DNB is 750 m at nadir and there are 32 aggregation zones through each half of the instrument swath on either side of nadir. These aggregation zones are designed to maintain a near 750 m spatial resolution for pixels away from the nadir. In order to provide imagery of clouds and Earth targets from full sunlight to quarter moon illumination status, the DNB comprises three gain stages: the low gain stage (LGS), the medium gain stage (MGS), and the high gain stage (HGS). The LGS is used for observing bright earth scenes at day time, the MGS is used for scenes near the terminator or at twilight, and the HGS is used for night scenes. In our study, we focus on the DNB LGS performance. The M4 to M7 wavelength ranges are the matching M bands within the DNB wavelength range. Of these bands, M4, M5, and M7 have Low Gain and High Gain stages. Table 1 lists characteristics for the DNB for the narrower bandpass bands M4 through M7.

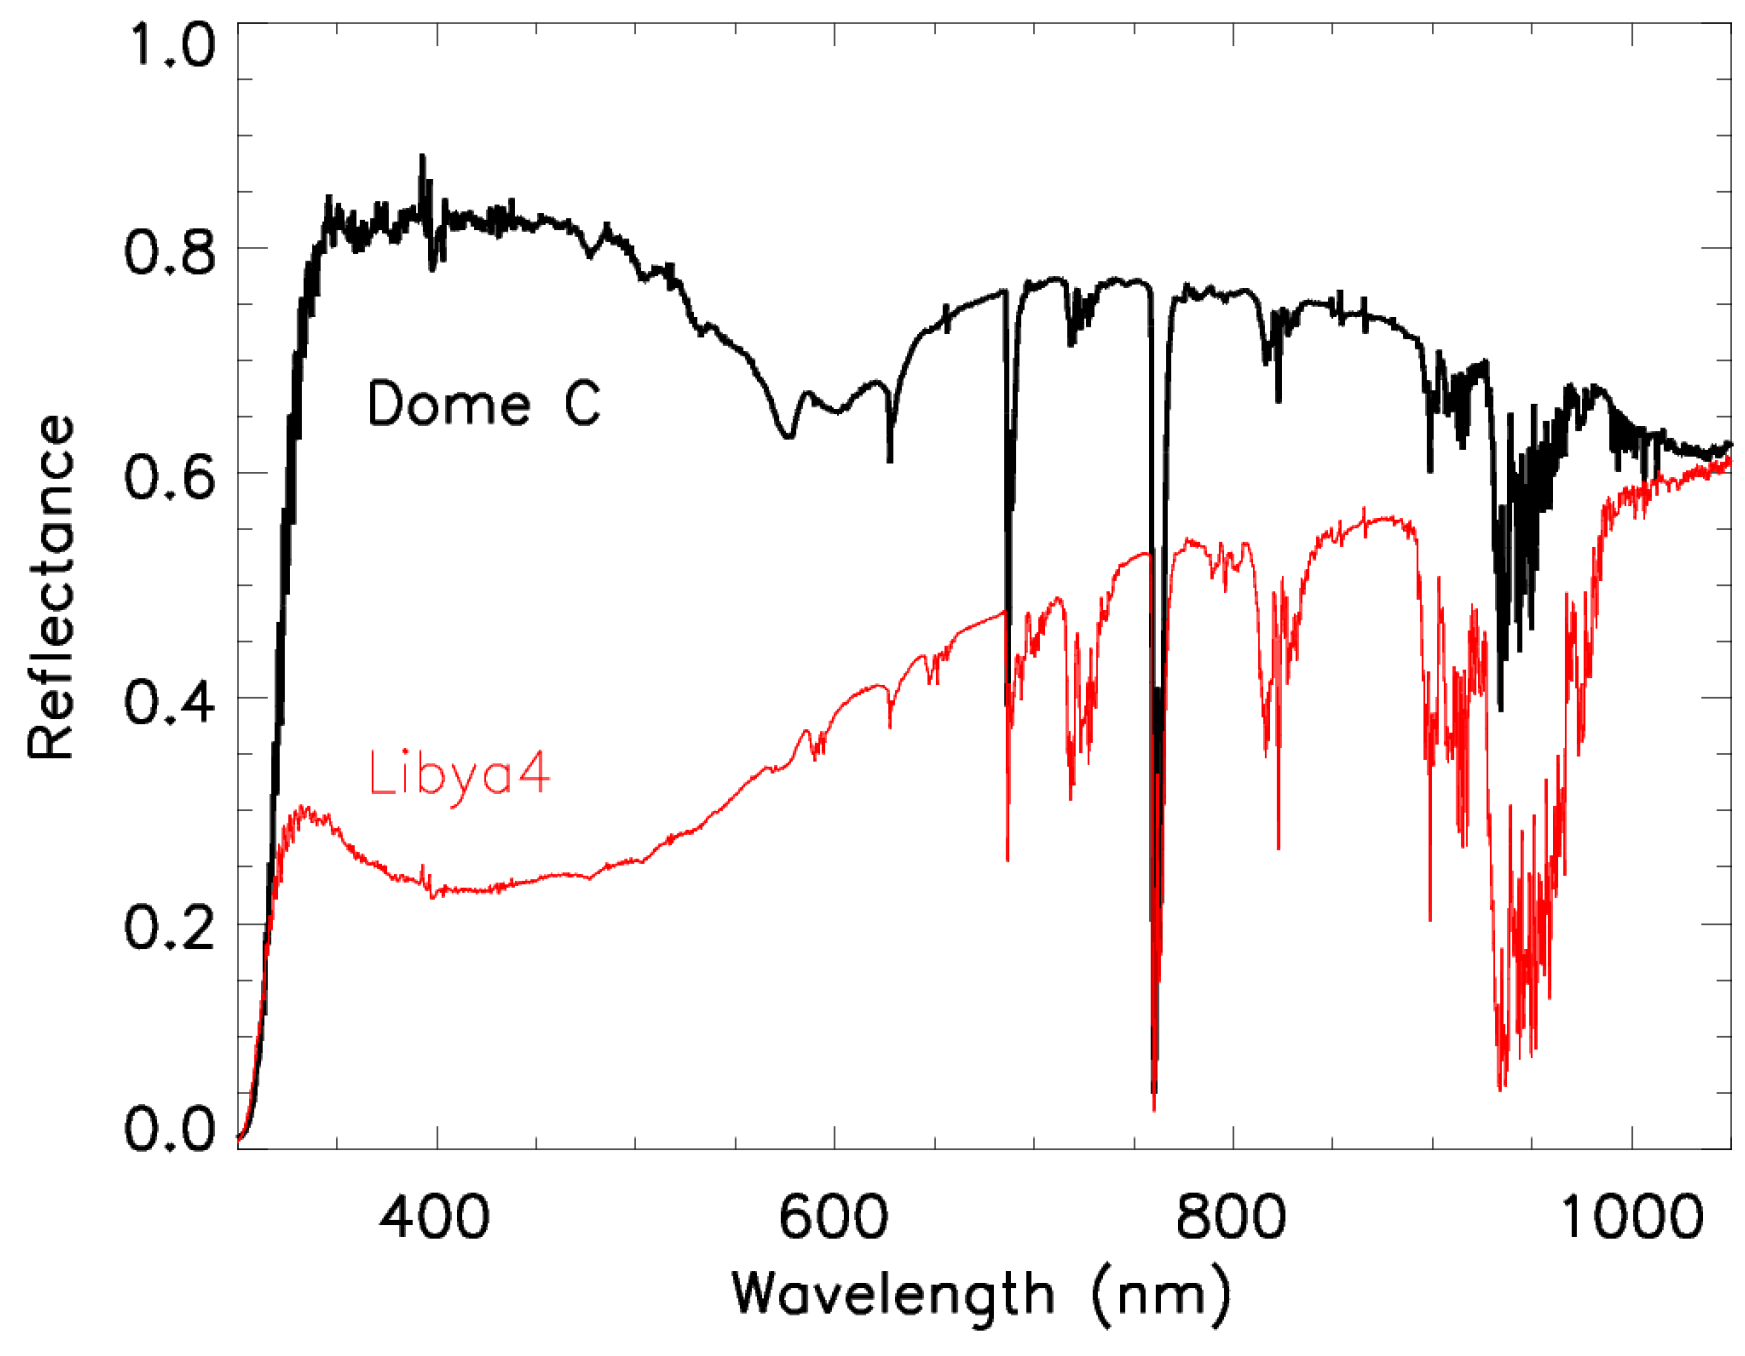
1.2. Reference Sites

Several Earth surface sites with stable radiometric characteristics are widely used as references to monitor satellite sensor long-term stability [4,5,6,7]. In this study, we chose the Libya 4 desert site and Dome C in Antarctica as reference sites, as they have been used extensively in previous studies to monitor satellite performance.
The Libya 4 desert site (Latitude: 28.55°N, Longitude: 23.39°E) is close to horizontally uniform and is a relatively homogeneous area covered by sands in Africa [4,5]. The Libya 4 site is often selected as a calibration study site based on its high spatial uniformity and temporally invariant surface cover properties for stable reflectance and bidirectional reflectance distribution function (BRDF) [4,5,8,9,10]. This site is located in an arid region and thus has a low probability of cloudy weather and precipitation.
The Dome C site (Latitude: 74.50°S, Longitude: 123.00°E) is one of the several plateaus on the Antarctic ice sheet and it is considered to be a nearly homogeneous surface [5,6,7]. Located in the east Antarctic, Dome C is covered by snow and has an extremely small terrain surface slope. The altitude of the site is 3200 m. Its uniformity properties produce temporally invariant reflectance and BRDF spectral response [11,12]. It has a clear atmosphere with minimized influence of aerosol and atmospheric water vapor when compared with other reference sites [12]. Since the Dome C site is close to the South Pole of the Earth, VIIRS can make several overpasses in any given day and it is easy to find a good daytime image near nadir observation during the southern hemisphere summer period, from October to March [9].

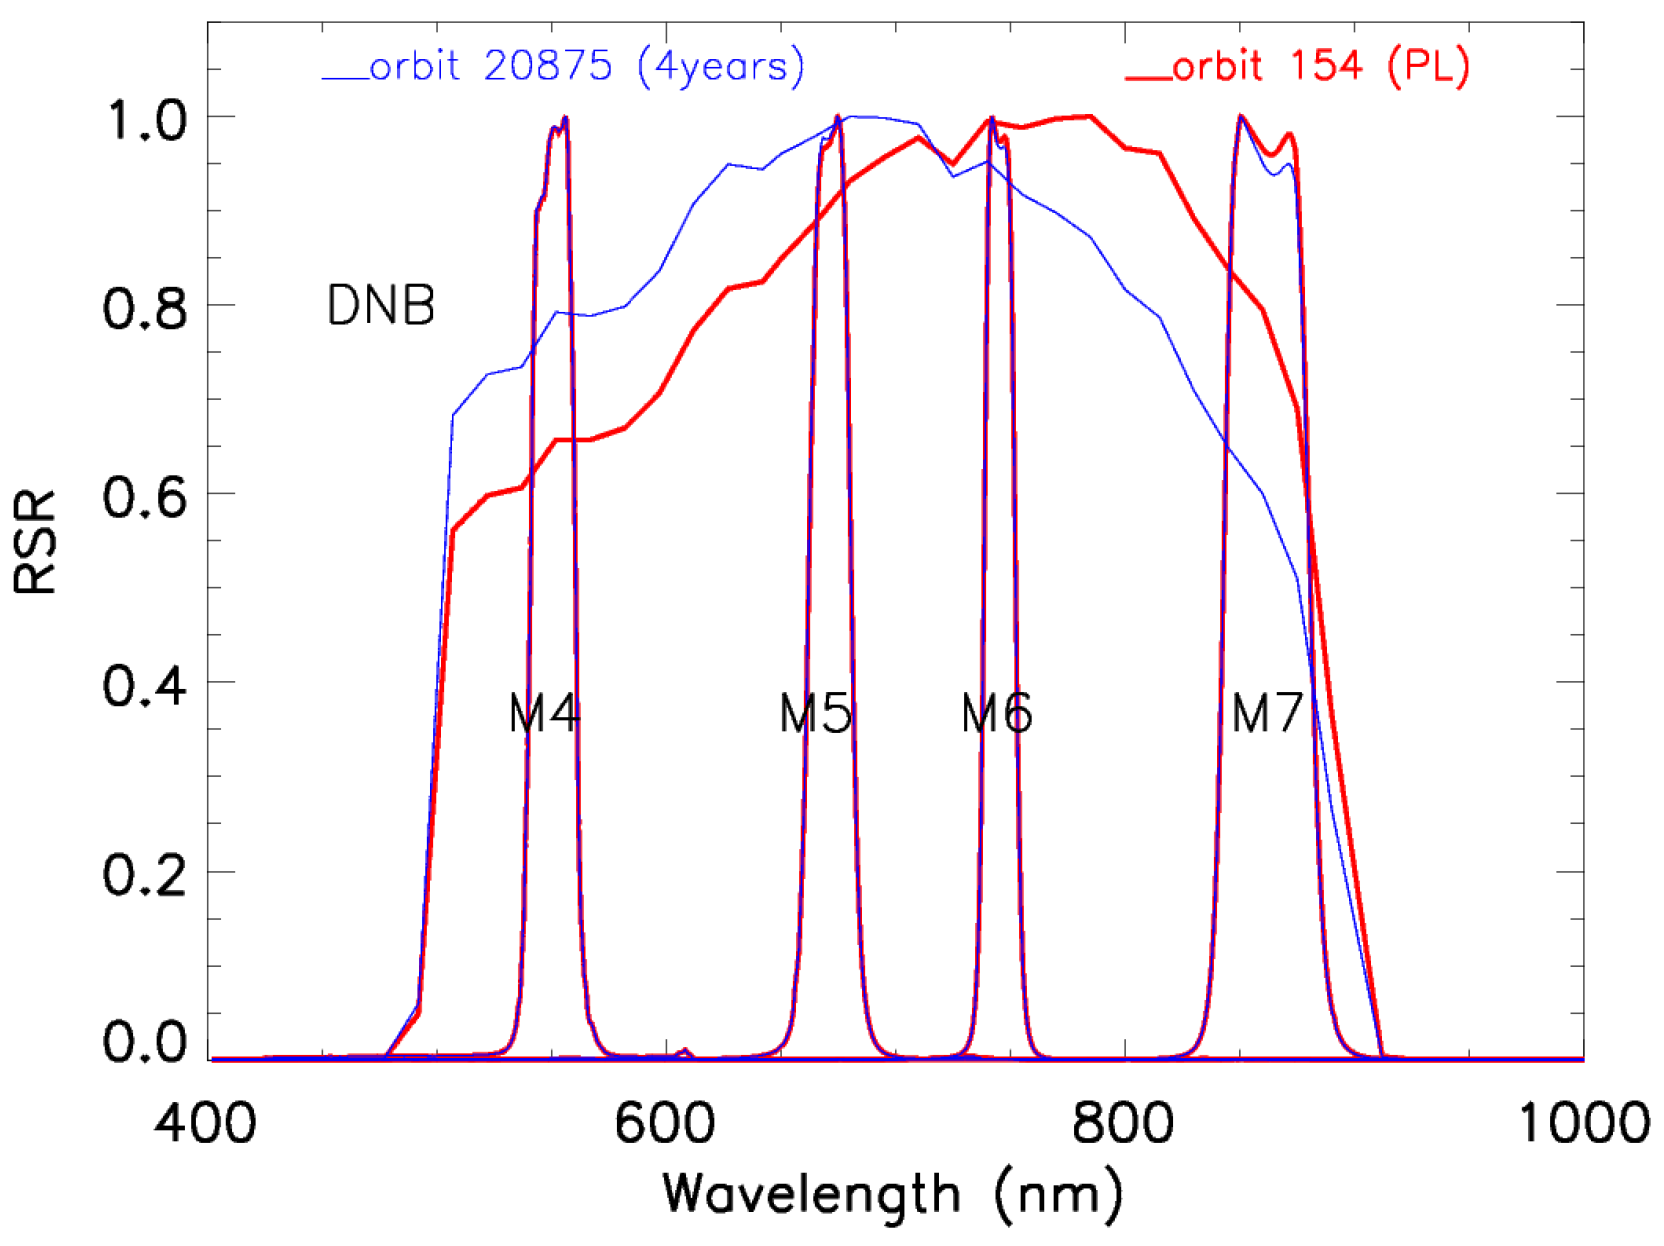
1.3. Relative Spectral Response (RSR)

Prelaunch RSRs of all VIIRS bands were measured during sensor thermal vacuum testing. A double monochromator operating in subtractive mode was used to collect spectral test data in the lab environment for generating VIIRS RSRs [13,14]. Shortly after S-NPP launch, it was observed that several VIIRS reflective bands had decreased optical throughput due to the contamination of the mirror coating on the rotating telescope assembly (RTA) [1,15,16], which also caused the RSRs to change over time. Without updating the RSRs, the sensor radiometric calibration and the computed top-of-the-atmosphere (TOA) spectral reflectance delivered in the Sensor Data Records (SDRs) could be biased [17].
The modulated RSR is derived from a wavelength-dependent optical throughput degradation model developed by NASA VIIRS Characterization Support Team (VCST) [13]. These modulated band-averaged RSRs are generated at different times during SNPP mission, and are used to update post-launch SDR Look-Up-Tables (LUT) to correct the RTA mirror contamination effect [15,18,19,20]. Figure 1 shows DNB and M4–M7 RSRs at orbit 154 (8 November, 2011, same as prelaunch RSRs) and at orbit 20875 (8 November 2015, four years after launch). The near infrared bands have been more affected by RTA contamination than those in the visible wavelength range. In the past four years, the DNB RSR peak wavelength has shifted to shorter wavelengths with the peak RSR wavelength changing from 784 nm to 680 nm. Based on the degradation observation and analysis in the past, the RSRs have been more stable now than in the past, and may change less in the future.

1.4. VIIRS Radiometric Calibration Stability

Radiometric calibration is the process of characterizing the instrument response to signal inputs, which usually are known, controlled, and stable [21]. Through the calibration process, systematic errors may be discovered and evaluated and can also help to determine the relative biases between different instruments. Calibration stability aims to measure the relative on-orbit calibration change and bias with time [22]. When a sensor’s calibration is stable and consistent, the response of that sensor to the same inputs is repeatable, traceable, and expectable over time [22]. Calibration stability studies usually look at long-term records, which are built upon current calibration methodologies, and consider all of the currently known system errors. These long-term records could be stable if the instrument and the inputs are stable whereas the records could experience jumps and drifts when new events occur over the sensor mission period. New systematic errors can be identified when specific causes are found to produce the specific effect that causes a drift of the observations. Long-term calibration stability can be achieved by frequently monitoring the instrument performance and recalibration with all the discovered system errors. Calibration stability can also evaluate whether the sensor meets mission requirements with an accurate interpretation of the data in order to make mission decisions.
The fine spatial resolution of VIIRS RSB and DNB products allow science community users to develop global surface type classification products [23], to estimate light power [24], to study nighttime lighting patterns [25], to monitor nighttime surface air quality [26], to monitor and forecast land surface phenology [27], and to research other topics. These growing interests bring a greater need for better understanding the calibration stability and absolute accuracy of the VIIRS RSB and DNB products.
The VIIRS RSB and DNB on-orbit calibration methodology used by the VCST has been described in several studies [1,13,18,19,20,28,29]. Some studies in the past have also demonstrated independent techniques for validation of VIIRS on-orbit calibration using Earth view data. Uprety et al. [10,30,31] have analyzed the stability of VIIRS RSB in the past few years through inter-comparison with Aqua MODIS and Landsat 8 OLI at Libya 4, Sudan 1, Dome C, and Ocean sites. Wu et al. [9] have done an assessment of the radiometric calibration stability of the first three years of VIIRS visible and near infrared spectral bands using measurements from Suomi-NPP VIIRS and Aqua MODIS simultaneous nadir overpasses over the Libya 4 and Dome C sites. Bhatt et al. [8] and Wang and Cao [32] have also assessed the VIIRS RSB using Libya 4 and deep convective clouds. Chen et al. [33] have validated the VIIRS DNB performance at Libya 4 and Dome C using both NOAA Interface Data Processing Segment (IDPS) and the NASA Land Product Evaluation and Algorithm Testing Element (PEATE) data. Before 5 April 2013, IDPS did not have accurate data due to the prelaunch RSR LUT. After excluding data before 5 April 2013, IDPS DNB radiance data are consistent with Land PEATE data with 0.6% or less difference for Libya 4 and 2% or less difference for Dome C [33]. Time series of the bridge light data are also used to validate the stability of the light measurements and the calibration of VIIRS DNB radiance [24]. These results indicate that the VIIRS variability is less than 0.6% per year for RSB and 2.5% for shortwave infrared (SWIR) bands [8,9]. The difference between the absolution calibration of VIIRS and MODIS for most bands are within 2.0% [9,10,30,32]. The global surface classification type products generated using S-NPP VIIRS data maintain (78.64% ± 0.57%) overall accuracy [23].
Some research used Simultaneous Nadir Overpass (SNO) data with similar geometry angles from two or more sensors which allowed for inter-comparison [9,30,32]. The SNO method is relatively simple and robust. Since it is possible that a pair of polar-orbiting satellites can observe the same point on the Earth’s surface at nearly the same time close to nadir, there can be very little ground surface and atmospheric path difference for observed collocated pixels [22]. However, SNO calibration alone is not sufficient to produce a long-term time series for absolute calibration. The difference in the spectral response functions between different sensors and the change of surface targets for different SNO observations can introduce uncertainties in long-term data records and makes the inter-calibration results difficult to understand. The SNO method is more efficient if one satellite has an accurate absolute calibration and can be used as a stable standard for other sensors.
Other research uses pseudo-invariant ground targets, such as desert, snow, bridge light power, and deep convective clouds, for sensor calibration and validation [4,8,10,24,32,33]. There are several advantages of using pseudo-invariant ground targets for validation. The ground targets are usually selected based on their spectral and spatial uniformity and radiometric stability, thus they have minimal effects from the environment and are suitable for long-term monitoring. The ground sites are usually accessible for ground-based measurements of the radiometric calibration and the measurements can be done if it is necessary. In addition, monitoring the ground targets long-term trends allows for investigation of the influence from RSRs changes, F-factor calculation, and other onboard calibration events [32,33].
Besides the above research, our study is the first one to validate the VIIRS DNB most recent radiometric calibration quality at two Earth view targets using the NASA Land PEATE products. The main objective in this research is to track the first four years of on-orbit calibration stability of the VIIRS DNB and M bands (M4, M5, and M7) using two stable ground reference sites, Libya 4 and Dome C. In the above paragraphs, we have presented an overview of the instrument, study sites, RSRs, and previous study results. In the Section 2, we describe the derivation of the data and the methodology. In Section 3, we provide analysis and the results. Finally, in Section 4, we summarize our findings and conclusions. The results shown in this paper are useful for validating the current VIIRS instrument calibration stability and can help guide future calibration algorithm improvements and data reprocessing. The methods can be adopted for validating other instruments on board satellites, such as Moderate Resolution Imaging Spectroradiometer (MODIS), Satellites Pour l’Observation de la Terre or Earth-observing Satellites (SPOT), China Brazil Earth Resources Satellite (CBERS), and future Joint Polar Satellite System (JPSS).

2. Data and Methodology

2.1. Data

The data products used in this study are provided by the NASA Land PEATE which can be downloaded from Level 1 and Atmosphere Archive and Distribution System (LAADS) C1.1 Reprocessing version (http://ladsweb.nascom.nasa.gov/). Three products were downloaded including NPP_VDNE_L1-VIIRS/NPP Day/Night Band 5-Min L1 Swath SDRs 750 m, NPP_VMAE_L1-VIIRS/NPP Moderate Resolution 5-Min L1 Swath SDRs, and GEO 750 m. We selected the data to be near nadir overpasses of Libya 4 and Dome C to cover the period between S-NPP launch and January 2016. The Land PEATE data has been reprocessed with improved calibration algorithms and LUTs [9,20,34]. In this study, the solar irradiance LUT is provided from the Aerospace Corporation and the modulated RSR LUTs are provided by the VCST. Among the data we used, the on-orbit SDSM screen transmission functions combined with the solar diffuser BRDF functions were generated from both yaw maneuver and regular on-orbit data conducted early in the mission [20] and the RSR functions have been updated on 31 March 2012, 15 July 2012, and 1 February 2013 and were implemented in data processing.
Images are visually examined and we exclude those with visible clouds or shadow over the Libya 4 and Dome C sites. In addition, the distances from the study site center pixel to nadir are less than 60 pixels, which is about 45 km on ground distance, and the satellite zenith angles are less than 3.5 degrees. The solar zenith angle range is from 14 to 55 degrees for Libya 4 and from 58 to 70 degrees for Dome C. We extract 32 × 32 pixels to calculate the DNB mean radiance and reflectance and use co-located 32 × 32 M bands pixels to calculate the M bands mean radiance and reflectance. All observations are at daytime, thus the DNB data are all observed in low gain stage at both the Libya 4 site and the Dome C site. At the Libya 4 site, M1 and M2 bands are in the high gain stage; M3 band has both high gain and low gain stage observation due to different seasons; and M4, M5, and M7 bands are all in the low gain stage. At the Dome C site, all dual gain M bands observations are in the low gain stage. More details on the algorithm are provided in Section 2.2. We also exclude the data that have shown less homogeneity, where the standard deviation of the DNB radiances is higher than 0.0001 (W·cm−2·Sr−1). Based on the above requirements, Libya 4 and Dome C site images are selected from 16-day repeatable orbits so all data have approximately the same viewing geometry relative to the site.

2.2. Calculate Radiance and Reflectance Data

DNB SDRs include calibrated and geolocated radiance data, while the M band SDRs contain both radiance and reflectance data. Lm is provided by the DNB SDRs product directly, which is calibrated considering the response versus scan angle of a rotating half angle mirror and the solar diffuser BRDF degradation using the time-dependent modulated RSR [1,15]. The DNB radiance with the Earth-Sun distance, solar zenith angle, and RSR normalization are calculated using the following Equations (1)–(4).
L n o r m a l i z e d = L m × d 2 cos ( θ )
L r s r _ n o r m a l i z e d = L m × d 2 cos ( θ ) × F E S U N
E S U N t = ( R S R λ , t × S o l a r I r r a d i a n c e λ × Δ λ ) ( R S R λ , t × Δ λ )
F E S U N = E S U N t E S U N t 0
L n o r m a l i z e d = Measured solar radiance after Earth-Sun distance and solar zenith angle normalization (W·cm−2·Sr−1).
L r s r _ n o r m a l i z e d = Measured solar radiance after Earth-Sun distance, solar zenith angle, and RSR normalization (W·cm−2·Sr−1).
F E S U N = Ratio of solar irradiance (ESUN) between the data collection time t and the reference time t0 (prelaunch at orbit 154).
L m = Measured solar radiance imported from the SDRs DNB product (W·cm−2·Sr−1).
d = Earth-Sun distance (astronomical units).
θ = Solar zenith angle (degree).
E S U N t = Band dependent and time dependent mean solar irradiance (W·m−2·nm−1). The summation is taken over lambda ranging from 200 nm to 200,000 nm.
S o l a r I r r a d i a n c e λ = Solar spectral irradiance (W·m−2·nm−1).
R S R λ , t = Wavelength dependent and time dependent relative spectral response of band λ at time t.
Δ λ = Wavelength spectral interval (nm).
To retrieve the DNB TOA reflectance data, we use the Equation (5).
ρ n o r m a l i z e d = π × L m × d 2 cos ( θ ) × E S U N t
ρ n o r m a l i z e d = Top of atmosphere reflectance with Earth-Sun distance, solar zenith angle, and RSR normalization.
M bands radiance ( L m _ M b a n d ) and reflectance ( ρ n o r m a l i z e d _ M b a n d ) data are calculated by using the scaled integer (SI), scale, and offset values provided by the SDRs products following Equations (6)–(9).
L m _ M b a n d = S I × s c a l e + o f f s e t
L n o r m a l i z e d _ M b a n d = L m _ M b a n d × d 2 cos ( θ )
L r s r _ n o r m a l i z e d _ M b a n d = L m _ M b a n d × d 2 cos ( θ ) × F E S U N
ρ n o r m a l i z e d _ M b a n d = π × L m _ M b a n d × d 2 cos ( θ ) × E S U N t

2.3. A Kernel-Driven BRDF Correction Model

When we use satellite data from inter-comparison sensors, as well as from adjoining paths or long term time series data of the same sensor, a BRDF model is required to remove the anisotropy influence from the surface and different geometry angles [9,30,32,35]. In this study, we use a semi-empirical BRDF correction model, consisting of two kernel-driven components [36]. This model has been found to be functional when applied to reflectances observed by MODIS over the Libya desert and Antarctic surface sites and by Landsat 7 Enhanced Thematic Mapper Plus over Sonoran and Libya desert sites [4,5].
This BRDF model assumes that the ground target subpixel surface contains a large number of identical protrusions with rectangular and vertical wall shapes. These protrusions are randomly distributed on a horizontal surface. The calculation of the BRDF relies on the empirical weighted sum of two functions (or kernels) of view and illumination geometry and an isotropic parameter [4,5,36].
The kernel-driven BRDF corrected radiance or reflectance R is expressed as Equation (10) [36]:
R i ( θ ,   φ ,   ψ ) = K 0 i + K 1 i f 1 i ( θ ,   φ ,   ψ ) + K 2 i f 2 i ( θ ,   φ ,   ψ )
where θ, ϕ are the solar zenith, satellite view zenith angles; ψ is the relative azimuth angle between the solar and the satellite sensor directions with value from 0 to π; i is the index for the band wavelength; f1 is estimated from the bidirectional radiance/reflectance associated with the geometric scattering component of the geometrical structure of opaque reflectors on the subsurface and shadowing effects, while f2 is derived from the volume scattering contribution by a collection of dispersed facets which simulates the volume scattering properties of surface features such as canopies, bare soils, sands, and other factors. Coefficients K0, K1, and K2 are parameters related to the surface’s subpixel-scale physical structure, optical properties, and the background and protrusion reflectance. The parameter K0 also represents the bidirectional reflectance at 0 solar zenith angle and view angle, which can provide a basis for the inter-comparison of sensor data acquired with different viewing or solar angles [36].
K0, K1, and K2 are surface type-specific parameters, thus the coefficients are determined empirically for each site in this study. The values of these coefficients are calculated by minimizing the differences between the observed and modeled reflectance using an optimization algorithm, given the measured values of θ, ϕ and ψ from the training data sets for each site. In this study, we use the first three full years available RSR corrected VIIRS DNB and M bands radiance/reflectance data (derived from Equations (2), (5), (8) and (9)) as the training data set in the kernel-driven BRDF correction model to cover a complete seasonal oscillation cycle. Please note that these training data are good for validating a relative trend but are not good for calculating the absolute calibration. In our study, Equation (11) is used to calculate the BRDF corrected Land PEATE DNB radiance ( L b r d f ) and TOA reflectance ( ρ b r d f ), which can be used to validate long-term sensor calibration stability. The DNB Rradiance/Rreflectance and K0_radiance/K0_reflectance are derived from the Equation (10) by using radiance data from Equation (2) or reflectance data from Equation (5) as BRDF model inputs.
L b r d f = L n o r m a l i z e d × K 0 _ r a d i a n c e R r a d i a n c e ;   ρ b r d f = ρ n o r m a l i z e d × K 0 _ r e f l e c t a n c e R r e f l e c t a n c e
Equation (12) is used to calculate the BRDF corrected Land PEATE M bands radiance ( L b r d f _ M b a n d ) and TOA reflectance ( ρ b r d f _ M b a n d ), which can be used in the comparison with DNB long-term calibration stability. The Rradiance/Rreflectance and K0_radiance/K0_reflectance are derived from Equation (10) for each M band using radiance data from Equation (8) or reflectance data from Equation (9).
L b r d f _ M b a n d = L n o r m a l i z e d _ M b a n d × K 0 _ r a d i a n c e R r a d i a n c e ; ρ b r d f _ M b a n d = ρ n o r m a l i z e d _ M b a n d × K 0 _ r e f l e c t a n c e R r e f l e c t a n c e

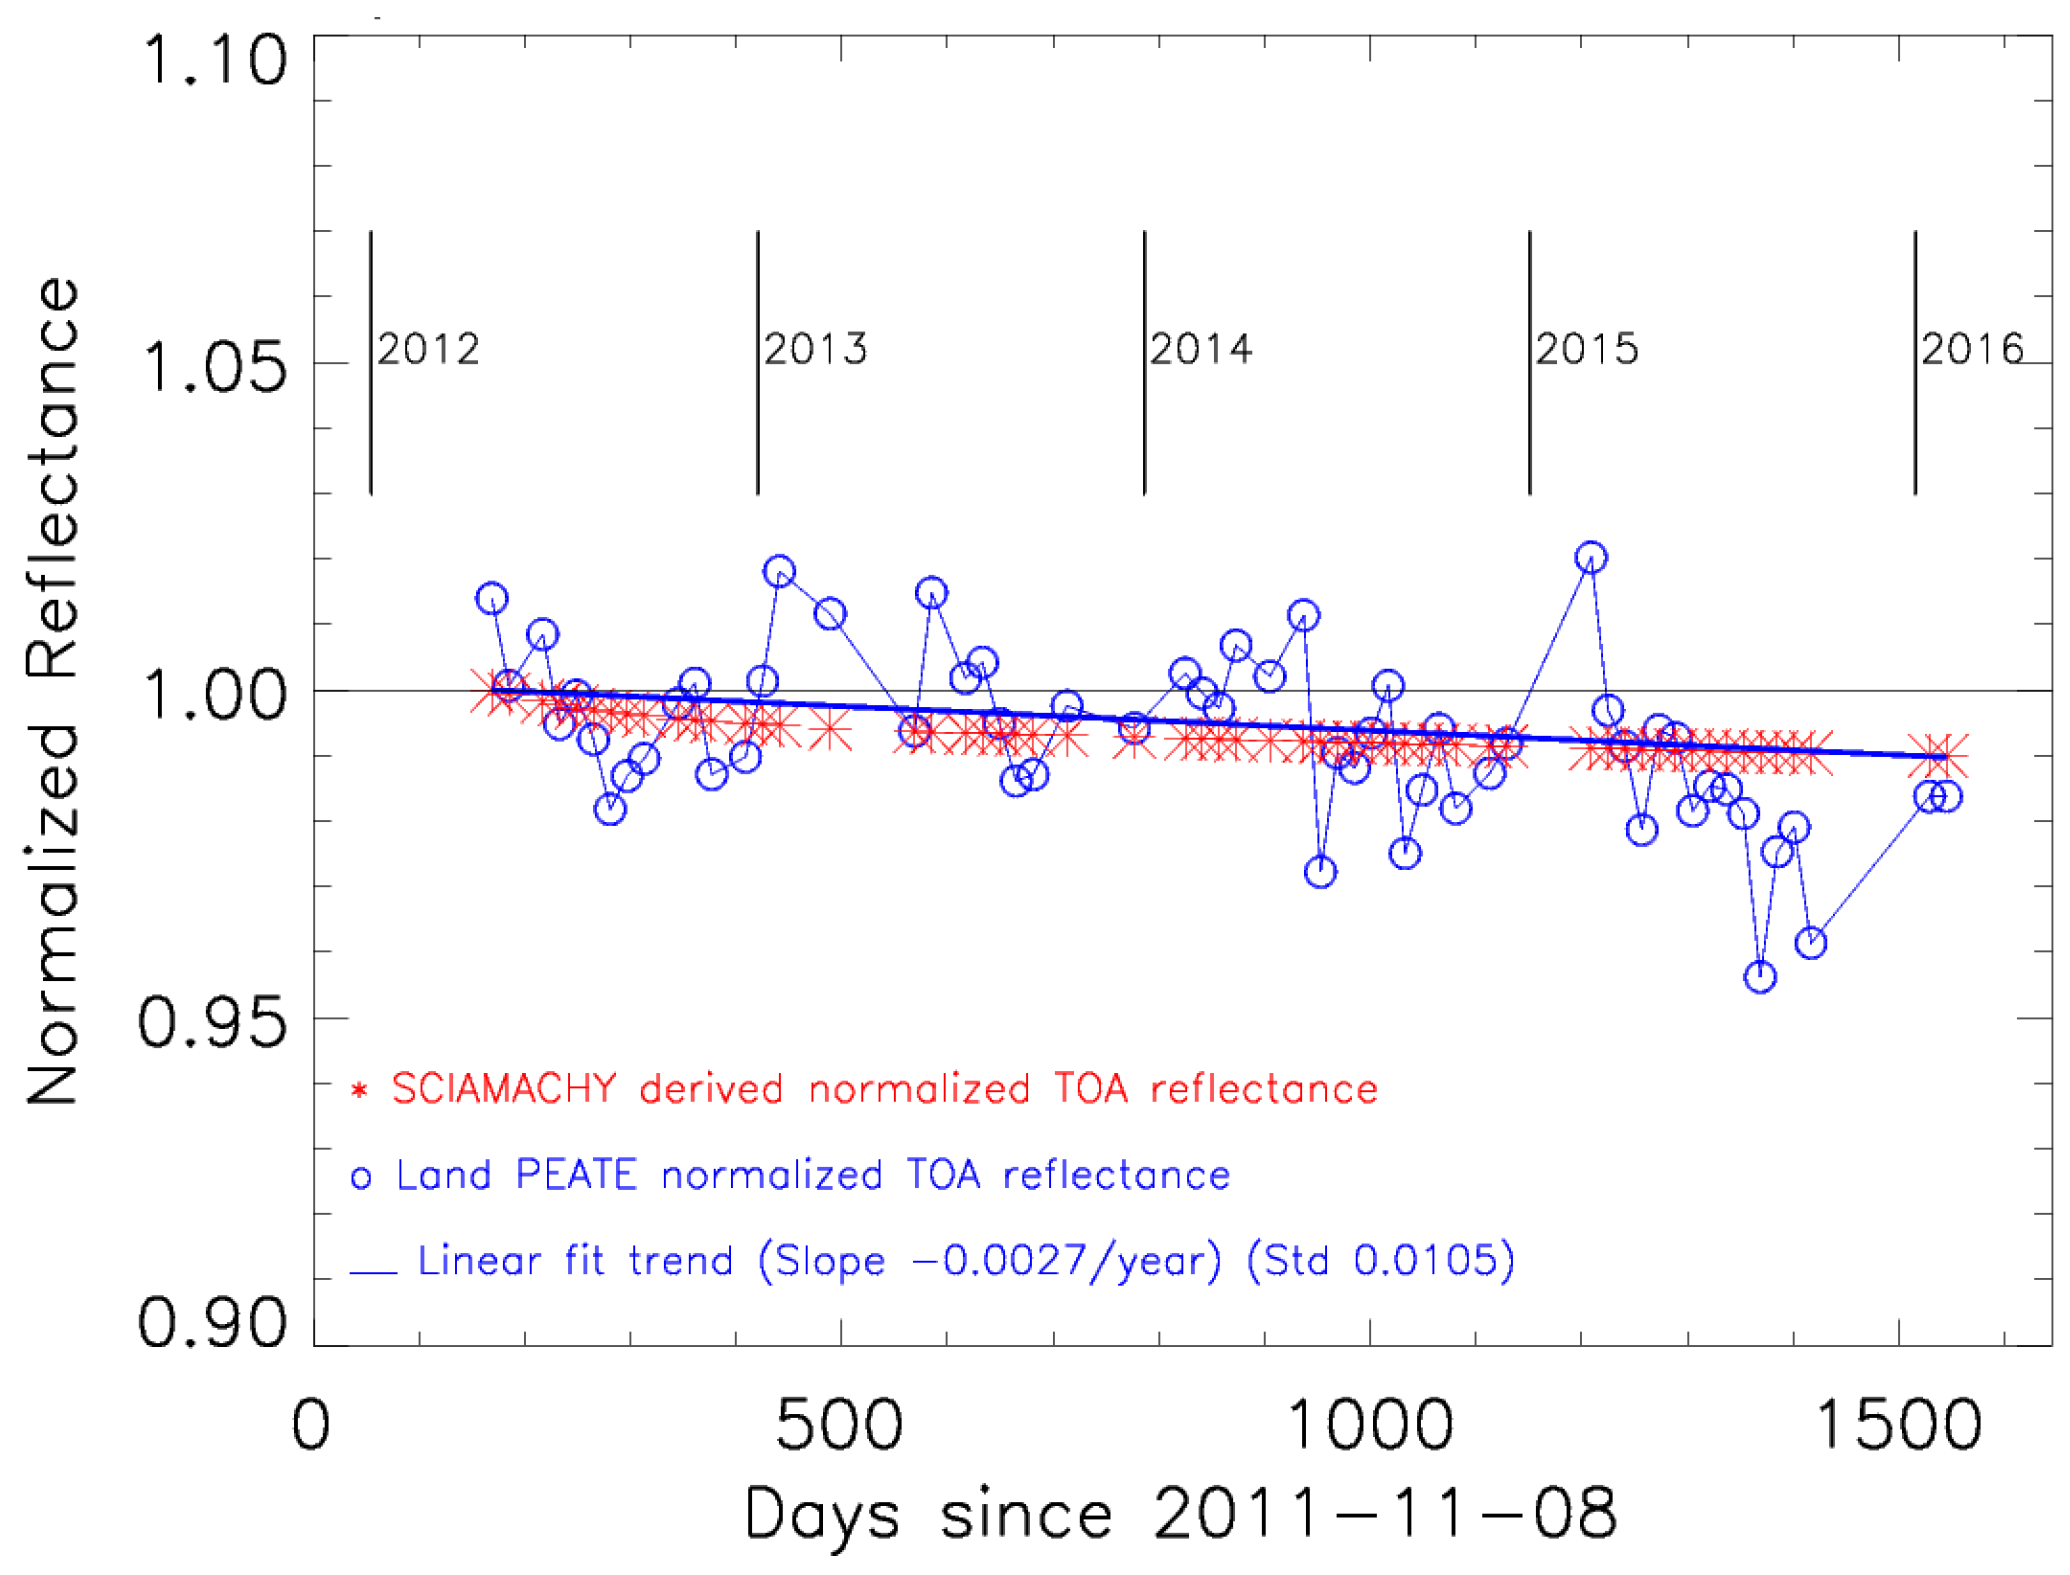
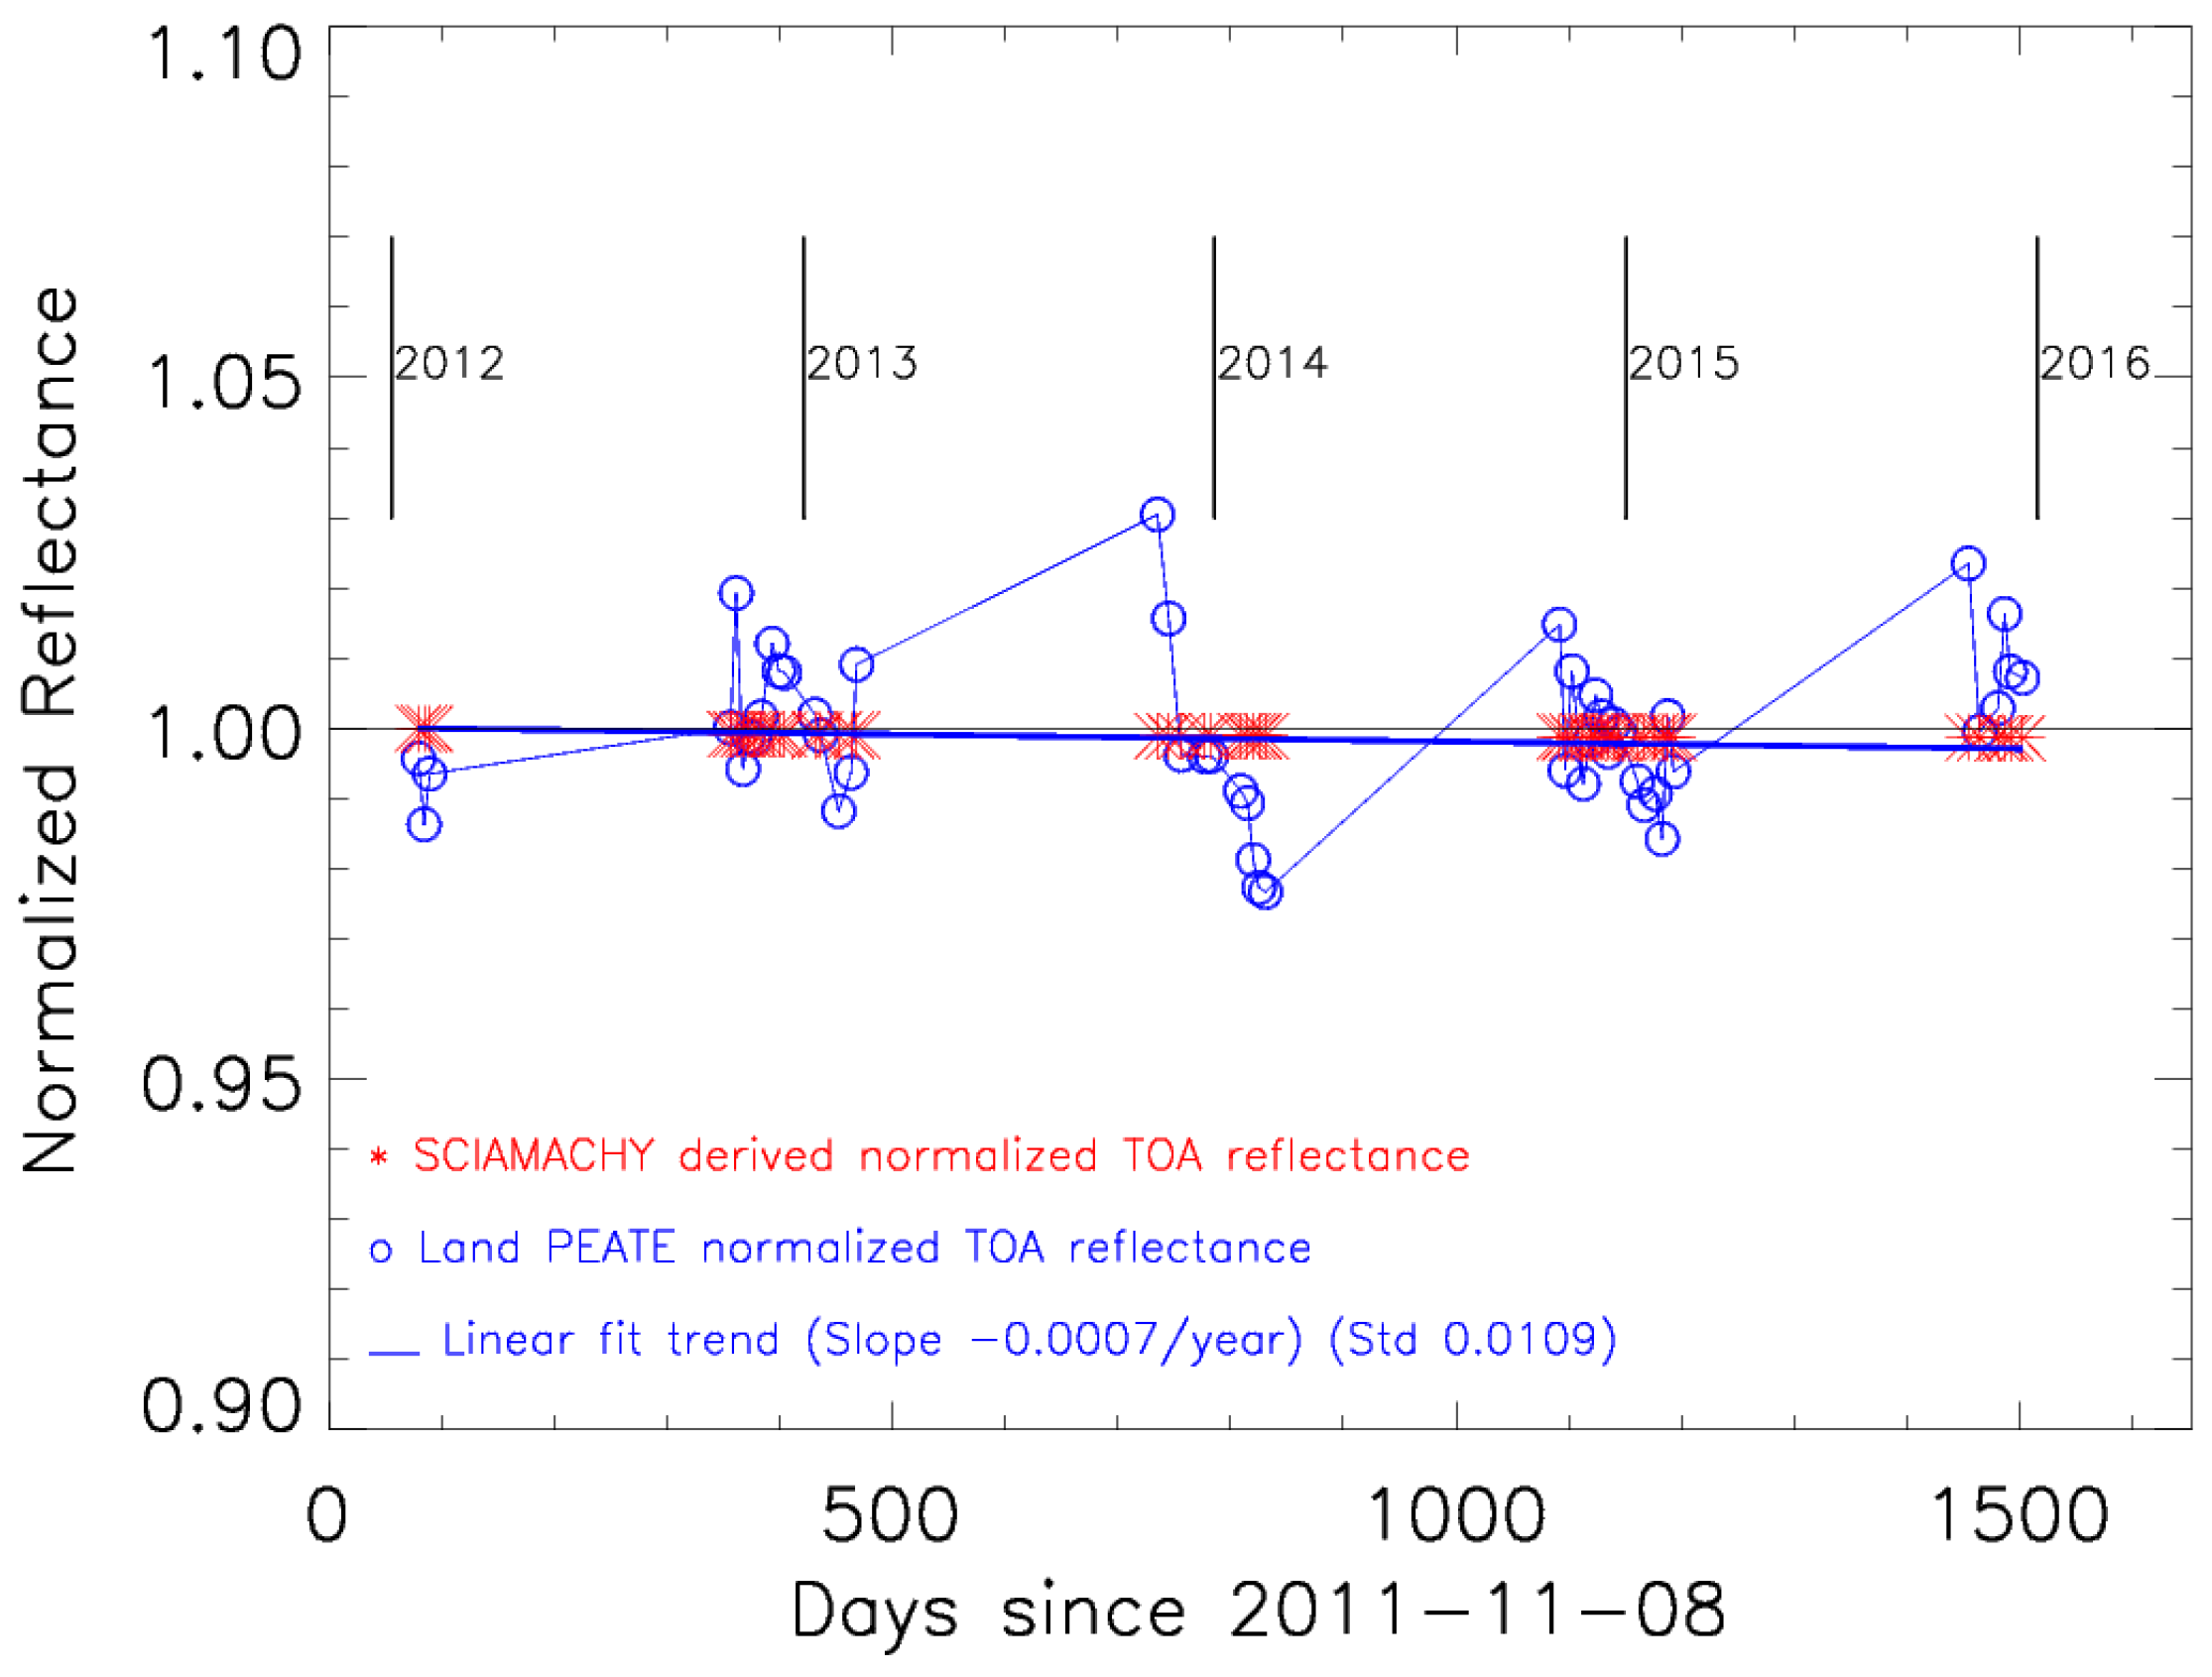
2.4. SCIAMACHY Spectral Data Simulated TOA Reflectance

In this study, we also use the Libya 4 and Dome C spectral data recorded by SCIAMACHY to retrieve the TOA reflectance observed by VIIRS. The SCIAMACHY data used in this study is provided by the European Space Agency. The data is the averaged reflectance spectra collected over the study sites from 2002 to 2010. We assume the ground targets do not change significantly and their reflectance spectra are stable over the period of study. The SCIAMACHY data has a very fine spectral resolution (<1 nm) [16]. Thus, SCIAMACHY data can provide high spectral precision measurements of our study sites by sampling several absorption features (Figure 2). These features are within common atmospheric absorption wavelengths and are affected by atmospheric status and ground materials status. SCIAMACHY provides the measured hyperspectral data with enough spectral and spatial resolutions and spectral coverage over the surface sites selected in this study since the SCIAMACHY data are stable and their average data, our input of the hyperspectral data, is constant over time. Thus, any impacts due to the DNB RSR changes can be easily simulated and identified.
We use Equation (13) to calculate the modulated TOA reflectance considering the RSR influence with time. ρ S C I A M A C H Y is the SCIAMACHY spectral reflectance indicated in Figure 2. The summation is taken over the wavelength parameter, 𝜆, ranging from 200 nm to 200,000 nm. We assume that the surface spectral and solar irradiance did not change, and the time-dependent RSR is the major source for the change of TOA reflectance.
ρ T O A _ S C I A M A C H Y = ( ρ S C I A M A C H Y × S o l a r I r r a d i a n c e λ × R S R λ × Δ λ ) ( R S R λ × S o l a r I r r a d i a n c e λ × Δ λ )
The SCIAMACHY derived TOA reflectance ( ρ T O A _ S C I A M A C H Y ) is compared with the BRDF corrected Land PEATE DNB TOA reflectance ( ρ b r d f ) for each study site. First, we use the first three full years of available Land PEATE DNB TOA reflectance data ( ρ b r d f ) to generate a linear fit model. Second, we use this linear model to derive fitted reflectance values for all of the available dates used in this study. Third, we normalize ρ b r d f and all of the fitted reflectance data from the second step to the first data point of the fitted reflectance value. We also normalize ρ T O A _ S C I A M A C H Y to its first data value. After the above normalization process, the changes of all three data trends can be easily compared.

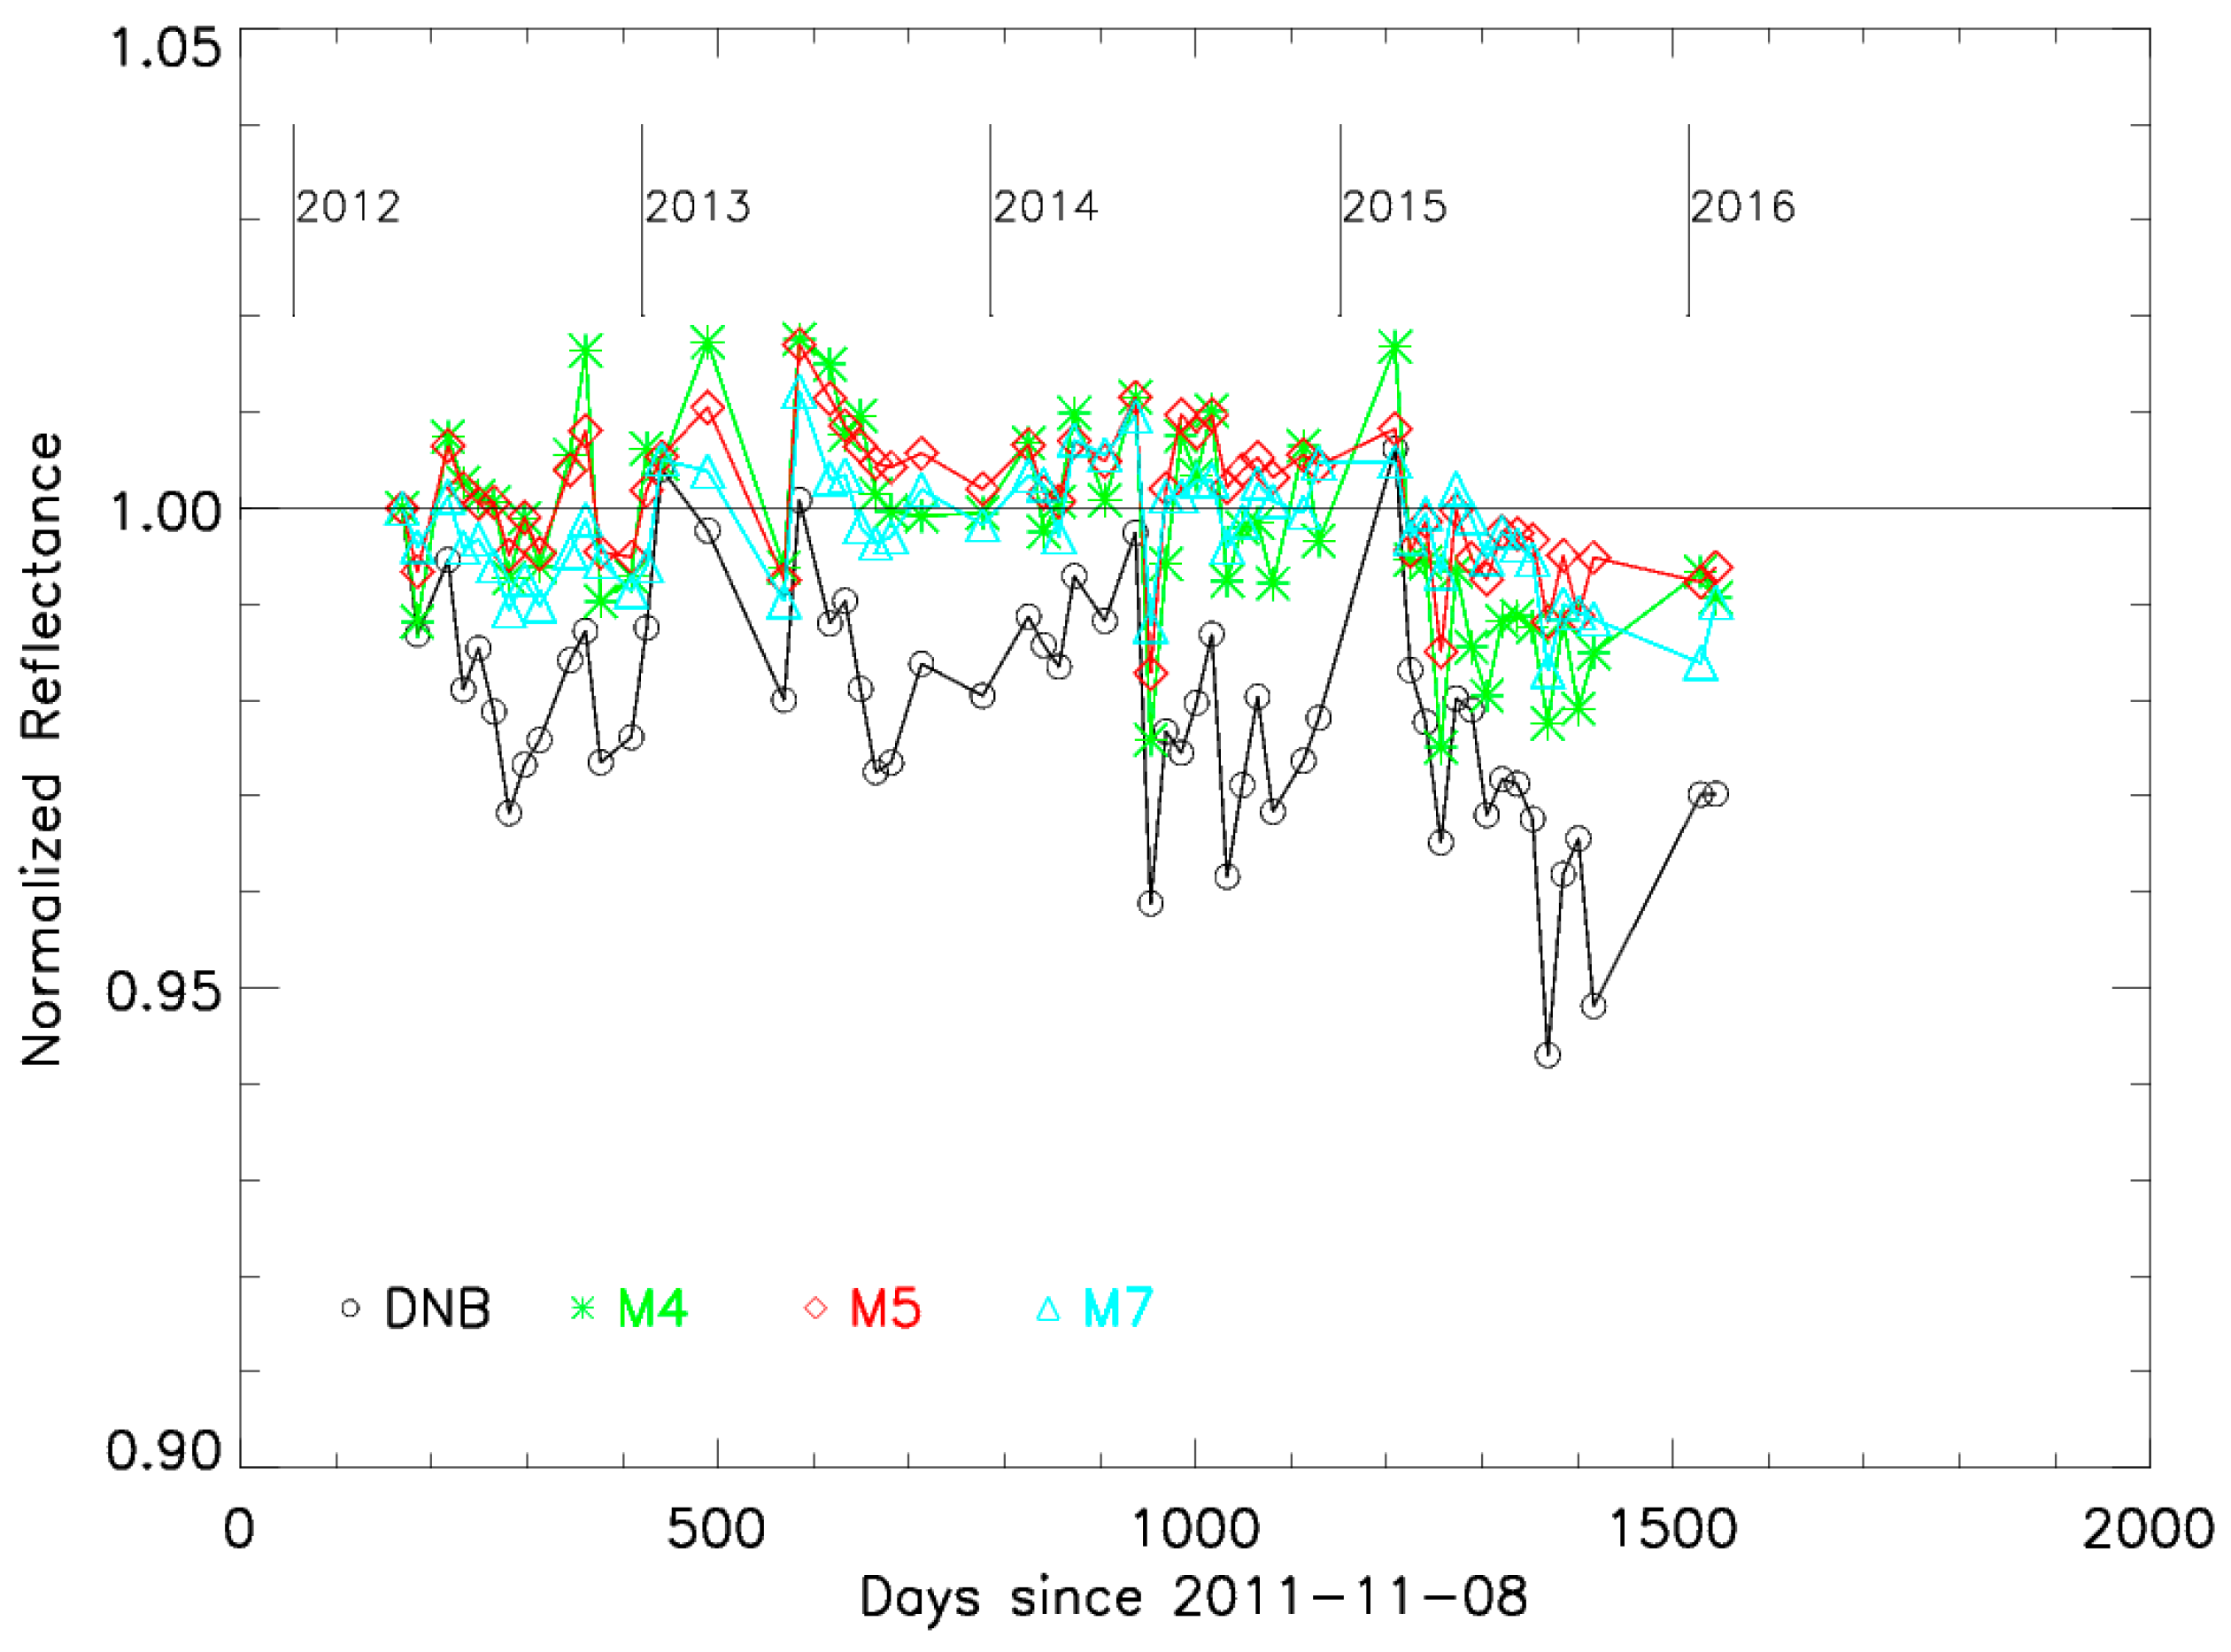
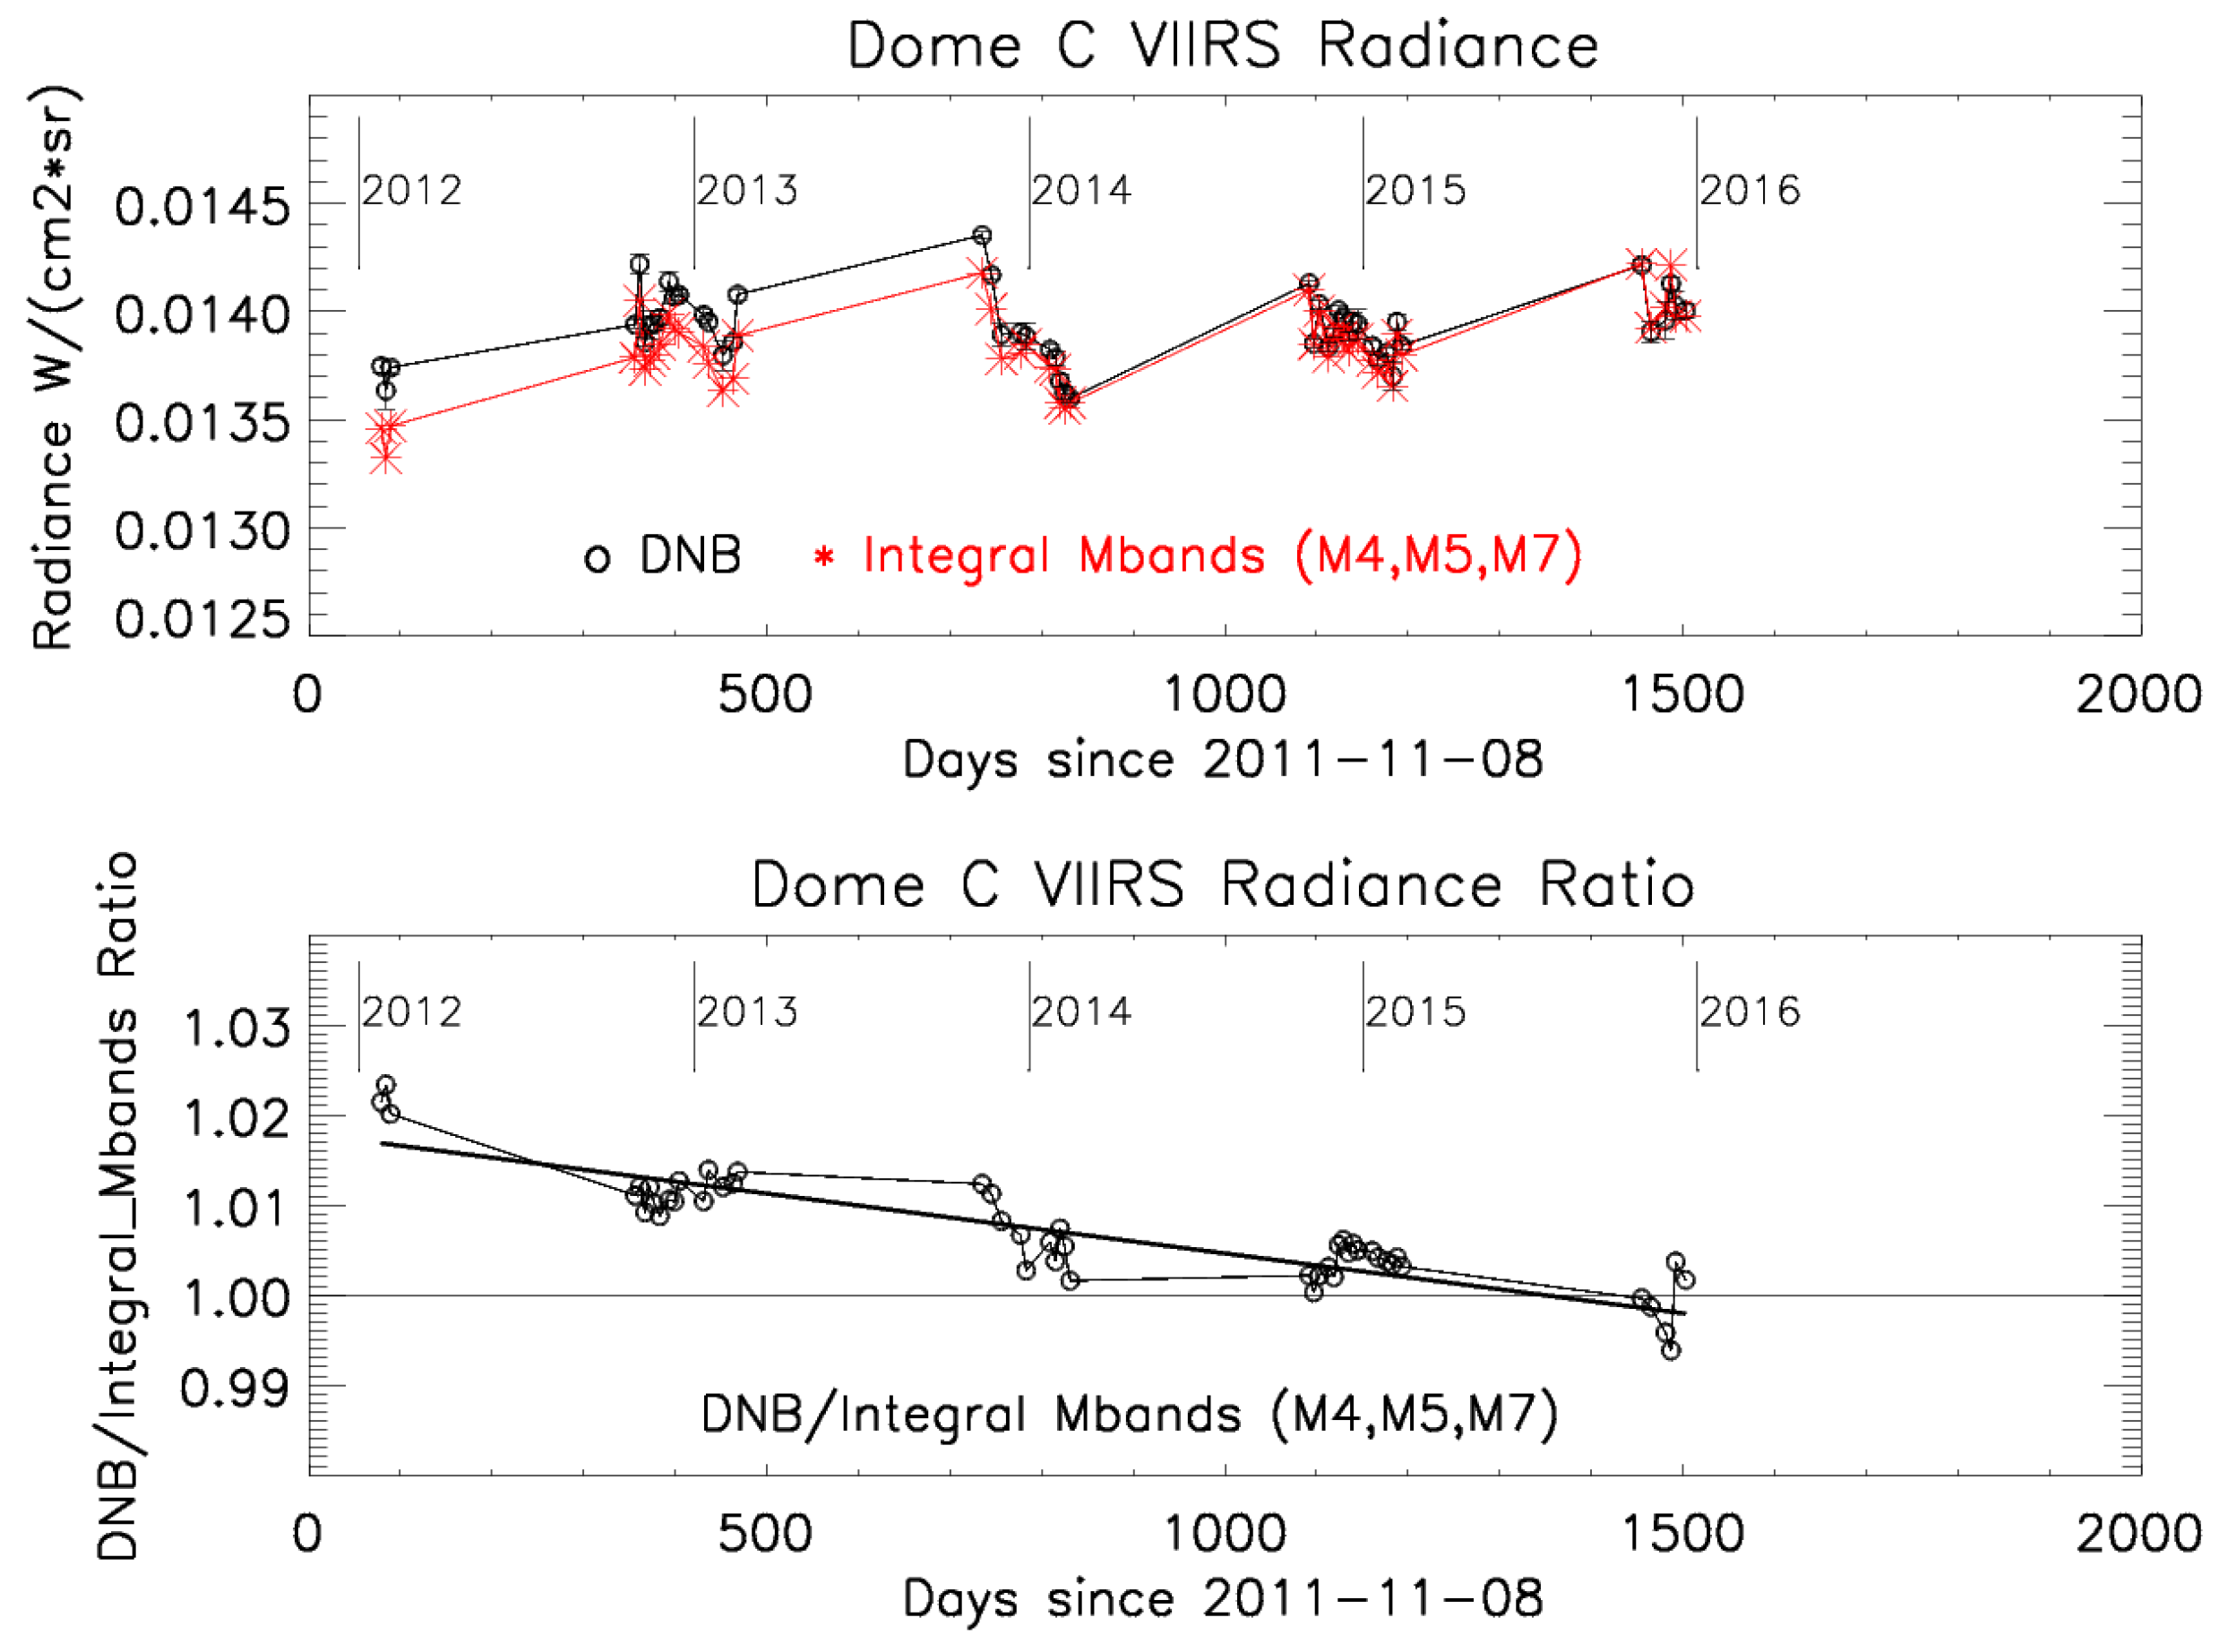
2.5. DNB Comparison with M bands

In this study, we compare the DNB with the M bands within the DNB wavelength range, except M6. The M6 band lacks sufficient data due to its band radiance saturation and ‘fold-over’ [20].
An integrated Mbands radiance using M4, M5, and M7 bands is compared with the DNB for long term trend monitoring following Equations (14)–(17).
R m i = R S R ( M i b a n d ) λ × R S R ( D N B ) λ × ρ S C I A M A C H Y × d λ R S R ( D N B ) λ × ρ S C I A M A C H Y × d λ
W m i = R m i R m 4 + R m 5 + R m 7
D N B b a n d w i d e = R S R ( D N B ) λ × d λ
I n t e g r a l M b a n d s = ( W m 4 × L m 4 + W m 5 × L m 5 + W m 7 × L m 7 ) × D N B b a n d w i d e
Rmi (i = 4, 5, 7) are the weight parameters of M4, M5, and M7 bands, which are computed from the RSR of these bands [RSR(Miband)]. Wmi are the adjusted weights that contain the scale factor for making the sum of all the weights equal to 1. The integral M bands radiance (IntegralMbands) is calculated in Equation (16) using the M bands radiance normalized by solar zenith angle, Earth-Sun distance, and BRDF correction (Lmi), and the DNB integral RSR (DNBbandwide).
For the Dome C site, atmospheric Rayleigh scattering and the change of solar zenith angle causes variations in the reflected radiance (isotropic) [6]. Field experiments demonstrate that when the snow surface is smooth, there is very little effect from varying azimuth angle between the sun and the surface roughness features’ dominant orientation direction [6,37]. The methodology used to characterize the long-term trend of the Dome C site is similar to the Libya 4 site reported in the above sections.

3. Results and Discussion

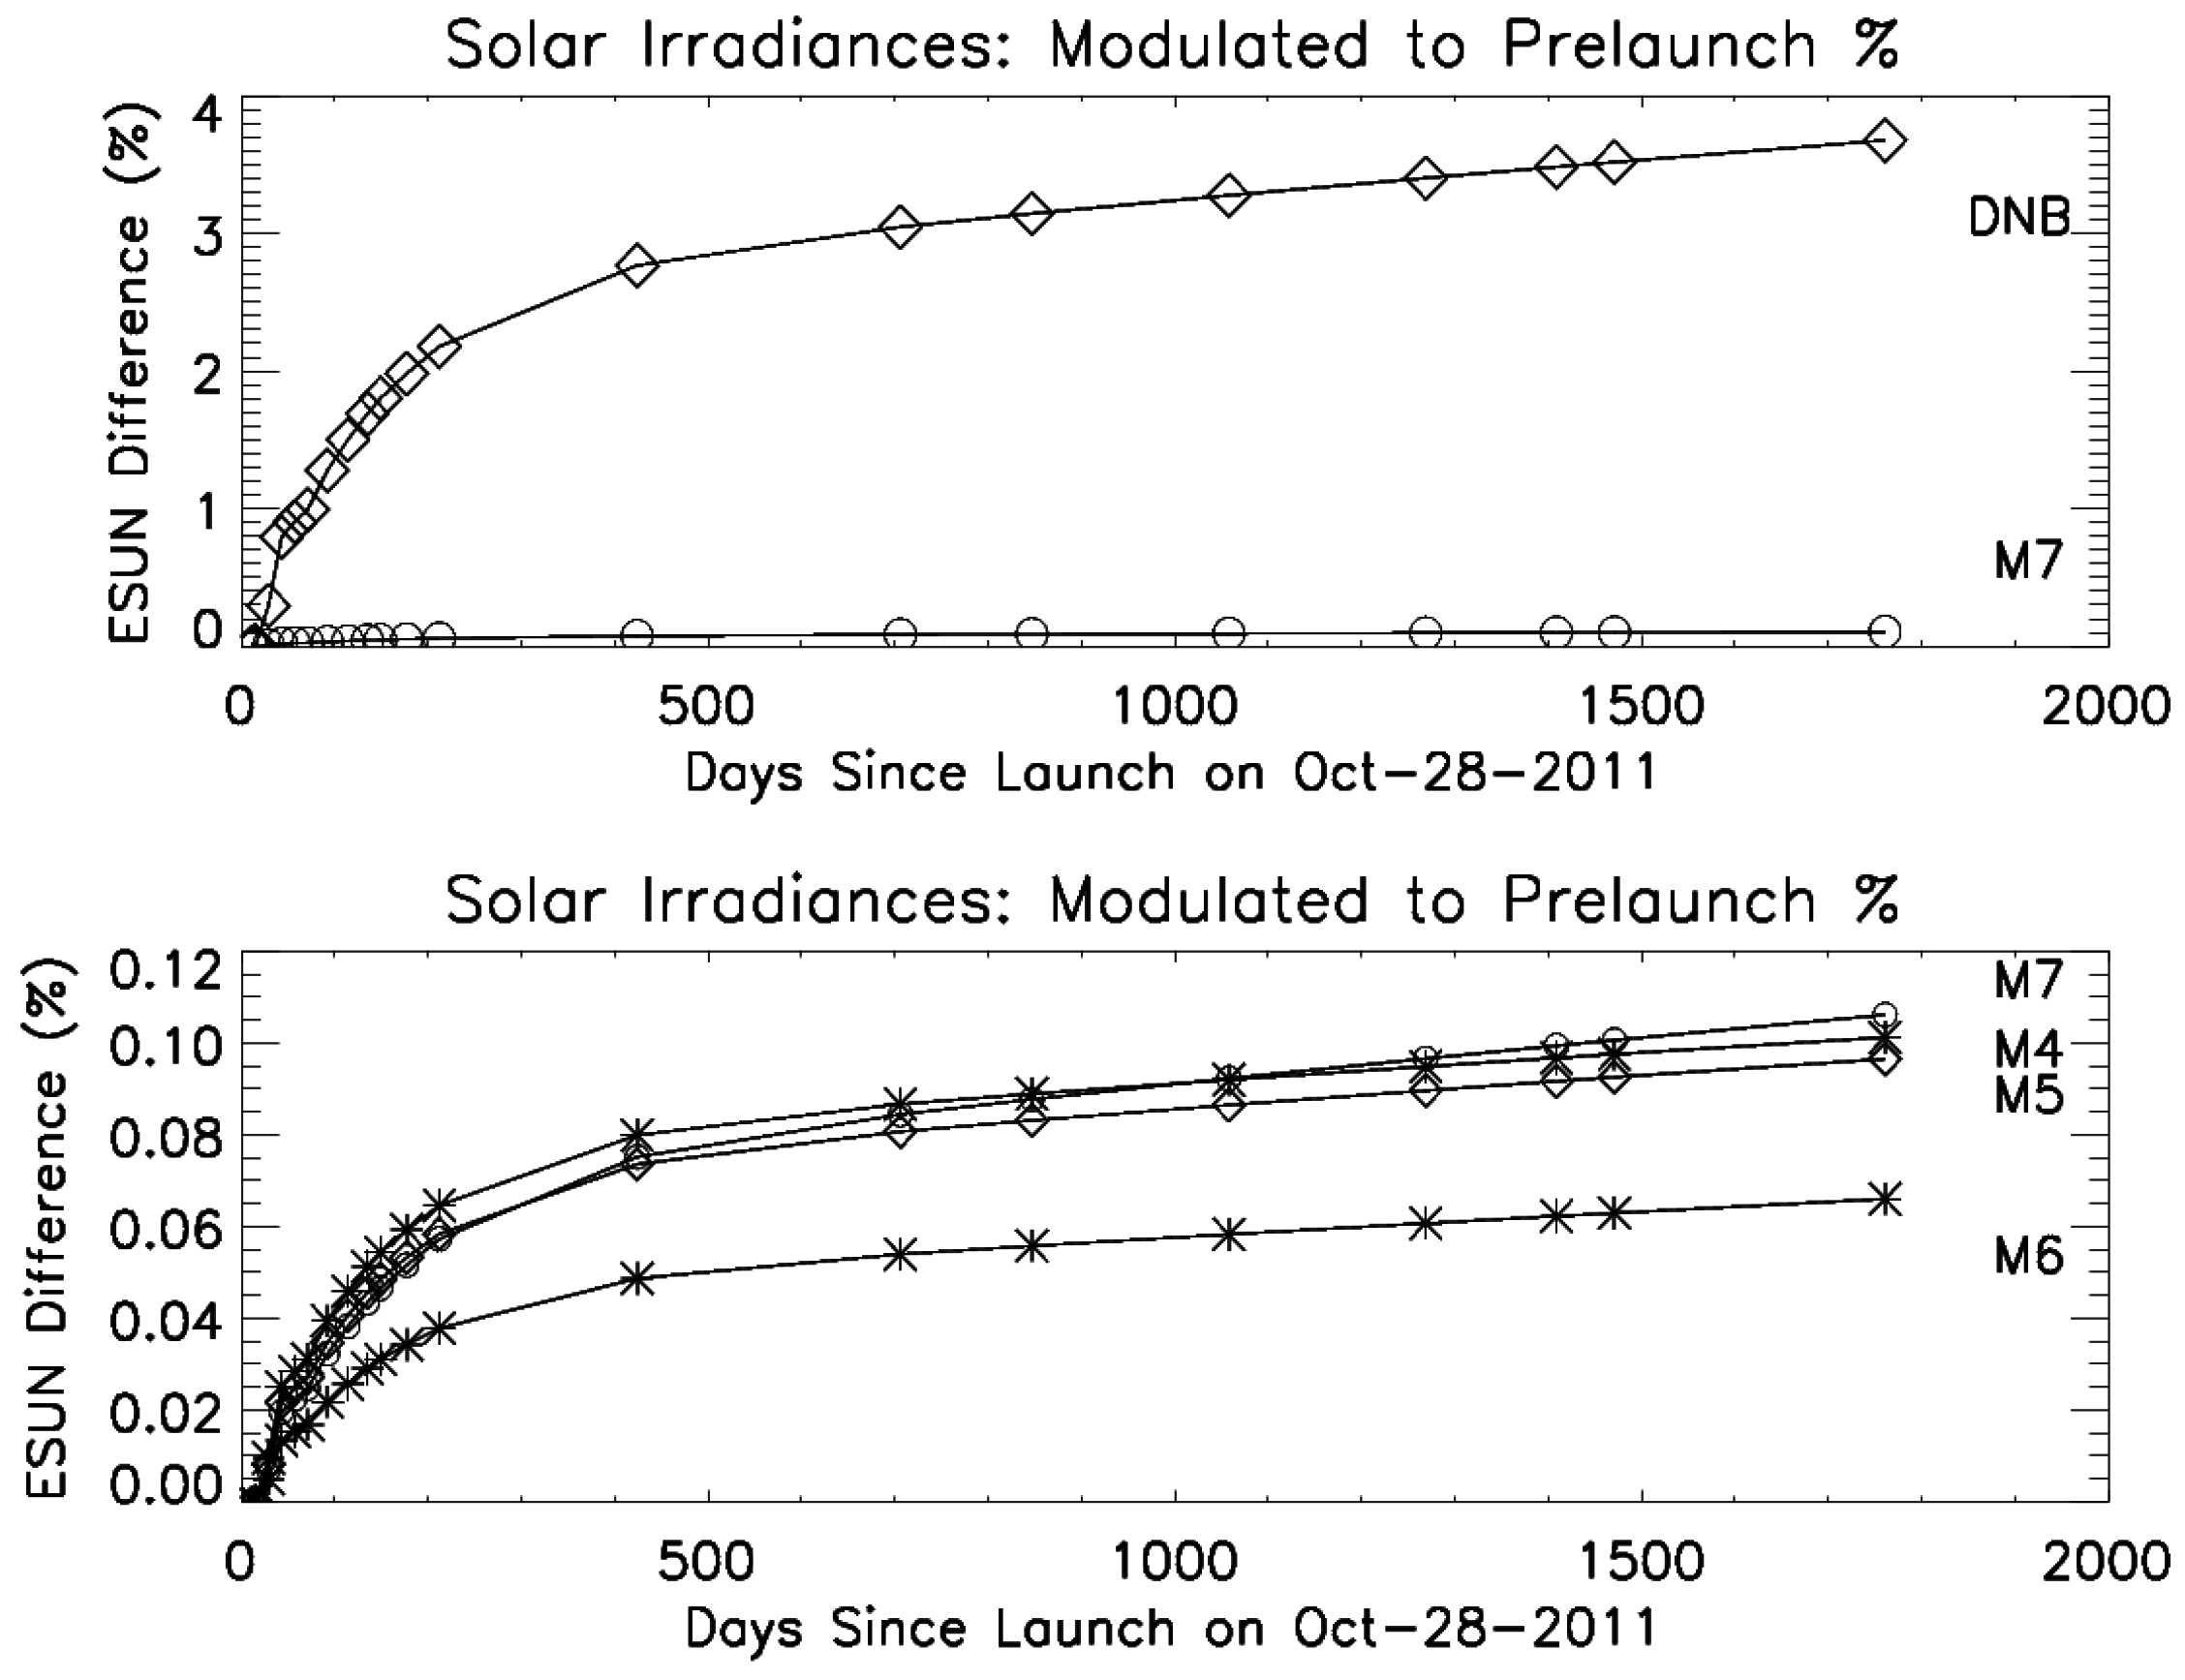
3.1. DNB RSR Influence on ESUN Stability

To accurately compute the DNB and M bands reflectance, a time-dependent, modulated RSR is used to model the change of incident solar radiance expected during solar calibration events. The band dependent observed solar irradiance (ESUN) changes due to the change in RSR. Figure 3 indicates the DNB and M4-M7 ESUN difference derived from the RSR at orbit 154 (same as prelaunch RSR) and from the modulated RSRs after launch. There is an approximately 3.5% increase of ESUN for the DNB and about 0.1% increase for M7 during the past four years (1473 days since launch). ESUN increases by approximately 0.1%, 0.095%, and 0.065% for M4, M5, and M6 bands, respectively.

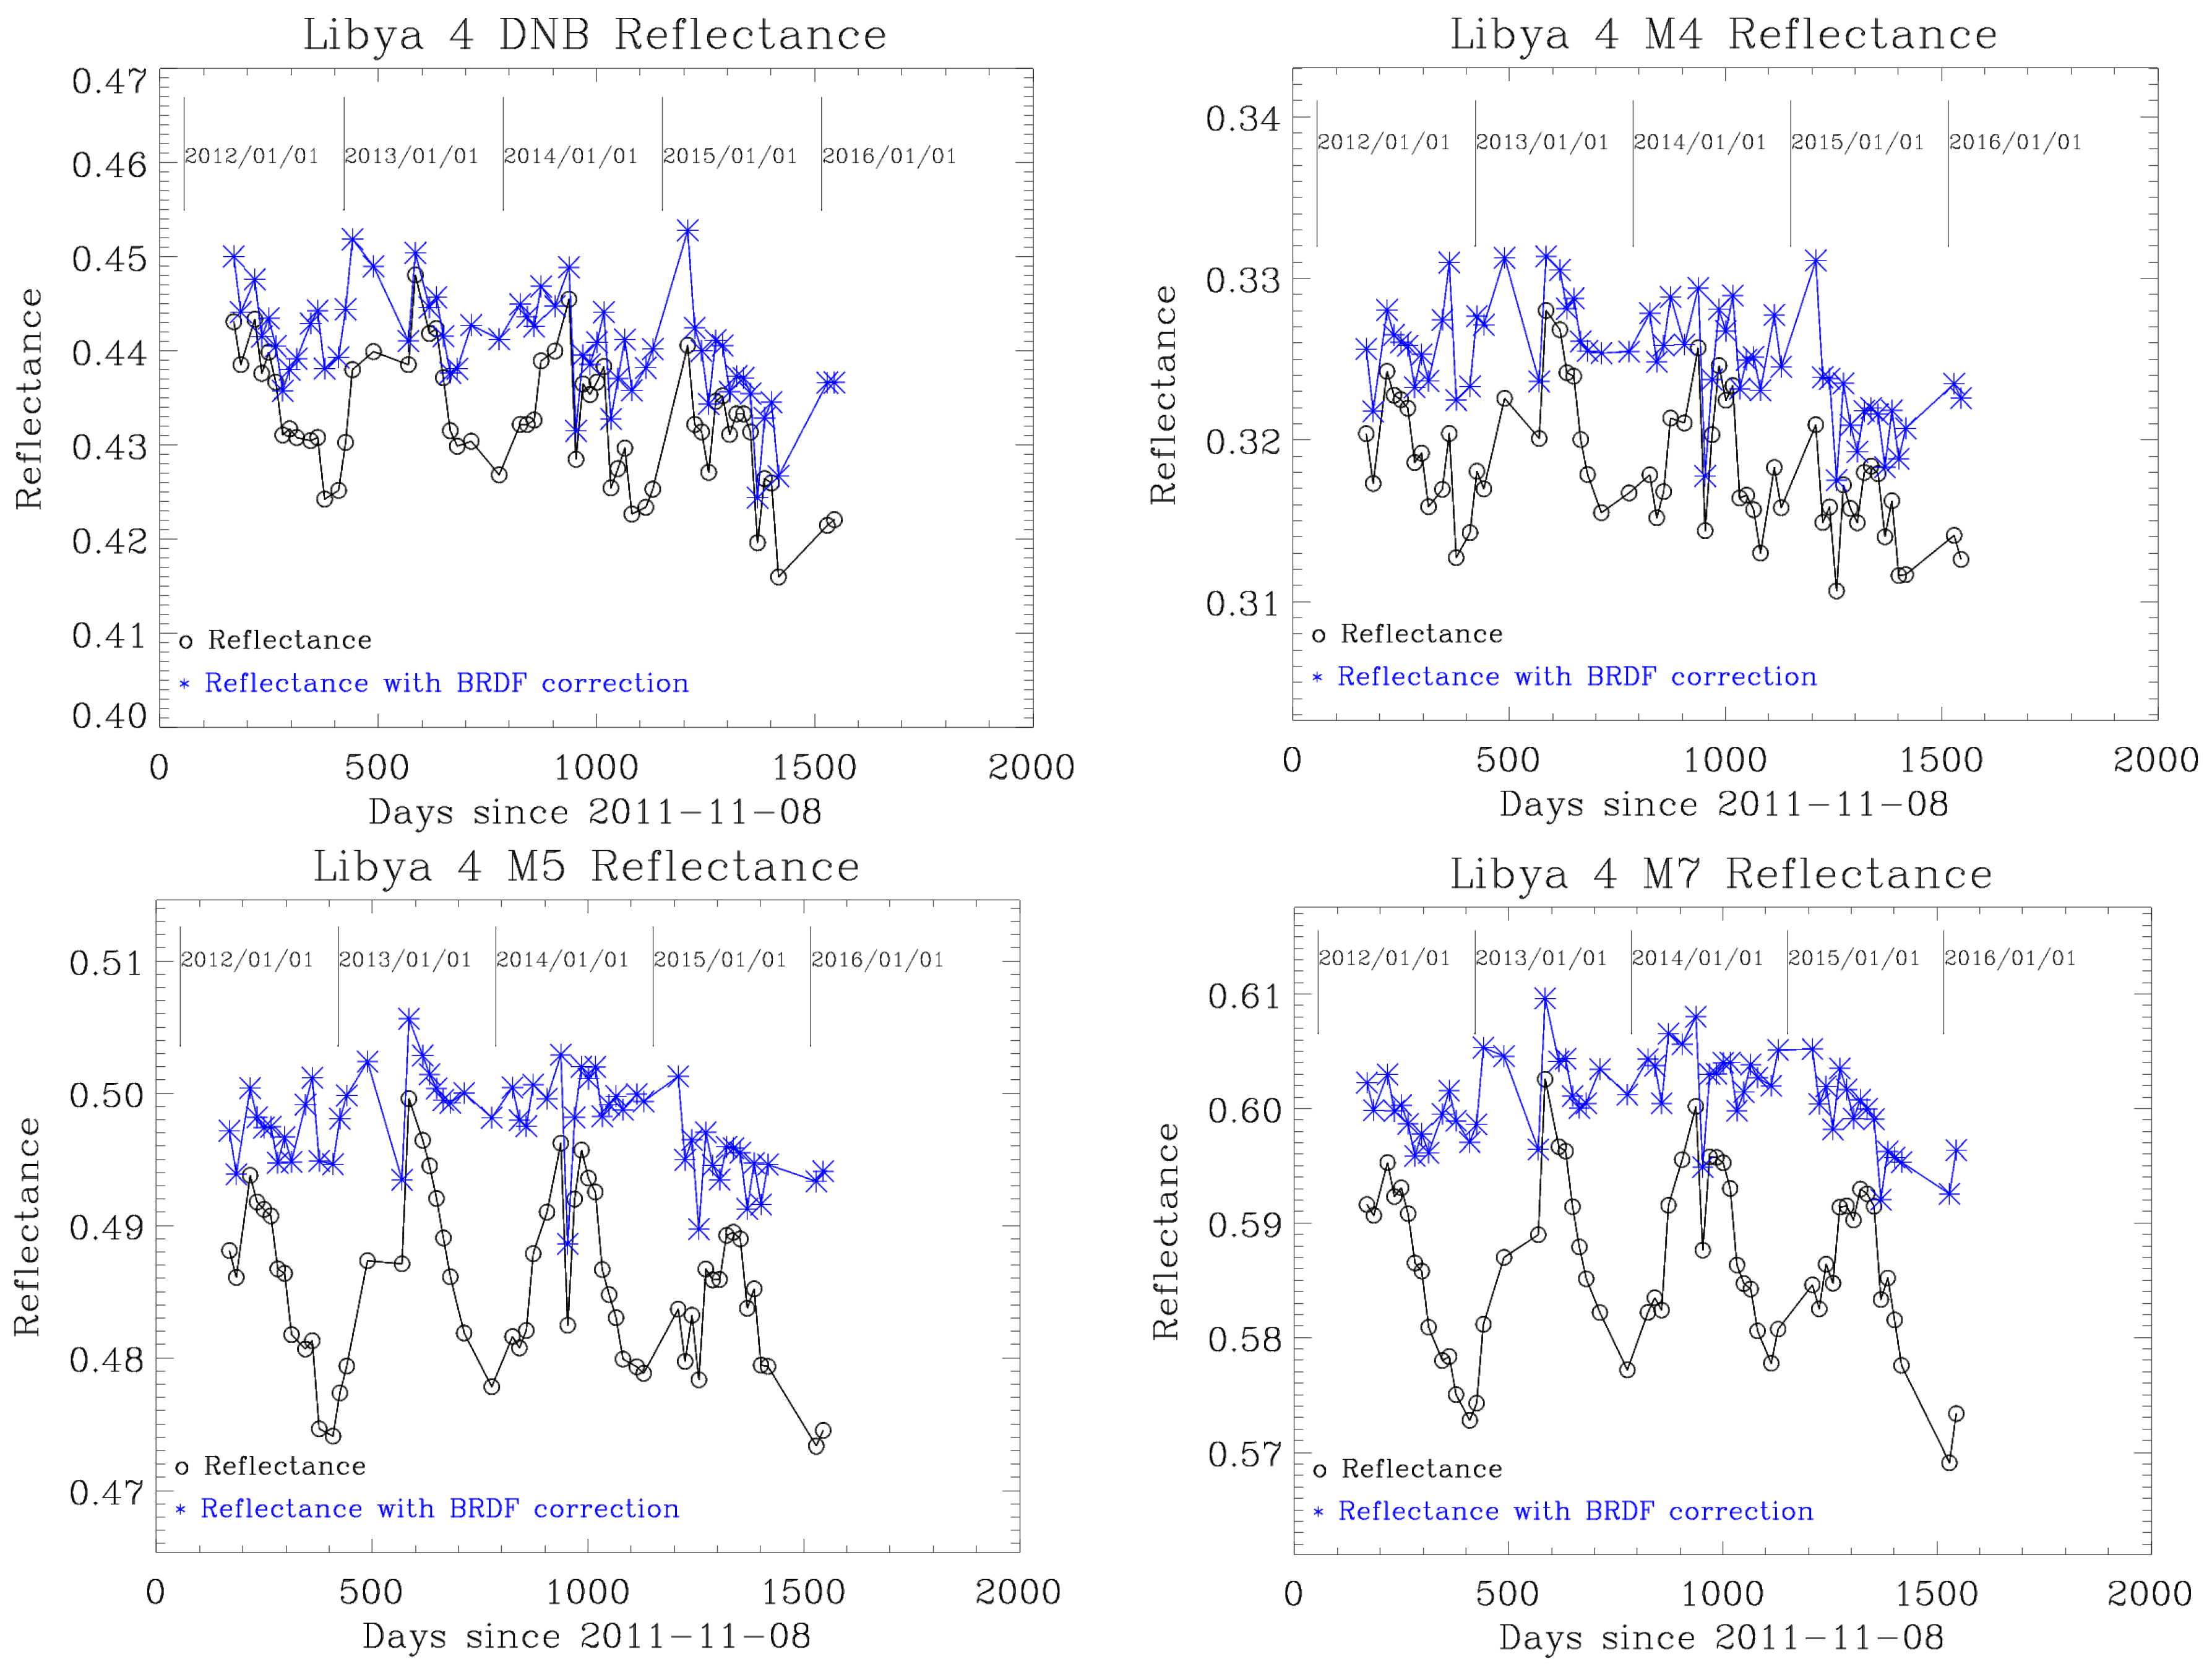
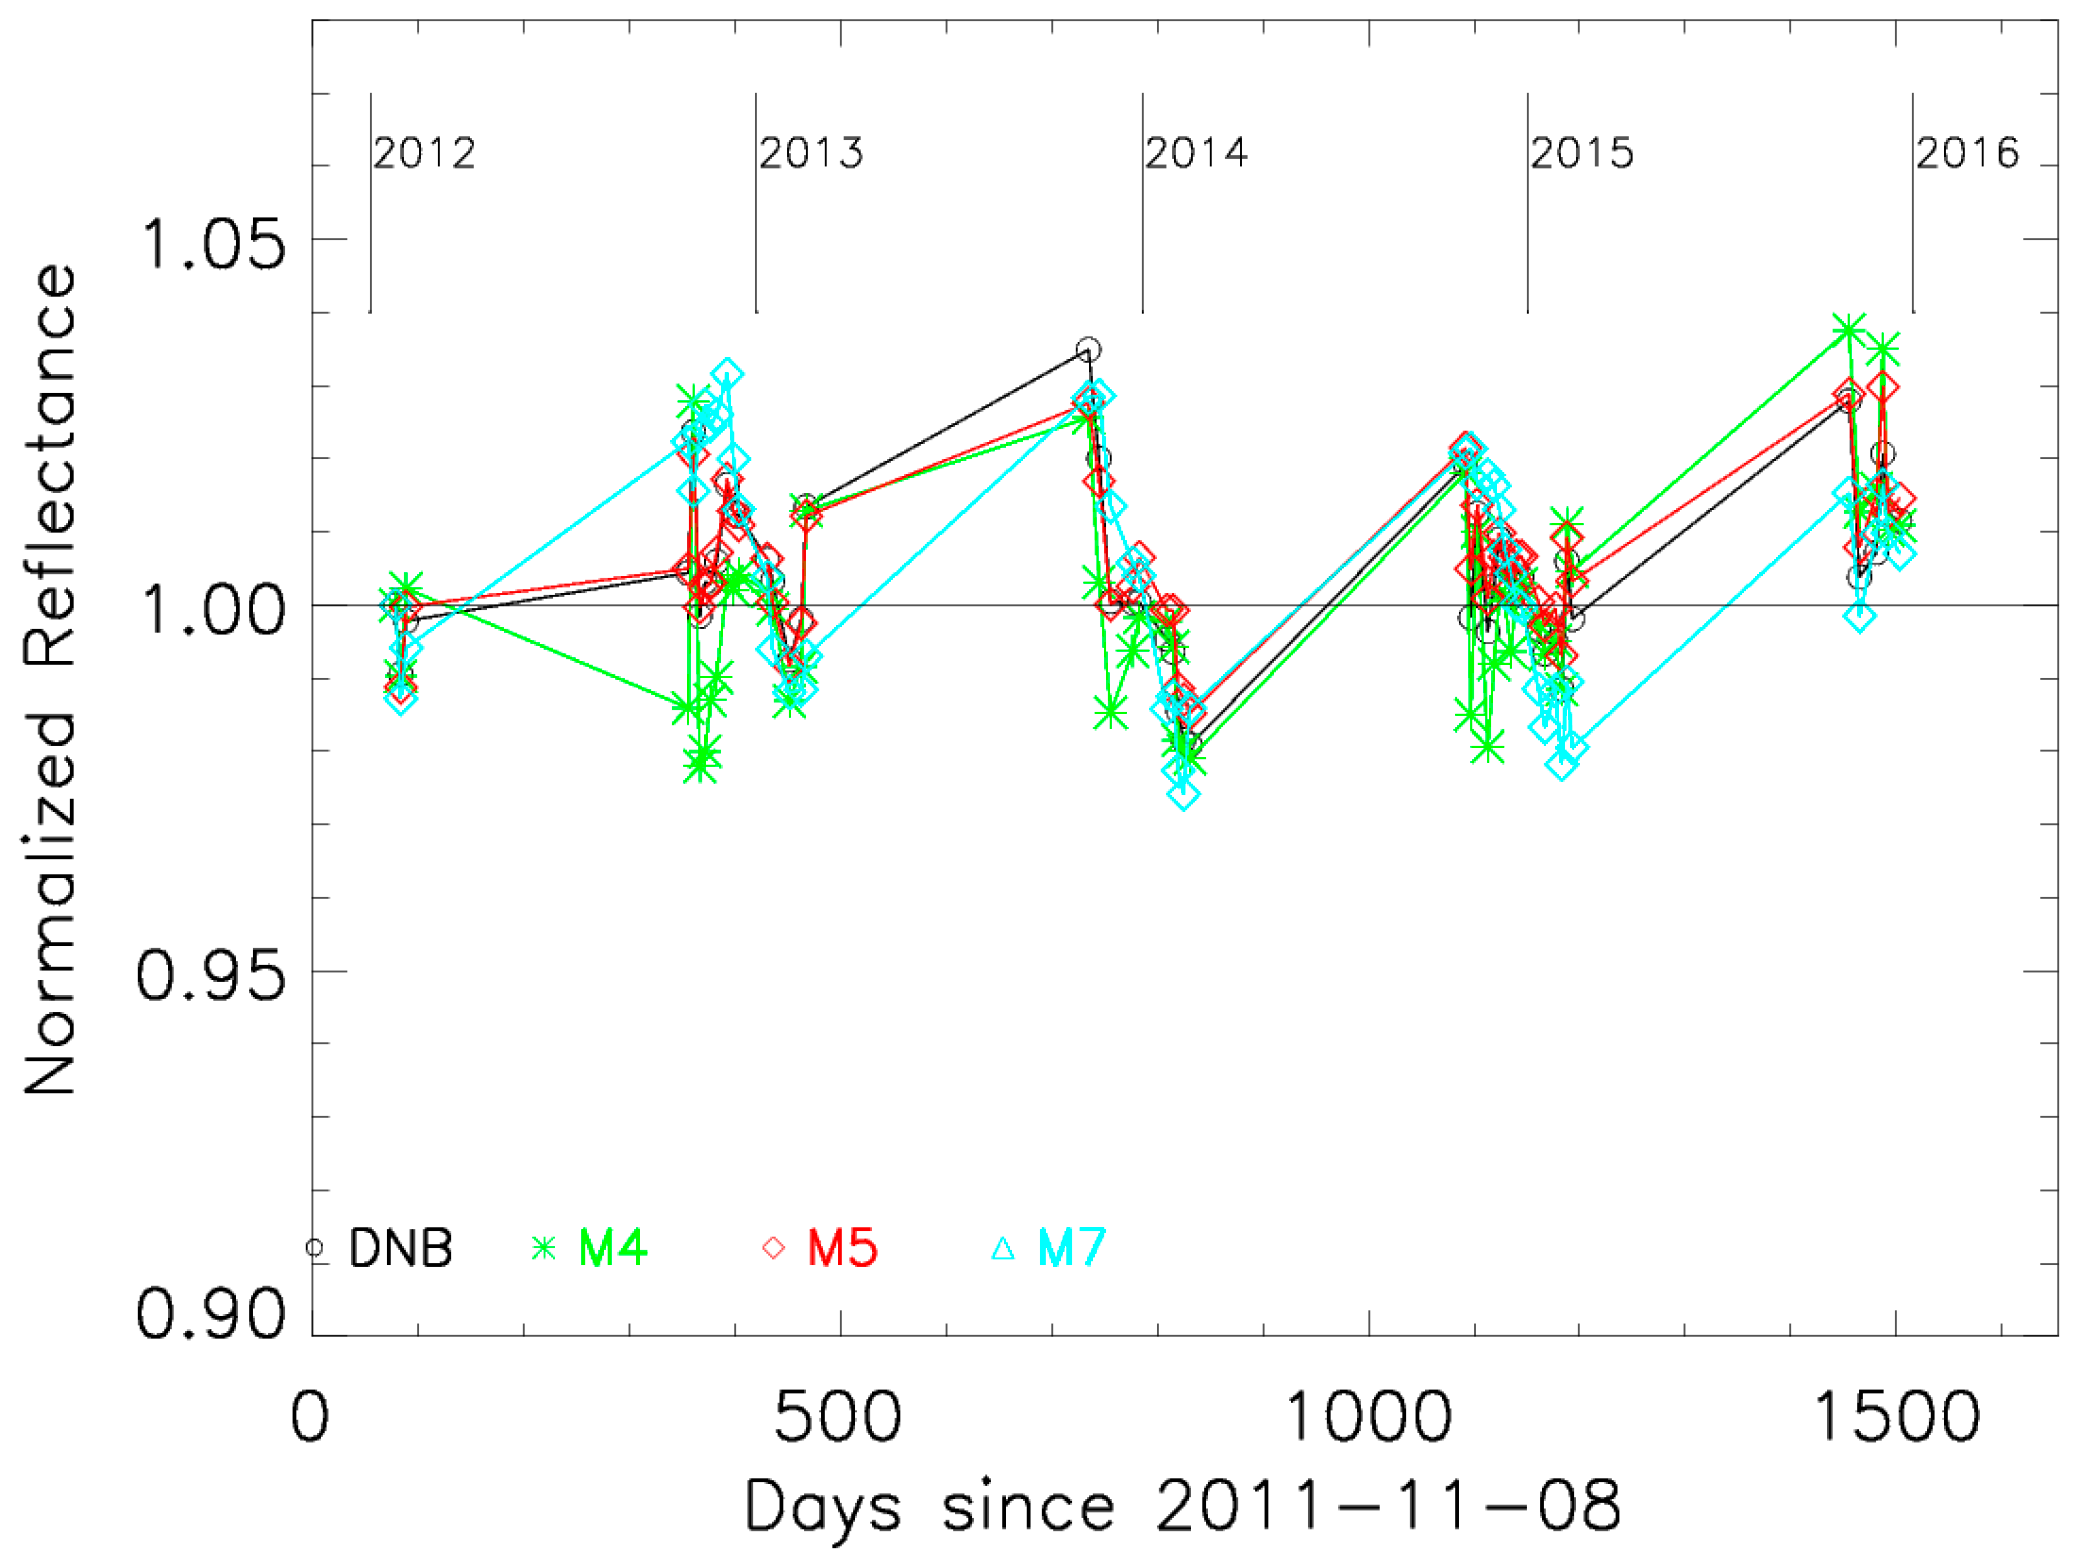
3.2. Libya 4 Site Radiance and Reflectance Long Term Stability

Among all of the selected data, the Libya 4 site view zenith angles are within a narrow range from 1 to 3.5 degrees. The variation of reflectance and radiance are relative to the solar zenith angle. Although the fluctuation patterns are roughly the same, the reflectance with the kernel driven BRDF correction shows less seasonally related fluctuations than a previous study that uses only the Lambertian model correction for DNB and M bands [33] (Figure 4). Our results also find that the longer the wavelength, the better the kernel-driven BRDF correction of TOA reflectance (Figure 4). The solar irradiance has more interaction with the material at shorter wavelengths than at longer wavelengths, thus there is reduced scattering and increased direct reflection at longer wavelengths [38]. This causes an increase in the BRDF at the longer wavelengths. These results confirm that the reflectance for desert sites are slightly non-Lambertian and thus the kernel-driven BRDF model performs better than the Lambertian correction at these sites, especially for longer wavelengths bands.
To investigate the VIIRS DNB data calibration stability, a comparison of the Libya 4 DNB normalized reflectance of Land PEATE and SCIAMACHY data is performed (Figure 5). In this figure, the Land PEATE reflectance data are normalized to the first fitted value of the Land PEATE linear fit model. The SCIAMACHY reflectance data are normalized to their first data point. We assume the surface SCIAMACHY reflectance spectra and Solar Irradiance LUT do not change in the past, when the DNB modulated RSR change. The SCIAMACHY derived TOA reflectance has a 1.01% decrease in the past four years. The trend in the TOA reflectance derived from Land PEATE data has some oscillation and the linear fit of the Land PEATE data indicates a 1.03% decrease in the past. The difference between the two trends is relatively small, which demonstrates that the Land PEATE reflectance changes are mostly caused by the RSR changes. Comparing with another study result that used IDPS data on the deep convective cloud reflectance time series [32], our Land PEATE reflectance data at Libya 4 are more stable in earlier days before April 2013. This is because the Land PEATE data have been reprocessed based on the latest version of RSR LUTs and the data are more accurate. After April 2013, both IDPS and Land PEATE data trends are stable.
The comparison of Land PEATE DNB and M bands normalized reflectance is shown in Figure 6. In this figure, each band’s reflectance data are normalized to its first data point. The Libya 4 reflectance spectra increase between 400 nm and 900 nm (Figure 2) and the M bands’ RSRs have very little change (Figure 3), thus the normalized DNB reflectance has a larger decrease compared to the M bands when the DNB RSR peak wavelength moves to the shorter wavelength side at later times. For data after 2015, both DNB and M bands have some notable decrease which may be mostly due to surface changes or atmosphere status changes since the RSR change is much smaller than earlier years.
The integral Mbands radiances from M4, M5, and M7 bands are compared with the measured DNB radiance after Earth-Sun distance, solar zenith angle, and BRDF correction (Figure 7). Their seasonal oscillations are very similar and the radiance values are close. In the Figure 7, the mean values and 1 standard deviation error bars of DNB 32 × 32 pixels’ are indicated and the percentages of standard deviation range from 0.96% to 2.08%. The integral Mbands radiance values are also indicated in Figure 7. For the M4, M5, and M7 individual bands, their percentage of standard deviation ranges are between 0.94% and 2.14%.
The use of the M band integrated radiance is to simulate the DNB, thus, ideally the ratio of the two is 1. Currently, the weights for M bands are changed with time due to the RSRs change and the ratio between DNB radiance to integral M bands radiance ranges from 1.01 to 0.97 (Figure 7). The fitting trend indicates that the DNB to integral M band ratio has a 0.75% decrease at Libya 4 site, which is partly due to the fact that the M bands used for integration are insufficient to simulate the whole DNB bandpass.

3.3. Dome C site Radiance and Reflectance Long Term Stability

The long-term trends of Dome C reflectance are indicated in Figure 8. Though the DNB modulated RSR has significant changes in the past, the Dome C surface spectral reflectance is relatively flat in the visible band range from 400 nm to 1000 nm (Figure 2), the SCIAMACHY derived TOA reflectance has only a 0.14% decrease in the past four years. The Land PEATE data derived TOA reflectance trend has large oscillations and the linear fit of Land PEATE data indicates a 0.29% decrease. These two trends are in good agreement.
The reflectance data of the Dome C site has significantly larger solar zenith angles (58–70 degrees) than those of the Libya 4 site (15–55 degrees). After the kernel-driven BRDF model correction, the reflectance data still show large fluctuations. This indicates that there is still some uncertainty due to surface and atmosphere status variation at the Dome C site.
The DNB and M bands normalized reflectance over the Dome C site are shown in Figure 9. Both M bands and DNB have little impact from changing RSRs, thus the trends of DNB and M bands reflectance are flat. However, they do show large seasonal oscillations due to the BRDF impact.
The Dome C integral M bands radiance from M4, M5, and M7 bands are compared with the DNB radiance in Figure 10. Their seasonal oscillations are very similar and the values are close. In Figure 10, the mean values and 1 standard deviation error bars of the DNB 32 × 32 pixels are indicated and the percentages of standard deviation range from 0.29% to 1.45%. For M4, M5, and M7 bands, their individual percentages of standard deviation range from 0.19% to 1.73%. The ratio between DNB to integral M bands radiance ranges from 1.02 to 0.99, with about 3% difference. The ratio at the Dome C site is slightly different from the Libya 4 site because the surface spectral characteristics are different, though the modulated RSR changes are the same. The linear fitting trend indicates the DNB to Integral M bands ratio has decreased about 1.9% in the past four years.

4. Conclusions

S-NPP VIIRS has been operating normally collecting global data on a daily basis for more than four years since opening the nadir door on 21 November 2011. In this study, we use two independent sites, Libya 4 and Dome C, to validate the VIIRS DNB and M bands calibration performance using nadir overpass images. Because of the DNB wide wavelength range, the DNB observed solar irradiance is quite sensitive to the incoming radiative spectrum as well as the RSR. In our investigation, the DNB modulated RSR introduces an approximately 3.5% increase on the DNB observed solar irradiance, while the M4-M7 bands RSR influences are 0.1%, 0.095%, 0.065%, and 0.1%, respectively. Long-term trend monitoring of the Earth’s surface using satellite observations always has certain challenges because the ground surface is usually viewed, at most, once a day with different viewing angles and solar zenith angles. Even after having performed atmospheric corrections and Earth-Sun distance correction, a bidirectional reflectance model is also required to reduce the oscillation. The surface reflectance bidirectional effects in many types of surfaces can add a significant component of noise-like fluctuations to the time series. The magnitude of these effects can introduce some uncertainties in the calibration stability assessments when using ground targets.
The kernel-driven BRDF model has been adopted in our study for the correction of surface bidirectional reflectance effects in a time series of satellite observations. When both the sun and viewing angles vary during a long-term observation period on the same invariant target, the model can follow a semi-empirical approach to derive BRDF coefficients specific for the heterogeneous surfaces. This method is suitable for long-term data series, which can have sufficient training data for the model. The BRDF kernel model used here contains only three adjustable parameters: the solar zenith angle, the satellite zenith angle, and the relative azimuth angle between the sun and the satellite, to describe the surface BRDF effects. Based on our previous experience, this model can also be tested in more heterogeneous areas if the model input parameters can be derived from the observed time series. The regression of observed data should be made in a chosen time period that is short enough to consider the surface as time invariant and long enough to contain all seasonal oscillation data for a sufficient regression. The minimum data inputs for this regression are at least four training data sets [36].
In our study, the kernel-driven BRDF model can remove most of the solar zenith angle and atmospheric Rayleigh scattering influence due to different seasons and atmosphere status in both the Libya 4 and Dome C site. The linear BRDF correction also works well for the Dome C site when applied to data with a solar zenith angle of less than 70 degrees. Long-term trending results from the Libya 4 desert and Dome C sites are based on the assumptions that the sites are stable in surface reflectance. Short-term weather events, such as dust storms or rains in the desert site, winds, clouds, and moisture changes can cause some variations of surface reflectance changes in the sites. These variations may not be removed based on our procedures because those are true observations. However, since they are not frequently observed events, their presence should have very little impact on the trending results if our observation time is long enough and covers seasonal oscillation cycles. As illustrated, the methods used in this study are suitable for tracking VIIRS calibration stability.
The theoretical TOA reflectance long term trend calculated from SCIAMACHY spectra and DNB RSR data indicate a decreasing trend of approximately 1.01% for the Libya 4 site and 0.14% for the Dome C site during the past four years while the linear fit of Land PEATE DNB reflectance data show decreases of 1.03% and 0.29% for these two sites, respectively. The differences of the DNB reflectance trends between the Land PEATE and SCIAMACHY are partially due to the Land PEATE early data processed RSRs and SDSM transmittance screens. The current trends also demonstrate that the Land PEATE data long-term trend changes are mostly caused by RSR influence instead of ground target changes.
Though we will need longer VIIRS observation times and more ground data to better understand and verify the S-NPP VIIRS Land PEATE data quality, results of this study provide useful information on VIIRS post-launch calibration assessment and preliminary analysis of its calibration stability for the past four years of operations. Based on the above results, VIIRS Land PEATE data is suitable for long-term monitoring tasks due to its stable radiometric calibration and data reprocessing procedure with improved calibration algorithm. Scientists need to consider the RSR degradation influence before using DNB for long-term land cover change detection or monitoring.

Acknowledgments

All the SCIAMACHY data is distributed by the European Space Agency. The authors would like to thank Truman Wilson and Kevin Twedt for providing comments on this manuscript. We also thank the reviewers and editors for their useful comments.

Author Contributions

X.C. designed the study, developed the methodology, performed the analysis and wrote the manuscript. A.W., X.X., N.L., Z.W. and K.C. contributed to the design of the study, improvement of the methodology, and manuscript reviews. A.W. also developed the program tool for Kernel-driven BRDF Correction Model and processed the SCIAMACHY data. N.L. also developed the DNB and M bands RSR degradation model and provided the program to interpolate RSR for different time period.

Conflicts of Interest

The authors declare no conflict of interest.

Abbreviations

The following abbreviations are used in this manuscript:
S-NPPSuomi National Polar-orbiting Partnership
VIIRSVisible Infrared Imaging Radiometer Suite (VIIRS)
VCSTVIIRS Characterization Support Team
Land PEATELand Product Evaluation and Algorithm Testing Element
IDPSInterface Data Processing Segment
SDRsSensor Data Records
RSBReflective solar bands
DNBDay-Night band
M bandsModerate resolution bands
BRDFBidirectional reflectance distribution function
TOATop-of-atmosphere
RSRRelative Spectral Response
SDSMSolar Diffuser Stability Monitor
LUTLook-Up-Table
RTARotating telescope assembly
DCCDeep convective clouds
SNOSimultaneous Nadir Overpass
ESUNSolar irradiance

References

  1. Xiong, X.; Butler, J.; Chiang, K.; Efremova, B.; Fulbright, J.; Lei, N.; McIntire, J.; Oudrari, H.; Sun, J.; Wang, Z.; Wu, A. VIIRS on-orbit calibration methodology and performance. J. Geophys. Res. Atm. 2014, 119, 1–11. [Google Scholar] [CrossRef]
  2. Butler, J.; Xiong, X.; Oudrari, H.; Pan, C.; Gleason, J. NASA calibration and characterization in the NOESS Preparatory Project (NPP). In Proceedings of the 2009 IEEE International Geoscience and Remote Sensing Symposium, Cape Town, South Africa, 12–17 July 2009.
  3. Cao, C.; De Luccia, F.J.; Xiong, X.; Wolfe, R.; Weng, F. Early on-orbit performance of the Visible Infrared Imaging Radiometer Suite onboard the Suomi National Polar-Orbiting Partnership (S-NPP) Satellite. IEEE Trans. Geosci. Remote Sens. 2013, 52, 1142–1156. [Google Scholar] [CrossRef]
  4. Angal, A.; Xiong, X.; Choi, T.; Chander, G.; Wu, A. Using the Sonoran and Libyan desert test sites to monitor the temporal stability of reflective solar bands for Landsat 7 ETM+ and Terra MODIS sensors. J. Appl. Remote Sens. 2010, 4. [Google Scholar] [CrossRef]
  5. Wu, A.; Xiong, X.; Cao, C.; Angal, A. Monitoring MODIS calibration stability of visible and near-IR bands from observed top-of-atmosphere BRDF-normalized reflectances over Libyan desert and Antarctic surfaces. Proc. SPIE 2008. [Google Scholar] [CrossRef]
  6. Hudson, S.R.; Wang, S.G.; Brandt, R.E.; Grenfell, T.C.; Six, D. Spectral bidirectional reflectance of Antarctic snow: Measurements and parameterization. J. Geophys. Res. 2006. [Google Scholar] [CrossRef]
  7. Madhavan, S.; Wu, A.; Brinkmann, J.; Wenny, B.; Xiong, X. Evaluation of VIIRS and MODIS thermal emissive band calibration consistency using Dome C. Proc. SPIE 2015. [Google Scholar] [CrossRef]
  8. Bhatt, R.; Doelling, D.; Wu, A.; Xiong, X.; Scarino, B.; Haney, C.O.; Gopalan, A. Initial stability assessment of S-NPP VIIRS reflective solar band calibration using invariant desert and deep convective cloud targets. Remote Sens. 2014, 6, 2809–2826. [Google Scholar] [CrossRef]
  9. Wu, A.; Xiong, X.; Cao, C.; Chiang, K. Assessment of SNPP VIIRS VIS/NIR radiometric calibration stability using Aqua MODIS and invariant surface targets. IEEE Trans. Geosci. Remote Sens. 2016, 54, 2918–2924. [Google Scholar] [CrossRef]
  10. Uprety, S.; Cao, C. Suomi NPP VIIRS reflective solar band on-orbit radiometric stability and accuracy assessment using desert and Antarctica Dome C sites. Remote Sens. Environ. 2015, 166, 106–115. [Google Scholar] [CrossRef]
  11. Chander, G. Questionnaire for Information Regarding the CEOS WGCV IVOS subgroup Cal/Val Test Sites for Land Imager Radiometric Gain. Available online: http://calval.cr.usgs.gov/PDF/QA4EO-WGCV-IVO-CSP-001.pdf (accessed on 15 June 2016).
  12. Moeller, C.; Mcintire, J.; Schwarting, T.; Moyer, D. VIIRS F1 “best” relative spectral response characterization by the government team. Proc. SPIE 2011. [Google Scholar] [CrossRef]
  13. Lei, N.; Xiong, X.; Guenther, B. Modeling the detector radiometric gains of the Suomi NPP VIIRS reflective solar bands. IEEE Trans. Geosci. Remote Sens. 2015, 53, 1565–1573. [Google Scholar] [CrossRef]
  14. Oudrari, H.; McIntire, J.; Xiong, X.; Butler, J.; Lee, S.; Lei, N.; Schwarting, T.; Sun, J. Prelaunch radiometric characterization and calibration of the S-NPP VIIRS Sensor. IEEE Trans. Geosci. Remote Sens. 2015. [Google Scholar] [CrossRef]
  15. Barrie, J.D.; Fuqua, P.D.; Meshishnek, M.J.; Ciofalo, M.R.; Chu, C.T.; Chaney, J.A.; Moision, R.M.; Graziani, L. Root cause determination of on-orbit degradation of the VIIRS rotating telescope assembly. Proc. SPIE 2012. [Google Scholar] [CrossRef]
  16. Gyanesh, C.; Mishra, N.; Helder, D.L.; Aaron, D.B.; Angal, A.; Choi, T.; Xiong, X.; Doelling, D.R. Applications of spectral band adjustment factors (SBAF) for cross-calibration. IEEE Trans. Geosci. Remote Sens. 2013, 51, 1267–1281. [Google Scholar]
  17. Joint Polar Satellite System (JPSS) VIIRS Radiometric Calibration Algorithm Theoretical Basis Document (ATBD). Available online: http://www.star.nesdis.noaa.gov/jpss/documents/ATBD/D0001-M01-S01-003_JPSS_ATBD_VIIRS-SDR_C.pdf (accessed on 15 June 2016).
  18. Chen, H.; Sun, C.; Chen, X.; Chiang, K.; Xiong, X. On-orbit calibration and performance of S-NPP VIIRS DNB. Proc. SPIE 2016. [Google Scholar] [CrossRef]
  19. Lee, S.; Chiang, K.; Xiong, X.; Sun, C.; Anderson, S. The S-NPP VIIRS Day-Night Band on-orbit calibration/characterization and current state of SDR products. Remote Sens. 2014, 6, 12427–12446. [Google Scholar] [CrossRef]
  20. Lei, N.; Chen, X.; Xiong, X. Determination of the SNPP VIIRS SDSM screen relative transmittance from both yaw maneuver and regular on-orbit data. IEEE Trans. Geosci. Remote Sens. 2016, 54, 1390–1398. [Google Scholar] [CrossRef]
  21. Guide to Meteorological Instruments and Methods of Observation (WMO-No. 8). Provisional 2014 edition for CIMO-16 Approval. World Meteorological Organization. Available online: https://www.wmo.int/pages/prog/www/IMOP/publications/CIMO-Guide/Provisional2014Edition.html (accessed on 15 June 2016).
  22. Ohring, G. Achieving Satellite Instrument Calibration for Climate Change (ASIC3); National Oceanic and Atmospheric Administration and Other Organizations at the National Conference Center: Lansdowne, VA, USA, 2006. [Google Scholar]
  23. Zhang, R.; Huang, C.; Zhan, X.; Dai, Q.; Song, K. Development and validation of the global surface type data product from S-NPP VIIRS. Remote Sens. Lett. 2016, 7, 51–60. [Google Scholar] [CrossRef]
  24. Cao, C.; Bai, Y. Quantitative analysis of VIIRS DNB nightlight point source for light power estimation and stability monitoring. Remote Sens. 2014. [Google Scholar] [CrossRef]
  25. Baugh, K.; Hsu, F.C.; Elvidge, C.; Zhizhin, M. Nighttime lights compositing using the VIIRS Day-Night Band: preliminary results. Proc. Asia-Pac. Adv. Netw. 2013, 35, 70–86. [Google Scholar] [CrossRef]
  26. Wang, J.; Aegerter, C.; Xu, X.; Szykman, J.J. Potential application of VIIRS Day/Night Band for monitoring nighttime surface PM2.5 air quality from space. Atm. Environ. 2016, 124, 55–63. [Google Scholar] [CrossRef]
  27. Zhang, X.; Friedl, M.; Henebry, G.; Jayavelu, S.; Ray, J.; Liu, Y.; Schaaf, C.; Wang, J. Development and validation of a land surface phenology product from VIIRS. In Proceedings of the MODIS/VIIRS 2016 Science Team Meeting, Silver Spring, MD, USA, 6–10 June 2016.
  28. Lee, S.; McIntire, J.; Oudrari, H.; Schwarting, T.; Xiong, X. A new method for Suomi-NPP Day-Night Band on-orbit radiometric calibration. IEEE Trans. Geosci. Remote Sens. 2015, 53, 324–334. [Google Scholar]
  29. Lei, N.; Xiong, X. Functional form of the radiometric equation for the SNPP VIIRS reflective solar bands. Proc. SPIE 2016. [Google Scholar] [CrossRef]
  30. Uprety, S.; Cao, C.; Xiong, X.; Blonski, S.; Wu, A.; Shao, X. Radiometric intercomparison between Suomi-NPP VIIRS and Aqua MODIS reflective solar bands using simultaneous nadir overpass in the low latitudes. J. Atm. Ocean. Technol. 2013, 30, 2720–2736. [Google Scholar] [CrossRef]
  31. Uprety, S.; Blonski, S.; Cao, C. On-orbit radiometric performance characterization of S-NPP VIIRS reflective solar bands. Proc. SPIE 2016. [Google Scholar] [CrossRef]
  32. Wang, W.; Cao, C. Monitoring the NOAA operational VIIRS RSB and DNB calibration stability using monthly and semi-monthly deep convective clouds time series. Remote Sens. 2016. [Google Scholar] [CrossRef]
  33. Chen, X.; Wu, A.; Xiong, X.; Lei, N.; Wang, Z.; Chiang, K. Validation of S-NPP VIIRS Day-Night band and M bands performance using ground reference targets of Libya 4 and Dome C. Proc. SPIE 2015. [Google Scholar] [CrossRef]
  34. McIntire, J.; Moyer, D.; Efremova, B.; Oudrari, H.; Xiong, X. On-Orbit characterization of S-NPP VIIRS transmission functions. IEEE Trans. Geosci. Remote Sens. 2015. [Google Scholar] [CrossRef]
  35. Roy, D.P.; Zhang, H.K.; Ju, J.; Gomez-Dans, J.L.; Lewis, P.E.; Schaaf, C.B.; Sun, Q.; Li, J.; Huang, H.; Kovalskyy, V. A general method to normalize Landsat reflectance data to nadir BRDF adjusted reflectance. Remote Sens. Environ. 2016, 176, 255–271. [Google Scholar] [CrossRef]
  36. Roujean, J.L.; Leroy, M.; Deschamps, P.Y. A bidirectional reflectance model of the Earth’s surface for the correction of remote sensing data. J. Geophys. Res. 1992, 97, 20455–20468. [Google Scholar] [CrossRef]
  37. Aoki, T.; Aoki, T.; Fukabori, M. Effects of snow physical parameters on spectral albedo and bidirectional reflectance of snow surface. J. Geophs. Res. 2000, 105, 10219–10236. [Google Scholar] [CrossRef]
  38. Ientilucci, E.; Gartley, M. Impact of BRDF on physics based modeling as applied to target detection in hyperspectral imagery. Proc. SPIE 2009. [Google Scholar] [CrossRef]
Figure 1. DNB and M4–M7 bands prelaunch RSRs at orbit 154 and modulated RSRs at orbit 20875.
Remotesensing 08 00984 g001
Figure 2. SCIAMACHY spectra of Libya 4 and Dome C sites.
Remotesensing 08 00984 g002
Figure 3. DNB and M4–M7 ESUN difference derived from using the modulated RSRs and using the prelaunch RSRs.
Remotesensing 08 00984 g003
Figure 4. Comparison of Libya 4 TOA reflectance before and after kernel driven BRDF correction for DNB, M4, M5, and M7 bands.
Remotesensing 08 00984 g004
Figure 5. Libya 4 Land PEATE and SCIAMACHY DNB normalized reflectance data.
Remotesensing 08 00984 g005
Figure 6. Comparison of Land PEATE DNB and M bands normalized reflectance at Libya 4 site.
Remotesensing 08 00984 g006
Figure 7. Comparison of Libya 4 DNB radiance and M bands integral radiance.
Remotesensing 08 00984 g007
Figure 8. Dome C DNB normalized reflectance of Land PEATE and SCIAMACHY data.
Remotesensing 08 00984 g008
Figure 9. Comparison of Dome C DNB reflectance and M bands reflectance.
Remotesensing 08 00984 g009
Figure 10. DNB radiance comparison with integral M bands radiance for Dome C site.
Remotesensing 08 00984 g010
Table 1. List of characteristics of DNB and M bands within DNB wavelength range.
VIIRS BandWavelength Range (nm)Bandpass (nm)Gain StagesBand ExplanationSpatial Resolution at Nadir (m)
DNB500–900400Low, Middle, HighVisible/Reflective750
M4545–56520Low, HighVisible/Reflective750
M5662–68220Low, High
M6739–75415SingleNear IR750
M7846–88539Low, High

