Article

An Alternative Quality Control Technique for Mineral Chemistry Analysis of Portland Cement-Grade Limestone Using Shortwave Infrared Spectroscopy

1
Department of Earth Systems Analysis, Faculty of Geo-Information Science and Earth Observation (ITC), University of Twente, P.O. Box 217, 7500 AE Enschede, The Netherlands
2
Department of Physics, Faculty of Mathematics and Natural Sciences, Syiah Kuala University, Darussalam, Banda Aceh 23111, Indonesia
3
Laboratory Department, PT. Lafarge Cement Indonesia, Km 17 Lhoknga, Aceh Besar 23353, Indonesia
*
Author to whom correspondence should be addressed.
Remote Sens. 2016, 8(11), 950; https://doi.org/10.3390/rs8110950
Submission received: 30 June 2016 / Revised: 26 October 2016 / Accepted: 3 November 2016 / Published: 15 November 2016

Abstract

:
Shortwave infrared (SWIR) spectroscopy can be applied directly to analyze the mineral chemistry of raw or geologic materials. It provides diagnostic spectral characteristics of the chemical composition of minerals, information that is invaluable for the identification and quality control of such materials. The present study aims to investigate the potential of SWIR spectroscopy as an alternative quality control technique for the mineral chemistry analysis of Portland cement-grade limestone. We used the spectroscopic (wavelength position and depth of absorption feature) and geochemical characteristics of limestone samples to estimate the abundance and composition of carbonate and clay minerals on rock surfaces. The depth of the carbonate (CO3) and Al-OH absorption features are linearly correlated with the contents of CaO and Al2O3 in the samples, respectively, as determined by portable X-ray fluorescence (PXRF) measurements. Variations in the wavelength position of CO3 and Al-OH absorption features are related to changes in the chemical compositions of the samples. The results showed that the dark gray and light gray limestone samples are better suited for manufacturing Portland cement clinker than the dolomitic limestone samples. This finding is based on the CaO, MgO, Al2O3, and SiO2 concentrations and compositions. The results indicate that SWIR spectroscopy is an appropriate approach for the chemical quality control of cement raw materials.

Graphical Abstract

1. Introduction

The manufacturing process and quality of Portland cement are directly controlled by the chemistry of the raw materials used. Therefore, it is essential to select raw materials that have the correct chemical composition. The composition and properties of Portland cement clinker show that it is made by blending different raw materials, which are predominantly a mix of calcareous and argillaceous materials [1,2,3,4]. To correct any desired composition deficiencies, it may be necessary to add minor proportions of additive or corrective constituents, which may be a siliceous, aluminous, or ferruginous material or a combination of those materials, into the raw mix. However, the proportional estimation of the additive or corrective constituents depends on the compositional characteristics of the calcareous material as the main component in the raw mix [1,2,3,4].
The main naturally available calcareous material on the earth’s surface, as well as the preferred source of lime or calcium oxide (CaO) to make clinker, is limestone [1,2,3,4]. The suitability and availability of this carbonate rock in very large amounts are vital for the production of clinker. Limestone is a sedimentary rock mostly containing calcium carbonate (CaCO3), normally in the form of calcite [5,6]. The rock may also contain various amounts of mineralogical associations, such as dolomite (CaMg(CO3)2), siderite (FeCO3), magnesite (MgCO3), goethite (FeO(OH)), quartz (SiO2), clays (kaolinite (Al2Si2O5(OH)4), montmorillonite ((Na,Ca)0.33(Al,Mg)2(Si4O10)), and illite ((K,H3O)(Al,Mg,Fe)2(Si,Al)4O10[(OH)2, (H2O)])), halides (fluorite (CaF2) and halite (NaCl)), phosphates (hydroxylapatite (Ca5(PO4)3OH), fluorapatite (Ca5(PO4)3F), and chlorapatite (Ca5(PO4)3Cl)), sulfates (gypsum (CaSO4·2H2O), barite (BaSO4), alunite (KAl3(SO4)2(OH)6), and celestite (SrSO4)), and sulfides (pyrite (FeS2) and realgar (As4S4)) [5,6]. Moreover, the mineralogical and chemical compositions of the rock depend on its mode of origin and depositional environment [2,5,6], which have a definite implication on the cement manufacturing process [2]. Carbonate rock that is suitable in the manufacturing of Portland cement should contain specific chemical compositions, such as 44%–52% CaO, 3%–3.5% MgO, 0.6% (maximum) Na2O and K2O, 0.6%–0.8% (maximum) SO3, 0.25%–0.6% (maximum) P2O5, 1.3% TiO2, 0.5% Mn2O3, and SiO2, Al2O3, and Fe2O3 in proportions suitable for cement manufacturing [1,3,4]. The occurrence of some of those minor chemical constituents and trace elements in amounts exceeding the standard, for instance, MgO, SO3, P2O5, TiO2, Na2O, K2O, Cl, Cu, Pb, Zn, Cr, and others, are deleterious to the production and utilization of clinker [1,3,4,7,8,9,10,11,12,13,14].
Various techniques have been employed to characterize and control the chemical compositions of cement materials and products. Such techniques include X-ray fluorescence (XRF) [15,16,17], energy dispersive X-ray spectroscopy (EDS) [18,19,20,21], electron probe microanalysis (EPMA) [22,23,24,25], and inductively coupled plasma optical emission spectrometer (ICP-OES) [26,27,28,29]. However, these methods are expensive and time consuming for sample preparation and analysis. An alternative approach that is much simpler and faster than these conventional techniques is infrared spectroscopy. This spectroscopic method uses shortwave infrared (SWIR) spectral absorption feature properties, such as the wavelength position and depth of absorption feature [30,31], to identify and estimate the relative abundances of SWIR range-active minerals and their compositions suitable for the manufacturing of cement clinker from hand specimens of fresh carbonate rock surfaces. The spectroscopic method can also be combined with X-ray fluorescence (XRF) or geochemistry data to determine the chemical compositions of rocks. Infrared spectroscopy techniques have been utilized to characterize the chemistry of cement products and the hydration rate [19,32,33,34,35]. However, their applications in determining the mineral chemistry and chemical compositions of cement raw materials, especially limestone or other calcareous materials, have not been completely explored. Previous studies have shown that the spectroscopic method complemented by geochemical analysis can identify and predict the composition and proportion of iron oxide and aluminum hydroxide (Al-clay) contents from drill core samples of channel iron ore [36] and iron ore [37]. Zaini et al. [38] recently presented a laboratory hyperspectral imaging spectroscopy approach to derive the carbonate mineral chemistry or Ca-Mg ratio from carbonate rock samples based on spectroscopic and geochemical parameters.
The SWIR reflectance spectra in the wavelength range of 1.0–2.5 μm exhibit several diagnostic absorption features of mineral chemistries. These features are determined by the occurrence of hydroxyl (OH), water (H2O), carbonate (CO3), sulfate (SO4), and typical cationic transitional vibrations present in phyllosilicates (e.g., Al-OH, Mg-OH, and Fe-OH bearing clay, mica and serpentine) [39,40,41,42]. The spectral absorption features of minerals are influenced by the chemical composition, structural arrangement, and bonding characteristics [43,44,45]. These spectral characteristics may allow for direct identification of surface mineralogy. Carbonate minerals, such as calcite (CaCO3) and dolomite (CaMg(CO3)2), have two distinctive absorption features in the SWIR wavelength region centered at 2.530–2.541 μm and 2.333–2.340 μm and 2.503–2.520 μm and 2.312–2.323 μm, respectively [39,41,45,46,47,48,49], due to the vibrational processes of carbonate ions ( CO 3 2 ) [39,41,46]. The presence of clay and other phyllosilicate minerals in an intimate mixture with carbonates can be identified based on their vibrational absorption features around 2.20 μm and 2.30 μm [40,41,42]. These absorption features are caused by the combination of the OH stretch with the Al-OH and Mg-OH bending modes, respectively [40,41,42].
The objective of the present study is to investigate the potential and accuracy of SWIR spectroscopy as an alternative quality control technique for chemical and mineralogical analyses of Portland cement-grade limestone in deriving and estimating the relative abundances and compositions of carbonate and clay mineral chemistries from carbonate rock samples. This is conducted by correlating the spectral absorption feature characteristics (wavelength position and depth of absorption feature) with a geochemical analysis of spot measurements on the rock surface.

2. Materials and Methods

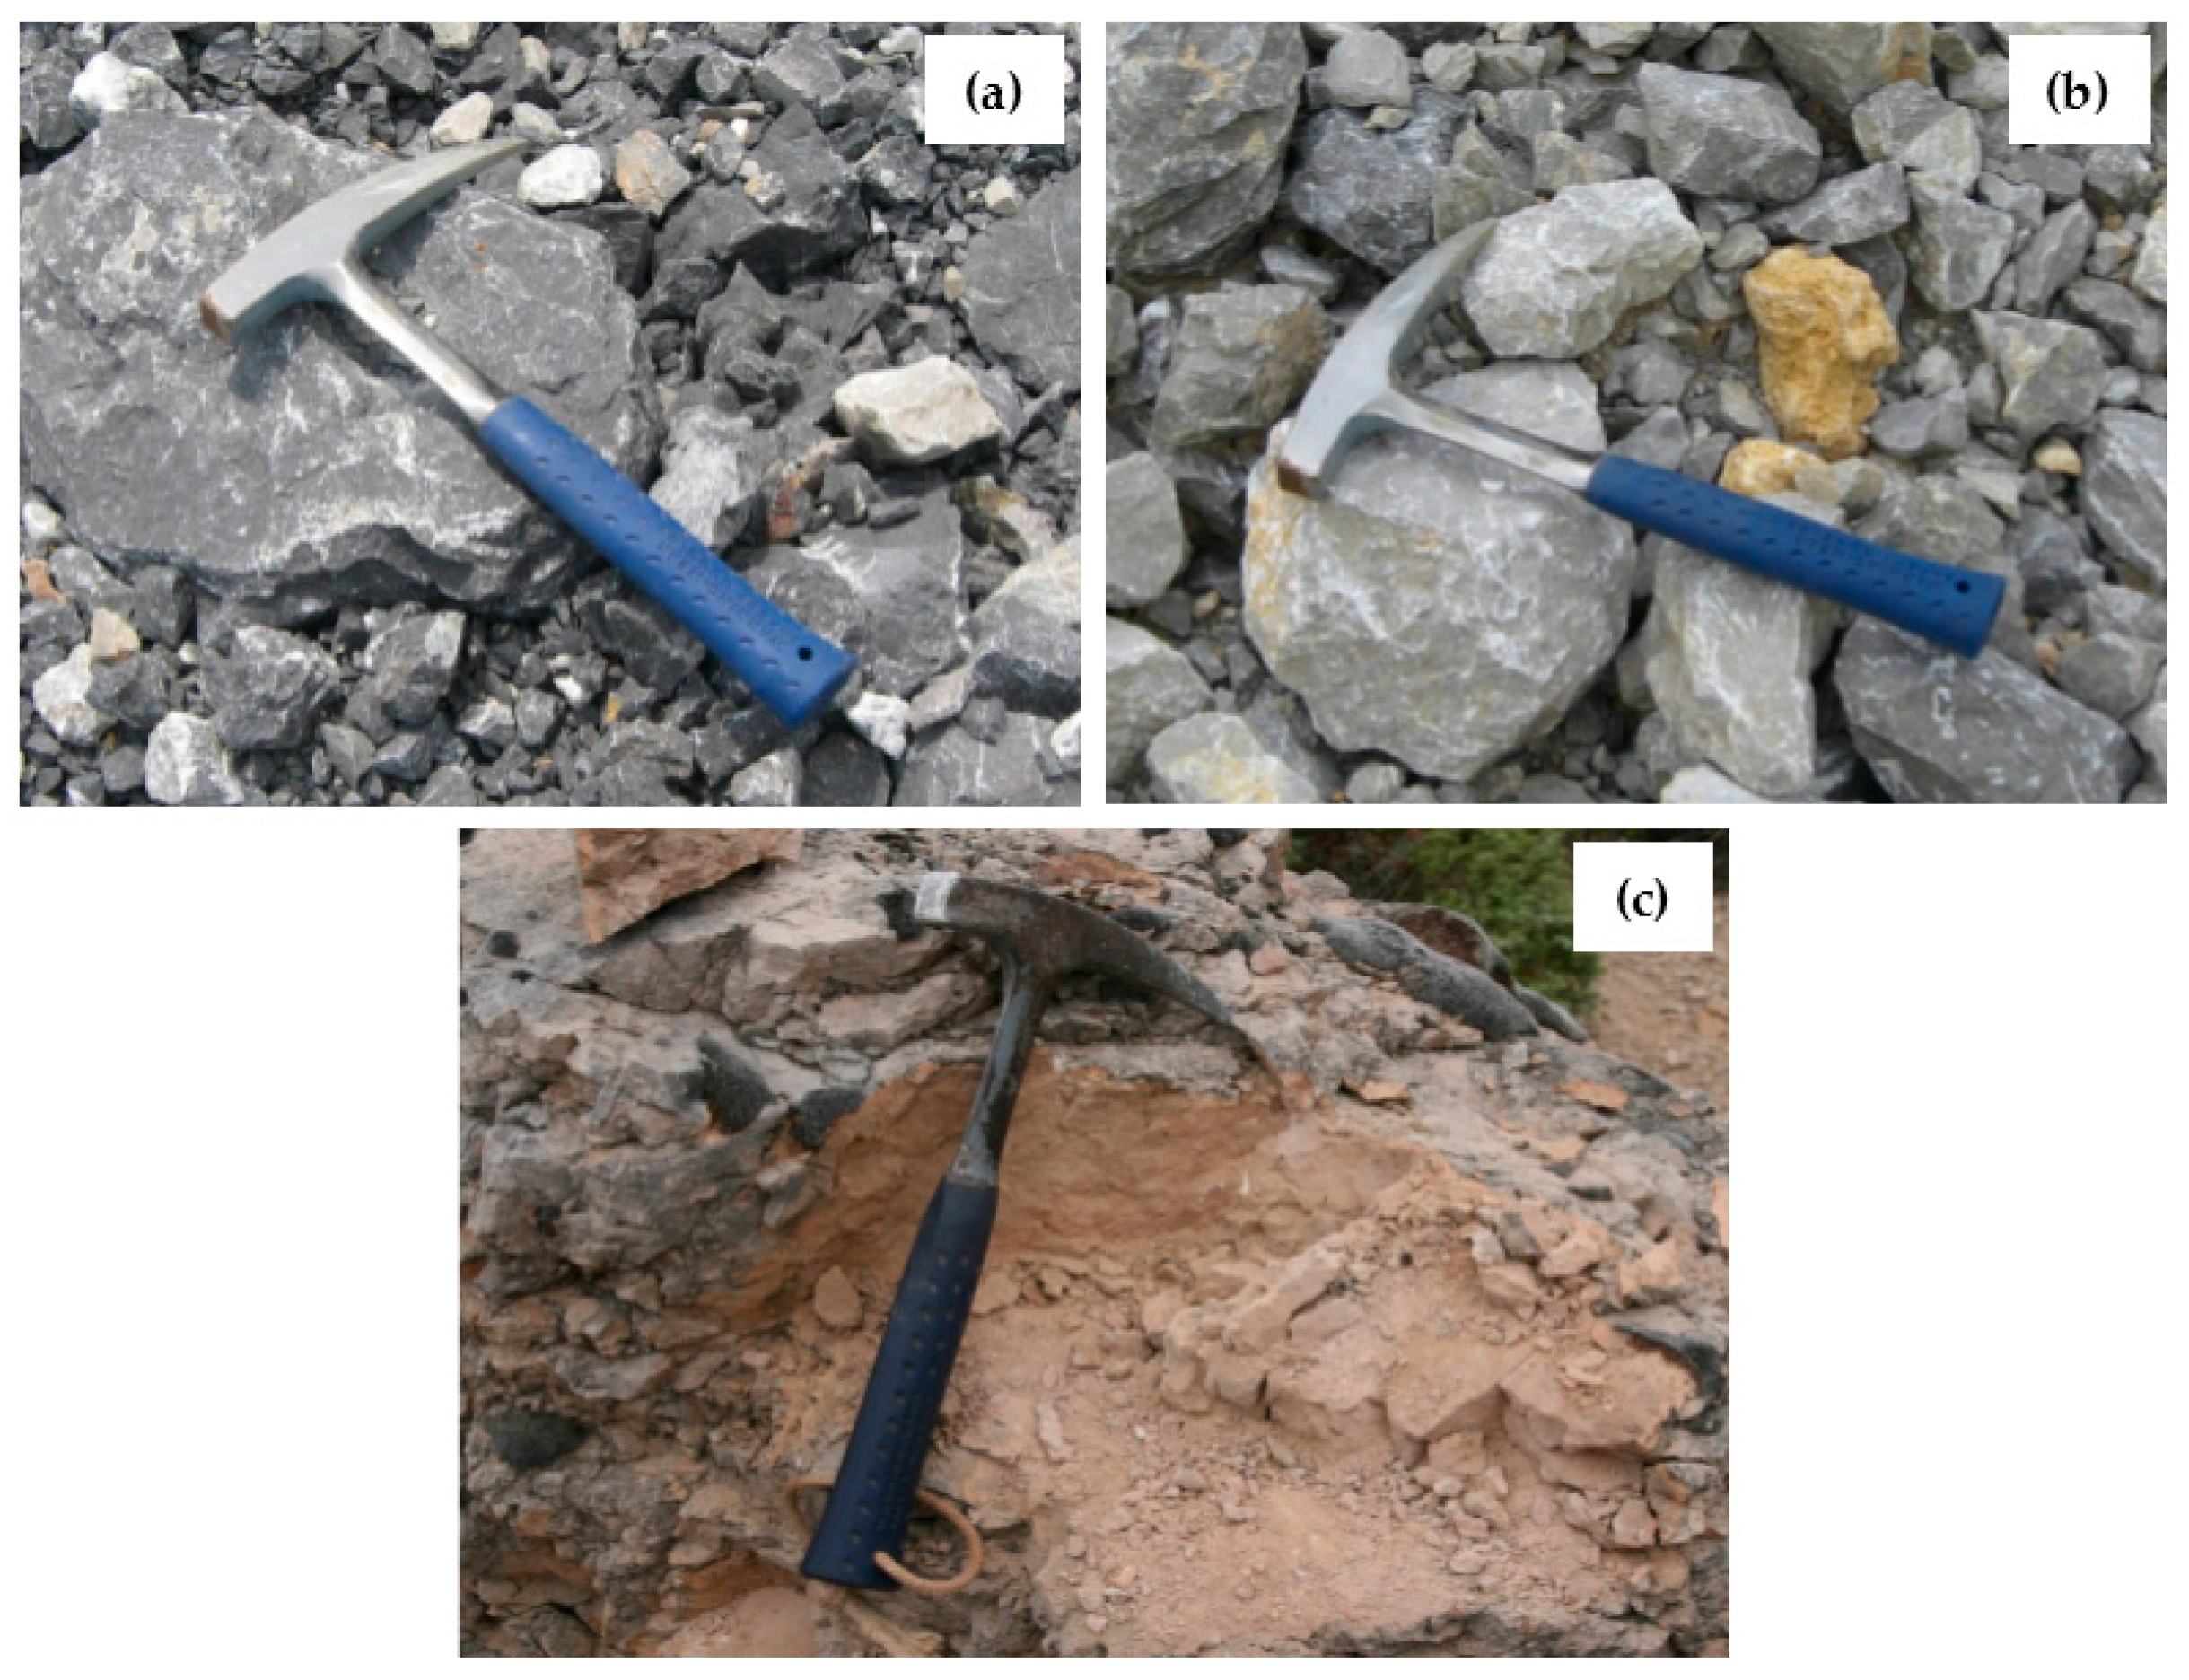
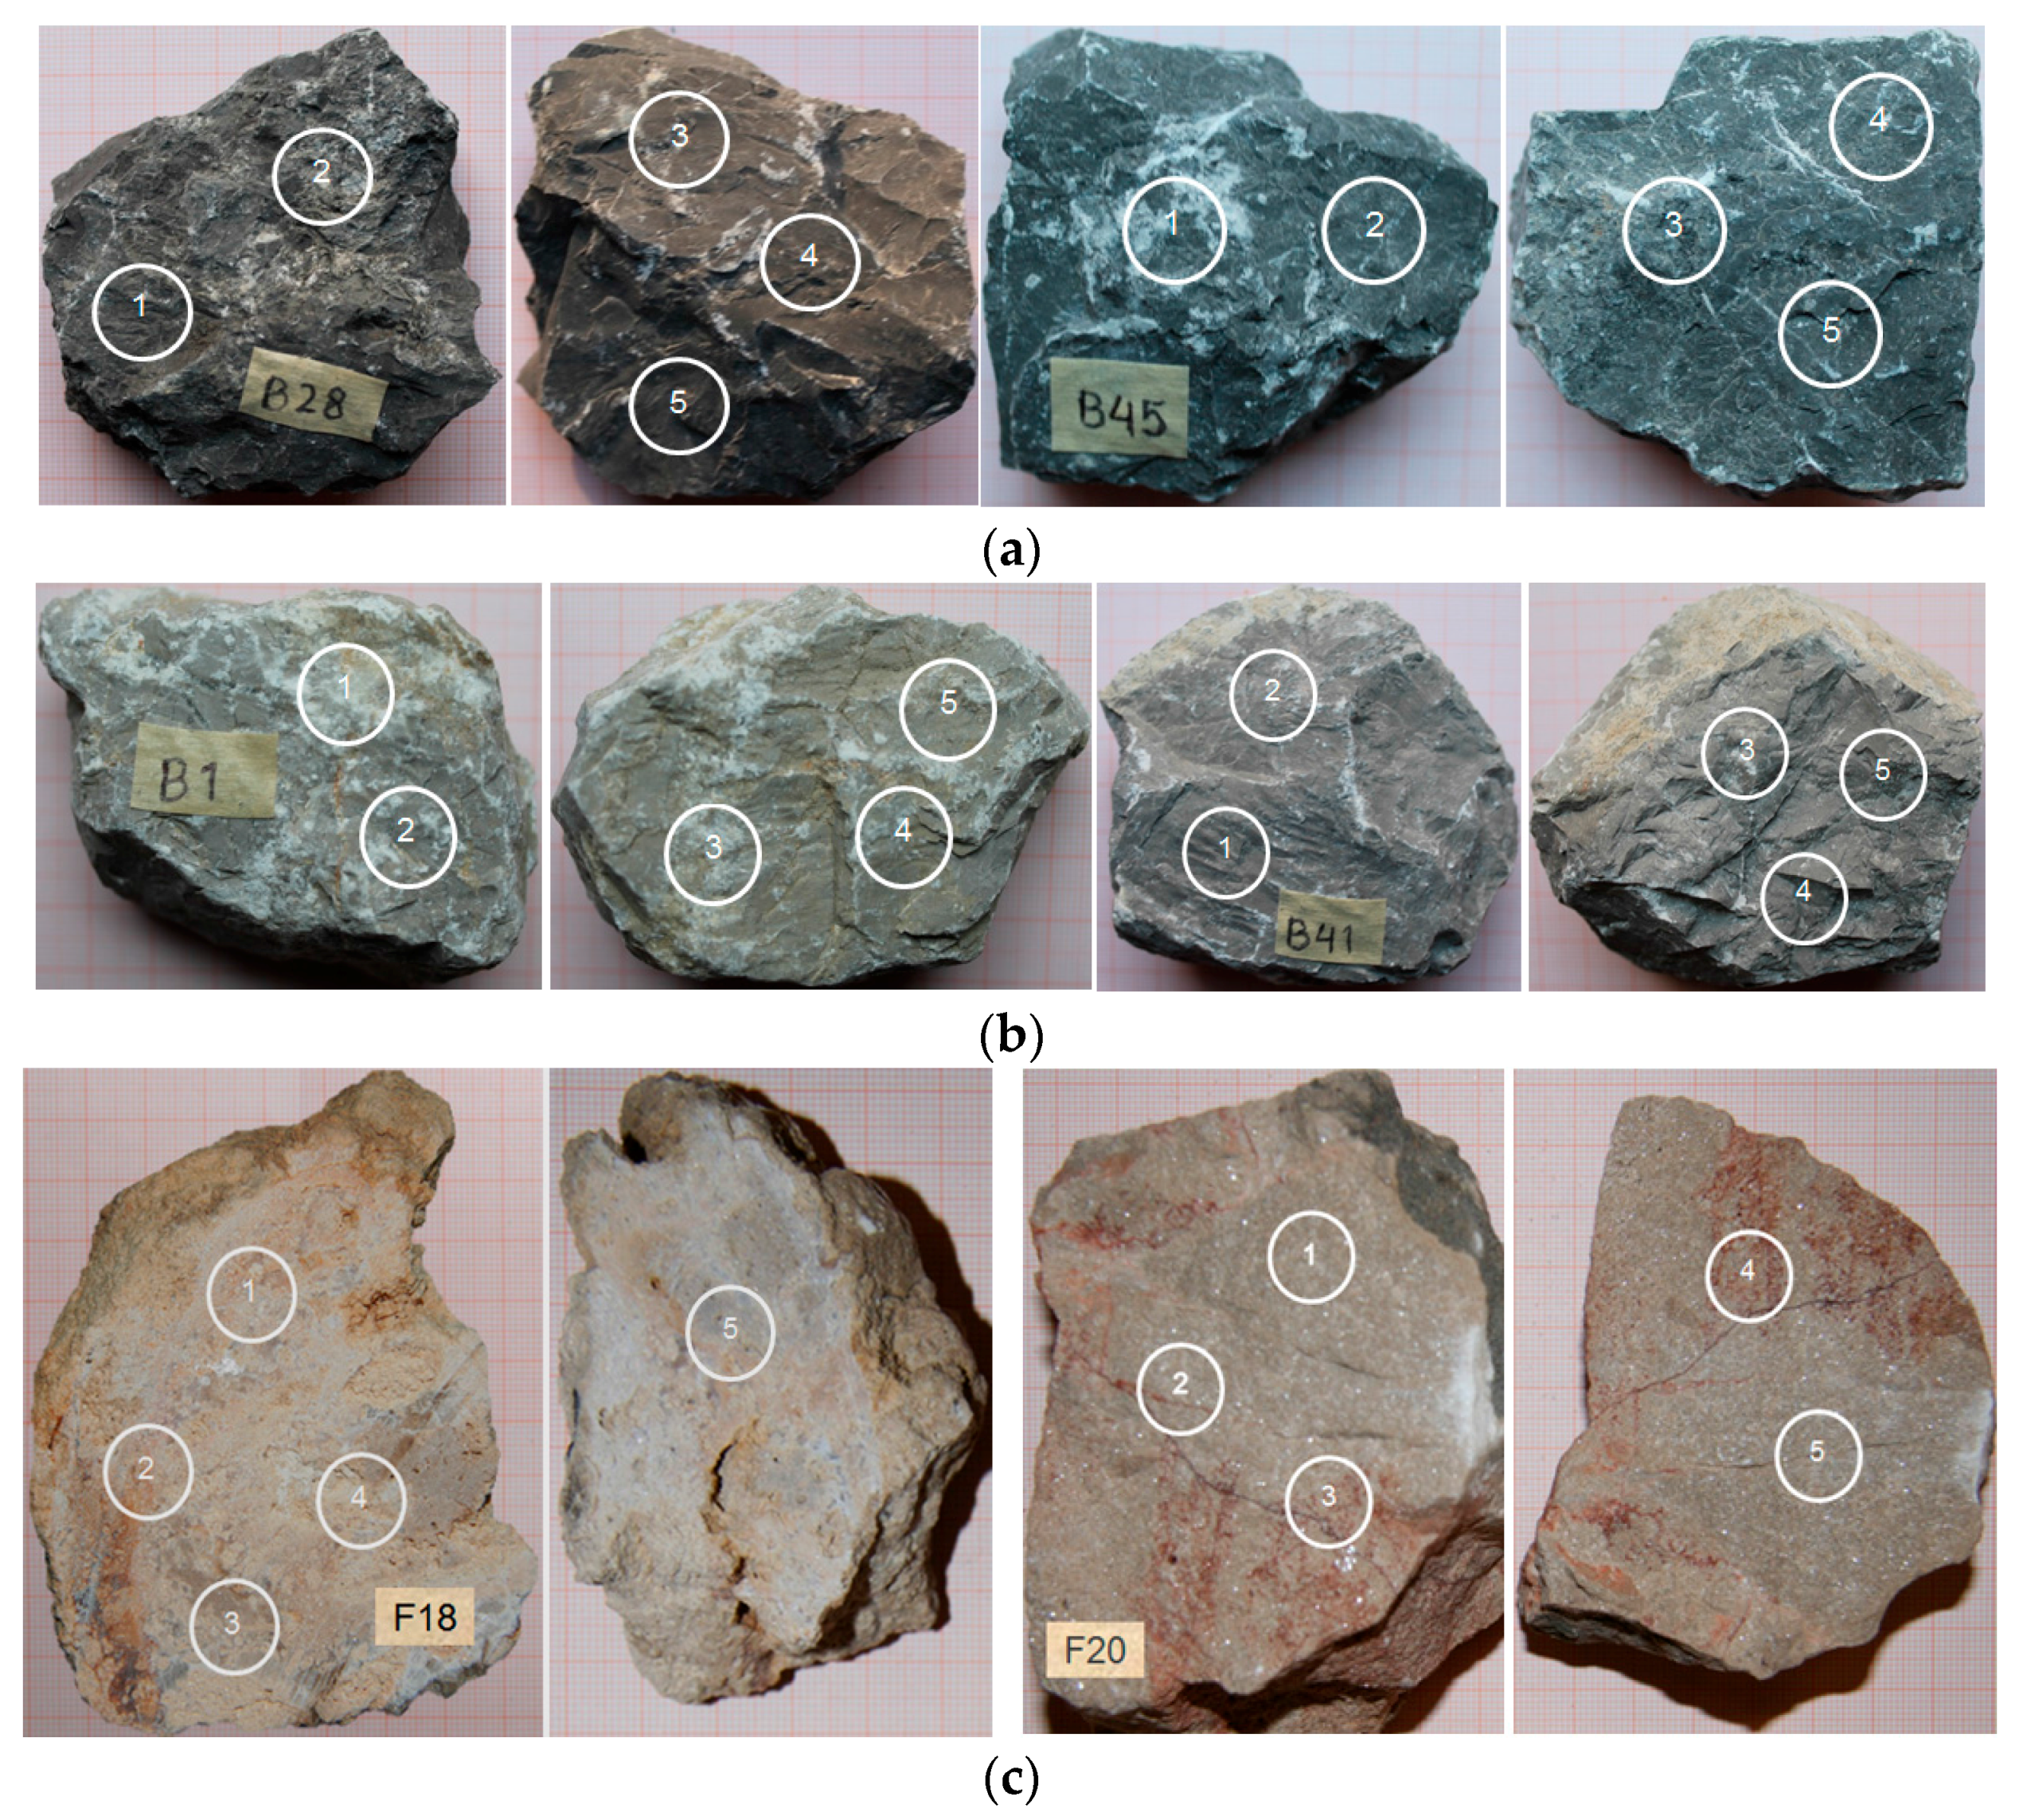
2.1. Carbonate Rock Samples

The carbonate rock samples (Figure 1) used for this study were collected from two different locations, including (1) the Lhoknga limestone quarry, which is an open active limestone mine of PT. Lafarge Cement Indonesia, Aceh Besar, Indonesia. Two types of limestone samples, dark gray and light gray limestones (Figure 1a,b), were selected during fieldwork from 1 to 5 September 2014. The sedimentary rocks are from the Jurassic to Cretaceous-Raba Limestone formation of the Woyla group, which are composed of massive calcarenite and calcilutite and dark gray thin-bedded argillaceous and siliceous limestones [50,51]; The second area is (2) the Bédarieux mining area, which is an open and partly active dolomite mine in the Hérault department of the Languedoc-Roussillon region, southern France [38]. The representative dolomitic limestone samples (Figure 1c) were selected during fieldwork in September 2008. These carbonate rocks are from the Jurassic-Bathomien formation, and their composition becomes sandier from west to east [38,52]. For the purpose of the present study, each carbonate rock type was grouped by five selective hand specimen samples. They consist of dark gray limestones (samples B20, B28, B33, B45, and B49), light gray limestones (samples B1, B26, B32, B36, and B41) and dolomitic limestones (samples F17, F18, F20, F23, and F26) (Figure 2).

2.2. PXRF Geochemical Analysis

The geochemical elements and oxide compositions of the selected limestone samples used for the quality control of cement raw material were analyzed using portable X-ray fluorescence (PXRF) with the Niton XL3t GOLDD+ from Thermo Fisher Scientific Inc. The geochemical characterizations consisted of the weight percentages of CaO, MgO, SiO2, Al2O3, Fe2O3, SO3, K2O, TiO2, and P2O5. To measure the carbonate rock samples, the instrument was set up using the same procedure as previous research [38]. Five PXRF spot measurements with an 8-mm diameter spot size were performed from the same locations as ASD spot measurements on both fresh surfaces of each limestone sample (Figure 2). The analyzer in the mining mode setting was calibrated for a silicate dominated rock matrix; hence, the Ca and Mg concentrations of pure carbonate samples showed an overestimation of up to 10% [38]. To overcome the instrument deficiency in acquiring these elemental concentrations, an inductively coupled plasma optical emission spectrometer (ICP-OES), Variant Liberty Series II, was used to correct the PXRF measurement results by analyzing some pure carbonate samples and limestone samples collected from the Lhoknga and Bédarieux mining areas, with a correction factor of 0.76 and 2.31 for the Ca and Mg PXRF values, respectively.

2.3. Carbonate Rock Spectral Measurements

A FieldSpec Pro Spectrometer from Analytical Spectral Devices (ASD) Inc., Boulder, CO, USA, was used to measure reflectance spectra of the carbonate rock samples from the visible/near infrared (VNIR) to the SWIR (350–2500 nm) wavelength regions. The spectrometer was equipped with a high-intensity light source that is integrated into a reflectance probe and a detector system, which consists of a 512-channel silicon photodiode array for the VNIR spectral measurements (350–1000 nm) and a single thermoelectrically cooled indium gallium arsenide (InGaAs) detector to acquire the SWIR reflectance spectra (1000–2500 nm). A Spectralon (Labsphere, North Sutton, NH, USA) was used to calibrate the spectral measurements of each carbonate rock sample. The reflectance spectra of rock samples were measured using the ASD contact probe, where a probe window frame 2 cm in diameter was placed in direct contact with each of the five spot measurements on both fresh rock sample surfaces (Figure 2). Five reflectance spectra were acquired to obtain an average reflectance spectrum from each ASD spot measurement of limestone samples. A total of five average spectral data were derived from five spot measurements of each rock sample or twenty-five reflectance spectra were recorded from each carbonate rock type. Raw spectral data were corrected by applying splice correction using ViewSpecPro software. ENVI software package version 4.7 was used to build a spectral library and process the spectral data in the wavelength range of 2.100–2.400 µm.

2.4. Determination of Spectral Feature Parameters

The SWIR reflectance spectra have several distinctive absorption features of surface mineralogy. These spectral features can be used to estimate the mineral abundances and chemical compositions of rock or geologic samples based on their spectral feature characteristics, such as the wavelength position and depth of absorption feature [36,37,38,47,53]. The position and depth of absorption feature were extracted from continuum-removed reflectance spectra [54]. The absorption wavelength position is defined as the wavelength at which the maximum absorption or minimum reflectance of an absorption feature occurred [30,31]. The depth of the absorption feature indicates the reflectance value at the shoulders minus the reflectance value at the position of the absorption wavelength [30,31]. Detailed definitions of the characteristics of the absorption feature are described in previous studies [30,31,47].
In this study, the carbonate (CO3) and Al-OH absorption features present in the SWIR reflectance spectra of limestone samples were analyzed. As mentioned previously, carbonate minerals, such as calcite (CaCO3) and dolomite (CaMg(CO3)2), and clay minerals, such as kaolinite (Al2Si2O5(OH)4) and illite ((K,H3O)(Al,Mg,Fe)2(Si,Al)4O10[(OH)2, (H2O)]), have prominent vibrational absorption features in the SWIR wavelength region due to the vibrational processes of carbonate ions [39,41,46] and the combination of the OH stretch with the Al-OH and Mg-OH bending modes [40,41,42], respectively. Those mineral constituents are the main components of the raw materials of cement and play an important role in the manufacturing of Portland cement clinker [1,2,3,4]. The presence of clay and other phyllosilicate minerals in selected rock samples was also confirmed using X-ray diffraction (XRD). The rock samples were pulverized and placed in acid. The acid-insoluble residue was filtered and dried and subsequently measured using the Bruker D2 Phaser XRD. However, there was very little material left after acid digestion on the powdered dolomitic limestone samples. The acid-insoluble residue came into contact with a filter paper and could not be separated. Hence, it yielded unreliable XRD results of clay and other phyllosilicate minerals in the dolomitic samples.
The wavelength position and depth of absorption feature of the mineral reflectance spectra were computed using Hyperspectral Python (HypPy) software package version 2.6 [55]. These spectral parameters were processed by following a routine procedure as described in Zaini et al. [38]. Firstly, we used a method developed by Rodger et al. [56] to calculate wavelength position of a prominent absorption feature of carbonate (CO3) and Al-OH spectral features in the wavelength ranges of 2.125–2.400 μm and 2.170–2.250 µm, respectively. The depth of the absorption feature was determined by adapting an approach designated in previous studies [30,31,47]. A continuum removal was then applied to the spectra within the selected wavelength range, followed by interpolation. A second-order polynomial fit was modeled to three data points of minimum reflectance in the continuum-removed spectra. The wavelength position of the minimum and depth of absorption feature were determined on the fitting polynomial curve or the resulting interpolated parabola. This process produced the wavelength position of the deepest absorption feature and the depth of the feature for each of the spectra. Finally, these spectral parameters were validated and correlated with PXRF geochemical analysis to derive the abundance and composition of the mineral chemistries from the SWIR continuum-removed spectra of the carbonate rock samples.

3. Results

3.1. Geochemical Characterization of the Rock Samples

The geochemical characterization results of oxide compositions on the selected limestone samples over five PXRF spot measurements for each rock sample are shown in Table 1. The chemical analysis shows that calcium oxide (CaO) is a major constituent, comprising approximately 50% by weight, and there is a very low amount of magnesium oxide (MgO) in most of the Lhoknga limestone samples (samples B28, dark gray limestone and B41, light gray limestone). The results also show a significant elemental concentration of SiO2 and Al2O3 in the Lhoknga samples, especially the dark gray limestone sample (sample B28, Table 1). Thus, the quarried limestone samples contain a major amount of calcium carbonate, which is associated with clay and a mixture of other phyllosilicate minerals. In addition, the PXRF results (Table 1) indicate that the light gray limestone sample (sample B41) is purer than the dark gray limestone sample (sample B28) in terms of CaO, MgO, Al2O3, and SiO2 concentrations.
In contrast, the selected dolomitic limestone sample from the Bédarieux dolomite mine (sample F20) contains major oxide elements of CaO and MgO, with concentrations over 27% and 18% (Table 1), respectively. The high MgO concentration is attributed to a dominance of magnesium carbonate in the Bédarieux samples. The geochemical results (Table 1) also reveal a relative low elemental concentration of SiO2 and Al2O3 in the rock sample. Moreover, the Lhoknga and Bédarieux rock samples contain low proportions of other oxide elements, such as Fe2O3, SO3, K2O, and TiO2 (Table 1). The oxide concentration of P2O5 is mostly less than 0.1% for the dark gray and light gray limestone samples and almost 0% for the dolomitic limestone samples. These elements indicate possibly the presence of iron oxide, phosphate and sulfate mineral associations in the limestones. The relative abundance of mineral chemistries and compositions in the rock samples (Table 1) illustrate that the Lhoknga limestone samples can be specified as a good quality limestone for the manufacturing of Portland cement clinker [3,4] compared with the Bédarieux sample.

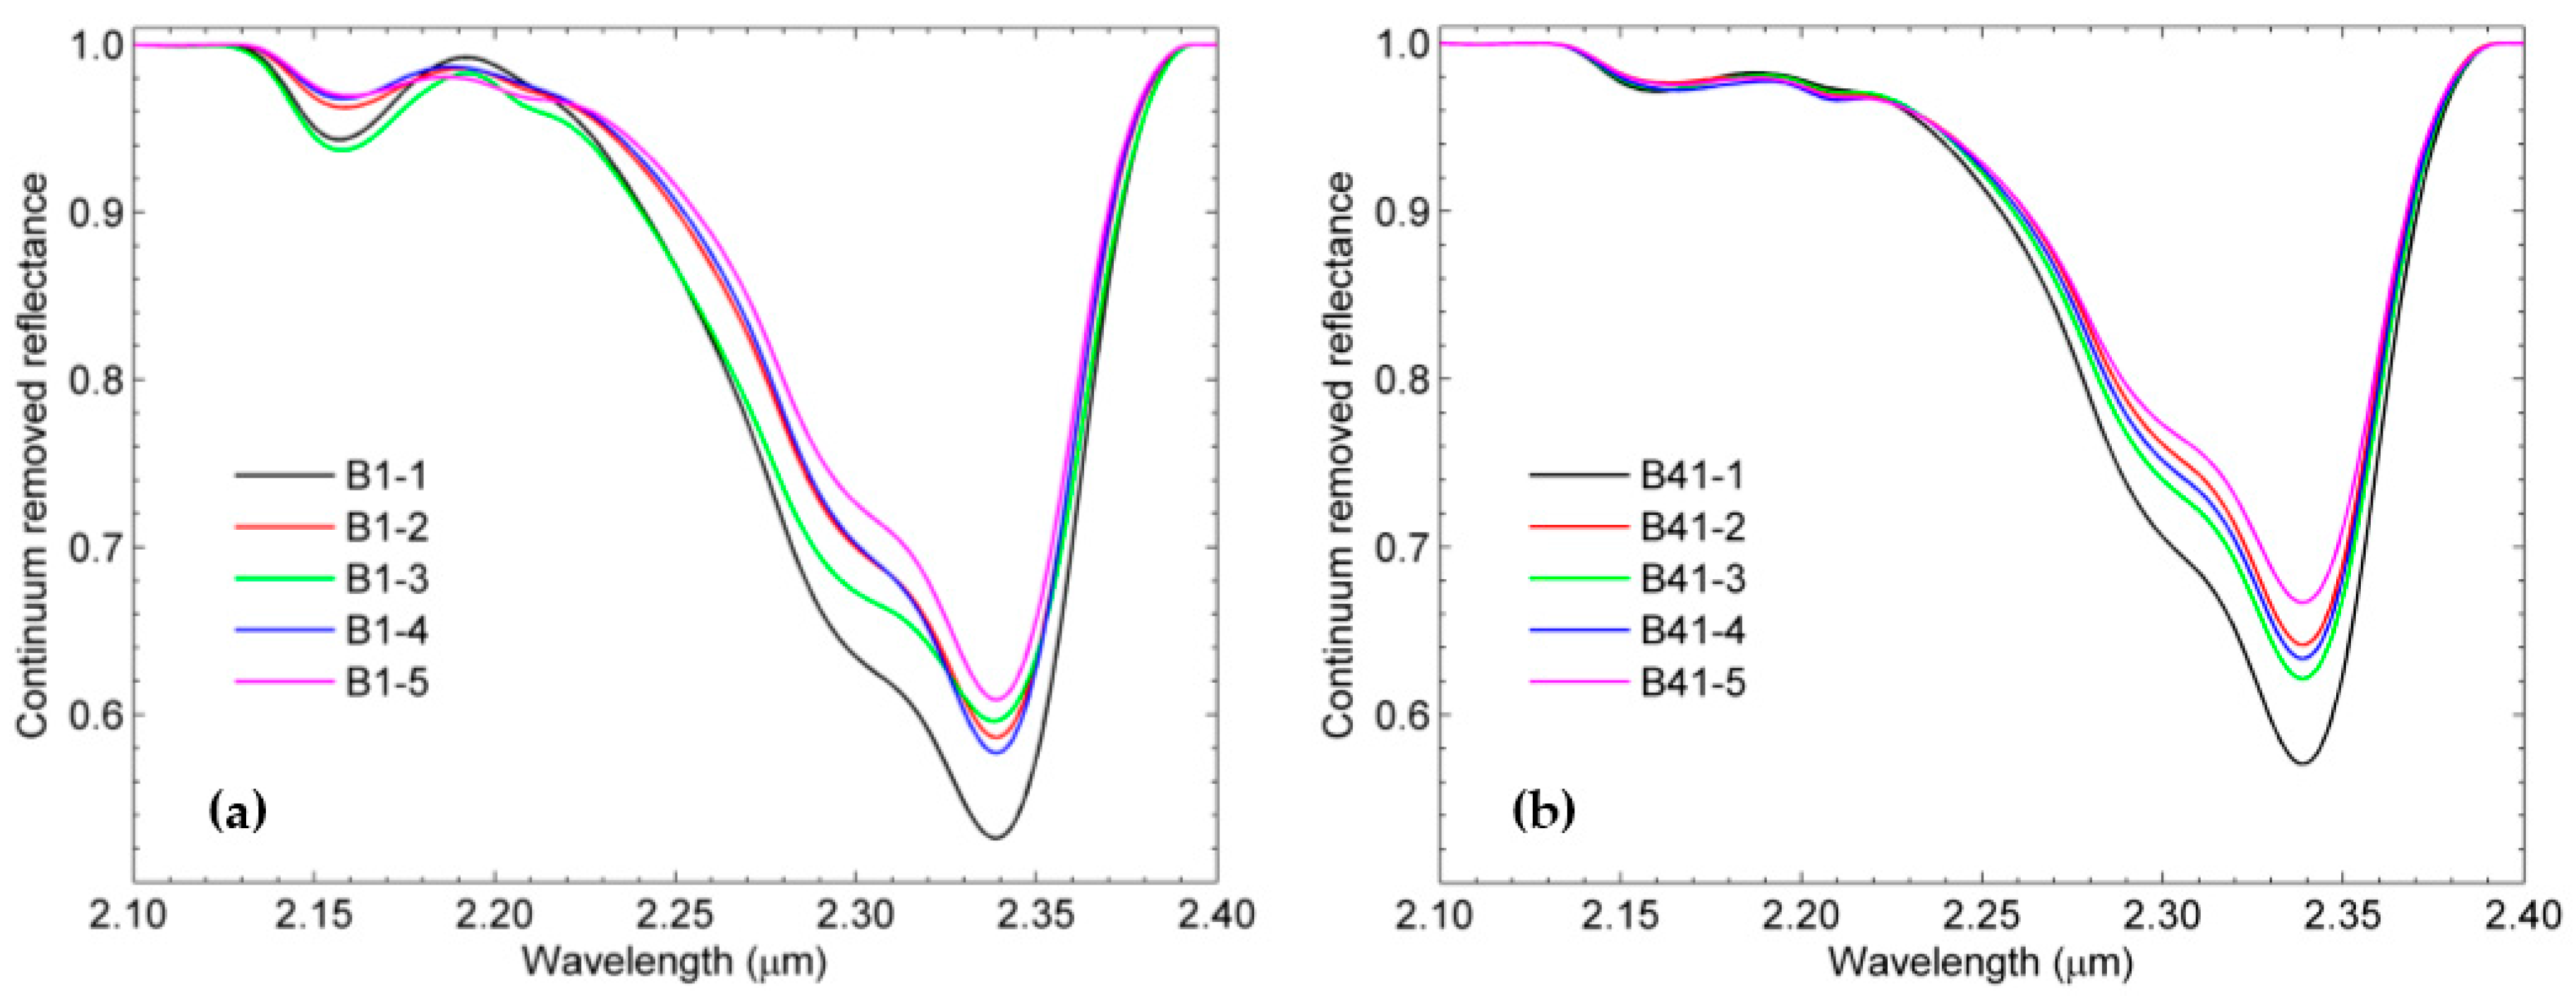
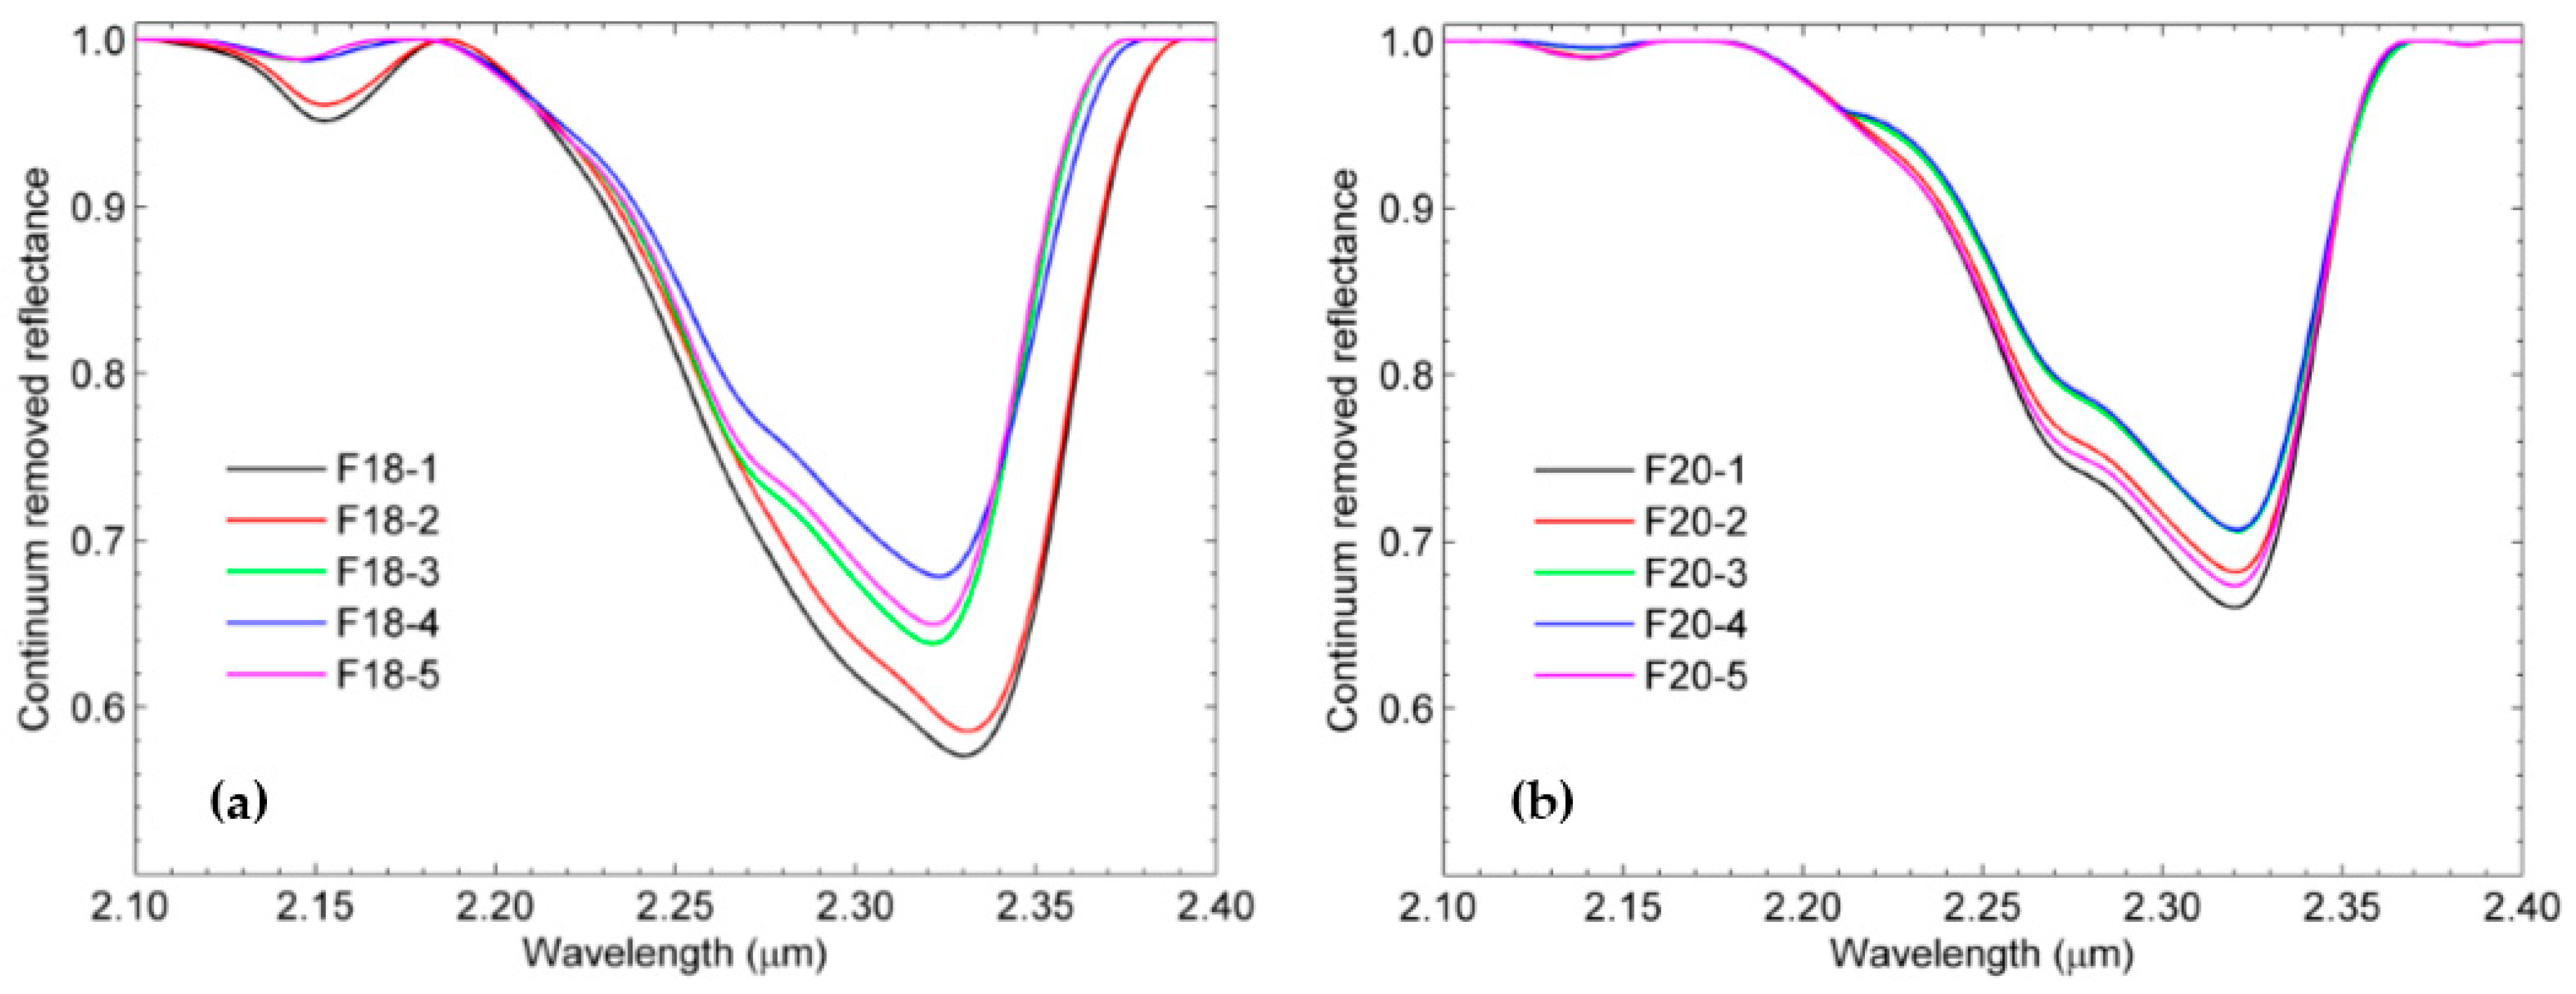
3.2. SWIR Reflectance Spectra of the Rock Samples

The SWIR continuum removed reflectance spectra of the dark gray limestone samples (samples B28 and B45) derived from five ASD spot measurements on the rock surfaces are shown in Figure 3. The spectra exhibit dominant carbonate absorption with a prominent absorption feature of carbonate at ~2.34 µm due to the vibrational process of the carbonate ions ( CO 3 2 ) [39,41,46]. This wavelength position and spectral shape indicate that calcite is more dominant than other carbonate minerals in the rock samples. The reflectance spectra (Figure 3) show weak Al-OH absorption feature at ~2.20 μm, which suggests the presence of minor constituents of clays (e.g., montmorillonite and illite) and other phyllosilicates (e.g., muscovite) in the rock samples. This is caused by the combination of the OH stretch with the fundamental Al-OH bending mode [40,41,42]. However, it is difficult to differentiate between montmorillonite, illite and muscovite based only on the subtle or weak absorption feature at ~2.20 μm. These phyllosilicate minerals exhibit relatively similar spectral shapes for the ~2.20 μm Al-OH feature. The spectral curves also show variations of the absorption band depths for features at ~2.20 µm and ~2.34 µm, which are probably correlated with changes in the relative abundances of phyllosilicate and carbonate minerals on the rock surfaces, respectively.
Figure 4 shows the SWIR continuum removed reflectance spectra of the light gray limestone samples (samples B1 and B41) derived from the five ASD spot measurements on the rock surfaces. The spectra exhibit strong and weak carbonate absorption features at ~2.34 µm and ~2.16 µm, respectively, and a subtle Al-OH absorption feature centered at ~2.20 µm. These carbonate features and spectral shapes are attributed to the relatively pure calcite in the rock samples. It can be seen obviously from Figure 3 and Figure 4 that the depth of carbonate absorption feature at ~2.34 µm in the light gray limestone samples (samples B1 and B41) is deeper than that in dark gray limestone samples (samples B28 and B45) and vice versa for the depth of Al-OH absorption feature at ~2.20 µm. This indicates that the light gray limestone samples contain more calcium carbonate mineral (calcite) than the dark gray limestone samples; moreover, the relative abundance of clay and other phyllosilicate minerals content is higher in the dark gray limestone samples than in the light gray limestone samples.
The SWIR continuum removed reflectance spectra of the dolomitic limestone samples (samples F18 and F20) differ slightly in the wavelength position and depth of carbonate absorption feature at ~2.32 µm (Figure 5). The shifts in the position of an absorption feature at ~2.32 µm towards longer wavelengths as observed in the spectra of sample F18 (Figure 5a) are related to changes in the carbonate mineral compositions of the sample, depending on the proportion of calcite-dolomite mixtures. Strong and weak carbonate absorption features at ~2.32 µm and ~2.15 µm (Figure 5) indicate that the rock samples are dominated by magnesium carbonate and dolomite, respectively. In addition, it can be observed from Figure 5 that there is no obvious Al-OH absorption feature at ~2.20 µm in the spectra, which suggests that the abundance of clay and other phyllosilicate mineral chemistries in the rock samples is insignificant to be determined spectroscopically, compared to the PXRF geochemical approach (Table 1).

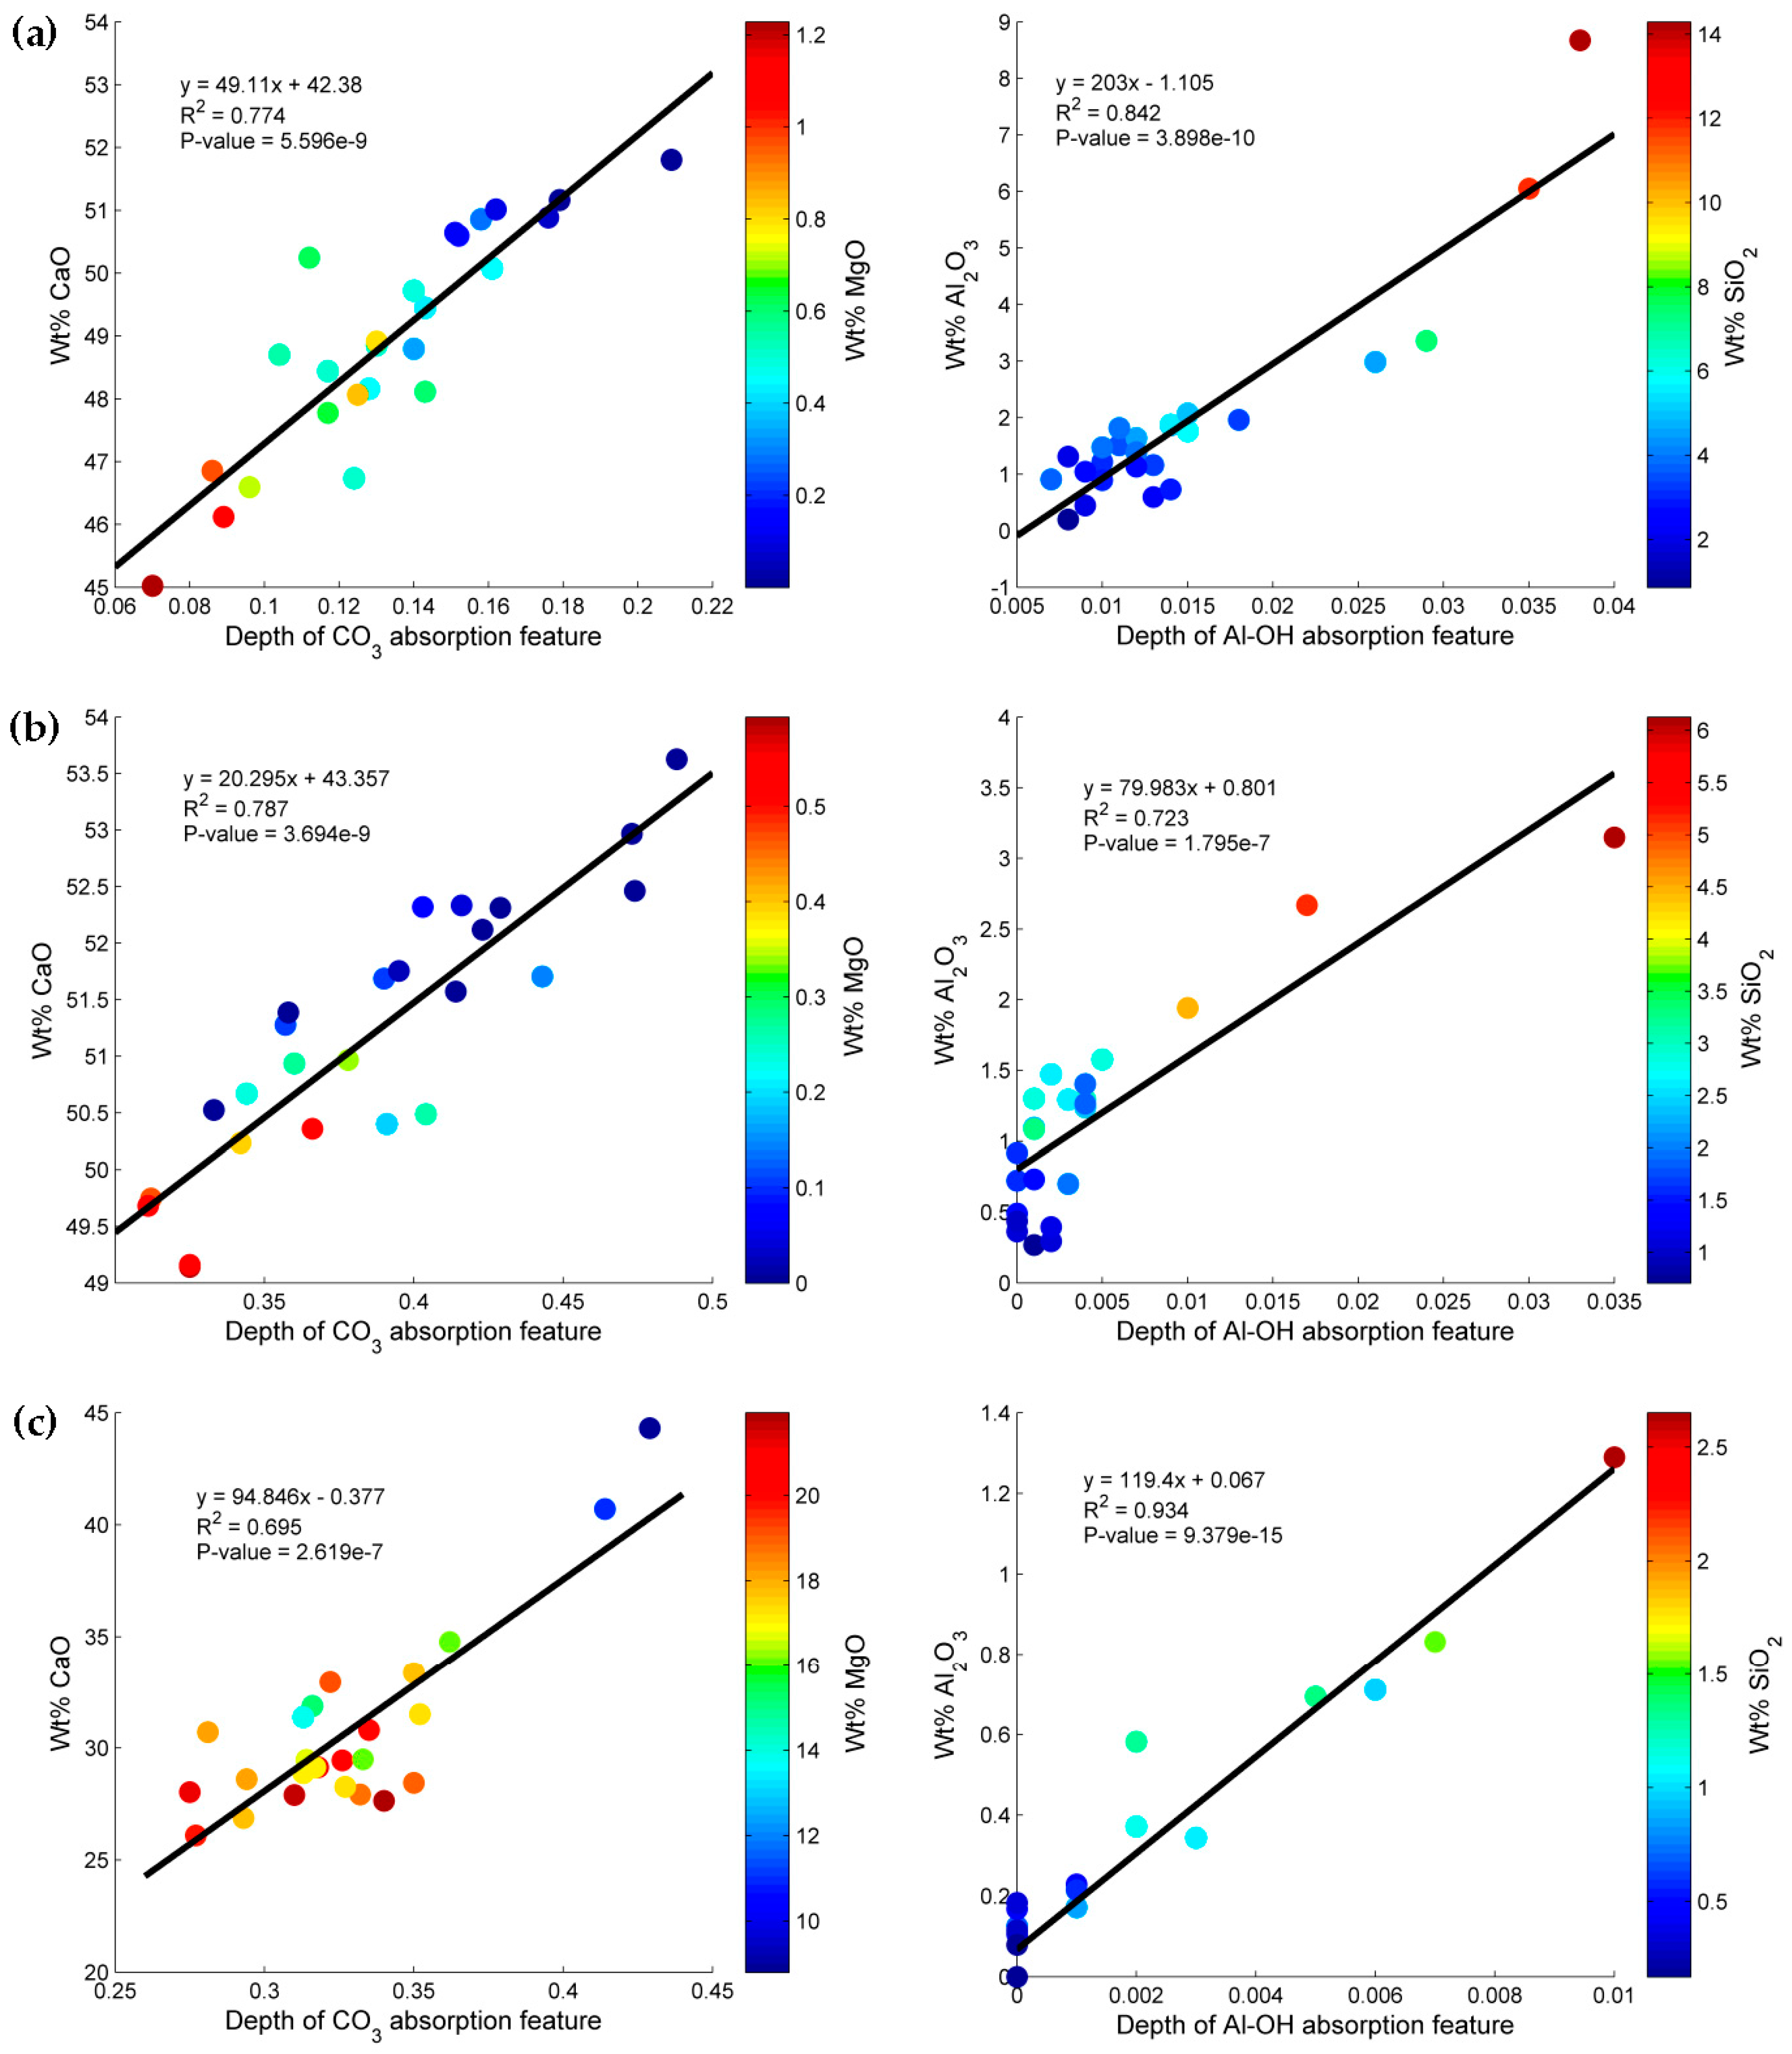
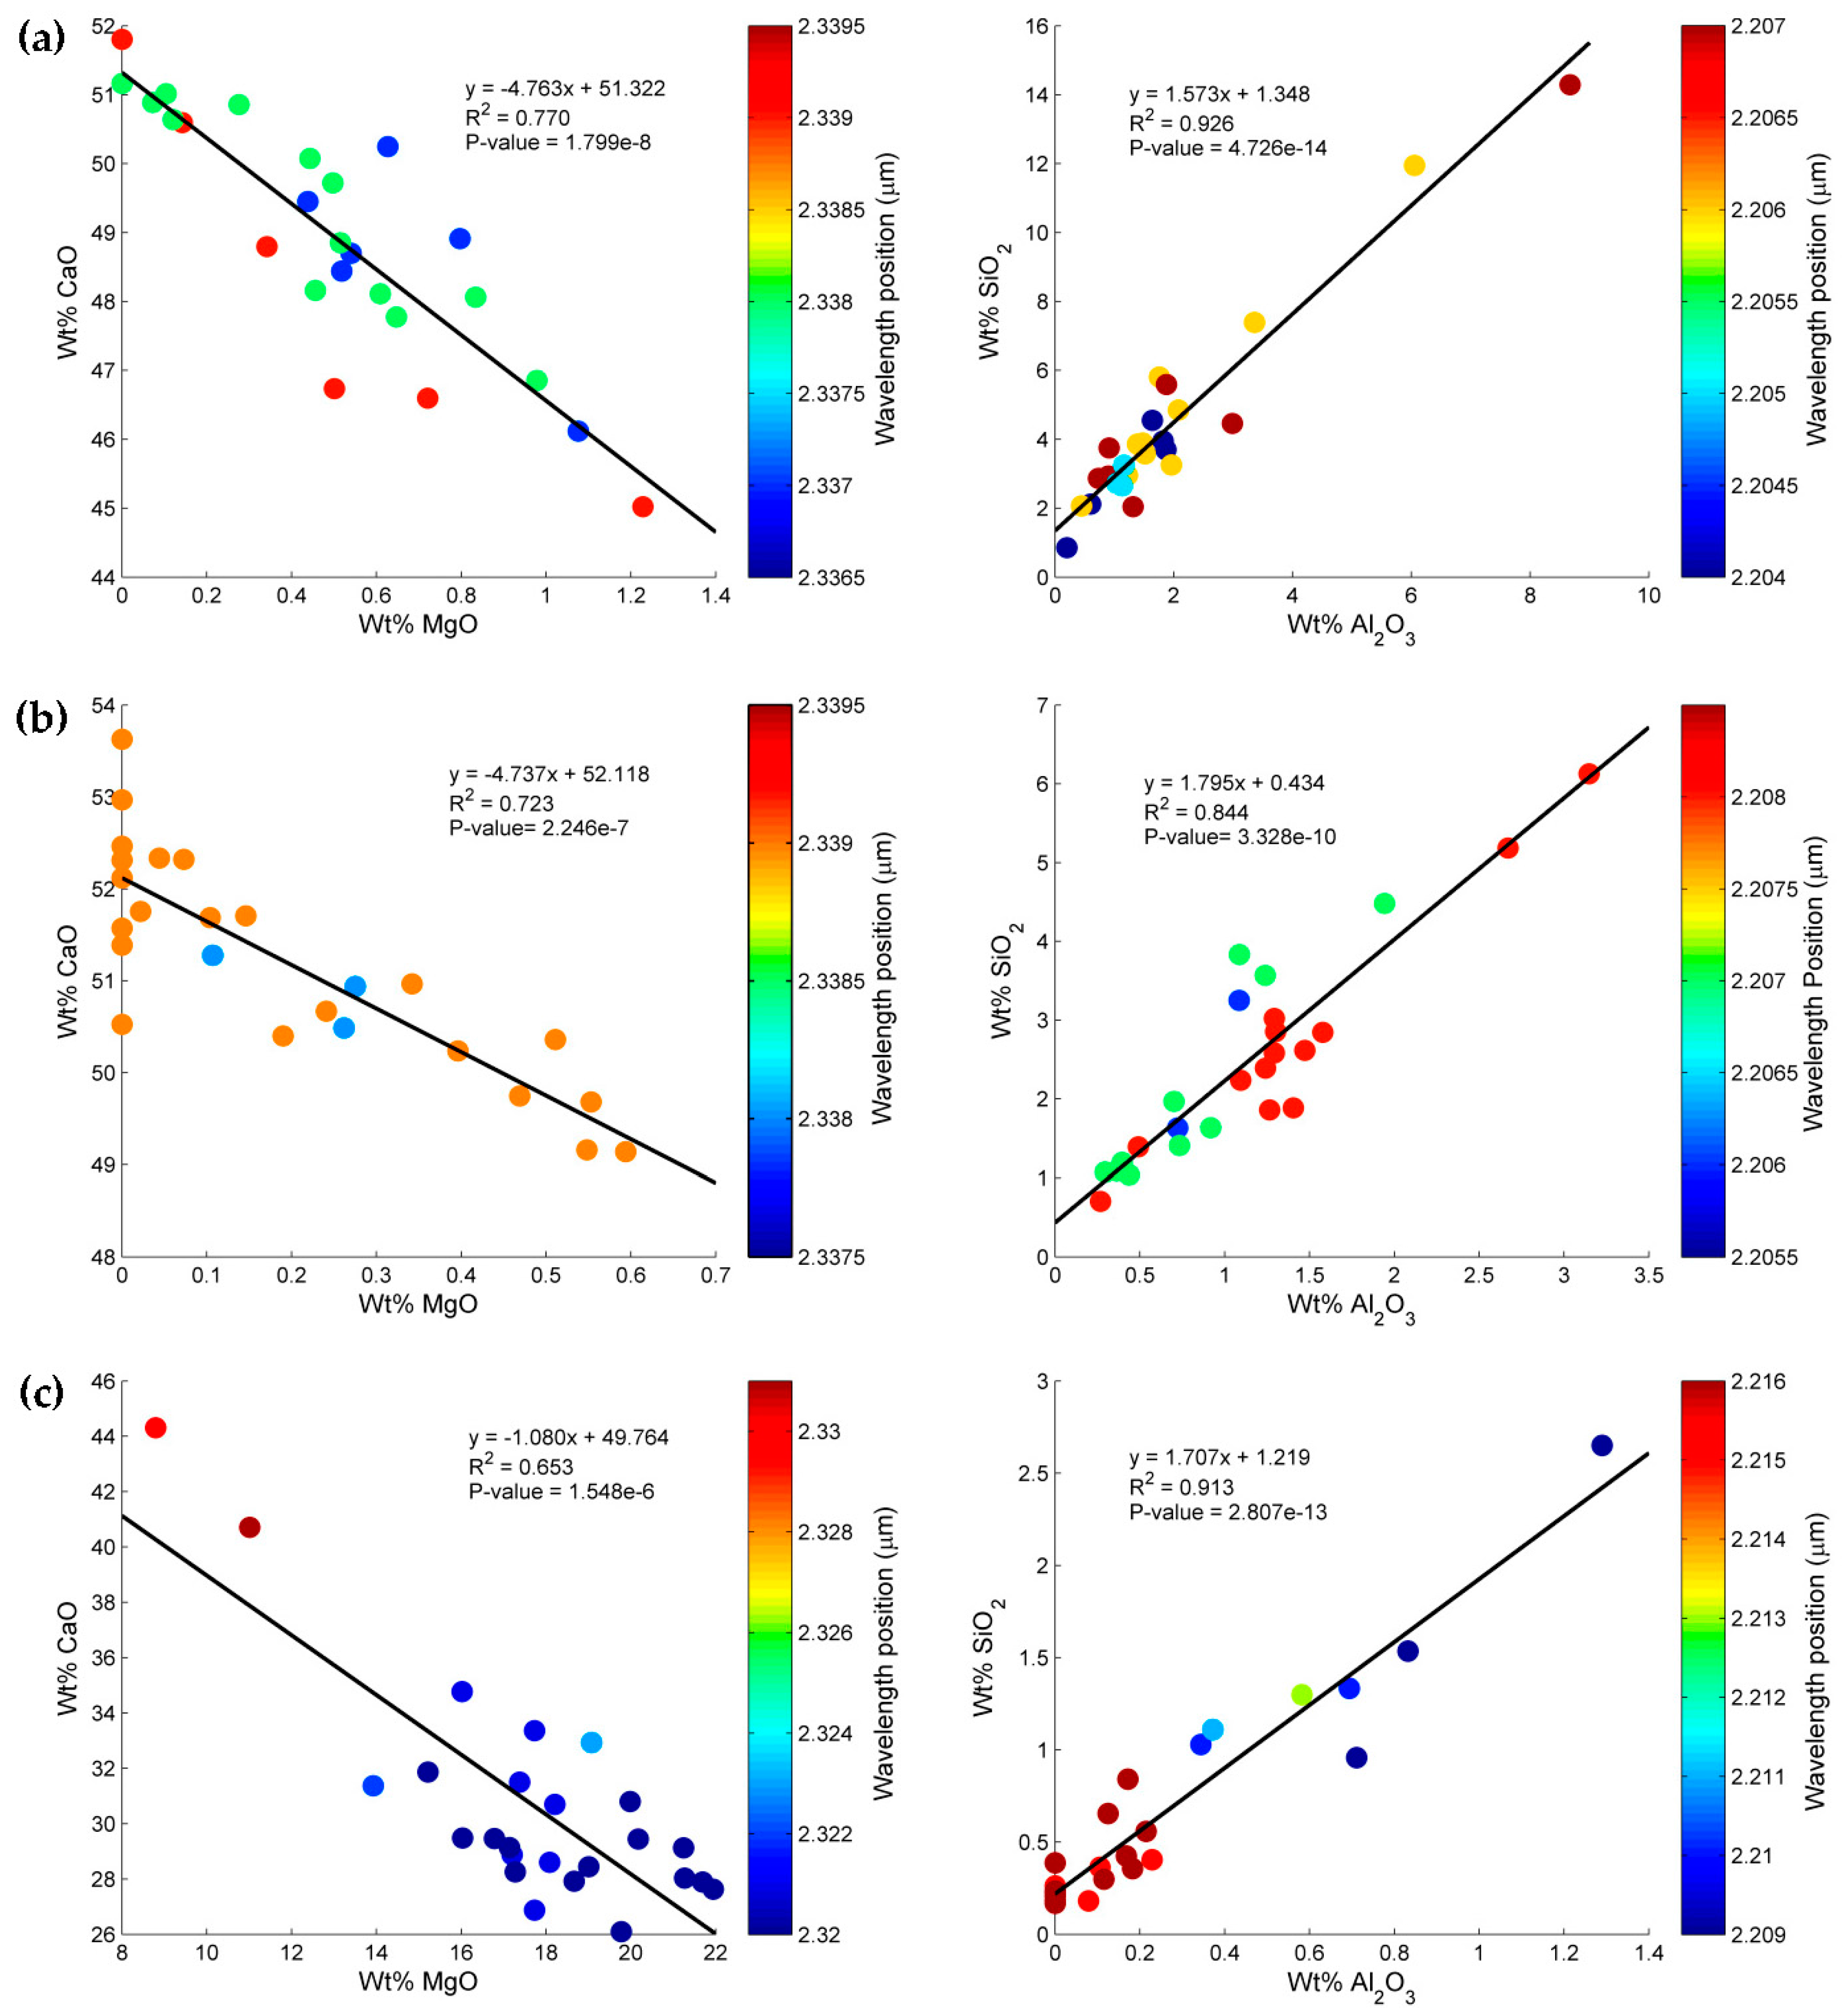
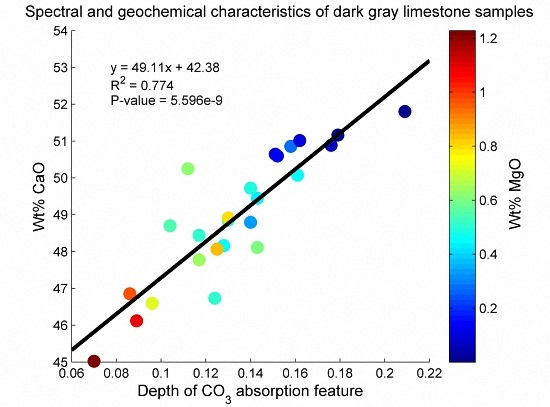
3.3. Estimation of Mineral Chemistry Abundance and Composition of the Rock Samples

The spectroscopy and geochemistry results indicate that the depths of carbonate (CO3) and Al-OH absorption features deepen with increasing relative abundances of carbonate (CaO) and phyllosilicate (Al2O3) mineral chemistries in the rock samples (Figure 6). The depths of CO3 and Al-OH absorption features and the wt % CaO and Al2O3 contents in the rock samples have a relatively good correlation, with R2 = 0.774 and 0.842 for the dark gray limestone samples (Figure 6a), R2 = 0.787 and 0.723 for the light gray limestone samples (Figure 6b), and R2 = 0.695 and 0.934 for the dolomitic limestone samples (Figure 6c), respectively. Figure 6 shows that the depths of CO3 and Al-OH absorption features vary between the limestone samples. Particularly for the depth of carbonate feature, the dark gray limestone samples tend to have lower band depth values than the light gray and dolomitic limestone samples. This is typical of opaque or organic materials, which can decrease the spectral reflectance value of the material [45,48,57]. However, the dark gray and light gray limestone samples contain more CaO and Al2O3 concentrations than the dolomitic limestone samples (Figure 6). The contents of wt % CaO in the samples are approximately 45%–52%, 49%–53%, and 26%–44% for the dark gray, light gray and dolomitic limestone samples, respectively.
The scatter plots shown in Figure 6 also indicate that SiO2 abundance is directly proportional to the Al2O3 content in the rock samples and vice versa for the relation between the MgO and CaO contents. As many clay minerals have Al octahedra and Si tetrahedra as their crystallographic framework [58], the correlation between Al2O3 and SiO2 indicates the presence of clay and other phyllosilicate minerals in the carbonate rocks. However, a number of spot measurements of light gray limestone samples and almost all dolomitic limestone samples do not have an Al-OH absorption feature or are spectrally featureless at ~2.20 µm (depth of Al-OH feature <0.005; Figure 6b,c). These results show that the light gray limestone (Figure 6b) and dolomitic limestone (Figure 6c) samples contain less than 1.2% and 0.7% of wt % Al2O3, respectively, as determined by the PXRF geochemical analyzer (Table 1). The very low amounts of Al2O3 in the dolomitic limestone point to very low percentages of clay and other phyllosilicate minerals in this particular rock, and these phyllosilicate mineral contents will therefore likely be below the detection limit of the infrared spectroscopy used.
Figure 7 shows the correlation between the CaO and MgO (left) and SiO2 and Al2O3 (right) contents in limestone samples, with the color-coded wavelength position of carbonate and Al-OH absorption features. These analyses reveal that the proportions of these mineral chemistries in carbonate and phyllosilicate minerals are linearly related. The wavelength positions of mineral chemistries vary slightly with their compositions (Figure 7). For the dark gray and light gray limestone samples, the position of carbonate feature is approximately in the wavelength range of 2.337–2.339 µm (Figure 7a,b). The wavelength position is typical of calcium carbonate or calcite [39,41,45,46,47,48,49], which is the dominant mineral in the rock samples. Nevertheless, the wavelength position of carbonate feature of the dolomitic limestone samples in the SWIR region is centered at 2.320–2.330 µm (Figure 7c), which is distinctive of dolomite [39,41,45,46,47,48,49], with a wt % MgO content of approximately 9%–22%. This indicates a larger dolomite or magnesium carbonate mineral content in the rock samples.
Moreover, the position of Al-OH absorption feature is approximately in the wavelength range of 2.205–2.208 µm for dark gray and light gray limestone samples (Figure 7a,b). The wavelength position suggests the presence of montmorillonite, illite or muscovite [41,42] in the rock samples. However, the wavelength position of Al-OH absorption feature of the dolomitic limestone samples is centered nearly at 2.210–2.216 µm (Figure 7c), which is suggestive of montmorillonite, illite or muscovite [41,42] of slightly different chemical composition. The longer wavelength position of the Al-OH feature indicates replacement of Al by Fe and Mg atoms in the crystal lattice of these minerals [59]. The majority of dolomitic samples contain relatively low concentrations (less than 0.4%) of Al2O3 (Figure 7c). As described above, some light gray and dolomitic limestone samples do not have an Al-OH absorption feature or are spectrally featureless at ~2.20 µm (Figure 6b,c). X-ray diffraction analysis of selected rock samples also confirms the presence of minor constituents of Al-containing minerals in the form of montmorillonite, illite, and muscovite in the dark gray and light gray limestone samples (Figure S1; see supplementary data).

4. Discussion

The PXRF geochemical analysis, SWIR reflectance spectra, and spectroscopic parameters of the limestone samples as shown in Table 1 and Figure 3, Figure 4, Figure 5, Figure 6 and Figure 7 indicate that the mineral abundance and chemical composition of the rock samples vary considerably. They depend on the type of limestone samples and the location of spot measurements on the rock surfaces. It seems that rough and porous surfaces within the area of spot measurements result in low elemental concentrations and reflectance intensity. The reason for this is probably that the incoming X-ray or electromagnetic radiation on the irregular surface will reflect diffusely, and only a few reflected radiations can reach the PXRF analyzer and spectroscopic sensors.
The results of this study (Table 1 and Figure 6 and Figure 7) reveal that the proportions of oxide compositions, such as CaO, MgO, Al2O3, and SiO2, of dark gray and light gray limestone samples collected from the Lhoknga limestone quarry of PT. Lafarge Cement Indonesia, Aceh Besar, Indonesia, are qualitatively suitable for Portland cement manufacturing. These limestone samples can be categorized as Portland cement-grade limestone. The chemical concentrations and compositions of the rock samples meet the standard quality requirements of cement raw material used for the manufacturing of Portland cement clinker [1,3,4]. However, the opposite is true for dolomitic limestone samples collected from the Bédarieux dolomite mine in the Hérault department of the Languedoc-Roussillon region, southern France. The proportions of the chemical compositions of the dolomitic limestone samples (Table 1 and Figure 6 and Figure 7), especially the wt % CaO and MgO concentrations, are present in quantities lower and higher than are allowed by the specifications of cement raw material for Portland cement making [1,3,4], respectively. A high amount of MgO (above 2%) in the cement clinker will generate the growth of periclase, which can restrict the reaction with water and consequently damage the hardened concrete [4].
These results (Table 1 and Figure 6 and Figure 7) also indicate that the light gray limestone sample is purer than its dark gray counterpart. Naturally, pure limestone is harder and has more massive structure than impure limestone. Its hardness influences the efficiency of the crushing and grinding process of the limestone sample to a fine powder to intimately mix with clay or shale before being transported to the kiln. The physical properties are another factor to be considered in determining the suitability of a limestone for Portland cement manufacturing. The clinkerization process (reactivity and burnability) of a raw meal may depend on its fineness [1,2,4]. The less pure limestones (dark gray limestone samples), which relate to CaO, MgO, Al2O3, and SiO2 contents, are more suitable for cement manufacturing in relation to the efficiency of the crushing and grinding process than the hard or pure limestones (light gray limestone samples).
The spectroscopic parameters, particularly the wavelength position and depth of absorption feature of carbonate and phyllosilicate minerals within the SWIR spectral ranges on fresh surfaces of limestone samples (Figure 6 and Figure 7), also exhibit changes in the abundance and composition of these mineral chemistries. Previous researchers stated that the wavelength positions of carbonate minerals in the SWIR reflectance spectra are affected by the Ca and Mg contents (calcite-dolomite mixtures) in the samples [38,45,47]. Post and Noble [59] observed that the wavelength position of clay absorption feature at ~2.20 µm depends on the relative content of Al in the sample. Haest et al. [36] and Magendran and Sanjeevi [37] studied the correlation between the depth of Al-OH absorption feature and the content of Al2O3 in iron ore samples. They found that the spectroscopic and geochemical characteristics of clay mineral chemistry are linearly related. Furthermore, carbonate spectral feature characteristics are influenced by particle size [45,46,47,48], texture [48], porosity [46] and mineral impurities [45,46,48]. Some scientists have attempted to analyze weathering effects on the infrared reflectance spectra of carbonate rocks [60,61]. They found that the reflectance values, shape and spectral absorption features of carbonate minerals are affected by the weathering processes of the rocks.
The practical implications of the study with regard to the quality control of cement raw materials or characterization of Portland cement-grade limestones are as follows. A comparison of the spectroscopy and geochemistry parameters (Figure 6) illustrates a relatively good correlation between the depths of carbonate and Al-OH absorption features and the abundance of carbonate (CaO) and phyllosilicate (Al2O3) mineral chemistries in the carbonate rock samples, respectively. The results show that the infrared spectroscopy within the SWIR wavelength range is an applicable technique for mineral chemistry analysis of Portland cement-grade limestones. Carbonate and clay mineral abundances in carbonate rock samples could be analyzed and estimated by applying these physical models (Figure 6) based on the spectroscopic parameter, especially the depth of absorption feature. This study confirms the results of previous studies [19,32,33,34,35] that used the infrared spectroscopy technique for characterizing the chemistry of cement products and hydration rate. These results also indicate that the SWIR spectroscopic approach can be used as a direct method for the characterization of other raw materials from a laboratory to real-time processes in the field or quarry. However, to implement this spectroscopic method on other limestones or rocks, some issues require further work. For instance, spectroscopic and geochemical characteristics should be derived from bulk measurements of the rock samples. It may provide a better interpretation of the method because the results of spot measurements on the rock surface are always at the mercy of the geological variation within a rock. Other spectral absorption feature parameters of carbonate and clay minerals should also be analyzed as alternative characteristics for identifying and estimating mineralogical variations and their compositions in rock.

5. Conclusions

Shortwave infrared (SWIR) spectroscopy in the 2.100–2.400 μm wavelength region is investigated in relation to the characterization of Portland cement-grade limestones to determine and estimate the chemical composition and mineral chemistry abundance on the carbonate rock surfaces. Spectral parameters, such as the wavelength position and depth of absorption feature derived from the SWIR continuum removed spectra fitted to the second-order polynomial curves, are helpful in analyzing and estimating carbonate (CO3) and Al-OH absorption features associated with CaO and Al2O3 contents and the compositions in the rock samples, respectively. The depths of these absorption features demonstrate a linear relationship with the contents of carbonate (CaO) and phyllosilicate (Al2O3) in the rock samples as determined by the portable X-ray fluorescence (PXRF) measurements. The wavelength positions of the CO3 and Al-OH absorption features vary with the chemical compositions of the samples. The results showed that dark gray and light gray limestone samples are more suitable for manufacturing Portland cement clinker (Portland cement-grade limestone) than dolomitic limestone samples in terms of CaO, MgO, Al2O3, and SiO2 concentrations and compositions. The approach illustrates that SWIR spectroscopy within the selected wavelength range is an applicable technique for the chemical quality control of cement raw materials, particularly for determining the carbonate and clay mineral chemistries in the carbonate rock samples.

Supplementary Materials

The following are available online at www.mdpi.com/2072-4292/8/11/950/s1, Figure S1: XRD pattern of clay and other phyllosilicate minerals of selected dark gray and light gray limestone samples, showing the presence of montmorillonite, illite and muscovite in the rock samples.

Acknowledgments

The authors acknowledge financial support from the Government of Aceh Province, Indonesia, for this PhD research. We want to express our gratitude to the managers and staff of PT. Lafarge Cement Indonesia, Aceh Besar for assisting in fieldwork and rock sample collection from the Lhoknga limestone quarry. The authors are also grateful to Steven de Jong and teams for providing dolomitic limestone samples from the Bedarieux dolomite mine, southern France.

Author Contributions

Nasrullah Zaini conceived, designed, and performed the experiments under the supervision of Freek van der Meer and Frank van Ruitenbeek; Frank van Ruitenbeek, Boudewijn de Smeth, and Fadli Amri analyzed the data; Caroline Lievens performed XRD analyses; and Nasrullah Zaini wrote the paper with assistance from Freek van der Meer.

Conflicts of Interest

The authors declare no conflicts of interest.

References

  1. Meade, R.K. Raw materials. In Portland Cement: Its Composition, Raw Materials, Manufacture, Testing and Analysis, 3rd ed.; The Chemical Publishing Company: Easton, PA, USA, 1926; pp. 51–74. [Google Scholar]
  2. Ghosh, S.P. Raw materials: Geological characteristics, nomenclature, origin, occurrences and exploration. In Advances in Cement Technology; Ghosh, S.N., Ed.; Pergamon Press Ltd.: Exeter, UK, 1983; pp. 1–38. [Google Scholar]
  3. Chatterjee, A.K. Chemico-Physico-Mineralogical characteristics of raw materials of Portland cement. In Advances in Cement Technology; Ghosh, S.N., Ed.; Pergamon Press Ltd.: Exeter, UK, 1983; pp. 39–68. [Google Scholar]
  4. Taylor, H.F.W. The chemistry of Portland cement manufacture. In Cement Chemistry, 2nd ed.; Telford: London, UK, 1997; pp. 55–88. [Google Scholar]
  5. Pettijohn, F.J. Limestones and dolomite. In Sedimentary Rocks, 3rd ed.; Harper & Row: New York, NY, USA, 1975; pp. 316–391. [Google Scholar]
  6. Blatt, H.; Middleton, G.; Murray, R. Origin of limestones. In Origin of Sedimentary Rocks; Prentice-Hall: Englewood Cliffs, NJ, USA, 1972; pp. 409–455. [Google Scholar]
  7. Gineys, N.; Aouad, G.; Damidot, D. Managing trace elements in Portland cement—Part I: Interactions between cement paste and heavy metals added during mixing as soluble salts. Cem. Concr. Compos. 2010, 32, 563–570. [Google Scholar] [CrossRef]
  8. Gineys, N.; Aouad, G.; Sorrentino, F.; Damidot, D. Incorporation of trace elements in Portland cement clinker: Thresholds limits for Cu, Ni, Sn or Zn. Cem. Concr. Res. 2011, 41, 1177–1184. [Google Scholar] [CrossRef]
  9. Ichikawa, M.; Kanaya, M. Effects of minor components and heating rates on the fine textures of alite in Portland cement clinker. Cem. Concr. Res. 1997, 27, 1123–1129. [Google Scholar] [CrossRef]
  10. Li, X.R.; Xu, W.L.; Wang, S.P.; Tang, M.L.; Shen, X.D. Effect of SO3 and MgO on Portland cement clinker: Formation of clinker phases and alite polymorphism. Constr. Build. Mater. 2014, 58, 182–192. [Google Scholar] [CrossRef]
  11. Galan, I.; Perron, L.; Glasser, F.P. Impact of chloride-rich environments on cement paste mineralogy. Cem. Concr. Res. 2015, 68, 174–183. [Google Scholar] [CrossRef]
  12. Horkoss, S.; Lteif, R.; Rizk, T. Influence of the clinker SO3 on the cement characteristics. Cem. Concr. Res. 2011, 41, 913–919. [Google Scholar] [CrossRef]
  13. Taylor, H.F.W. Distribution of sulfate between phases in Portland cement clinkers. Cem. Concr. Res. 1999, 29, 1173–1179. [Google Scholar] [CrossRef]
  14. Maki, I.; Fukuda, K.; Yoshida, H.; Kumaki, J. Effect of MgO and SO3 on the impurity concentration in alite in Portland-cement clinker. J. Am. Ceram. Soc. 1992, 75, 3163–3165. [Google Scholar] [CrossRef]
  15. Mazouzi, W.; Kacimi, L.; Cyr, M.; Clastres, P. Properties of low temperature belite cements made from aluminosilicate wastes by hydrothermal method. Cem. Concr. Compos. 2014, 53, 170–177. [Google Scholar] [CrossRef]
  16. Wu, K.; Shi, H.S.; De Schutter, G.; Guo, X.L.; Ye, G. Preparation of alinite cement from municipal solid waste incineration fly ash. Cem. Concr. Compos. 2012, 34, 322–327. [Google Scholar] [CrossRef]
  17. Fernandez, R.; Martirena, F.; Scrivener, K.L. The origin of the pozzolanic activity of calcined clay minerals: A comparison between kaolinite, illite and montmorillonite. Cem. Concr. Res. 2011, 41, 113–122. [Google Scholar] [CrossRef]
  18. Tosun, K.; Felekoglu, B.; Baradan, B.; Altun, I.A. Effects of limestone replacement ratio on the sulfate resistance of Portland limestone cement mortars exposed to extraordinary high sulfate concentrations. Constr. Build. Mater. 2009, 23, 2534–2544. [Google Scholar] [CrossRef]
  19. Pipilikaki, P.; Papageorgiou, D.; Teas, C.; Chaniotakis, E.; Katsioti, M. The effect of temperature on thaumasite formation. Cem. Concr. Compos. 2008, 30, 964–969. [Google Scholar] [CrossRef]
  20. De Weerdt, K.; Colombo, A.; Coppola, L.; Justnes, H.; Geiker, M.R. Impact of the associated cation on chloride binding of Portland cement paste. Cem. Concr. Res. 2015, 68, 196–202. [Google Scholar] [CrossRef]
  21. Irassar, E.F.; Bonavetti, V.L.; González, M. Microstructural study of sulfate attack on ordinary and limestone Portland cements at ambient temperature. Cem. Concr. Res. 2003, 33, 31–41. [Google Scholar] [CrossRef]
  22. Bertron, A.; Escadeillas, G.; de Parseval, P.; Duchesne, J. Processing of electron microprobe data from the analysis of altered cementitious materials. Cem. Concr. Res. 2009, 39, 929–935. [Google Scholar] [CrossRef]
  23. Kurokawa, D.; Honma, K.; Hirao, H.; Fukuda, K. Quality design of belite-melilite clinker. Cem. Concr. Res. 2013, 54, 126–132. [Google Scholar] [CrossRef]
  24. Ifka, T.; Palou, M.; Baracek, J.; Soukal, F.; Bohac, M. Evaluation of P2O5 distribution inside the main clinker minerals by the application of EPMA method. Cem. Concr. Res. 2014, 59, 147–154. [Google Scholar] [CrossRef]
  25. Taylor, H.F.W.; Newbury, D.E. An electron-microprobe study of a mature cement paste. Cem. Concr. Res. 1984, 14, 565–573. [Google Scholar] [CrossRef]
  26. Marjanovic, L.; McCrindle, R.I.; Botha, B.M.; Potgieter, J.H. Analysis of cement by inductively coupled plasma optical emission spectrometry using slurry nebulization. J. Anal. At. Spectrom. 2000, 15, 983–985. [Google Scholar] [CrossRef]
  27. Silva, C.S.; Blanco, T.; Nobrega, J.A. Analysis of cement slurries by inductively coupled plasma optical emission spectrometry with axial viewing. Spectrochim. Acta Part B 2002, 57, 29–33. [Google Scholar] [CrossRef]
  28. Potgieter, S.S.; Maljanovic, L. A further method for chloride analysis of cement and cementitious materials—ICP-OES. Cem. Concr. Res. 2007, 37, 1172–1175. [Google Scholar] [CrossRef]
  29. Frias, M.; Derojas, M.I.S.; Garcia, N.; Luxan, M.P. Contribution of toxic elements-hexavalent chromium in materials used in the manufacture of cement. Cem. Concr. Res. 1994, 24, 533–541. [Google Scholar] [CrossRef]
  30. Kruse, F.A.; Lefkoff, A.B.; Dietz, J.B. Expert system-based mineral mapping in Northern Death-Valley, California Nevada, using the airborne visible infrared imaging spectrometer (AVIRIS). Remote Sens. Environ. 1993, 44, 309–336. [Google Scholar] [CrossRef]
  31. Van der Meer, F.D. Analysis of spectral absorption features in hyperspectral imagery. Int. J. Appl. Earth Obs. 2004, 5, 55–68. [Google Scholar] [CrossRef]
  32. Perraki, T.; Kontori, E.; Tsivilis, S.; Kakali, G. The effect of zeolite on the properties and hydration of blended cements. Cem. Concr. Compos. 2010, 32, 128–133. [Google Scholar] [CrossRef]
  33. Kocak, Y.; Nas, S. The effect of using fly ash on the strength and hydration characteristics of blended cements. Constr. Build. Mater. 2014, 73, 25–32. [Google Scholar] [CrossRef]
  34. Ylmen, R.; Wadso, L.; Panas, I. Insights into early hydration of Portland limestone cement from infrared spectroscopy and isothermal calorimetry. Cem. Concr. Res. 2010, 40, 1541–1546. [Google Scholar] [CrossRef]
  35. Mollah, M.Y.A.; Yu, W.H.; Schennach, R.; Cocke, D.L. A Fourier transform infrared spectroscopic investigation of the early hydration of Portland cement and the influence of sodium lignosulfonate. Cem. Concr. Res. 2000, 30, 267–273. [Google Scholar] [CrossRef]
  36. Haest, M.; Cudahy, T.; Laukamp, C.; Gregory, S. Quantitative mineralogy from infrared spectroscopic data. I. Validation of mineral abundance and composition scripts at the Rocklea channel iron deposit in Western Australia. Econ. Geol. 2012, 107, 209–228. [Google Scholar] [CrossRef]
  37. Magendran, T.; Sanjeevi, S. Hyperion image analysis and linear spectral unmixing to evaluate the grades of iron ores in parts of Noamundi, Eastern India. Int. J. Appl. Earth Obs. 2014, 26, 413–426. [Google Scholar] [CrossRef]
  38. Zaini, N.; van der Meer, F.; van der Werff, H. Determination of carbonate rock chemistry using laboratory-based hyperspectral imagery. Remote Sens. 2014, 6, 4149–4172. [Google Scholar] [CrossRef]
  39. Hunt, G.R.; Salisbury, J.W. Visible and near infrared spectra of minerals and rocks: II. Carbonates. Mod. Geol. 1971, 2, 23–30. [Google Scholar]
  40. Hunt, G.R. Spectral signatures of particulate minerals in the visible and near infrared. Geophysics 1977, 42, 501–513. [Google Scholar] [CrossRef] [Green Version]
  41. Clark, R.N.; King, T.V.V.; Klejwa, M.; Swayze, G.A.; Vergo, N. High spectral resolution reflectance spectroscopy of minerals. J. Geophys. Res. 1990, 95, 12653–12680. [Google Scholar] [CrossRef]
  42. Hunt, G.R.; Salisbury, J.W. Visible and near-infrared spectra of minerals and rocks: I. Silicate minerals. Mod. Geol. 1970, 1, 283–300. [Google Scholar]
  43. Clark, R.N. Spectroscopy of rocks and minerals, and principles of spectroscopy. In Remote Sensing for the Earth Sciences: Manual of Remote Sensing, 3rd ed.; Rencz, A.N., Ed.; John Wiley and Sons: New York, NY, USA, 1999; Volume 3, pp. 3–58. [Google Scholar]
  44. Povarennykh, A.S. Use of infrared-spectra for determination of minerals. Am. Mineral. 1978, 63, 956–959. [Google Scholar]
  45. Van der Meer, F.D. Spectral reflectance of carbonate mineral mixtures and bidirectional reflectance theory: Quantitative analysis techniques for application in remote sensing. Remote Sens. Rev. 1995, 13, 67–94. [Google Scholar] [CrossRef]
  46. Gaffey, S.J. Spectral reflectance of carbonate minerals in the visible and near infrared (0.35–2.55 microns): Calcite, aragonite, and dolomite. Am. Mineral. 1986, 71, 151–162. [Google Scholar]
  47. Zaini, N.; van der Meer, F.; van der Werff, H. Effect of grain size and mineral mixing on carbonate absorption features in the SWIR and TIR wavelength regions. Remote Sens. 2012, 4, 987–1003. [Google Scholar] [CrossRef]
  48. Crowley, J.K. Visible and near-infrared spectra of carbonate rocks-reflectance variations related to petrographic texture and impurities. J. Geophys. Res. Solid 1986, 91, 5001–5012. [Google Scholar] [CrossRef]
  49. Kurz, T.H.; Dewit, J.; Buckley, S.J.; Thurmond, J.B.; Hunt, D.W.; Swennen, R. Hyperspectral image analysis of different carbonate lithologies (limestone, karst and hydrothermal dolomites):The Pozalagua quarry case study (Cantabria, North-West Spain). Sedimentology 2012, 59, 623–645. [Google Scholar] [CrossRef]
  50. Bennett, J.D.; Bridge, D.M.; Cameron, N.R.; Djunuddin, A.; Ghazali, S.A.; Jeffery, D.H.; Kartawa, W.; Keats, W.; Rock, N.M.S.; Thomson, S.J.; et al. Geologic Map of the Banda Aceh Quadrangle, Sumatra; Indonesia Geological Research and Development Centre: Bandung, Indonesia, 1981. [Google Scholar]
  51. Barber, A.J.; Crow, M.J. Pre-tertiary stratigraphy. In Sumatra: Geology, Resources and Tectonic Evolution; Barber, A.J., Crow, M.J., Milsom, J.S., Eds.; Geological Society: London, UK, 2005; pp. 24–53. [Google Scholar]
  52. Bogdanoff, S.; Donnot, M.; Ellenberger, F. Carte Geologique de la France à 1:50.000 et Notice Explicative, Feuille Bedarieux; Edition du BRGM: Orléans, France, 1984. [Google Scholar]
  53. Murphy, R.J.; Schneider, S.; Monteiro, S.T. Consistency of measurements of wavelength position from hyperspectral imagery: Use of the ferric iron crystal field absorption at 900 nm as an indicator of mineralogy. IEEE Trans. Geosci. Remote Sens. 2014, 52, 2843–2857. [Google Scholar] [CrossRef]
  54. Clark, R.N.; Roush, T.L. Reflectance spectroscopy-quantitative analysis techniques for remote sensing applications. J. Geophys. Res. 1984, 89, 6329–6340. [Google Scholar] [CrossRef]
  55. Bakker, W. HypPy User Manual: Graphical User-Interface (GUI); Version 2.6; ITC: Enschede, The Netherlands, 2012. [Google Scholar]
  56. Rodger, A.; Laukamp, C.; Haest, M.; Cudahy, T. A simple quadratic method of absorption feature wavelength estimation in continuum removed spectra. Remote Sens. Environ. 2012, 118, 273–283. [Google Scholar] [CrossRef]
  57. Salisbury, J.W.; Hapke, B.; Eastes, J.W. Usefulness of weak bands in mid infrared remote sensing of particulate planetary surface. J. Geophys. Res. 1987, 92, 702–710. [Google Scholar] [CrossRef]
  58. Brigatti, M.F.; Galan, E.; Theng, B.K.G. Structures and mineralogy of clay minerals. In Developments in Clay Science; Bergaya, F., Theng, B.K.G., Lagaly, G., Eds.; Elsevier: Amsterdam, The Netherlands, 2006; Volume 1, pp. 19–86. [Google Scholar]
  59. Post, J.L.; Noble, P.N. The near-infrared combination band frequencies of dioctahedral smectites, micas, and illites. Clays Clay Miner. 1993, 41, 639–644. [Google Scholar] [CrossRef]
  60. Younis, M.T.; Gilabert, M.A.; Melia, J.; Bastida, J. Weathering process effects on spectral reflectance of rocks in a semi-arid environment. Int. J. Remote Sens. 1997, 18, 3361–3377. [Google Scholar] [CrossRef]
  61. Yue, Y.; Zhang, B.; Wang, K.; Liu, B.; Li, R.; Jiao, Q.; Yang, Q.; Zhang, M. Spectral indices for estimating ecological indicators of karst rocky desertification. Int. J. Remote Sens. 2010, 31, 2115–2122. [Google Scholar] [CrossRef]
Figure 1. Carbonate rock samples: (a) dark gray; and (b) light gray limestone samples collected from the Lhoknga limestone quarry of PT. Lafarge Cement Indonesia, Aceh Besar, Indonesia; and (c) dolomitic limestone sample collected from the Bédarieux dolomite mine, Hérault department of the Languedoc-Roussillon region, southern France.
Remotesensing 08 00950 g001
Figure 2. Examples of hand specimens of carbonate rock samples collected from the mines: (a) dark gray limestones (samples B28 and B45); (b) light gray limestones (samples B1 and B41); and (c) dolomitic limestones (samples F18 and F20), with white circles pointing out the locations of portable X-ray fluorescence (PXRF) and Analytical Spectral Device (ASD) spot measurements on both fresh surfaces of the rock samples.
Remotesensing 08 00950 g002
Figure 3. Continuum removed spectra of dark gray limestone samples: (a) sample B28; and (b) sample B45 derived from five ASD spot measurements on the rock sample surfaces in the SWIR wavelength region. The spectral curves exhibit variations of depths of absorption features at ~2.20 µm and ~2.34 µm corresponding to changes in mineral contents on the rock surfaces.
Remotesensing 08 00950 g003
Figure 4. Continuum removed spectra of light gray limestone samples: (a) sample B1; and (b) sample B41 derived from five ASD spot measurements on the rock sample surfaces in the SWIR wavelength region, showing the variability in the depth of carbonate absorption feature at ~2.34 µm.
Remotesensing 08 00950 g004
Figure 5. Continuum removed spectra of dolomitic limestone samples: (a) sample F18; and (b) sample F20 derived from five ASD spot measurements on the rock sample surfaces in the SWIR wavelength region, showing the variability in the wavelength position and depth of carbonate absorption feature at ~2.32 µm.
Remotesensing 08 00950 g005
Figure 6. Correlation between spectral and geochemical characteristics derived from the same spot measurements of (a) dark gray limestone samples (samples B20, B28, B33, B45 and B49); (b) light gray limestone samples (samples B1, B26, B32, B36 and B41); and (c) dolomitic limestones samples (samples F17, F18, F20, F23 and F26). Physical models relating depths of carbonate features and wt % CaO PXRF results, color coded with the wt % MgO results (left) and the depths of Al-OH features and wt % Al2O3 PXRF results, color coded with the wt % SiO2 results (right).
Remotesensing 08 00950 g006
Figure 7. Geochemical charts of CaO vs. MgO (left) and SiO2 vs. Al2O3 (right) contents derived from PXRF spot measurements of (a) dark gray limestone samples (samples B20, B28, B33, B45 and B49); (b) light gray limestone samples (samples B1, B26, B32, B36 and B41); and (c) dolomitic limestones samples (samples F17, F18, F20, F23 and F26), color coded with the wavelength position of the carbonate and Al-OH absorption features.
Remotesensing 08 00950 g007
Table 1. Chemical composition of the selected limestone samples derived from five PXRF spot measurements on both fresh surfaces of each rock sample (wt %) (Samples B28, dark gray limestone; B41, light gray limestone; and F20, dolomitic limestone). The geochemical analysis illustrates a considerable variability in oxide concentrations and compositions of the carbonate rock samples that relate to the sample quality for Portland cement manufacturing.
PXRF Spots CodeCaOMgOAl2O3SiO2Fe2O3K2OSO3TiO2Sample Quality
B28-146.7360.5012.9844.4630.3450.3730.1970.148Good [3,4]
B28-245.0231.2288.67414.2890.4401.1660.2300.572
B28-351.80400.8972.9390.2760.2180.2200.113
B28-448.7980.3421.7595.8080.7850.4361.0260.322
B28-550.5950.1421.9603.2600.2220.3170.0950.127
B41-152.31300.2951.0740.0670.0700.1720.060Good [3,4]
B41-251.38800.3951.1960.0590.0450.2250.045
B41-350.9670.3421.2402.3900.0760.03900.053
B41-450.3600.5111.5782.8460.0600.06900.050
B41-550.52501.2651.8620.0690.05200.053
F20-127.63521.94100.169000.1720Bad [3,4]
F20-229.13221.2390.0790.1820.03400.1920
F20-328.60618.0860.7110.9580.1070.0230.1620.020
F20-426.87717.7280.8321.5350.11300.1570.022
F20-529.44220.17400.237000.1400

