Article

Vegetation Responses to Climate Variability in the Northern Arid to Sub-Humid Zones of Sub-Saharan Africa

1
Department of Geographical Sciences, University of Maryland, College Park, MD 20782, USA
2
Department of Geography, University of California-Los Angeles, Los Angeles, CA 90095, USA
*
Author to whom correspondence should be addressed.
Remote Sens. 2016, 8(11), 910; https://doi.org/10.3390/rs8110910
Submission received: 3 June 2016 / Revised: 12 October 2016 / Accepted: 18 October 2016 / Published: 2 November 2016
(This article belongs to the Special Issue Remote Sensing of Land Degradation and Drivers of Change)

Abstract

:
In water limited environments precipitation is often considered the key factor influencing vegetation growth and rates of development. However; other climate variables including temperature; humidity; the frequency and intensity of precipitation events are also known to affect productivity; either directly by changing photosynthesis and transpiration rates or indirectly by influencing water availability and plant physiology. The aim here is to quantify the spatiotemporal patterns of vegetation responses to precipitation and to additional; relevant; meteorological variables. First; an empirical; statistical analysis of the relationship between precipitation and the additional meteorological variables and a proxy of vegetation productivity (the Normalized Difference Vegetation Index; NDVI) is reported and; second; a process-oriented modeling approach to explore the hydrologic and biophysical mechanisms to which the significant empirical relationships might be attributed. The analysis was conducted in Sub-Saharan Africa; between 5 and 18°N; for a 25-year period 1982–2006; and used a new quasi-daily Advanced Very High Resolution Radiometer (AVHRR) dataset. The results suggest that vegetation; particularly in the wetter areas; does not always respond directly and proportionately to precipitation variation; either because of the non-linearity of soil moisture recharge in response to increases in precipitation; or because variations in temperature and humidity attenuate the vegetation responses to changes in water availability. We also find that productivity; independent of changes in total precipitation; is responsive to intra-annual precipitation variation. A significant consequence is that the degree of correlation of all the meteorological variables with productivity varies geographically; so no one formulation is adequate for the entire region. Put together; these results demonstrate that vegetation responses to meteorological variation are more complex than an equilibrium relationship between precipitation and productivity. In addition to their intrinsic interest; the findings have important implications for detection of anthropogenic dryland degradation (desertification); for which the effects of natural fluctuations in meteorological variables must be controlled in order to reveal non-meteorological; including anthropogenic; degradation.

Graphical Abstract

1. Introduction

The effect of climate variation on vegetation productivity has been studied in many drylands [1,2,3] and elsewhere [4,5,6]. More recently, interest has intensified as global circulation models project an increase in inter-annual precipitation variation, higher temperatures, and an intensified precipitation regime (through larger individual precipitation events) with longer intervening dry periods than at present [7,8]. During the last few decades, two sequences of extremely dry years, in 1972–1973 and again in 1983–1984, struck the Sahel-part of a longer drought that lasted from the end of the 1960s to the mid-1990s [9,10]. This unusual dry spell was not limited to the Sahelian eco-climatic zone but extended to regions more to the south as well [10]. The total number of rainfall events during the drought also decreased thus increasing the probability of dry spells during the rainy season [10]. Since 1994, annual rainfall totals recovered and varied around the mean of the standard 30-year climatological period of 1931–1960 [9,11]. These fluctuations in rainfall at intra-annual, interannual and decadal time scales make the Sahelian region of Africa the most dramatic example of climate variation that has been directly measured [12]. The Sahel therefore provides a valuable natural experiment on the effects of climatic variations on vegetation production.
The term “Sahel” is often applied to the region extending across Africa from east to west approximately between the latitudes of 10°N and 18°N. The region includes the Sahelian, Sudano-Sahelian, Sudanian and parts of the Guinean eco-climatic zones [13] and is characterized by a steep north-south gradient in mean annual rainfall [14]. Vegetation cover in the northern Sahel consists of shrubs interspersed with annual and perennial grasses, and the southern part with perennial grasslands and deciduous, open savanna woodlands, with woody cover only locally exceeding 5%. The central part of the Sahel generally has only annual grasses. The Sudanian zone is dominated by deciduous shrublands with sparse trees, and further south by deciduous woodlands with grass understory, and the Guinean zone by semi-deciduous closed woodlands and evergreen forests [13,14].
Most of the Sahelian rainfall occurs during the northern hemisphere summer and is linked to periodic northwards excursions of the West African monsoon [15,16,17]. The onset of the monsoon proceeds slowly and is characterized by a succession of active and inactive phases [15,16]. The initial wet spell in the northern Sahel does not usually produce a large volume. It is only when the monsoon rainfall maximum abruptly shifts from 5°N to 10°N that significant rain is rapidly observed over the Sahelian ecoclimatic zone [15]. The mean onset date of the wet season in the Sahelian zone is the 24th of June with a standard deviation of 8 to 10 days [18,19,20] but most rains fall between mid-July and September [15]. On average, the length of the wet season increases from about 50 days in northern Sahel at 18°N to roughly 8 months in the coastal Guinean zone at 10°N [21]. Compared to the onset phase, the withdrawal phase is abrupt and rather uniformly distributed throughout the entire monsoon region [17]. The vegetation cycle closely responds to the seasonality in rainfall, with virtually all biomass production taking place in the wet summer months [21,22].
Vegetation production in drylands is often assumed to be closely related to inter-annual rainfall variability [22,23]. Moderate to strong linear relationships between rainfall and vegetation production have been noted in the drier parts (<800 mm) of South Africa and the Sahel [24,25]. Nevertheless, precipitation is not the only factor that controls production and poor relations have been reported in some parts of the Sahel [3,4,11,26,27,28] and elsewhere [1,29,30].
Several factors may influence the rainfall-production relationship. For example, positive feedbacks between vegetation production and antecedent rainfall at monthly and interannual timescales have been found [1,25,31]. These feedbacks are sometimes likened to a “memory” in land surface processes [4,32,33] and can arise from purely physical reasons, such as soil moisture carried over from antecedent rainfall [1,4] or can result from inter-annual carryover of soil nutrients and seed banks [34,35,36]. Such relations, however, are complex and feedbacks are not found in all climatic vegetation types [1,37]. Rainfall occurring during the growing season is better related to vegetation production [30,38]. On one hand, a large portion of Sahelian precipitation falling at the beginning of the wet season may be lost to evaporation before it can be used for photosynthesis [39] and, while early season precipitation event(s) may trigger germination of annual plants, seedling development and culm elongation are aborted unless subsequent rain events allow seedlings to survive and grow [3,40,41,42]. On the other hand, precipitation falling after fructification is not used for production by most annuals [3] and, while leaves of trees and some shrubs developed early in the growing season can be retained until late in the season, they typically have lower photosynthetic capacity than younger leaves [43].
The frequency and intensity of precipitation events can also influence vegetation production [27,29,30,38,44,45,46,47,48,49,50,51,52,53] by altering soil moisture levels [15,38,54] and nutrient availability [55]. A number of field experiments in North American grasslands and shrublands have demonstrated the sensitivity of vegetation production to an intensified precipitation regime [29,48,49,50,51,53]. For the same amount of total rainfall, vegetation production in dry biomes has been found to respond positively to more intense and less frequent precipitation events, whereas in the wetter biomes vegetation production has been found to decrease in response to an intensified precipitation regime [29,50,51]. Modeling studies suggest that this asymmetrical response to precipitation regimes is mainly due to differences between biomes in the proportional losses of precipitation to evaporation and runoff [30,38].
In addition to the timing, frequency and intensity of precipitation events, air humidity and temperature can also affect vegetation production either directly by influencing stomatal conductance and photosynthetic reaction rates [27,56,57,58] or indirectly by altering soil evaporative demands [58,59]. Eddy-covariance measurements across a range of vegetation types and climate zones in Africa found strong relationships between net photosynthetic accumulation by C3-plants and vapor pressure deficit but these were poor to non-existent at the C4-plant dominated sites [60]. These and land surface modeling studies that have investigated the relative influence of climatic factors on vegetation production have indicated that, in addition to precipitation, air humidity [27] and temperature [61] may play important, yet secondary roles in limiting vegetation production in drylands.
While several remote sensing studies have investigated the nature of the relation between NDVI (used as a proxy of vegetation productivity) and rainfall in the Sahel (e.g., [2,22,25,46,62,63,64]), only few have expanded beyond that to include other meteorological variables that might influence vegetation growth and rates of development (e.g., [6,61]).
The purpose of this study was twofold; (I) to characterize empirically the nature of the relationship between remotely sensed estimates of vegetation production and climate variability and (II) to explore, using a land surface model, the underlying hydraulic and biophysical processes to which these relationships can be attributed. Bias-corrected-hybrid meteorological datasets constructed by combining a suite of global observation-based datasets with numerical weather prediction and assimilation models are becoming available at higher temporal and spatial resolutions [65]. These, along with recent developments in Advanced Very High Resolution Radiometer (AVHRR) data processing [65], provided the opportunity to expand on previous studies of vegetation responses to climate variation.
While the empirically-derived relationships may reveal the direction and magnitude of vegetation responses to climate variation, they offer little understanding of the underlying biophysical processes to which these relations can be attributed. To address this problem, a land surface model was used to gain deeper insight into these processes. The model selected was the Simplified Simple Biosphere (SSiB2 ver.2) [66]. SSiB2 is a process-oriented model that simulates explicitly the interactions between climate, soil, and plants. In SSiB2, the rates of carbon sequestration change with temperature, the proportion of incident photosynthetically active radiation absorbed by green vegetation (fPAR), and intercellular CO2 concentration. The Farquhar and Collatz [27,56,57,58] formulations are used to model CO2 uptake within the leaf. CO2 uptake at the canopy scale is regulated by stomatal conductance which, in turn, is limited by stress multipliers of air-to-leaf vapor pressure deficit and soil moisture [66]. The focus of the modeling approach was to investigate, in different climates and for different vegetation types, the sensitivity of soil moisture, leaf temperature, and stomatal conductance to changes in precipitation, temperature, and humidity and whether climate-induced changes in soil moisture, stomatal conductance and leaf temperature, if any, influence vegetation production.

2. Materials and Methods

2.1. Remote Sensing Data

Version 2 of the Long-term Data Record (LTDR) daily time series of the National Oceanic and Atmospheric Administration (NOAA) AVHRR Global Area Coverage (GAC) reflectance data [66] for the years 1982 to 2006 were used in this study (http://ltdr.nascom.nasa.gov). The LTDR data processing stream creates a daily reflectance product using a geographic projection at a spatial resolution of 0.05°. The sequence of data included observations from AVHRR sensors onboard NOAA satellites 7, 9, 11 and 14. LTDR data processing includes a vicarious sensor calibration of the red (0.58–0.68 µm) and near infrared (NIR, 0.725–1.10 µm) channels using cloud/ocean techniques to minimize variations caused by changes in sensors and sensor drift [67,68].LTDR processing also includes an improved atmospheric correction scheme to reduce the effects of Rayleigh scattering, ozone, and water vapor but does not include corrections for the effects of aerosols [66]. It should be noted that the known random errors in the LTDR data do not affect the conclusions of the present study [69,70,71].
For the present study, prior to the calculation of NDVI values, the LTDR reflectances in the red and NIR were normalized to a standard sun-target-sensor geometry and cloud-contaminated observations were replaced with reconstructed values interpolated from preceding and succeeding clear-sky observations. Daily NDVI values were subsequently calculated (NDVI = (NIR − red)/(NIR + red)).
BRDF and atmospheric corrections reduce noise in surface NDVI data [70] that would otherwise result from the strong bidirectional properties of vegetation [72,73,74] and the considerable absorption in the AVHRR NIR channel by atmospheric water vapor [75]. The resulting daily data were intended to enable more precise identification of vegetation dynamics [76] than compositing (generally over 10 days or monthly), particularly in the drier areas with short growing season. Full details of the data preparation are given in [71].

2.2. Meteorological and Land Cover Data

The Princeton Hydrology Group 1.0° dataset, constructed from NCEP (National Center for Environmental Prediction)-NCAR (National Center for Atmospheric Research) reanalysis data corrected for biases using station observations [65] were used in this study. Precipitation, surface air temperature, specific humidity (ratio of mass of water vapor to the mass of dry air in which it is mixed—dimensionless—used here to remove the temperature effect on humidity), atmospheric pressure and incident solar radiation were used. Daily data for the period 1982–2006 were downscaled from 1° to the 0.05° resolution of the AVHRR dataset using bilinear interpolation.
Land cover was obtained from [77].

2.3. Estimating Phenological Transition Dates and the Length of the Growing Season

The rates of change of daily NDVI data were used to define key phenological transition dates of the growing season [78]. These were the “onset of greenness increase”, the “onset of maturity”, the “onset of greenness decrease”, and the “onset of dormancy”, hereafter referred to as green-up, maturity, senescence and dormancy, respectively. Green-up is the date when NDVI begins to increase rapidly indicating the onset of leaf development. Maturity is the date when the rate of increase in NDVI slows and NDVI approaches its maximum, indicating peak green leaf area. Senescence is the date when NDVI begins to decrease rapidly indicating leaf death. Dormancy is the date when NDVI approaches its minimum, annual value owing to death of annuals and suspension of growth and dormancy in perennials.
To estimate the phenological transition dates, piecewise sigmoid functions (Equation (1) were fitted to periods of sustained NDVI increase (i.e., growth) and decrease (i.e., senescence). The rates of change in the curvature of the fitted sigmoid functions (i.e., the second derivative) were then calculated. During the period of sustained NDVI increase, the local maxima of the second derivative were used for the dates of green-up and maturity, and the local minima of the second derivative during the period of sustained NDVI decrease were used for senescence and dormancy [78]. The phenological transition dates were compared with MODIS Land Cover Dynamics Science Dataset Collection 4 [79] during the overlapping period (2002–2006).
y t = c 1 + e a + b t + d
where t is time in days, yt is the NDVI value at time t, a and b are fitting parameters, c is the maximum increment in NDVI over d, the initial minimum NDVI value.
The onset of leaf development and leaf senescence were then used to define the timing and duration of the growing season. Annual and growing season sums of daily NDVI, precipitation, temperature, and humidity were calculated for each year (1982–2006).

2.4. Relationship of Annual ΣNDVI with Annual Total Precipitation

The relationships of annual and growing season sums of precipitation and ΣNDVI were characterized using linear regression for the averages of every three by three pixels. The coefficients of determination (r2) were mapped to show the geographical patterns of the ΣNDVI-total precipitation relationships for the entire year and for the growing season alone.

2.5. Relationship of Growing Season ΣNDVI with Intraseasonal Precipitation Distribution

A series of small precipitation events may have a different effect on vegetation production than an equivalent amount of rainfall occurring in a few intense events [30,31]. To describe the temporal characteristics of precipitation, two higher order moments of intraseasonal precipitation distribution were calculated from daily precipitation data. These were the growing season precipitation variance and its skewness. Summary statistics were used since it is impractical to specify explicitly the enormous number of seasonal patterns of rainfall frequency and amount that can occur for more than a few pixels. High precipitation distribution variance indicates higher than normal deviation from mean seasonal precipitation and can result from extended periods of drought or from intense precipitation events or a combination of both, while the skewness is a measure of the dominant frequency of either high intensity precipitation events (negative skewness) or low intensity precipitation events (positive skewness).
The relation of growing season ΣNDVI to seasonal precipitation totals, precipitation variance and skewness were characterized using multivariate linear regression analysis. To reduce the effects of multicollinearity between input variables and consequent overfitting [80], a subset of independent variables that ‘best’ explained ΣNDVI variation were selected for each 3 × 3 pixels. [81], to search for the variable subsets with the highest r2 value adjusted for degrees of freedom (adjusted r2). The variables of the regression model with the highest adjusted r2 were tested for multicollinearity and the model regression coefficients were tested to determine whether they were significantly different from zero. To test for multicollinearity, the variance inflation factors (VIFs) of the model independent variables were evaluated relative to the r2 value of the model [80]. Multicollinearity was considered strong enough to affect the model coefficient estimates whenever any of the VIFs was larger than 1/(1 − r2) [82]. A t-test was used to test the null hypothesis that the model regression coefficients Bk1…n were equal to zero. If there was insufficient evidence to reject the null hypothesis (H0k1…n: Bk1…n = 0, p > 0.05) or if multicollinearity was strong enough to affect model estimates then the regression model with the second to highest adjusted r2 was subjected to the same tests. The procedure was repeated until the test conditions were met.

2.6. Relationship of Growing Season ΣNDVI with Temperature and Humidity

The relationships of growing season ΣNDVI and seasonal precipitation totals, specific humidity and air temperature were characterized by regression analysis using the same computational approach described in the previous section. Furthermore, the three meteorological variables and the ΣNDVI data were standardized to zero mean and a standard deviation of one. The standardized regression coefficients were then estimated to measure the relative contribution of each meteorological variable to the observed ΣNDVI variation. The standardized regression coefficients were summarized by the landcover types in the study area [83] in order to characterize the relative contribution of each of the meteorological variables to the observed NDVI variation in grasslands, shrublands, and savannas.

2.7. Soil-Vegetation-Atmosphere Transfer Modeling

The Simplified Simple Biosphere (SSiB2 ver.2) land surface model [59,84] was used in its “offline” mode (no neighbor-effects) to represent ecosystem physiology as driven by prescribed meteorology and vegetation phenology Parameterization and validation studies and land surface model inter-comparison experiments (e.g., [85]) have demonstrated that SSiB2 can reasonably reproduce measured energy and water fluxes at diurnal, seasonal, and multi-annual scales across diverse climates and vegetation functional types.
SSiB2 was used to explore the underlying hydrological and physiological processes to which the empirical relationships, revealed in the statistical analysis of co-variation between meteorology and vegetation productivity, can be attributed. The model was run for the period 1999–2007 with a 3-hourly time step for a number of sites representative of different vegetation types and climatologies throughout the Sahel (Table 1 and Figure 1). Model inputs for the base run were Princeton Hydrology Group meteorology, LAI and fraction vegetation cover [86].
To investigate the sensitivity of vegetation to precipitation variation during the early stages of phenological development (i.e., greenup to maturity), SSIB2 was run eight times with the precipitation data modified for the corresponding period ( ±0.5, ±1, ±1.75 and ±2.5 standard deviations from the values used in the base run; changed values that exceeded the range of long term (1982–2007) natural meteorological variation were reset to the minimum and maximum of observed meteorological variation, as appropriate) while keeping the remaining meteorological variables unchanged. The sensitivity experiments were repeated for the maturity stage (i.e., from maturity to senescence). The same approach was used to investigate the sensitivity of vegetation to changes in humidity and temperature. The resulting changes in soil moisture (to 1 m depth) and stomatal conductance and their relation to canopy scale net photosynthesis were summarized at a daily time step and averaged over each of the two stages of phenological development.

3. Results

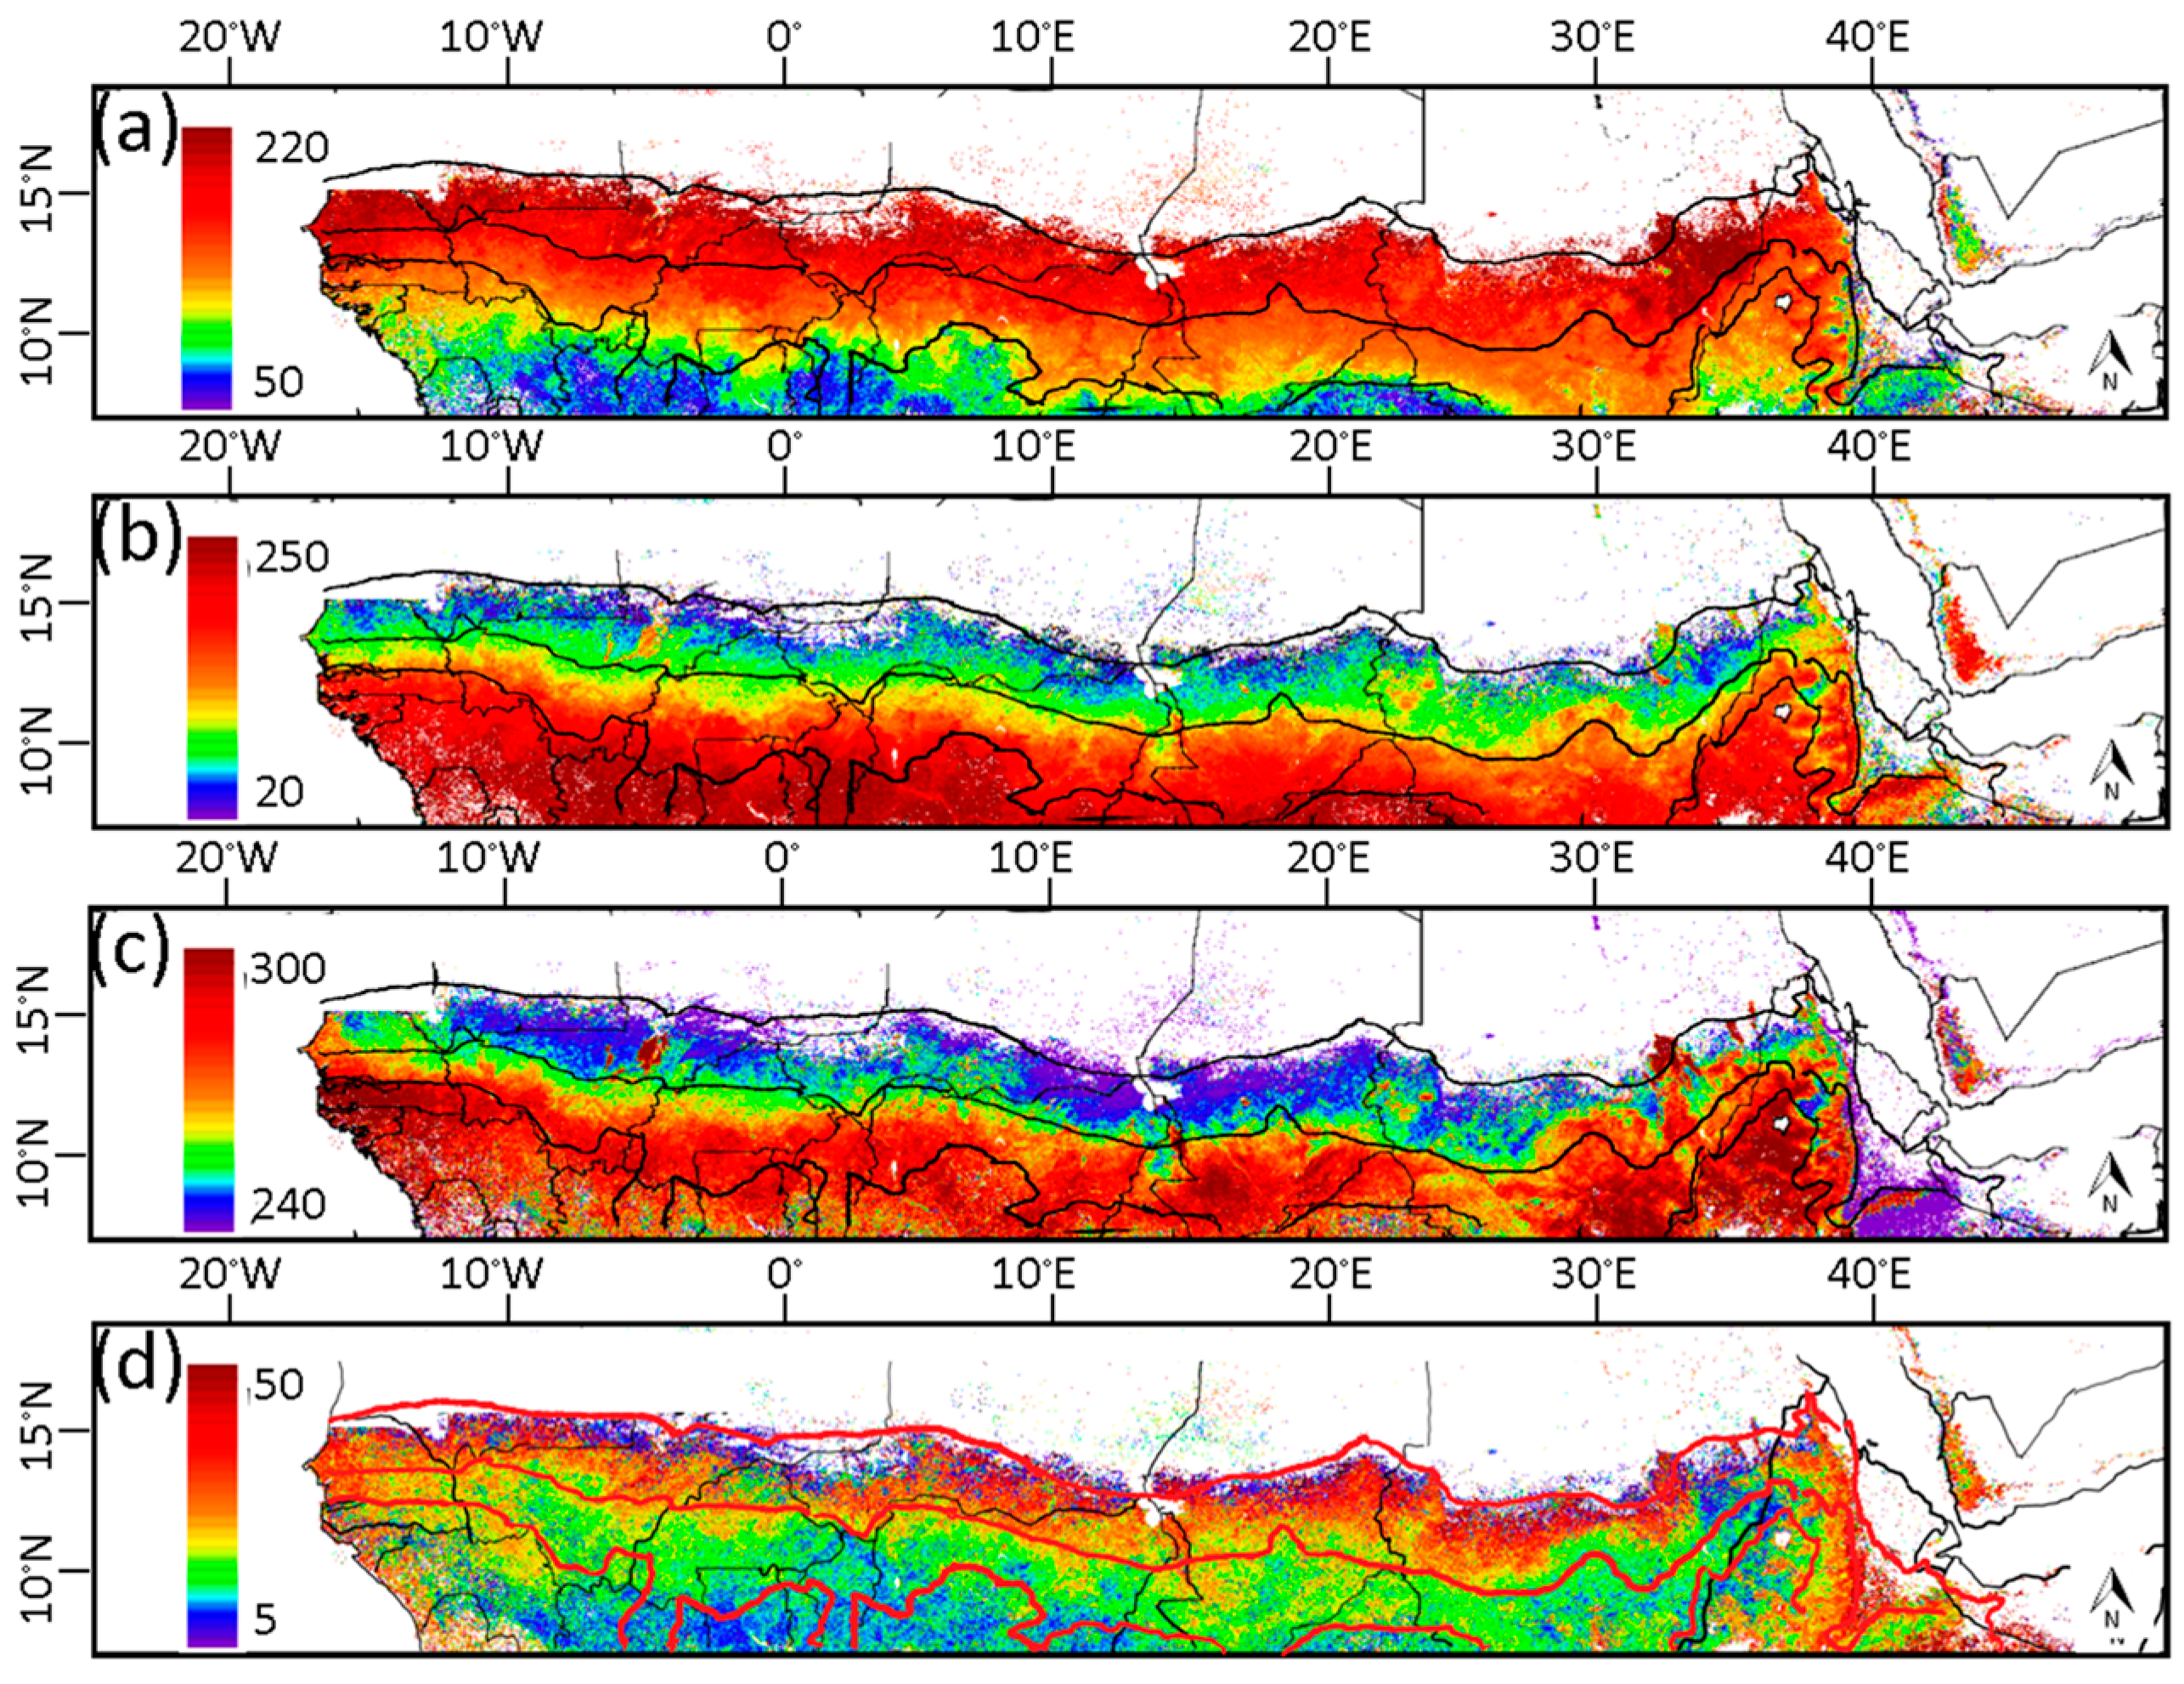
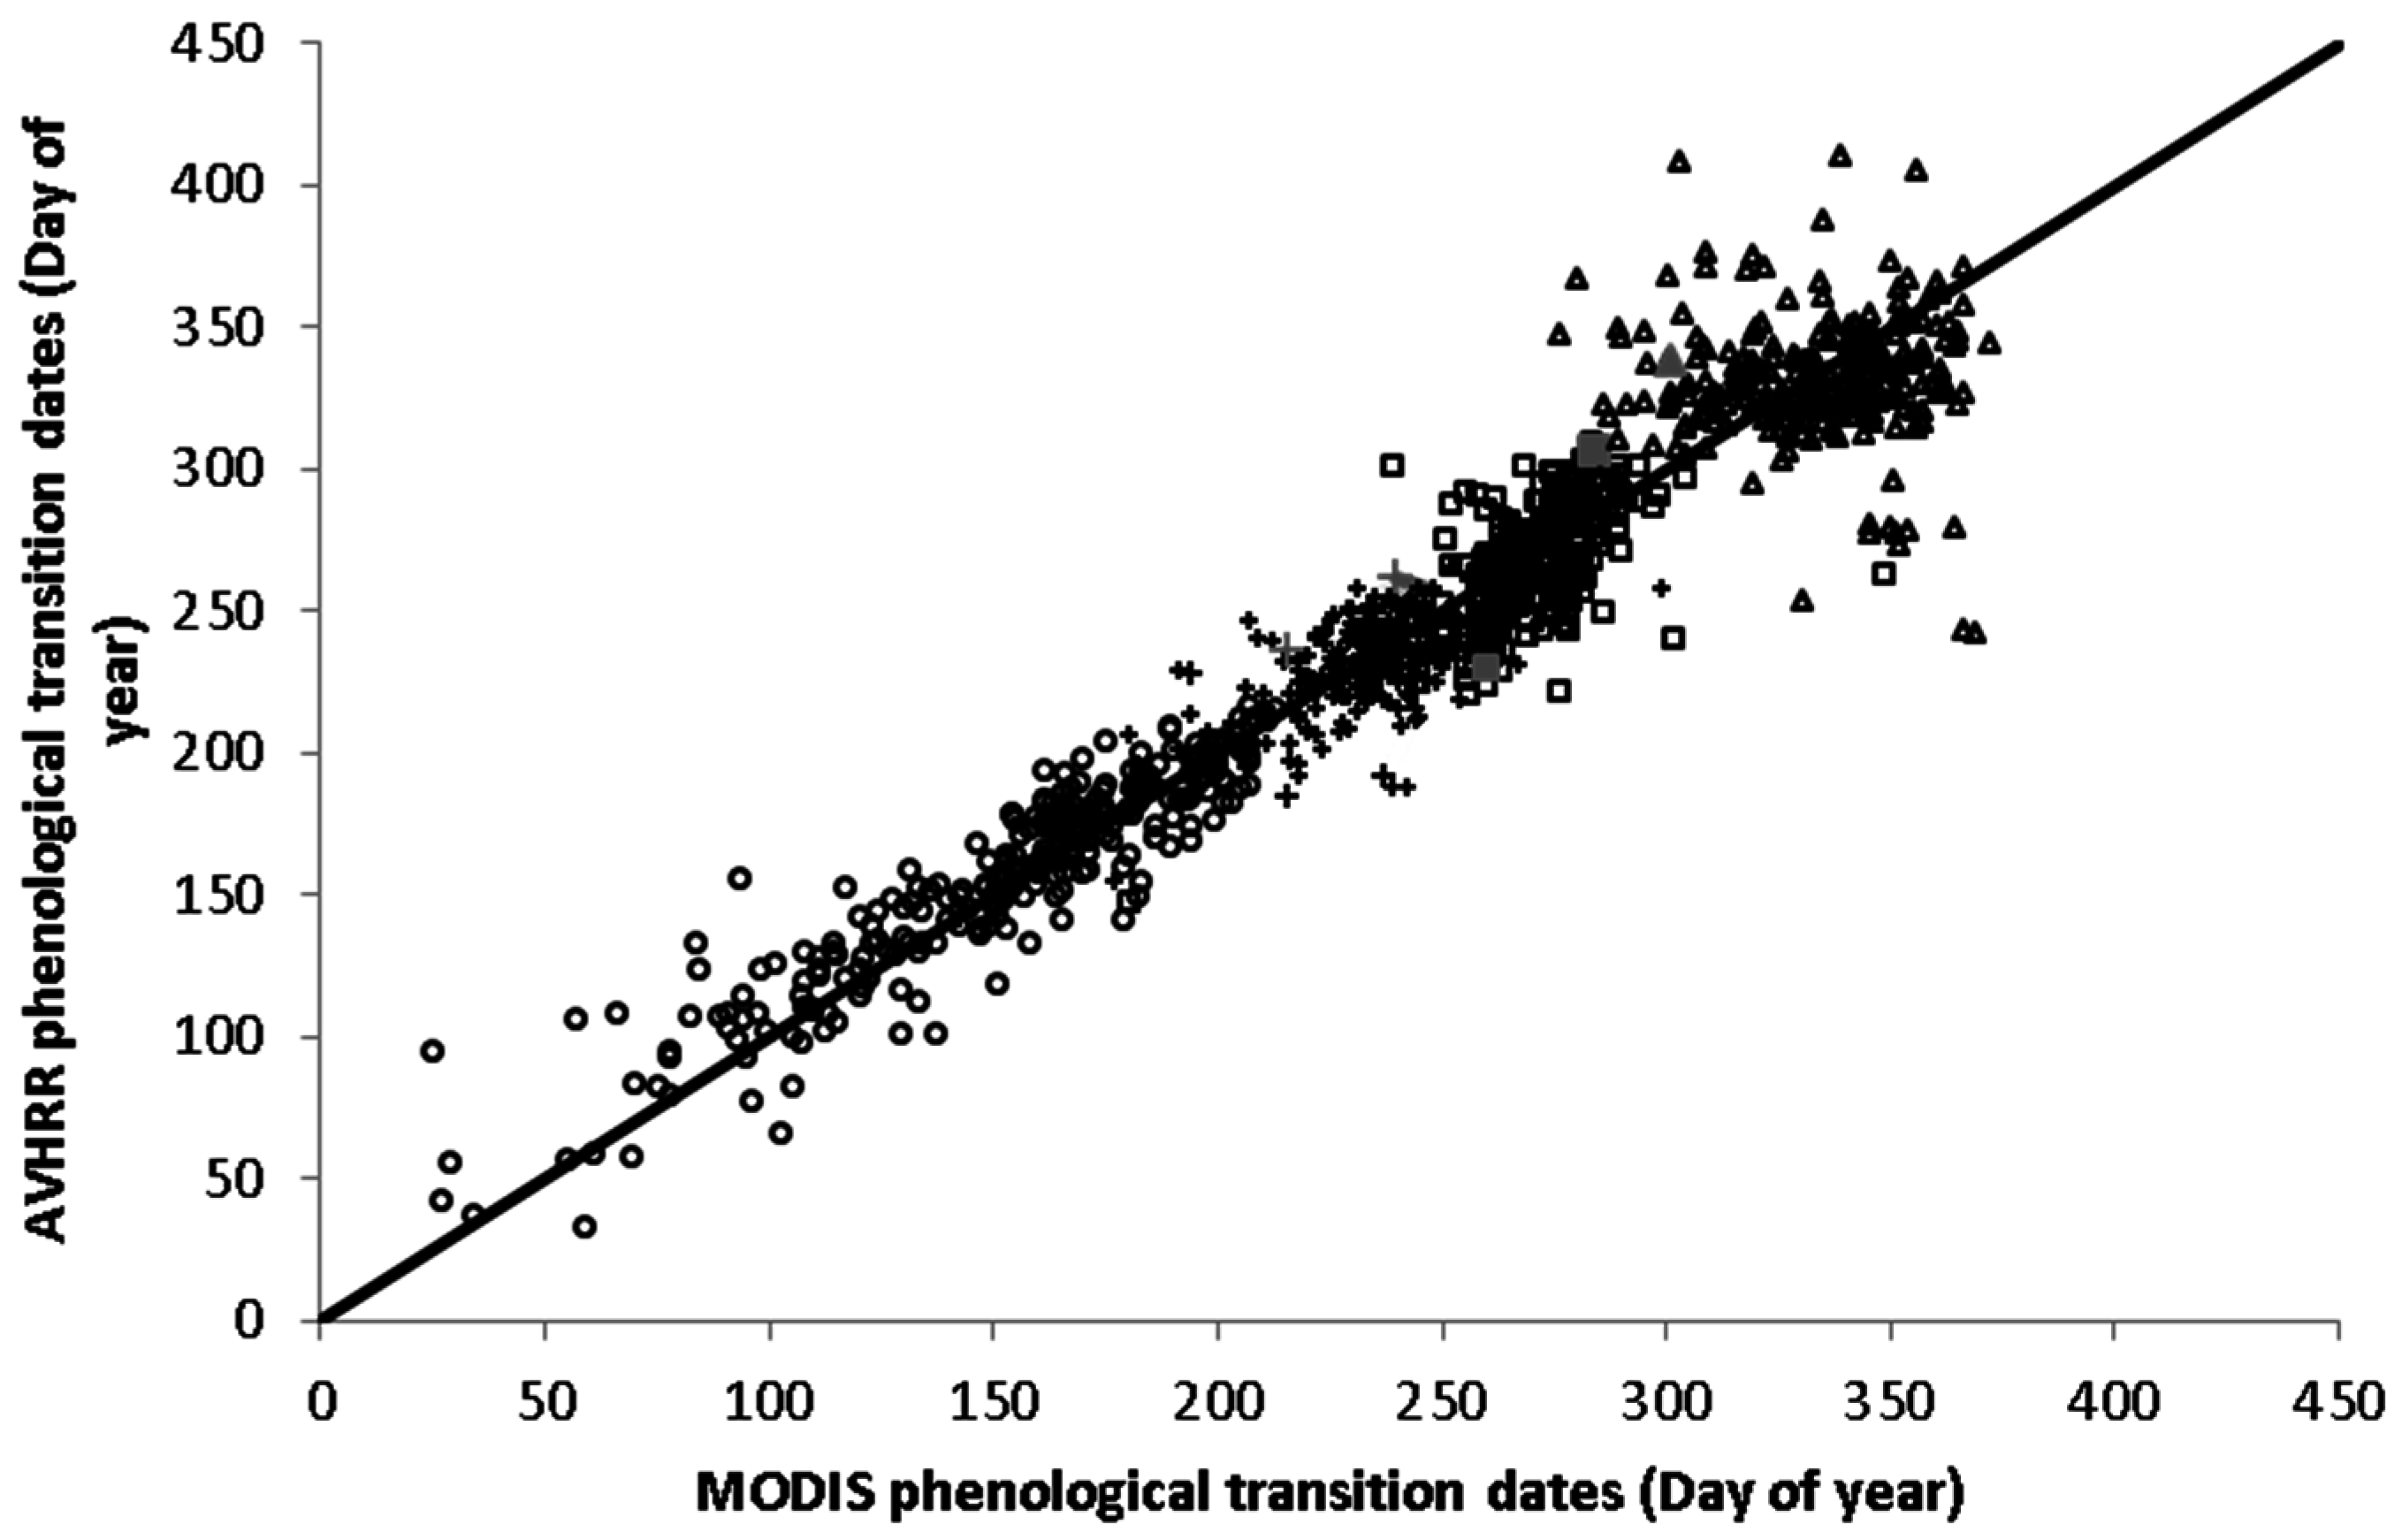
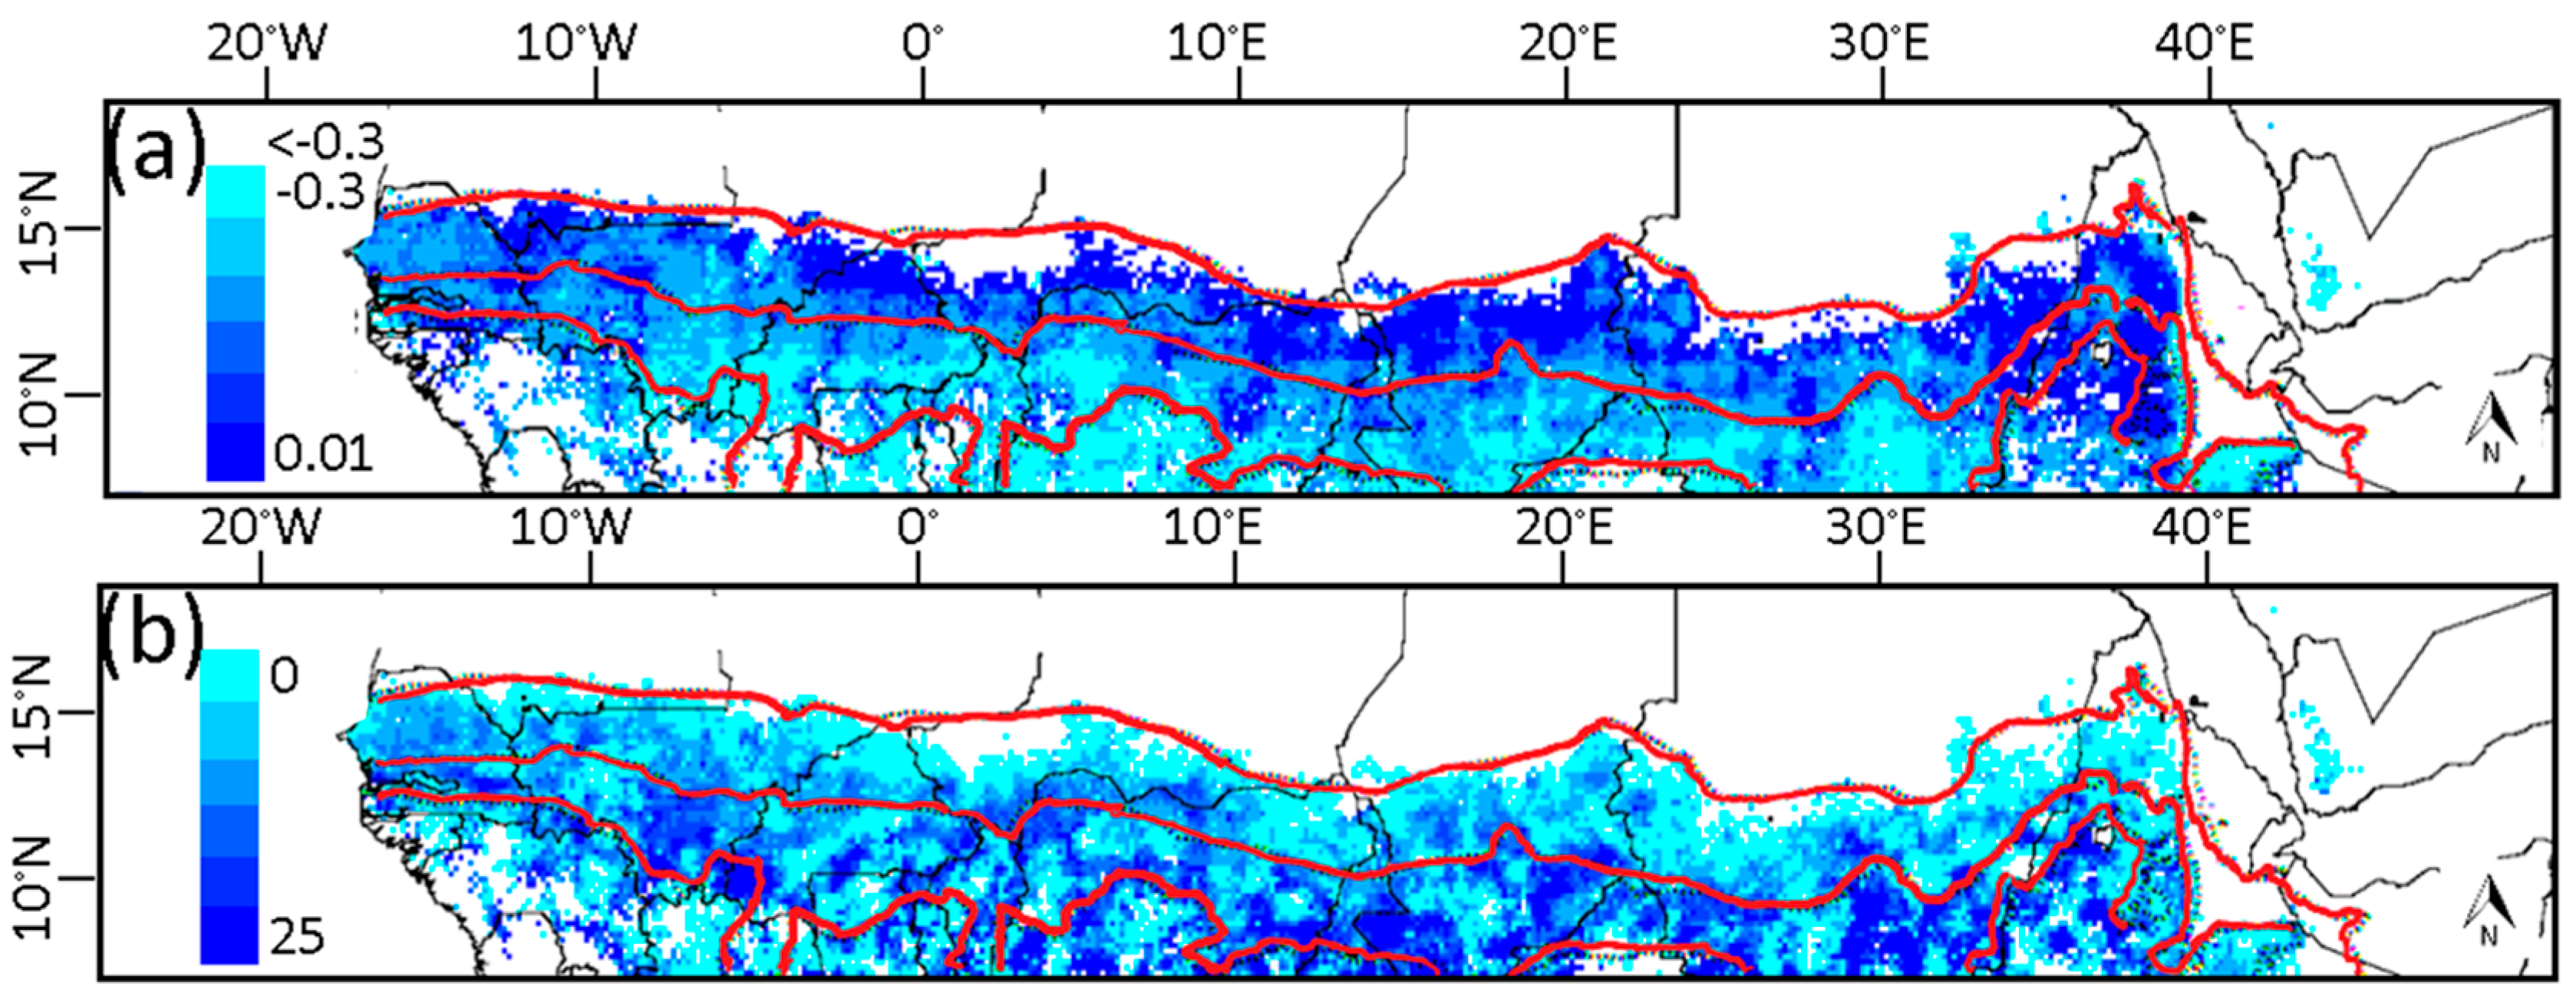
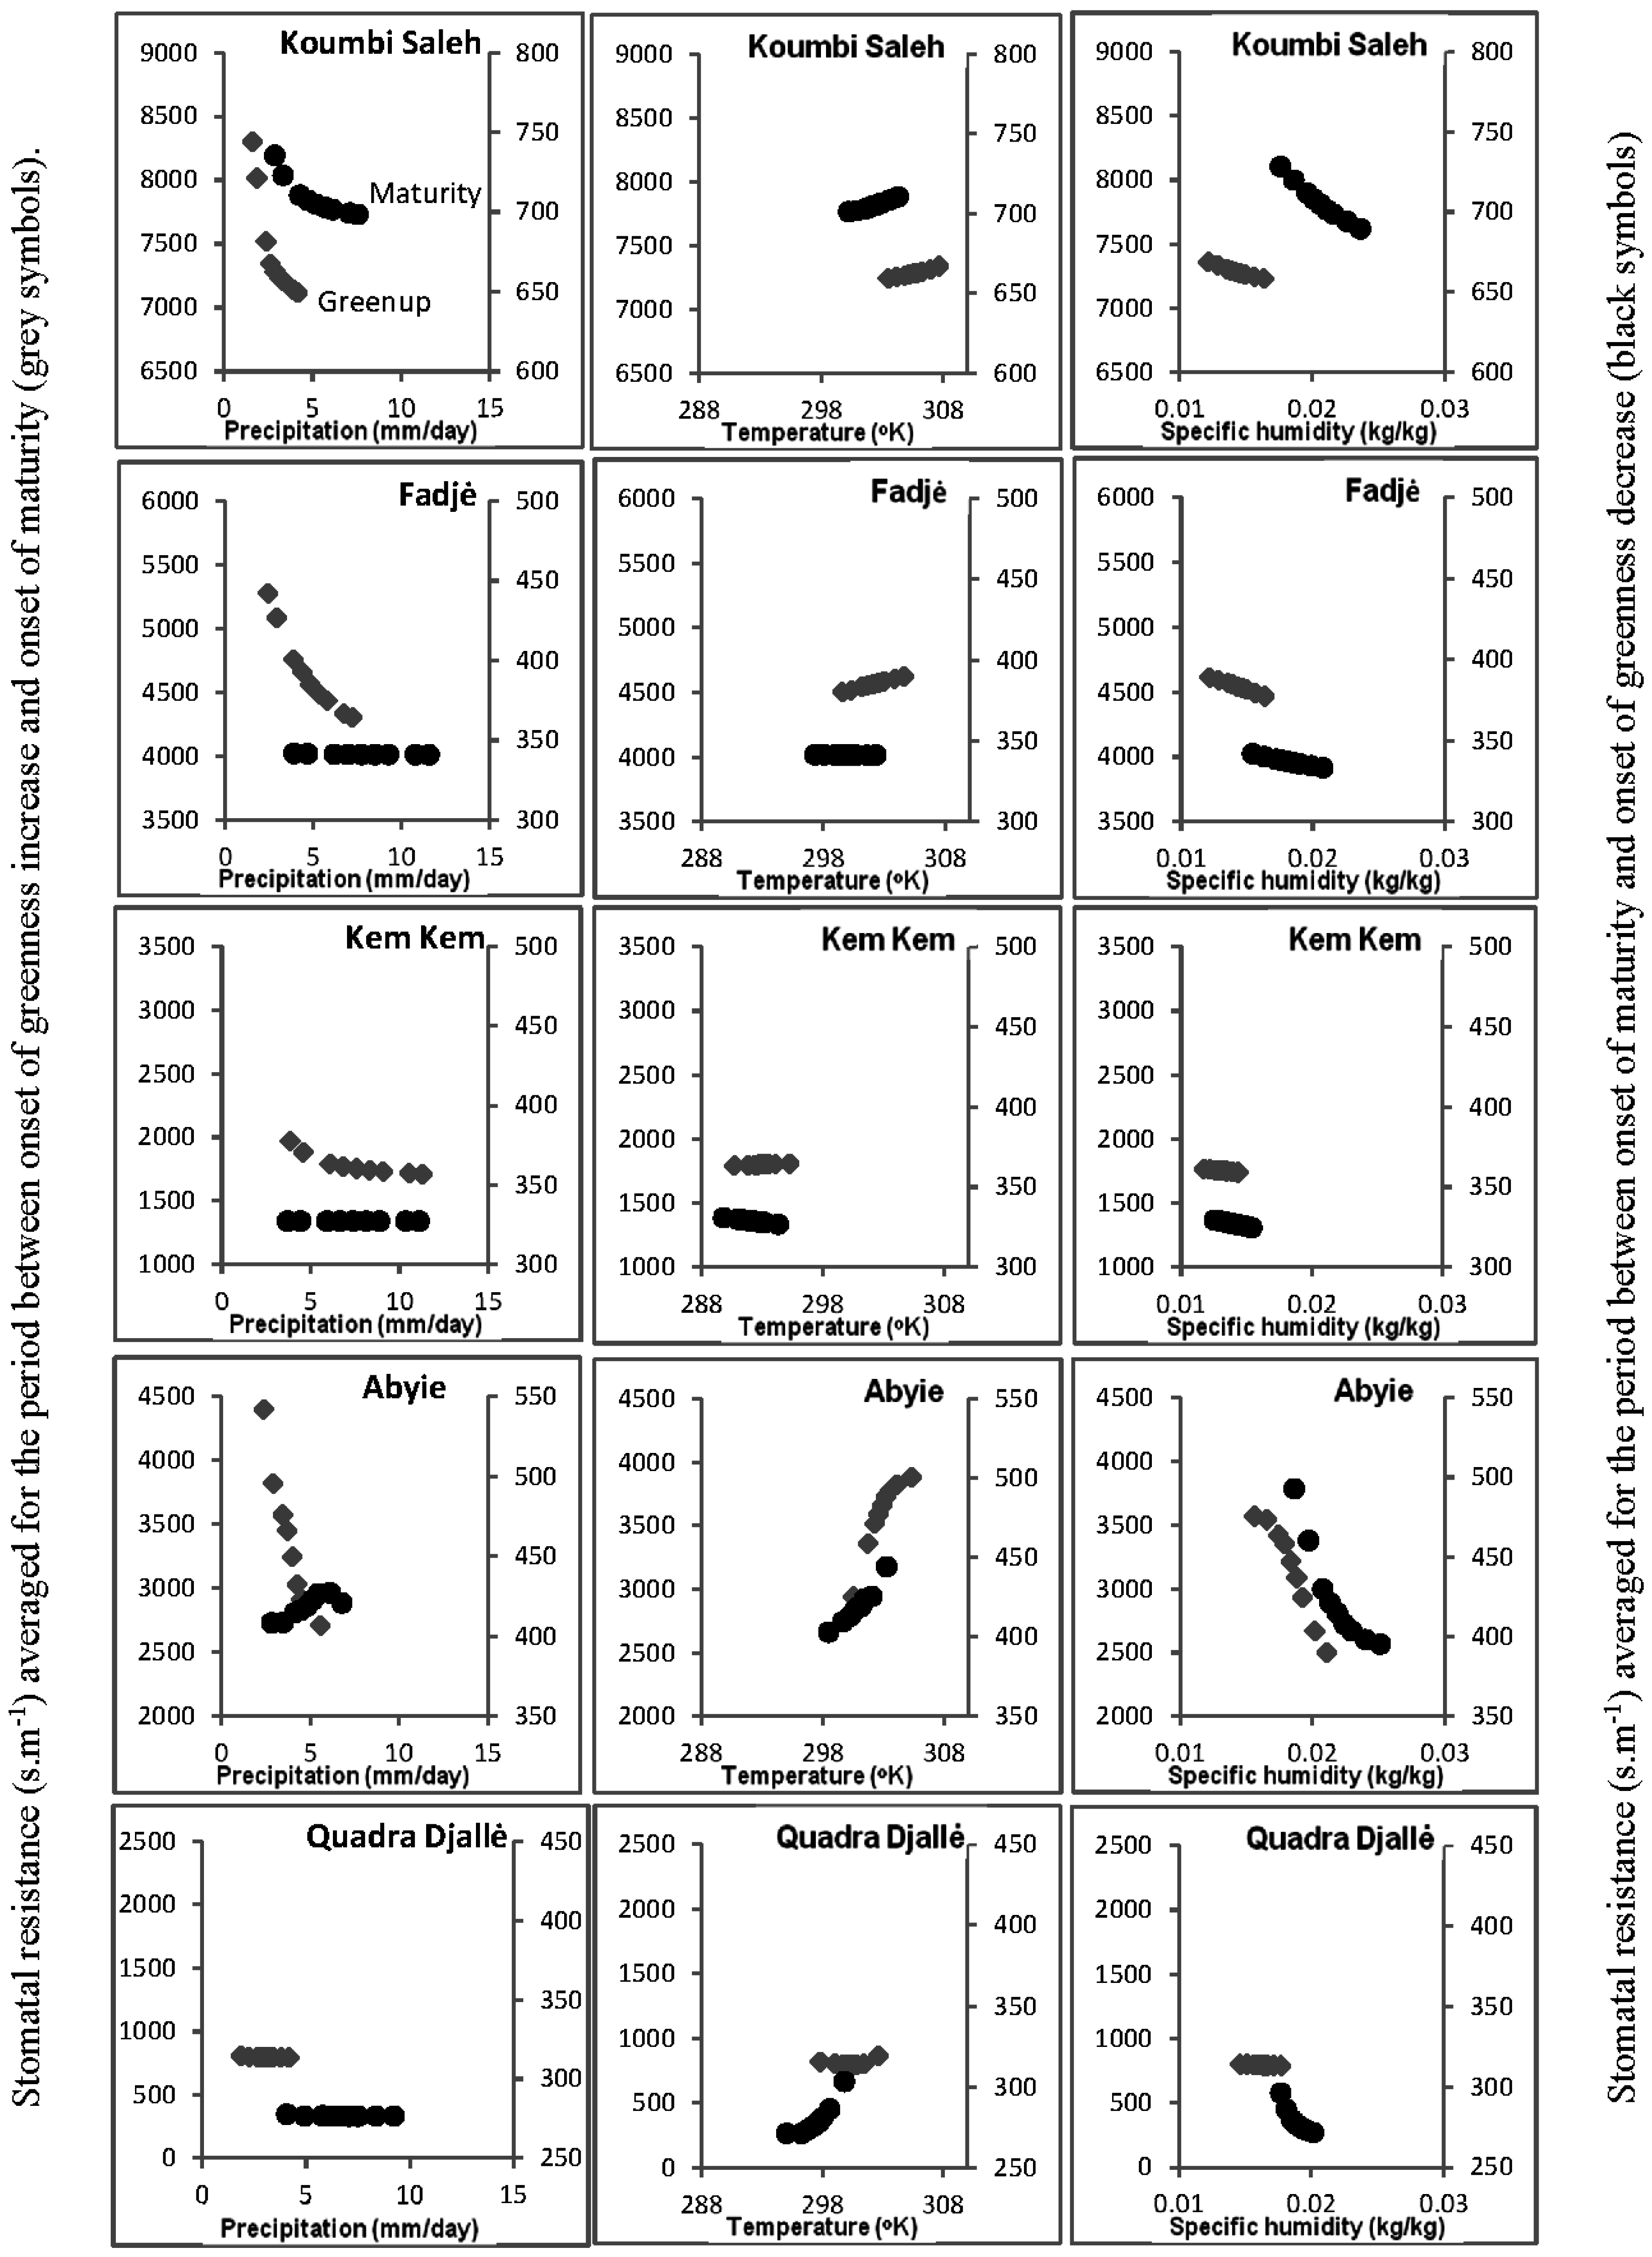
3.1. Phenological Transition Dates

For the transition dates of greenup, maturity and senescence, the comparison between the AVHRR and MODIS [79] (Figure 2) measurements revealed a good agreement with root mean square errors only slightly higher than the reported accuracies of the MODIS products [78,79]. However, the measurements of the dormancy transition dates did not agree and the root mean square error (RMSE = 29 days) of the dormancy comparison was one order of magnitude higher than the RMSE values for greenup, maturity and senescence. This is perhaps due to the less pronounced transitions in the rates of change in NDVI curvature towards the end of the growing season which renders derivatives of the dormancy dates more sensitive to errors in NDVI measurements.
The greenup transition dates (Figure 3) were characterized by a pronounced north-south gradient with greenup detected as early as February at lower latitudes (7.5°N) and as late as August at higher latitudes (17.5°N). The senescence transition dates also had a pronounced north-south gradient but with the earlier dates at higher latitudes (late August) than at lower latitudes (late October). Both transitions were found to vary between years with grasslands in the arid region showing the highest temporal variability in greenup transition dates. On average, the length of the growing season (the difference between the two dates) varied from approximately 20 days at the southern edge of the Sahara Desert to approximately 250 days in the wetter parts of the study area.

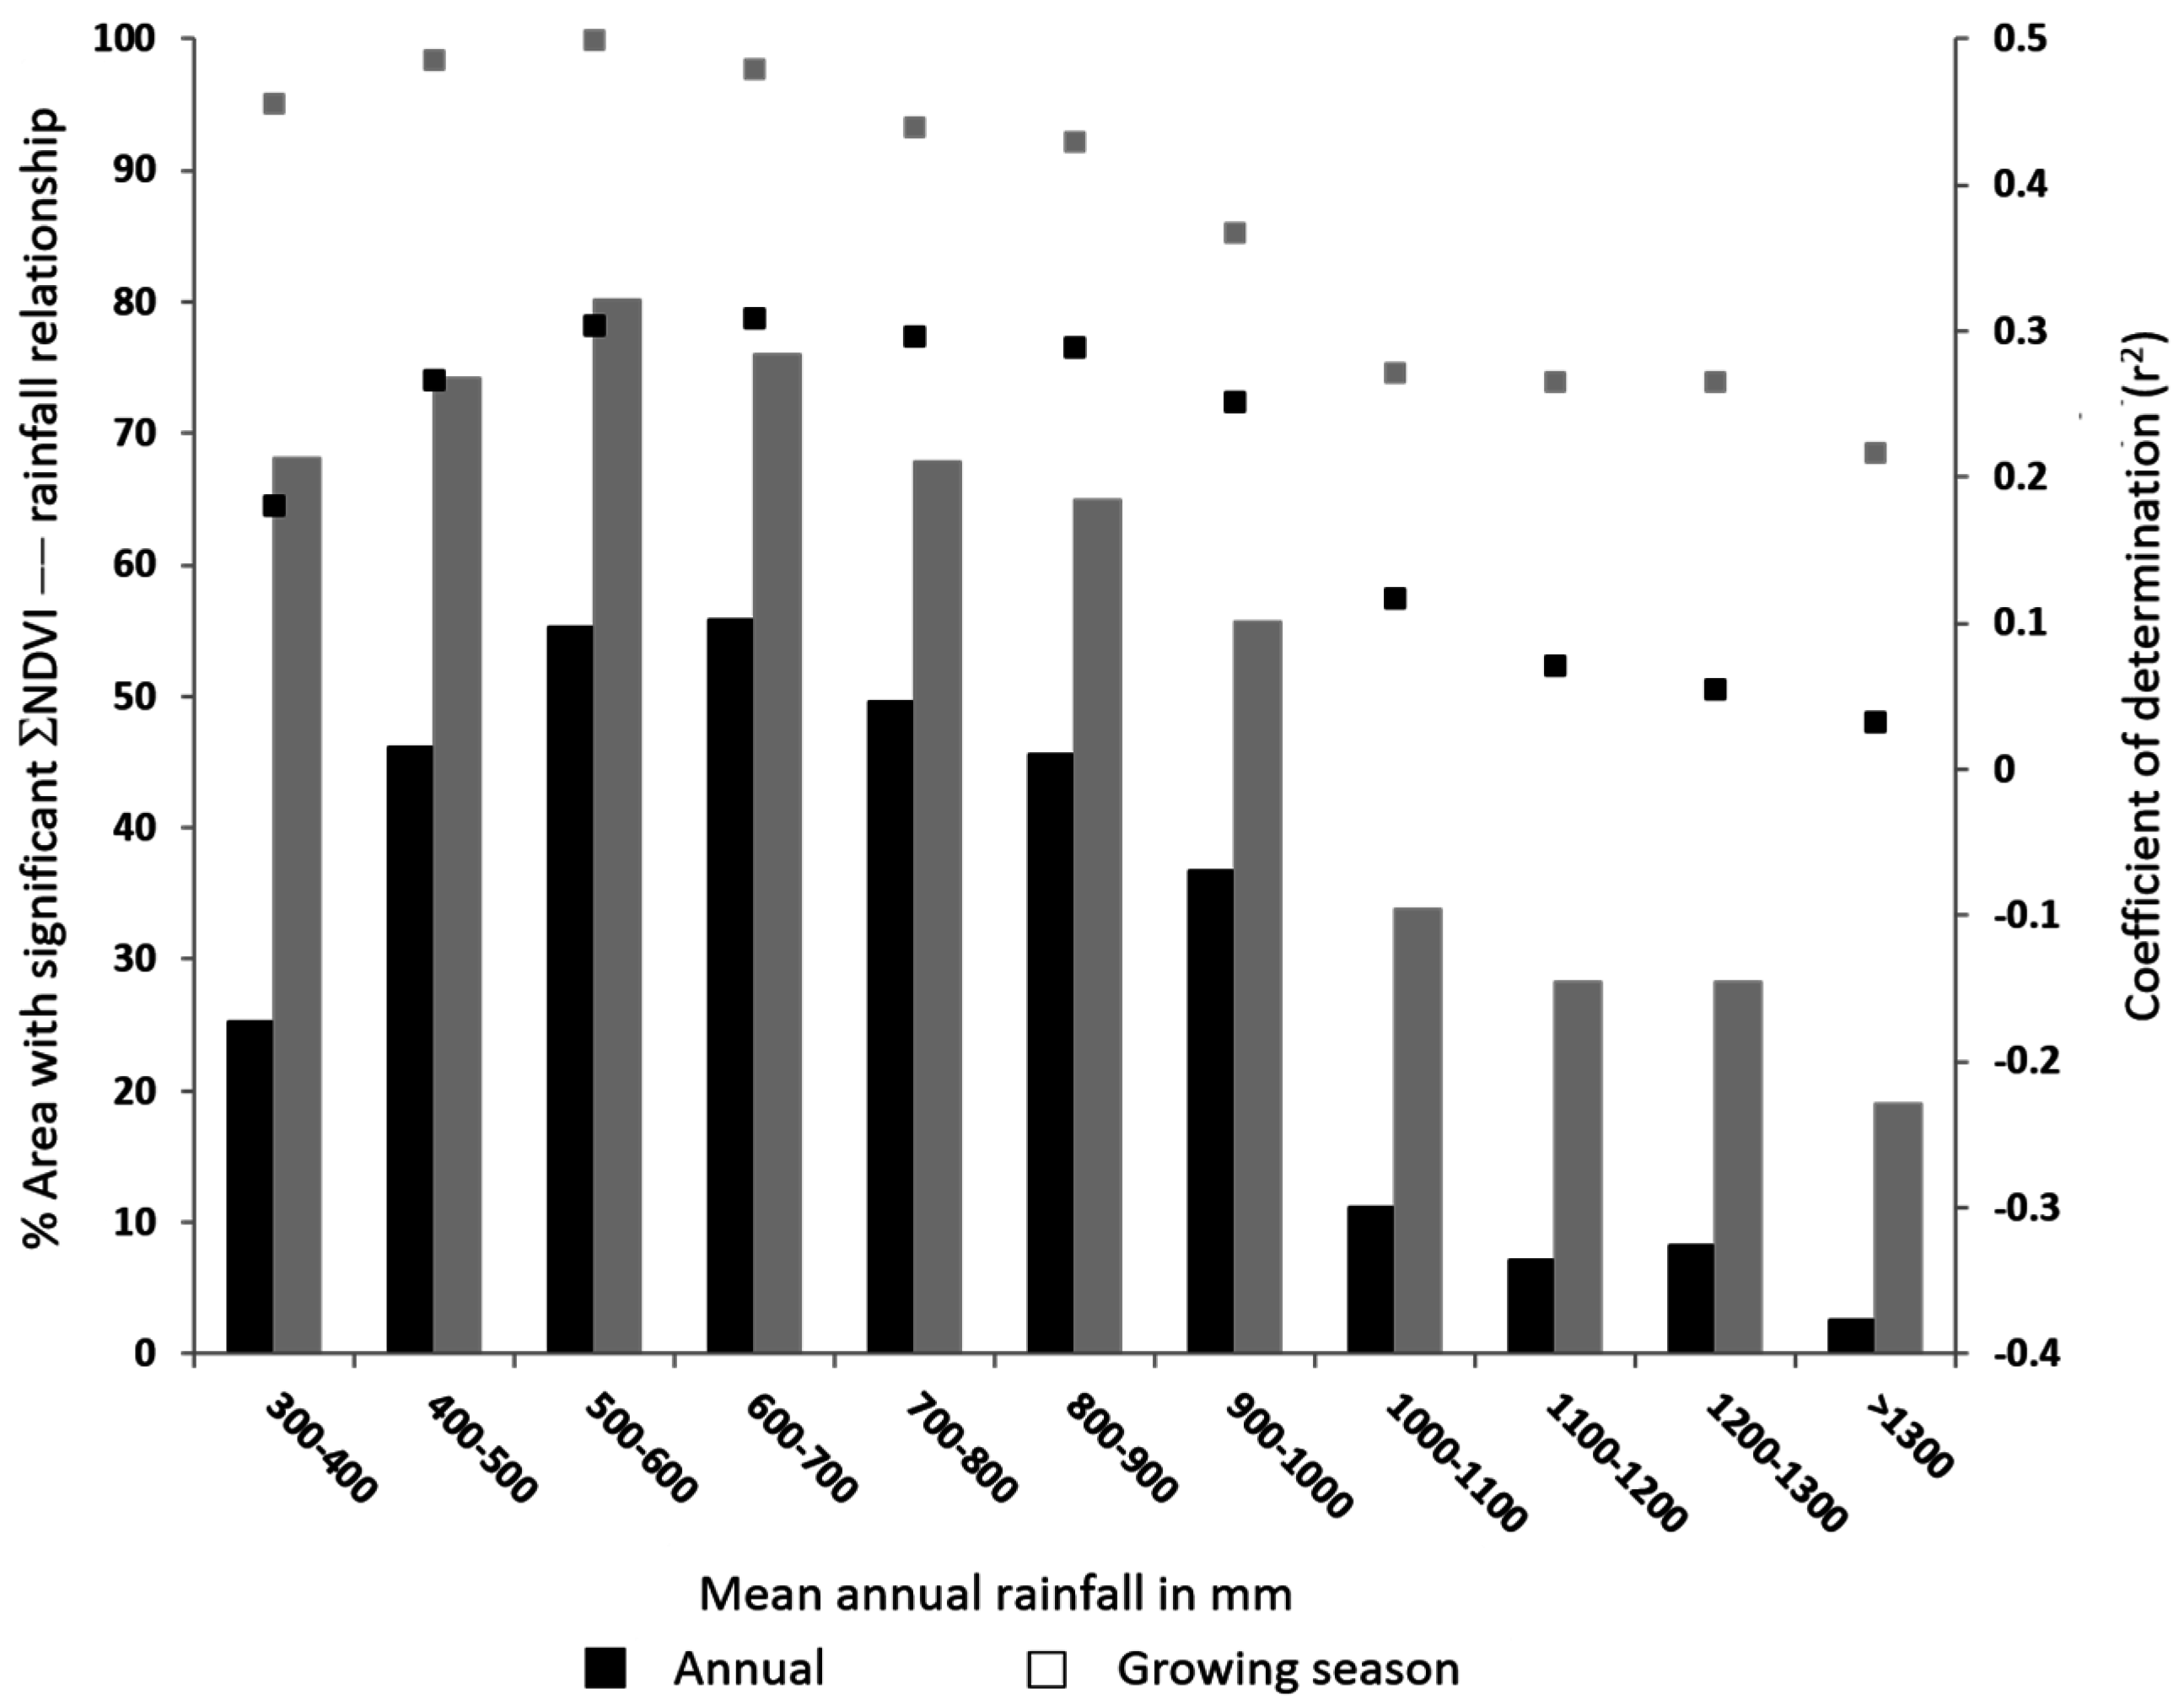
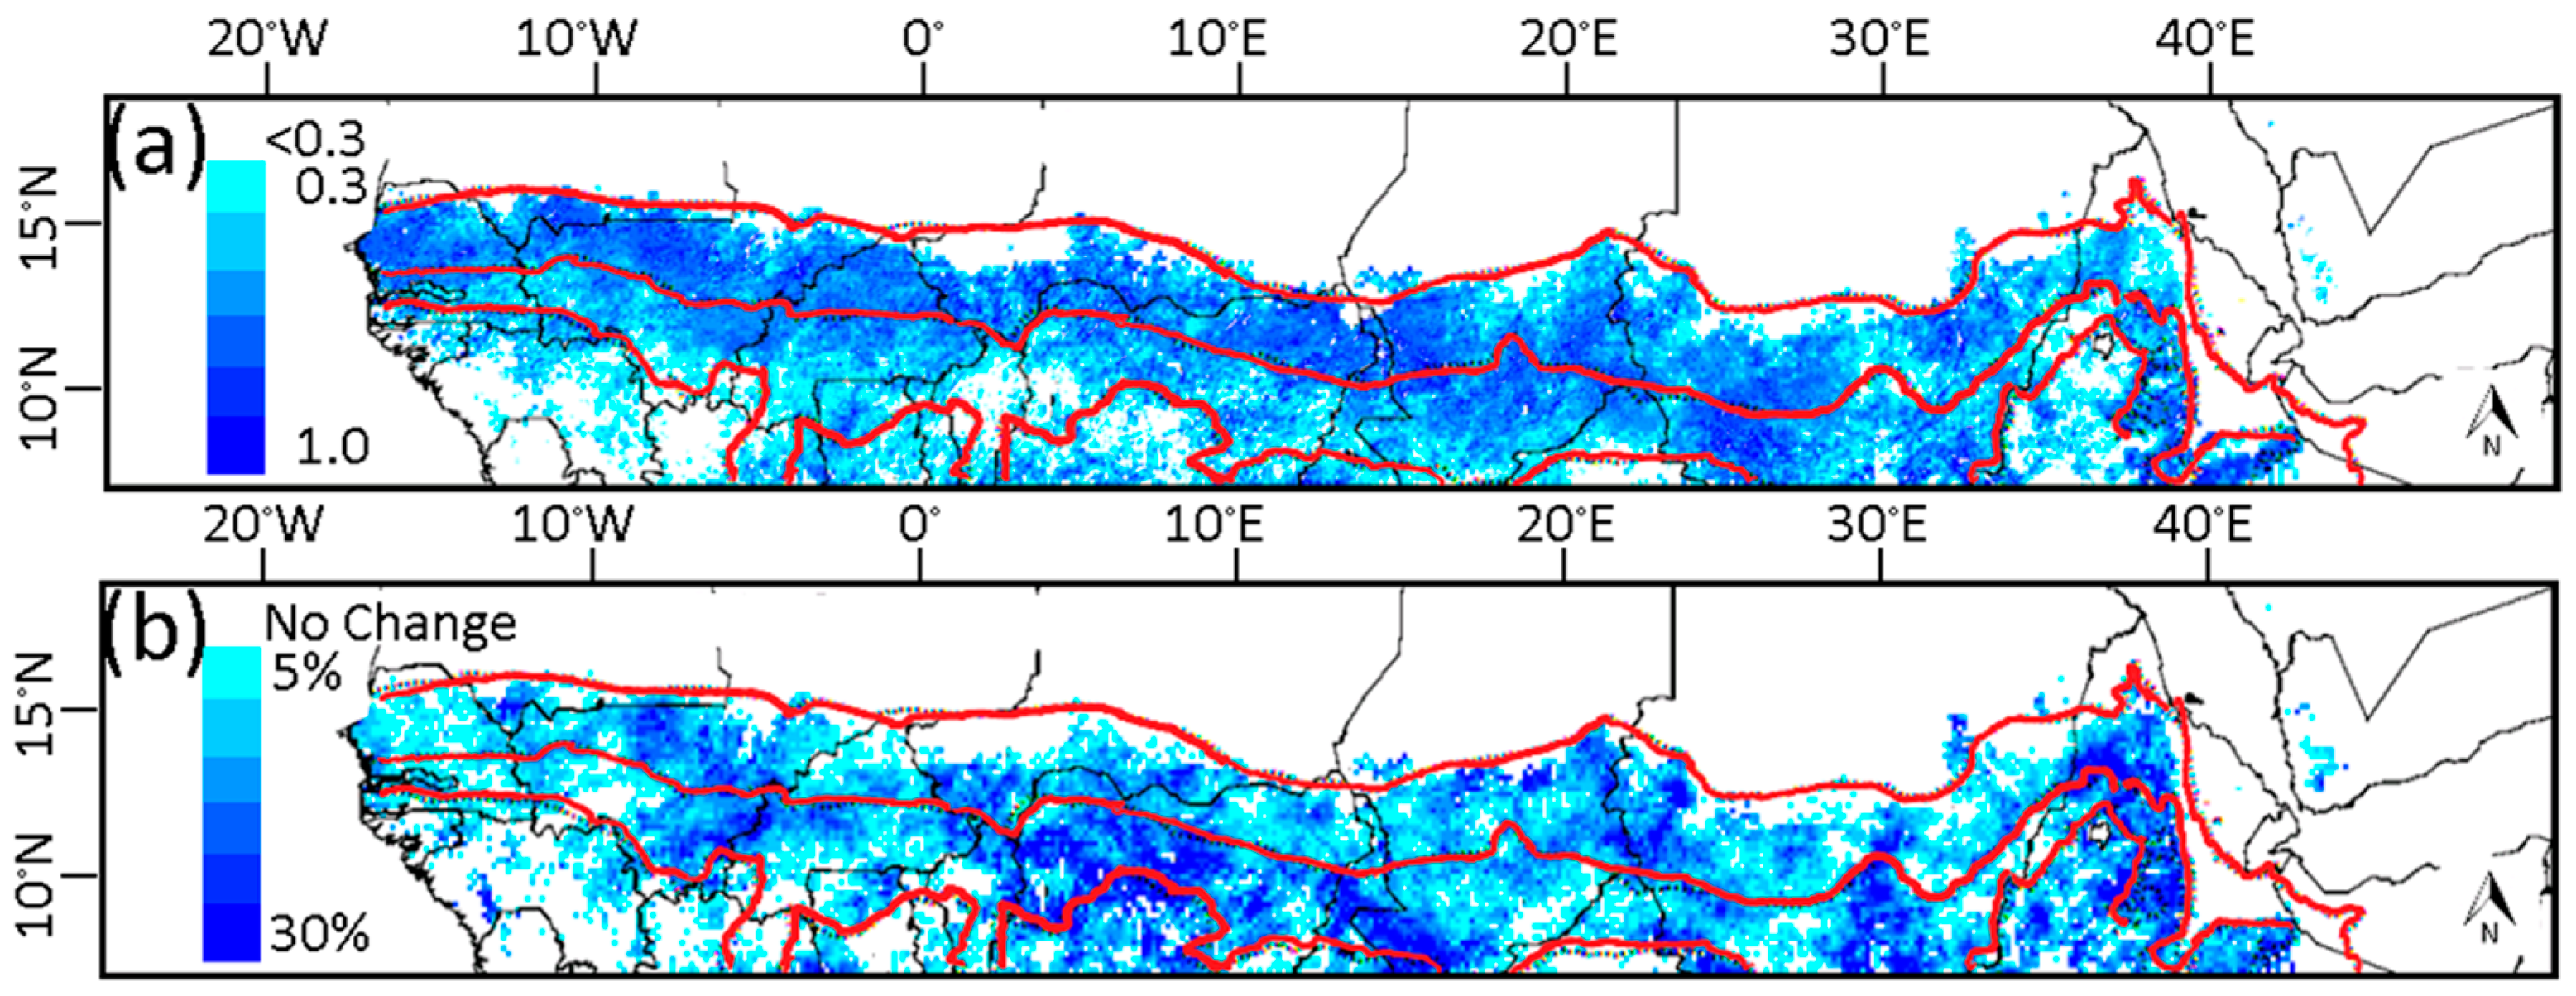
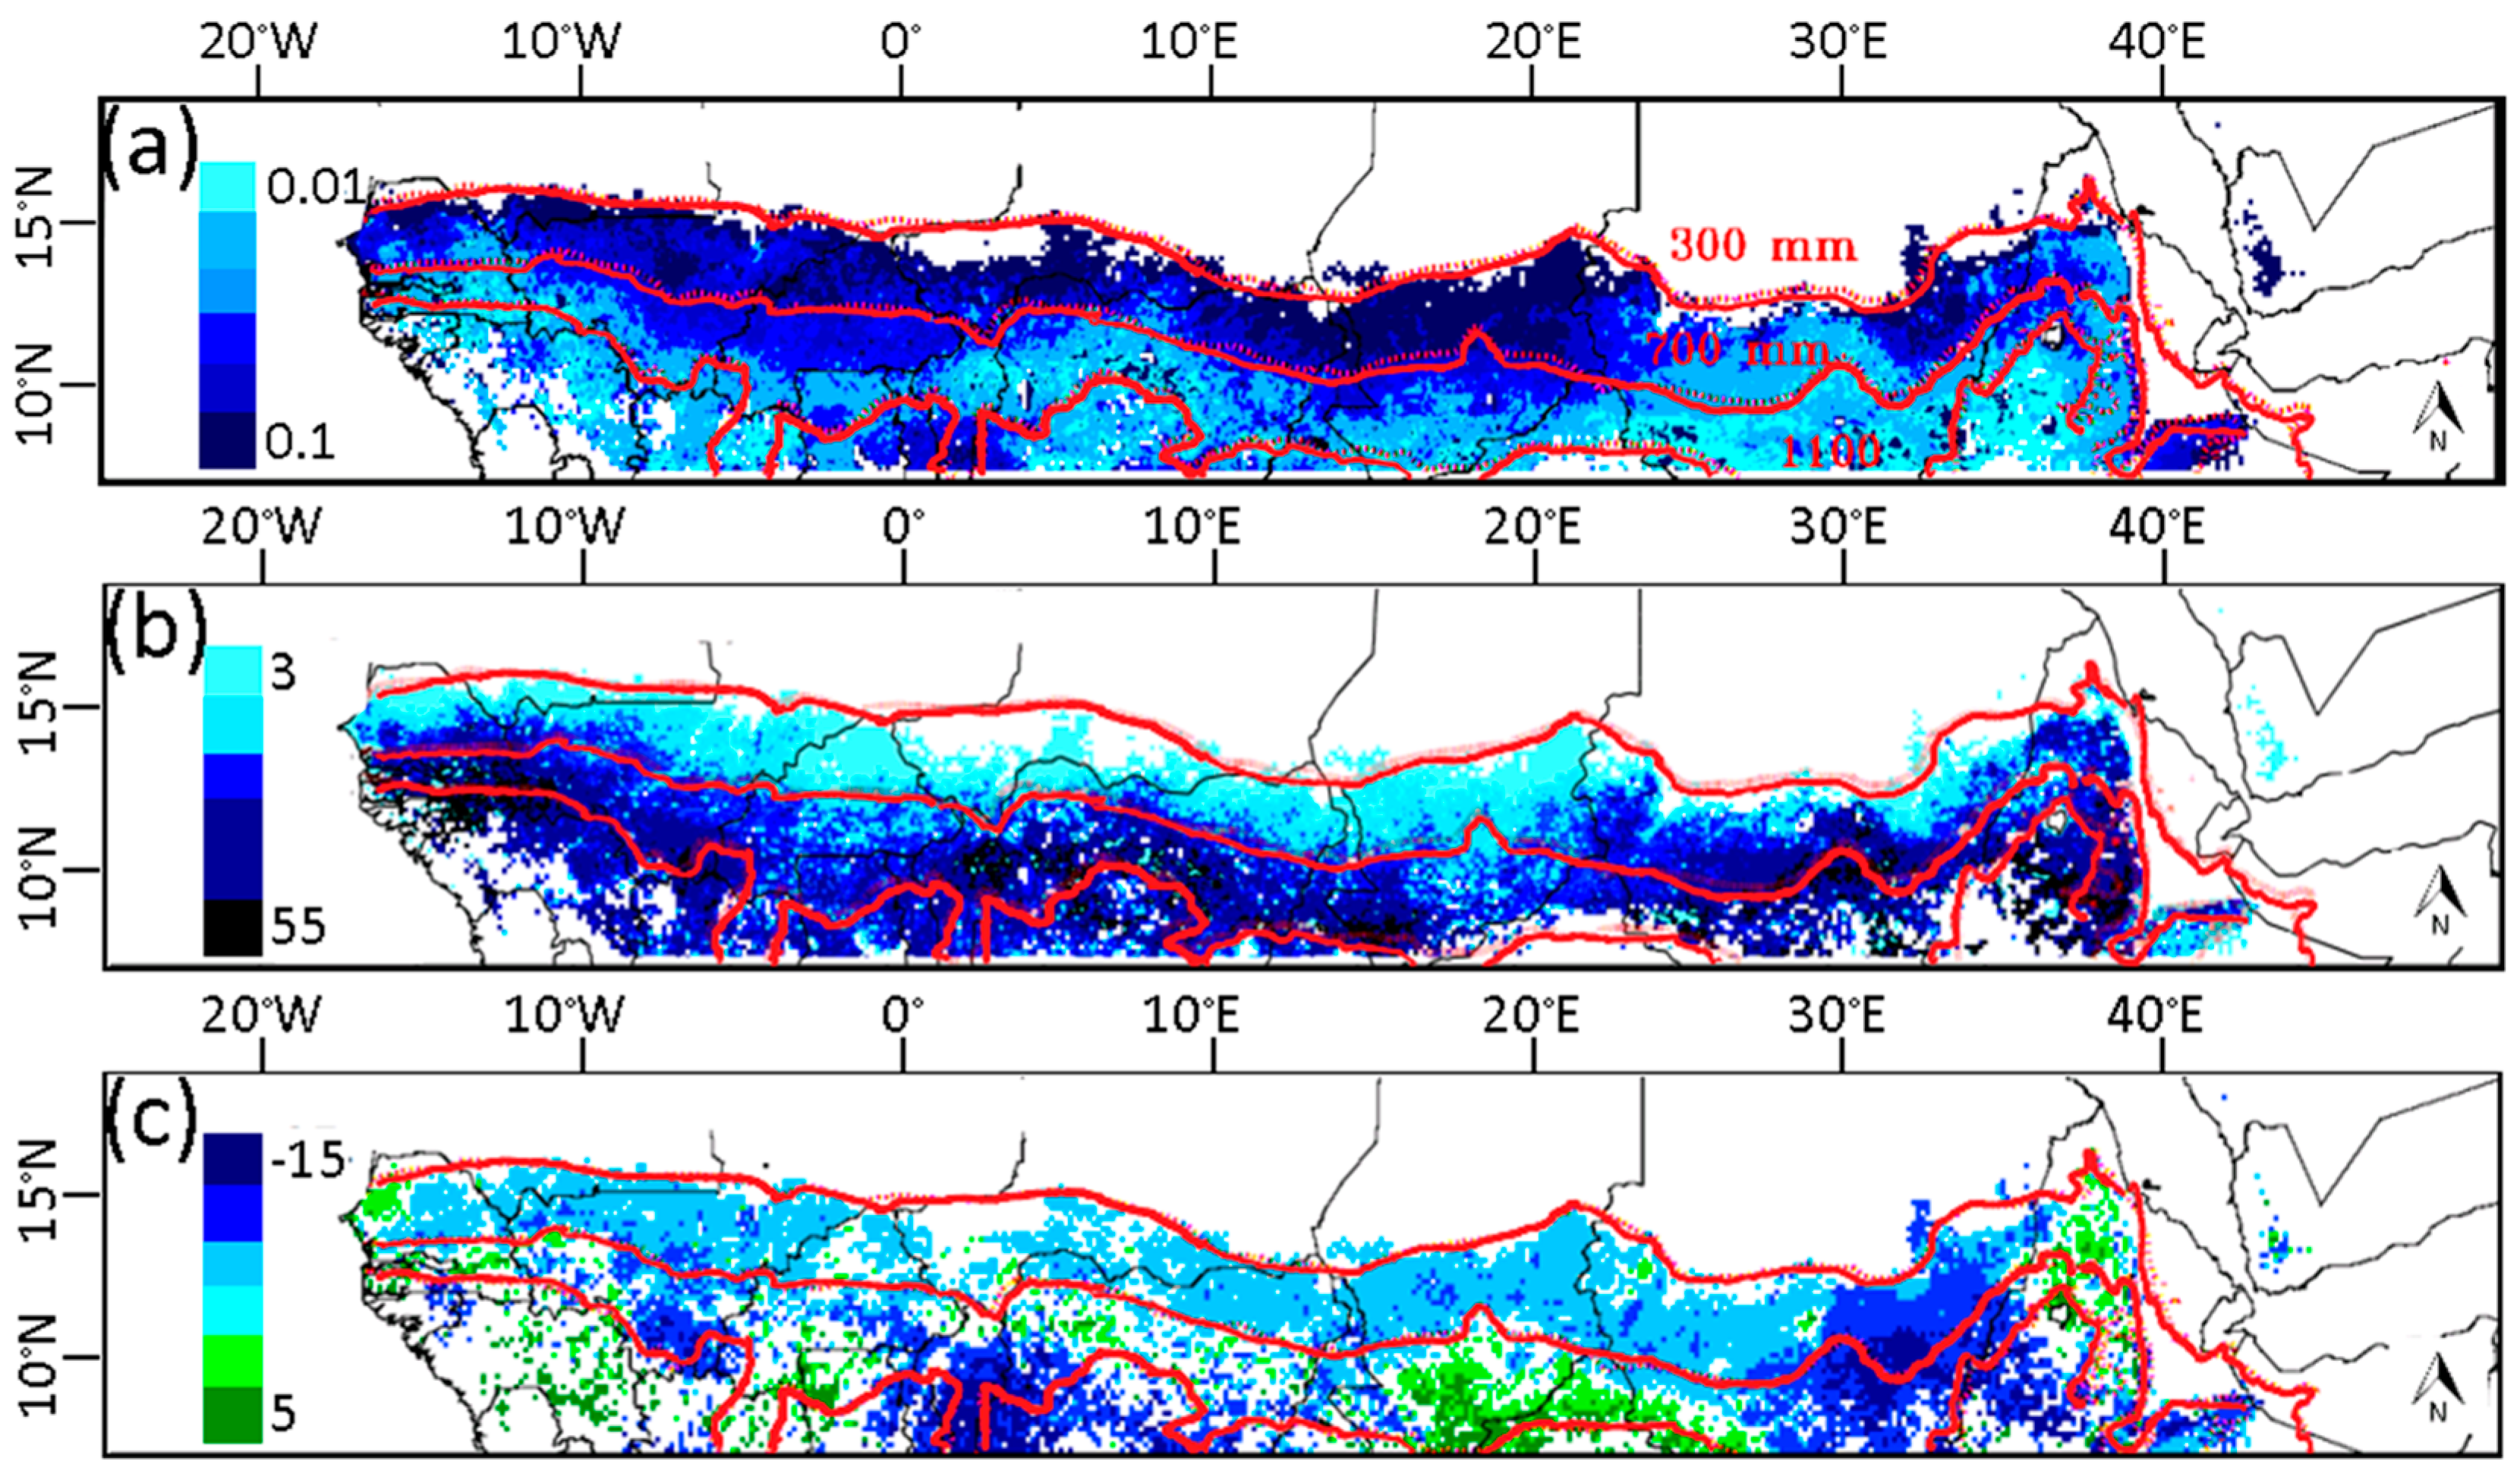
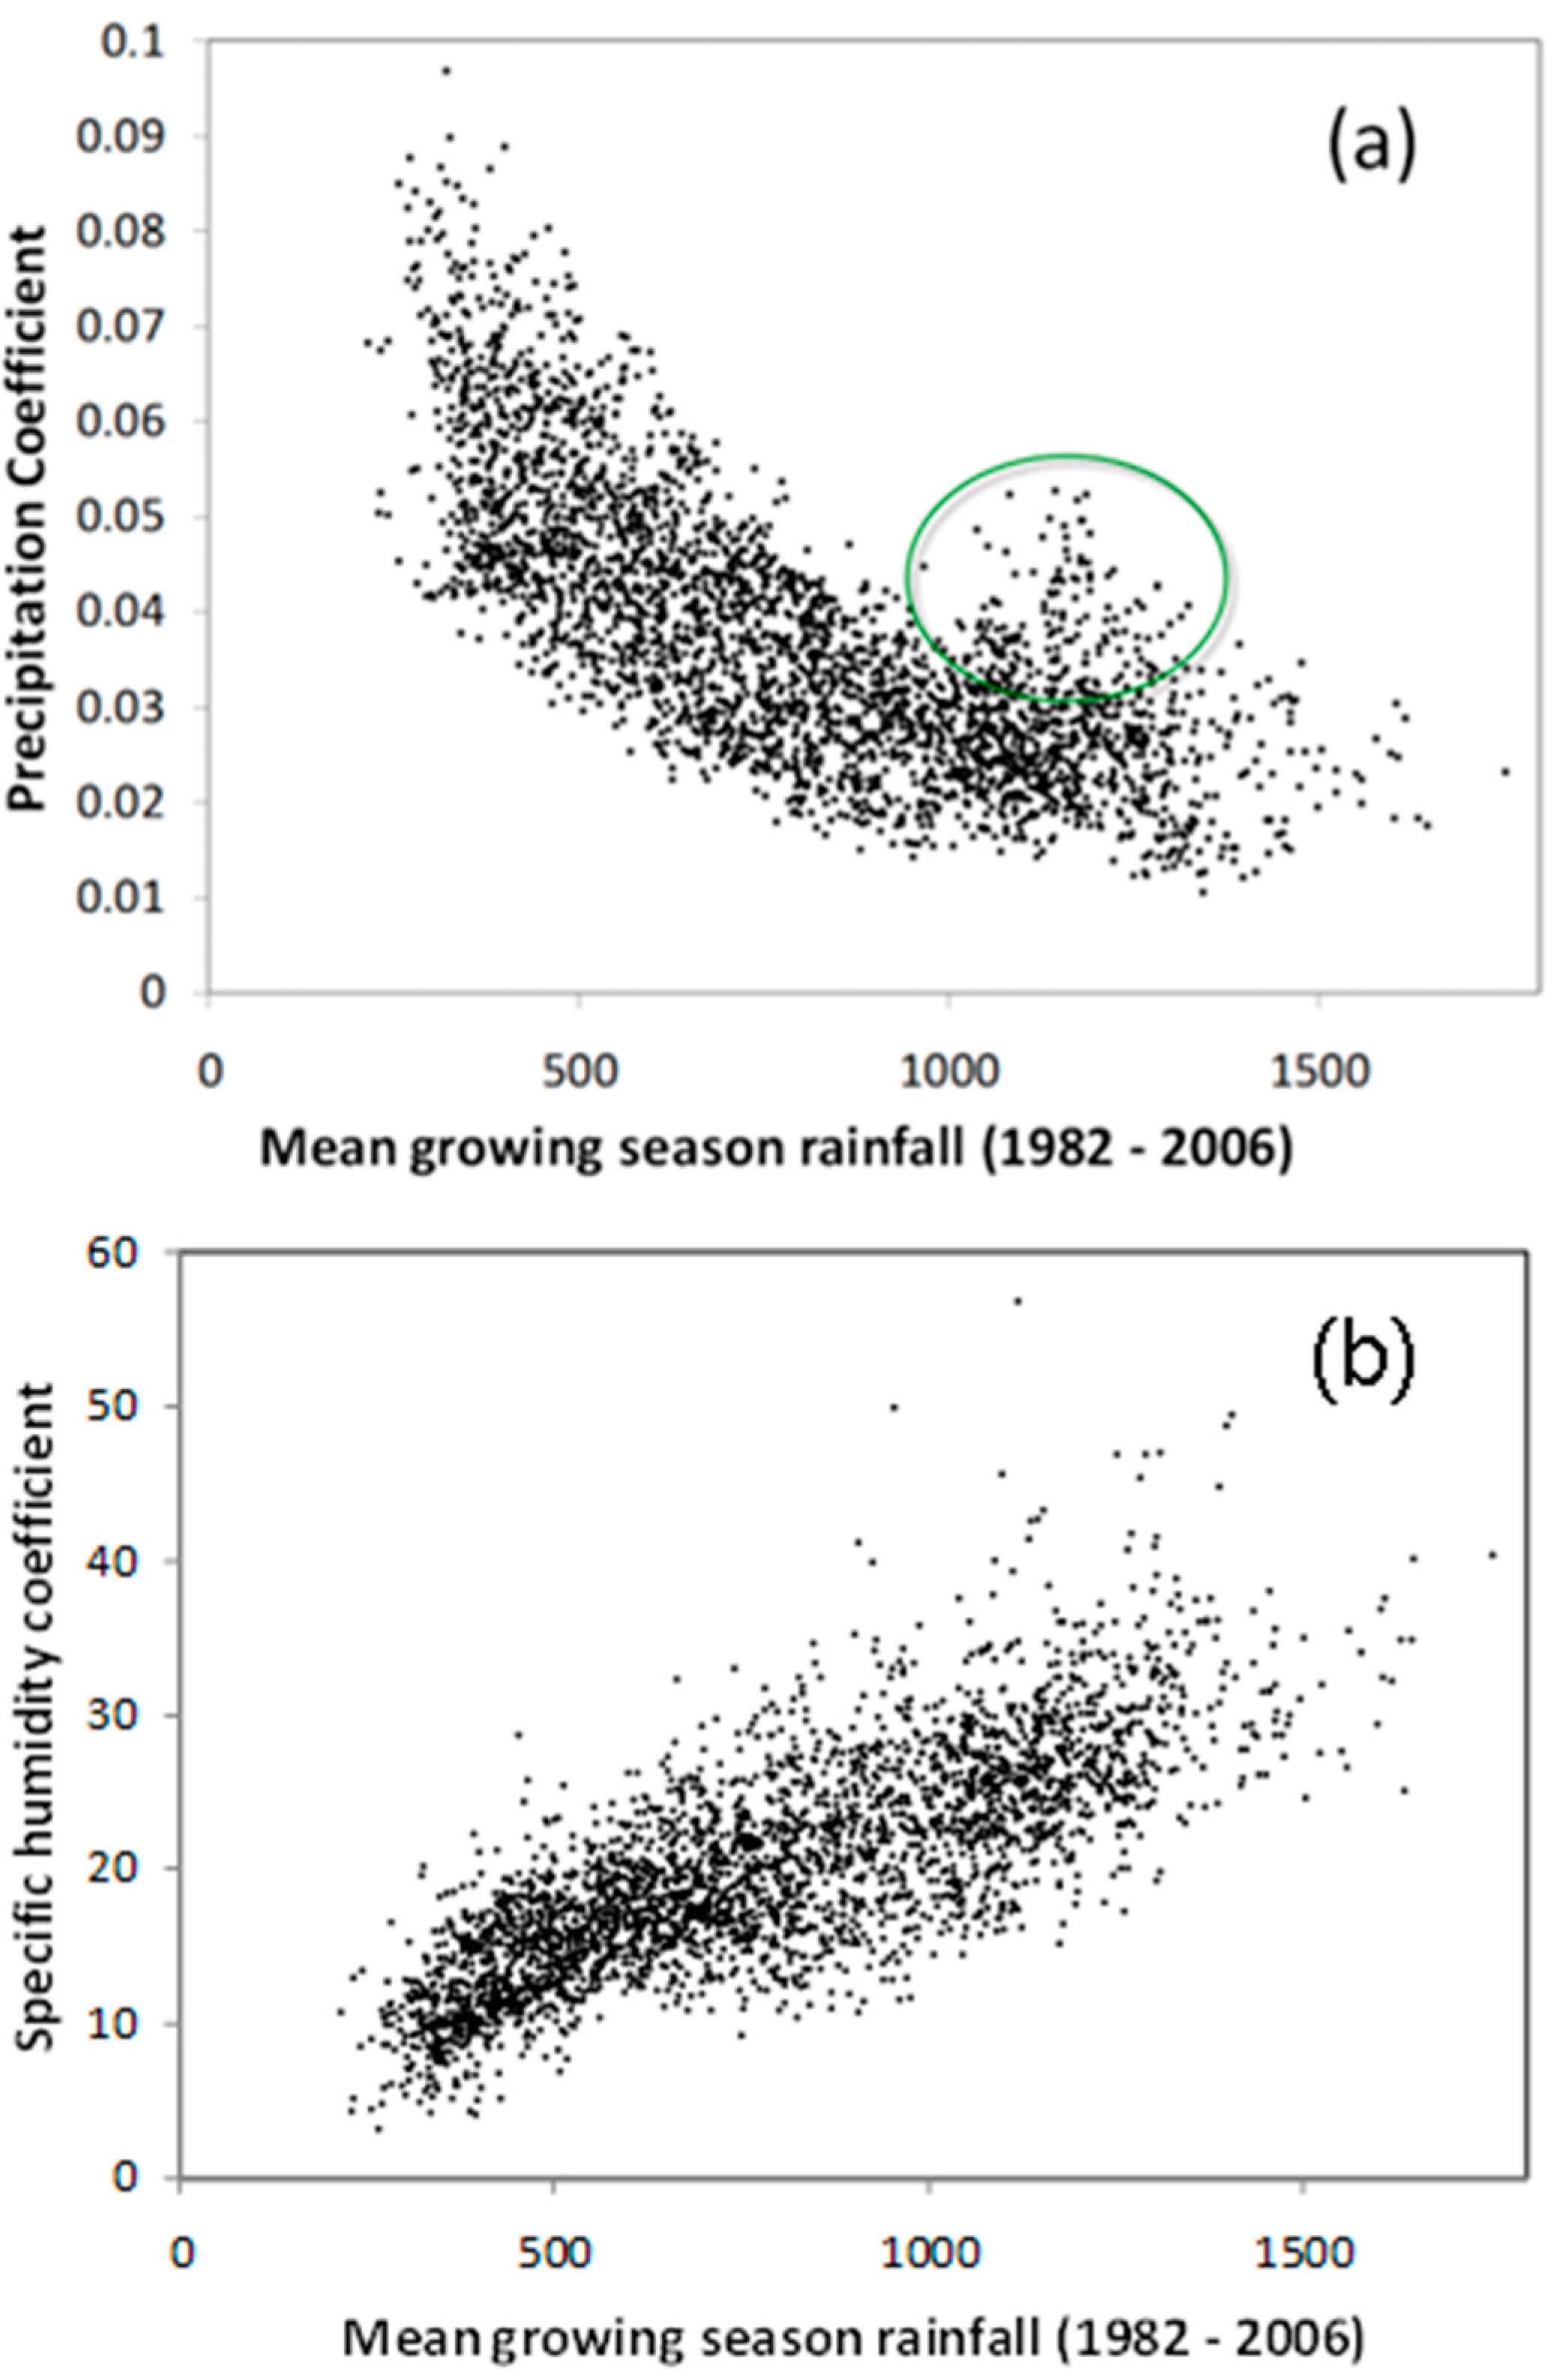
3.2. Relationship of NDVI with Rainfall

The relationships of annual and growing season sums of rainfall and NDVI differed in strength and to some extent in their spatial patterns. The growing season rainfall-ΣNDVI relationships were generally stronger (Figure 4 and Figure 5). The growing season rainfall-ΣNDVI relationships were significant in approximately 58% of the study area whereas the annual rainfall-ΣNDVI relationships were significant in 37% of the study area (critical t-values calculated for each pixel indicated that, in general, regressions with r2 values greater than 0.3 were significant (p < 0.05)).
A belt of significant annual ΣNDVI-rainfall relationships was evident around the 700 mm rainfall isohyet, however, areas receiving less than 400 mm rainfall/year and areas receiving more than 1000 mm rainfall/year were generally characterized by insignificant relationships (Figure 4). On average, stronger growing season ΣNDVI-rainfall relationships were found in the arid and semi-arid areas with shrubland and grassland landcover (r2 = 0.43 ± 0.17) than in sub-humid areas with woody savanna land cover (r2 = 0.3 ± 0.16) (Figure 5).

3.3. Relationship of Growing Season ΣNDVI with Seasonal Rainfall Distribution

The multivariate regressions between ΣNDVI, total growing season rainfall and the two moments of rainfall distribution (variance and skewness) provided robust yet simple statistical models of NDVI variation (Figure 6a). Compared to the growing season ΣNDVI-rainfall relationships, adding the two moments increased the ability of the models to account for NDVI variation (Figure 6b). The changes in percentage variance explained varied spatially but these were not significantly related to either the aridity gradient or to the spatial distribution of land cover types.
The coefficients of the multivariate linear regressions quantified the direction and magnitude of the relationship between precipitation distribution and growing season NDVI. In general, growing season NDVI was positively related to precipitation totals and to the skewness of precipitation distribution, but negatively related to its variance which suggest that, for a given precipitation total, the seasonally summed NDVI values were higher when precipitation arrived in more frequent and less intense precipitation events (Figure 7). Similar results have been reported at the interannual temporal scale [2].

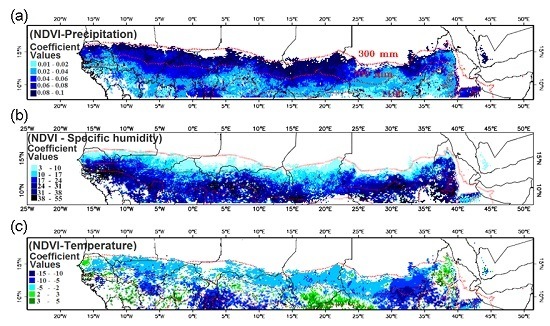
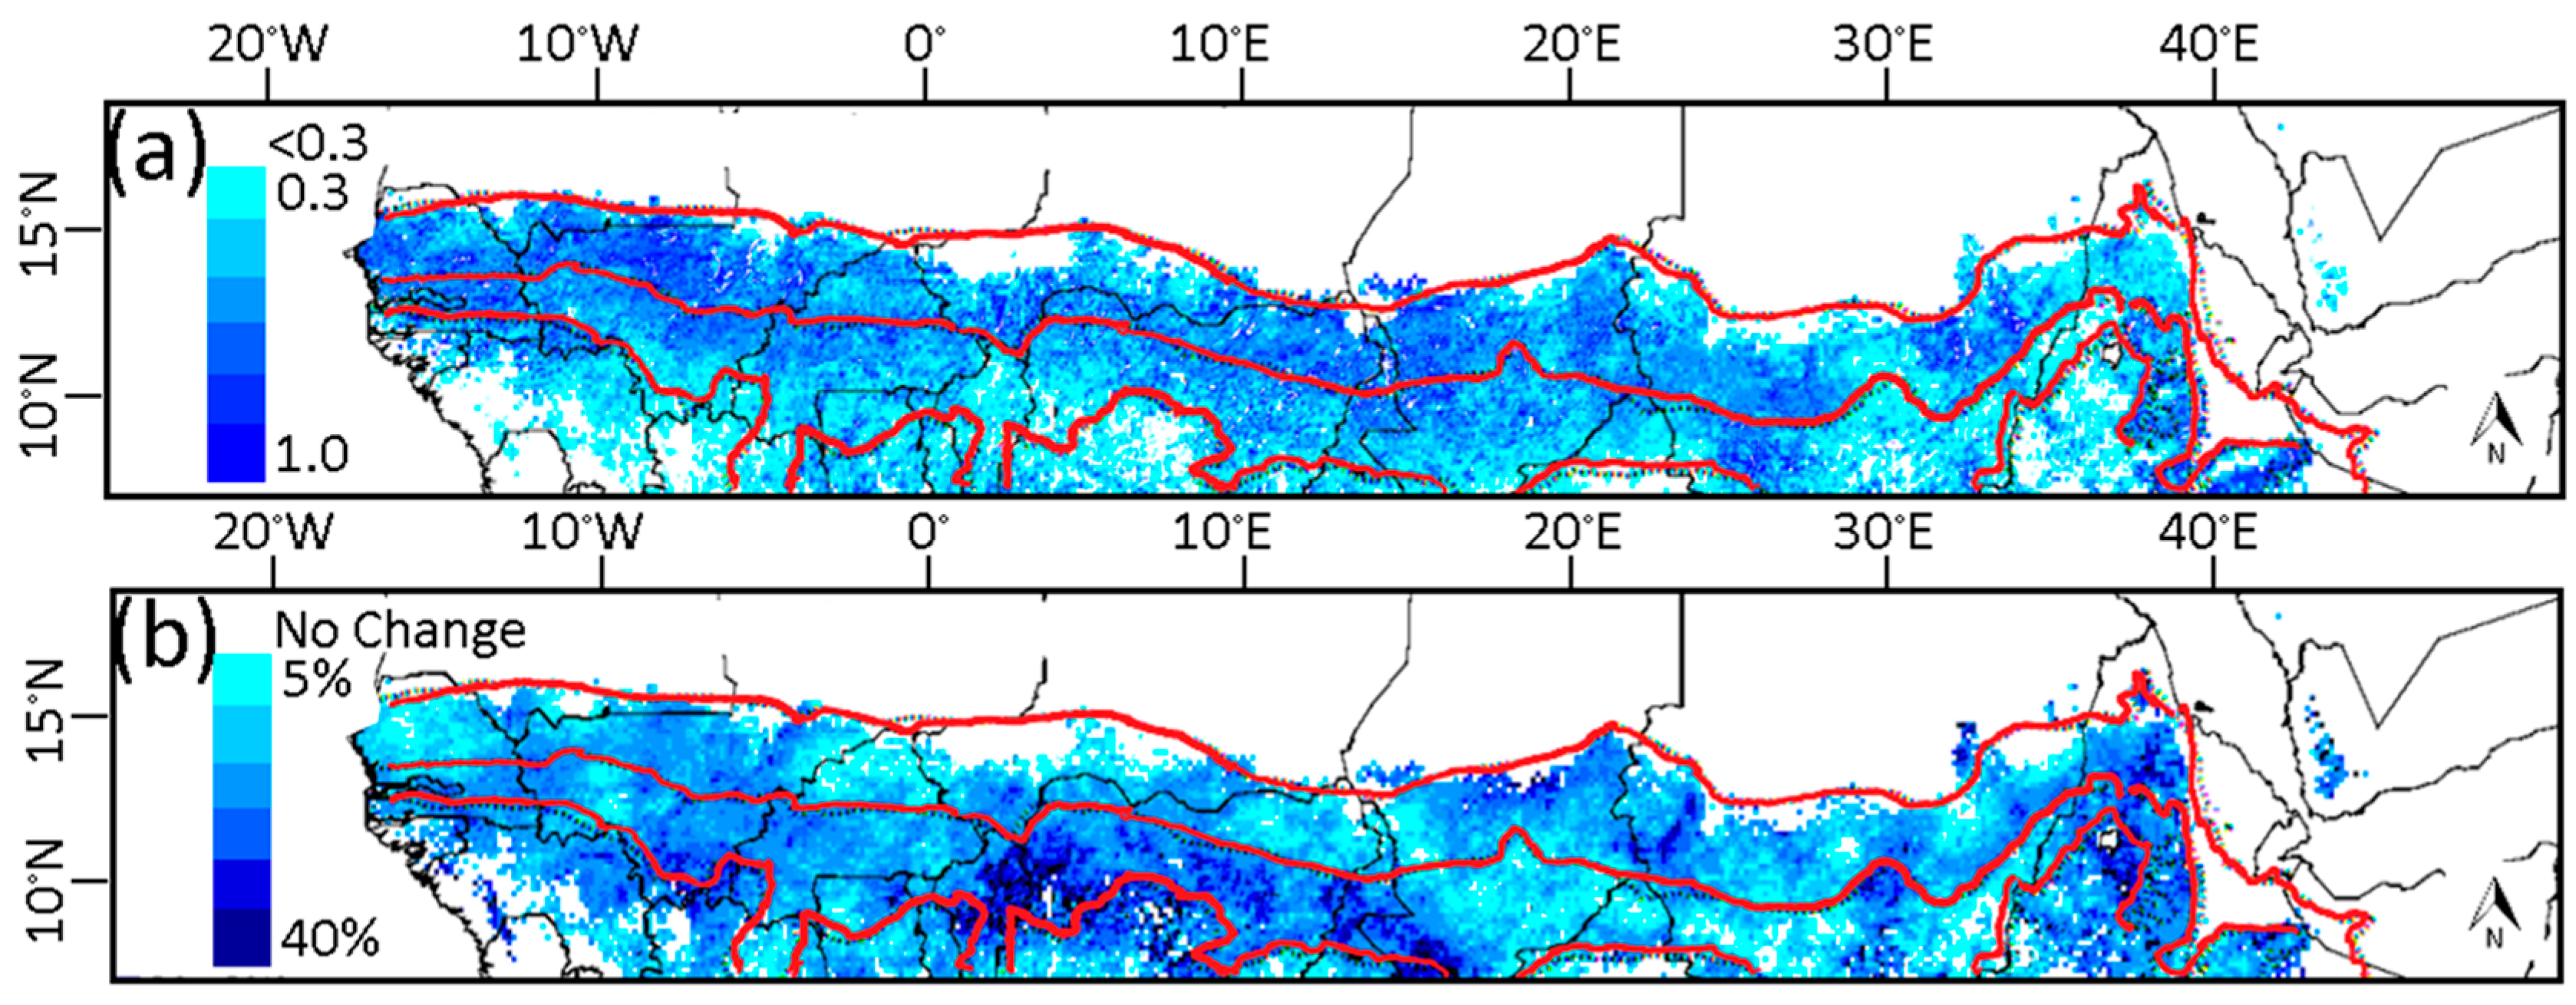
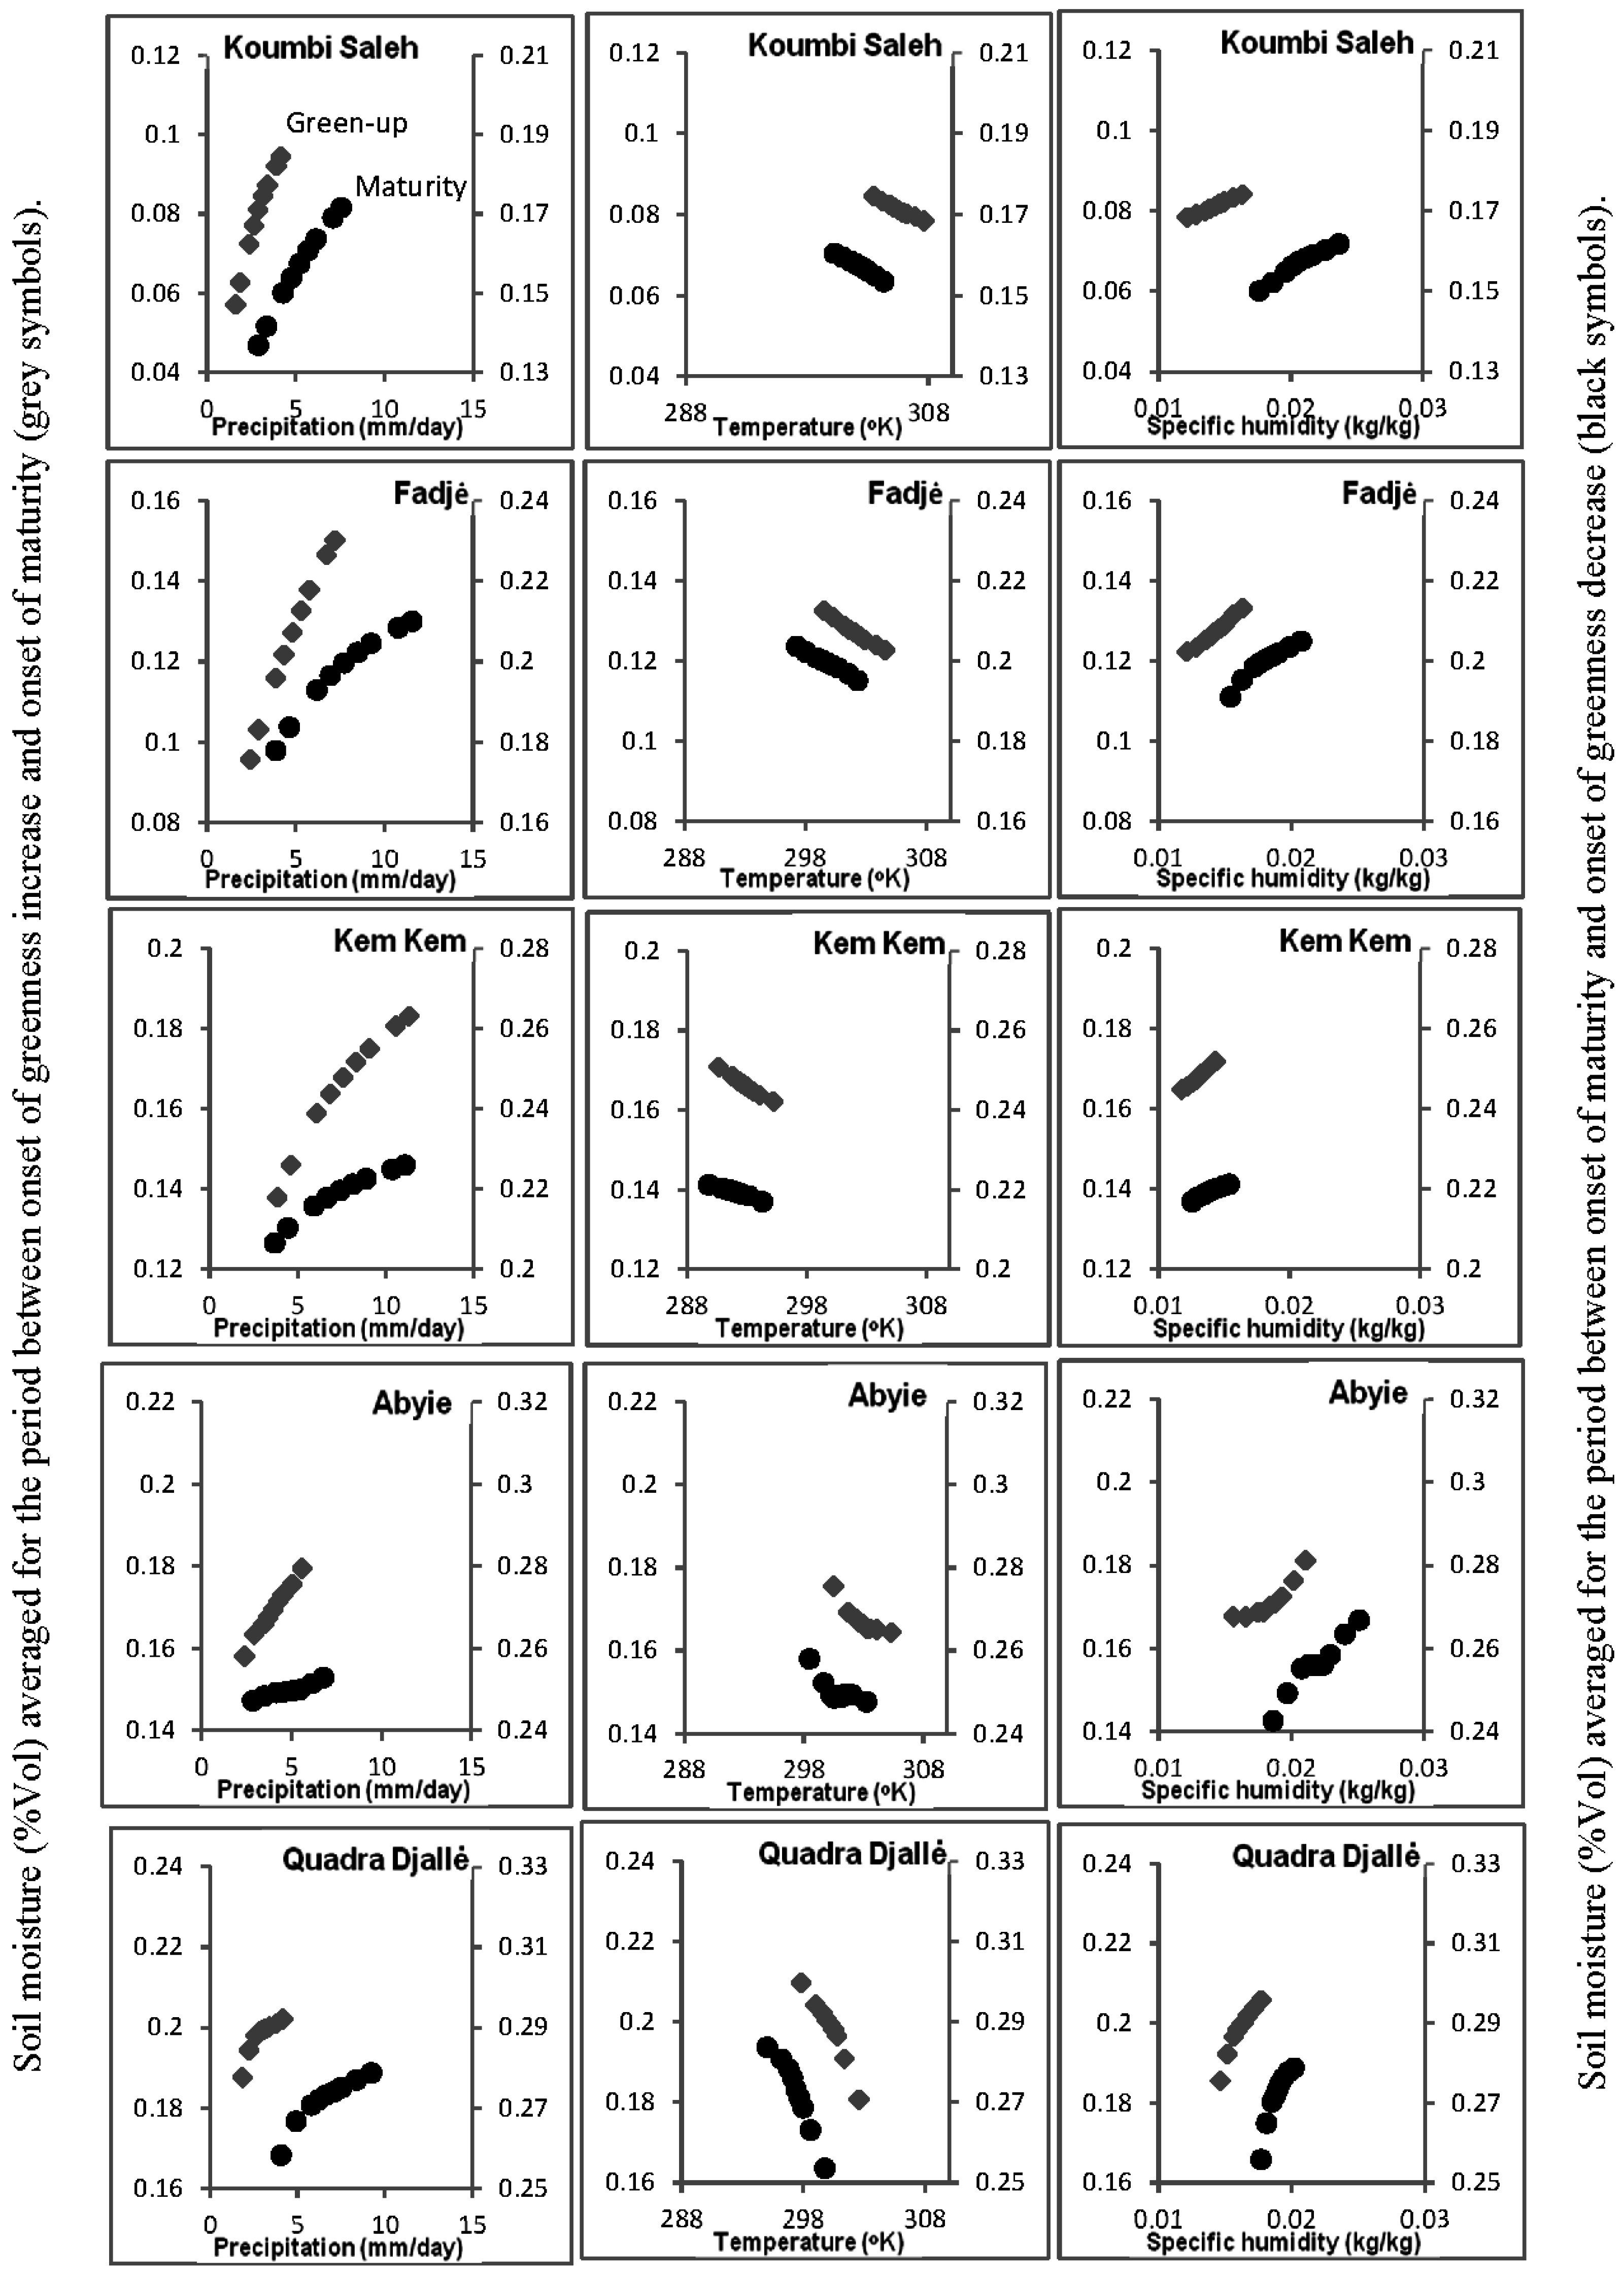
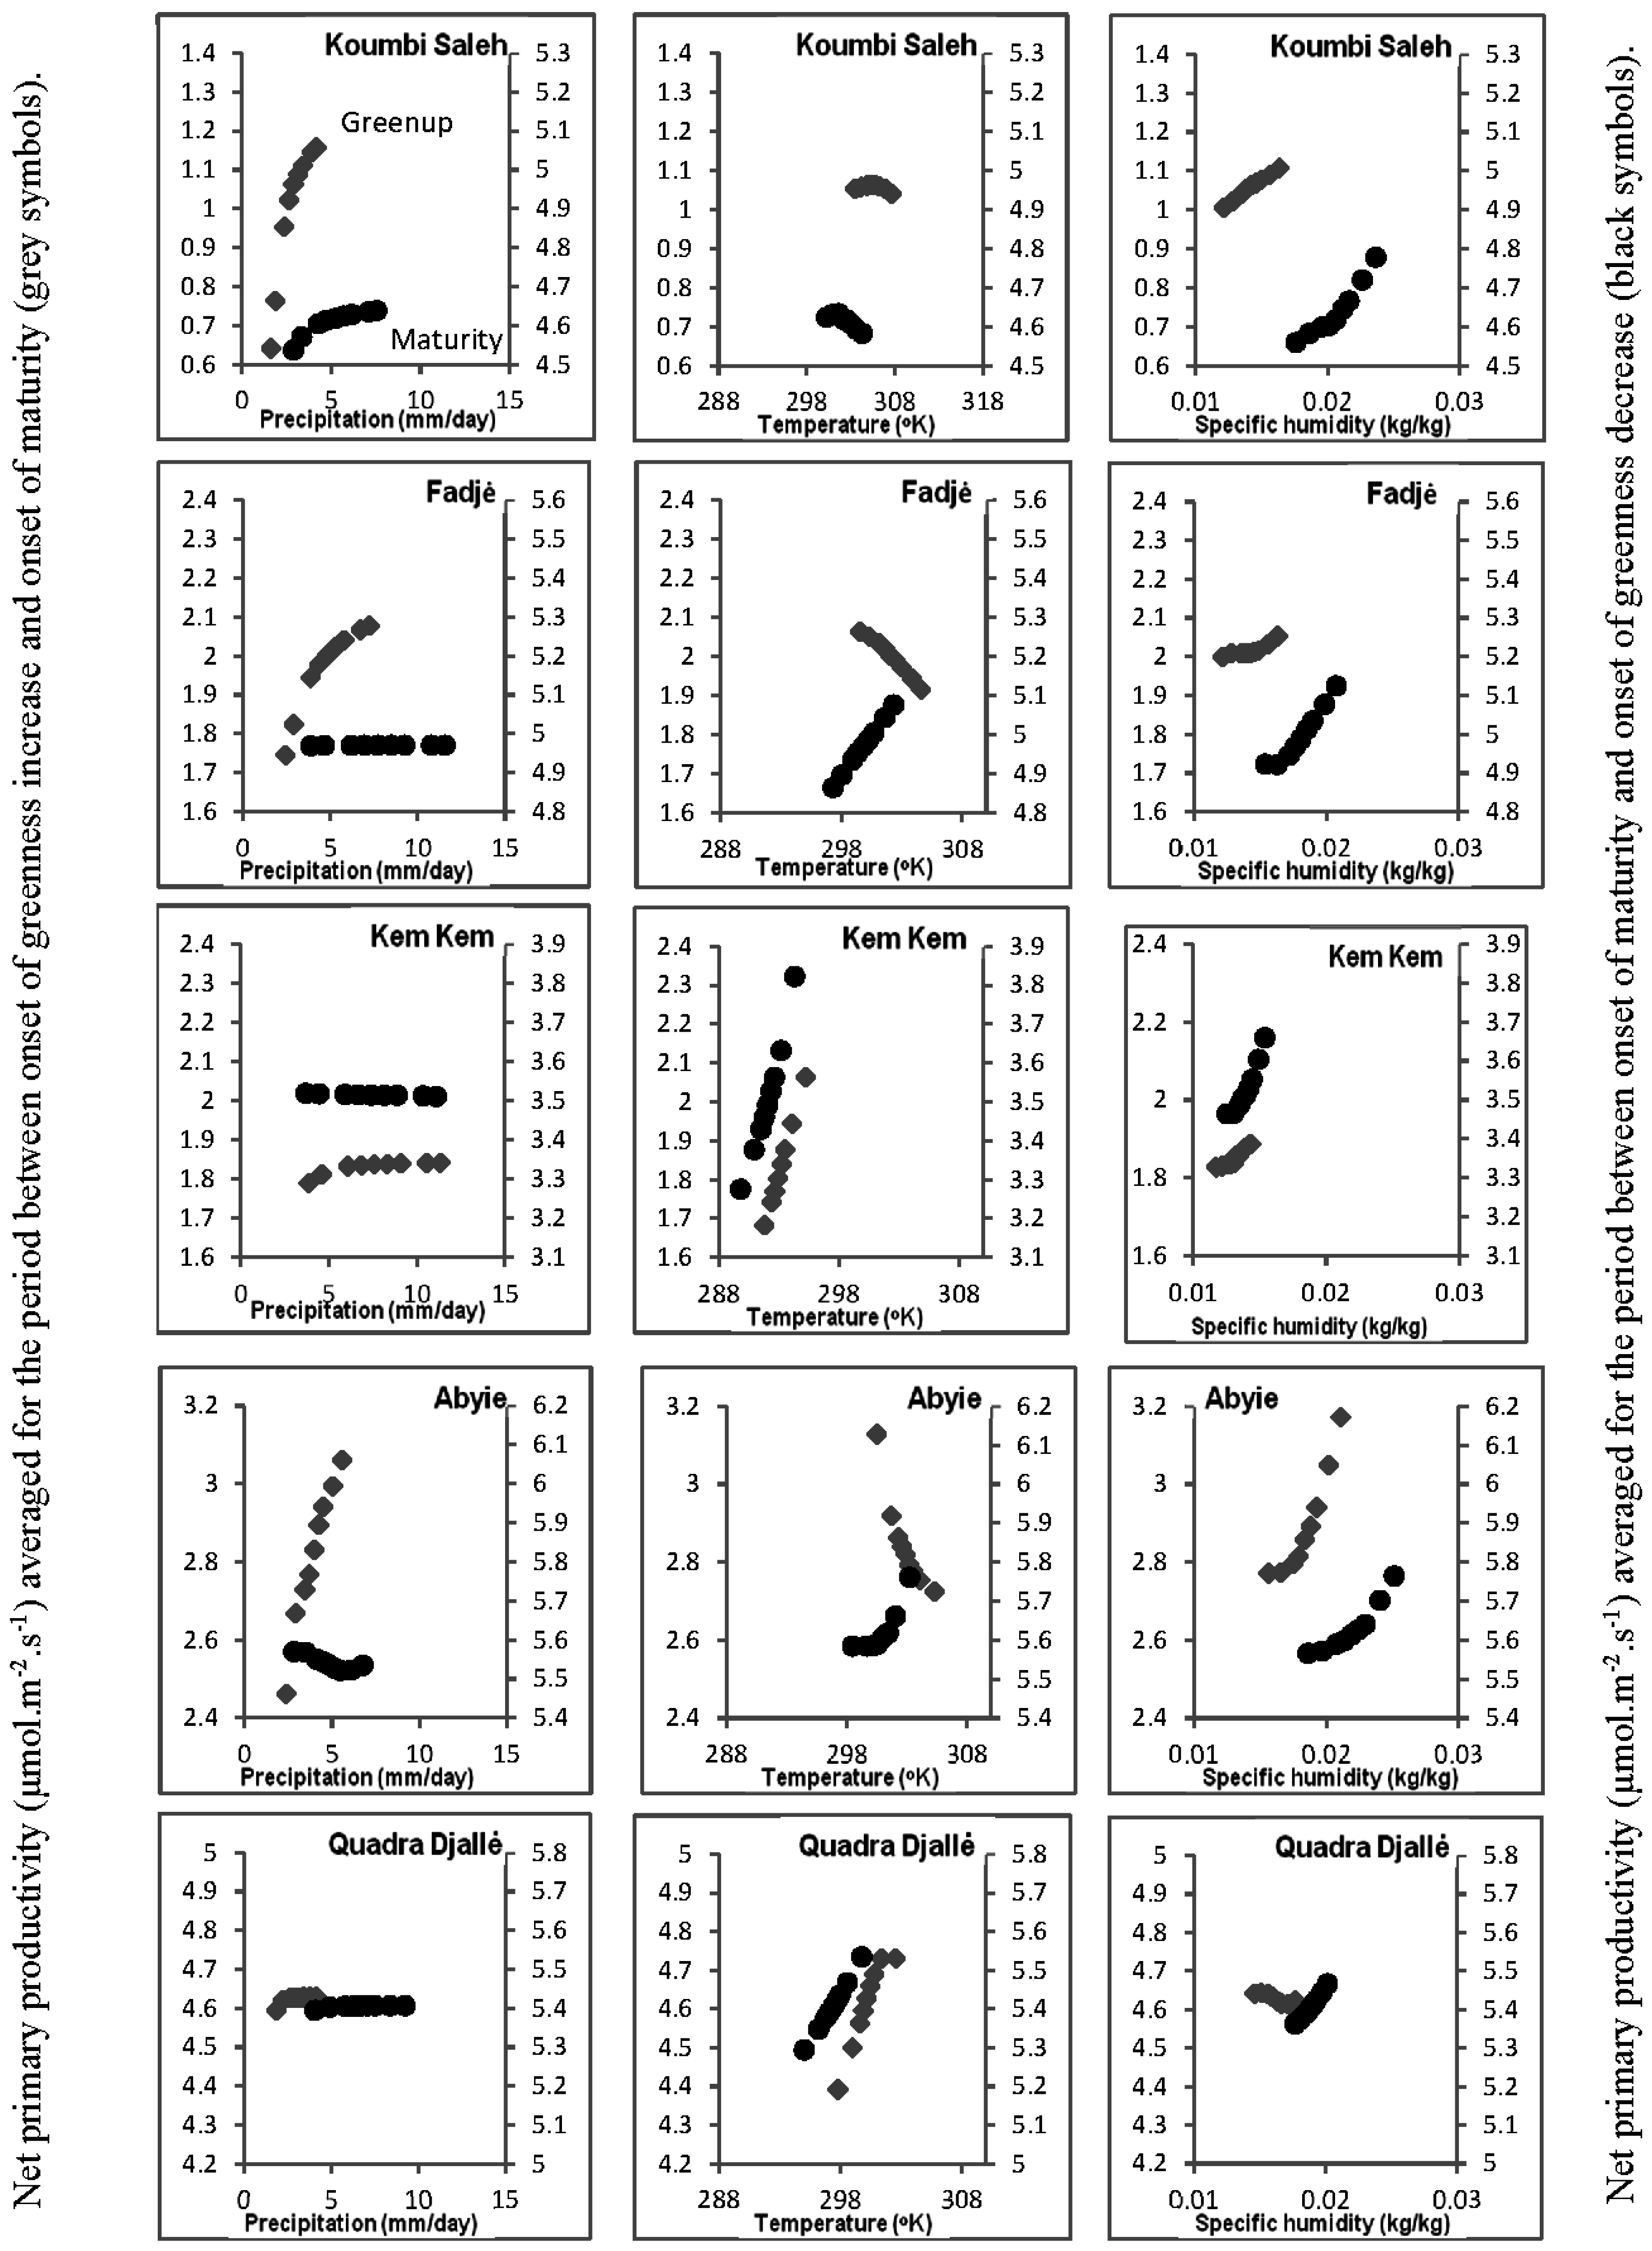
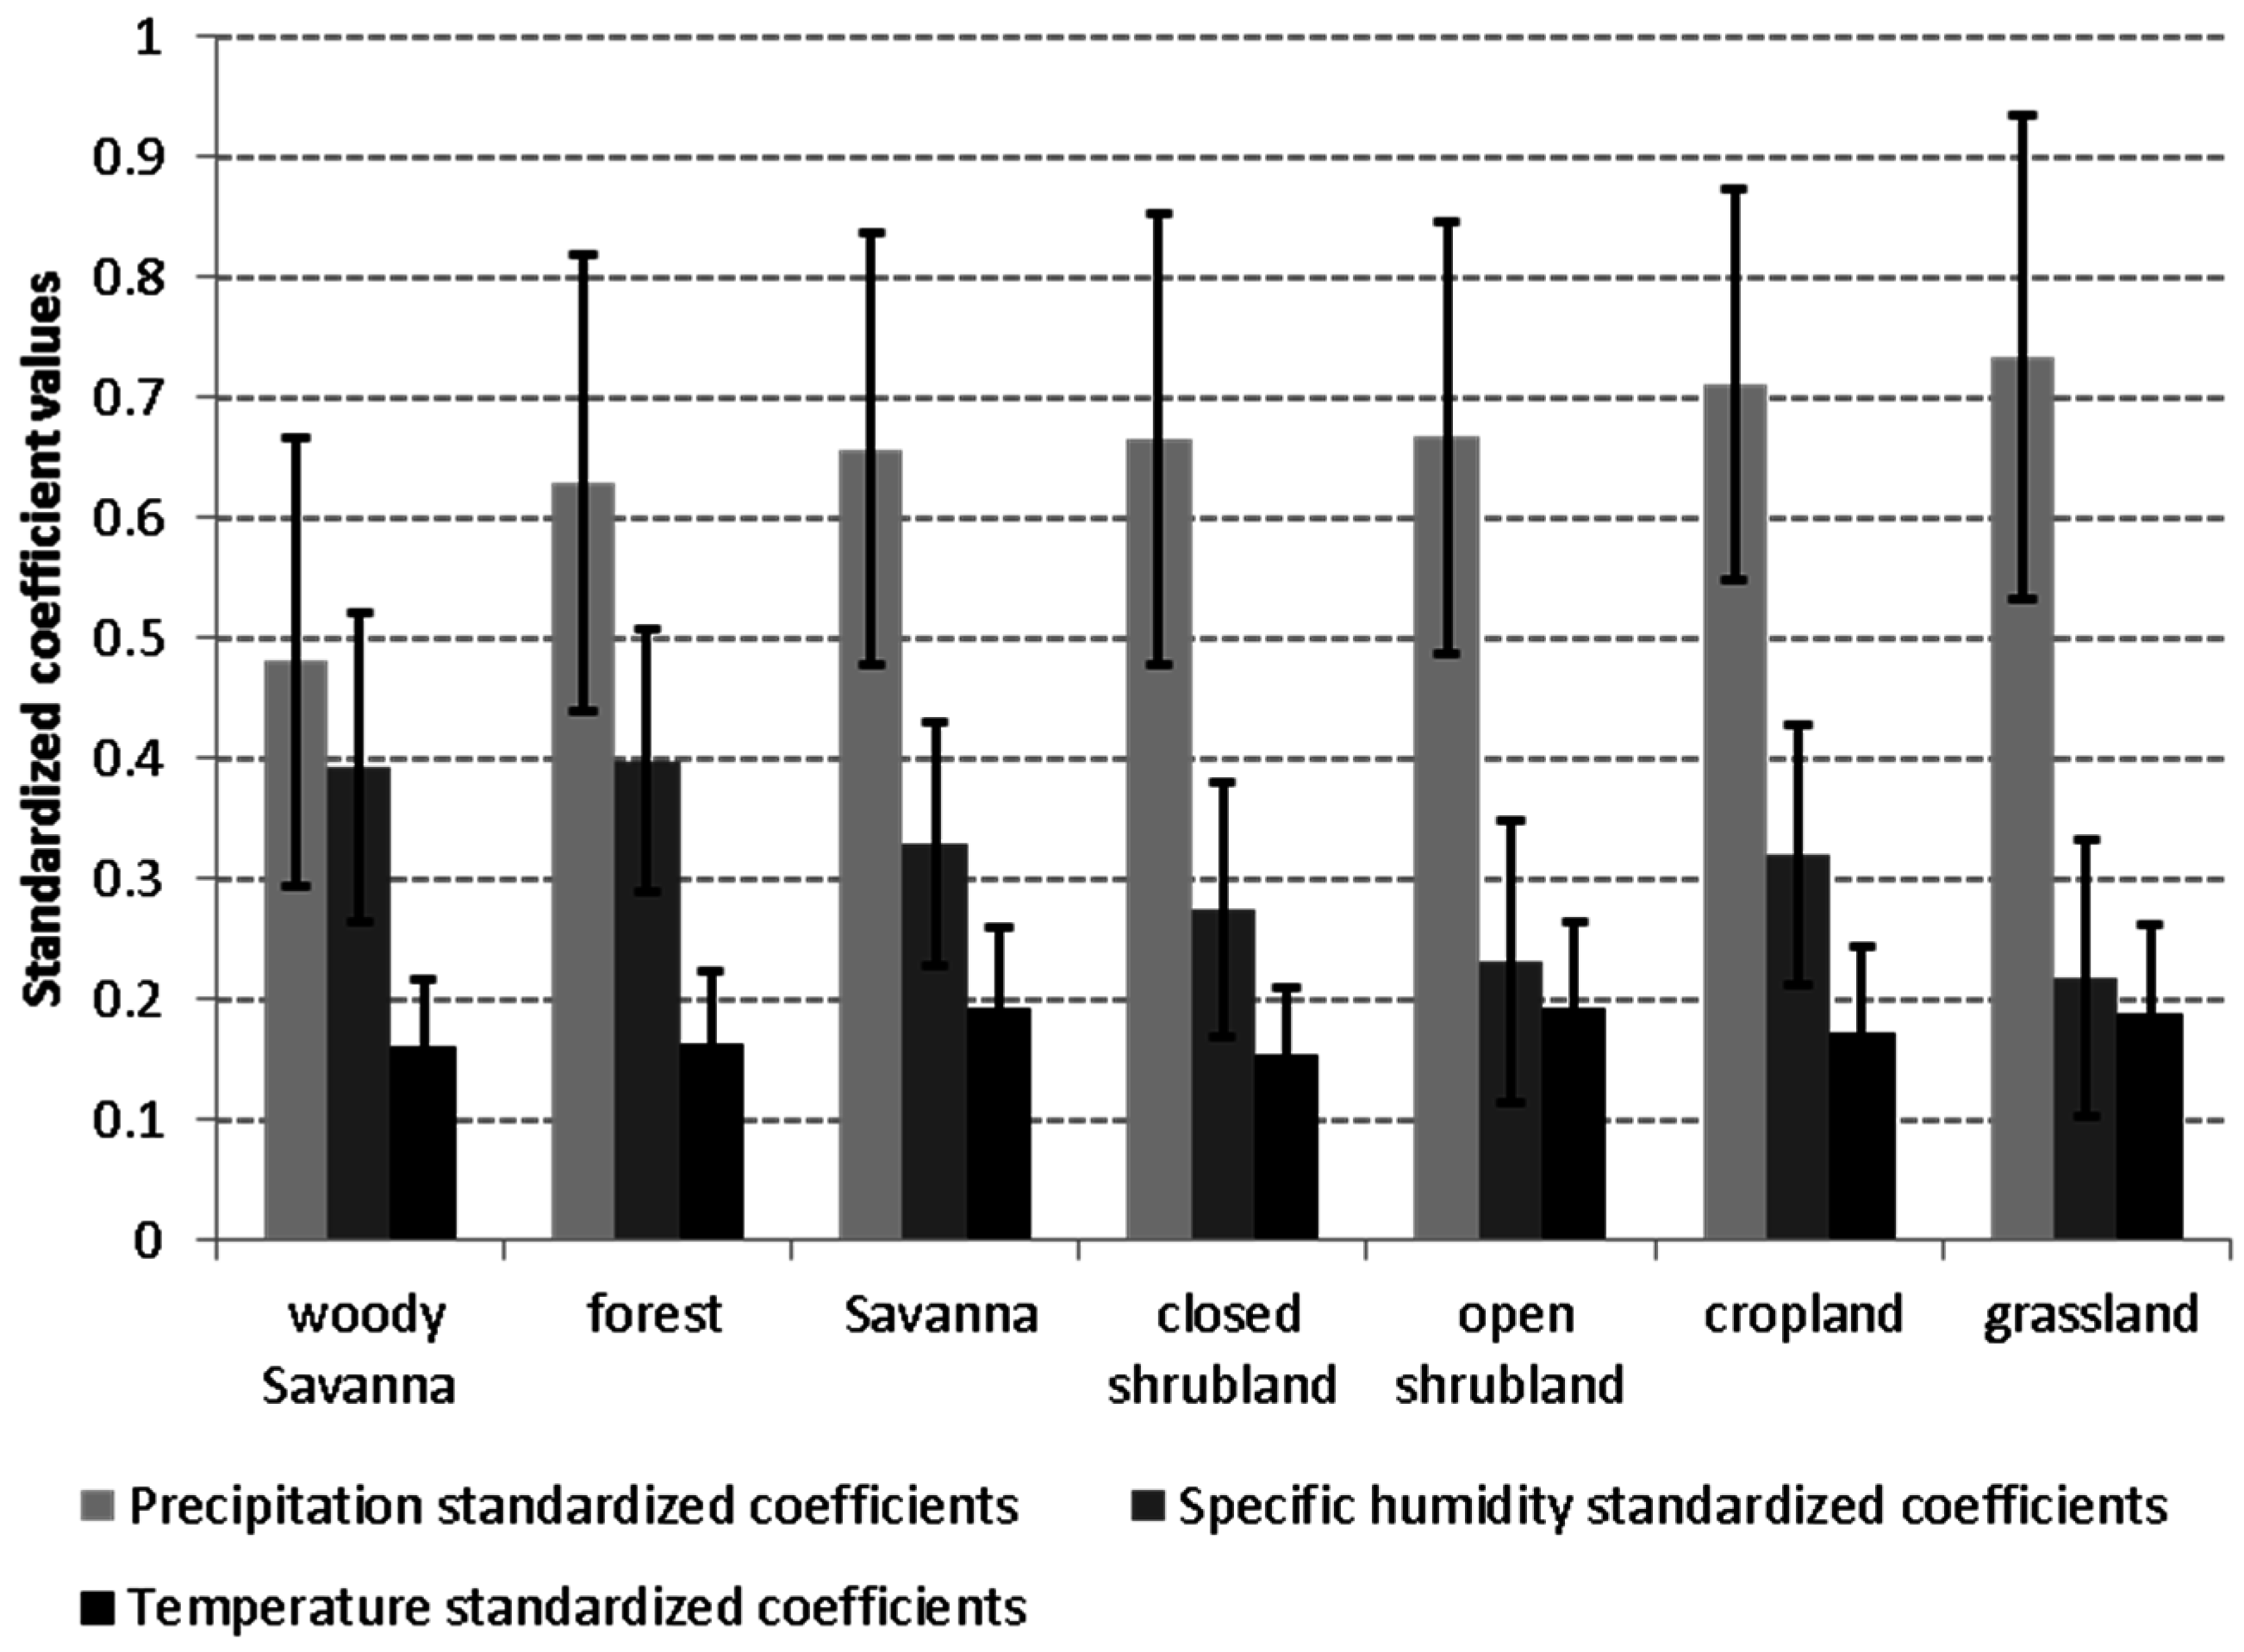
3.4. Relationship of Growing Season ΣNDVI with Air Humidity and Temperature

The adjusted r2 of the multivariate regressions of growing season ΣNDVI on total growing season precipitation, specific humidity and temperature are shown in Figure 8a. Compared to the growing season ΣNDVI-rainfall relationships, adding specific humidity and temperature increased the ability of the models to account for NDVI variation (Figure 8b). On average, the largest gains in the percentage NDVI variance explained were to the south of the 700 mm rainfall isohyet (Figure 8b). However, the relationships remained insignificant in the humid coastal Guinean zone. This might be due to the saturation of NDVI at high values of LAI [87,88], to the persistence of cloud cover which adversely affects the quality of ΣNDVI values [69], or to the influence of other climatic and non-climatic factors on net primary productivity (NPP), such as low plant nutrient availability or low incident photosynthetic radiation [61,89].
The regression coefficients calculated for every grid cell provided a statistical estimate of the mean rate of change in ΣNDVI in relation to variations in rainfall, humidity, and temperature (i.e., precipitation coefficient). The highest precipitation coefficient values (0.08–0.1 ΣNDVI·mm−1) were evident in the arid margins whereas the lowest (0.01–0.02) were in the wetter parts of the study area (Figure 9a). Conversely, the humidity coefficient values were generally the lowest in the northern arid zone (Figure 9b). The temperature coefficient values, on the other hand, differed in sign with spatially coherent positive ΣNDVI relationships with temperature evident in the Bongos mountain range (in western Southern Sudan and northern Central African Republic) and in northern Ethiopian highlands (Figure 9c), while negative ΣNDVI relations to temperature were more common in the arid zone (300–700 mm).
A negative exponential pattern emerged when the precipitation coefficients were plotted against rainfall climatology (Figure 10a). However, there were some wet sites with comparatively high precipitation coefficients (green circle; Figure 10a). These were generally associated with the agricultural landscapes in eastern Ghana, southern Benin and Togo (Figure 9a). In these landscapes, the percentage of land used for farming was estimated to range between 45%–90% of the total area [90]. Here the high ΣNDVI was probably caused by irrigation rather than local rainfall as a result of several small, periurban irrigation systems [91] and large irrigation projects in the Ouémé Catchment in Benin [92] and the Volta river basin in Benin, Togo and Ghana [93]. In contrast, a positive linear pattern emerged when the humidity coefficients were plotted against rainfall climatology (Figure 10b) and there was no distinctive relationship between temperature coefficients and rainfall climatology (not shown).
The standardized coefficients of the multivariate regression models were calculated to estimate the relative contributions of growing season precipitation, specific humidity and temperature on ΣNDVI variations. When summarized for the land cover types in the study area, precipitation emerged, on average, as the primary factor influencing NDVI, followed by specific humidity and then temperature (Figure 11). Except in woody savanna and forests, the precipitation standardized coefficients were significantly higher (p < 0.01) than the standardized specific humidity coefficients and approximately three to four orders of magnitude higher than the standardized temperature coefficients (Figure 11). The standardized specific humidity coefficients, on the other hand, were significantly higher (p < 0.01) than the standardized temperature coefficient in woody savannas and forests but not for the other land cover types (Figure 11).

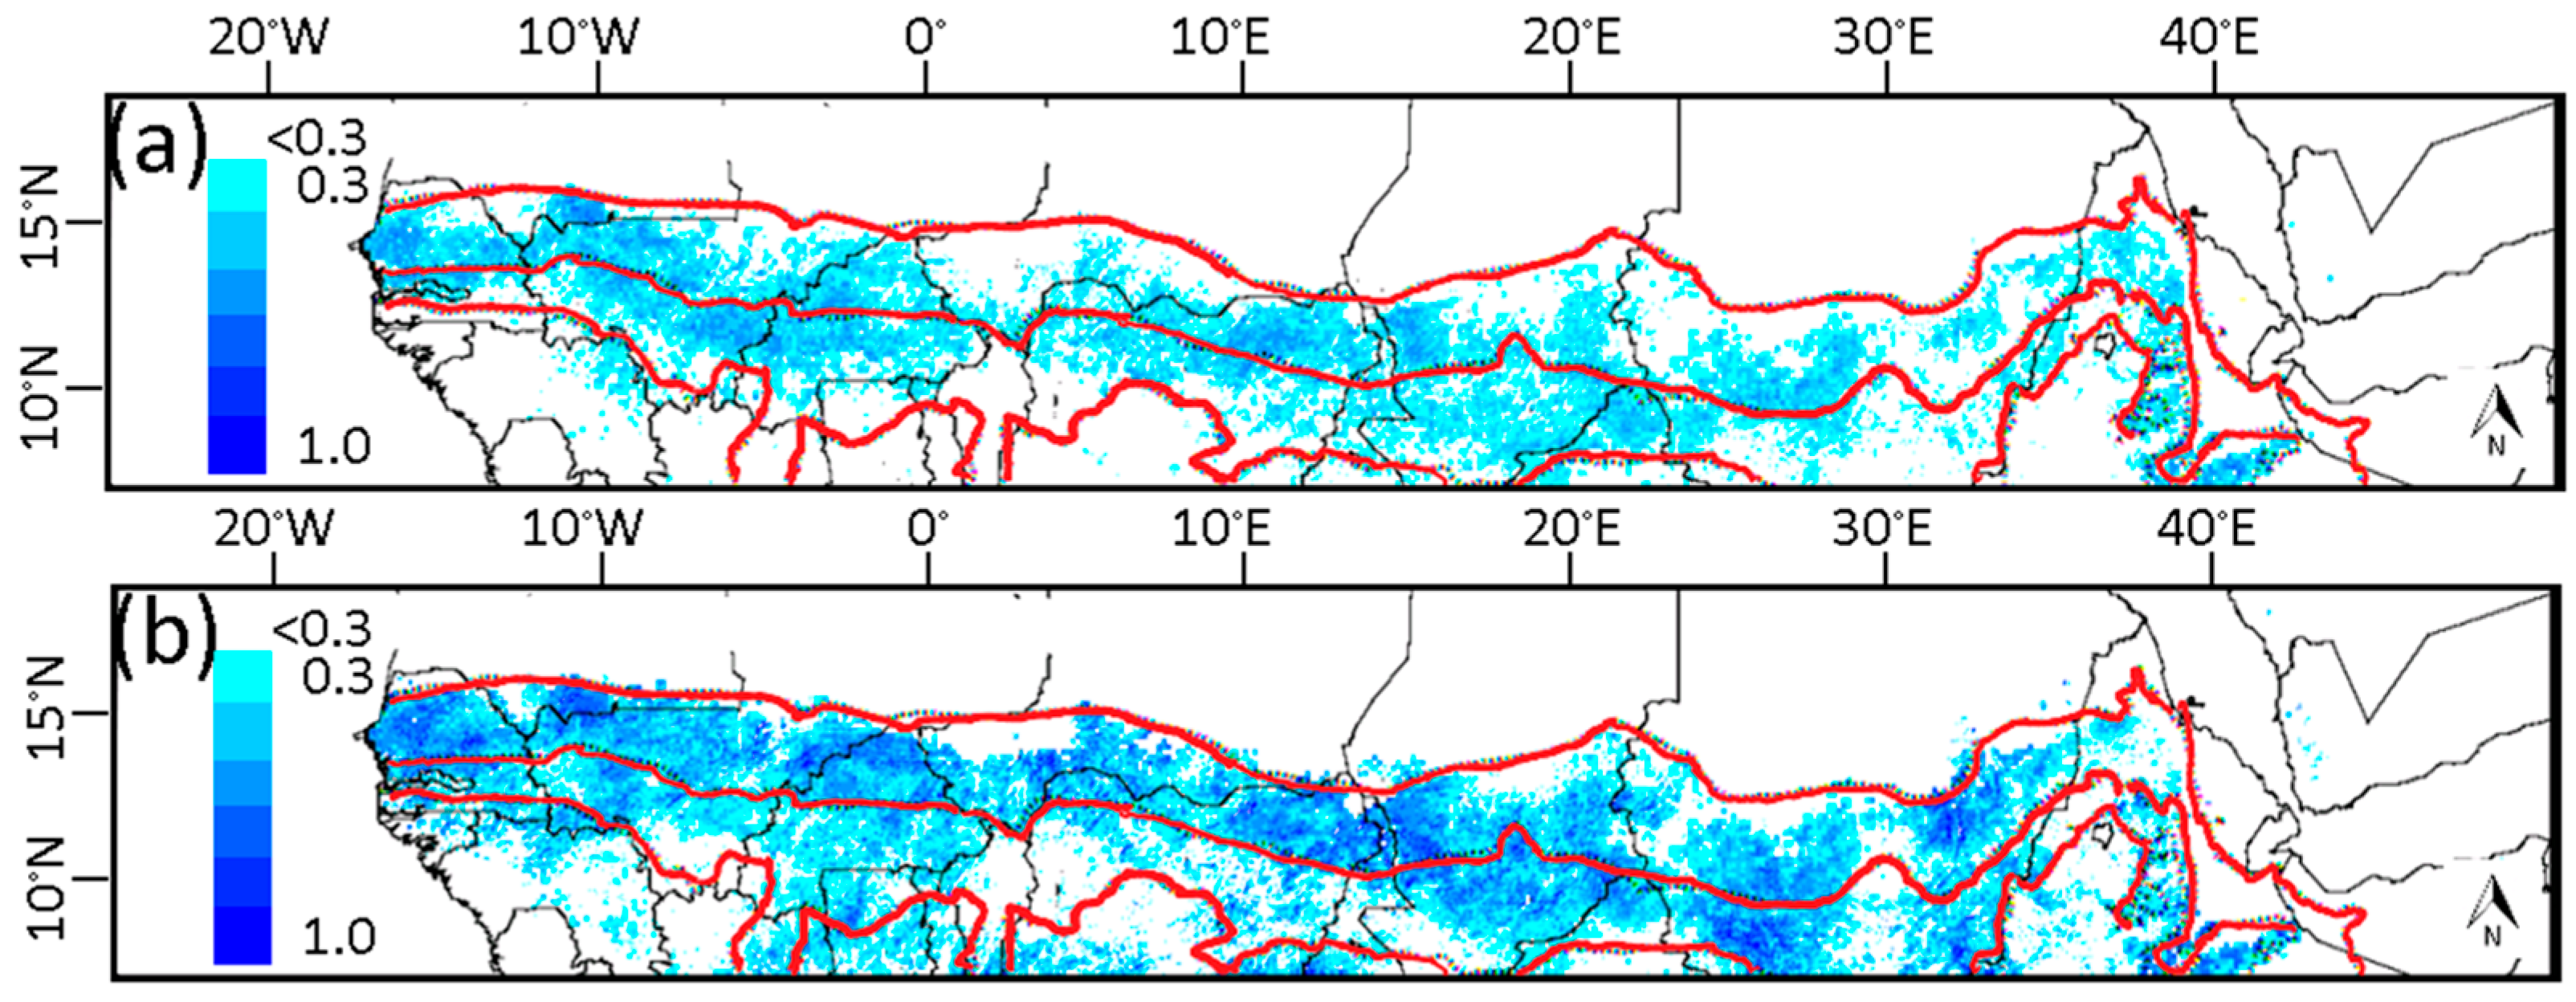
3.5. Soil-Vegetation-Atmosphere Transfer Modeling

The SSiB2 model was used to explore the hydrological and physiological mechanism that can explain the empirical relations found by correlation between meteorological variables and vegetation ΣNDVI. Five sites (Table 1) illustrate the overall results. Koumbi Saleh (southern Mauritania) is the driest and the warmest with a cumulative growing season precipitation of 300 mm, a mean growing season daily temperature of 30.45 °C, and growing season length of 3 months. Fadjė, located to the southeast of Lake Chad, is considerably wetter and 2.5 °C cooler than Koumbi Saleh. Growing season precipitation for the remaining three sites is greater than 650 mm (Kem Kem, Abyie, and Quadra Djallė) but the sites differ greatly in mean growing season temperature and mean growing season specific humidity (Table 1).
The daily modeled responses of soil moisture, stomatal resistance, and NPP to changes in precipitation, air temperature, and specific humidity were summarized for the two periods of the growing season (green-up to maturity, and maturity to senescence) and are shown in Figure 12, Figure 13 and Figure 14. Higher specific humidity reduced evapotranspiration demand (not shown) resulting in higher volumetric soil moisture content in the root zone (Figure 12). Particularly at drier sites or during dry periods, higher volumetric soil moisture content and higher atmospheric vapor pressure combined to increase modeled stomatal conductance (Figure 13) and therefore canopy-scale NPP (Figure 14). In the wetter sites such as, Kem Kem, Abyie and Quadra Djallė, higher specific humidity also increased leaf temperature at a rate of approximately 0.25 °C per unit increase in specific humidity ( g H 2 O k g A i r ) . Higher leaf temperatures (but below the temperature inhibition range) can also increase NPP by increasing the photosynthetic reaction rates [56].
Dry sites such as Koumbi Saleh and Fadjė showed a strong increase in NPP in response to precipitation during the greenup period, and somewhat less in the maturity period (Figure 14). In the wetter sites Quadra Djallė and Kem Kem, there were no noticeable changes in modeled NPP in response to precipitation during either the greenup or maturity periods (Figure 14). At these sites changes in soil moisture content in response to precipitation (Figure 12) did not induce noticeable changes in stomatal resistance (Figure 13) and hence NPP. The productivity in these sites, however, was sensitive to changes in temperature where increases in temperature increased modeled NPP (Figure 14). The woody savanna site (Abyie) which is wetter than Kem Kem but drier than Quadra Djallė showed a strong increase in stomatal conductance and NPP in response to precipitation during the greenup period but no responses during the maturity period (Figure 14). At Abyie and Fadjė, changes in temperature produced contrasting responses in modeled NPP (Figure 14). During the maturity period, when productivity was not limited by available soil moisture, productivity responded positively to higher temperatures. However, during the green-up period when soil moisture levels were comparatively lower (Figure 12), higher temperature lowered productivity.

4. Discussion

Rainfall is usually assumed to be the only significant environmental factor that determines primary production in drylands [55,94,95]. However, the statistical and process modeling reported here indicated a wider range of environmental variables related to primary production and regional differences in the importance of these factors.

4.1. Relationship of ΣNDVI and Climate Variability

In arid and semi-arid regions, NPP and ΣNDVI have been shown to have a strong relationship with precipitation [23,24,96]. Indeed, average NPP has been shown to increase linearly or near-linearly with mean annual precipitation, to an upper limit [23,60,97,98]. However, the interannual variability in NPP does not always exhibit such a strong relationship, as evidenced by the weak correlations between annually summed NPP and rainfall [3,26,29,99] and between ΣNDVI and rainfall [4,64,100]. Similarly, in this study, the correlations between annually summed NDVI and rainfall, in general, did not reveal strong relationships, yet there were some systematic, though weak, correlations in areas receiving intermediate precipitation (Figure 4 and Figure 5). Others (e.g., [64,100]) have also noted that the degree of ΣNDVI variance explained by rainfall can be high in some areas and low in others with weak to insignificant relationships more common in the dry and wet margins of the Sahel.
The apparent lack of ΣNDVI response to additional precipitation in the dry sub-humid Sahel may be caused by the low sensitivity of fPAR, and thus NDVI, to additional rain during wet years [25]. Another plausible explanation is that precipitation in the wetter areas is not the primary factor controlling vegetation growth [29]. The simulations of net primary productivity in the dry sub-humid areas such as at Quadra Djallė and Kem Kem (Figure 14) shown here revealed little or no sensitivity of NPP to variations in precipitation. At these sites, the modeled volumetric soil moisture in the root zone remained above approximately 14% by volume (Figure 12) which is unlikely to induce acute water stress, stomatal closure and a drop in NPP (Figure 13). Similarly, modeling results [27] suggested that the woody plant associations in the wetter parts of the Sudanian and the Guinean ecoclimatic zones had sufficient soil moisture to meet evapotranspiration demands even during years with below-average precipitation.
The variance of ΣNDVI explained by rainfall in the northern boundary of the Sahel was generally low. This was unexpected since several studies have reported a strong coupling between NDVI and rainfall there (e.g., [22,25,88,89]), however, those analyses used time-series of moving average monthly precipitation and ΣNDVI data although successive values in their series were usually highly autocorrelated [22]. Regression of autocorrelated variables can cause overestimation of the strength and significance of the relationship [101]. Whether the differences between the strength of the relationship found here and those reported by others were the result of using different integration periods cannot be deduced from the current analysis.
In the arid and semi-arid Sahel the correlations between growing season rather than annual integrated ΣNDVI and precipitation totals were generally higher (Figure 4 and Figure 5), confirming that occasional rainfall outside the main growing season has little effect on vegetation production [24,38,102,103,104]. Long periods of drought following early rain, the probability of which increases as the climate gets drier northwards [105,106,107], have been found to kill the seedlings of fast-germinating species favoring those with long-lived seed banks which have reserves of seeds that germinate when the rainy season resumes [40,41]. On the other hand, rains falling later cannot be used for production by most annuals irrespective of the amount of precipitation, since vegetative growth ends with fructification, a date set by sensitivity to photoperiod [3,108].
Interestingly, the geographical distribution of the precipitation coefficients (Figure 9a) was correlated with precipitation totals; higher precipitation coefficients in dry areas and lower in wet areas (Figure 10a) [108,109]. Analysis of eddy-covariance measurements across a range of vegetation types and climate zones in Africa [60], found that NPP at the wetter sites varied over a narrow range in relation to precipitation variability, whereas NPP at the drier sites responded more strongly. The maximum photosynthetic response to precipitation variation was greater for grasses in dry areas than for trees in wetter areas, which has been attributed to the differences in the photosynthetic pathways of trees (C3) and grasses (C4) [60]. It could also be that the differences are a result of the non-linearity of soil moisture response to precipitation in the wetter areas (Figure 12) where high precipitation rates can saturate infiltration and lead to surface runoff, so additional precipitation does not increase soil moisture and photosynthesis.
In contrast to the ΣNDVI–rainfall relations, specific humidity coefficients (Figure 8b) were higher in the wetter areas (Figure 10b). Unfortunately, this could not be compared to eddy-covariance studies since they usually report the relationship of net photosynthesis to vapor pressure deficit rather than to specific humidity. Mechanistically, however, high specific humidity may restrict evapotranspiration-driven reductions in soil water thus alleviating plant soil water stress. On the other hand, low specific humidity may increase evapotranspiration demand resulting in a net decrease in soil moisture availability [27]. The combination of soil moisture stress and low specific humidity was found to increase stomatal resistance which in turn decreased productivity (Figure 12, Figure 13 and Figure 14).
Surprisingly, the ΣNDVI-temperature relations differed between the two directions of change (Figure 9c). The effects of temperature on plant growth are largely mediated by its effects on chemical reactions (e.g., photosynthesis and respiration) and its effects on soil moisture. On the one hand, photosynthesis reaction rates increase with temperature up to an upper limit beyond which photosynthesis decreases due to the denaturation of proteins. On the other hand, the desiccating effects of higher temperatures can reduce net photosynthesis. The empirical results show that for some areas in the Ethiopian highlands, the Guinean ecoclimatic zone and from western South Sudan to southern Chad growing season temperature was positively related to ΣNDVI. These and the modeling results at the Kem Kem (Ethiopian highlands) and the Quadra Djallė sites (Bongos Mountains) (Figure 14) suggest that increases in temperature-dependent photosynthetic reaction rates may counter the desiccating effects of higher temperature. However, global studies of climatic limits on plant growth do not identify temperatures as an important factor influencing vegetation growth in either the Ethiopian highlands or in the Bongos Mountain range, rather they suggest that vegetation growth in these areas is primarily limited by incident photosynthetic active radiation (PAR) [6,110]. The influence of PAR on vegetation production was not investigated here owing to the low spatial resolution (2.5°) of the data available at the time.
The suggestion [38] that an intensified hydrological regime would increase NPP in xeric environments while reducing NPP in mesic environments was not verified in the present study. The suggestion was based on the assumption that, in xeric environments, the proportional losses of precipitation to canopy interception and to evaporation would be reduced if the precipitation event size increased and that this reduction would offset or even exceed the volume of water lost to runoff, thereby increasing soil water availability [38]. In the present study, throughout most of the Sahel, an intensified precipitation regime (higher variance and lower skewness) was inversely related to ΣNDVI values. This difference in frequency and total rainfall in the drier and wetter parts of the Sahel has been reported for the interannual scale using annual sums of NDVI (e.g., [2]) and the present work adds an intra-annual component. The proportional effects of reductions in evaporation due to an intensified precipitation regime might be less than theorized as the percentage of total precipitation that falls in very small events (<7 mm/day) in the Sahel is minimal [10,111,112]. Thus it is plausible that larger precipitation events with longer intervening dry periods would lead to greater drying of the soil and reduce NPP.

4.2. Phenological Transition Dates

The “onset of greenness increase” was characterized by a pronounced north-south gradient with onset dates detected as early as February at lower latitudes (7.5°N) and as late as August at higher latitudes (17.5°N). The “onset of greenness decrease” also had a pronounced north-south gradient but with the onset dates earlier at higher latitudes (late August) than at lower latitudes (late October). Both dates were also found to vary between years with grasslands in arid region showing the highest interannual variability. On average, the length of the growing season (the difference between the two dates) varied from approximately 20 days at the southern edge of the Sahara Desert to approximately 250 days in the wetter parts of the study area (Figure 3). The spatiotemporal variability in the timing and duration of the growing season throughout the Sahel , clearly indicated that daily data are needed to monitor the shorter growing seasons It also indicates that interannual changes in ΣNDVIgs cannot be adequately captured using a standard integration period such as the June, July, August (JJA) period usually used to define the start and end of the growing season (e.g., [100,109]). Rather than using a standard integration period, growing season sum NDVI and meteorological data were calculated here by integrating daily values bounded by the interval between the two transitions dates; i.e., the onset of greenness increase and the onset of greenness decrease.
The interannual variation in the timing of greenup was highest in the arid regions dominated by grasslands, for which there are several possible causes. In the Sahelian eco-climatic zone, the onset of the summer monsoon in successive years can vary by more than 30 days [18]. After the start of the wet season, above ground biomass production starts when seedlings establish their root system [3]. This is followed by rapid growth that produces a detectable increase in NDVI. However, the length of time between the start of the wet season and rapid growth has also been found to vary between years [3]. In this study, in general, the interannual variation in the timing of green-up decreased from north to south probably because of the lower interannual variability in the onset of rainy season at lower latitudes [10].

5. Conclusions

Vegetation growth and rates of development in arid and semi-arid Sahel were, as expected, generally related to precipitation but it was also found that air humidity and temperature have a significant role, in agreement with several recent modeling studies [27,61]. The magnitude of the effects of these three variables varied geographically, between vegetation functional types and elevation. Inaccuracies in the reconstructions of daily AVHRR NDVI and of the independent variables, particularly meteorological data, may influence these conclusions. Despite these possible shortcomings, it was evident that vegetation dynamics in the Sahel and their environmental correlates are more complex than equilibrium relationships between growing season precipitation and NPP variation.
One surprising result was that the vegetation, particularly at the wetter sites, did not always respond directly and proportionately to variations in soil moisture. Model simulations showed that, while variations in meteorology were indeed found to significantly alter soil moisture, this did not always increase production. The changes in vegetation productivity at the wetter sites were either dampened or enhanced by the direct effects of temperature and humidity on leaf temperature and stomatal conductance. These results were based on modeling and should be generalized with caution; for example, it is known that, in some regions, antecedent rainfall affects productivity in the following year [4]—so called lags—but interannual processes are not simulated in SSiB.
Seasonal precipitation distribution also influenced productivity. For the same total precipitation amount, productivity was higher when precipitation arrived in more frequent and less intense precipitation events. The suggestion [38] that vegetation productivity in xeric environments responds favorably to more intense and less frequent precipitation events was not supported.
The effects of precipitation, temperature and humidity on productivity were geographically coherent [109], suggesting fundamental causes. Unfortunately, the lack of a dense network of observational data meant that the emergent spatial patterns found here could not be analyzed further. Still, it is worth noting that the general patterns were compatible with previous modeling studies [27] and observational data from the few flux tower measurements from the study area [60].
One application of these results concerns the detection of anthropogenic dryland degradation (“desertification” [113,114,115]). Fundamentally, the term “degradation” implies a comparison with an explicit, standard, base-line, or reference condition, so no measure of degradation is useful unless the condition in the absence of degradation is first known. However, as shown in this study, NPP is strongly affected by meteorological variables and so any degradation caused by human activities or other, non-meteorological factors can only be inferred if these meteorological effects are first eliminated or at least controlled by normalization. An early method [46], which, explicitly or implicitly, is still widely used (e.g., [94,100,116]) is rain use efficiency (RUE) in which the NPP for each site is simply divided by its precipitation, and the maximum values in a region are taken to be a non-degraded reference. However, the results reported here and by others show that precipitation is not the only meteorological variable that affects NPP. Thus a more accurate normalization should use more complete relationships. Clearly, the selection of the appropriate model, acquisition of the necessary variables for each geographical location, and the need for additional meteorological data require more effort, but the potential errors caused by omission of the dependencies uncovered in the present study strongly support the need for improvement of the normalization.
The results indicate clearly that vegetation dynamics in the Sahel and their environmental correlates are more complex than statistical relationships between growing season precipitation and variation. The spatially explicit representation of these relationship presented here provide a new dimension to rainfall–productivity relationships in the Sahelian-Guinean ecoclimatic-zones.

Acknowledgments

This work was partly supported by NASA grant 000420 (NASA-Goddard Space Flight Center) (PI S. Prince) and was used in partial fulfillment of K. Rishmawi’s doctoral dissertation. Many thanks to Hasan Jackson who helped in the preparation of this manuscript.

Author Contributions

Khaldoun Rishmawi conceived and designed the experiments; Khaldoun Rishmawi performed the experiments; Khaldoun Rishmawi, Stephen Prince, and Yongkang Xue analyzed the data; Stephen Prince and Yongkang Xue provided the software and computer used for analyses; Khaldoun Rishmawi and Stephen Prince wrote the paper.

Conflicts of Interest

The authors declare no conflict of interest.

References

  1. Fuller, D.O.; Prince, S.D. Rainfall and foliar dynamics in tropical southern Africa: Potential impacts of global climatic change on savanna vegetation. Clim. Chang. 1996, 33, 69–96. [Google Scholar] [CrossRef]
  2. Olsson, L.; Eklundh, L.; Ardo, J. A recent greening of the Sahel—Trends, patterns and potential causes. J. Arid Environ. 2005, 63, 556–566. [Google Scholar] [CrossRef]
  3. Hiernaux, P.; Mougin, E.; Diarra, L.; Soumaguel, N.; Lavenu, F.; Tracol, Y.; Diawara, M. Sahelian rangeland response to changes in rainfall over two decades in the Gourma region, Mali. J. Hydrol. 2009, 375, 114–127. [Google Scholar] [CrossRef]
  4. Goward, S.N.; Prince, S.D. Transient effects of climate on vegetation dynamics: Satellite observations. J. Biogeogr. 1995, 22, 549–564. [Google Scholar] [CrossRef]
  5. Fang, J.Y.; Piao, S.L.; Tang, Z.Y.; Peng, C.H.; Wei, J. Interannual variability in net primary production and precipitation. Science 2001, 293, U1–U2. [Google Scholar] [CrossRef] [PubMed]
  6. Nemani, R.R.; Keeling, C.D.; Hashimoto, H.; Jolly, W.M.; Piper, S.C.; Tucker, C.J.; Myneni, R.B.; Running, S.W. Climate-driven increases in global terrestrial net primary production from 1982 to 1999. Science 2003, 300, 1560–1563. [Google Scholar] [CrossRef] [PubMed]
  7. Easterling, D.R.; Meehl, G.A.; Parmesan, C.; Changnon, S.A.; Karl, T.R.; Mearns, L.O. Climate extremes: Observations, modeling, and impacts. Science 2000, 289, 2068–2074. [Google Scholar] [CrossRef] [PubMed]
  8. Solomon, S.; Qin, D.; Manning, M.; Chen, Z.; Marquis, M.; Averyt, K.B.; Tignor, M.; Miller, H.L. Contribution of Working Group I to the Fourth Assessment Report of the Intergovernmental Panel on Climate Change, 2007; Cambridge University Press: Cambridge, UK, 2007. [Google Scholar]
  9. Nicholson, S.E. Climatic and environmental change in Africa during the last two centuries. Clim. Res. 2001, 17, 123–144. [Google Scholar] [CrossRef]
  10. Le Barbe, L.; Lebel, T.; Tapsoba, D. Rainfall variability in west Africa during the years 1950–90. J. Clim. 2002, 15, 187–202. [Google Scholar] [CrossRef]
  11. Hiernaux, P.; Diarra, L.; Trichon, V.; Mougin, E.; Soumaguel, N.; Baup, F. Woody plant population dynamics in response to climate changes from 1984 to 2006 in Sahel (Gourma, Mali). J. Hydrol. 2009, 375, 103–113. [Google Scholar] [CrossRef] [Green Version]
  12. Hulme, M. Climatic perspectives on sahelian desiccation: 1973–1998. Glob. Environ. Chang. Hum. Policy Dimens. 2001, 11, 19–29. [Google Scholar] [CrossRef]
  13. White, F. Vegetation of Africa—A Description Memoir to Accompany the UNESCO/AETFAT/UNSO Vegetation Map of Africa; Unesco: Paris, France, 1983; p. 356. [Google Scholar]
  14. Lehouerou, H.N. The rangelands of the Sahel. J. Range Manag. 1980, 33, 41–46. [Google Scholar]
  15. Lebel, T.; Diedhiou, A.; Laurent, H. Seasonal cycle and interannual variability of the sahelian rainfall at hydrological scales. J. Geophys. Res. Atmos. 2003. [Google Scholar] [CrossRef]
  16. Dieng, O.; Roucou, P.; Louvet, S. Intra-seasonal variability of precipitation in Senegal (1951–1996). Science et Changements Planétaires/Sécheresse 2008, 19, 87–93. [Google Scholar]
  17. Nicholson, S.E. The West African Sahel: A review of recent studies on the rainfall regime and its interannual variability. ISRN Meteorol. 2013. [Google Scholar] [CrossRef]
  18. Sultan, B.; Janicot, S. The west African monsoon dynamics. Part II: The “preonset” and “onset” of the summer monsoon. J. Clim. 2003, 16, 3407–3427. [Google Scholar] [CrossRef]
  19. Dalu, G.A.; Gaetani, M.; Baldi, M. A hydrological onset and withdrawal index for the west African monsoon. Theor. Appl. Clim. 2009, 96, 179–189. [Google Scholar] [CrossRef]
  20. Sultan, B.; Janicot, S. Abrupt shift of the ITCZ over west Africa and intra-seasonal variability. Geophys. Res. Lett. 2000, 27, 3353–3356. [Google Scholar] [CrossRef]
  21. Zhang, X.Y.; Friedl, M.A.; Schaaf, C.B.; Strahler, A.H.; Liu, Z. Monitoring the response of vegetation phenology to precipitation in Africa by coupling MODIS and TRMM instruments. J. Geophys. Res. Atmos. 2005. [Google Scholar] [CrossRef]
  22. Herrmann, S.M.; Anyamba, A.; Tucker, C.J. Recent trends in vegetation dynamics in the African Sahel and their relationship to climate. Glob. Environ. Chang. 2005, 15, 394–404. [Google Scholar] [CrossRef]
  23. Lehouerou, H.N.; Bingham, R.L.; Skerbek, W. Relationship between the variability of primary production and the variability of annual precipitation in world arid lands. J. Arid Environ. 1988, 15, 1–18. [Google Scholar]
  24. Wessels, K.J.; Prince, S.D.; Malherbe, J.; Small, J.; Frost, P.E.; VanZyl, D. Can human-induced land degradation be distinguished from the effects of rainfall variability? A case study in South Africa. J. Arid Environ. 2007, 68, 271–297. [Google Scholar] [CrossRef]
  25. Nicholson, S.E.; Davenport, M.L.; Malo, A.R. A comparison of the vegetation response to rainfall in the Sahel and East-Africa, using normalized difference vegetation index from NOAA AVHRR. Clim. Chang. 1990, 17, 209–241. [Google Scholar] [CrossRef]
  26. Tracol, Y.; Mougin, E.; Hiernaux, P.; Jarlan, L. Testing a sahelian grassland functioning model against herbage mass measurements. Ecolo. Model. 2006, 193, 437–446. [Google Scholar] [CrossRef]
  27. Williams, C.A.; Hanan, N.P.; Baker, I.; Collatz, G.J.; Berry, J.; Denning, A.S. Interannual variability of photosynthesis across africa and its attribution. J. Geophys. Res. Biogeosci. 2008. [Google Scholar] [CrossRef]
  28. Fensholt, R.; Rasmussen, K. Analysis of trends in the sahelian ‘rain-use efficiency’ using GIMMS NDVI, RFE and GPCP rainfall data. Remote Sens. Environ. 2011, 115, 438–451. [Google Scholar] [CrossRef]
  29. Knapp, A.K.; Smith, M.D. Variation among biomes in temporal dynamics of aboveground primary production. Science 2001, 291, 481–484. [Google Scholar] [CrossRef] [PubMed]
  30. Reynolds, J.F.; Kemp, P.R.; Ogle, K.; Fernandez, R.J. Modifying the ‘pulse-reserve’ paradigm for deserts of North America: Precipitation pulses, soil water, and plant responses. Oecologia 2004, 141, 194–210. [Google Scholar] [CrossRef] [PubMed]
  31. Potts, D.L.; Huxman, T.E.; Cable, J.M.; English, N.B.; Ignace, D.D.; Eilts, J.A.; Mason, M.J.; Weltzin, J.F.; Williams, D.G. Antecedent moisture and seasonal precipitation influence the response of canopy-scale carbon and water exchange to rainfall pulses in a semi-arid grassland. New Phytol. 2006, 170, 849–860. [Google Scholar] [CrossRef] [PubMed]
  32. Prince, S.D.; Goward, S.N.; Goetz, S.; Czajkowski, K. Inter-annual atmosphere-biosphere variation: Implications for observations and modeling. J. Geophys. Res. 2000, 105, 20–55. [Google Scholar] [CrossRef]
  33. Wiegand, T.; Snyman, H.A.; Kellner, K.; Paruelo, J.M. Do grasslands have a memory: Modeling phytomass production of a semiarid South African grassland. Ecosystems 2004, 7, 243–258. [Google Scholar] [CrossRef]
  34. Lauenroth, W.K.; Sala, O.E. Long-term forage production of north-american shortgrass steppe. Ecol. Appl. 1992, 2, 397–403. [Google Scholar] [CrossRef] [PubMed]
  35. Nouvellon, Y.; Moran, M.S.; Lo Seen, D.; Bryant, R.; Rambal, S.; Ni, W.M.; Begue, A.; Chehbouni, A.; Emmerich, W.E.; Heilman, P.; et al. Coupling a grassland ecosystem model with Landsat imagery for a 10-year simulation of carbon and water budgets. Remote Sens. Environ. 2001, 78, 131–149. [Google Scholar] [CrossRef]
  36. Oesterheld, M.; Loreti, J.; Semmartin, M.; Sala, O.E. Inter-annual variation in primary production of a semi-arid grassland related to previous-year production. J. Veg. Sci. 2001, 12, 137–142. [Google Scholar] [CrossRef]
  37. Grist, J.; Nicholson, S.E.; Mpolokang, A. On the use of ndvi for estimating rainfall fields in the Kalahari of Botswana. J. Arid Environ. 1997, 35, 195–214. [Google Scholar] [CrossRef]
  38. Knapp, A.K.; Beier, C.; Briske, D.D.; Classen, A.T.; Luo, Y.; Reichstein, M.; Smith, M.D.; Smith, S.D.; Bell, J.E.; Fay, P.A.; et al. Consequences of more extreme precipitation regimes for terrestrial ecosystems. Bioscience 2008, 58, 811–821. [Google Scholar] [CrossRef]
  39. Huxman, T.E.; Smith, M.D.; Fay, P.A.; Knapp, A.K.; Shaw, M.R.; Loik, M.E.; Smith, S.D.; Tissue, D.T.; Zak, J.C.; Weltzin, J.F.; et al. Convergence across biomes to a common rain-use efficiency. Nature 2004, 429, 651–654. [Google Scholar] [CrossRef] [PubMed]
  40. Elberse, W.T.; Breman, H. Germination and establishment of sahelian rangeland species. I. Seed properties. Oecologia 1989, 80, 477–484. [Google Scholar] [CrossRef]
  41. Elberse, W.T.; Breman, H. Germination and establishment of sahelian rangeland species. II. Effects of water availability. Oecologia 1990, 85, 32–40. [Google Scholar] [CrossRef]
  42. Huxman, T.E.; Snyder, K.A.; Tissue, D.; Leffler, A.J.; Ogle, K.; Pockman, W.T.; Sandquist, D.R.; Potts, D.L.; Schwinning, S. Precipitation pulses and carbon fluxes in semiarid and arid ecosystems. Oecologia 2004, 141, 254–268. [Google Scholar] [CrossRef] [PubMed]
  43. Chabot, B.F.; Hicks, D.J. The ecology of leaf life spans. Annu. Rev. Ecol. Syst. 1982, 13, 229–259. [Google Scholar] [CrossRef]
  44. Noy-Meir, I. Desert ecosystems: Environment and producers. Annu. Rev. Ecol. Syst. 1973, 4, 25–51. [Google Scholar] [CrossRef]
  45. Sala, O.; Lauenroth, W. Small rainfall events: An ecological role in semiarid regions. Oecologia 1982, 53, 301–304. [Google Scholar] [CrossRef]
  46. Prince, S.D.; De Colstoun, E.B.; Kravitz, L.L. Evidence from rain-use efficiencies does not indicate extensive Sahelian desertification. Glob. Chang. Biol. 1998, 4, 359–374. [Google Scholar] [CrossRef]
  47. Wainwright, J.; Mulligan, M.; Thornes, J. Plants and water in drylands. In Eco-Hydrology: Plants and Water in Terrestrial and Aquatic Environments; Baird, A.J., Wilby, R.L., Eds.; Routledge: London, UK, 1999; pp. 78–126. [Google Scholar]
  48. Jobbagy, E.G.; Sala, O.E. Controls of grass and shrub aboveground production in the Patagonian Steppe. Ecol. Appl. 2000, 10, 541–549. [Google Scholar] [CrossRef]
  49. Paruelo, J.M.; Sala, O.E.; Beltran, A.B. Long-term dynamics of water and carbon in semi-arid ecosystems: A gradient analysis in the Patagonian Steppe. Plant Ecol. 2000, 150, 133–143. [Google Scholar] [CrossRef]
  50. Heisler-White, J.L.; Blair, J.M.; Kelly, E.F.; Harmoney, K.; Knapp, A.K. Contingent productivity responses to more extreme rainfall regimes across a grassland biome. Glob. Chang. Biol. 2009, 15, 2894–2904. [Google Scholar] [CrossRef]
  51. Knapp, A.K.; Fay, P.A.; Blair, J.M.; Collins, S.L.; Smith, M.D.; Carlisle, J.D.; Harper, C.W.; Danner, B.T.; Lett, M.S.; McCarron, J.K. Rainfall variability, carbon cycling, and plant species diversity in a mesic grassland. Science 2002, 298, 2202–2205. [Google Scholar] [CrossRef] [PubMed]
  52. Schwinning, S.; Sala, O.E. Hierarchy of responses to resource pulses in and and semi-arid ecosystems. Oecologia 2004, 141, 211–220. [Google Scholar] [CrossRef] [PubMed]
  53. Robertson, T.R.; Bell, C.W.; Zak, J.C.; Tissue, D.T. Precipitation timing and magnitude differentially affect aboveground annual net primary productivity in three perennial species in a Chihuahuan desert grassland. New Phytol. 2009, 181, 230–242. [Google Scholar] [CrossRef] [PubMed]
  54. Good, S.P.; Caylor, K.K. Climatological determinants of woody cover in Africa. Proc. Natl. Acad. Sci. USA 2011, 108, 4902–4907. [Google Scholar] [CrossRef] [PubMed]
  55. Belnap, J.; Welter, J.R.; Grimm, N.B.; Barger, N.; Ludwig, J.A. Linkages between microbial and hydrologic processes in arid and semiarid watersheds. Ecology 2005, 86, 298–307. [Google Scholar] [CrossRef]
  56. Collatz, G.J.; Ball, J.T.; Grivet, C.; Berry, J.A. Physiological and environmental-regulation of stomatal conductance, photosynthesis and transpiration—A model that includes a laminar boundary-layer. Agric. For. Meteorol. 1991, 54, 107–136. [Google Scholar] [CrossRef]
  57. Collatz, G.J.; Ribas-Carbo, M.; Berry, J.A. Coupled photosynthesis-stomatal conductance model for leaves of C4 plants. Aust. J. Plant Physiol. 1992, 19, 519–538. [Google Scholar] [CrossRef]
  58. Reichstein, M.; Ciais, P.; Papale, D.; Valentini, R.; Running, S.; Viovy, N.; Cramer, W.; Granier, A.; OgÉE, J.; Allard, V.; et al. Reduction of ecosystem productivity and respiration during the european summer 2003 climate anomaly: A joint flux tower, remote sensing and modelling analysis. Glob. Chang. Biol. 2007, 13, 634–651. [Google Scholar] [CrossRef]
  59. Xue, Y.; Sellers, P.J.; Kinter, J.L.; Shukla, J. A simplified biosphere model for global climate studies. J. Clim. 1991, 4, 345–364. [Google Scholar] [CrossRef]
  60. Merbold, L.; Ardo, J.; Arneth, A.; Scholes, R.J.; Nouvellon, Y.; de Grandcourt, A.; Archibald, S.; Bonnefond, J.M.; Boulain, N.; Brueggemann, N.; et al. Precipitation as driver of carbon fluxes in 11 African ecosystems. Biogeosciences 2009, 6, 1027–1041. [Google Scholar] [CrossRef]
  61. Beer, C.; Reichstein, M.; Tomelleri, E.; Ciais, P.; Jung, M.; Carvalhais, N.; Roedenbeck, C.; Arain, M.A.; Baldocchi, D.; Bonan, G.B.; et al. Terrestrial gross carbon dioxide uptake: Global distribution and covariation with climate. Science 2010, 329, 834–838. [Google Scholar] [CrossRef] [PubMed]
  62. Nicholson, S.E.; Tucker, C.J.; Ba, M.B. Desertification, drought, and surface vegetation: An example from the West African Sahel. Bull. Am. Meteorol. Soc. 1998, 79, 815–829. [Google Scholar] [CrossRef]
  63. Camberlin, P.; Martiny, N.; Philippon, N.; Richard, Y. Determinants of the interannual relationships between remote sensed photosynthetic activity and rainfall in tropical Africa. Remote Sens. Environ. 2007, 106, 199–216. [Google Scholar] [CrossRef]
  64. Hellden, U.; Tottrup, C. Regional desertification: A global synthesis. Glob. Planet. Change 2008, 64, 169–176. [Google Scholar] [CrossRef]
  65. Sheffield, J.; Goteti, G.; Wood, E.F. Development of a 50-year high-resolution global dataset of meteorological forcings for land surface modeling. J. Clim. 2006, 19, 3088–3111. [Google Scholar] [CrossRef]
  66. Pedelty, J.; Devadiga, S.; Masuoka, E.; Brown, M.; Roy, D.; Pinheiro, A. Generating a long-term land data record from the AVHRR and MODIS instruments. In Proceedings of the 2007 IEEE International Geoscience and Remote Sensing Symposium, Barcelona, Spain, 23–28 July 2007.
  67. Vermote, E.; Kaufman, Y.J. Absolute calibration of avhrr visible and near-infrared channels using ocean and cloud views. Int. J. Remote Sens. 1995, 16, 2317–2340. [Google Scholar] [CrossRef]
  68. Vermote, E.F.; Saleous, N.Z. Calibration of noaa16 AVHRR over a desert site using MODIS data. Remote Sens. Environ. 2006, 105, 214–220. [Google Scholar] [CrossRef]
  69. Nagol, J.N. Quantification of Error in AVHRR NDVI Data. Ph.D. Thesis, University of Maryland, College Park, MD, USA, 2011. [Google Scholar]
  70. Nagol, J.N. Quantification of uncertainty in LTDR AVHRR NDVI data by comparison with MODIS Aqua. Remote Sens. Environ. 2016. submitted for publication. [Google Scholar]
  71. Rishmawi, K.N. Spatial Patterns and Potential Mechanisms of Land Degradation in the Sahel. Ph.D. Thesis, University of Maryland, College Park, MD, USA, 2013. [Google Scholar]
  72. Vermote, E.; Justice, C.O.; Breon, F.M. Towards a generalized approach for correction of the BRDF effect in MODIS directional reflectances. IEEE Trans. Geosci. Remote Sens. 2009, 47, 898–908. [Google Scholar] [CrossRef]
  73. Fensholt, R.; Sandholt, I.; Proud, S.R.; Stisen, S.; Rasmussen, M.O. Assessment of MODIS sun-sensor geometry variations effect on observed NDVI using MSG SEVIRI geostationary data. Int. J. Remote Sens. 2010, 31, 6163–6187. [Google Scholar] [CrossRef]
  74. Gutman, G.G. Vegetation indexes from AVHRR—An update and future-prospects. Remote Sens. Environ. 1991, 35, 121–136. [Google Scholar] [CrossRef]
  75. Cihlar, J.; Howarth, J. Detection and removal of cloud contamination from AVHRR images. IEEE Trans. Geosci. Remote Sens. 1994, 32, 583–589. [Google Scholar] [CrossRef]
  76. Viovy, N.; Arino, O.; Belward, A.S. The best index slope extraction (BISE)—A method for reducing noise in NDVI time-series. Int. J. Remote Sens. 1992, 13, 1585–1590. [Google Scholar] [CrossRef]
  77. Hansen, M.C.; DeFries, R.S.; Townshend, J.R.G.; Carroll, M.; Dimiceli, C.; Sohlberg, R.A. Global percent tree cover at a spatial resolution of 500 meters: First results of the modis vegetation continuous fields algorithm. Earth Interact. 2003. [Google Scholar] [CrossRef]
  78. Zhang, X.Y.; Friedl, M.A.; Schaaf, C.B.; Strahler, A.H.; Hodges, J.C.F.; Gao, F.; Reed, B.C.; Huete, A. Monitoring vegetation phenology using MODIS. Remote Sens. Environ. 2003, 84, 471–475. [Google Scholar] [CrossRef]
  79. Zhang, X.Y.; Friedl, M.A.; Schaaf, C.B. Global vegetation phenology from Moderate Resolution Imaging spectroradiometer (MODIS): Evaluation of global patterns and comparison with in situ measurements. J. Geophys. Res. Biogeosci. 2006. [Google Scholar] [CrossRef]
  80. Dielman, T.E. Applied Regression Analysis: A Second Course in Business and Economic Statistics, 4th ed.; Brooks/Cole: Belmont, CA, USA, 2005. [Google Scholar]
  81. Furnival, G.M.; Wilson, R.W. Regressions by leaps and bounds. Technometrics 1974, 16, 499–511. [Google Scholar] [CrossRef]
  82. Freund, R.; Wilson, W.J. Regression Analysis: Statistical Modeling of a Response Variable; Academic Press: San Diego, CA, USA, 1998. [Google Scholar]
  83. Friedl, M.A.; McIver, D.K.; Hodges, J.C.F.; Zhang, X.Y.; Muchoney, D.; Strahler, A.H.; Woodcock, C.E.; Gopal, S.; Schneider, A.; Cooper, A.; et al. Global land cover mapping from MODIS: Algorithms and early results. Remote Sens. Environ. 2002, 83, 287–302. [Google Scholar] [CrossRef]
  84. Zhan, X.W.; Xue, Y.K.; Collatz, G.J. An analytical approach for estimating CO2 and heat fluxes over the amazonian region. Ecolo. Model. 2003, 162, 97–117. [Google Scholar] [CrossRef]
  85. Wood, E.F.; Lettenmaier, D.P.; Liang, X.; Lohmann, D.; Boone, A.; Chang, S.; Chen, F.; Dai, Y.J.; Dickinson, R.E.; Duan, Q.Y.; et al. The project for intercomparison of land-surface parameterization schemes (PILPS) phase 2(c) red-arkansas river basin experiment: I. Experiment description and summary intercomparisons. Glob. Planet. Chang. 1998, 19, 115–135. [Google Scholar] [CrossRef]
  86. Baret, F.; Hagolle, O.; Geiger, B.; Bicheron, P.; Miras, B.; Huc, M.; Berthelot, B.; Nino, F.; Weiss, M.; Samain, O.; et al. LAI, fAPAR and fCover cyclopes global products derived from vegetation—Part I: Principles of the algorithm. Remote Sens. Environ. 2007, 110, 275–286. [Google Scholar] [CrossRef] [Green Version]
  87. Sellers, P.J. Canopy reflectance, photosynthesis, and transpiration. II. The role of biophysics in the linearity of their interdependence. Remote Sens. Environ. 1987, 21, 143–183. [Google Scholar] [CrossRef]
  88. Malo, A.R.; Nicholson, S.E. A Study of Rainfall and Vegetation Dynamics in the African Sahel Using Normalized Vegetation Index; Elsevier: Kidlington, UK, 1990. [Google Scholar]
  89. Davenport, M.L.; Nicholson, S.E. On the relation between rainfall and the normalized difference vegetation index for diverse vegetation types in East-Africa. Int. J. Remote Sens. 1993, 14, 2369–2389. [Google Scholar] [CrossRef]
  90. Ramankutty, N.; Evan, A.T.; Monfreda, C.; Foley, J.A. Farming the planet: I. Geographic distribution of global agricultural lands in the year 2000. Glob. Biogeochem. Cycles 2008. [Google Scholar] [CrossRef]
  91. Gruber, I.; Kloos, J.; Schopp, M. Seasonal water demand in Benin’s agriculture. J. Environ. Manag. 2009, 90, 196–205. [Google Scholar] [CrossRef] [PubMed]
  92. African Development Bank Group. Oueme Valley Irrigated Agricultural Development Project; Project Performance Evaluation Report; African Development Bank Group: Abidjan, Côte d’Ivoire, 1998. [Google Scholar]
  93. Hanjra, M.A.; Gichuki, F. Investments in agricultural water management for poverty reduction in Africa: Case studies of Limpopo, Nile, and Volta River Basins. Nat. Resour. Forum 2008, 32, 185–202. [Google Scholar] [CrossRef]
  94. Bai, Z.G.; Dent, D.L.; Olsson, L.; Schaepman, M.E. Proxy global assessment of land degradation. Soil Use Manag. 2008, 24, 223–234. [Google Scholar] [CrossRef]
  95. Bui, E.N.; Hancock, G.J.; Wilkinson, S.N. ‘Tolerable’ hillslope soil erosion rates in Australia: Linking science and policy. Agric. Ecosyst. Environ. 2011, 144, 136–149. [Google Scholar] [CrossRef]
  96. LeHouérou, H.N. The Grazing Land Ecosystems of the African Sahelthe Grazing Land Ecosystems of the African Sahel; Springer: Heidelberg, Germany, 1989. [Google Scholar]
  97. Lieth, H. Modeling the primary productivity of the world. In Primary Productivity of the Biosphere; Lieth, H., Whittaker, R.H., Eds.; Springer: Heidelberg, Germany, 1975; pp. 237–263. [Google Scholar]
  98. Breman, H.; Dewit, C.T. Rangeland productivity and exploitation in the Sahel. Science 1983, 221, 1341–1347. [Google Scholar] [CrossRef] [PubMed]
  99. Hiernaux, P.; Ayantunde, A.; Kalilou, A.; Mougin, E.; Gerard, B.; Baup, F.; Grippa, M.; Djaby, B. Trends in productivity of crops, fallow and rangelands in southwest Niger: Impact of land use, management and variable rainfall. J. Hydrol. 2009, 375, 65–77. [Google Scholar] [CrossRef] [Green Version]
  100. Ibrahim, Y.; Balzter, H.; Kaduk, J.; Tucker, C. Land degradation assessment using residual trend analysis of GIMMS NDVI3g, soil moisture and rainfall in Sub-Saharan West Africa from 1982 to 2012. Remote Sens. 2015, 7, 5471–5494. [Google Scholar] [CrossRef]
  101. Granger, C.W.J. Spurious regressions in econometrics. J. Econ. 1974, 2, 111–120. [Google Scholar] [CrossRef]
  102. Yang, L.; Wylie, B.K.; Tieszen, L.L.; Reed, B.C. An analysis of relationships among climate forcing and time-integrated NDVI of grasslands over the U.S. Northern and central great plains. Remote Sens. Environ. 1998, 65, 25–37. [Google Scholar] [CrossRef]
  103. Wang, G.L.; Eltahir, E.A.B. Modeling the biosphere-atmosphere system: The impact of the subgrid variability in rainfall interception. J. Clim. 2000, 13, 2887–2899. [Google Scholar] [CrossRef]
  104. Wessels, K.J. Monitoring land Degradation in Southern Africa by Assessing Changes in Primary Productivity. Ph.D. Thesis, University of Maryland, College Park, MD, USA, 2005. [Google Scholar]
  105. Barron, J.; Rockstrom, J.; Gichuki, F.; Hatibu, N. Dry spell analysis and maize yields for two semi-arid locations in east Africa. Agric. For. Meteorol. 2003, 117, 23–37. [Google Scholar] [CrossRef]
  106. Frappart, F.; Hiernaux, P.; Guichard, F.; Mougin, E.; Kergoat, L.; Arjounin, M.; Lavenu, F.; Koite, M.; Paturel, J.E.; Lebel, T. Rainfall regime across the Sahel band in the Gourma Region, Mali. J. Hydrol. 2009, 375, 128–142. [Google Scholar] [CrossRef] [Green Version]
  107. Yengoh, G.T.; Armah, F.A.; Onumah, E.E.; Odoi, J.O. Trends in agriculturally-relevant rainfall characteristics for small-scale agriculture in northern Ghana. J. Agric. Sci. 2010, 2, 3–16. [Google Scholar] [CrossRef]
  108. Penning de Vries, F.; Djitèye, M.A. La Productivité des Pasturages Sahélien: Une étude des Sols des Végétations et de L’exploitation de Cette Ressource Naturelle; Pudoc, Center for Agricultural Publication and Documentation: Wageningen, The Netherlands, 1983; p. 525. [Google Scholar]
  109. Huber, S.; Fensholt, R.; Rasmussen, K. Water availability as the driver of vegetation dynamics in the African Sahel from 1982 to 2007. Glob. Planet. Chang. 2011, 76, 186–195. [Google Scholar] [CrossRef]
  110. Churkina, G.; Running, S.W. Contrasting climatic controls on the estimated productivity of global terrestrial biomes. Ecosystems 1998, 1, 206–215. [Google Scholar] [CrossRef]
  111. D’Amato, N.; Lebel, T. On the characteristics of the rainfall events in the Sahel with a view to the analysis of climatic variability. Int. J. Clim. 1998, 18, 955–974. [Google Scholar] [CrossRef]
  112. LeBarbe, L.; Lebel, T. Rainfall climatology of the hapex-Sahel region during the years 1950–1990. J. Hydrol. 1997, 189, 43–73. [Google Scholar]
  113. Prince, S.D. Where does desertification occur? Mapping dryland degradation at regional to global scales. In The End of Desertification? Disrupting Environmental Change in Drylands; Behnke, R., Matimore, M., Eds.; Springer: Heidelberg, Germany, 2016. [Google Scholar]
  114. Jackson, H.; Prince, S.D. Degradation of net primary production in a semi-arid rangeland. Biogeosciences 2016, 13, 4721–4734. [Google Scholar] [CrossRef]
  115. Jackson, H.; Prince, S.D. Degradation of non-photosynthetic vegetation in a semi-arid rangeland. Remote Sens. 2016. [Google Scholar] [CrossRef]
  116. Dardel, C.; Kergoat, L.; Hiernaux, P.; Grippa, M.; Mougin, E.; Ciais, P.; Nguyen, C.C. Rain-use-efficiency: What it tells us about the conflicting Sahel greening and sahelian paradox. Remote Sens. 2014, 6, 3446–3474. [Google Scholar] [CrossRef] [Green Version]
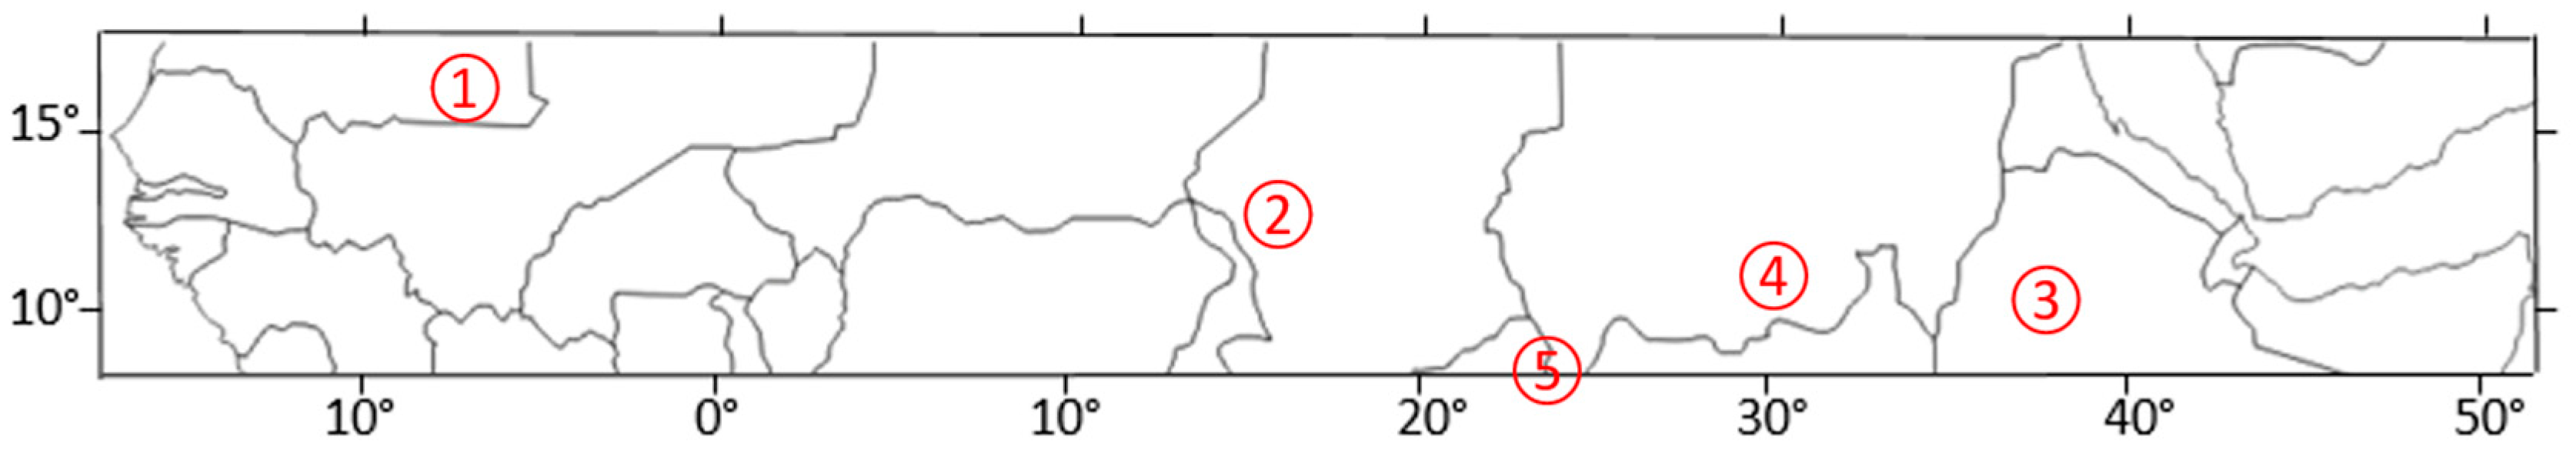
Figure 1. Locations of study sites: 1. Koumbi Saleh, Mauritania; 2. Fadjė, Chad; 3. Kem Kem, Ethiopia; 4. Abyie, Sudan; 5. Quarda Djallė, Central African Republic.
Remotesensing 08 00910 g001
Figure 2. Scatter plot of MODIS and AVHRR phenological transition dates of 250 randomly selected points from the study area. Open circles (○) represent the dates of onset of greenness increase (RMSE = 15.5 days, r = 0.89). Crosses (+) represent the dates of onset of maturity (RMSE = 14.9 days, r = 0.71). Open squares (□) represent the dates of onset of greenness decrease (RMSE = 17 days, r = 0.63). Open triangles (Δ) represent the dates of onset of dormancy (RMSE = 29 days, r = 0.2).
Remotesensing 08 00910 g002
Figure 3. Spatial variation in averaged values (1982–2006), of (a) greenup “onset of greenness increase”, (b) senescence “onset of greenness decrease”, and (c) length of growing season (days). The map in (d) is the between-year variation (±2 standard deviations) in the onset date of greenness increase. The red lines (black in (d)) from north to south are the 300 mm, 700 mm and 1100 mm rainfall isohyets.
Remotesensing 08 00910 g003
Figure 4. Coefficients of determination (r2) for (a) annual rainfall-ΣNDVI and (b) growing season rainfall-ΣNDVI regressions. The red lines from north to south are the 300 mm, 700 mm and 1100 mm rainfall isohyets.
Remotesensing 08 00910 g004
Figure 5. Percentage area with significant ΣNDVI-rainfall relationships (bars) in each rainfall range and the spatial average of the coefficient of determination (r2) values (points) of all pixels within each rainfall range.
Remotesensing 08 00910 g005
Figure 6. Spatial distributions of (a) the coefficients of determination (adjusted r2) for the multiple regression of ΣNDVI on total growing season rainfall, its variance and its skewness. (b) The change in the percentage of variance explained by including the additional variables over the percentage variance of ΣNDVI and rainfall alone. The red lines from north to south are the 300 mm, 700 mm and 1100 mm rainfall isohyets.
Remotesensing 08 00910 g006
Figure 7. Coefficients of (a) seasonal rainfall variance, and (b) seasonal rainfall skewness obtained from the multivariate regressions of growing season ΣNDVI on total seasonal precipitation, precipitation variance and skewness. Missing values (white pixels) are areas with high multicollinearity between explanatory variables, or where the coefficients were insignificantly different from zero (p > 0.05). The red lines from north to south are the 300 mm, 700 mm and 1100 mm rainfall isohyets.
Remotesensing 08 00910 g007
Figure 8. Adjusted r2 for (a), the relation of ΣNDVI with total growing season rainfall, air humidity and temperature; (b) The change in the percentage of variance explained by including the additional variables over the percentage variance of ΣNDVI and rainfall alone. The red lines from north to south are the 300 mm, 700 mm and 1100 mm rainfall isohyets.
Remotesensing 08 00910 g008
Figure 9. Regression coefficients of (a) precipitation (b) specific humidity; and (c) air temperature obtained from the multivariate regressions of growing season ΣNDVI on precipitation, specific humidity and temperature. Missing values (white pixels) are areas with high multicollinearity between explanatory variables, or where the coefficients were insignificantly different from zero (p > 0.05). The red lines from north to south are the 300 mm, 700 mm and 1100 mm rainfall isohyets.
Remotesensing 08 00910 g009
Figure 10. A randomly drawn sample (10%) representing the relationship of rainfall climatology to (a) precipitation coefficient ΣNDVI·mm−1 and (b) specific humidity coefficient Σ N D V I   ( g H 2 O k g A i r ) .
Remotesensing 08 00910 g010
Figure 11. Mean absolute values of the standardized coefficients of the multivariate regression between NDVI and explanatory variables (precipitation, specific humidity and temperature) summarized for the land cover types. Error bars are ±1 standard deviation around the mean.
Remotesensing 08 00910 g011
Figure 12. The response of daily soil moisture at root depth to changes in precipitation, temperature, and specific humidity averaged for the period from green-up to maturity (green-up period, grey diamonds; left hand axis) and from maturity to senescence (maturity period, black circles; right hand axis). Note the different ranges on the y axis between sites.
Remotesensing 08 00910 g012
Figure 13. The response of stomatal resistance (s·m−1) to changes in precipitation, temperature, and specific humidity averaged for the period from green-up to maturity (green-up period, grey diamonds; left hand axis) and from maturity to senescence (maturity period, black circles; right hand axis). Note the different ranges on the y axis between sites.
Remotesensing 08 00910 g013
Figure 14. The response of net primary productivity (NPP) (µmol·m−2·s−1) to changes in precipitation, temperature, and specific humidity averaged for the period from green-up to maturity (green-up period, grey diamonds; left hand axis) and from maturity to senescence (maturity period, black circles; right hand axis). Note the different ranges on the y axis between sites.
Remotesensing 08 00910 g014
Table 1. Information on sites used for sensitivity studies. See Figure 1 for map of locations. GUMA: the period of Greenup to maturity. MASE: the period of Maturity to senescence.
LocationLand CoverLatitudeLongitudeElevation (m)Growing Season Means and Standard DeviationsMaximum LAI and Interannual VariationMean Duration
Cumulative Precipitation (mm)Temperature (°C)Specific Humidity (gH2O/kgdry air) GUMA (Days)MASE (Days)
Koumbi Saleh, MauritaniaGrasslands15.775°N7.991°W187300 ± 6030.6 ± 0.7118 ± 1.01.39 ± 0.3775 ± 2321 ± 3
Fadjė, ChadShrublands with grass ground cover11.625°N15.925°W325410 ± 9928.2 ± 0.6416 ± 0.82.79 ± 0.3566 ± 2138 ± 10
Kem Kem, EthiopiaCropland12.075°N37.825°W1870678 ± 10319.7 ± 0.5213 ± 0.52.51 ± 0.1365 ± 1872 ± 11
Abyie, SudanWoody savannas9.525°N28.425°W400792 ± 11028.3 ± 0.7021 ± 1.02.40 ± 0.2095 ± 1570 ± 12
Quarda Djallė, Central African RepublicSavannas with grass ground cover8.775°N22.375°W682861 ± 10826.5 ± 0.6218 ± 0.6 3.25 ± 0.25128 ± 11105 ± 11

