Article

Multi-Instrument Inter-Calibration (MIIC) System

1
NASA Langley Research Center, Mail Stop 420, Hampton, VA 23681, USA
2
Mechdyne Corporation, Virginia Beach, VA 23462, USA
3
OPeNDAP, Inc., Butte, MT 59701, USA
*
Author to whom correspondence should be addressed.
Remote Sens. 2016, 8(11), 902; https://doi.org/10.3390/rs8110902
Submission received: 21 September 2016 / Revised: 18 October 2016 / Accepted: 25 October 2016 / Published: 3 November 2016

Abstract

:
In order to have confidence in the long-term records of atmospheric and surface properties derived from satellite measurements it is important to know the stability and accuracy of the actual radiance or reflectance measurements. Climate quality measurements require accurate calibration of space-borne instruments. Inter-calibration is the process that ties the calibration of a target instrument to a more accurate, preferably SI-traceable, reference instrument by matching measurements in time, space, wavelength, and view angles. A major challenge for any inter-calibration study is to find and acquire matched samples from within the large data volumes distributed across Earth science data centers. Typically less than 0.1% of the instrument data are required for inter-calibration analysis. Software tools and networking middleware are necessary for intelligent selection and retrieval of matched samples from multiple instruments on separate spacecraft.  This paper discusses the Multi-Instrument Inter-Calibration (MIIC) system, a web-based software framework used by the Climate Absolute Radiance and Refractivity Observatory (CLARREO) Pathfinder mission to simplify the data management mechanics of inter-calibration. MIIC provides three main services: (1) inter-calibration event prediction; (2) data acquisition; and (3) data analysis. The combination of event prediction and powerful server-side functions reduces the data volume required for inter-calibration studies by several orders of magnitude, dramatically reducing network bandwidth and disk storage needs. MIIC provides generic retrospective analysis services capable of sifting through large data volumes of existing instrument data. The MIIC tiered design deployed at large institutional data centers can help international organizations, such as Global Space Based Inter-Calibration System (GSICS), more efficiently acquire matched data from multiple data centers. In this paper we describe the MIIC architecture and services.

Graphical Abstract

1. Introduction

Global Space Based Inter-Calibration System (GSICS) is an international collaboration that recommends inter-calibration algorithms for space-borne instruments [1]. Most algorithms compare observations at Earth surface targets or simultaneous nadir overpasses (SNOs). The first step of any inter-calibration process is to locate matched measurements from within large datasets distributed across multi-agency international data centers. The typical process involves months of time downloading large datasets from remote data centers onto terabytes of expensive disk space. The distributed MIIC system provides a more effective solution. MIIC is a tool that primarily supports retrospective analysis. The MIIC system communicates with remote servers based on the Open-source Project for Network Data Access Protocol (OPeNDAP) middleware [2] to sift through large data volumes of online storage. Custom MIIC functions running within remote OPeNDAP servers provide subset, filter, and statistics services. These functions are designed to work with any hierarchical data format (HDF) or network common data format (netCDF) file. The MIIC event prediction software uses orbital mechanics and instrument scan models to determine when an instrument is viewing a particular Earth surface site or aligned in time, space, and angle with another instrument observation. The current system can predict inter-calibration (IC) events for configured spacecraft instruments given the availability of spacecraft daily two-line element (TLE) files from Space-Track.org [3]. LEO-LEO and LEO-GEO IC events typically vary between two and 28 min in duration depending on orbit properties. High-resolution instrument data are aggregated to cover a single event. The MIIC system can mine data from calibration targets, such as deep convective clouds (DCC) and homogeneous surface sites, used for vicarious calibration. Each inter-calibration plan (ICPlan) when executed performs up to three operations: (1) event prediction; (2) data acquisition; and (3) data analysis. This paper describes the functionality and results of these three services.
The CLARREO Pathfinder (CPF) mission, scheduled for launch to the International Space Station (ISS) in 2020, will provide a highly accurate SI-traceable calibration standard in orbit to measure spectral reflectance between 350 and 2300 nm. The CPF mission will demonstrate significant improvements in the inter-calibration process by using the most accurate spectral reflectance reference spectrometer in space to date, 0.3% (2σ) accuracy, and by matching target observations at multiple scan angles using a two-axis pointing system [4]. Simultaneous nadir overpass (SNO) comparisons typically only align observations at nadir. CLARREO data will inter-calibrate both the Clouds and the Earth’s Radiant Energy System (CERES) shortwave channel (0.3–5.0 μm) and the Visible Infrared Imaging Radiometer (VIIRS) reflected solar bands. Figure 1 depicts the free flyer CLARREO concept using a unique active pointing system to match target instrument views near orbit crossings in support of inter-calibration. The ISS CPF instrument will provide the same capabilities, except the orbit will be at 400 km altitude instead of 609 km. Active pointing increases inter-calibration sampling by a factor of 100 compared to the current GSICS capabilities [4]. The CPF instrument swath width is 70 km at 0.5 km spatial resolution. The CLARREO instrument will serve as a calibration reference for many low earth orbit (LEO) and geostationary earth orbit (GEO) instruments in space. The CLARREO Pathfinder mission will use the Multi-Instrument Inter-Calibration (MIIC) system to acquire matched CERES and VIIRS observations for inter-calibration with the CPF instrument. The MIIC system simplifies access to data from multiple data centers in support of inter-comparison studies performed by international Earth science communities such as GSICS.

2. Background

Investigations to validate and track instrument calibration stability and accuracy once in orbit utilize a wide range of methodologies [1]. The purpose of this section is to highlight the type inter-calibration studies that MIIC was designed to benefit. Inter-calibration studies typically compare calibrated radiance or reflectance from multiple instruments over similar spectral bands at the top-of-atmosphere (TOA). One such study performs a radiometric inter-comparison between the SNPP VIIRS and the Aqua Moderate Resolution Imaging Spectroradiometer (MODIS) using an extended simultaneous nadir overpass (SNO-x) technique to find homogeneous ocean and desert scenes at lower latitudes, an advantage over SNO, being typically limited to polar orbit crossings [5]. The MODIS calibration science team tracks the instrument response versus scan angle (RVS) change for both Aqua and Terra instruments using stable desert calibration sites recommended by the Committee on Earth Observation Satellites (CEOS). MIIC provides services to predict and mine observation data from any user-defined surface site for vicarious calibration studies. The CLARREO instrument uses active pointing control to match target instrument observations at various scan angles.
CERES broadband measurements are converted to unfiltered radiances for inter-comparison with other instruments using a spectral correction algorithm to account for the different spectral responses of each instrument [6]. Shape and bandwidth differences of spectral response functions (SRF) must be accounted for when comparing radiances from separate instruments. The CERES project tracks calibration relative stability of multiple CERES instruments using vicarious techniques, including tropical mean and deep convective cloud comparisons referenced to the FM1 instrument [7]. CERES performs inter-satellite direct comparisons by commanding its two-axis gimbal pointing system to rotate in the azimuth direction so that observations from multiple instruments match near satellite orbit crossings. CERES performed the first commanded inter-satellite direct comparison with the Scanner for Radiation Budget (ScaRaB) radiometer during January and March 1999 [8]. Comparisons of shortwave radiances from two instruments require similar solar zenith and relative azimuth angles. This can be obtained by rotating the azimuth gimbal of one instrument such that the scan planes of both instruments are parallel. CERES performed similar Programmable Azimuth Plan Scan (PAPS) operations in March 2000 to compare CERES shortwave observations on both Tropical Rainfall Measuring Mission (TRMM) and Terra [9]. Acquisition of the requisite amount of samples for inter-calibration is a challenge due to variable clear-sky conditions, scene type, viewing geometry differences, and small surface site targets. The CLARREO Pathfinder instrument two-axis pointing system will significantly improve the sampling required for reflected solar instrument inter-calibration.
Instrument teams spend a great deal of time validating calibration accuracy and stability by comparing measurements with other instruments. The CLARREO Pathfinder instrument will serve as a high-accuracy reflected solar reference to improve the calibration accuracy of many orbiting instruments. The most accurate inter-calibration techniques match reference and target observations in time, space, view and solar zenith angles, and wavelength [4]. CLARREO will match target observations in space, time, viewing geometry, and wavelength. Empirical models will be developed to account for imager band spectral response function differences and polarization sensitivity variability with scan angle. The algorithms used for CLARREO Pathfinder inter-calibration are documented in Roithmayr et al. [10].
The idea for the Multi-Instrument Inter-Calibration (MIIC) software framework was derived from the original CLARREO 2007 Decadal Survey mission concept [11]. The MIIC team received NASA funding from the Research Opportunities in Earth and Space Science (ROSES) Advancing Collaborative Connections for Earth System Science (ACCESS) program in 2011 and 2013 to develop software to improve access to satellite instrument data distributed across multiple data centers in support of inter-calibration. The MIIC design enables development of distributed collaborative systems to subset satellite instrument data efficiently for inter-calibration and comparisons of derived geophysical parameters. MIIC predicts, locates, and acquires data when multiple satellite instruments observe the same geographic scene at similar scan and solar angles within an allowable time difference. MIIC also collects data over user-defined surface sites to trend calibration stability. Observations are subset and filtered during acquisition using custom remote OPeNDAP server-side functions. The MIIC system enables a user to download only the matched data of interest without first downloading the entirety of both datasets for the time period in question. This reduces network traffic by several orders of magnitude. The MIIC data services have been tested using CERES, CALIPSO, CrIS, VIIRS, MODIS, and GOES data. The current MIIC system is deployed at the NASA Langley Research Center (LaRC) Atmospheric Science Data Center (ASDC). Current plans are to use MIIC to access CERES and VIIRS data matched with the CLARREO Pathfinder Reflected Solar instrument for inter-calibration.

3. MIIC Architecture

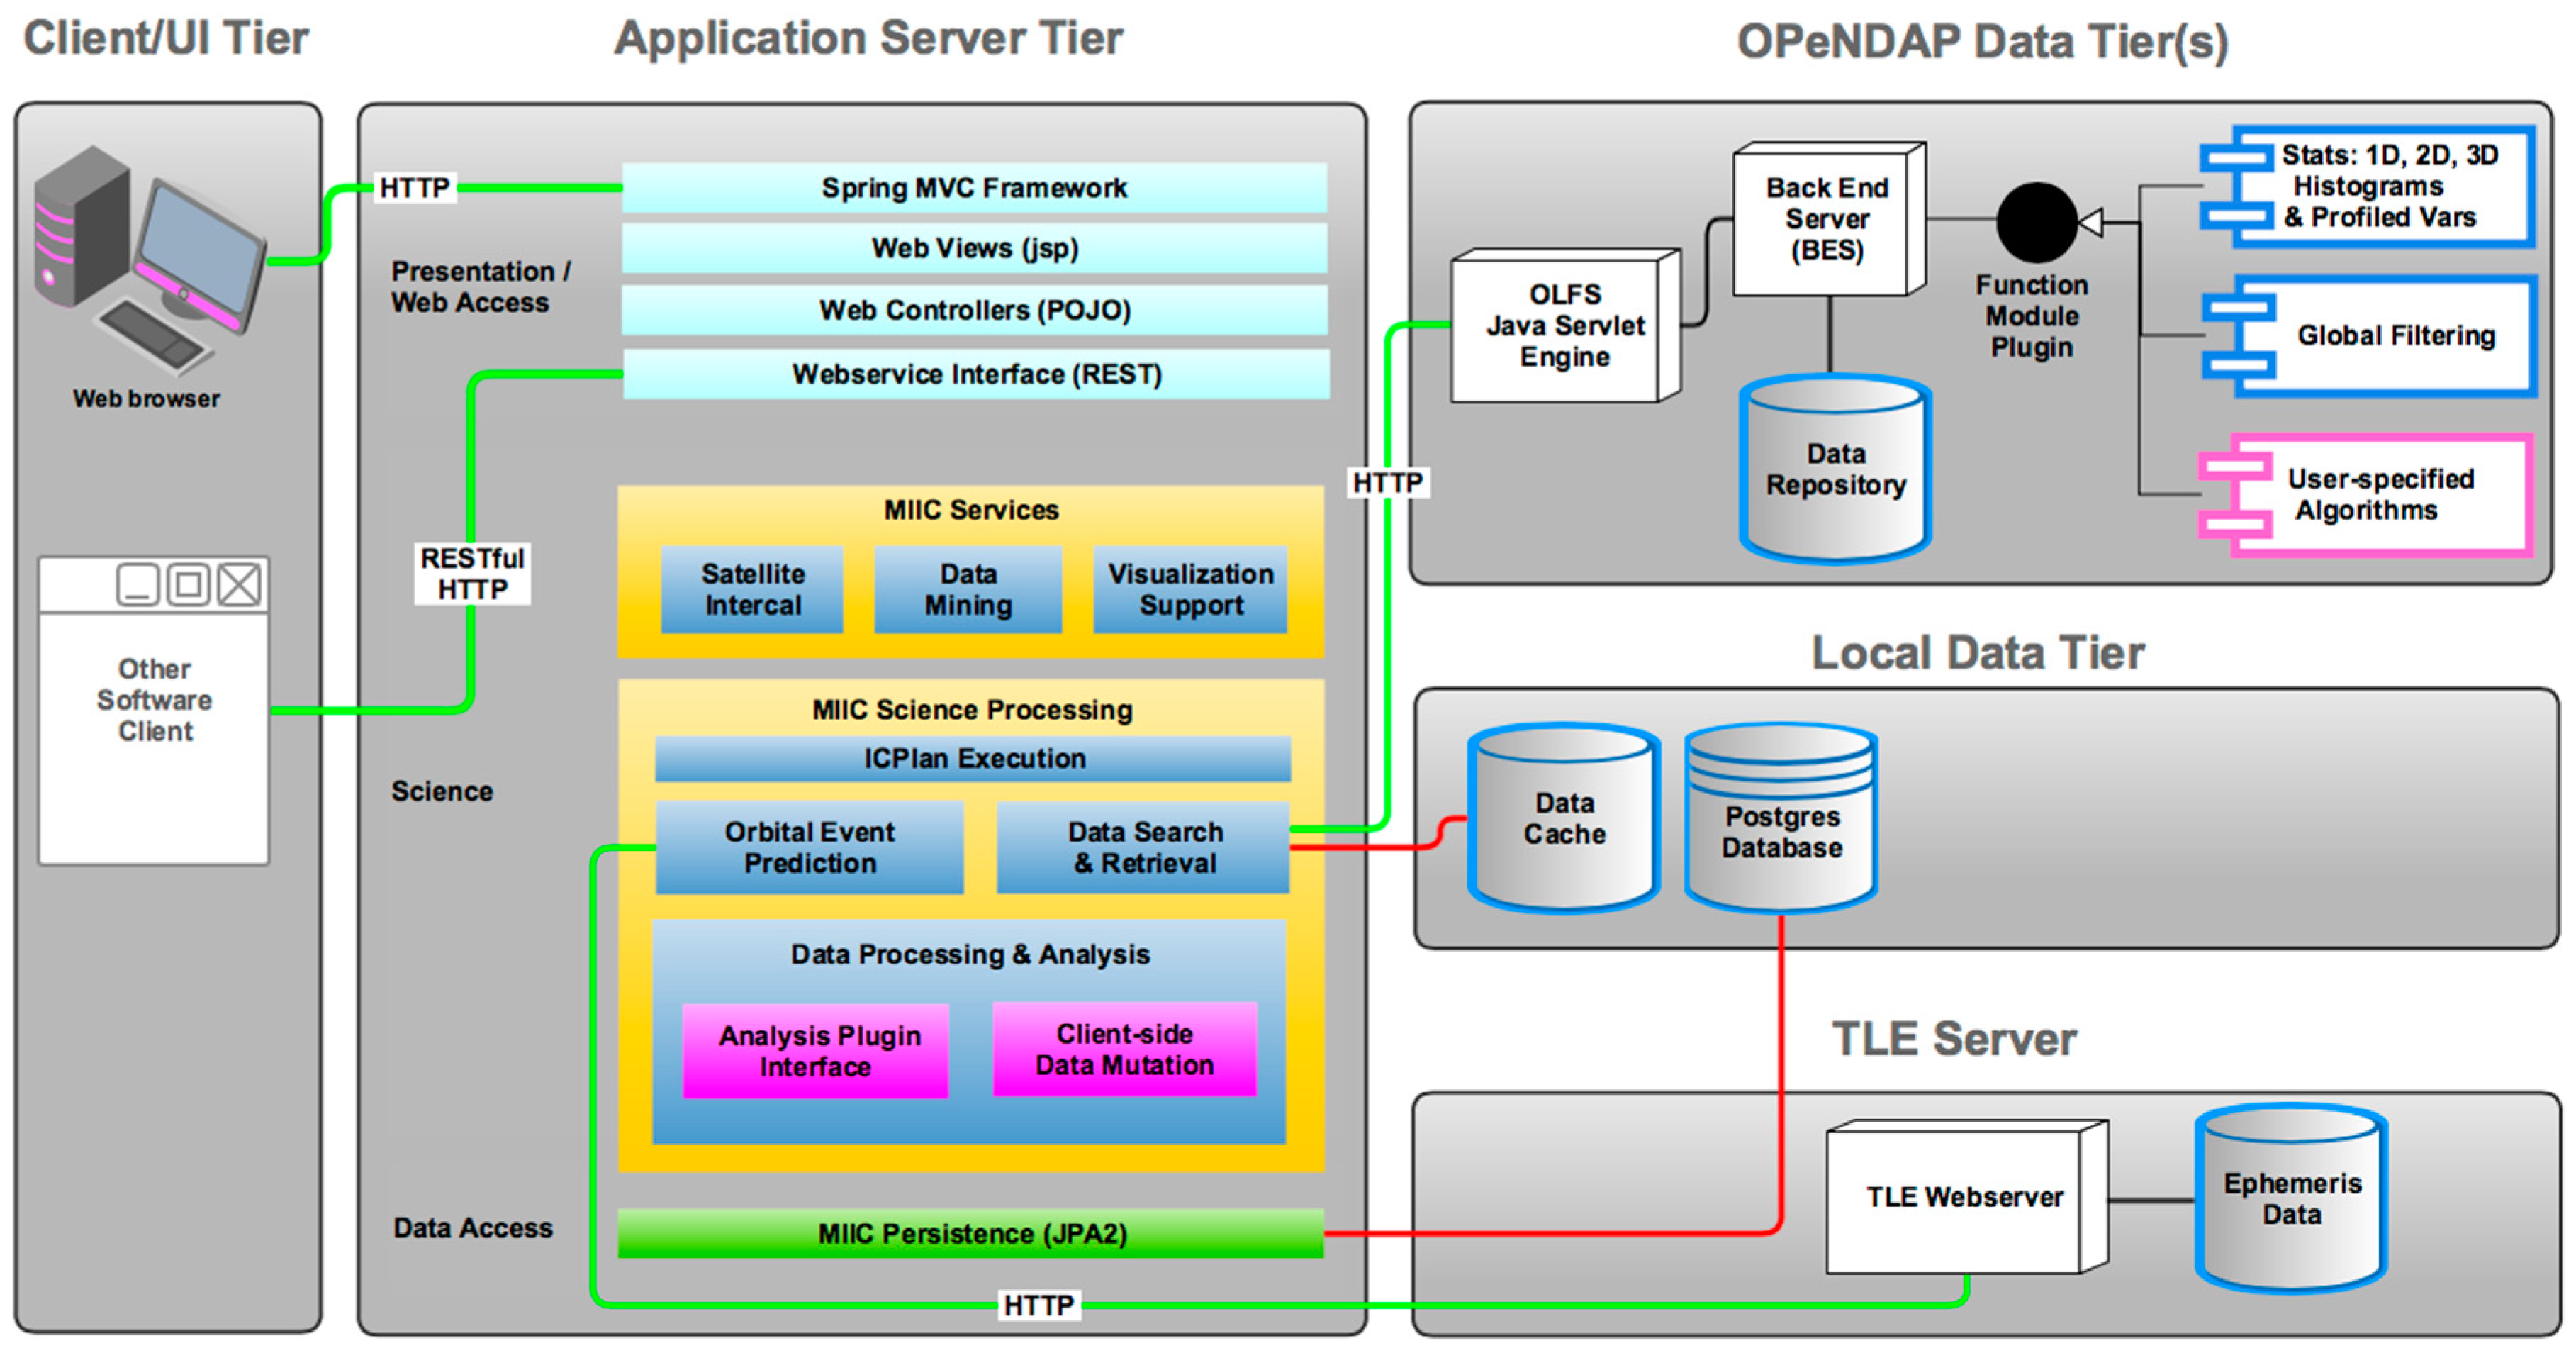
3.1. Data System Architecture

MIIC is a multi-tiered web-based data system designed to meet the following objectives:
  • Support inter-calibration and inter-comparison science studies
  • Access matched measurements within large datasets distributed across multiple data centers
  • Enable development of distributed collaborative data systems
  • Demonstrate the benefit of custom OPeNDAP server-side functions
  • Provide web-based tools to simplify data access for GSICS and instrument Cal-Val teams
The MIIC data system (Figure 2) is a multi-tiered architecture that consists of three primary tiers: client/user interface, application, and data.
The application tier controls the workflow for each inter-calibration task. The event prediction module predicts the time and location of event data and identifies the data files associated with each event. Instrument data files are processed on external OPeNDAP servers within embedded MIIC server-side functions. The server-side functions subset and filter data within the event spatial coverage. Data transmitted from the OPeNDAP servers are cached in the local data tier for analysis. The application server can connect to multiple OPeNDAP servers physically located at disparate data centers. The MIIC architecture uses multiple HTTP REpresentational State Transfer (REST) interfaces to communicate between the distributed components. Daily two-line elements (TLEs) (see Section 4.1) needed for event prediction are acquired through a REST interface from Space-Track.org. Users access the MIIC services through a web interface, running in a browser, or via external client application programs using a REST API.
The tiered software stack is implemented in multiple programming languages that run on separate servers. The web-based user interface uses JavaScript, the application tier is written in Java, and the data tier is written in C++. Web pages are generated within the application tier. Interactive dynamic data plots are implemented using the Highcharts JavaScript library [12]. Standalone client applications use a REST API to submit inter-calibration plans for execution. The application tier workflow managers sequence the event prediction, file location, collection, and analysis services. ICPlan state is updated during execution and persisted in a PostgreSQL database. OPeNDAP Hyrax servers can be deployed at Earth science data centers or within the cloud, wherever instrument data are located.
The MIIC system can easily be configured with additional OPeNDAP servers and data products. Each OPeNDAP server must include the MIIC plugin that contains server-side functions for histograms, filters, and spatial and spectral convolution. An analysis plugin using the Java implementation of the Abstract Interfaces for Data Analysis (JAIDA) library [13] generates histogram statistics on target and reference data retrieved by MIIC. Additional analysis plugins can be developed and easily added to the application tier. The MIIC software stack is extendable and can support many different use cases including multi-instrument data aggregation.
Multi-tiered architectures for enterprise applications require scalable and secure network features. The application tier uses the Spring framework [14] to provide Java enterprise services within a lightweight Tomcat servlet container. Spring dependency injection simplifies reconfiguration for testing and prototyping. The Spring model-view-controller (MVC) framework handles all incoming requests for web pages, REST API requests, and dynamic JSON objects. Spring MVC handles crosscutting concerns in web requests, such as request authentication and authorization, session management, and necessary data transformations. We use the Hibernate framework [15] for object-relational mapping to persist data in a PostgreSQL database. The MIIC system consists of hardware deployed at the NASA LaRC Atmospheric Science Data Center. The application tier server communicates with two OPeNDAP servers with 10GE connectivity to the ASDC online disk storage (>6 PB). External OPeNDAP data servers have been deployed in the Amazon Web Service (AWS) and tested with connectivity to the MIIC application server. The MIIC web interface has been scanned by NASA network security and authorized for use on external-facing networks. Additional testing and software enhancements need to occur to ensure proper scalability and user support before MIIC services can be made public. The CLARREO Pathfinder mission will verify the MIIC architecture and enhance features by working closely with the CLARREO, CERES, and VIIRS Cal/Val teams. The CLARREO Pathfinder science data system will communicate through the MIIC REST API for inter-calibration services. MIIC software is primarily for large institutional data centers. The software is currently not open source but can be licensed to support future deployments.

3.2. Server-Side Functions

The OPeNDAP open source software allows clients easy access to data over the network. The MIIC plugin is designed to execute functions within an OPeNDAP (Hyrax version) server. These functions subset and filter raw data, perform statistics (histograms), and mutate data by executing mathematical expressions on any combination of parameters within a file. The MIIC plugin is compatible with the OPeNDAP handlers that support the various flavors of HDF and netCDF. New data products can easily be supported using an XML-based configuration. MIIC tuple and profile server-side functions return filtered native resolution and averaged data respectively. The tuple function returns a 1D list of filtered observations for each requested data variable. Filtering is global in scope in that each filter modifies a mask applied to all requested variables. Multiple filters are chained together. The profile function performs histogram binning in multiple dimensions (1D-3D). Any variable can be used to define a histogram axis. Bin statistics for each profile parameter include count, average, and standard deviation. Visualizations of 1D and 2D profiles using HighCharts are shown in Section 4. Data mutation is implemented using dynamic expressions of one or more data variables within the file. Dynamic expressions are implemented using the C++ Mathematical Expression Toolkit Library (ExprTk) [16]. For security reasons the dynamic expressions are defined within secure YAML Ain’t Markup Language (YAML) files hosted on each OPeNDAP server. Expressions can only be called by name within a URL command. The primary MIIC server-side functions include nested calls to other utility functions. MIIC OPeNDAP server-side commands use the following HTTP protocol URL syntax: Each command identifies the OPeNDAP server, data file, response type, e.g., .nc (NETCDF3), and query containing nested server-side function calls to any depth.

4. MIIC Services and Results

MIIC provides event prediction, data acquisition, and analysis web services.

4.1. Event Prediction Services

The MIIC event prediction service finds collocated, near-coincident measurements from separate spacecraft instruments with similar viewing zenith, solar zenith, and relative azimuth angles. The MIIC event prediction algorithms [10] support both LEO-LEO and LEO-GEO inter-comparisons. The prediction service also locates data over user-defined Earth surface sites. The algorithm uses the open source orbit propagator SGP4 [17] software and two-line elements (TLEs) provided by Space-Track.org. A two-line element contains a list of orbital elements of an Earth-orbiting object for a given point in time. Predictions can be performed for any requested time period, days to years, as long as the satellite TLEs are available. The TLE ASCII text format is the de facto standard for distribution of Earth-orbiting orbital state vectors of satellites in the Earth-centered inertial coordinate system. The MIIC prediction service is fast and efficient since data files are not processed to determine event locations. Events are predicted using two-line elements, orbit propagation software, and instrument scan models. LEO instruments are assumed to be cross-track scanners. The event predictor outputs a series of latitude-longitude bounding boxes that define Earth regions containing matched data from one or more spacecraft. Predicted instrument scan times that transect each event box are used to access data files from online repositories.
The current MIIC LEO-LEO event prediction process is depicted in Figure 3 and defined in [10]. The event opportunities are based on the time when the reference instrument (P) field of view (FOV) pointing vectors are within the blue tent structure constructed with the target instrument location at A and fictitious locations at A+ and A− corresponding to user-defined maximum allowable observation time difference. The time difference is tunable and is typically given a value between two and 10 min for scene reflectance to remain comparable. As long as P is within the tent structure its observations are within the allowable time difference with A. Orbit inclination angles, altitude differences, and time of year affect the frequency of events. The number of inter-calibration events may vary from one month to the next. The output longitude-latitude event boundary is trimmed to include only the region that contains matching observations based on viewing zenith, relative azimuth, and solar zenith angle settings. The current MIIC event prediction algorithm assumes that both target and reference instruments are cross-track scanners.
Table 1 shows the effect of spacecraft orbit altitude differences on frequency of events. The event prediction algorithm requires that each satellite orbit be at a different altitude so that one spacecraft passes under the other. Satellites at the same altitude essentially never cross. There are approximately 40 potential events per month for ISS versus SNPP instruments, compared to only 11 potential events per year for METOP-A versus SNPP instruments. For LEO-LEO inter-comparisons a user can set the event prediction parameters defined in Table 2. Nominal event prediction settings for daytime events are Δ θ v < 15°, Δ φ v < 30°, θ s < 75°, and twin < 2.5 min.
A predicted LEO-GEO event is depicted in Figure 4 for Aqua MODIS vs. GOES-13. The rectangles demarcate daytime events with solar zenith angle < 75°, and viewing zenith and relative azimuth angle differences within 10° and 20° respectively. For this case we are searching for simulated MODIS pointing vectors within a ± 55 °   scan angle co-aligned with the GEO instrument pointing vectors. Simulated instrument pixels have 1 km resolution. For each LEO simulated pixel, corresponding GEO viewing zenith, solar zenith, and relative azimuth angles are calculated. Purple pixels depict where LEO and GEO viewing zenith angles differ by less than 10°. Light blue pixels correspond to relative azimuth angles differences that are less than 20°. Dark blue pixels indicate when both conditions are met. The geographic bounding boxes identify regions that contain matching observations. In a future software release the dark blue pixel locations will be exported to a file to simplify the spatial matching handled outside of MIIC. There are five LEO orbits that intersect the GOES-13 FOV with footprints that meet filter criteria. The time coverage and geographic coordinates for each rectangle are passed to the MIIC data acquisition service.
The CLARREO event prediction algorithms are integrated into the MIIC software. Users may run predictions and show event locations on Google Maps using the MIIC web interface. This is a powerful feature for studying global coverage prior to acquiring the data. Figure 5 shows a Mercator satellite view of a full month of predicted daytime events for ISS versus Aqua. Each red box depicts the geographic spatial coverage for a single inter-calibration event.

4.2. Data Acquisition Services

MIIC intelligently selects, acquires, and aggregates matched instrument data from data center online archives. The MIIC data acquisition controller uses the event definitions contained in the ICPlan to acquire data over the network using the OPeNDAP network protocol [2]. Only instrument data within each event latitude-longitude bounding box are acquired. The controller uses the predicted event time range to select the appropriate files from the MIIC-compatible OPeNDAP servers. The controller processes events in parallel. ICPlan metadata and status are stored in the MIIC database. Custom MIIC OPeNDAP server-side functions perform filtering, spectral and spatial convolution, and histogram analysis within the remote servers. This combination of event prediction and server-side functions eliminate the need to transfer large volumes of data files in their entirety, thus reducing data center and user network bandwidth and disk storage consumption.
The controller builds HTTP commands based on the desired collection strategy and server-side function. There are three main collection modes: surface site, LEO-LEO, and LEO-GEO. Data can be returned as flat arrays, multi-dimensional arrays, or averaged data in 1D–3D histogram grids. Spatial and spectral convolution server-side functions have been implemented but only support a few specific instruments. MIIC services are designed to be generic, i.e., work on any data type and data product. The data collector locates files using a catalog search mechanism built on top of the Hyrax Thematic Real-Time Environmental Distributed Data Services (THREDDS) handler. Data are returned from the OPeNDAP servers in NetCDF3. OPeNDAP servers must be configured to accept POST commands since many of the MIIC URL requests are too large for GET commands and must be contained within the HTTP POST message body. The MIIC tiered design prevents overloading OPeNDAP servers. The OPeNDAP Lightweight Frontend Servlet (OLFS) configuration limits the number of simultaneous HTTP requests based on the number of Back-end Server (BES) processes available. The current LaRC ASDC deployment has two back-end servers, each providing 32 BES processes (one per CPU core). The MIIC controller within the application tier manages an event queue to fairly share available HTTP request slots among all users.
MIIC subsets and filters data on remote servers without first having to transmit the entire dataset collection. One month of Aqua L1B MODIS and GOES-13 imager data consists of approximately 9672 files (1.4 TB). The event prediction algorithm finds near-coincident observations with similar viewing conditions to reduce the number of files transmitted by a factor of 22. Server-side equal-angle gridding (2DProfile) reduces the data by an additional factor of 34. The final matched gridded MODIS/GOES-13 samples are contained in 808 files (1.8 GB). This is consistent with recommended GSICS LEO/GEO inter-calibration algorithms that typically require less than 0.1% of the total data volume. We have demonstrated similar data volume savings using server-side spatial and spectral convolution algorithms to compare L1B SCanning Imaging Absorption SpectroMeter for Atmospheric CHartography (SCIAMACHY) data (5287 spectral bands, 240–1748 nm, 30 km × 240 km) with L1B MODIS band 1 (0.65 μm, 1 km). Spectral convolution of MODIS Band 1 (0.65 μm) relative spectral response (RSR) values with hyperspectral SCIAMACHY data reduces the 5287 spectral values to one simulated reflectance value. Spatial convolution of 1 km MODIS pixels within the 30 km × 240 km SCIAMACHY footprints accounts for a reduction factor of 7000 at nadir. These two examples show orders of magnitude savings in data transmission. Powerful event prediction and server-side processing simplify data accessibility and enable researchers to focus more on analysis tasks.

4.2.1. LEO-LEO Data Acquisition

Figure 6 shows the full-resolution data acquired for the matched LEO-LEO event, SNPP VIIRS versus Aqua MODIS, over Antarctica for 3 January 2015. The top image shows SNPP VIIRS reflectance band I1, 0.64 μm; the bottom image shows Aqua MODIS reflectance band 1, 0.62–0.67 μm. Scale and offset metadata parameters within the HDF products are automatically applied to the data within MIIC server-side functions. MODIS reflectance data are stored within the data product as ρ cos θ s , where ρ is reflectance and θ s is solar zenith angle. To match VIIRS reflectance ( ρ ) the solar zenith angle correction is removed using a server-side expression (divide by cos θ s ). Application of metadata parameters and data mutation expressions are enabled in MIIC system data product configuration files. For this scene, the mean difference of matched grid cells in reflectance is 0.0053 (1.1% of the scene mean reflectance of 0.478). MIIC acquires matched data from multiple instruments and performs quality control-type analyses of the data. The image in Figure 6 is generated using the MIIC interactive web analysis plugin (discussed in Section 4.3). The CLARREO Pathfinder mission will use MIIC to acquire target instrument data for LEO-LEO inter-calibration.

4.2.2. LEO-GEO Data Acquisition

Figure 7 shows full-resolution data acquired for a single matched LEO-GEO event. The top image shows Aqua CERES shortware flux; the bottom image depicts GOES-13 shortwave albedo. Both images are generated from data acquired over the GOES-East Imager Southern Hemisphere Scan Sector region (20°–40°S, 80°–40°W) on 30 January 2014. The source data are contained in 10 files (458.6 MB); 27.9 MB of data are retrieved within this region and stored in the application tier cache. Data are binned by longitude and latitude for inter-comparison. The image in Figure 7 is generated using the MIIC interactive web analysis plugin. Histogram profile statistics include the mean value, standard deviation, and count for each selected parameter (in this case shortwave flux and albedo) for each latitude-longitude bin.

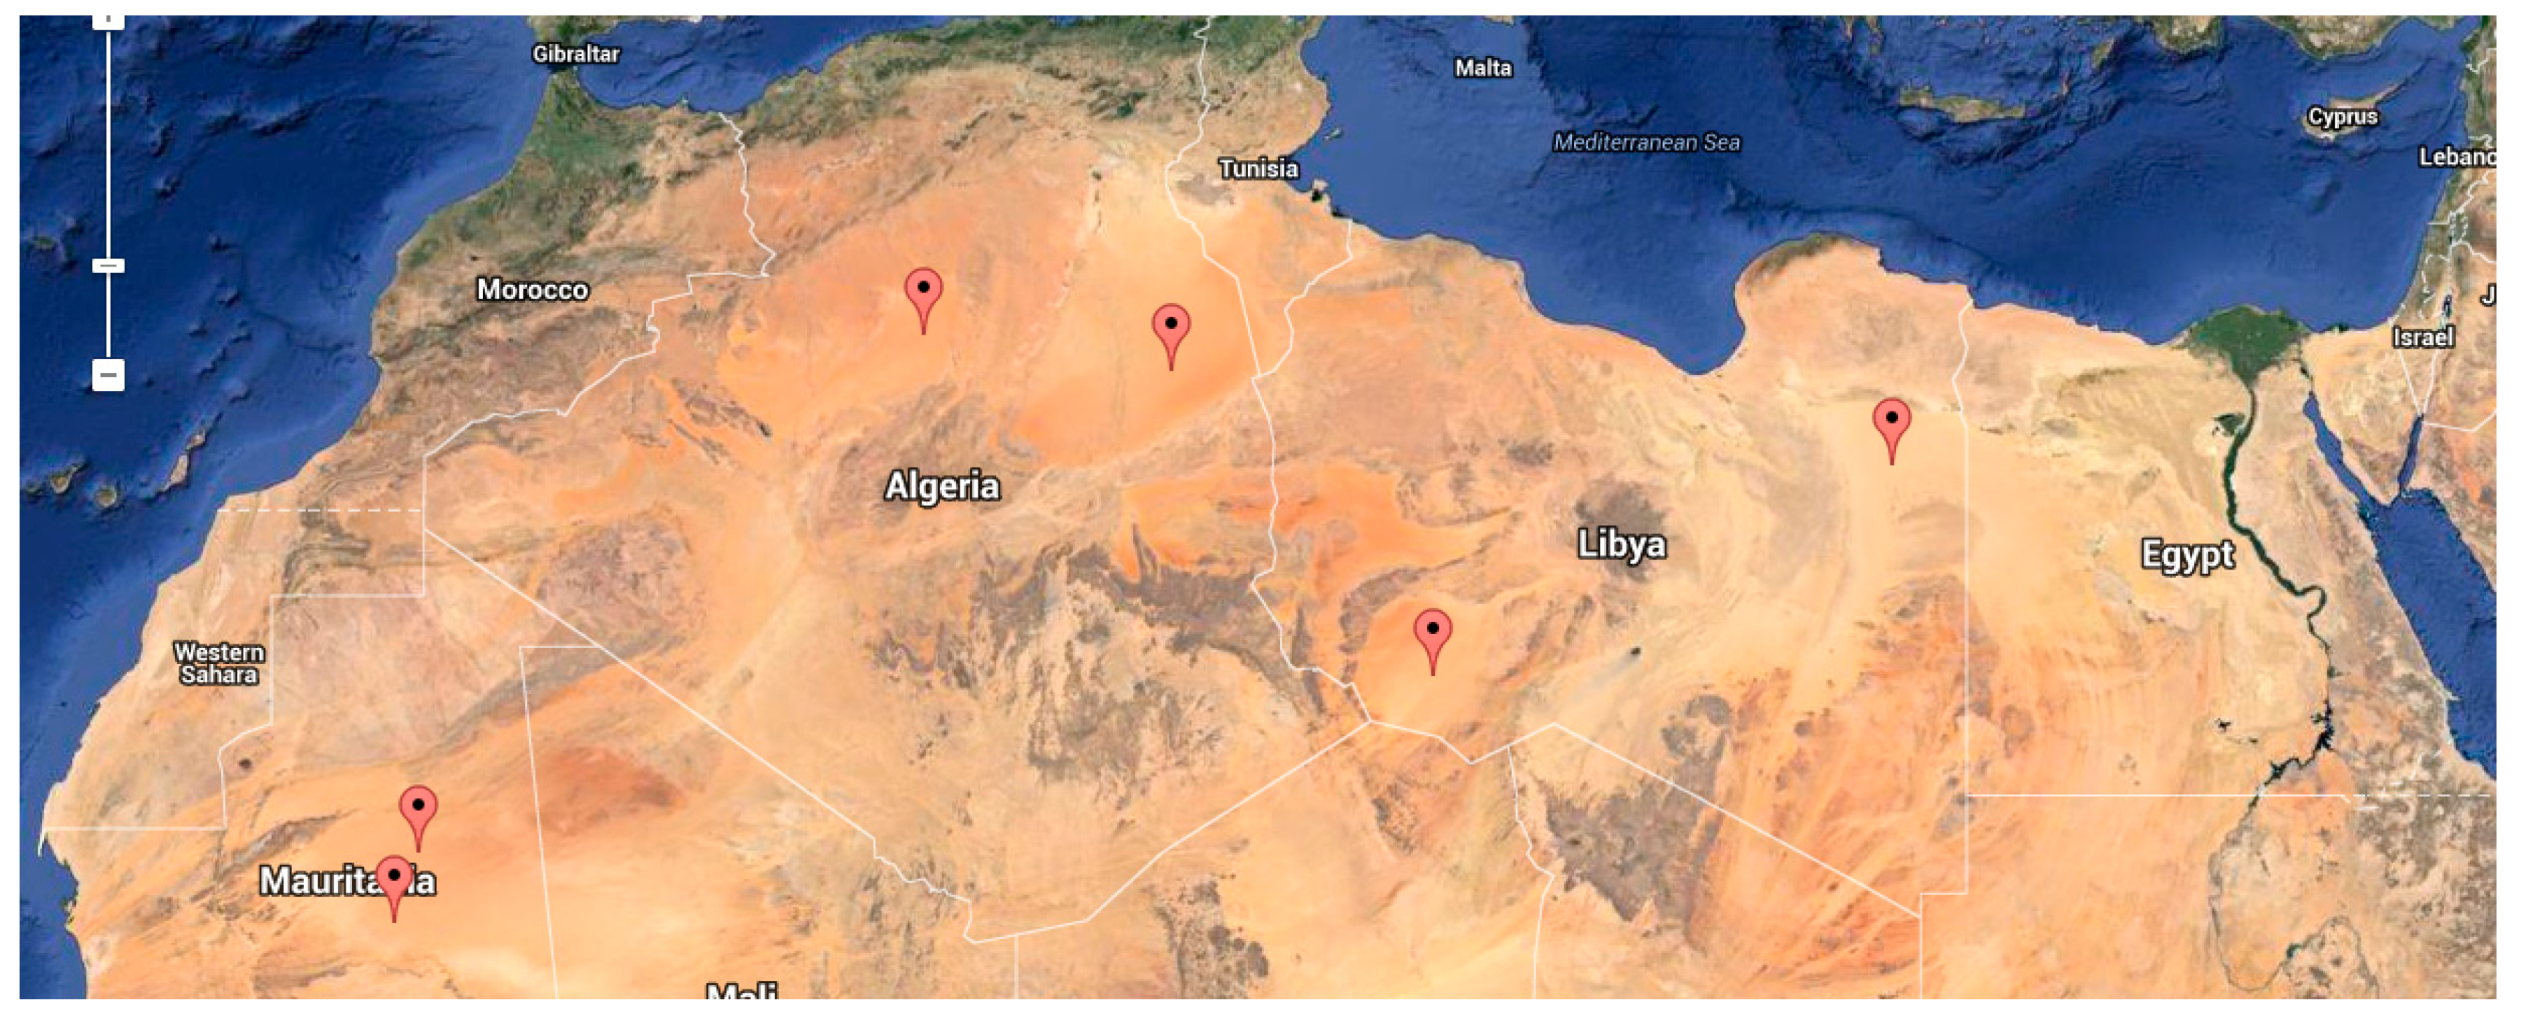
4.2.3. Surface Site Data Acquisition

The surface site acquisition mode is useful for vicarious calibration studies. Figure 8 shows VIIRS I1 reflectance data acquired over North Africa for the month of January 2014. The VIIRS data are filtered for M15 brightness temperature greater than 300 °K within the tuple server-side function to eliminate cloudy pixels from acquisition. The entire North African region is too inhomogeneous for inter-calibration since dispersion, defined as σ / x ¯ , is 21.7% even after cloud filtering. Homogeneous desert sites are typically very small, less than 50 km in diameter. The bright region around 25N, 13E is a recommended CEOS reference site (Libya-1).
The CEOS Infrared and Visible Optical Sensors (IVOS) working group has endorsed a set of globally-distributed reference standard test sites for the post-launch calibration of space-based optical imaging sensors [1]. CEOS recommends eight instrumented sites and six pseudo-invariant calibration sites (PICS) [18]. The instrumented sites are primarily used for field campaigns and inter-comparison of instrument radiometric biases. A pseudo-invariant site is a location on the Earth’s surface that is very stable, both temporally and spatially, over long periods of time. These sites, depicted in Figure 9, are used to analyze the stability of instrument calibrations and perform inter-calibrations. The MIIC system can mine satellite instrument data from any of these regions.
FiuSmith [19] accurately describes the challenges involved with analyzing multiple instrument data sets over small test sites for calibration and validation analyses. Statistical analyses require acquisition of many data samples from multiple surface sites over long time periods (years). Access to calibrated observation data for specific sites is not always straightforward. Acquiring and analyzing large volumes of data is time consuming, especially if the data of interest are located at a remote data center. The size of data products is usually very large compared to the area of interest, hundreds of megabytes of information typically need to be acquired per event. Download limits and local storage are problematic for the average user. Users must deal with multiple file formats. Acquisition of matched co-incident observations from multiple spacecraft is even more challenging. The MIIC system simplifies these data management challenges.

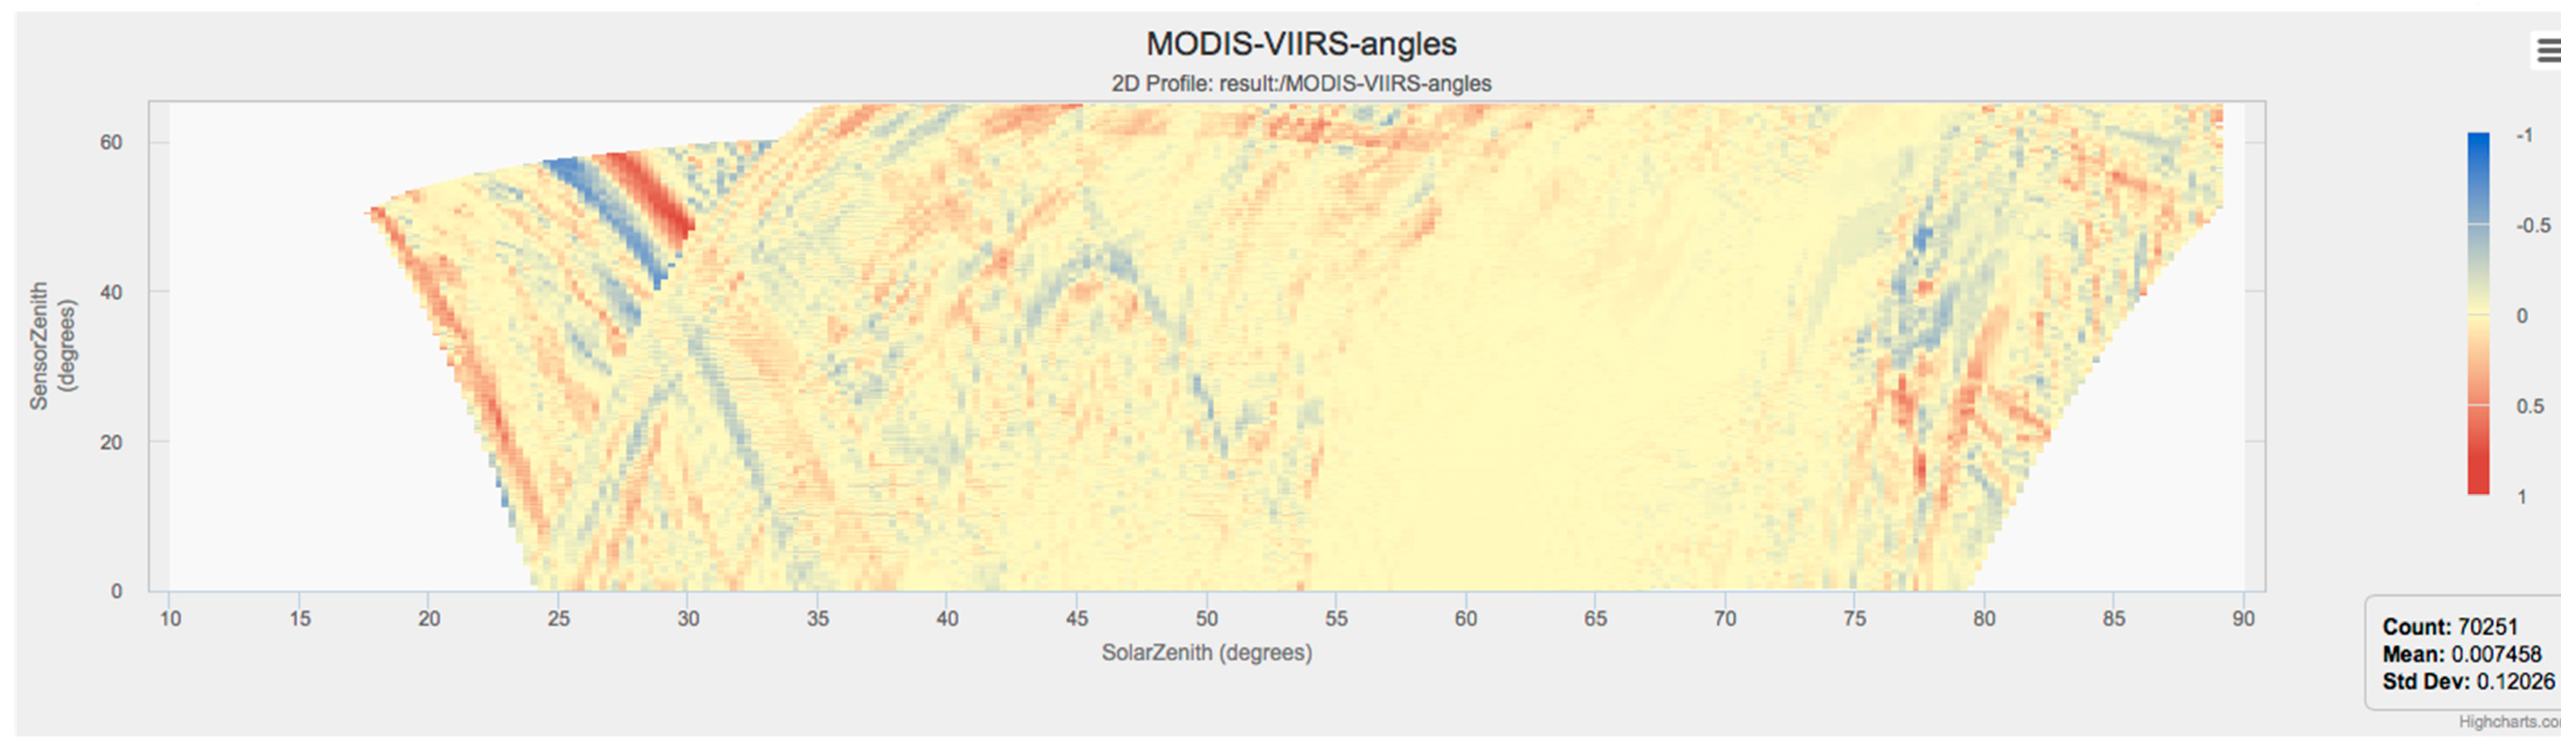
4.3. Analysis Services

The MIIC analysis plugin architecture allows users to develop data analysis routines in Java. Plugins run on the web server in the context of an executing inter-calibration plan. Users can select from available analysis plugins to define an analysis task. Analysis tasks are automatically run once the event data have been collected. The following are the key analysis features:
  • Analysis tasks may access all data retrieved by an ICPlan
  • Analysis tasks may be chained together
  • Analysis tasks may accept user input in a format defined by the plugin
  • Statistics calculations are memory intensive
  • Statistics are generated using JAIDA
AIDA is a set of abstract interfaces and formats for representing common data analysis objects used in the High Energy Physics community. The most important of these interfaces are histogram, profile, and tuple. JAIDA is the Java implementation of AIDA and part of the FreeHEP library [13]. All MIIC analyses are based on JAIDA. Interactive plots of MIIC analyses are generated using the interactive HighCharts JavaScript library. Analysis results are exported to file for further offline analysis.
Figure 10 shows the trend analysis of nine years of CERES unfiltered shortwave radiance data, 2006–2014, collected using the MIIC surface site acquisition mode over the Libya-1 calibration site. The plot shows a 1DProfile calculated within the MIIC Analysis Plugin. Data are filtered for solar zenith (<60°) and viewing zenith (<30°) during acquisition within the tuple server-side function. The CERES data show the seasonal cycle and excellent long-term calibration stability. MIIC excels at acquiring data for time series analysis.
El Niño is an anomalous, yet periodic, warming of the central and eastern equatorial Pacific Ocean. Every two to seven years this patch of ocean warms for six to 18 months. Figure 11 shows 13 years of L2 CERES sea surface temperature (SST) observations collected over the Nino 3 (5°N–5°S, 150°W–90°W) region using MIIC and compared with the NOAA monthly ocean time series climate indices published at the NOAA Climate Prediction Center [20]. The CERES trend results are exported from the MIIC 1DProfile analysis and analyzed in an external Python program since the NOAA data are not accessible to MIIC. The mean difference in temperature between the two time series is 0.17 °C. The NOAA and CERES time series derived from different instrument observations are strongly correlated (R = 0.99535).
The MIIC web-based tiered collection of software simplifies acquisition of matched data for inter-comparison scientific studies. The MIIC analysis plugin architecture provides a mechanism for implementing common analyses and visualizations for initial assessment of matched observation data. The MIIC analysis plugin is not intended to compete with many of the excellent standalone analysis packages that already exist. Figure 12 show how well MODIS band 1 matches VIIRS band I1 in reflectance for various solar zenith and viewing zenith angles. The 2DProfiles contain grid cells ~0.25° in solar zenith–viewing zenith angular grid space. The difference plot capability allows users to identify anomalies or significant trends in the data. The scene contains a mixture of ocean, clouds, and snow and ice over Antarctica on 3 January 2015. Additional error analyses will be performed outside of MIIC to analyze observations better matched in viewing geometry and scene type. For optimum inter-calibration results observations need to match in space, time, wavelength, and view angles.

5. Conclusions

The Multi-Instrument Inter-Calibration (MIIC) system is deployed at the NASA LaRC Atmospheric Science Data Center with access to more than 6 PB of online data. MIIC can access data from both local and remote OPeNDAP servers using powerful custom server-side functions. The MIIC system simplifies data access to support inter-calibration. MIIC will support the NASA CLARREO Pathfinder mission by predicting and acquiring time-, space-, and angle-matched target instrument data (CERES and VIIRS) with the accurate CLARREO Reflected Solar spectrometer. MIIC is a distributed web-based system that predicts, locates, and acquires matched event data housed within multiple data centers. This combination of event prediction and powerful server-side functions reduces the data volume required for inter-calibration studies by several orders of magnitude, dramatically reducing network bandwidth and disk storage needs. MIIC software can be deployed at large institutional data centers to ease access to satellite instrument data in support of scientific analysis.

Acknowledgments

This research has been supported by the NASA Advancing Collaborative Connections for Earth System Science (ACCESS) Program and the NASA CLARREO project. The CERES and CALIPSO datasets were obtained from the NASA Langley Atmospheric Sciences Data Center. VIIRS and MODIS data were obtained from the GSFC Level 1 and Atmosphere Archive and Distribution System (LAADS). In the near future MIIC software will be available from the NASA Earth Observing System Data and Information System (EOSDIS) Earthdata Code Collaborative repository.

Author Contributions

Chris Currey analyzed the data and wrote this manuscript. Aron Bartle developed the MIIC software. Carlos Roithmayr developed the event prediction algorithms. Constantine Lukashin defined the histogram analysis features.

Conflicts of Interest

The authors declare no conflict of interest.

References

  1. Chandler, G.; Hewison, T.; Fox, N.; Wu, X.; Xiong, X.; Blackwell, W. Overview of Intercalibration of satellite instruments. IEEE Trans. Geosci. Remote Sens. 2013, 51, 1056–1080. [Google Scholar] [CrossRef]
  2. OPeNDAP Hyrax Server. Available online: http://www.opendap.org/ (accessed on 27 October 2016).
  3. Space-Track Satellite Two Line Element (TLE). Available online: https://www.space-track.org/ (accessed on 27 October 2016).
  4. Wielicki, B.; Young, D.; Mlynczak, M.; Thome, K.; Leroy, S.; Corliss, J.; Anderson, J.; Ao, C.; Bantges, R.; Best, F.; et al. Achieving climate change absolute accuracy in orbit. Bull. Am. Meteorol. Soc. 2013. [Google Scholar] [CrossRef]
  5. Uprety, S.; Cao, C.; Xiong, X.; Blonski, S.; Wu, A. Radiometric intercomparison between Suomi-NPP VIIIRS and Aqua MODIS reflective solar bands using simultaneous nadir overpass in the low latitudes. J. Atmos. Ocean. Technol. 2013, 30, 2720–2736. [Google Scholar] [CrossRef]
  6. Loeb, N.; Priestley, K.; Kratz, D.; Geier, E.; Green, R.; Wielicki, B.; Hinton, P.; Nolan, S. Determination of unfiltered radiances from the Clouds and Earth’s Radiant Energy System (CERES) instrument. J. Appl. Meteorol. 2001, 40, 822–835. [Google Scholar] [CrossRef]
  7. Loeb, N.; Manalo-Smith, N.; Su, W.; Shankar, M.; Thomas, S. CERES Top-of-atmosphere earth radiation budget climate data record: Accounting for in-orbit changes in instrument calibration. Remote Sens. 2016. [Google Scholar] [CrossRef]
  8. Haeffelin, M.; Wielicki, B.; Duvel, J.; Priestley, K. Inter-calibration of CERES and ScaRaB Earth radiation budget datasets using temporally and spatially collocated radiance measurements. Geophys. Res. Lett. 2001, 28, 167–170. [Google Scholar] [CrossRef]
  9. Priestley, K.; Wielicki, B.; Green, R.; Haeffelin, M.; Lee, R.; Loeb, N. Early radiometric validation results of the CERES flight model 1 and 2 instruments onboard NASA’s terra spacecraft. Adv. Space Res. 2002, 30, 2371–2376. [Google Scholar] [CrossRef]
  10. Roithmayr, C.; Lukashin, C.; Speth, P.; Kopp, G.; Thome, K.; Wielicki, B.; Young, D. CLARREO approach for reference intercalibration of reflected solar sensors: On-orbit data matching and sampling. IEEE Trans. Geosci. Remote Sens. 2014, 52, 6762–6773. [Google Scholar] [CrossRef]
  11. NRC. Earth Science and Applications from Space: National Imperatives for the Next Decade and Beyond; The National Academy Press: Washington, DC, USA, 2007. [Google Scholar]
  12. Highcharts. Available online: http://www.highcharts.com/ (accessed on 27 October 2016).
  13. JAIDA—AIDA in Java, FreeHEP Java Libraries. Available online: http://java.freehep.org (accessed on 27 October 2016).
  14. Spring Framework. Available online: https://projects.spring.io/spring-framework/ (accessed on 27 October 2016).
  15. Hibernate. Available online: http://hibernate.org/ (accessed on 27 October 2016).
  16. C++ Mathematical Expression Toolkit Library (ExprTk). Available online: http://www.partow.net/programming/exprtk/ (accessed on 27 October 2016).
  17. Vallado, D.; Crawford, P.; Hujsak, R.; Kelso, T. Revisiting spacetrack report #3. In Proceedings of the AIAA/AAS Astrodynamics Specialist Conference, Keystone, CO, USA, 21–24 August 2006.
  18. USGS Remote Sensing Technology. Available online: http://calval.cr.usgs.gov/ (accessed on 27 October 2016).
  19. Smith, D.; Cox, C. (A)ATSR solar channel on-orbit radiometric calibration. IEEE Trans. Geosci. Remote Sens. 2013, 51, 1370–1382. [Google Scholar] [CrossRef]
  20. NOAA Climate Prediction Center. Available online: http://www.esrl.noaa.gov/ (accessed on 27 October 2016).
Figure 1. Free flyer concept using active pointing to match CLARREO scans (red) across the Suomi National Polar-orbiting Partnership (SNPP) satellite instrument scan width (green). CLARREO provides reference SI-traceable spectra for operational sensors that cannot achieve climate change accuracy directly.
Remotesensing 08 00902 g001
Figure 2. MIIC data system architecture.
Remotesensing 08 00902 g002
Figure 3. MIIC LEO-LEO event prediction tent structure.
Remotesensing 08 00902 g003
Figure 4. LEO-GEO event prediction, Aqua MODIS vs. GOES-13, 1 January 2011, daytime.
Remotesensing 08 00902 g004
Figure 5. MIIC event prediction web interface, ISS versus Aqua, one month predicts for January 2015; twin = 10 min, vzmax = 180°, szmax = 75°.
Remotesensing 08 00902 g005
Figure 6. Single matched LEO-LEO event for VIIRS (top) and MODIS (bottom), 3 January 2015 over Antarctica. The mean difference between MODIS and VIIRS reflectance is 0.0053 (σ = 0.0177) for matched grid cells of size 0.3°.
Remotesensing 08 00902 g006
Figure 7. Single matched LEO-GEO event acquired from Aqua CERES (top) and GOES-East Imager (bottom), 30 January 2014 over South America.
Remotesensing 08 00902 g007
Figure 8. Surface site acquisition, North Africa (20°–30°N, 4°–20°E); VIIRS band I1 reflectance, August 2014; server-side cloud filter M15 BT > 300 K; scene reflectance dispersion σ / x ¯ = 21.7%.
Remotesensing 08 00902 g008
Figure 9. The North Africa surface above is a mixture of rock and desert and is non-homogeneous in reflectance. The bright homogeneous region in the center of this image is CEOS site Libya-1.
Remotesensing 08 00902 g009
Figure 10. MIIC Analysis Plugin Results, CERES SW unfiltered radiance over Libya-1; nine years of CERES data collected and analyzed using MIIC; 1233 events detected, and 6361 CERES observations are processed; data are filtered for θ s   < 60° and θ v   < 30°.
Remotesensing 08 00902 g010
Figure 11. MIIC collected CERES SST observations (red) vs. NOAA monthly time series (blue) for Nino 3 the Central Tropical Pacific (5°N–5°S, 150°E–90W); January 2003–July 2015; R = 0.99535, d i f f ¯ = −0.170 °C, σ = 0.217 °C.
Remotesensing 08 00902 g011
Figure 12. Mixed scene (ice, clouds, ocean) over Antarctica showing reflectance from VIIRS (top) and MODIS (middle) plotted against the solar zenith angle (x-axis) and viewing zenith (y-axis). For this scene the average reflectance difference is 0.0014 (0.29% of the average scene reflectance). The difference plot shows the average reflectance difference of 0.0075 (1.56%) for grid cells based on the viewing zenith and solar zenith angles.
Remotesensing 08 00902 g012aRemotesensing 08 00902 g012b
Table 1. Orbit altitude and frequency of opportunities for several LEO spacecraft pairs.
SC1SC1 Altitude (km)SC2SC2 Altitude (km)SC1 (Orbits/Day)SC2 (Orbits/Day)Crossing Period (Days)
Aqua705Envisat80014.5714.324.0
Aqua705SNPP82414.5714.192.6
METOP-A820SNPP82414.2214.1933.3
ISS404SNPP82415.5514.190.74
Table 2. User-specified LEO-LEO event prediction parameters.
EP ParameterDescription
razmax ( Δ φ v ) Maximum allowable difference in relative azimuth angles
Δ t Time increment (seconds) for orbit propagation steps (default = 1)
referenceSwathSwath width (degrees) of reference instrument
targetSwathSwath width (degrees) of target instrument
szmax ( θ s ) Maximum allowable solar zenith value for any observation
twinMaximum allowable time difference (minutes) between observations
vzmax ( Δ θ v ) Maximum allowable difference in viewing zenith angles

