Abstract
Collect Earth is a free and open source software for land monitoring developed by the Food and Agriculture Organization of the United Nations (FAO). Built on Google desktop and cloud computing technologies, Collect Earth facilitates access to multiple freely available archives of satellite imagery, including archives with very high spatial resolution imagery (Google Earth, Bing Maps) and those with very high temporal resolution imagery (e.g., Google Earth Engine, Google Earth Engine Code Editor). Collectively, these archives offer free access to an unparalleled amount of information on current and past land dynamics for any location in the world. Collect Earth draws upon these archives and the synergies of imagery of multiple resolutions to enable an innovative method for land monitoring that we present here: augmented visual interpretation. In this study, we provide a full overview of Collect Earth’s structure and functionality, and we present the methodology used to undertake land monitoring through augmented visual interpretation. To illustrate the application of the tool and its customization potential, an example of land monitoring in Papua New Guinea (PNG) is presented. The PNG example demonstrates that Collect Earth is a comprehensive and user-friendly tool for land monitoring and that it has the potential to be used to assess land use, land use change, natural disasters, sustainable management of scarce resources and ecosystem functioning. By enabling non-remote sensing experts to assess more than 100 sites per day, we believe that Collect Earth can be used to rapidly and sustainably build capacity for land monitoring and to substantively improve our collective understanding of the world’s land use and land cover.
1. Introduction
Monitoring Land Use and Land Use Change (LULUC) through remote sensing is a common approach to generating necessary data for quantifying anthropogenic impacts on the Earth’s system. Land monitoring through remote sensing has traditionally been challenging due to the cost of acquiring satellite imagery and commercial software to conduct remote sensing analysis [1] and due to the high level of technical skill required to pre-process and analyze imagery and conduct a robust land assessment [2].
Remote sensing data are now used in many national and international land assessments, such as national forest inventories (e.g., France, Italy, Switzerland, USA) and the European Land Use and Land Cover Survey (LUCAS) [2,3]. These assessments have followed a multi-phase sampling approach, in which the first phase involves visual interpretation of Very High Resolution (VHR) satellite imagery, and the second phase is devoted to collecting ground-based data in the field. The use of remote sensing data during the first phase enables national and international experts to efficiently assess a large number of sites and quantify the area of land currently and historically allocated to broad land use and land cover categories. Subsequently, ground-based data gathered during the more time-demanding second phase allow experts to develop a more detailed understanding of land characteristics and variability within broad land use and land cover categories. The data resulting from the two phases are synergistic, as Phase 2 data can be used to estimate uncertainties within the spatial extent and area estimation of land use and land cover categories, while the latter can be used to extrapolate more detailed land characteristics (e.g., vegetation types, carbon stocks, etc.) from a relatively small number of field sites to the landscape level drawing upon the much larger number of sites assessed in the first phase. This method has also been adopted by countries to quantify their LULUC with low uncertainty and to address their need to report to the United Nations Framework Convention on Climate Change (UNFCCC) [4,5].
The field of remote sensing has undergone significant changes over the past decade that have helped make land monitoring more cost efficient and technically feasible for non-remote sensing experts. The cost of many type of satellite imagery has decreased; the free accessibility of imagery has increased [6,7,8,9]; and several non-commercial software packages have been developed to facilitate the analysis of imagery. The United States Geological Survey (USGS) and Google are two institutions at the forefront of these developments.
The USGS has spearheaded significant changes through its adoption of an open data policy with the Landsat imagery archive in 2008. Landsat is the world’s largest and longest running archive of satellite imagery, with imagery acquisition dating back to 1972. Its global coverage and frequent imagery acquisition (16-day revisit time) make the archive highly suitable for supporting land change monitoring. Prior to 2008, the cost of Landsat imagery ranged from USD20–4000 depending on the image format, the sensor and the imagery acquisition date. Four years after making the archive freely available, the number of image downloads each month rose from under 3000 to over 250,000, exponentially increasing the use of satellite imagery for land monitoring [10].
Google released Google Earth in 2005, a virtual globe desktop software, enabling users to freely view medium, high and very high spatial resolution satellite imagery. The best imagery available for each site is automatically loaded in Google Earth’s user-friendly software that allows users to zoom into any place on Earth while the software seamlessly manages ten petabytes of geographic information [11]. Google Earth software offers users a level of vertical integration that was not previously available within the field of remote sensing. In the past, companies that developed image processing software were distinct from those that launched satellites and acquired satellite imagery, while the service providers with the technical expertise that used the software and imagery for remote sensing analysis often represented a third company. Thus, an individual interested in LULUC monitoring often needed to consult at least three different companies to achieve one’s Earth observation objectives. Google changed this paradigm by streamlining imagery acquisition and arduous processing (such as geo-referencing and mosaicking) to make satellite imagery ready for visual interpretation within a simple application. Google Earth has enabled many users wishing to monitor land (e.g., foresters, conservationists, indigenous leaders, etc.) to bypass the need for remote sensing experts to monitor their land. By 2011, Google Earth had been downloaded over one billion times while global Internet usage had reached around 2.2 billion worldwide, making Google Earth the world’s most popular geospatial application [12,13].
Numerous free and open source software platforms for land monitoring have been developed by building upon Google Earth and its freely accessible archive of satellite imagery. Examples of software facilitating the analysis of land use, land cover and other land characteristics include: (1) Geo-Wiki; (2) GLCF Labeling Tool; (3) LACO-Wiki; (4) SkyTruth; (5) TimeSync; (6) Tomnod and (7) VIEW-IT. An overview of the scope and functionality of the different software is provided in Table 1.

Table 1.
Overview of relevant existing free land assessment software.
Geo-Wiki, GLCF Labeling Tool, LACO-Wiki, TimeSync and VIEW-IT are designed to facilitate visual interpretation of land cover and/or land use data primarily for the purpose of map validation at any scale, local to global, but these tools can be used for other purposes, as well [14,15,16,17,18]. In contrast, Skytruth and Tomnod were developed to collect very specific types of information, such as the spatial extent of land degradation due to mountain-top removal mining or natural disasters [19,20]. Many of these free and open source tools (e.g., Geo-Wiki, VIEW-IT, Skytruth and Tomnod) have been developed by non-governmental organizations or academic institutions to enable the crowdsourcing of volunteered geographic information (VGI) by non-remote sensing experts [8]. However, GLCF Labeling Tool, LACO-Wiki and TimeSync were designed mainly for remote sensing experts [16].
All of these software packages draw upon one or two archives of satellite imagery: one with VHR imagery (in Google Maps or DigitalGlobe’s web mapping interface) and/or one archive of medium-(Landsat) or coarse-resolution (MODIS) imagery. VIEW-IT, GLCF Labeling Tool and TimeSync also display automatically generated time series of vegetation indices and the results of other image processing algorithms.
Despite the aforementioned developments, significant challenges remain for monitoring LULUC through remote sensing. Google Maps and Google Earth and the software mentioned above facilitate visual interpretation through VHR satellite imagery (one meter or less). However, the small geographic scope and the irregular time intervals of VHR imagery acquisition limit its use for national and subnational assessments for land monitoring (including LULUC), particularly in areas with persistent cloud cover, phenological changes or rapid change. While the Landsat archive may excel in these aspects with its global geographic coverage and bi-monthly imagery acquisition, its relatively low spatial resolution (30 m) makes it difficult or impossible to identify small features in imagery and small-scale changes within landscapes that may be of interest to land monitors. Despite these limitations that impact visual interpretation of the imagery, Landsat can be extremely useful for (semi-)automated imagery analysis.
Furthermore, the application of semi-automated classification methods (e.g., pixel-based, object-based) on VHR images to develop national, regional or global maps has proven to be challenging for a number of reasons. These challenges include: (i) the high cost associated with VHR imagery; (ii) their low spatial extent (a few hundreds of km2) [1]; (iii) their relatively low availability due to their low temporal resolution and lack of global coverage [21]; (iv) the variation of radiometric properties among sensors; (v) the influence of acquisition conditions (i.e., Sun-scene-sensor angles) [22,23,24,25] and (vi) classic atmospheric perturbations (e.g., cloud, fires) [21]. All of these challenges of land use monitoring are exacerbated when assessing land use change and attempting to acquire imagery from multiple years with acquisition conditions that are sufficiently consistent to enable the comparison of land characteristics.
Here, we present Collect Earth, a free and open source software developed by the Food and Agriculture Organization of the United Nations (FAO) to facilitate the collection, management and analysis of land data. Like its predecessors, Collect Earth also enables expert and non-expert users to draw upon Google technology to freely access and visually interpret satellite imagery for data collection. Collect Earth geo-synchronizes the visualization and use of imagery of varying spatial and temporal resolutions, including DigitalGlobe, SPOT, Sentinel 2, Landsat and MODIS imagery within Google Earth, Bing Maps and Google Earth Engine [26,27,28]. Collect Earth differs from previously existing land monitoring tools by offering access to: (a) multiple archives of VHR satellite imagery that can support the assessment of land use and land cover dynamics; (b) graphical representations of inter-annual and intra-annual vegetation indices generated with Landsat and MODIS imagery in Google Earth Engine (GEE), new technology for cloud-based, automated processing of satellite imagery; and (c) built-in data analysis tools through an integration with Saiku Analytics. Collect Earth also differs from previous land monitoring software in that (d) it offers a robust data collection framework that is fully customizable by non-experts; and (e) it streamlines the use of probability sampling statistics. Collect Earth accesses three archives of satellite imagery that have an expansive coverage and collectively enable users to assess any area in the world. However, where supplementary VHR imagery has been acquired, such imagery can be imported into Google Earth (Pro) in numerous formats and immediately used for a land assessment with Collect Earth.
In remote sensing, the terms visual interpretation and photo interpretation refer to human interpretation of two-dimensional images to use visual elements, such as tone, shape, pattern, texture and shadow, to identify objects within satellite or aerial imagery [29]. While previously available free and open source land assessment software packages facilitate basic visual interpretation, Collect Earth draws upon Google Earth, GEE and Bing Maps to enable land assessment through augmented visual interpretation. Images from multiple years are supplemented by seasonal and multi-year graphs of several indices that are automatically generated by scripts within the GEE Code Editor (e.g., Landsat 8 32-day Normalized Difference Vegetation Index (NDVI), Normalized Difference Water Index (NDWI), Enhanced Vegetation Index (EVI), Moderate Resolution Imaging Spectroradiometer (MODIS) 16-DAY NDVI and Landsat 7 Monthly NDVI Composite). The visual interpretation of these indices in GEE Code Editor, in conjunction with VHR and HR satellite imagery, enable users to assess current land attributes and trends over the past 16 years more comprehensively than otherwise possible through basic visual interpretation.
Landsat 7 and MODIS, which are used to generate the vegetation index time series, were both launched in 1999. To support users interested in conducting a longer-term land assessment, Collect Earth also has functionality to indicate the presence of Landsat 5 Annual Imagery. Landsat 5 is the world’s longest-operating Earth observation satellite; however, its images are neither spatially contiguous nor available in the Earth Engine archive at regular time intervals. For each site assessed, Collect Earth generates a graphic within Earth Engine showing the number of Landsat 5 images available in the archive and their acquisition date to guide users seeking imagery dating back to 1984.
Another key difference in using augmented visual interpretation and a probabilistic sampling design to assess the land use is that it does not involve nor require any modelling or extrapolation to produce the final results. This is substantially different from common remote sensing techniques, which generally assess land through the extrapolation of a subset of training sites over an entire study area [30]. Local visual interpretation of VHR imagery is often used for training and/or validation purposes of extrapolated maps of land cover or tree cover [7,9]. In essence, Collect Earth combines these two steps by exclusively using data previously reserved for training/validation to directly produce results at a national, regional or global scale.
This paper presents a detailed overview of Collect Earth’s structure and functionality. To illustrate the application of the tool and a possible customization, an example of land monitoring in Papua New Guinea is presented in Section 3. The advantages and potential limitations of using Collect Earth for these and other assessments are subsequently discussed.
2. Materials and Methods
Collect Earth is a land monitoring system that can be divided into four main parts: (1) inputs; (2) a data collection framework; (3) a data management framework and (4) analytical tools for visualizing results and generating outputs. The inputs define the parameters of the data collection framework. Data collected are automatically managed by servers and structured within databases. The tools for analysis and data dissemination access these databases to facilitate the interpretation of land characteristics. Collectively, these four parts draw upon seven software products, three imagery archives, two supplementary data archives and two servers (Figure 1).
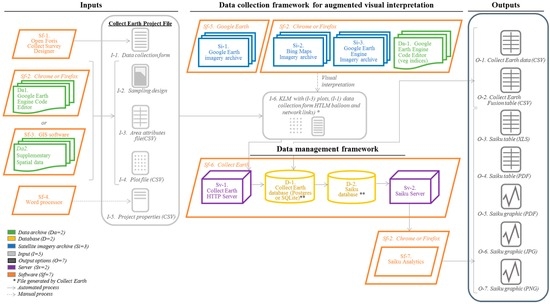
Figure 1.
Overview of Collect Earth land monitoring system with supporting software.
The Collect Earth software is free, open source and available with a comprehensive user manual on the Open Foris website (www.openforis.org) and Github code repository [31,32]. The software is Java-based and runs on Windows, Mac and Linux operating systems. Most of the supporting software is bundled inside the Collect Earth installer, while the remaining software products (Google Earth, a web browser and Open Foris Collect) are freely available online [33,34,35,36]. The Collect Earth installation file and user manual are also available as Supplementary Materials.
2.1. Collect Earth Inputs
Collect Earth is fully customizable and can be configured to serve a wide variety of land monitoring purposes at the global, regional, national and sub-national scale (Table 2). Each unique Collect Earth customization has its own Collect Earth Project (CEP) package that contains parameters and other inputs to configure the data collection framework. The CEP inputs can be summarized as follows:
Table 2.
Collect Earth customizations and applications.
Each of these inputs can be customized separately in terms of content and language. Examples of different applications and customizations of Collect Earth are presented in Table 2.
2.1.1. Data Collection Form
The data collection form (Figure 1, I-1) is a series of multiple-choice prompts and text entry fields that guide a Collect Earth user to record information on specific land attributes. Several default data collection forms are available online; however, users can also design their own forms in any language using Open Foris Collect, a free and open source software also developed by FAO [36].
2.1.2. Sampling Design
The sampling design (Figure 1, I-2) determines the spatial distribution of sites to be assessed and the extent to which land attributes of the sites can represent the entire area of interest. Sites assessed in Collect Earth are delineated by plots. Probabilistic sampling designs select plots through a process that gives all areas within the assessment a known chance of being selected. Common examples include simple random sampling, stratified sampling and stratified systematic sampling. In contrast, non-probabilistic sampling designs lack a known probability of inclusion, which allows statistical inferences to be made from the sample. Such sampling designs include those based on convenience, personal judgment or quotas. Collect Earth can support any type of sampling design. When used for multi-temporal land use or land cover assessments, it can also enable estimates of areas of change with lower costs, smaller classification bias and timelier results [37]. Probability sampling is also necessary for estimating sampling errors and uncertainties in land area estimates [38].
2.1.3. Area Attributes
Collect Earth is designed to exploit the benefits of probability sampling by facilitating area estimations and proportional land compositions. When using a systematic sampling design, the area attributes CSV file (Figure 1, I-3) enables Collect Earth to calculate the area represented by each plot. When more complex probabilistic sampling designs are used, such as random restricted sampling, the area attributes file adjusts the weighting of each plot and automatically calculates plot expansion factors and the spatial extent of each attribute.
2.1.4. Plot File
The plot file (Figure 1, I-4) is a CSV containing the geographic coordinates and unique identifier of each plot, along with any supplementary data that may be useful for analysis, but is not manually entered by the user (e.g., elevation, climate, soil data, etc.). Supplementary data can be prepared in GEE Code Editor or any GIS software and added to the plot file CSV that is imported into Collect Earth [39].
2.1.5. Project Properties
The size and shape of plots and the number of sampling points within each plot can be specified in the project properties CSV file (Figure 1, I-5). The coverage of topographical elements within each plot (e.g., tree cover, roads, agricultural land, etc.) is estimated via proportions [40]. Each plot contains a certain number of sample points, each presenting a discrete percentage of the total area within the plot. The percentage of the plot covered by a topographic element is the ratio of (a) the number of points overlaying the element being measured over (b) the total number of points. Area estimates for each land use or land cover class are obtained by multiplying the proportion of each class by the total area [40].
Users can also indicate which imagery archives should be launched during the assessment (e.g., GEE, GEE time lapse, Bing Maps, Google Street View, GEE Code Editor). Project properties can be defined using any word processing software or with Open Foris Collect [36].
These inputs comprise the CEP file that defines the data collection framework for land assessment through augmented visual interpretation.
2.2. Data Collection Framework for Augmented Visual Interpretation
The data collection framework for augmented visual interpretation includes satellite imagery, boundaries delimiting the plot and sampling points within the plot and graphs that present an overview of current and historic vegetation indices for an area that includes the plot. It also includes the Collect Earth data collection form (Figure 2) that guides the user to record land attributes in a systematic and structured way.

Figure 2.
Illustration of a Collect Earth data collection form including the IPCC Land Use and Land Use Change ‘card’ (a1); as well as the subdivisions per land use (a2); the land cover elements to be measured (b) and the information on the remote sensing data used to assess each plot (c).
The data collection workflow involves launching Collect Earth to automatically open Google Earth (Figure 1, Sf-5 and Si1; Figure 3) with the list of plots to be assessed in the places panel. The user can select a plot ID to zoom to the plot location and visualize the three windows of the web browser displaying geo-synchronized views of the selected plot within Bing Maps (Figure 1, Si-2), GEE (Figure 1, Si-3) and GEE Code Editor (Da-1). In total, the user has access to three archives of satellite imagery (Google Earth, Bing Maps and GEE) and one archive with satellite-derived data (GEE Code Editor).
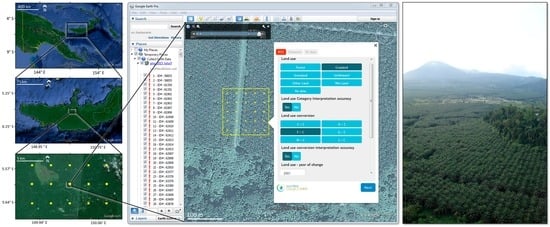
Figure 3.
Illustration of sampling design (left), project properties (center) and a Google Earth Panoramio picture of the plot layout with 25 sampling points (right).
Bing Maps (Figure 1, Si-2) is a web mapping service owned by Microsoft that features VHR satellite imagery from DigitalGlobe and other imagery providers [27]. Collect Earth’s integration with Bing Maps uses the latter’s JavaScript API to specify coordinates and initial zooming level and to make the imagery acquisition date visible. Although Bing Maps features only one layer of imagery, the geographic scope of Bing Map’s VHR imagery and acquisition date is often complementary to Google Earth’s.
GEE (Figure 1, Si-3) is a cloud computing platform for accessing, visualizing and processing satellite imagery. Its archive includes imagery provided by Landsat, MODIS and Sentinel, which collectively offer global coverage, temporal continuity (1972–present) and a spatial resolution ranging from 500 m down to 10 m. GEE is divided into two tools. The GEE graphical user interface allows users to browse through the imagery catalogue, manually load layers and perform a limited set of visualization and analytical processes. The GEE Playground is a platform where users can automate imagery visualization and analysis using JavaScript and Python. In both GEE tools, publically available imagery from the GEE archive or private imagery can be used [41].
Collect Earth processes the CEP input files to generate a network-linked KML (Figure 1, Sf-6) that loads plot locations in Google Earth and links the plot layer to a web-based data collection form. The integration with Google Earth enables users to freely view medium, high and very high spatial resolution (30 m down to sub-meter) satellite imagery provided by Landsat, Digital Globe (including IKONOS and QuickBird), SPOT and other suppliers. Unlike Google Maps, Google Earth presents multiple layers of imagery with different acquisition dates in many locations on Earth. For some plots, the current and historic VHR imagery within Google Earth is sufficient for assessing land use and land cover change (Figure 4). Google Earth is constantly augmenting its archive and extending its coverage of VHR satellite imagery [42].

Collect Earth’s integration with GEE Code Editor (Figure 1, Sf-2; Figure 5c) enables users to move beyond basic visual or photo interpretation by automatically processing years of satellite imagery to present satellite-derived data overviews that supplement photo interpretation. The GEE Code Editor’s default configuration in Collect Earth simultaneously displays: (a) line graphs of inter-annual (15-month) and intra-annual (15-year) vegetation indices, such as NDVI, NDWI and EVI derived from Landsat 7, Landsat 8 and MODIS imagery; as well as (b) true and false color composites of Landsat and Sentinel 2 current and historic imagery. The vegetation indices are generated by plotting the vegetation index value of the pixel containing the plot for each date that imagery is available (Figure 4). In the default configuration of Collect Earth, persistent clouds and cloud shadows will interfere with the index values gathered from ground-based features in the landscape [43]. The imagery and analytical processes used to generate the vegetation index charts can be modified in GEE Code Editor; however, the historic time range possible will be limited by the imagery acquisition dates of the archives referenced (for example, Landsat 7 was launched in 1999, and its data became available globally from 2001 onward). Collect Earth uses a Selenium WebDriver API and JavaScript commands to geo-synchronize plot locations and trigger imagery processing in the GEE Code Editor.
As the user performs augmented visual interpretation with Google Earth, Bing Maps and GEE, the user enters and saves qualitative and quantitative information about land attributes in the Collect Earth data collection form that appears within Google Earth as a HyperText Markup Language (HTML) balloon.
2.3. Data Management Framework
Collect Earth’s data management framework uses a Jetty server (Figure 1, Sv-1) to link data entered in the HTML balloon within Google Earth (Figure 1, Sf-6) to the Collect Earth database (Figure 1, D-1). The structure of the database is consistent with the structure outlined in the Collect Survey Designer (Figure 1, Sf-1), and it includes all of the data manually entered in the Collect Earth data collection form, as well as supplementary data the user added to the plot file and metadata generated by the system, such as plot assessment date and user. By default, Collect Earth uses an SQLite database that is stored locally on each user’s computer (i.e., allowing users to work individually). However, a Postgres database can also be configured to enable users on a single network to automatically pool data into the same database (i.e., allowing multiple users to work on the same assessment simultaneously through a shared network). Whether using an SQLite or Postgres database, Collect Earth also generates data tables that can be shared and backed up.
2.4. Data Analysis and Reporting
Collect Earth’s data management framework prepares the data for analysis by duplicating the Collect Earth database and automatically formatting it for use by Saiku Analytics to facilitate data interpretation and visualization for non-experts. A table can also be generated directly from Collect Earth to be exported and used with other statistical analysis software, such as R or Excel.
2.4.1. Saiku Analytics
Saiku Analytics (Figure 1, Sf-7) is a web-based software that enables users to visualize and analyze data through a simple, drag-and-drop interface. Collect Earth’s integration with Saiku launches the application and directs Saiku server to Collect Earth database that is pre-formatted for the application’s use. Saiku’s workspace lists all of the data attributes and basic units of analysis or measurement as blocks that users can easily manipulate to build analytical queries. Users run queries by selecting the data attributes in which they are interested. The results are presented in a tabular format by default, but can easily be reformatted as pie charts, bar graphs, scatterplots and other graphics.
The tabular results and graphics can be exported to commonly-used formats, such as XLS (Figure 1, O-3), PDF (O-4) and JPG (O-5). The output options of Saiku analytics represent subsets of the database, while Collect Earth’s direct outputs (O1. CSV and O-2. Fusion Table) export data for all plots assessed in formats that can be imported into GEE, QGIS or other GIS software for analysis.
2.4.2. Uncertainty Analysis
When conducting a land cover or land use assessment of a region with Collect Earth using a sampling-based approach, two types of uncertainty may be quantified: the sampling error and the measurement error. The first is related to the sampling design, and the second addresses the differences observed with data from the ground. Here, we present an example of sampling error analysis that may be conducted for a land cover analysis based on a systematic sampling design.
Following the IPCC Good Practice Guidance for Land Use, Land Use Change and Forestry (LULUCF) recommendations (IPCC 2003) [40], the sampling error of the proportion of a given class i of land cover is calculated from the proportion of plots assessed with Collect Earth falling in the land cover i weighted by the total number of plots assessed. The confidence interval related to the area of the class i is then calculated as follows:
3. Application Example
This section is based on work undertaken by the Papua New Guinea Forest Authority (PNGFA) in the context of its preliminary national assessment of LULUCF with Collect Earth. The assessment was conducted between October 2013 and May 2014.
More than twenty-five government officers participated in the assessment, all of whom had extensive local knowledge and professional backgrounds in forestry and silviculture, but little or no prior GIS or remote sensing experience. Although other LULUCF assessments in Papua New Guinea have relied upon a smaller number of individuals with established GIS skills, the PNGFA team found that the use of Collect Earth software facilitated the involvement of officers with other professional backgrounds. After five days of training on the use of Collect Earth, the officers worked for varying lengths of time ranging from 5 to 64 days and completed the majority of the data collection in a four-month period. The average number of plots assessed per day by each officer working full-time (at least seven hours) was 46, with individual averages ranging from 13 to 91 plots. After several days of experience working with the Collect Earth, several officers were able to assess over 100 plots in one day.
PNGFA’s main limitation during this first assessment with Collect Earth was the Internet speed, as this directly impacts the amount of time required for imagery in Google Earth, Bing Maps and Earth Engine to load before image interpretation can occur. Standardizing land use interpretation among a large number of officers was also a significant challenge. PNGFA has subsequently addressed these issues by strengthening the Internet bandwidth and by adjusting their methodology and work space to facilitate collaboration during Collect Earth assessments.
In the 2013/2014 assessment presented in this application example, PNGFA officers recorded 45 different attributes for each of the 25,279 stratified systematic sampling plots assessed in Papua New Guinea. Land use change data were collected within a reference period from the early 1970s–2013. Land use changes between 2001 and 2013 were assessed with Collect Earth, while the assessment of land use changes prior to 2001 was based on local knowledge. For the purposes of this application example, we use a subset of the data that focuses on only five attributes and 2240 plots within three provinces: Milne Bay, North Solomon and West New Britain. The data presented here cannot be considered as final results and are solely used for illustrative purposes.
3.1. Data Collection Form
PNGFA’s data collection form was customized to gather information in a manner consistent with IPCC guidelines, thus enabling PNGFA to use the resulting data to address some of its data needs for reporting to the United Nations Framework Convention on Climate Change [44]. Figure 2 shows a sample data collection form used in Papua New Guinea for gathering land use and land use change data, as well as land cover information.
3.2. Sampling Design and Project Properties
The sampling design for the Papua New Guinea assessment was generated in QGIS with a probabilistic sampling design, enabling area estimations. In Papua New Guinea’s stratified-systematic sampling design, smaller provinces measuring less than 5000 km2 (with the exception of National Capital District) have more intensive sampling, with four-times as many plots per square kilometer as the country’s larger regions. The plot size is consistent with the minimum mapping area required to apply Papua New Guinea’s national forest definition.
The Papua New Guinea LULUCF assessment with Collect Earth uses square-shaped plots of one hectare containing 25 sampling points (Figure 3). Each sampling point therefore corresponds to approximately 4% of the plot. Data are analyzed at the plot level, while the sampling points within the plot can be used to quantify and characterize land cover within the plot. For example, canopy cover percentage within the plot can be measured to apply the canopy cover threshold of the national forest definition.
Figure 3 provides an example of the sampling design in West New Britain province of PNG (Figure 3a), the project properties (Figure 3b), as well as a picture of the plot area from Google Panoramio [45]. Google Panoramio pictures are available to users free of charge through Google Earth and allow users to exploit an additional visualization tool to assess land.
3.3. Augmented Visual Interpretation
Figure 4 presents an illustration of an LULUCF assessment based on the IPCC Guidelines for National Greenhouse Gas Inventories [40]. In Google Earth, the plot falls in an oil palm plantation in February 2011. The current land use is therefore ‘cropland’. Using the historic VHR imagery in Google Earth (without accessing any of the additional sources that Collect Earth provides), the user can observe that the land use of the same plot was ‘forest’ in March 2001, but partially cleared sometime before September 2001; by June 2003, the land use of the plot has changed to ‘cropland’. Thus, a forest-to-cropland land use change has occurred.
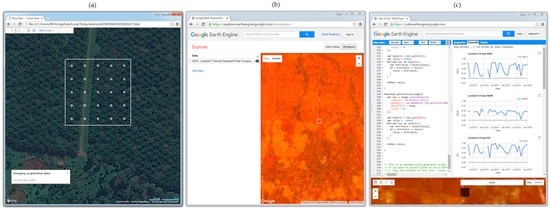
After this initial assessment in Google Earth, the user can begin evaluating the information in the additional archives Collect Earth accesses. Figure 5 presents the geo-synchronized view of the plot at different in scales in Bing Maps (Figure 5a), GEE (Figure 5b) and GEE Code Editor (Figure 5c).
The user can observe that the image in Bing Maps (dating June 2011) corroborates the observations made in Google Earth.
Loading the Landsat 7 Annual Greenest-Pixel Composite for 2014 in GEE (Figure 5b), we can observe that the plot is at the edge of a cropland plantation and forest and that the current land use for 2014 is indeed ‘cropland’.
In an assessment like PNGFA’s, the inter-annual vegetation indices in the GEE Code Editor (Figure 5c) can guide users to hone in on periods of significant change, as opposed to loading and reviewing imagery from every year of the reference period. Forest clearings can easily be detected, as well as harvests within cropland.
3.4. Data Analysis and Visualization Using the Built-In Saiku Analytics
Figure 6 presents examples of analytical queries in Saiku for (a) current land use composition; (b) land use change; (c) current land use of historic forest area; and (d) current cropland subdivisions within historic forest area in three provinces of Papua New Guinea. The bar graph, table and pie chart in Figure 6 were generated within Saiku.
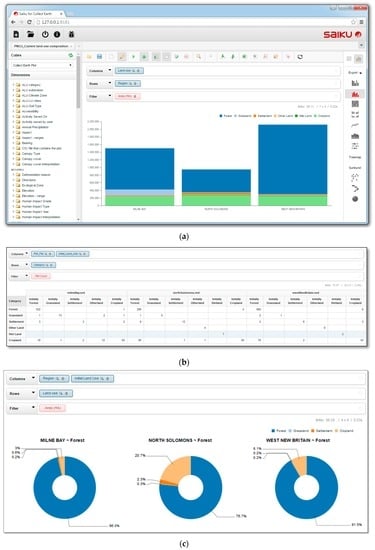
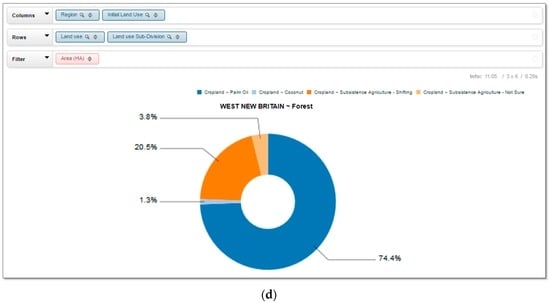
Figure 6.
Saiku analytical queries and results for (a) current land use; (b) land use change; (c) current land use of historic forest areas; and (d) current cropland subdivisions within historic forest area in Milne Bay, North Solomons and West New Britain provinces of Papua New Guinea.
Figure 6a illustrates that land categorized as ‘forest’ according to the IPCC land representation framework occupies the largest area in the three provinces.
An overview of land use conversions from the early 1970s–2013 is presented in Figure 6b as a land use change matrix. Initial IPCC land use categories are listed in the columns, while current land use categories are presented in rows. For example, of the 962 initial forest plots in West New Britain, 880 plots remained as forest, while 82 plots were converted to cropland by 2013. The land use conversion presented in Figure 6 is an example of one such forest-to-cropland conversion in West New Britain. Approximately three quarters of forest-to-cropland conversions in the province occurred within lands currently categorized as oil palm plantations. In all three provinces, the conversion of forest to other land uses constitutes a substantial portion of all land use changes. Countries can use this type of land use change matrix for international reporting.
Figure 6c focuses on the first column of the West New Britain land use change matrix, presenting the current land use composition of 2001 forest lands in pie chart format. For example, the plots in West New Britain that were converted from forest to cropland are shown in light orange. The vast majority of West New Britain’s 2001 Forest lands remained forest in 2013. In terms of forest changes to other land uses, Milne Bay, West New Britain and North Solomons present three different profiles: low-, medium- and high-level forest change.
Most forest changes that are observed in this illustrated example are forest-to-cropland conversions. Figure 6d presents these land use changes in greater detail by looking at the land use subdivisions (which were developed by the PNGFA). In this example, it provides, where possible, the type of agriculture ‘forest lands’ have been replaced by and their relative proportion. The land use composition and the land use subdivisions of an area are critical for establishing a baseline against which future changes can be assessed. Information on historical land use subdivision, such as that provided in Figure 6d, can also be useful for understanding the drivers of deforestation or other forms of land use change.
4. Discussion
Large-scale land assessments have often been conducted with several approaches: compiling national maps [46], using sampling-based approaches [47,48] or developing exhaustive maps from remote sensing products [9,49,50]. Mayaux et al. (2005) [49] underlined that sampling approaches may yield more accurate results in the case of forest distribution if based on large numbers of small units. However, existing sampling-based products [46,47] are based on a small number of large units extracted from Landsat scenes. Consequently, recent efforts were more focused on the improvement of spatially-exhaustive remote-sensing products, where experts use commercial, specialized GIS or image analysis software that run semi-automated algorithms for detecting and categorizing changes in spectral signatures in the satellite imagery of a landscape [9,49].
Commonly-used semi-automated approaches to land use and land cover (LULC) assessment may include key steps such as: (1) the selection of remotely-sensed data; (2) the determination of a suitable classification system; (3) the selection of training samples; (4) image pre-processing; (5) the selection of a suitable classification approach; (6) image segmentation and feature extraction; (7) post-classification processing; and (8) accuracy assessment [51]. Such LULC assessments can incur expenses throughout this process for acquiring satellite imagery and commercial GIS or image analysis software and also for human resources to contract remote sensing experts to conduct image pre-processing and analysis.
Google Earth, Google Earth Engine and Bing Maps, as well as the existing land assessment and map validation tools listed in Table 1 can be used individually to support one or several steps outlined above for semi-automated image analysis. However, Collect Earth is currently the only tool that can simultaneously access all three of the aforementioned archives, thus enabling users to draw upon the strengths of each, while also reducing the cost and time devoted to image acquisition (Step 1). As spatial and temporal gaps in freely available VHR imagery are inevitable, Collect Earth’s integration with GEE helps users to easily fill these gaps with information from coarser resolution Sentinel 2, Landsat and MODIS imagery.
Collect Earth’s integration with multiple archives of VHR imagery can facilitate the generation of data for training samples (Step 3) and accuracy assessment (Step 8), reducing the potential expenditure by $16–$25 USD/km2 for imagery ranging from 0.6 to 4-m resolution [52]. The information gathered with VHR imagery is extremely important for the typical LULC assessment that uses semi-automated algorithms because a relatively small amount of information from sites directly observed is used to train an algorithm that will classify vast areas and a relatively large number of sites that have not been directly observed.
In contrast, Collect Earth provides a framework for users to go beyond this more limited use of visual interpretation. Through augmented visual interpretation with Collect Earth, users can simultaneously analyze imagery of multiple scales and base their entire assessment on the same activity that often underpins only training and the accuracy assessment portions of LULC studies. Thus, while only 5%–10% of an area might be directly assessed in a typical LULC assessment with semi-automatic algorithms, Collect Earth and the input sampling design guide users to assess 100% of the sites that are used in the calculation of statistics regarding land use, land cover and land dynamics. This allows users to avoid classical uncertainties and biases related to extrapolations of mapping-based methods.
When conducting land use or land cover change analysis with high resolution imagery, the cost of analysis can be $160–$250 USD/km2, ten-times greater than the cost of the imagery because of the large amount of image pre-processing (Step 4) required [52]. Pre-processing can include geometric rectification, radiometric calibration, atmospheric correction and topographic correction [51]. Some of these tasks are conducted by Google and DigitalGlobe when they add new images to their archives. Collect Earth and augmented visual interpretation enable users to skip pre-processes and reduce expenses associated with this step by accessing pre-processed imagery and by facilitating a methodology that can easily be applied by non-remote sensing experts with minimal pre-processing.
Lastly, conducting an LULC assessment with using Collect Earth or other free software, including those listed in Table 1, can reduce expenditure on commercial software licenses.
The application of augmented visual interpretation with Collect Earth for LULUCF assessment in Papua New Guinea is one of numerous potential applications of the software (Table 2). Regardless of whether Collect Earth is used to conduct a base assessment, to facilitate on-going monitoring, to gather information to train land assessment algorithms or to generate data to assess the accuracy of existing maps, the software’s user-friendly interface and robust framework can broaden the engagement of individuals with little or no prior GIS and remote sensing experience. In conjunction with Google Earth, Bing Maps, Google Earth Engine and Saiku, Collect Earth can facilitate the assessment of land use, land cover and land dynamics by government agencies, non-for-profit organizations, academic institutions, field experts or other individuals.
Nevertheless, Collect Earth also has some limitations. The accuracy and robustness of an assessment depend heavily on applying an appropriate sampling design and sampling intensity to adequately capture the variability of the land characteristics being assessed. Furthermore, the point-sampling methodology is a non-exhaustive spatial cover (depending on the sampling intensity), thus limiting the full variability of the land that can be classified and measured.
The augmented visual interpretation approach presented here using Collect Earth is currently based on optical data. Although the powerful combination of sources of information that Collect Earth make available for a land monitoring assessment (including the Landsat Greenest pixel products) usually provides cloud-free information, occasional (partial or full) cloud cover over a sampling plot remains a challenge.
Another limitation is that the Internet is required to access the imagery and satellite-derived data that are used by Collect Earth. In cases where only Google Earth imagery is required, a low or medium speed Internet connection can be adequate. However, to quickly visualize and process years of MODIS, Landsat and Sentinel 2 imagery, high speed Internet is necessary.
Finally, when multiple users are working on the same assessment, it is crucial that a clear methodological framework for augmented visual interpretation is established to ensure consistency.
5. Conclusions
With nearly three quarters of the Earth’s surface impacted by human activity, it is more important than ever that countries, organizations, communities and individuals are cognizant of current, past and future land characteristics. Improved land monitoring by both remote sensing and non-remote sensing experts through augmented visual interpretation can enable a broader array of actors to take an active role in monitoring lands currently impacted by human activities. The application of Collect Earth in Papua New Guinea illustrates how the software can be used at the national and subnational level. A recent assessment of trees, forests and land use in drylands has demonstrated that Collect Earth can also be used to conduct rapid land assessments at the global level [53]. Collect Earth is not only a tool for land monitoring, but it can also support land use planning, management, transparency and accountability at multiple scales.
Collect Earth makes a substantial contribution to a significant trend that has been observed in the field of remote sensing over the past ten years by improving access to freely available satellite imagery and making imagery analysis more accessible to non-remote sensing experts. By altering the inputs of Collect Earth, such as the data collection form, sampling design and plot size, users can easily configure Collect Earth to address specific land monitoring purposes, such as landscape restoration, reporting for REDD+, national forest inventories, disaster assessments and humanitarian work, livestock and rangeland management, etc. (Table 2), with a multi-temporal and multi-scale approach.
The most significant innovation of Collect Earth is that it enables anyone to conduct a robust land assessment of any area of the world using free and open source tools, VHR satellite imagery freely accessible online and augmented visual interpretation.
For users who wish to learn more about Collect Earth or use the software for a land assessment, the following supplementary materials are available: 1. Collect Earth User Manual (version 1) [39]; 2. Collect Earth installation file for Windows operating systems [54]; 3. Collect Earth installation file for Mac operating systems [54]; and 4. Collect Earth—Papua New Guinea customization (CEP) file [54].
Acknowledgments
The Collect Earth tool was developed with the technical support of the “National Forest Monitoring and Information System Project for a Transparent and Truthful REDD-Plus” and the Google Earth Outreach team; funding from the International Climate Initiative of the German Federal Ministry for the Environment, Nature Conservation, Building and Nuclear Safety; and programmatic support from the Papua New Guinea Forest Authority, which requested FAO to develop an open source tool for forest monitoring through multi-phase sampling. Collect Earth is based also on Collect software, which has been developed with support from the FAO-Finland Technical Cooperation Programme. The authors thank Mikko Lappanen, Anssi Pekkarinen and Cosimo Togna for their support. Harris Blair has kindly allowed the use of the photograph featured in Figure 3.
Author Contributions
Danilo Mollicone led the design of the software development and land monitoring project presented in this work. Adia Bey, Alfonso Sánchez-Paus Díaz, Danae Maniatis, Giulio Marchi, Danilo Mollicone and Stefano Ricci equally contributed to the implementation of the work. Danae Maniatis, Jean-François Bastin, Adia Bey and Danilo Mollicone drafted the manuscript. Sandro Federici contributed to the uncertainty analysis. Alfonso Sánchez-Paus Díaz, Rebecca Moore, Stefano Ricci and Gino Miceli developed the software presented. Ruth Turia, Gewa Gamoga, Hitofumi Abe and Elizabeth Kaidong have contributed to the data collection and the design of the customization of Collect Earth used by Papua New Guinea Forest Authority. Marcelo Rezende, and Chiara Patriarca contributed to the analysis.
Conflicts of Interest
The authors declare that they have no competing interests. The views expressed in this publication are those of the author(s) and do not necessarily reflect the views of the Food and Agriculture Organization of the United Nations nor of the United Nations Development Programme.
References
- Gibbs, H.K.; Brown, S.; Niles, J.O.; Foley, J.A. Monitoring and estimating tropical forest carbon stocks: Making REDD a reality. Environ. Res. Lett. 2007, 2, 045023. [Google Scholar] [CrossRef]
- Romijn, E.; Lantican, C.B.; Herold, M.; Lindquist, E.; Ochieng, R.; Wijaya, A.; Murdiyarso, D.; Verchot, L. Assessing change in national forest monitoring capacities of 99 tropical countries. For. Ecol. Manag. 2015, 352, 109–123. [Google Scholar] [CrossRef]
- Martino, L.; Fritz, M. New Insight into Land Cover and Land Use in Europe. Available online: http://ec.europa.eu/eurostat/documents/3433488/5582088/KS-SF-08-033-EN.PDF/fc262221-5c2e-4dcf-9e7b-0c6731b3f3a4 (accessed on 31 May 2016).
- Tomppo, E.; Katila, M.; Mäkisara, K.; Peräsaari, J. The Multi-Source National Forest Inventory of Finland—Methods and Results 2011. Measurement 2011, 319, 1–224. [Google Scholar]
- Tabacchi, G.; de Natale, F.; Floris, A.; Gagliano, C.; Gasparini, P.; Scrinzi, G.; Tosi, V. Italian National Forest Inventory: Methods, state of the project, and future developments. In Proceedings of the Seventh Annual Forest Inventory and Analysis Symposium, Portland, ME, USA, 3–6 October 2005.
- Ploton, P.; Pélissier, R.; Proisy, C.; Flavenot, T.; Barbier, N.; Rai, S.N.; Couteron, P. Assessing aboveground tropical forest biomass using Google Earth canopy images. Ecol. Appl. 2012, 22, 993–1003. [Google Scholar] [CrossRef] [PubMed]
- Montesano, P.M.; Nelson, R.; Sun, G.; Margolis, H.; Kerber, A.; Ranson, K.J. MODIS tree cover validation for the circumpolar taiga-tundra transition zone. Remote Sens. Environ. 2009, 113, 2130–2141. [Google Scholar] [CrossRef]
- Schepaschenko, D.; See, L.; Lesiv, M.; McCallum, I.; Fritz, S.; Salk, C.; Moltchanova, E.; Perger, C.; Shchepashchenko, M.; Shvidenko, A.; et al. Development of a global hybrid forest mask through the synergy of remote sensing, crowdsourcing and FAO statistics. Remote Sens. Environ. 2015, 162, 208–220. [Google Scholar] [CrossRef]
- Hansen, M.C.; Potapov, P.V.; Moore, R.; Hancher, M.; Turubanova, S.A.; Tyukavina, A.; Thau, D.; Stehman, S.V.; Goetz, S.J.; Loveland, T.R.; et al. High-Resolution Global Maps of 21st-Century Forest Cover Change. Science 2013, 342, 850–853. [Google Scholar] [CrossRef] [PubMed]
- Wulder, M.A.; Masek, J.G.; Cohen, W.B.; Loveland, T.R.; Woodcock, C.E. Opening the archive: How free data has enabled the science and monitoring promise of Landsat. Remote Sens. Environ. 2012, 122, 2–10. [Google Scholar] [CrossRef]
- Brotton, J. A History of the World in 12 Maps; Kindle ed.; Penguin: London, UK, 2014; pp. 405–406. [Google Scholar]
- Official Google Blog. Google Earth Downloaded More than One Billion Times. Available online: https://maps.googleblog.com/2011/10/google-earth-downloaded-more-than-one.html (accessed on 9 March 2016).
- Number of Internet Users Worldwide from 2005 to 2015. Available online: http://www.statista.com/statistics/273018/number-of-internet-users-worldwide/ (accessed on 29 May 2016).
- Fritz, S.; McCallum, I.; Schill, C.; Perger, C.; Grillmayer, R.; Achard, F.; Kraxner, F.; Obersteiner, M. Geo-Wiki.Org: The use of crowdsourcing to improve global land cover. Remote Sens. 2009, 1, 345–354. [Google Scholar] [CrossRef]
- Feng, M.; Huang, C.; Sexton, J.O.; Channan, S.; Narasimhan, R.; Townshend, J.R. An approach for quickly labeling land cover types for multiple epochs at globally selected locations. In Proceedings of the IEEE International Geoscience and Remote Sensing Symposium, Munich, Germany, 22–27 July 2012; pp. 6203–6206.
- See, L.; Perger, C.; Hofer, M.; Weichselbaumb, J.; Dresel, C.; Fritz, S. LACO-Wiki: An open access online portal for land cover validation. In ISPRS Annals of Photogrammetry, Remote Sensing and Spatial Information, Sciences, Proceedings of the ISPRS Geospatial Week, La Grande Motte, France, 28 September–3 October 2015; Volume II-3/W5.
- Cohen, W.B.; Yang, Z.; Kennedy, R. Detecting trends in forest disturbance and recovery using yearly Landsat time series: 2. TimeSync—Tools for calibration and validation. Remote Sens. Environ. 2012, 114, 2911–2924. [Google Scholar] [CrossRef]
- Clark, M.L.; Aide, T.M. Virtual interpretation of earth web-interface tool (VIEW-IT) for collecting land-use/land-cover reference data. Remote Sens. 2011, 3, 601–620. [Google Scholar] [CrossRef]
- Skytruth: Mountaintop Removal Mining. Available online: http://blog.skytruth.org/2009/12/measuring-mountaintop-removal-mining-in.html (accessed on 29 May 2016).
- Tomnod: Nepal Earthquake Data Portal. Available online: http://blog.tomnod.com/Nepal-Earthquake-Data-Portal (accessed on 29 May 2016).
- Pengra, B.; Long, J.; Dahal, D.; Stehman, S.V.; Loveland, T.R. A global reference database from very high resolution commercial satellite data and methodology for application to Landsat derived 30 m continuous field tree cover data. Remote Sens. Environ. 2015, 165, 234–248. [Google Scholar] [CrossRef]
- Ryan, R.; Baldridge, B.; Schowengerdt, R.A.; Choi, T.; Helder, D.L.; Blonski, D.L. IKONOS spatial resolution and image interpretability characterization. Remote Sens. Environ. 2016, 88, 37–52. [Google Scholar] [CrossRef]
- Asner, G.P.; Warner, A.S. Canopy shadow in IKONOS satellite observations of tropical forests and savannas. Remote Sens. Environ. 2003, 87, 521–533. [Google Scholar] [CrossRef]
- Barbier, N.; Proisy, C.; Véga, C.; Sabatier, D.; Couteron, P. Bidirectional texture function of high resolution optical images of tropical forest: An approach using LiDAR hillshade simulations. Remote Sens. Environ. 2011, 115, 167–179. [Google Scholar] [CrossRef]
- Bastin, J.F.; Barbier, N.; Couteron, P.; Adams, B.; Shapiro, A.; Bogaert, J.; De Cannière, C. Aboveground biomass mapping of African forest mosaics using canopy texture analysis: Toward a regional approach. Ecol. Appl. 2014, 24, 1984–2001. [Google Scholar] [CrossRef]
- Whitehead, T. Google Earth Imagery Suppliers. Available online: http://www.gearthblog.com/blog/archives/2015/09/google-earth-imagery-suppliers.html (accessed on 1 June 2016).
- Bing Maps Unveils Exclusive High Res Imagery with Global Ortho Project, 27 June 2011. Available online: http://blogs.bing.com/maps/2011/06/27/bing-maps-unveils-exclusive-high-res-imagery-with-global-ortho-project/ (accessed on 30 May 2016).
- Google Earth Engine Datasets. Available online: https://earthengine.google.com/datasets/ (accessed on 1 June 2016).
- Elements of Visual Interpretation. Available online: http://www.nrcan.gc.ca/earth-sciences/geomatics/satellite-imagery-air-photos/satellite-imagery-products/educational-resources/9291 (accessed on 23 April 2016).
- Gomez, C.; White, J.C.; Wulder, M.A. Optical remotely sensed time series data for land cover classification: A review. Int. Soc. Photogramm. 2016, 116, 55–72. [Google Scholar] [CrossRef]
- Open Foris Collect Earth. Available online: http://www.openforis.org/tools/collect-earth.html (accessed on 28 March 2016).
- Sánchez-Paus Díaz, A. Open Foris Collect Earth Code Repository. Available online: https://github.com/ openforis/collect-earth (accessed on 28 March 2016).
- Google Earth. Available online: https://www.google.com/earth/ (accessed on 23 April 2016).
- Google Chrome. Available online: https://www.google.com/chrome/ (accessed on 23 April 2016).
- Mozilla Firefox. Available online: https://www.mozilla.org/en-US/firefox/new/ (accessed on 23 April 2016).
- Open Foris Collect. Available online: http://www.openforis.org/tools/collect.html (accessed on 23 April 2016).
- Stehman, S.V. Comparing estimators of gross change derived from complete coverage mapping versus statistical sampling of remotely sensed data. Remote Sens. Environ. 2005, 96, 466–474. [Google Scholar] [CrossRef]
- Olofson, P.; Foody, G.M.; Herold, M.; Stehman, S.V.; Woodcock, C.E.; Wulder, M.A. Good practices for estimating area and assessing accuracy of land change. Remote Sens. Environ. 2014, 148, 42–57. [Google Scholar] [CrossRef]
- Bey, A.; Sánchez-Paus Díaz, A.; Pekkarinen, A.; Patriarca, C.; Maniatis, D.; Weil, D.; Mollicone, D.; Marchi, G.; Niskala, J.; Rezende, M.; et al. Collect Earth User Manual, 1st ed. Available online: http://openforis.org/fileadmin/user_upload/Collect_Earth_Tutorials/Collect_Earth_User_Manual_20150618_highres_full.pdf (accessed on 29 May 2016).
- IPCC. Guidelines for National Greenhouse Gas Inventories; Institute for Global Environmental Strategies: Kanagawa, Japan, 2006. [Google Scholar]
- Google Earth Engine: A Planetary-Scale Platform for Earth Science Data & Analysis. Available online: https://earthengine.google.com/ (accessed on 30 May 2016).
- Whitehead, T. Google Earth Imagery Update Mid-January 2016. Available online: http://www.gearthblog.com/ blog/archives/2016/01/google-earth-imagery-update-mid-january-2016.html (accessed on 28 March 2016).
- Zhang, Q.; Li, B.; Thau, D.; Moore, R. Building a Better Urban Picture: Combining Day and Night Remote Sensing Imagery. Remote Sens. 2015, 7, 11887–11913. [Google Scholar] [CrossRef]
- IPCC. Good Practice Guidance for Land Use, Land-Use Change and Forestry; Institute for Global Environmental Strategies: Kanagawa, Japan, 2003. [Google Scholar]
- Google Panoramio. Available online: http://www.panoramio.com (accessed on 29 May 2016).
- Food and Agriculture Organization of the United Nations. Forest Resources Assessment 1990; Tropical Countries, FAO Forestry Paper 112; FAO: Rome, Italy, 1993. [Google Scholar]
- Achard, F.; Beuchle, R.; Mayaux, P.; Stibig, H.J.; Bodart, C.; Brink, A.; Carboni, S.; Desclée, B.; Donnay, F.; Eva, H.D.; et al. Determination of tropical deforestation rates and related carbon losses from 1990 to 2010. Glob. Chang. Biol. 2014, 20, 2540–2554. [Google Scholar] [CrossRef] [PubMed]
- Potapov, P.; Hansen, M.C.; Gerrand, A.M.; Lindquist, E.J.; Pittman, K.; Turubanova, S.; Løyche Wilkie, M. The global Landsat imagery database for the FAO FRA remote sensing survey. Int. J. Digit. Earth 2011, 4, 2–21. [Google Scholar] [CrossRef]
- Mayaux, P.; Holmgren, P.; Achard, F.; Eva, H.; Stibig, H.-J.; Branthomme, A. Tropical forest cover change in the 1990s and options for future monitoring. Philos. Trans. R. Soc. Lond. B Biol. Sci. 2005, 360, 373–384. [Google Scholar] [CrossRef] [PubMed]
- Sexton, J.O.; Song, X.-P.; Feng, M.; Noojipady, P.; Anand, A.; Huang, C.; Kim, D.-H.; Collins, K.M.; Channan, S.; et al. Global, 30-m resolution continuous fields of tree cover: Landsat-based rescaling of MODIS Vegetation Continuous Fields with lidar-based estimates of error. Int. J. Digit. Earth 2013, 6. [Google Scholar] [CrossRef]
- Lu, D.; Weng, Q. A survey of image classification methods and techniques for improving classification performance. Int. J. Remote Sens. 2007, 28, 823–870. [Google Scholar] [CrossRef]
- Böttcher, H.; Eisbrenner, K.; Fritz, S.; Kindermann, G.; Kraxner, F.; McCallum, I.; Obersteiner, M. An assessment of monitoring requirements and costs of Reduced Emissions from Deforestation and Degradation. Carbon Balance Manag. 2009, 4, 7. [Google Scholar] [CrossRef] [PubMed]
- Food and Agriculture Organization of the United Nations. Trees, Forests and Land Use in Drylands: The First Global Assessment, 2016. Available online: http://www.fao.org/publications/card/en/c/01382d82-6356-478e-9f42-d85ccdfd7a7d/ (accessed on 5 August 2016).
- Collect Earth Installation File for Windows Operating Systems; Collect Earth Installation File for Mac Operating Systems; Collect Earth-Papua New Guinea Customization (CEP) File. Available online: http://www.openforis.org/tools/collect-earth.html (accessed on 27 September 2016).
© 2016 by the authors; licensee MDPI, Basel, Switzerland. This article is an open access article distributed under the terms and conditions of the Creative Commons Attribution (CC-BY) license (http://creativecommons.org/licenses/by/4.0/).