1. Introduction
With the improvement of camera technologies and the rise of new matching approaches, more and more image-based software for 3D modeling and reconstruction have been developed, such as Street Factory, Accute3D, PhotoScan, in which a multi-view dense image matching (DIM) algorithm is one of the most crucial processes. The goal of multi-view dense matching is to extract dense point clouds from multiple images that have known orientated parameters. Image-based surveying and 3D modeling can now deliver point clouds with accuracy comparable to those produced by laser scanning [
1] for many terrestrial and aerial applications in a reasonable time. Since the inherent nature of multi-spectral images, rich texture information can be accessed. Moreover, the absolute accuracy of a point cloud can be assessed based on the redundant measurements extracted from imagery. Image-based 3D reconstruction is widely used for 3D modeling, mapping, robotics, and navigation because it is lightweight, convenient, cost effective, and generates textured point clouds comparable to those produced by LiDAR systems.
Dense image matching algorithms can be divided into stereo pair based algorithms [
2,
3,
4,
5] and multi-view based algorithms [
6,
7,
8,
9,
10,
11,
12] according to type of processing units. They can also be divided into local and global algorithms according to different optimization strategies [
13]. Local (window-based) methods compute disparity at a given point using intensity values with implicit smoothing assumptions, while global methods make explicit smoothness assumptions and solve for a global optimization problem using an energy minimization approach, based on regularized Markov fields (MRFs), graph-cut, dynamic programming, or max-flow methods [
1]. The global methods often yield better performance than local methods, but with a more complex algorithm. Semi-global matching (SGM) algorithms [
2,
3,
14] use pixelwise, Mutual Information (MI)-based matching supported by a smoothness constraint expressed as a global cost function, and performs a fast approximation by pathwise optimizations from all directions, thus representing a compromise between performance and complexity. An extensive study of different matching costs [
15] showed that a census matching cost is the most robust technique for stereo vision, and performs better for matching local radiometric changes than the MI cost in many real-world applications.
The four state-of-art software; SURE, MicMac, PMVS, and PhotoScan were evaluated in terms of similarities and differences in approach [
1]. SURE [
5,
16] is based on SGM method followed by a fusion step in which redundant depth estimations across single stereo models are merged. Micmac [
7,
17] implements a coarse-to-fine extension of the maximum-flow image-matching algorithm across multi-resolution and multi-image presented in [
18]. PMVS [
10] is a region growing method that expands a sparse set of matched key points to nearby pixel correspondences before using visibility constraints to filter out false matches. PhotoScan uses a stereo SGM-like method, a proprietary commercial package. Experiments showed that the SURE and PhotoScan approaches that adopted a SGM or SGM-like method are more accurate and efficient than the PMVS and Micmac approaches.
The stereo DIM algorithm in our implementation is based on the tSGM (SGM with a tube shaped disparity range) algorithm in SURE; it is an improvement on the SGM algorithm in memory demand and processing time. The tSGM algorithm provides more a complete reconstruction of lightly textured objects and objects with a repetitive texture. However, edges are not reconstructed as clearly as in SGM algorithm, particularly in the case of close range photogrammetry. For this reason, a guided median filter was introduced to preserve depth discontinuities instead of the median filter deployed in the current method. Within MVS methods in image space, disparity estimations for single stereo models are typically merged in order to increase the reliability and precision of the final depth maps or point clouds. The original SGM algorithm [
3] proposes an orthographic 2.5D projection method to fuse several disparity images from different viewpoints for aerial applications; this method is not applicable for close range and oblique aerial applications because too much information would be lost. SURE [
5] presents a method to transform all disparity maps of a base image to the distance maps between the camera center and object points on the optical ray, then fuses them by minimizing the reprojection error. However, the point clouds generated from different base images result in small offsets since they are triangulated separately using different set of images. In our approach, a multi-view DIM point cloud generation method based on a graph network is introduced, integrating a correspondence linking technique as presented in [
19]. The main steps of the current method are as follows: First, a graph network is built considering the overlap relationship and intersection angle between adjacent images. Second, epipolar images are generated and a modified tSGM algorithm is applied to obtain dual direction disparity maps across stereo pairs. A multi-view triangulation approach based on the graph network is adopted to calculate a dense point cloud for a single base view. Finally, multi-view dense point clouds are fused with average reprojection error as a priority measure to generate a final point cloud.
The main contribution of this paper are: (1) Proposing a graph network based multi-view DIM method that computes fewer stereo pairs than traditional MVS methods like SURE and PhotoScan, while obtaining better completeness and higher accuracy. The triangulated point clouds from different base images in the proposed method share the same correspondences with no offset and can be seamlessly integrated; (2) We introduce a guided median filter into the tSGM algorithm to preserve depth discontinuities for better performance in difficult areas with sharp discontinuities, weak textures, or repeated textures.
This paper is organized as follows:
Section 2 describes the graph network based multi-view DIM algorithm, where
Section 2.1 describes the construction of graph network.
Section 2.2 presents the improved tSGM algorithm for stereo dense matching.
Section 2.3 shows the graph network based triangulation method of base view.
Section 2.4 introduces the multi-view point-cloud fusion approach.
Section 3 presents experiments and results, followed by the discussion in
Section 4.
Section 5 draws some conclusions.
2. Graph Network Based DIM Methodology
In this section, an effective graph network based approach for multi-view dense matching of high-resolution imagery is presented. The proposed method can be divided into four main steps. In the first step, candidate stereo pairs are selected considering overlap relationships and intersection angle to construct the multi-view graph network. In the second step, epipolar images are generated followed by processing with the modified tSGM algorithm to calculate dual-direction disparity maps. In the third step, a graph network based triangulation is adopted to generate a dense point cloud of base views from all the connected images, including those outside the candidate matches. Redundancy is exploited through the correspondence linking technique to eliminate error and increase the accuracy of triangulation, while enabling assessment of the accuracy of the average reprojection error. Finally, the multi-view point clouds are fused with the average reprojection error as a priority measure. Details of those specific principles and implementation processes are provided in the subsequent sub sections.
2.1. Graph Network Construction
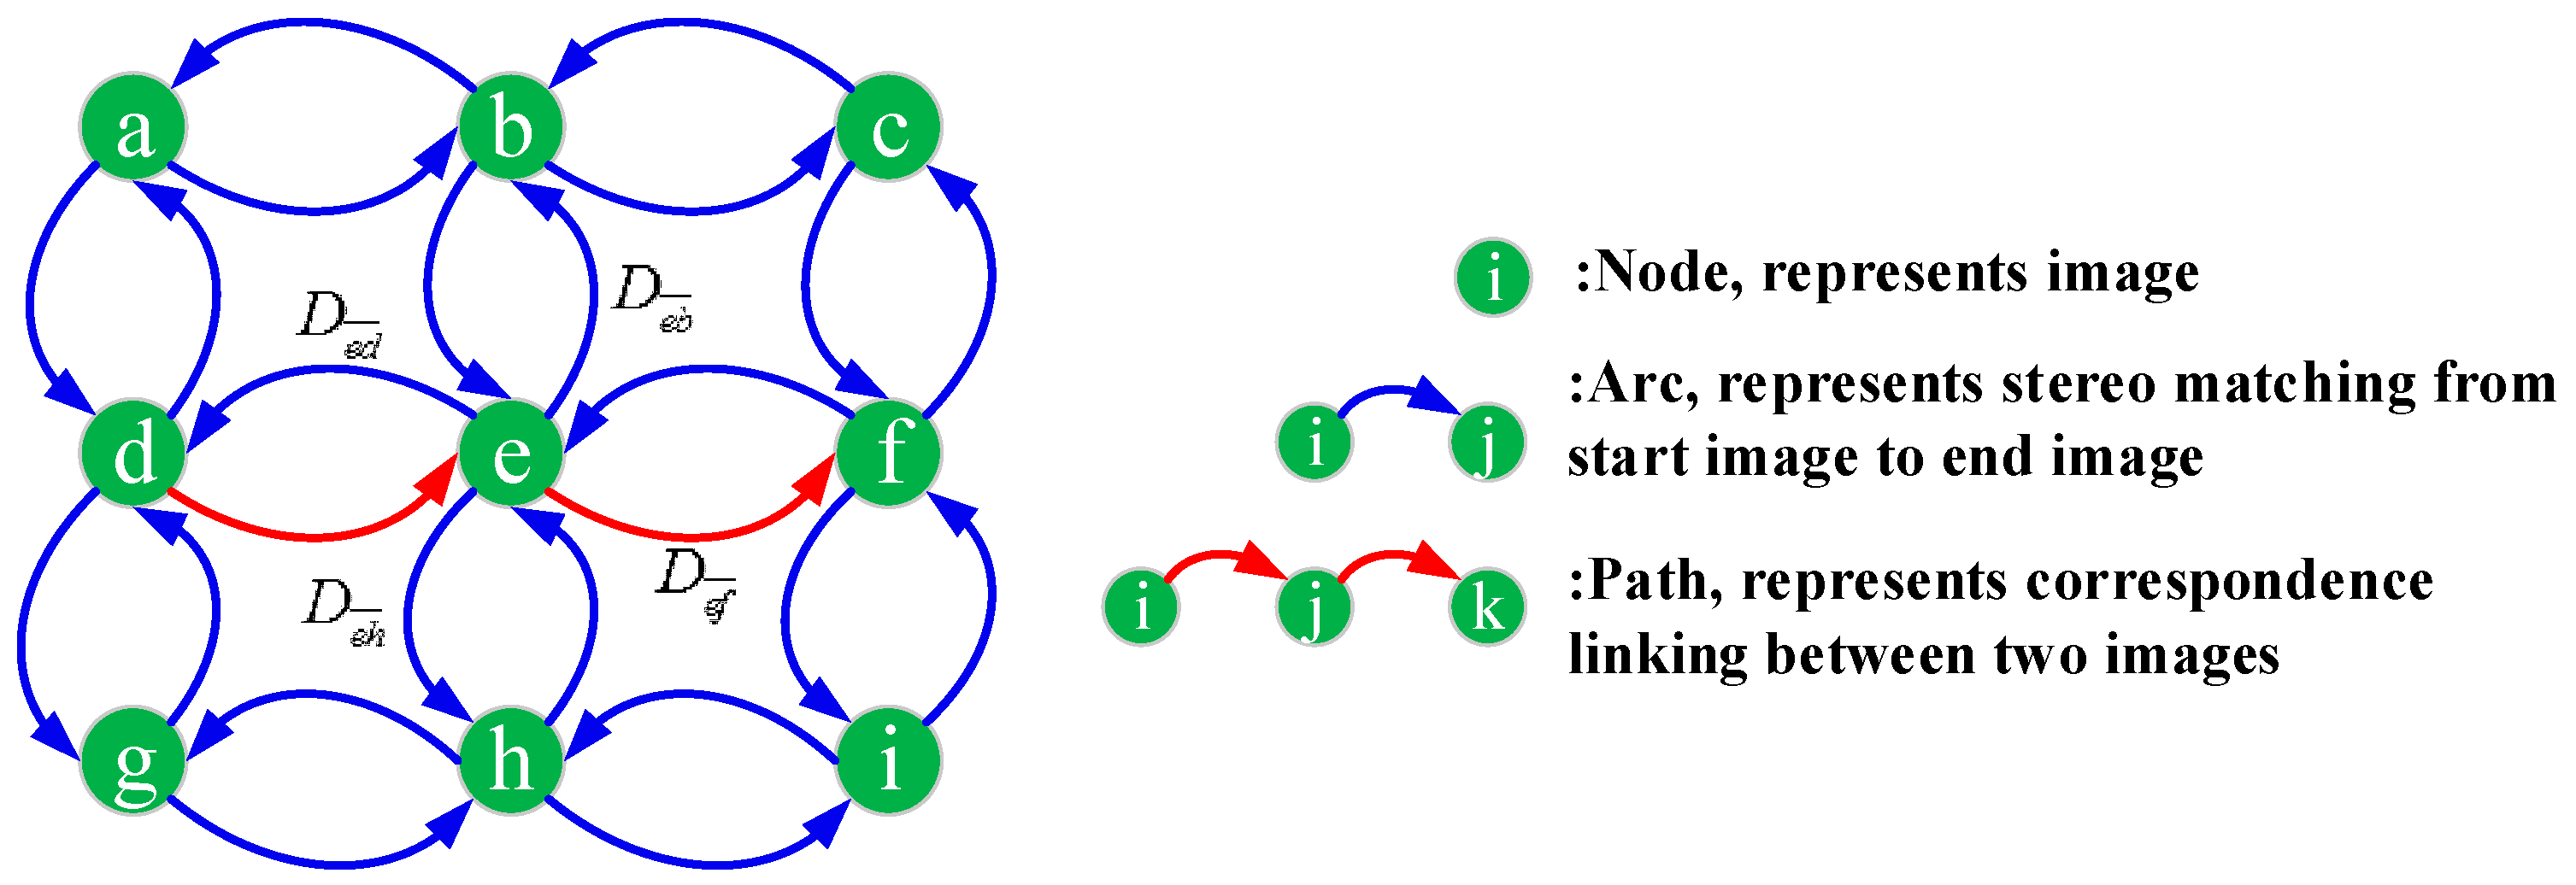
Figure 1 illustrates the process for constructing the graph network. Let the target graph network be denoted by
then, nodes represent the available images, arcs represent stereo matching from a start node to end node, and paths represent correspondence linking between two images, as shown in the Figure. All the oriented images are first added to the
as single nodes respectively, while arcs are inserted to
by candidate stereo pairs.
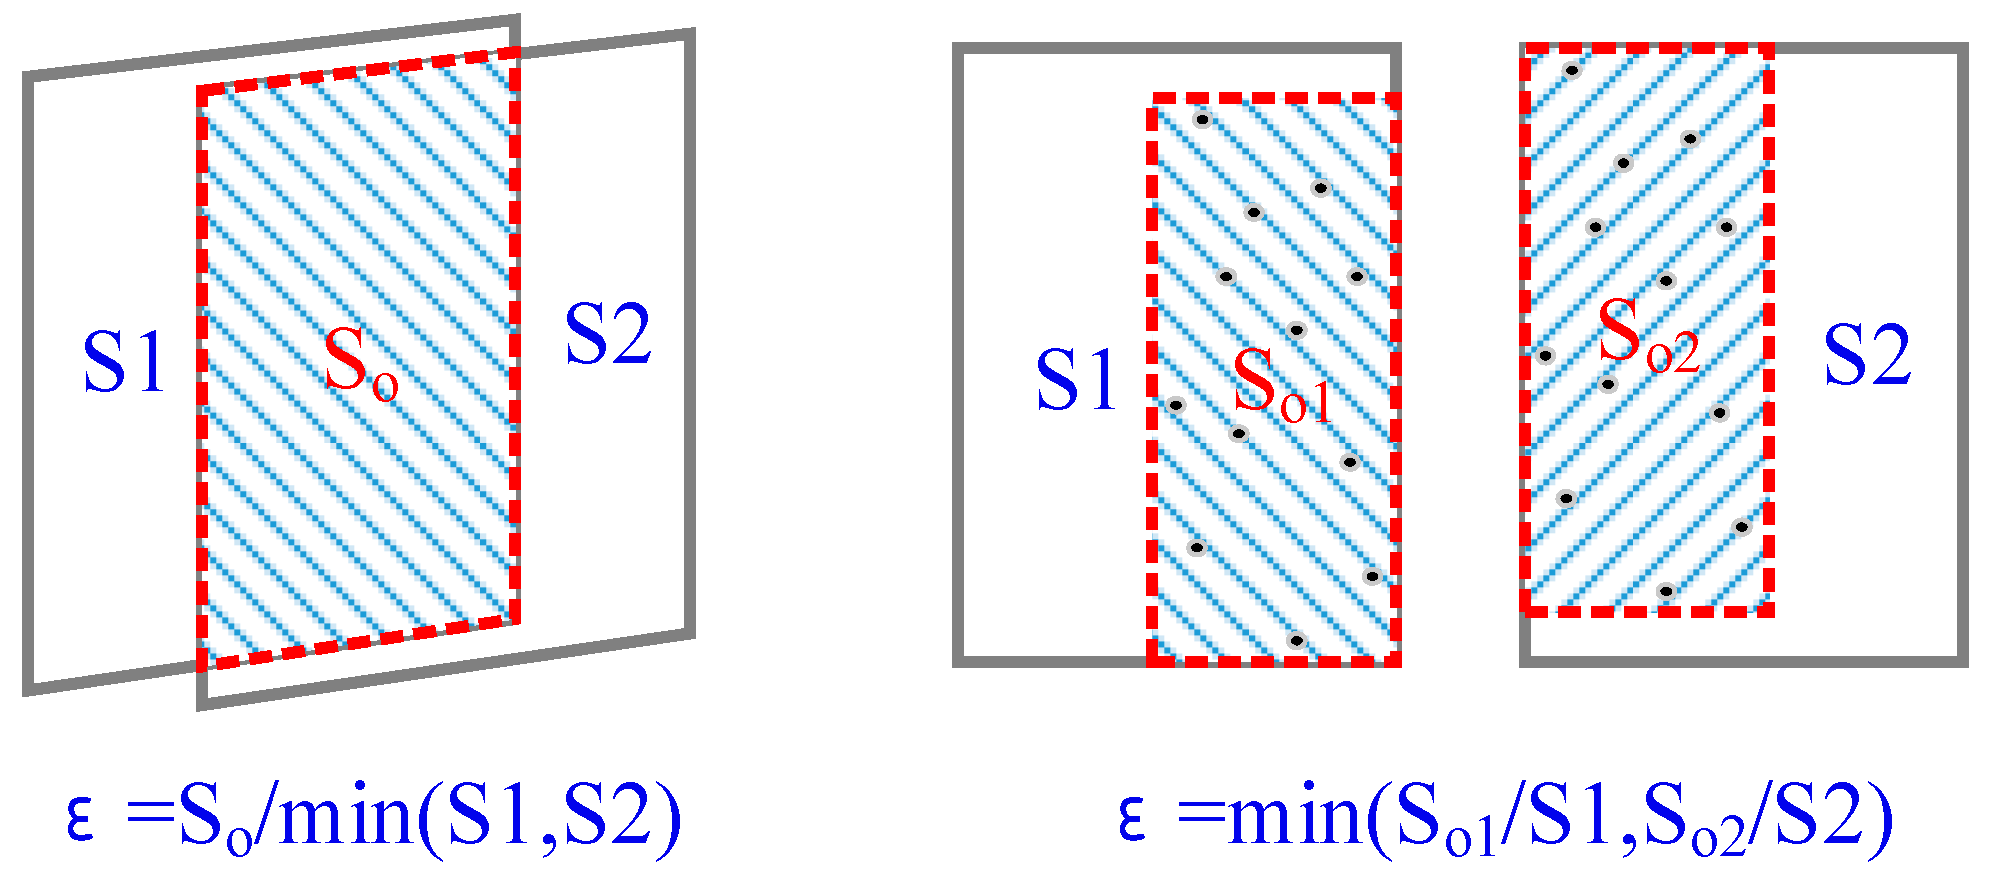
Overlap ratio and intersection angle are then used to determine the candidate stereo pairs. The overlap ratio can be defined in two ways as illustrated in
Figure 2.
In an aerial situation, the corners of image frame are projected to a common plane; then the overlap ratio can be calculated by
where
represent the area and overlap area respectively. In more general cases, the matched features obtained after a SFM (Structure from Motion) or BA (Bundle Adjustment) process are used to define the overlap ratio as
where
represent the minimum bounding box of matched features. When the matches are not available, coarse-image matching can be executed with low-resolution images for fast processing.
The intersection angle can be calculated by the two optical axis vectors of the cameras, and only those with an intersection angle less than a threshold (ten degrees is the default) are considered. More occlusion appears between images with a larger intersection angle; adding difficulty to dense image matching and reducing the quality of matching results. Stereo pairs outside of target graph however, can be connected by certain paths through image pairs with high overlap, thus making full use of the redundant measurements and therefore improving matching accuracy.
2.2. Dense Stereo Matching
In this section, the implemented module for dense stereo matching is described. In
Section 2.2.1, the details of epipolar rectification are presented based on the algorithms in [
20,
21,
22,
23]. In
Section 2.2.2, a modified hierarchical strategy based on tSGM algorithm is proposed by introducing the guided median filter that efficiently preserves local structure.
2.2.1. Epipolar Rectification
Epipolar rectification must be done before stereo dense matching, which reduces the disparity search space to one dimension. Suppose the camera intrinsic matrix is
, the extrinsic parameters are
and
; and the relative transformation is
where
; then, the rotation matrix
for rectification between an original image and epipolar image can be calculated as follows:
The new rotation matrix for the rectified image is:
Thus, the homographic matrix between the original image and epipolar image is:
After deriving the homographies , the gray values for pixels at integer positions in the rectified frames are calculated by interpolation in Equation (5) using the correspondence coordinates.
2.2.2. Modifications of the tSGM Algorithm
The SGM algorithm is often the technique of choice in real world applications as it generates dense reconstruction results with highly robust parameterization and capability for real-time processing. This algorithm however, creates extensive memory demands given the large format frames required and the high number of potential correspondences.
The tSGM algorithm in SURE provides a hierarchical coarse-to-fine solution for the SGM method to limit disparity search ranges and decreases the memory demand as well as processing time. The key advantage of tSGM algorithm is that it makes full use of disparity images matched at low-resolution pyramids to limit the disparity search range at next level pyramids, which dramatically decrease the memory demands and processing times. However, edges are not reconstructed as clearly as in SGM algorithm.
Inspired by the joint bilateral filter [
24] and guided filter [
25], which have the edge-preserving smoothing property, a guided median filter [
26] was introduced to replace the traditional median filter in this paper, with left epipolar image as the guidance image and the output of a pixel is a weighted average of nearby pixels in the guidance image. The pixels are weighted in the local histograms:
where
is a local window near
,
is the pixel value,
is the discrete bin index,
is the Kronecker delta function:
is 1 when the argument is 0, and is 0 otherwise, and
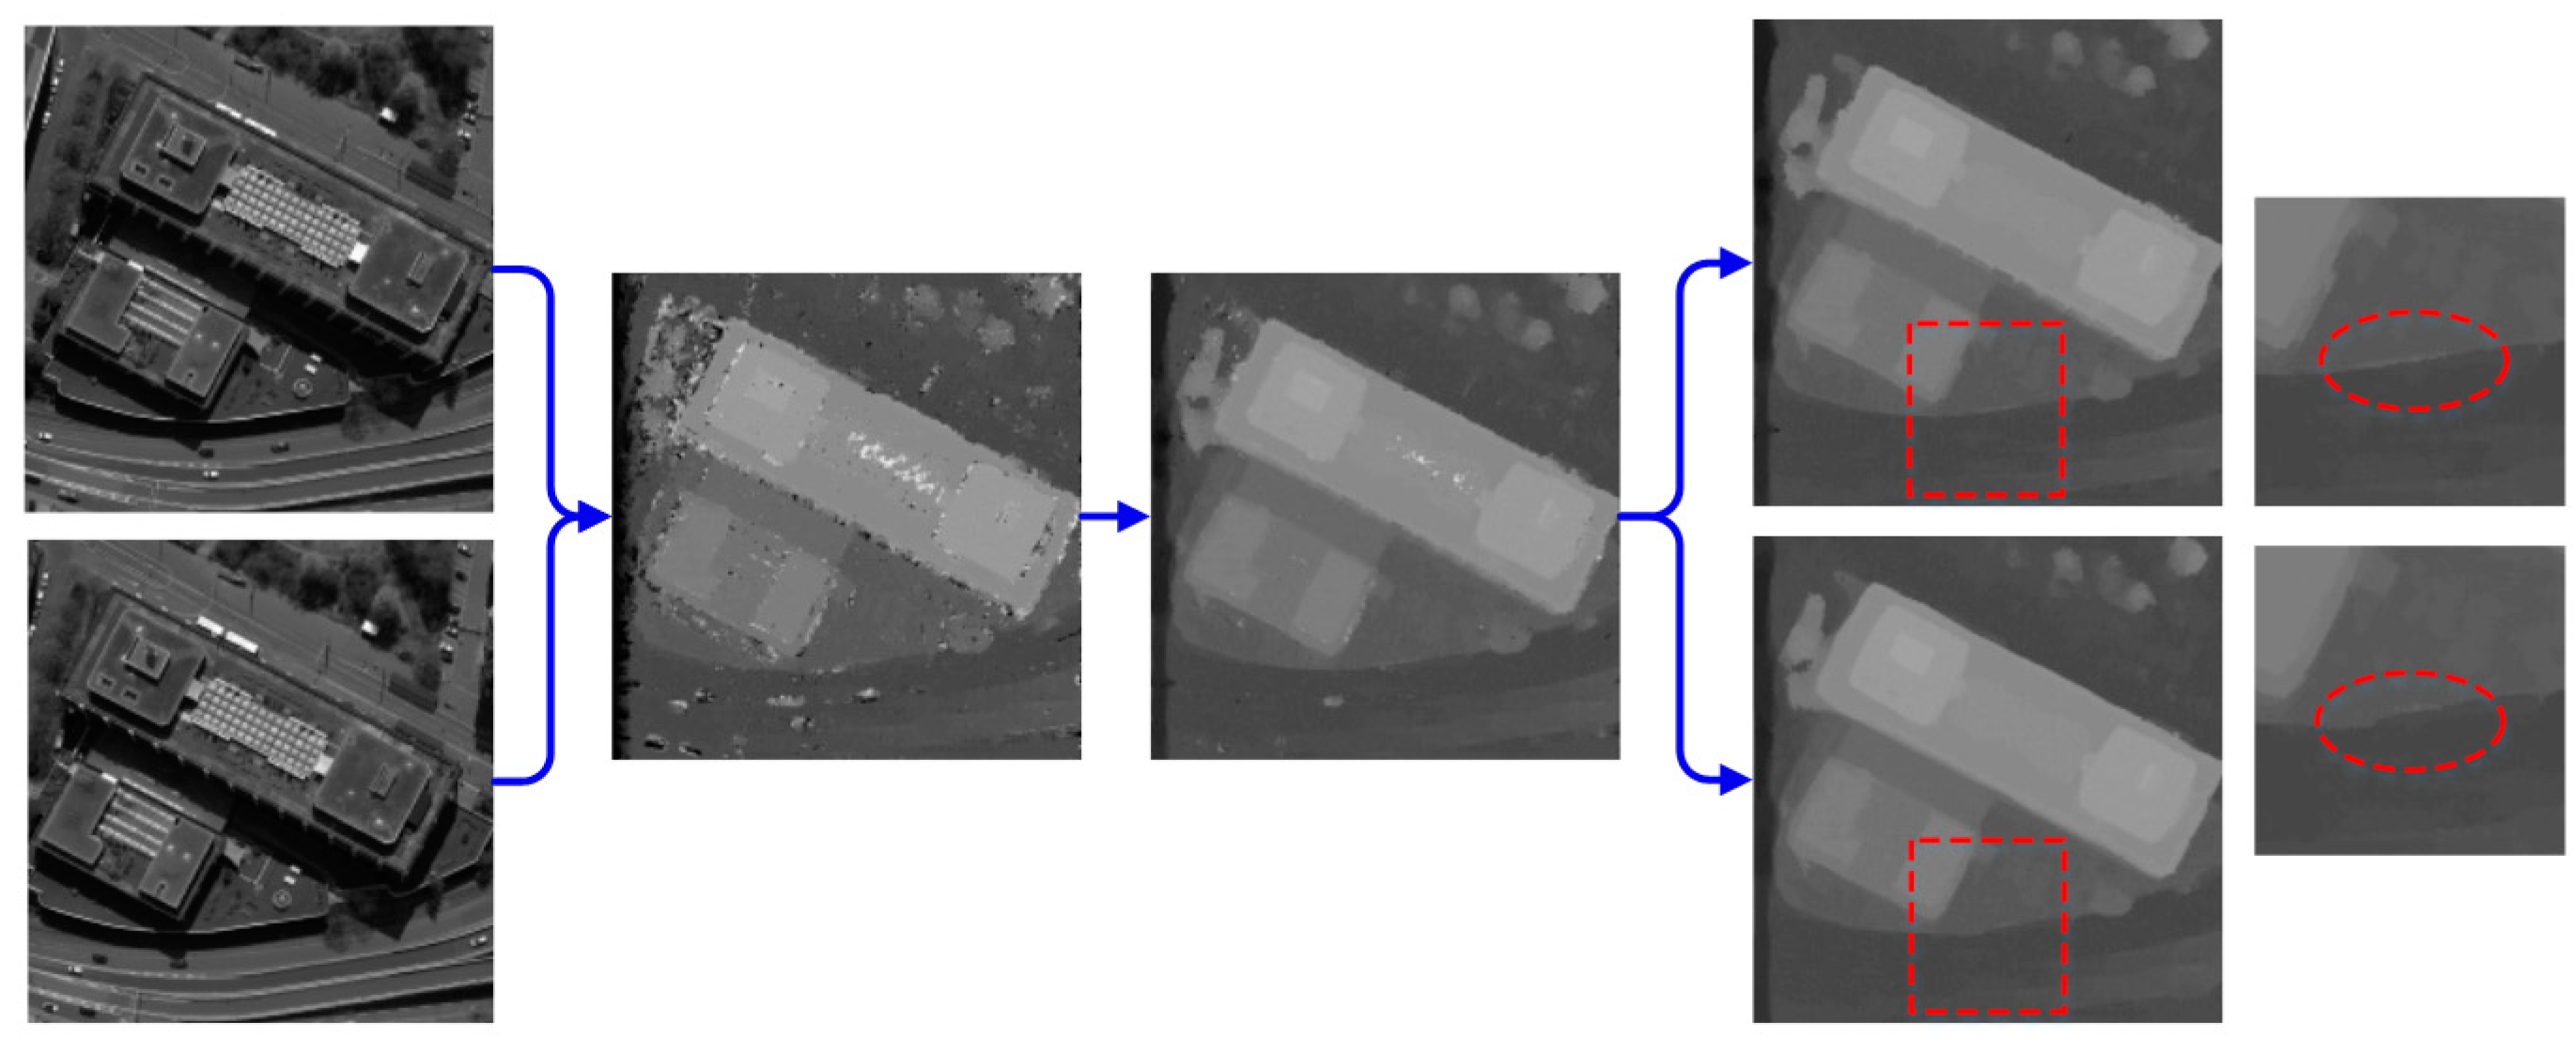
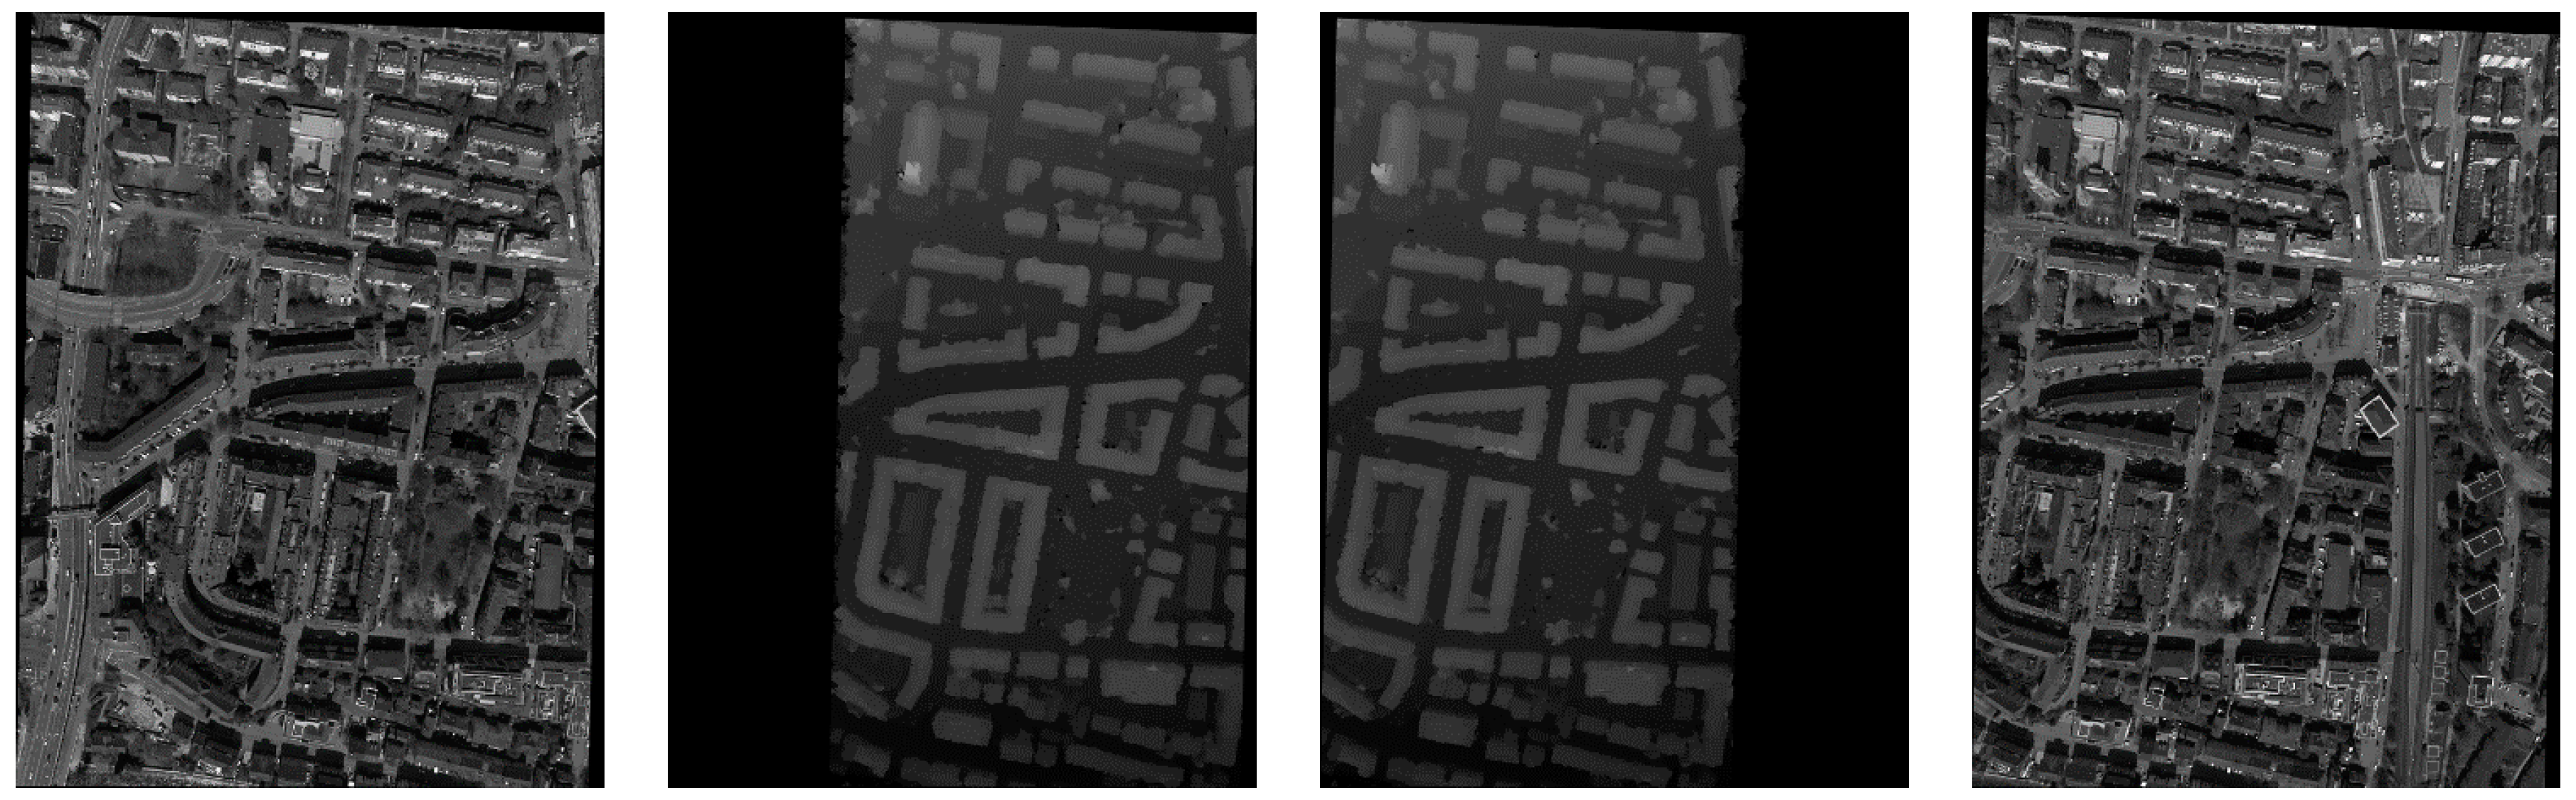
w is the bilateral weight that suppresses the pixels with different color from the center pixel. It is straightforward to pick the median value through accumulating this histogram. Comparing the stereo matching results by guided median filter and traditional median filter as shown in
Figure 3, the disparities in areas with sharp discontinuities obtained better results due to the introduction of the guided median filter.
The hierarchical approach in our implementation is a little different from tSGM algorithm. One advantage of guided median filter in the tSGM algorithm is that a canny edge detector is no longer necessary to optimize the penalty parameter P2, thus increasing the efficiency of the algorithm. When matching an image pair fin a certain pyramid level
, the disparity between base and match images is computed followed by a consistency check to obtain valid disparity pixels with high confidence. The guided median filter is adopted to generate a median disparity image. If a pixel is valid, a small 15 × 15 window is searched; else, a larger 31 × 31 window is used to obtain the median value of all valid disparities. After these steps, a speckle-filtering algorithm in OpenCV library [
27] is exploited to extract the regions of noise or holes followed by interpolation, again using a guided median filter. The maximum and minimum disparity images
are calculated from the final median disparity image
with the search ranges for valid and invalid pixels by 16 and 32 according to
where
is the prior maximum disparity of the image pair and
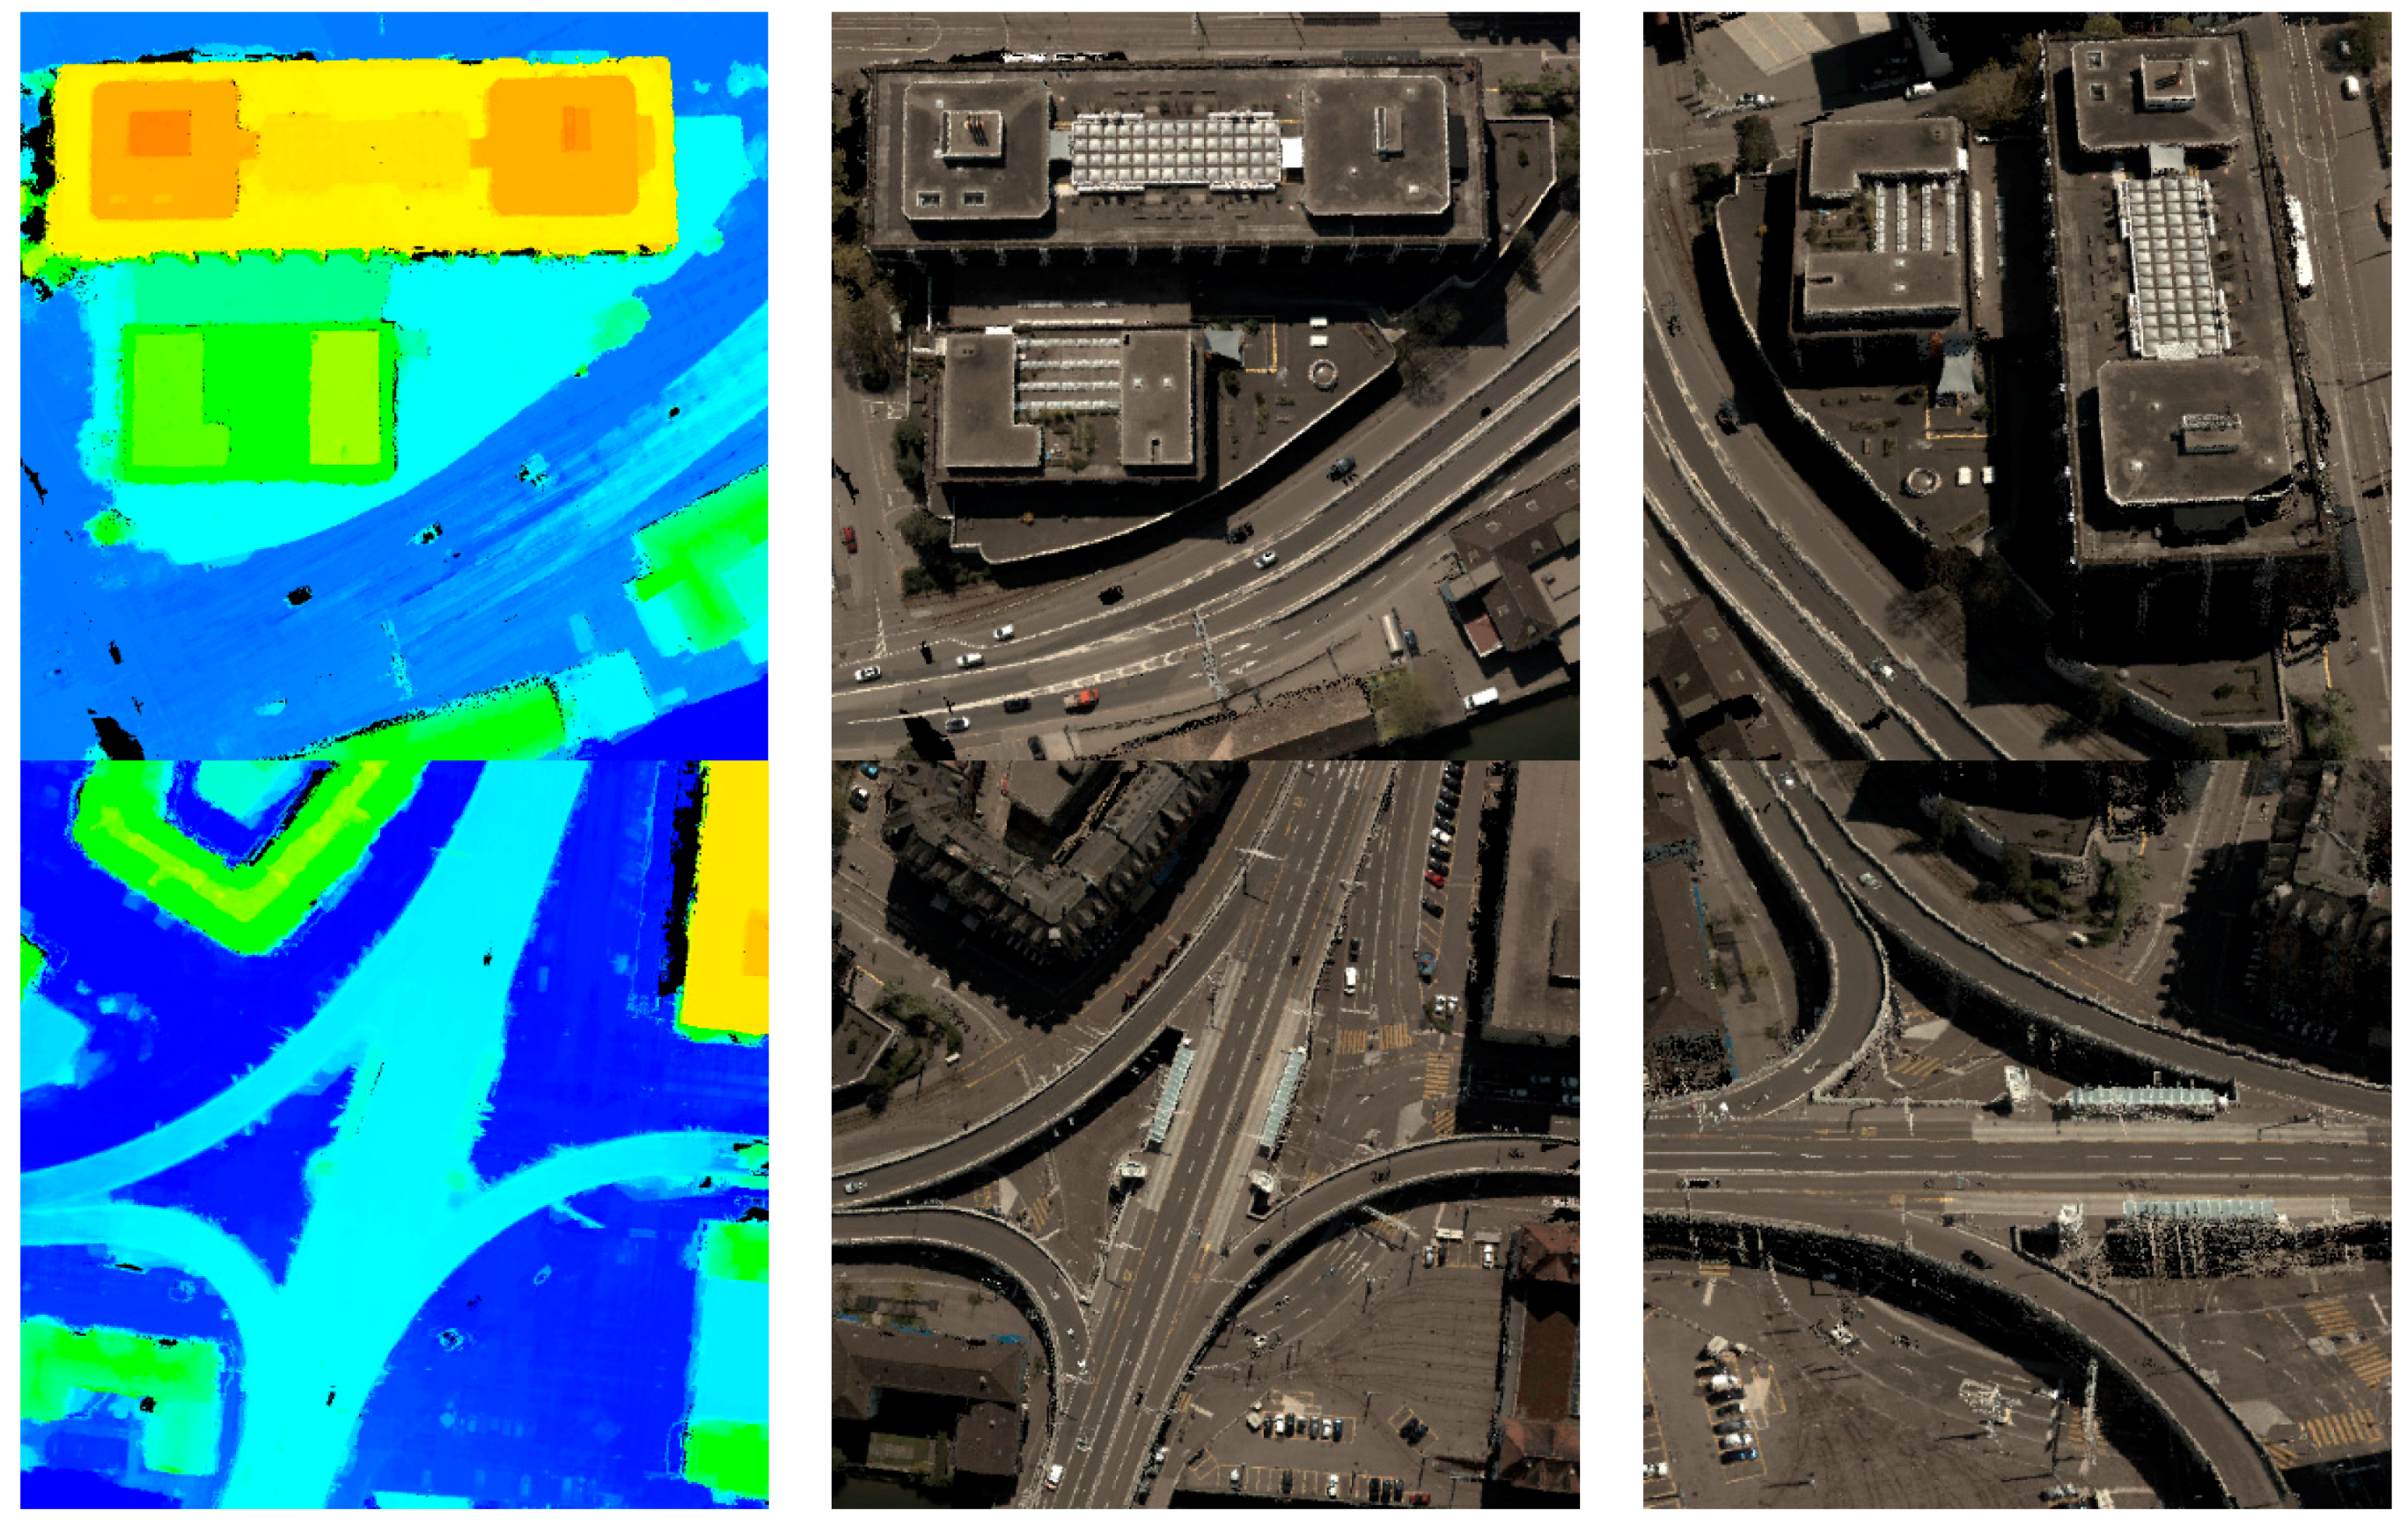
r is the half size of search ranges, then path accumulation keeps the same with tSGM algorithm. Considering the direction of edges in graph network, the depth maps of the reference image and matched image are both computed and output for subsequent processing, as shown in
Figure 4.
2.3. Graph Network Based Triangulation
The geometric correspondence relationship across multi-view images based on graph network is shown in
Figure 5.
For a pixel
on image
, the correspondence
on image
can be calculated as follows: First its correspondence coordinate on left epipolar image is calculated using the homographic matrix
. Then, the matched pixel on right epipolar image is easily obtained from the corresponding disparity of base image. Finally, the correspondence pixel
is determined by multiplying the inverted homographic matrix
. The whole transformation is as follows:
Since the transformed coordinate is not integer, bilinear interpolation will be exploited to calculate the value on the disparity image. Moreover, the disparity image of a base image or matched image has to be chosen according to the direction of arcs in graph network. For a path with length of
from image
to image
, the correspondence on image
can be computed along the path by applying the transformation in Equation (8), for
times. To reconstruct the dense results for a reference image, a full graph search is utilized to find the candidate images for triangulation. However, only those that meet the minimum overlap conditions (10% as the default) and intersection angle (10 degrees as the default) are maintained. After all the matches across the multi-view images in the graph network are computed, the corresponding object point
can be calculated using multi-view triangulation according to
where
represents the camera projection matrix of image
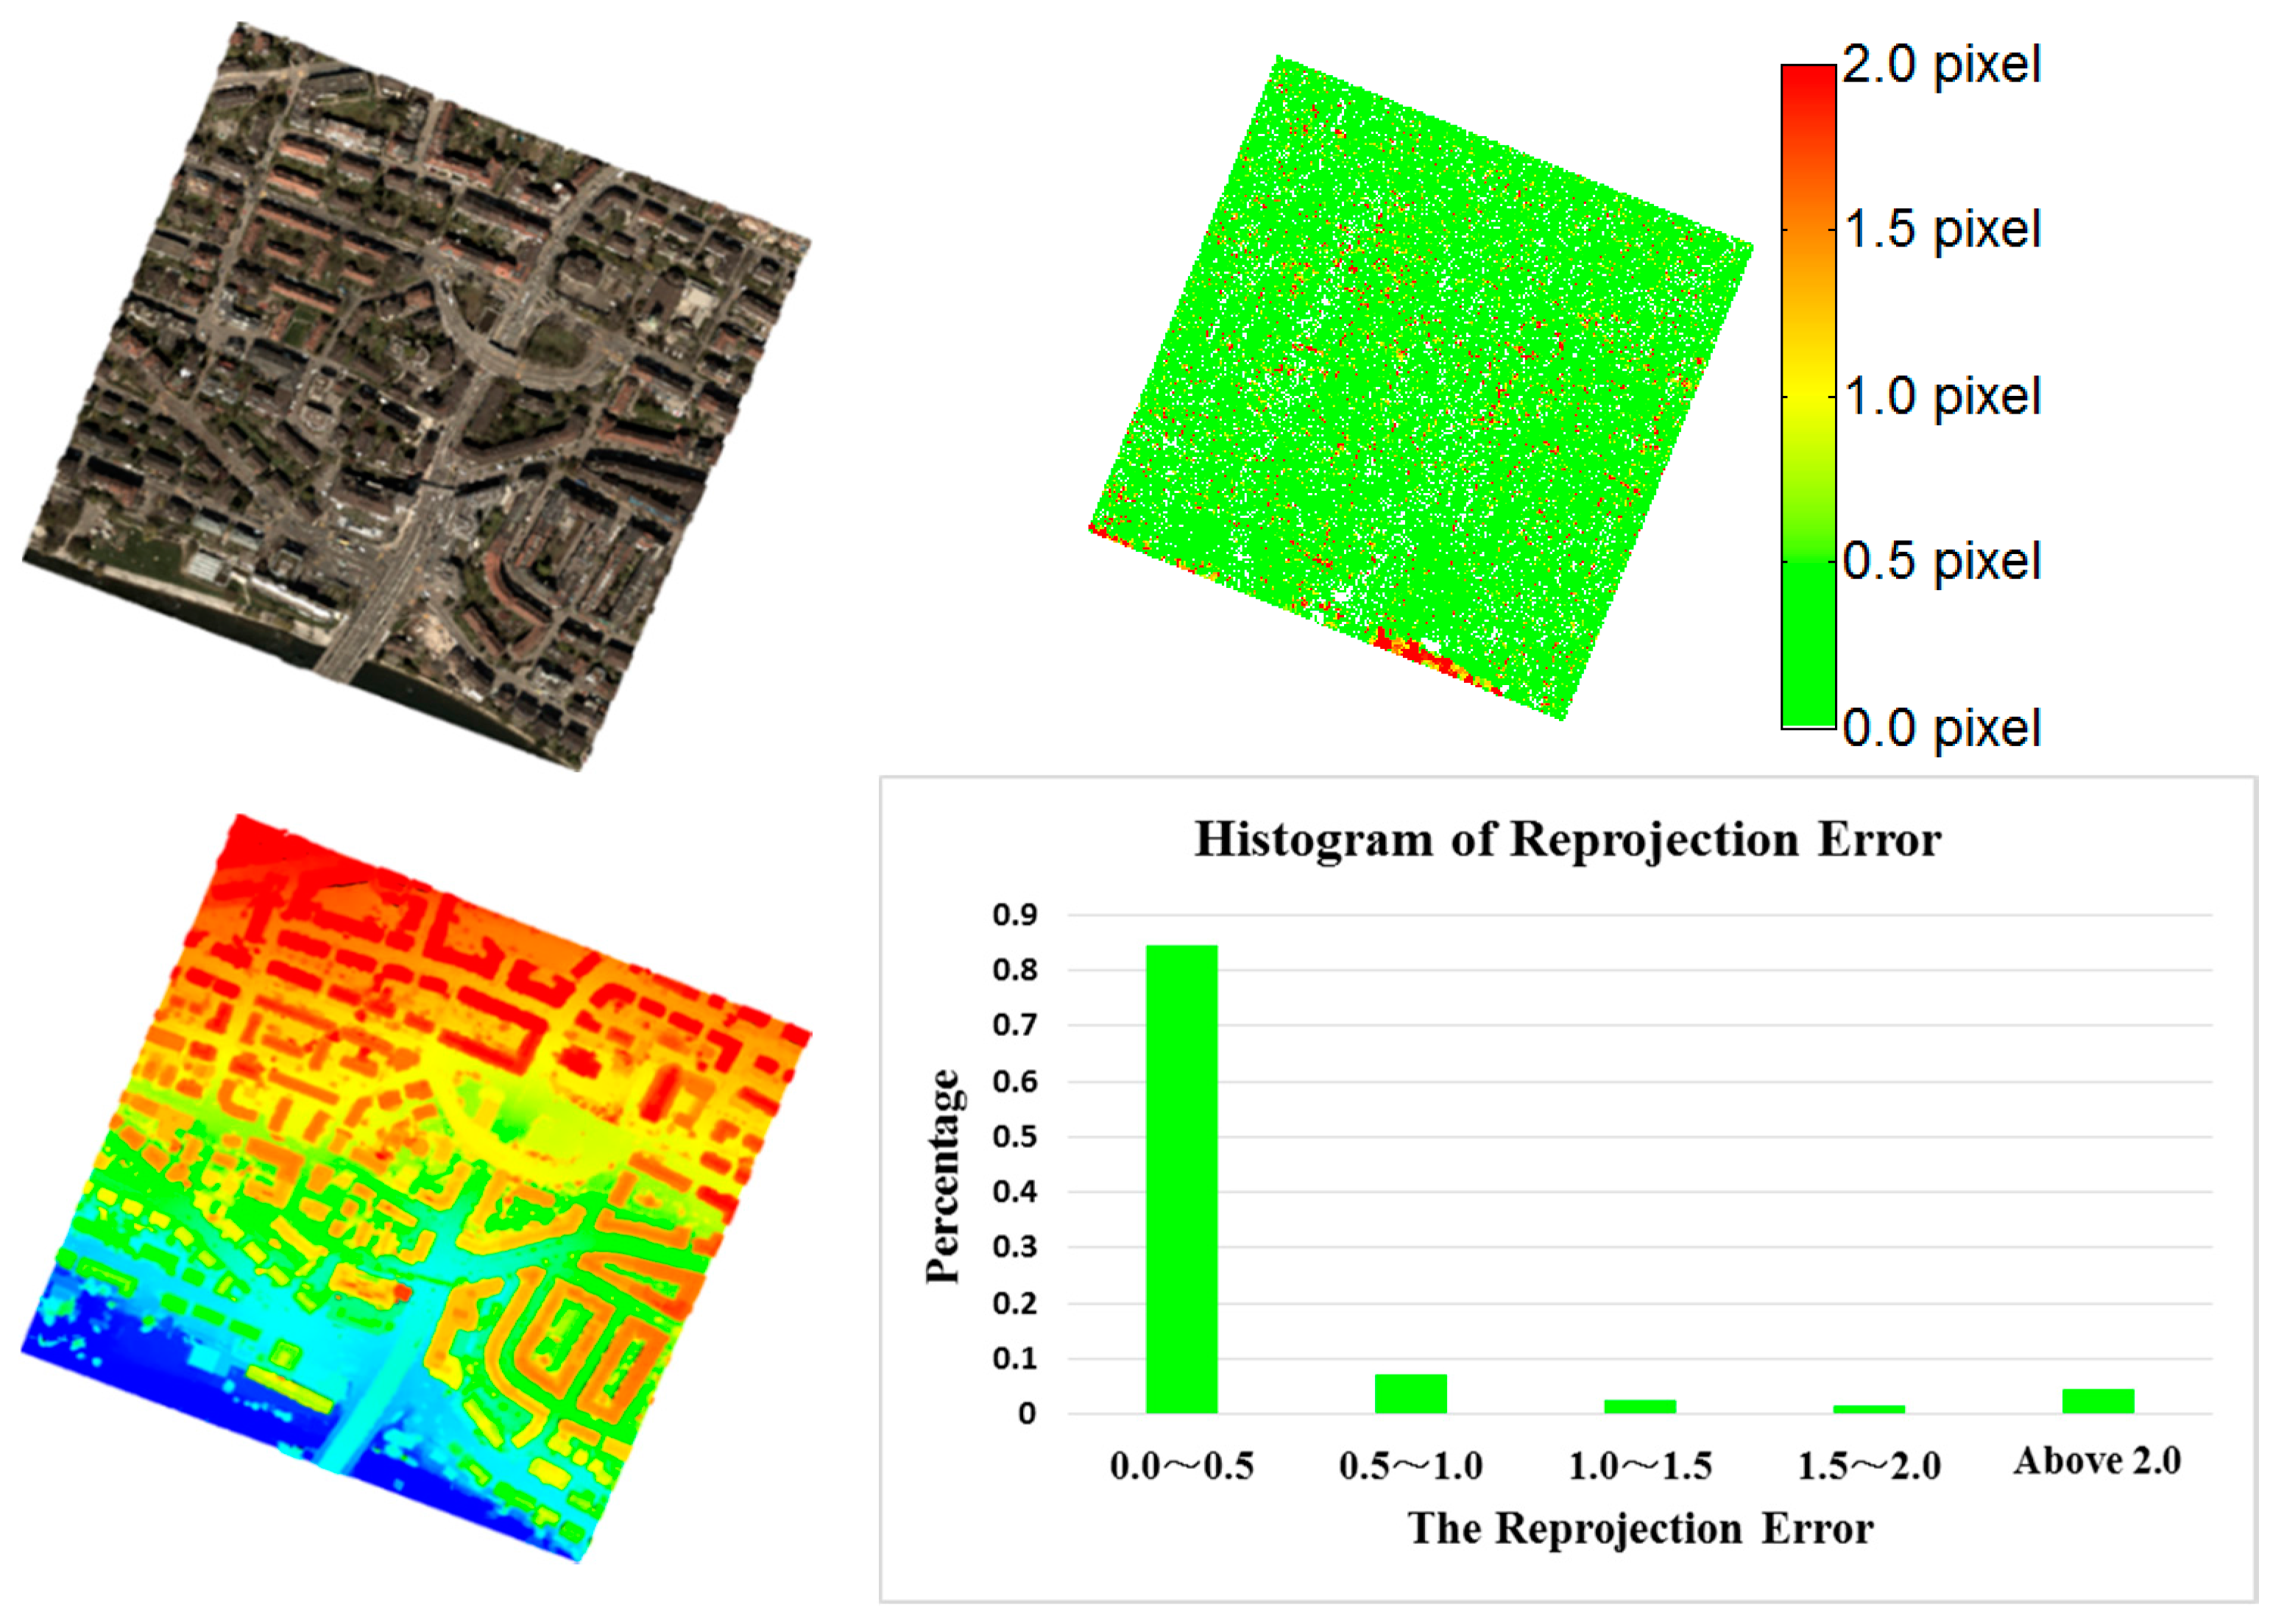
, and the average reprojection error can be calculated by
Despite the use of consistency checking, speckle removal, and guided median filtering, there is still some error. By setting the minimum number of image matches and the threshold for reprojection error during triangulation, potential error can be efficiently eliminated, which greatly reduces the complexity and runtime in the subsequent filtering process. Compared to direct triangulation from stereo pairs, graph network based triangulation makes full use of redundant measurements, resulting in higher accuracy for reconstructed dense point clouds. Due to the use of graph network, the triangulation of the same object point from different base images will get the same results. The dense point clouds extracted from different images therefore, will have a consistent coordinate system and can be more easily fused.
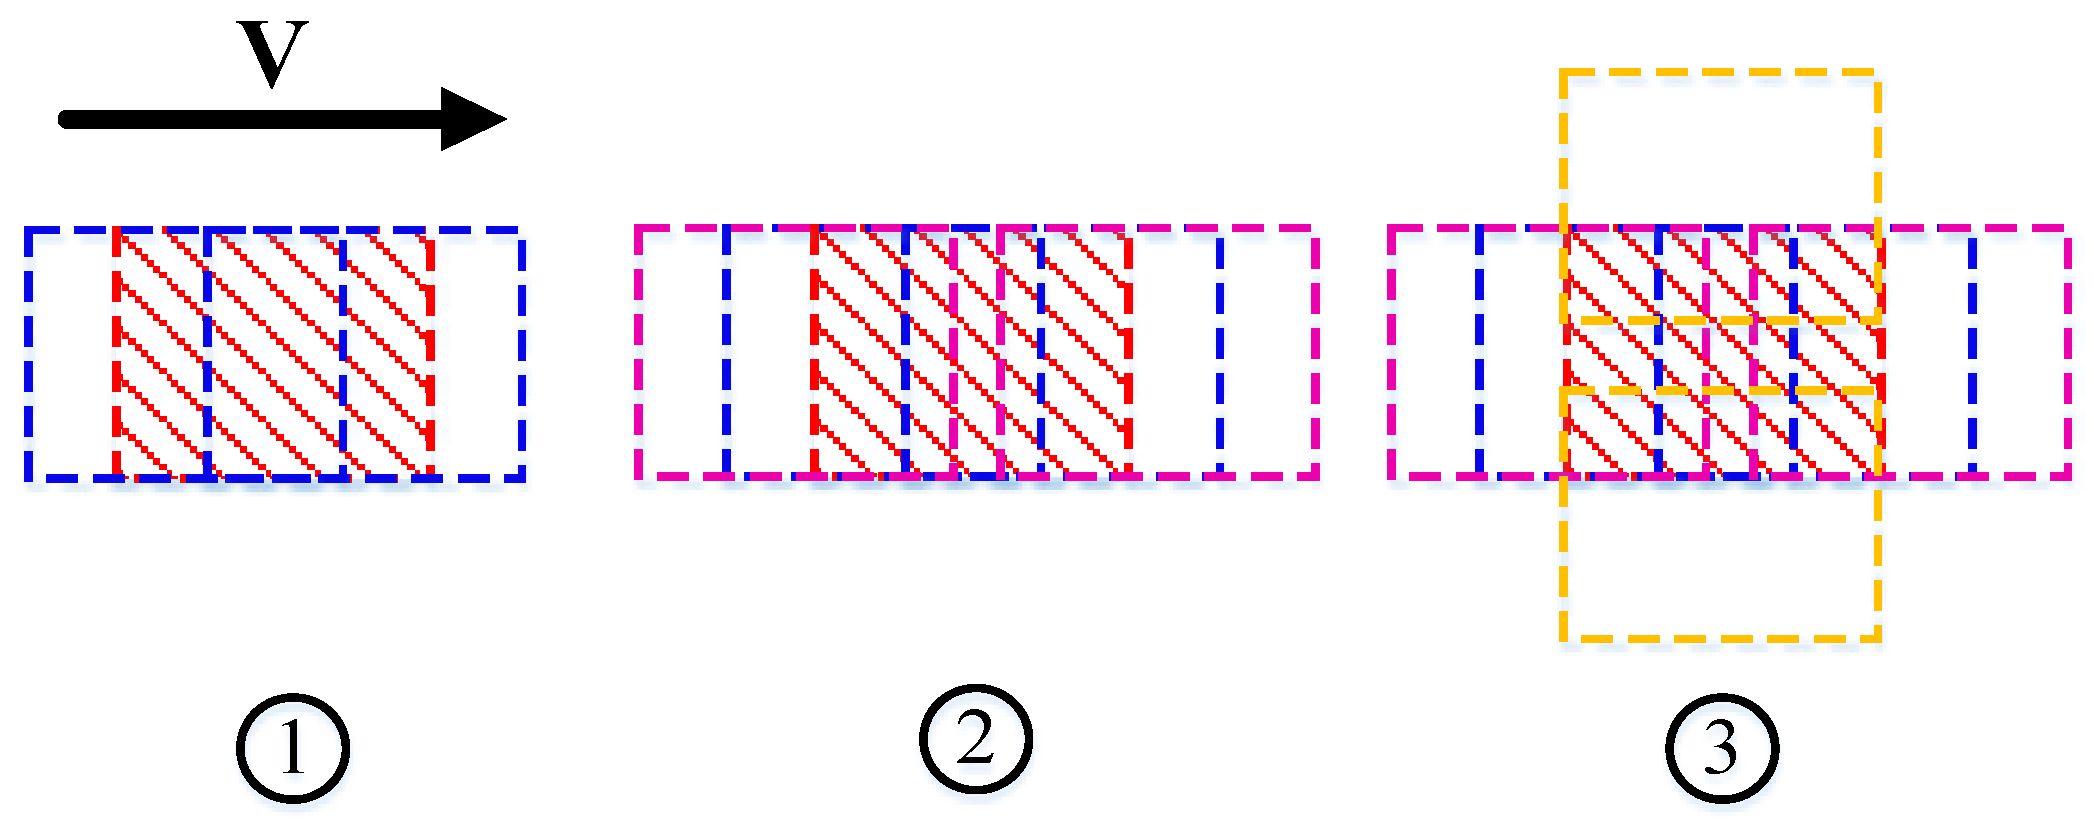
Benefiting from the transitivity of graph network, there is no need to compute stereo matching for image pairs with low overlap directly, resulting in different matching configurations for the proposed method. Three different matching configurations were designed and tested.
2.4. Multi-View Point Cloud Fusion
Considering the influence of perspective, occlusion, and mismatching, point clouds generated from different views need be fused and filtered so that the scenario results are complete. Since there is a high density of points in overlapping areas, resampling is applied to generate a final point cloud. The main steps of point cloud fusion in the current implementation are as follows: (1) Using noise filtering algorithm in Point Cloud Library (PCL) [
28] to remove the remaining mismatches of every single point clouds. Since most mismatches are excluded during the multi-view consistency checking process, the number of those to be eliminated is small; (2) Calculating the minimum bounding box of the target survey areas and partition task units by a tiling mechanism to make the task parallelization and accelerate the progress; (3) Within each task unit, point clouds that intersect with a bounding box are fused and resampled, using the K-d tree algorithm. The average reprojection error is the priority measure.
4. Discussion
4.1. Accuracy Analysis with Reference ALS Data
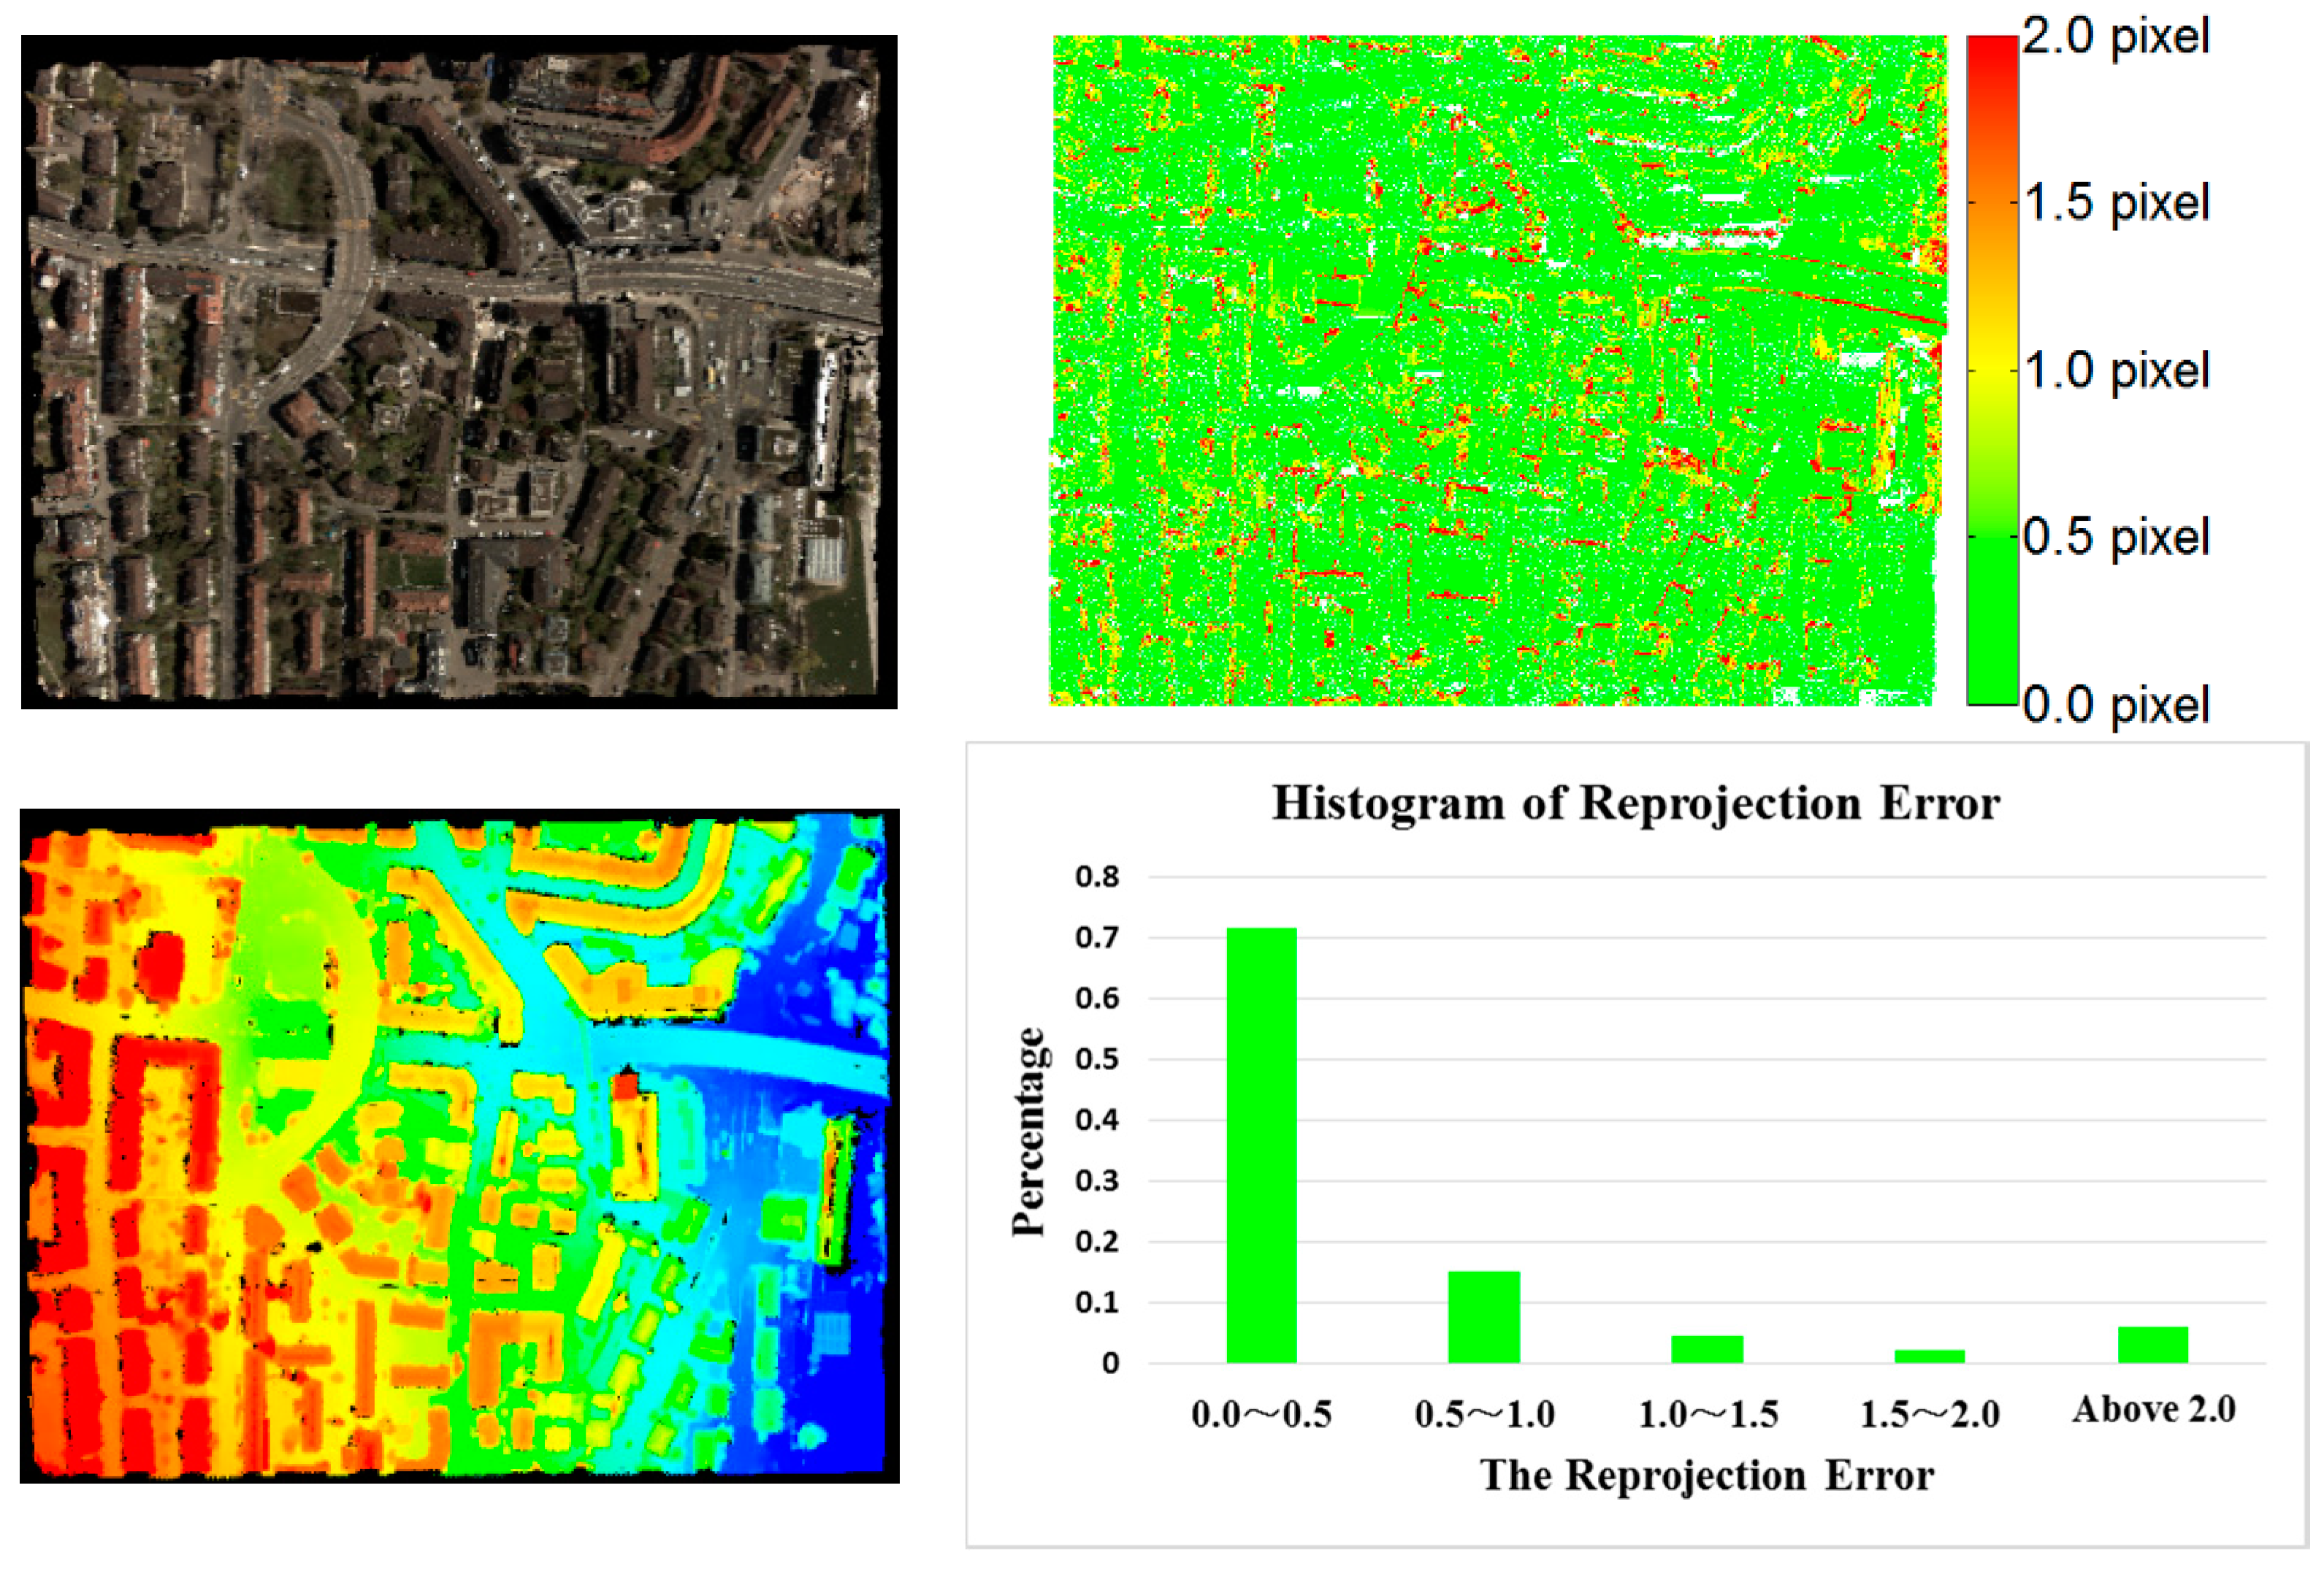
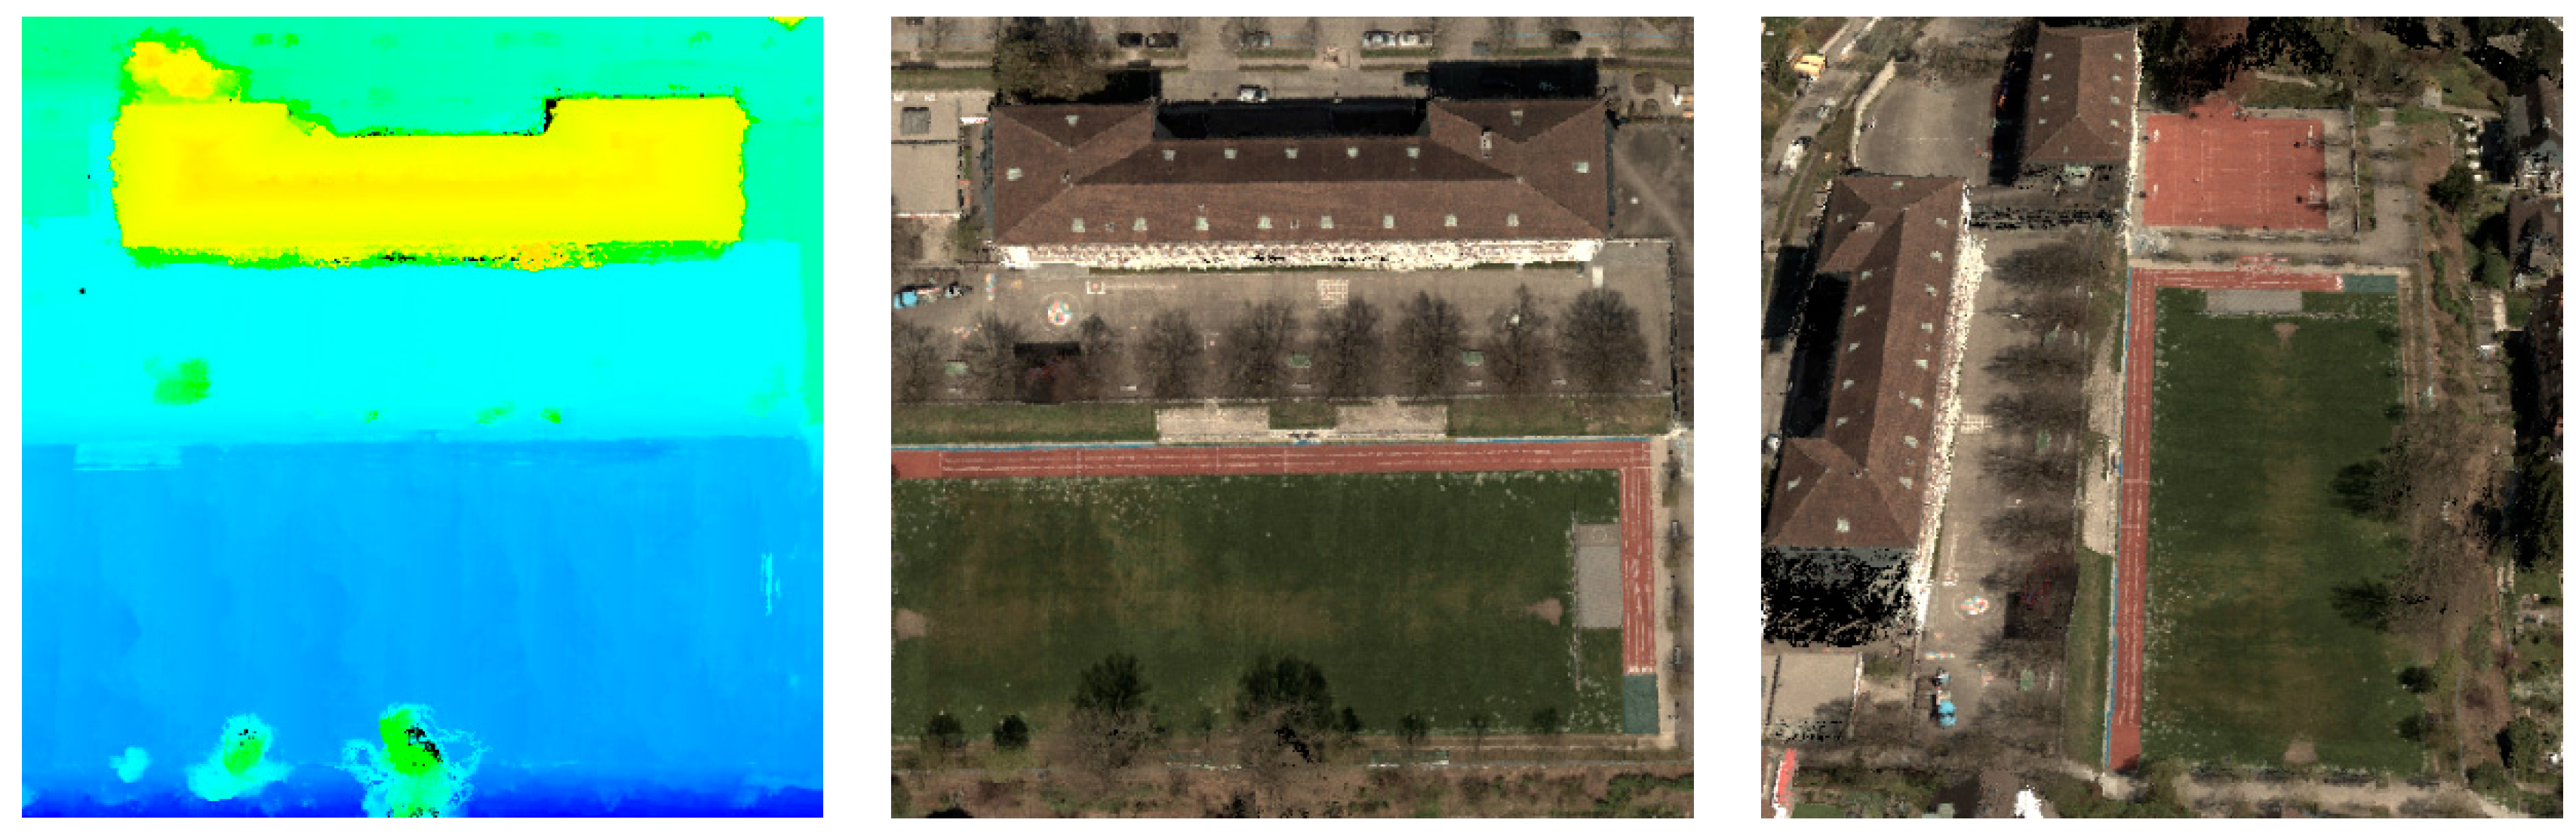
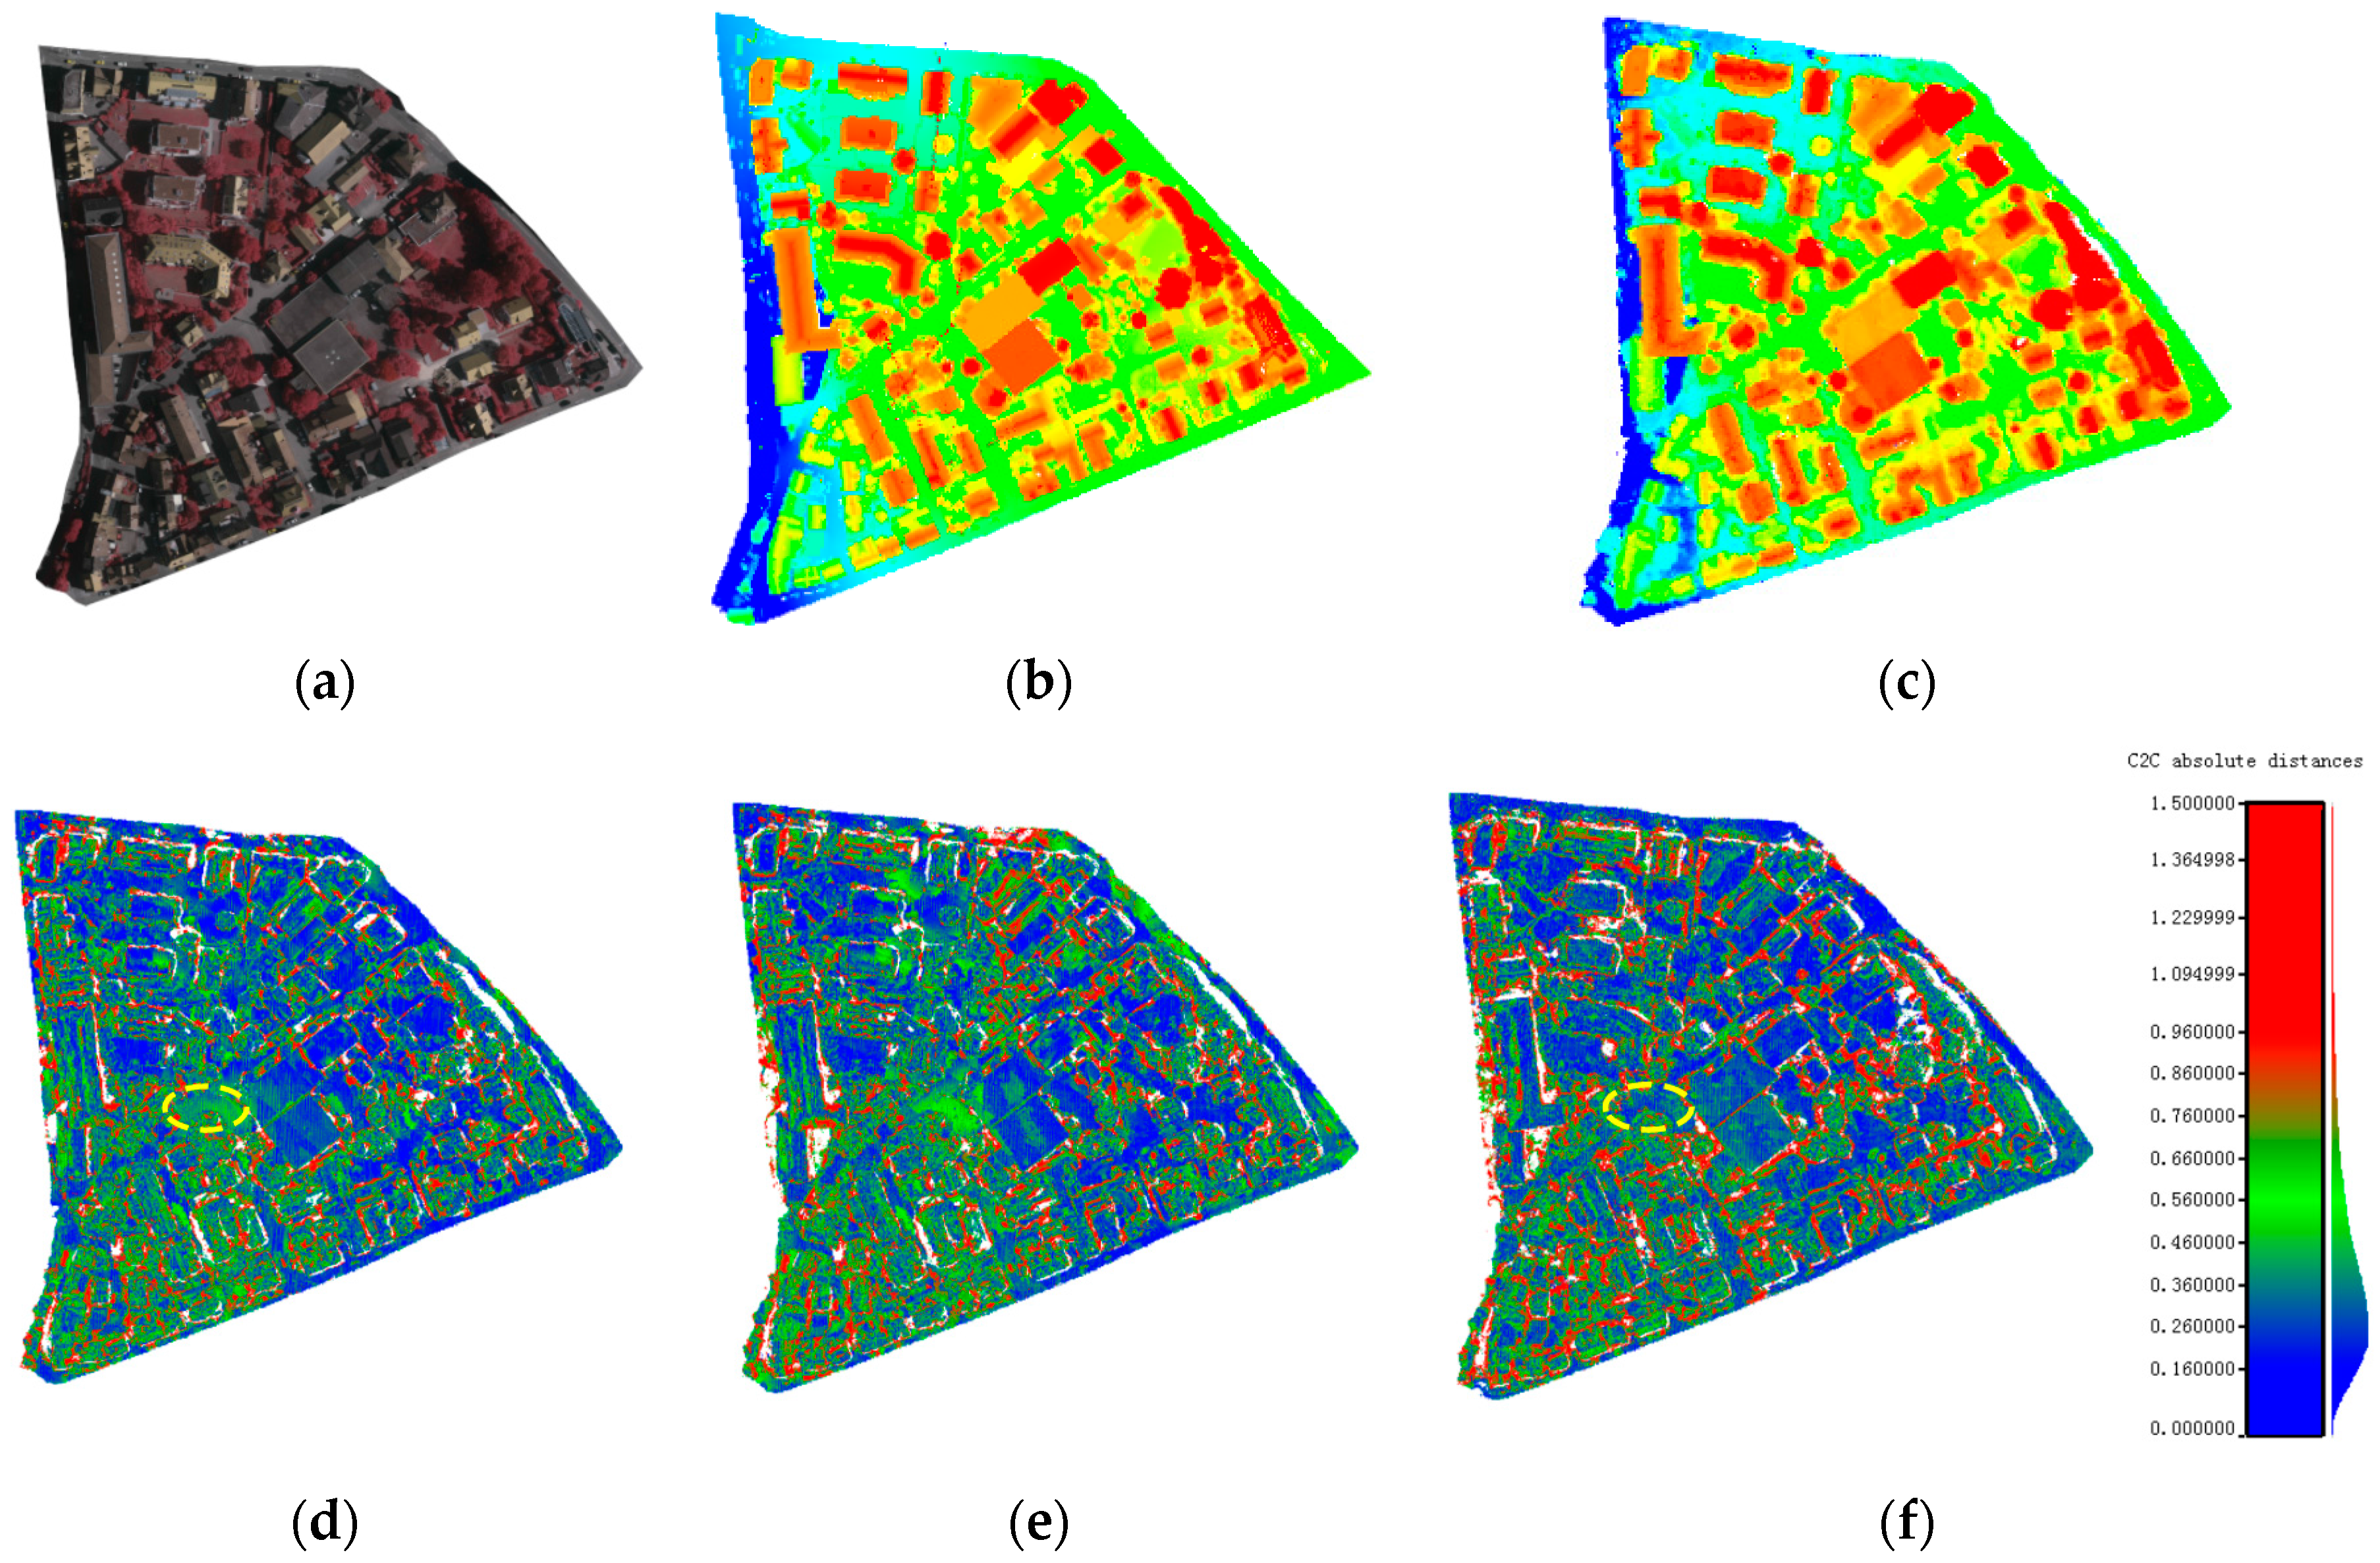
Since the actual positioning accuracy is affected by both matching accuracy and base-height ratio, reprojection error cannot fully evaluate the result of dense matching, so the Vaihingen dataset with reference ALS point cloud was used to validate the RMSE for positioning accuracy in the target area with vegetation and buildings. The dense matching results produced by the tested three configurations are compared to the reference data. Deviation maps were generated, as shown in
Figure 11.
Figure 11 shows that the dense matching results from the proposed method were consistent with the reference ALS point cloud. The actual positioning accuracy was 1.50 GSD, 1.75 GSD and 1.87 GSD for three configurations, respectively; similar to the accuracy as determined using reprojection error as discussed in
Section 3.2.1. Comparing the positioning error maps of the three configurations, configuration ② was less accurate than configuration ① due to the impact of the low matching accuracy of wide-baseline image pairs using the same image collection for triangulation. On the other hand, image pairs across flights were added in configuration ③ for triangulation, which was more accurate in some local areas than configuration ① as shown in the area denoted by a yellow ellipse. However, the matching accuracy in the areas with sharp discontinuities like tall buildings was further reduced due to the big intersection angle between image pairs across flights, this resulted in less accurate results than configuration ①, which considered completeness and overall accuracy.
4.2. Comparison with SURE and PhotoScan
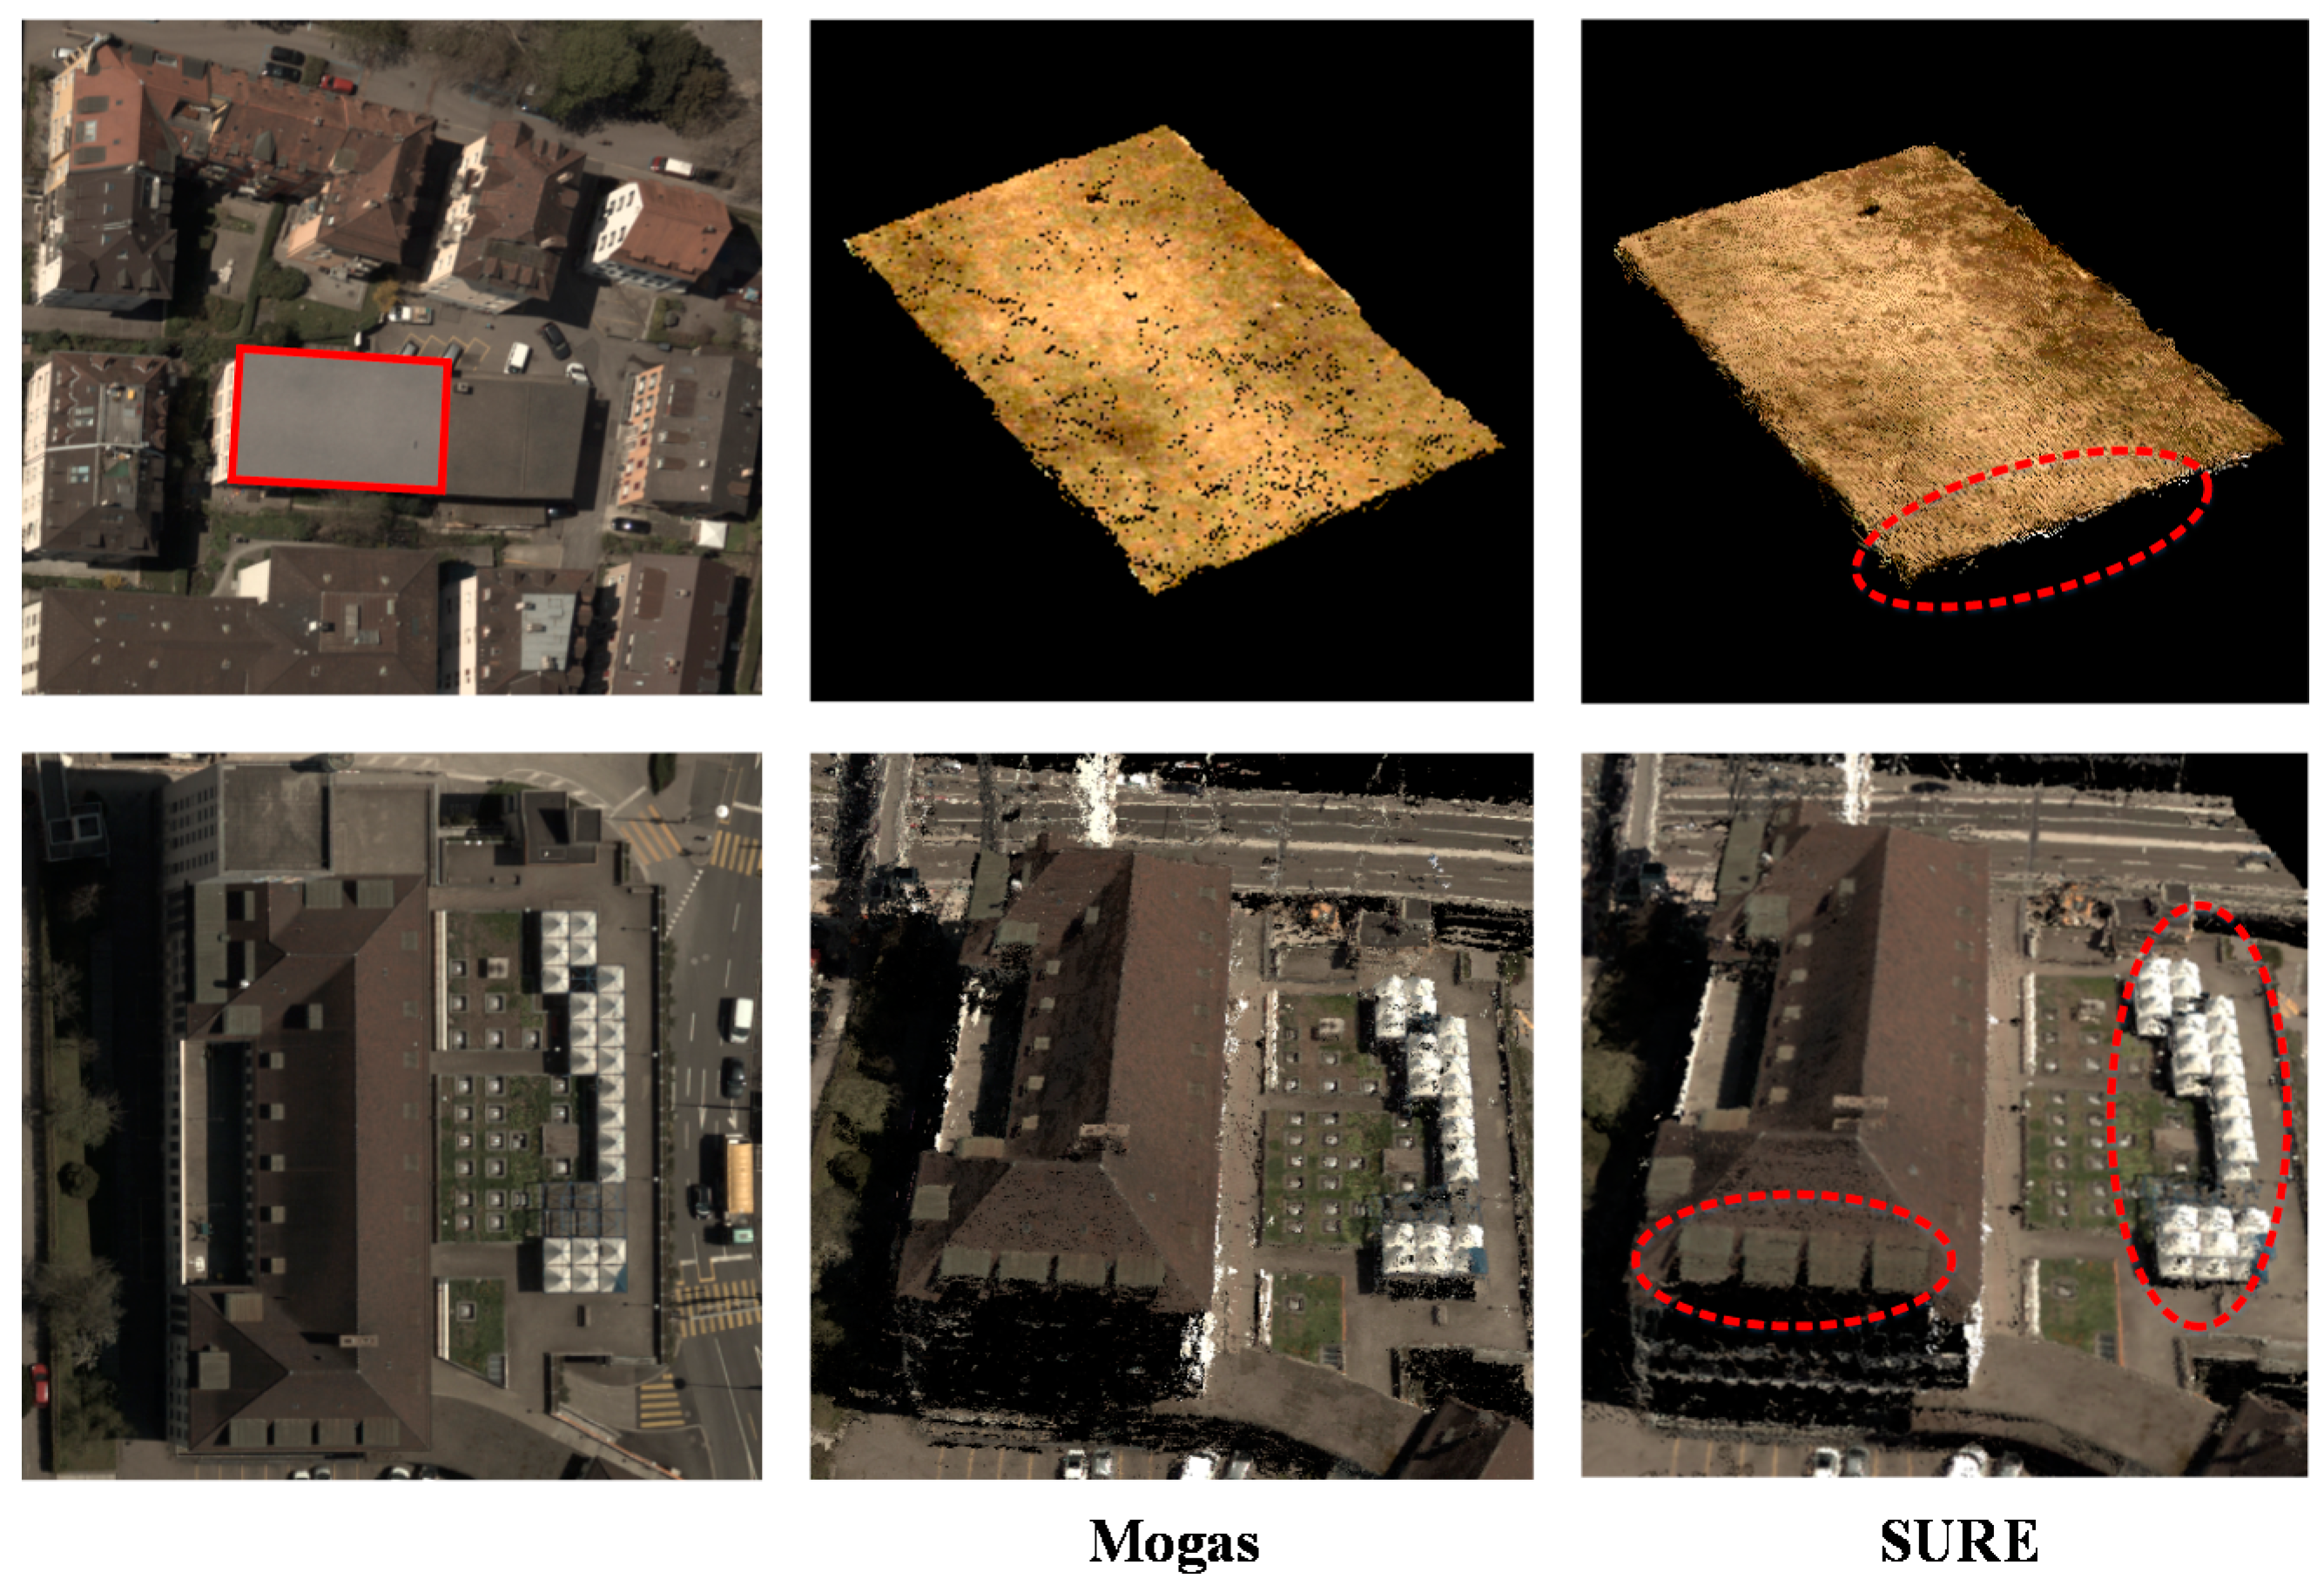
Since our method is close to SURE, the point clouds obtained by the two methods were first compared through visual inspection.
Figure 12 (red ellipse areas) displays the results for the Zürich dataset. Ghosting effects are visible in the SURE results, while the results produced using our proposed method show no evidence of Ghosting. In the SURE method, point clouds for the same scene are generated from different views during the triangulation process with different correspondences. This results in a slight offset across the multi-view point clouds. In contrast, since a graph network is used in our algorithm, the point clouds from different views share the same correspondences with no offset and can be seamlessly integrated.
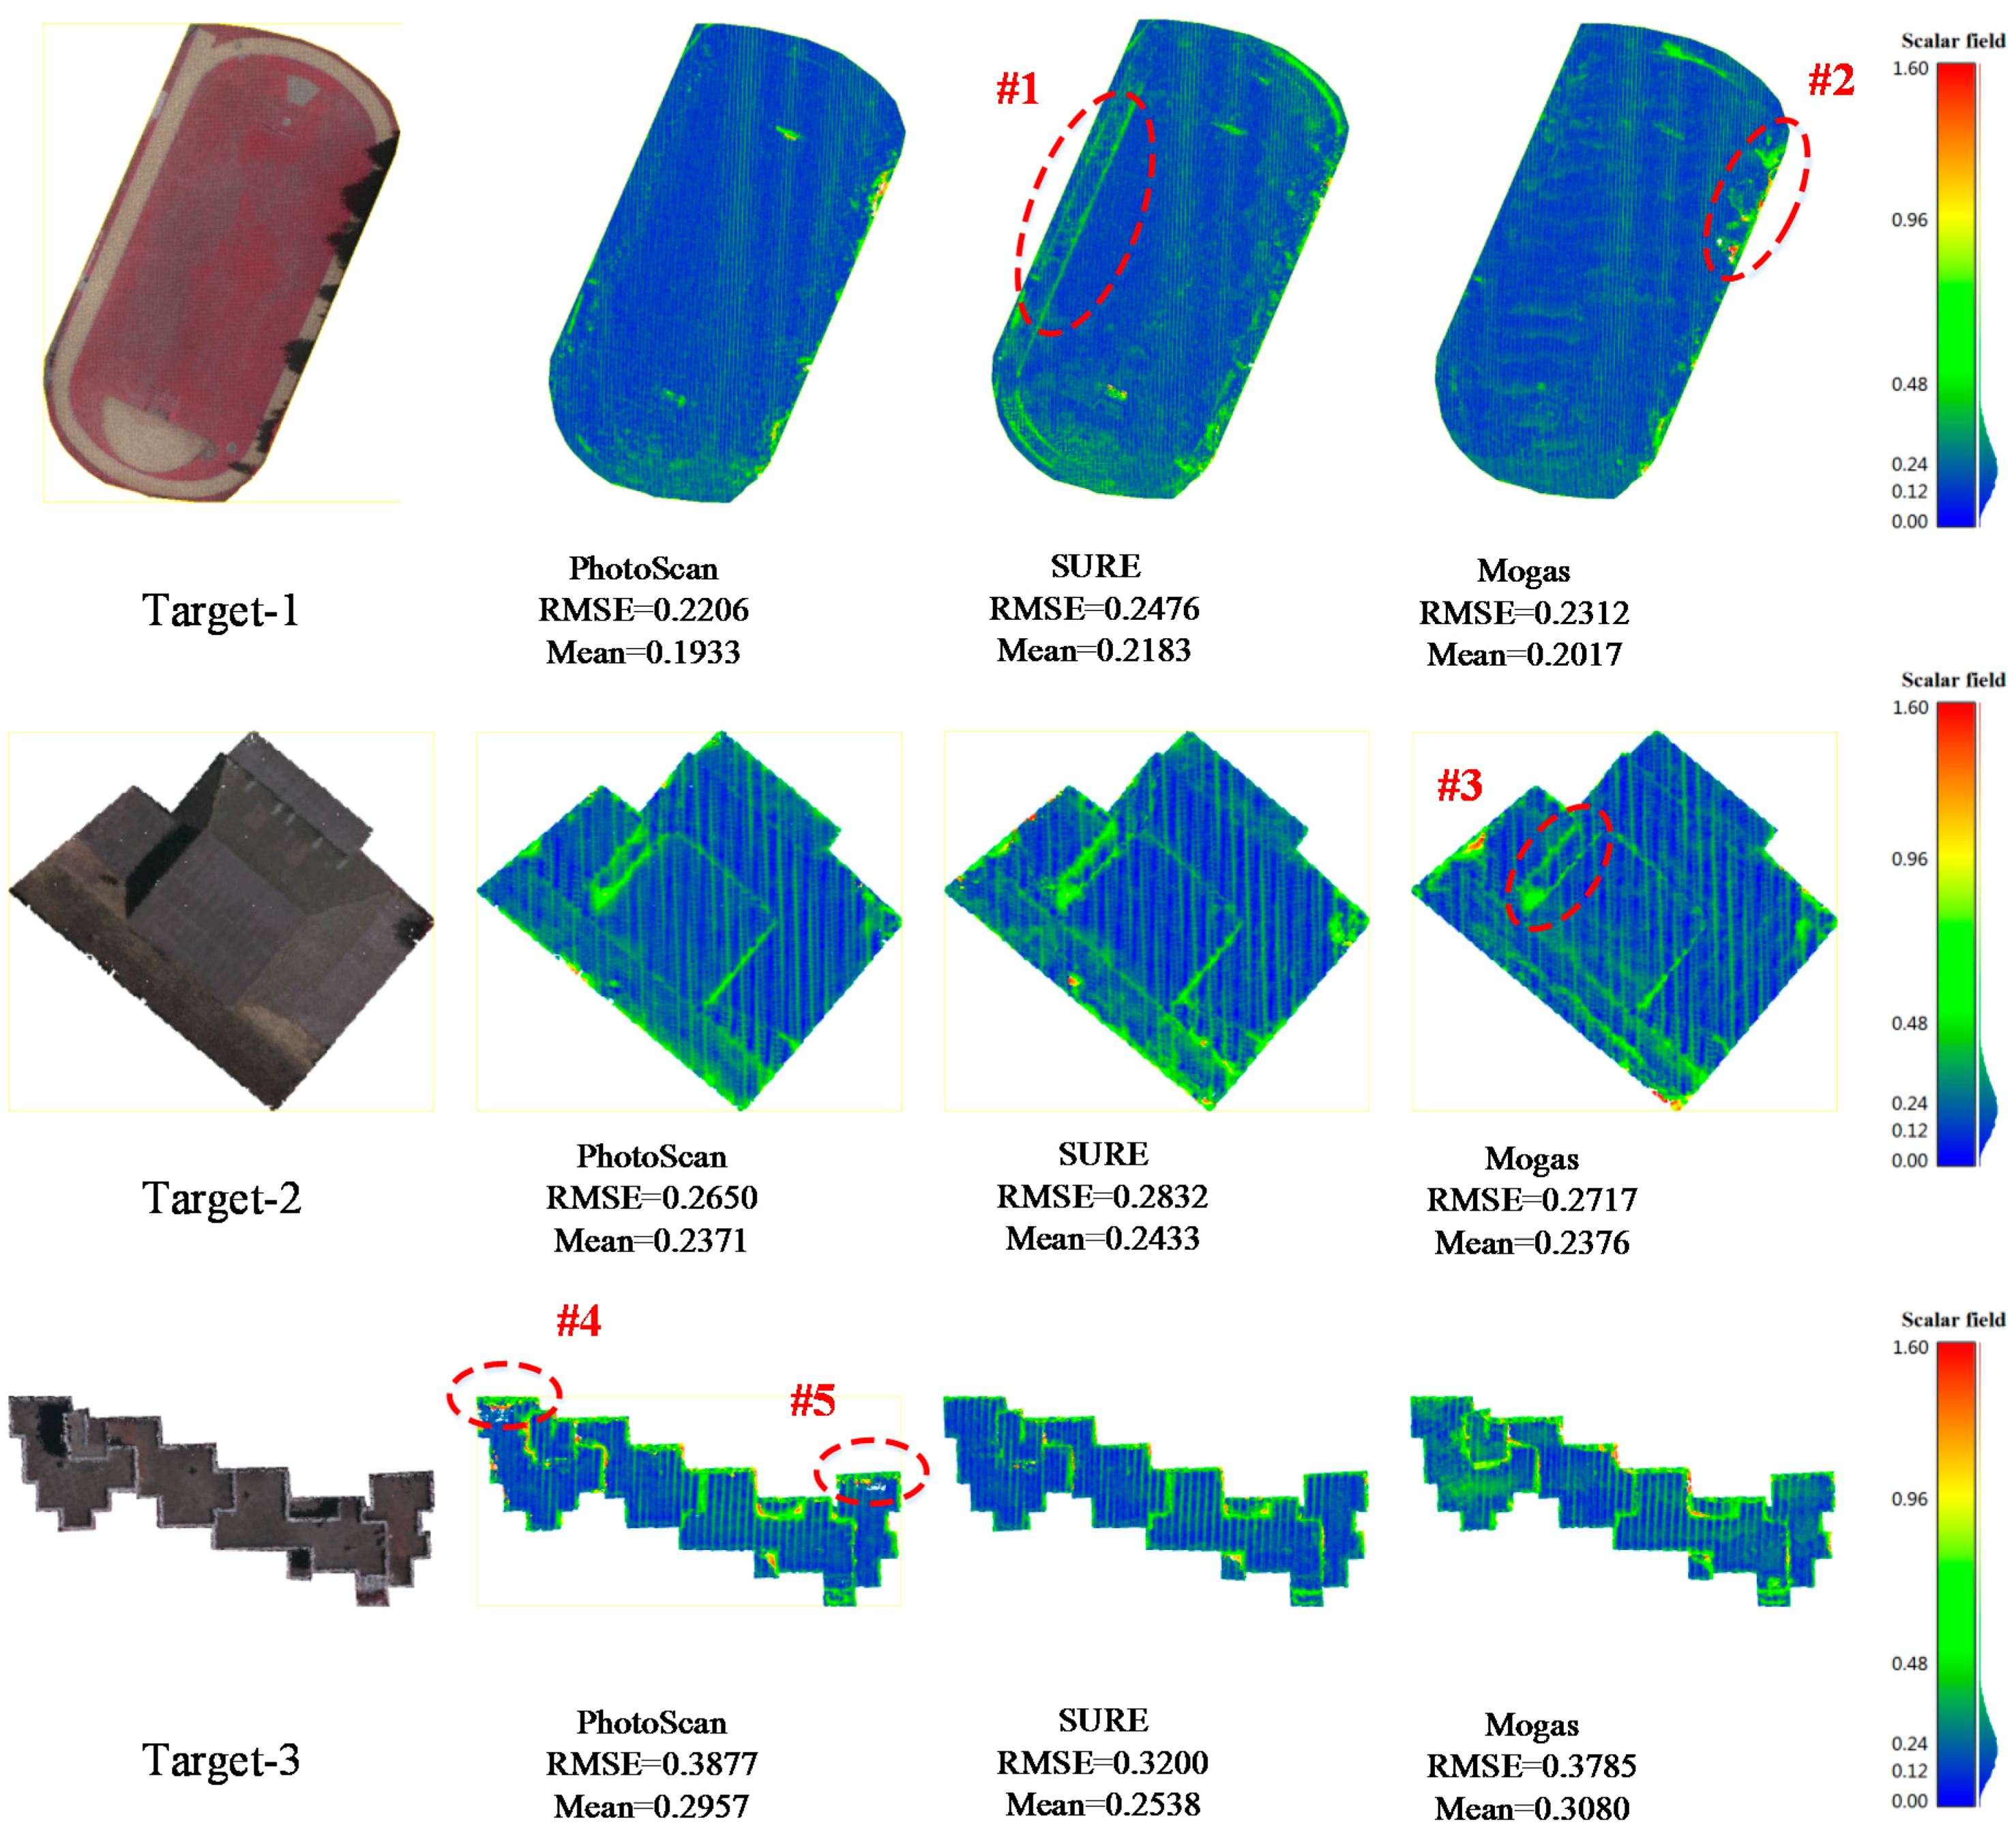
To further validate the performance and accuracy of the proposed method, two state-of-the-art software product (SURE and PhotoScan) results are compared at three target areas from easy to challenging in the Vaihingen dataset. Target-1 is a planar playground, target-2 is a single building and target-3 is a continuous complex building. Affected by the plant growth due to time gap between image capture and LiDAR flights, and given differences in measurement principles, the reference ALS data cannot exclusively match the DIM results. Areas of vegetation therefore, were not used in these experiments.
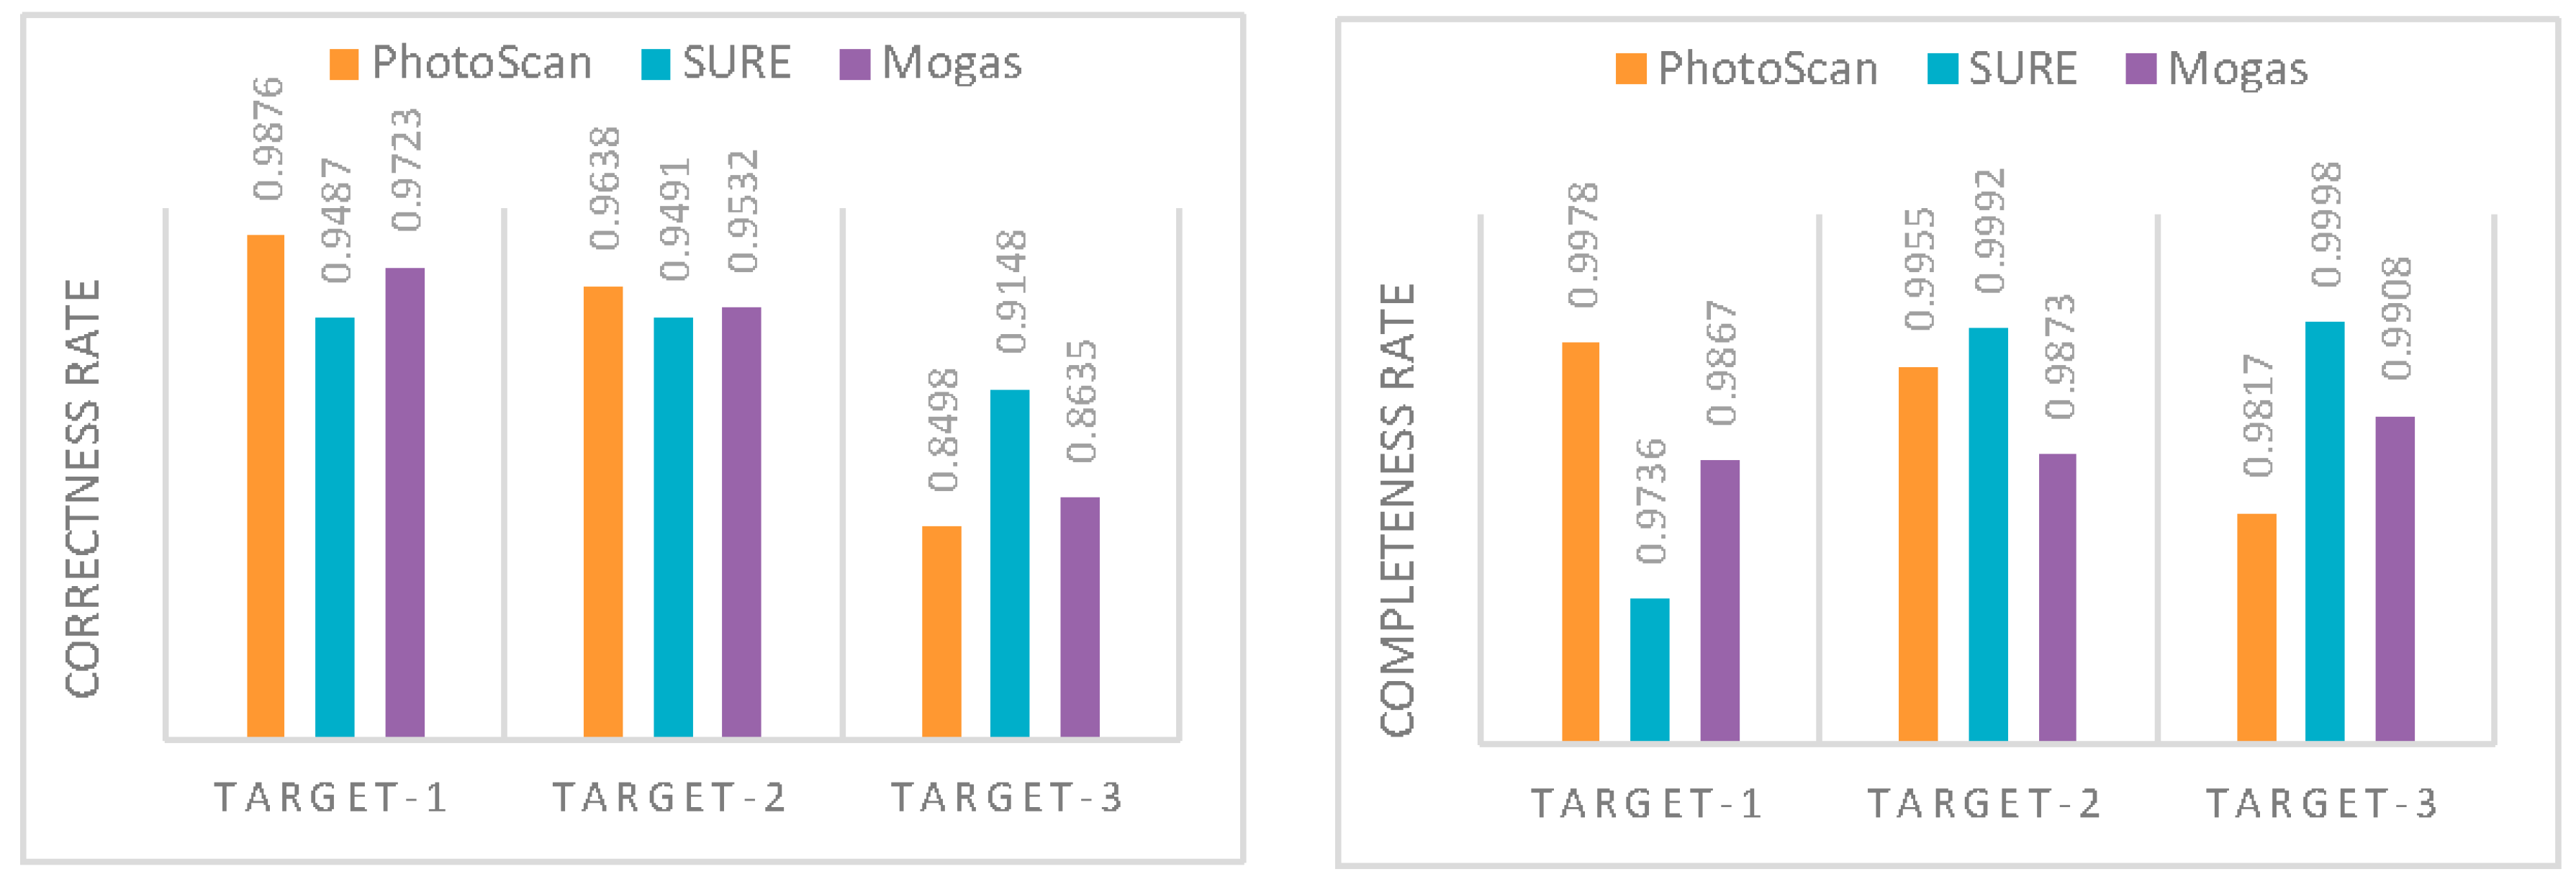
To make a fair comparison, the three methods are excuted at the same image resolution using configuration three, which is adopted as the solution in SURE and PhotoScan. In order to reduce the requirements for professional skills, SURE and PhotoScan are designed ina one-button processing mode, so the matching results are generated with default settings. In this paper, point clouds obtained from the three methods were first resampled with the grid width of the GSD for the respective imagery to get the same density, so points with the median elevation were retained when the neighborhood of a target grid point contained matching results. Then, deviation maps were generated by computing the euclidean distance using reference data. The RMSE and mean error were also calculated along with the correctness and completeness rates that represent the percentage of pixels with an error <n × GSD, as shown in
Figure 13 and
Figure 14. Correctness was computed with the value of three GSD, completeness with ten GSD.
To compare the performance of three methods in flat areas, target-1 was selected for the simple case, as shown in the top row of
Figure 13. These results show that the proposed method is comparable to PhotoScan, but better than SURE, considering the RMSE and mean error. SURE has a large deviation in the contour region, #1 for a runway, while areas with large deviations in the results from the proposed method are mainly located in areas of cast shadows, #2. Because the image intensity values in those regions are inconsistent with the surrounding areas, the cencus cost and guided median filter are not viable, so the match fails. In the more difficult cases, target-2 and target-3 were selected to evaluate performance on buildings in urban areas. From the deviation maps of target-b as depicted in the middle of
Figure 13, the results are similar to those obtained for target-1 by the RMSE and mean error. This structure was effectively captured by all three methods. However, it can be seen that the proposed method works best on the edge details of #3 showing a building covered by a cast shadow. The most challenging case in target-3, where buildings are of different heights with more occlusionsis presented at the bottom of
Figure 13, PhotoScan no longer the delivers the best performance due to missed matches on the both ends of the buildings in region #4 and #5. In contrast to PhotoScan, the proposed method and SURE demonstrate more complete results. However, all the solutions from three methods appear relatively noisy in the outlined areas of buildings. Considering the correctness rate as dipicted on the left of
Figure 14, the statistics are consistent with the previous analysis. As for the completeness rate as shown in right of
Figure 14, all three methods perform well and have a completeness rate of over 95%.
4.3. Strengths and Limitations
A graph network-based multi-view dense matching algorithm is proposed in this study. The new method was successfully applied for dense point cloud generation from multi-view high-resolution aerial images. The main advantage of the proposed approach is improvement in the efficiency and completeness for stereo pair based multi-view dense matching with high accuracy. Experimental results show that the average reprojection error is at the subpixel level, and actual positioning accuracy is about 1.5 GSD.
The time consumed by dual-depth map generation for a single stereo pair in 15 Megapixel was about 2 min in our tSGM implementation. Fewer stereo pairs need to be computed in the proposed method than in the conventional practices found in the SURE and PhotoScan software, which decreased the overall processing time by 57% in our experiment with the Zürich dataset. In the selected aerial scenario, the overlap ratio was low and the number of images was small. For large scale scenarios with high overlap, the execution time could be further reduced, thereby considerably improving the efficiency and applicability of the MVS algorithm.
Within multi-view stereo methods based on image space, disparity estimations of single stereo models are typically merged in order to increase the reliability and precision of the final depth maps or point clouds. The original SGM [
3] proposes an orthographic 2.5D projection method to fuse several disparity images from different viewpoints for aerial applications, and SURE [
5] presents a method to transform all disparity maps of base image to the distance maps between camera center and object point on the optical ray, then fuses them by minimizing the reprojection error. However, point clouds from different base images will have small offsets since in these methods they are generated separately without connection. Those produced by the proposed method show higher consistency, therefore these point clouds can be seamlessly integrated without extra processing.
Considering that the performance of stereo matching decreases sharply with the increased base-height ratio using a SGM algorithm, image pairs with wide baselines can obtain higher correspondence using the proposed method than the direct matching result. Our experimental results show that configuration ① has a higher performance than configuration ② and ③. The proposed method performs better than traditional practices found in SURE and PhotoScan since the point clouds from different base images have consistent coordinates, with competitive efficiency.
The proposed method can be combined with an object-based MVS algorithm such as the plane sweep stereo method [
30,
31] to achieve the optimal performance and efficiency. A minimum number of image pairs are computed to obtain initial matching results with high accuracy, so that the depth search space can be constrained in a small range for the object-based MVS method to refine the results.
5. Conclusions
A novel graph network based multi-view dense matching algorithm for high-resolution aerial images is proposed in this paper. In this method, a modified tSGM algorithm is first used to compute dual direction disparity maps across stereo pairs, and point clouds of single view are then generated by triangulation based on graph network, followed by multi-view point cloud fusion with average reprojection error as a priority measure.
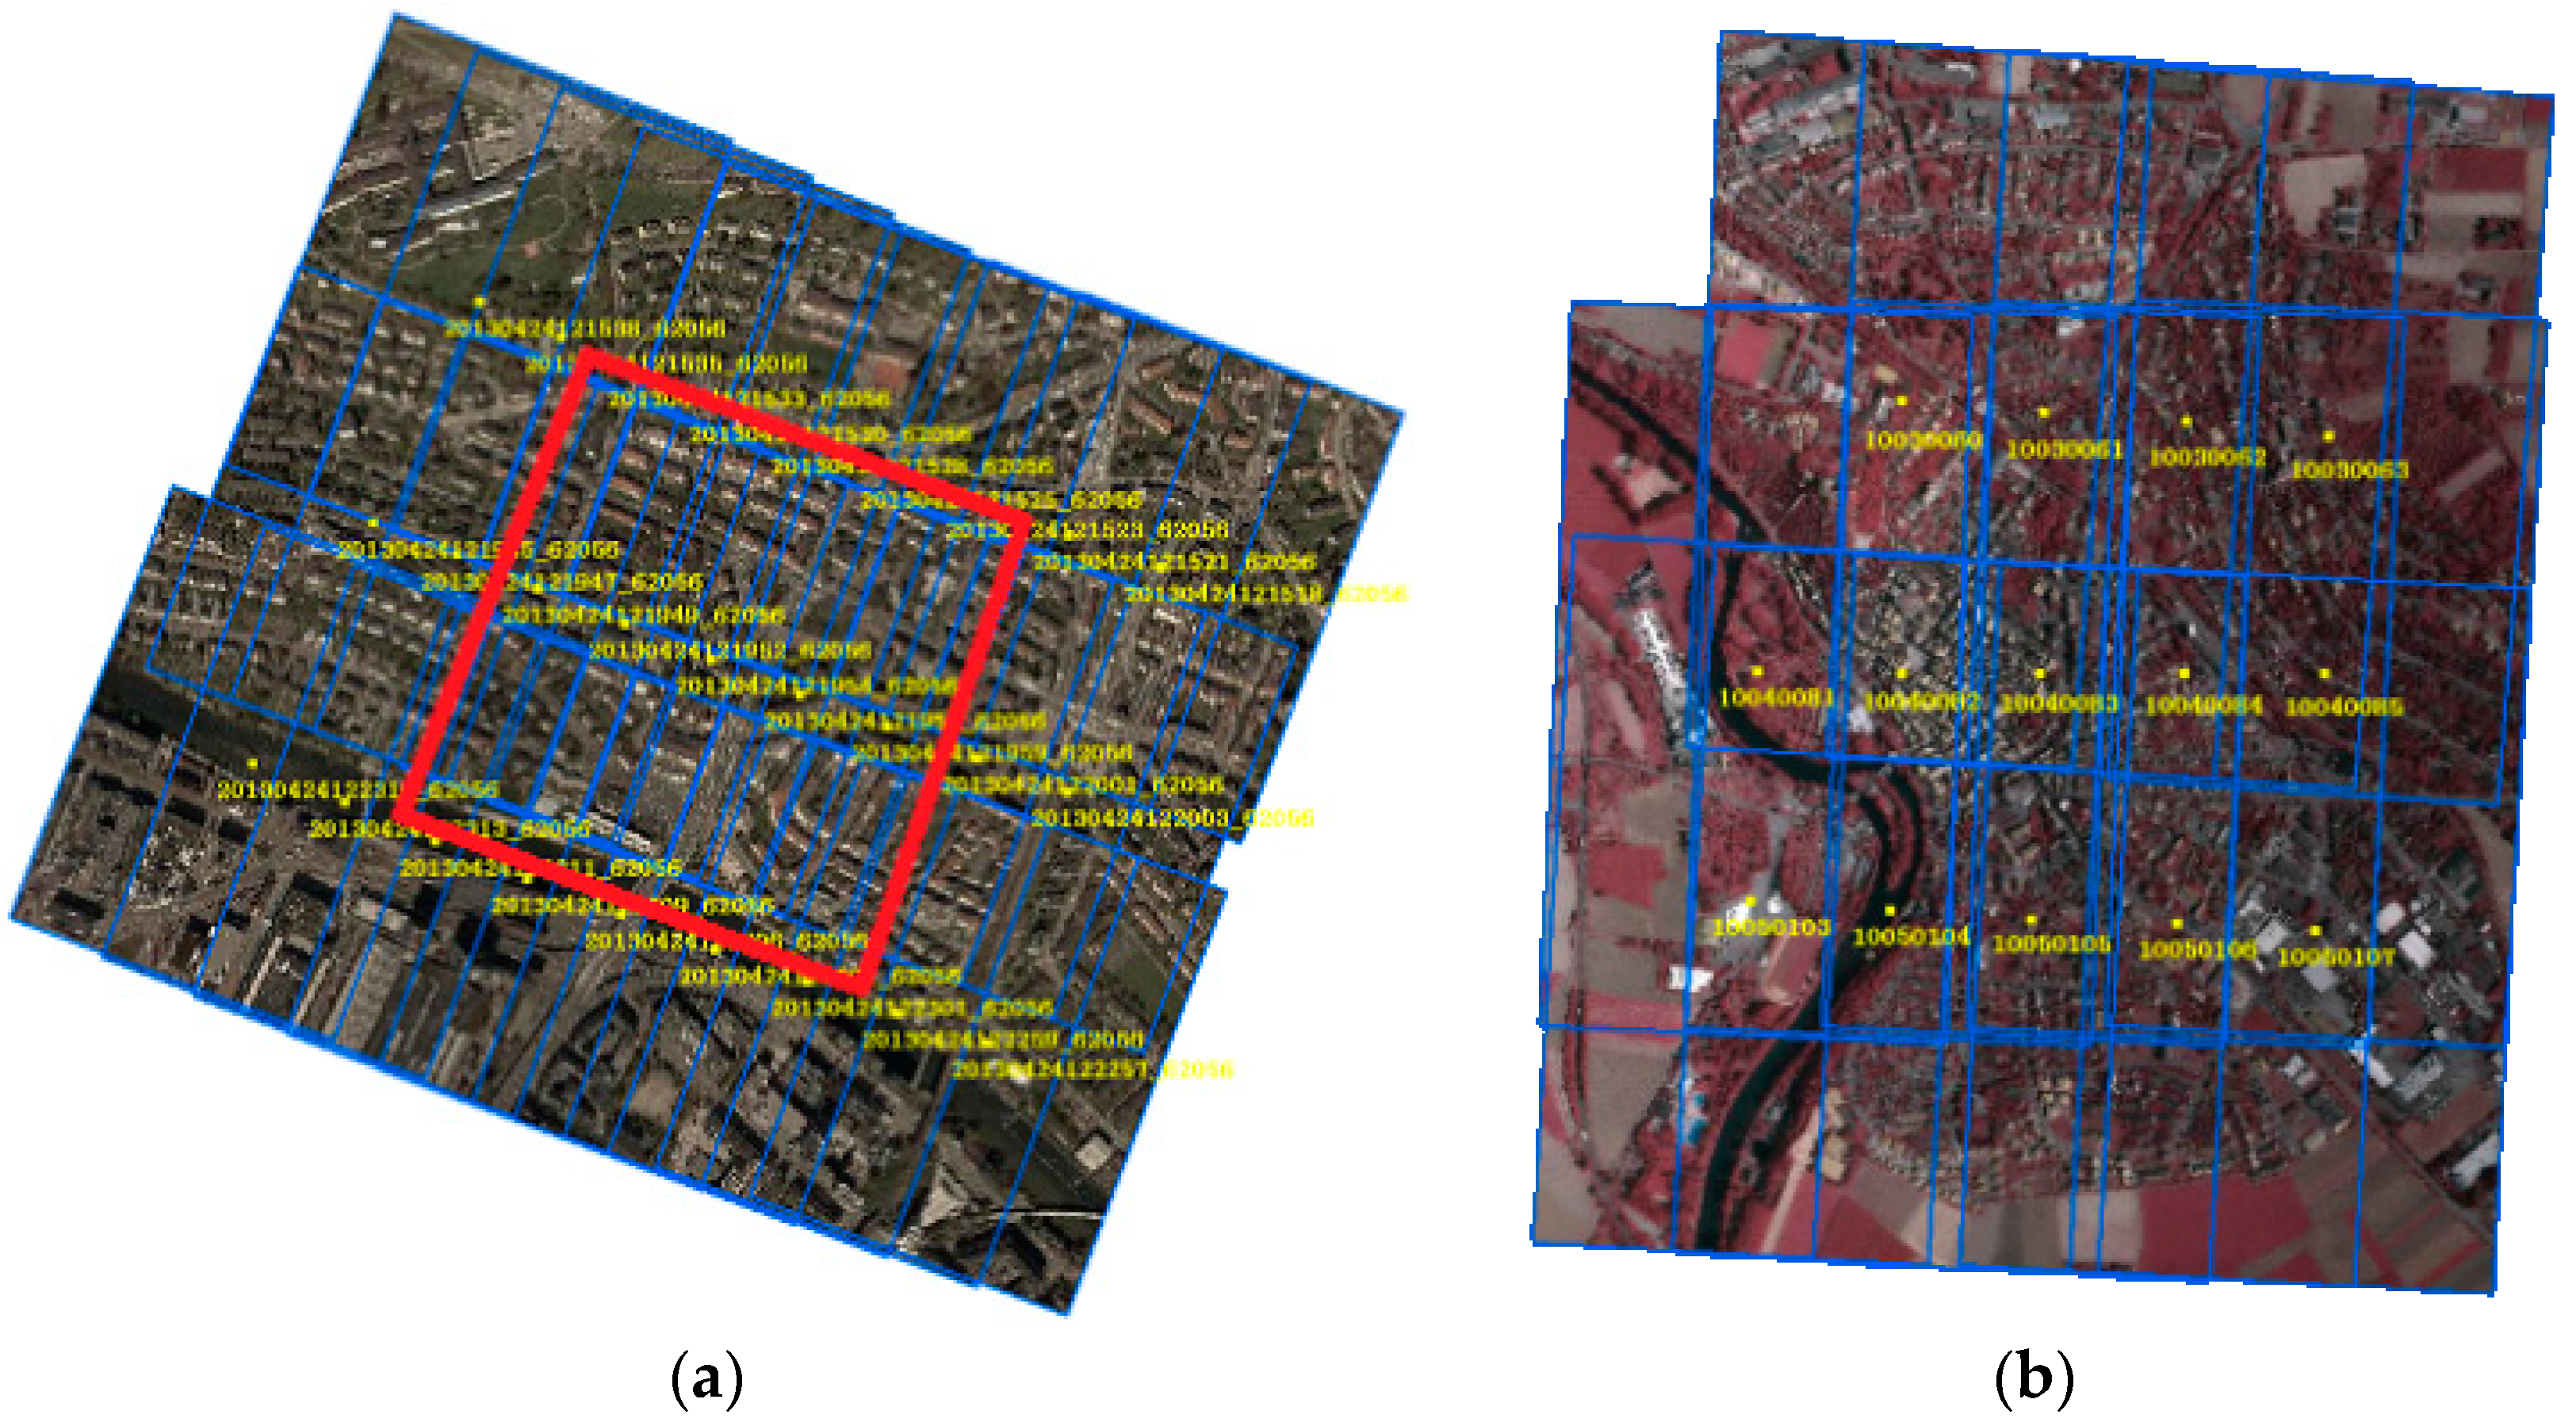
The aerial image dataset of Vaihingen and oblique nadir image block of Zürich from the ISPRS test project are used to verify the effectiveness and accuracy of the proposed method. Experimental results demonstrate the completeness, efficiency, and high precision of this algorithm as results at the sub pixel level can be achieved. To explore the most efficient approach for multi-view dense matching based on a graph network, three kinds of configurations were designed and tested. Considering the numbers of image pairs, runtime and accuracy, our comparative experiments confirm that the first configuration is superior to the other two configurations as adopted in the SURE and PhotoScan approaches. Extensive experiments show that the proposed method can derive results comparable to SURE and PhotoScan, with no ghosting and improves the accuracy of the final point cloud and can be extended to oblique photogrammetry. Furthermore, experiments verified the effectiveness of this strategy for multi-view point cloud fusion and difficult areas with sharp discontinuities, weak textures, or repeated textures can be matched by the proposed algorithm.
This research provides a good foundation for oblique multi-view dense matching; our future research will focus on further improvements to the efficiency and accuracy of the proposed algorithm. Given that random noise of final point cloud may still exist, we will attempt to exploit a post-processing process to refine the results to make it smoother.


