Article

Tropical Forests of Réunion Island Classified from Airborne Full-Waveform LiDAR Measurements

1
Laboratoire des Sciences du Climat et de l’Environnement (LSCE), Commissariat à l’Energie Atomique et aux énergies alternatives—Centre National de la Recherche Scientifique—Université de Versailles Saint-Quentin-en-Yvelines, 91191 Gif sur Yvette Cedex, France
2
Laboratoire de l’Atmosphère et Cyclones (LACy), Université de la Réunion, CNRS, Météo-France, 15 Avenue René Cassin, CS 92003, 97744 Saint-Denis Messag, France
3
UMR PVBMT, Peuplements Végétaux et Bioagresseurs en Milieu Tropical, Université de La Réunion, 15 Avenue R. Cassin, CS 92003, 97744 Saint-Denis Messag, France
4
UMR PVBMT, Peuplements Végétaux et Bioagresseurs en Milieu Tropical, Université de la Réunion, Pôle de Protection des Végétaux, 7, Chemin de l’IRAT, 97410 Saint Pierre, France
*
Author to whom correspondence should be addressed.
Remote Sens. 2016, 8(1), 43; https://doi.org/10.3390/rs8010043
Submission received: 3 December 2015 / Revised: 27 December 2015 / Accepted: 29 December 2015 / Published: 7 January 2016
(This article belongs to the Special Issue Remote Sensing of Vegetation Structure and Dynamics)

Abstract

:
From an unprecedented experiment using airborne measurements performed over the rich forests of Réunion Island, this paper aims to present a methodology for the classification of diverse tropical forest biomes as retrieved from vertical profiles measured using a full-waveform LiDAR. This objective is met through the retrieval of both the canopy height and the Leaf Area Index (LAI), obtained as an integral of the foliage profile. The campaign involved sites ranging from coastal to rain forest, including tropical montane cloud forest, as found on the Bélouve plateau. The mean values of estimated LAI retrieved from the apparent foliage profile are between ~5 and 8 m2/m2, and the mean canopy height values are ~15 m for both tropical montane cloud and rain forests. Good agreement is found between LiDAR- and MODIS-derived LAI for moderate LAI (~5 m2/m2), but the LAI retrieved from LiDAR is larger than MODIS on thick rain forest sites (~8 against ~6 m2/m2 from MODIS). Regarding the characterization of tropical forest biomes, we show that the rain and montane tropical forests can be well distinguished from planted forests by the use of the parameters directly retrieved from LiDAR measurements.

Graphical Abstract

1. Introduction

Tropical forest areas are difficult to monitor/to classify using either remote sensing or in situ approaches, because of their tremendous heterogeneity and complex structure. The fundamental challenge is thus to acquire information about the forest vegetation structure given the fact that forest vegetation limits the ability to acquire information. Forest horizontal patterns are accessible using passive multispectral sensors [1,2] and hyper-spectral sensors [3,4,5], but these sensors are not adequate to penetrate beyond the upper canopy layer [6]. Active remote sensing instruments, including LiDAR and radar, have more of a chance to peer through the forest canopy down to the ground level [7]. Radar yields volumetric scattering information in addition to surface scattering observations, but the retrieval of the vegetation vertical structure is not direct, unlike with LiDAR.
Ground-based LiDAR systems, either terrestrial or portable, can accurately estimate canopy structural parameters [8,9,10,11,12]; however, covering large areas with such systems is impractical. Airborne/spaceborne LiDAR technology has been used to rapidly describe forest structure over large areas; whereas the observations of optical remote sensing is often limited by cloud in tropical areas. Several airborne discrete return LiDAR datasets have been acquired over tropical forests and have been successfully used to derive structural characteristics, such as canopy height, canopy cover and aboveground biomass [13,14,15]. A full description of the forest vertical structure (including canopy top, tree crown base height and understory structures) has also been obtained by airborne full-waveform LiDAR, both with infrared wavelengths [16,17] and ultraviolet wavelengths [18,19]. Recently, the airborne demonstration instrument called the Laser Vegetation Imaging Sensor (LVIS) [20] has shown that a full-waveform infrared LiDAR with a large footprint can reliably extract the vertical structure and Leaf Area Index (LAI) of a tropical rainforest (Costa Rica [21]) as well as a mid-latitude forest (California [22]), even with a dense canopy cover. The LVIS team however acknowledges the need of a broader dataset on multiple tropical biomes to confirm these findings and compare the extracted features.
The overarching goal of this paper is to report on a methodology of classification using a full-waveform ultraviolet airborne LiDAR with a large footprint, of varied tropical forest types on Réunion Island, which is a rich diversity of tropical ecosystems listed as World Heritage by UNESCO. The classification, obtained using LiDAR-derived canopy height and LAI, has distinguished native forest from plantations/exotic forests. The study sites and data collection methods will be described in Section 2, where the main steps of LiDAR processing for forest studies and the sampling strategy will also be presented. The retrieved forest structural and ecological properties will be analyzed in Section 3, along with comparisons to ground-based census and spaceborne observations. The classification of tropical forest sites will be also presented in this section.

2. Materials and Methods
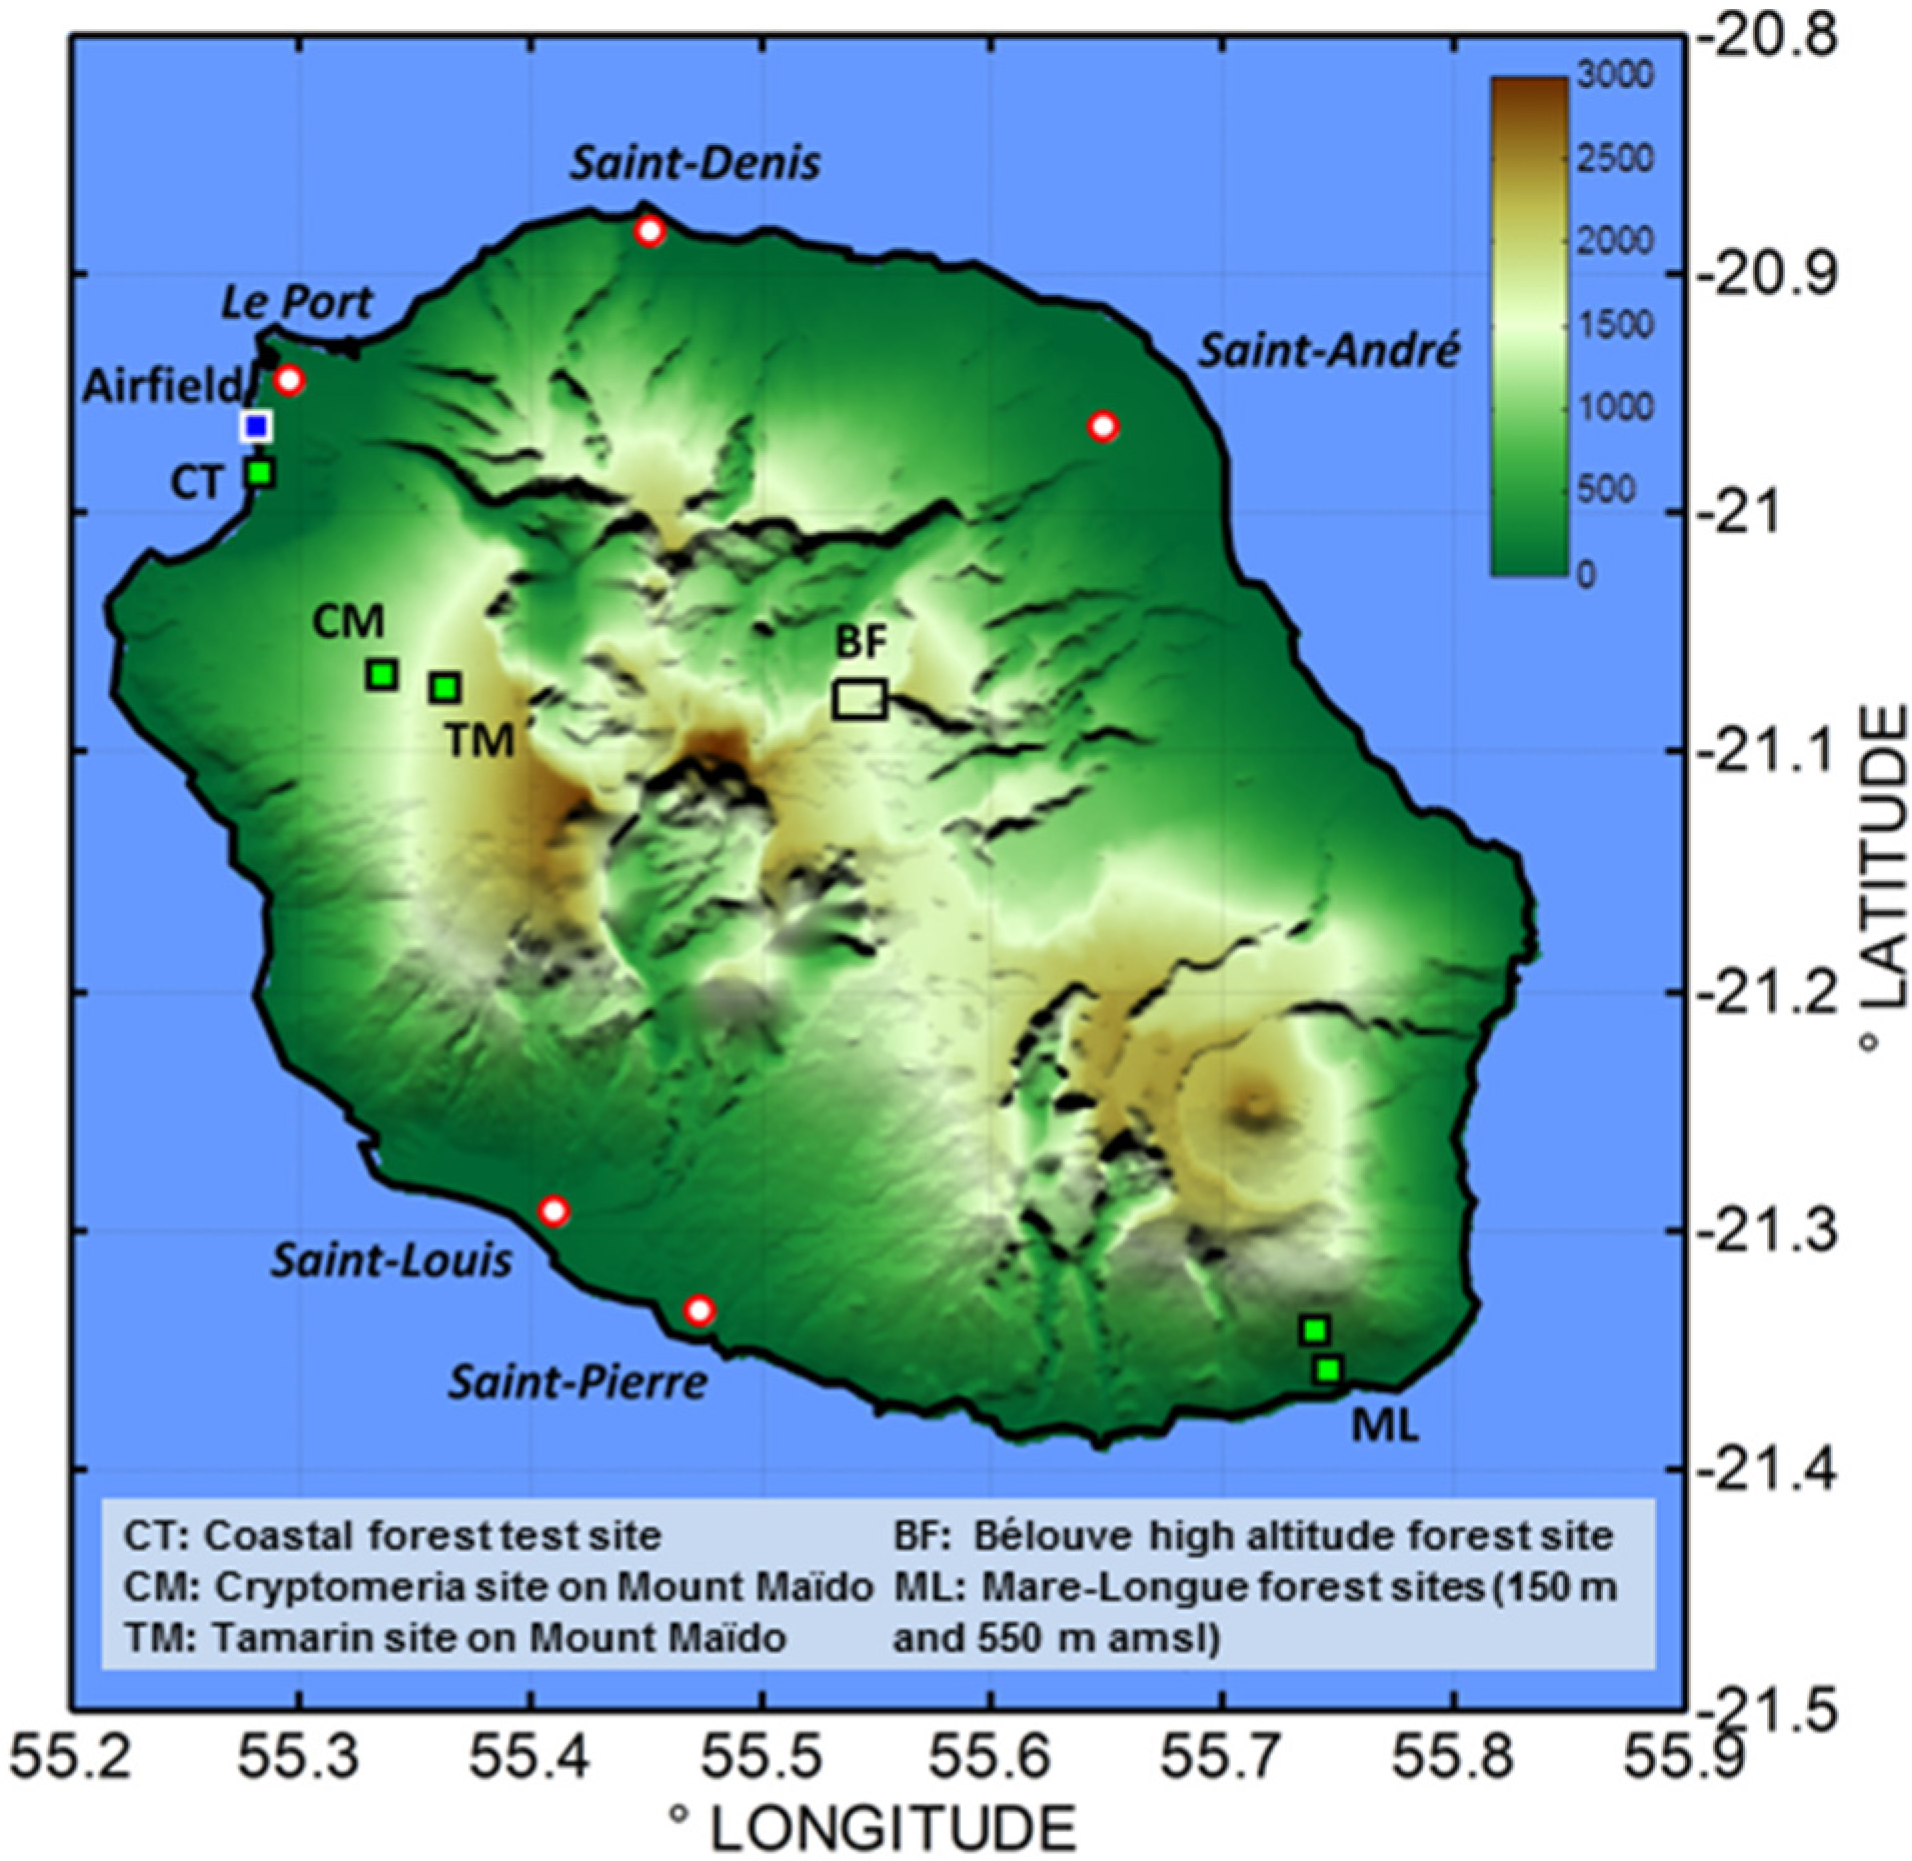
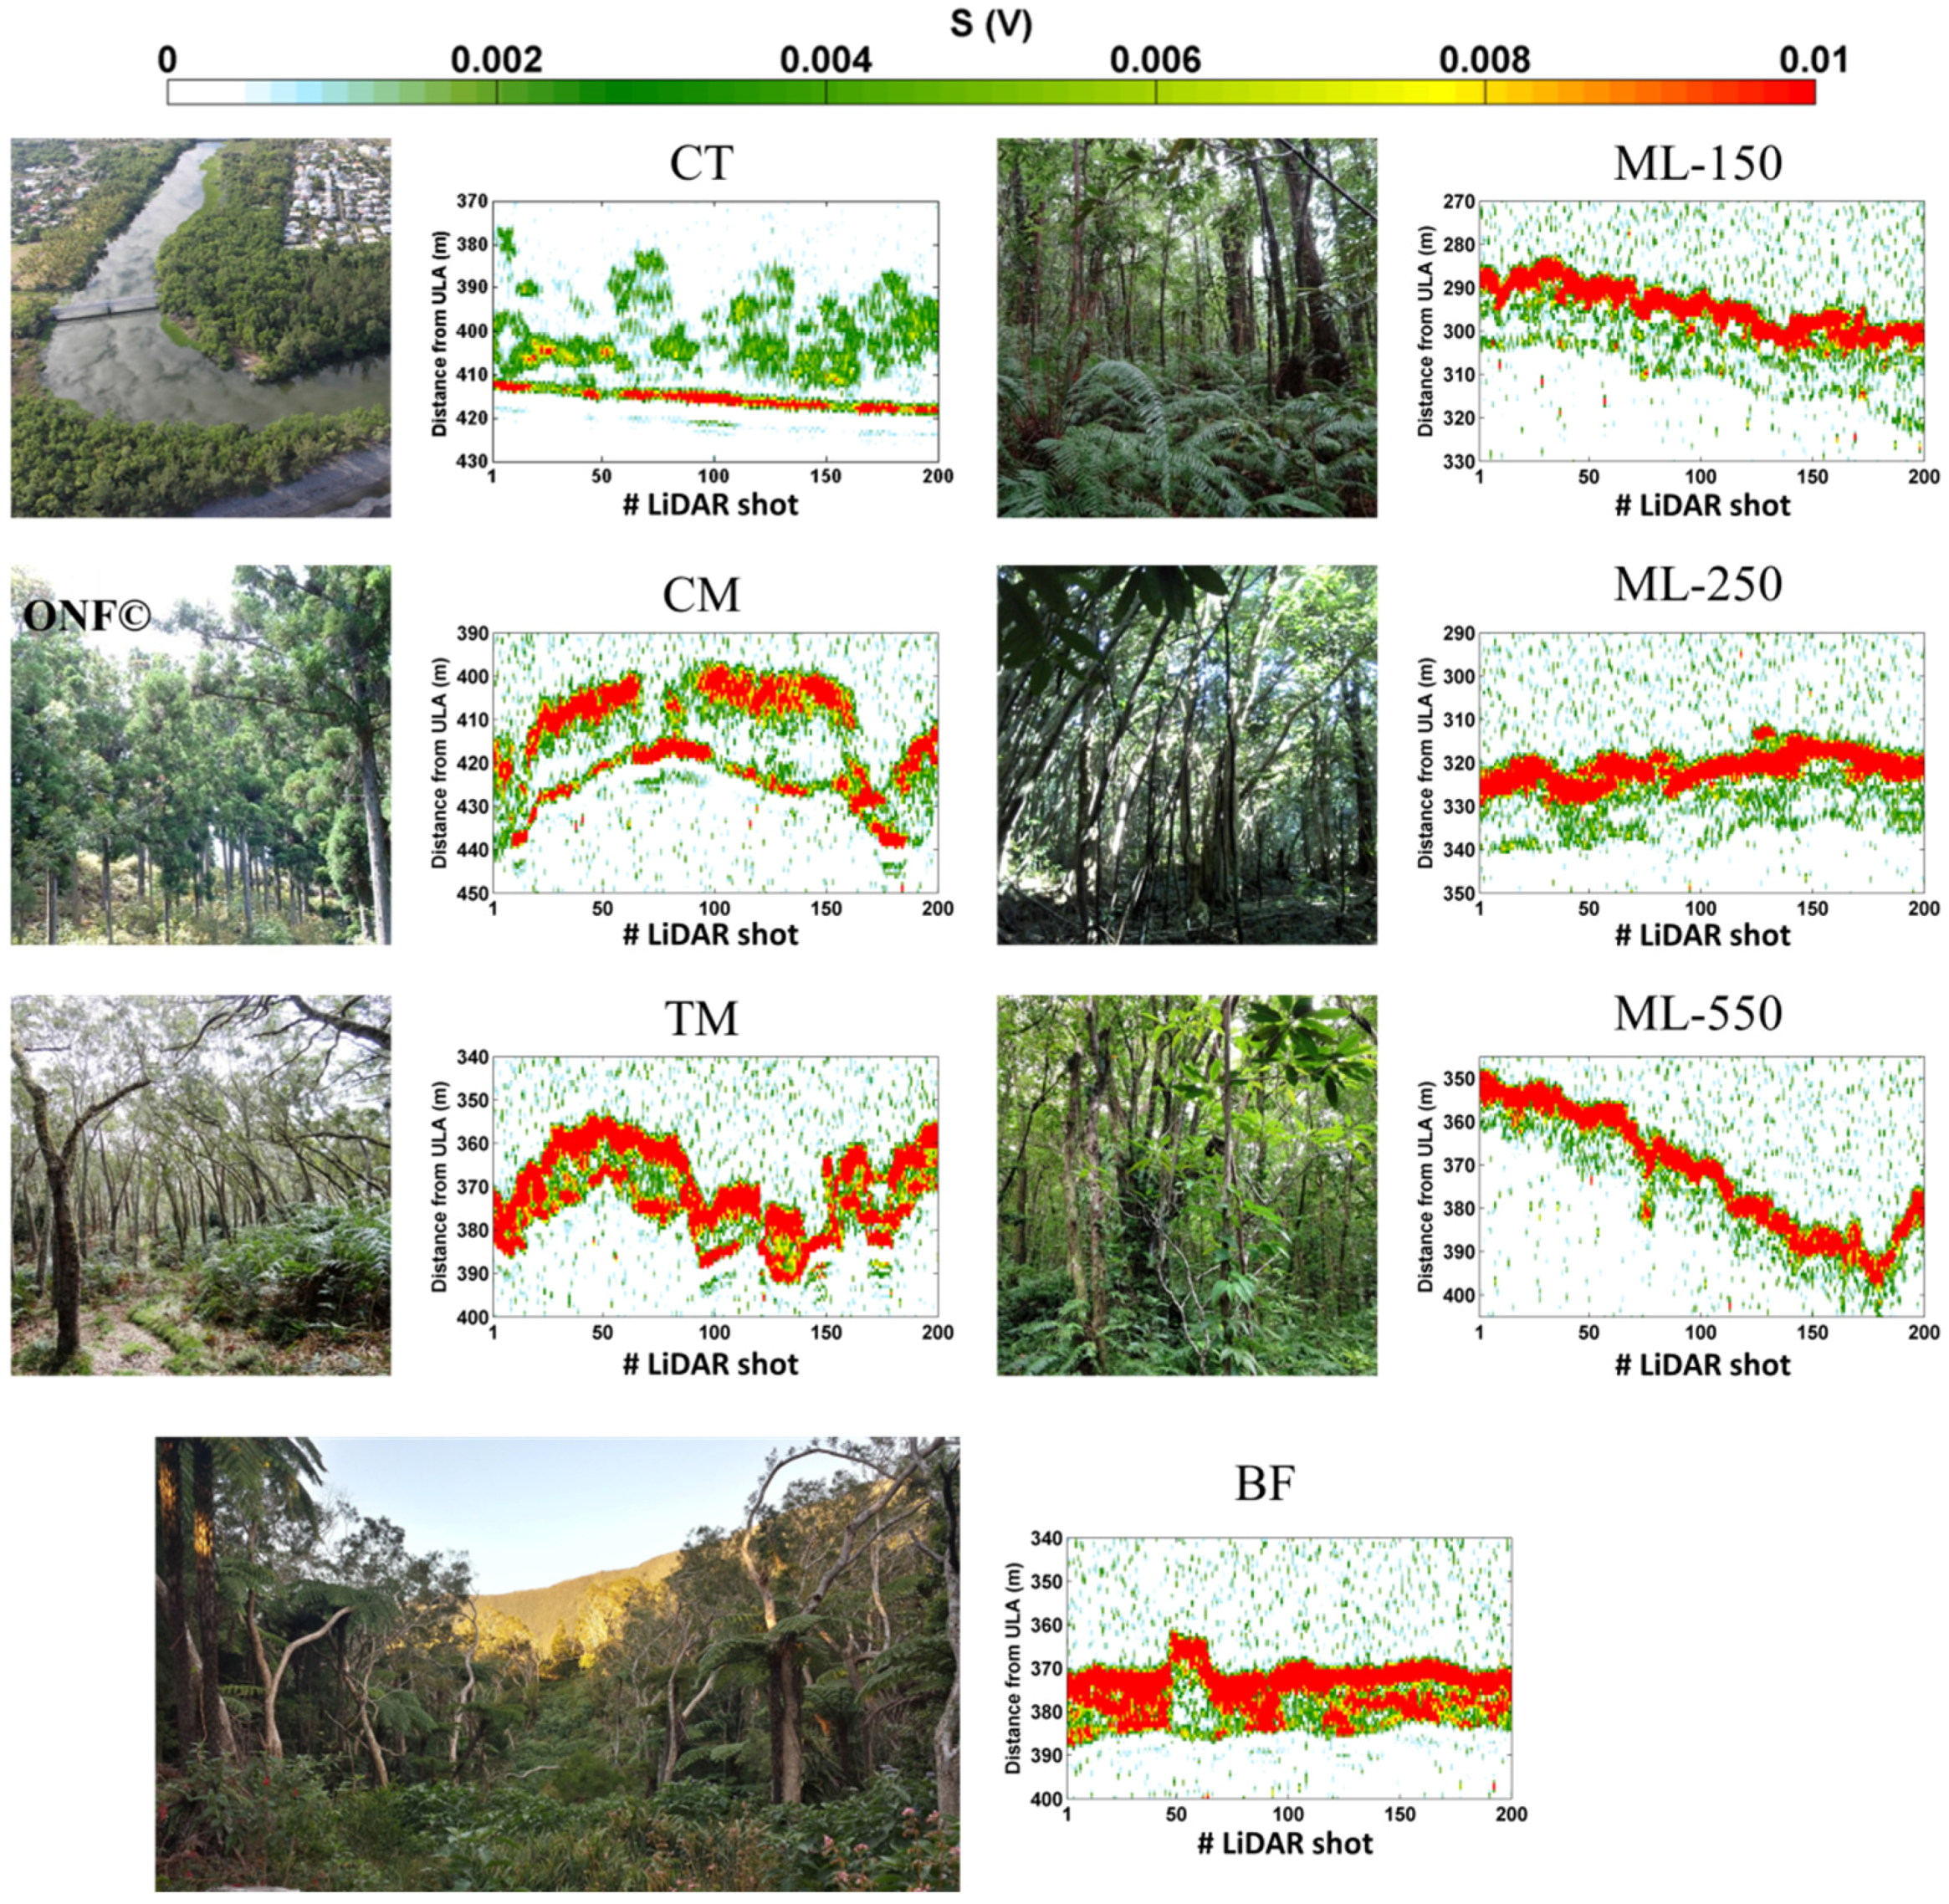
2.1. Study Sites

Réunion Island is a French overseas department located in the Indian Ocean (20°06’52”S, 55°31’57”E; Figure 1). It is a small (2512 km2) tropical volcanic island, which reaches 3070 m in altitude at its highest point (Piton des Neiges). In spite of the transformation of its habitats [23], the island still shelters 100,000 ha of native ecosystems (included in a national park) and is home to the last remnants of intact tropical forests in the Mascarenes archipelago (Réunion, Mauritius, Rodrigues).
Figure 1. Location of the study sites and topography of Réunion Island.
Remotesensing 08 00043 g001
Seven plots on Réunion Island were used for forest sampling in our study (Figure 1; Table 1). The coastal test site (CT) has only exotic vegetation. The Cryptomeria (CM) and Tamarind (TM) plots, located on Mount Maïdo, and the Bélouve (BF) site, located on a central plateau, are tropical montane cloud forests, which in particular still cover large areas of Réunion Island (60,000 ha), extending from 800 to 1900 m above mean-sea-level (amsl) on the windward side and from 1100 to 2000 m amsl on the leeward side of the island. This dense forest within cultivated forests on moderate slopes is very similar to Acacia koa forests in Hawaii. The CM is a monoculture of Cryptomeria japonica, an introduced species in the Taxodiaceae family. These trees commonly reach 20 to 25 m in height on the site; they produce a dense canopy, under which light is very scarce. Most acacia stands, like the TM site, are composed of secondary forest and display a monospecific acacia (highland tamarind) canopy with shrubby vegetation in the understory, of which the structure can vary with the intensity of human activities (stock farming in particular). The Mare-Longue sites (three plots dubbed ML-150, -250 and -550, according to their altitude) are located in the National Park of Réunion Island in the former Mare-Longue nature reserve, which shelters the last remnant of lowland tropical rainforest in the Mascarene Islands with around 4000 mm of yearly rainfall. This lowland forest grows on a non-altered basaltic pahoehoe lava flow dated between four and six centuries old [24]. This forest displays the greatest tree species diversity on Réunion Island with an average richness of 40 tree species per hectare [25]. Whereas average tree height remains very low (15 to 20 m), the stem density exceeds 1000 trees/ha (diameter at breast height >10 cm). The most abundant tree species in the sampled plots is Labourdonnaisia calophylloides (Sapotaceae), endemic from the Mascarene Islands.
Table 1. Main characteristics of the study sites and associated available LiDAR profiles.
Forest SitesAltitude (m·amsl 1)Dominant Tree SpeciesSub-PlotLiDAR CoverLaser ShotsGround Slope > 30°
Exotic VegetationCoastal forest (CT)10Only exotic vegetation-22 ha20460.06%
Tropical Montane Cloud ForestsCryptomeria (CM)1230Cryptomeria japonica40 m × 40 m10 ha964622.6%
Tamarind (TM)1750Acacia heterophylla40 m × 40 m10 ha14,73812%
Bélouve (BF)1600Acacia heterophylla-400 ha48,4107%
Tropical Lowland RainforestMare-Longue (ML)ML-150150Labourdonnaisia calophylloides50 m × 100 m2.8 ha98082%
ML-25025050 m × 50 m1.4 ha15520.2%
ML-550550-0.7 ha66716%
1 amsl: above mean-sea-level.

2.2. Data Collection

The following estimation of forest parameters on Réunion Island was performed in May 2014, combining mainly airborne LiDAR measurements with in situ approaches.

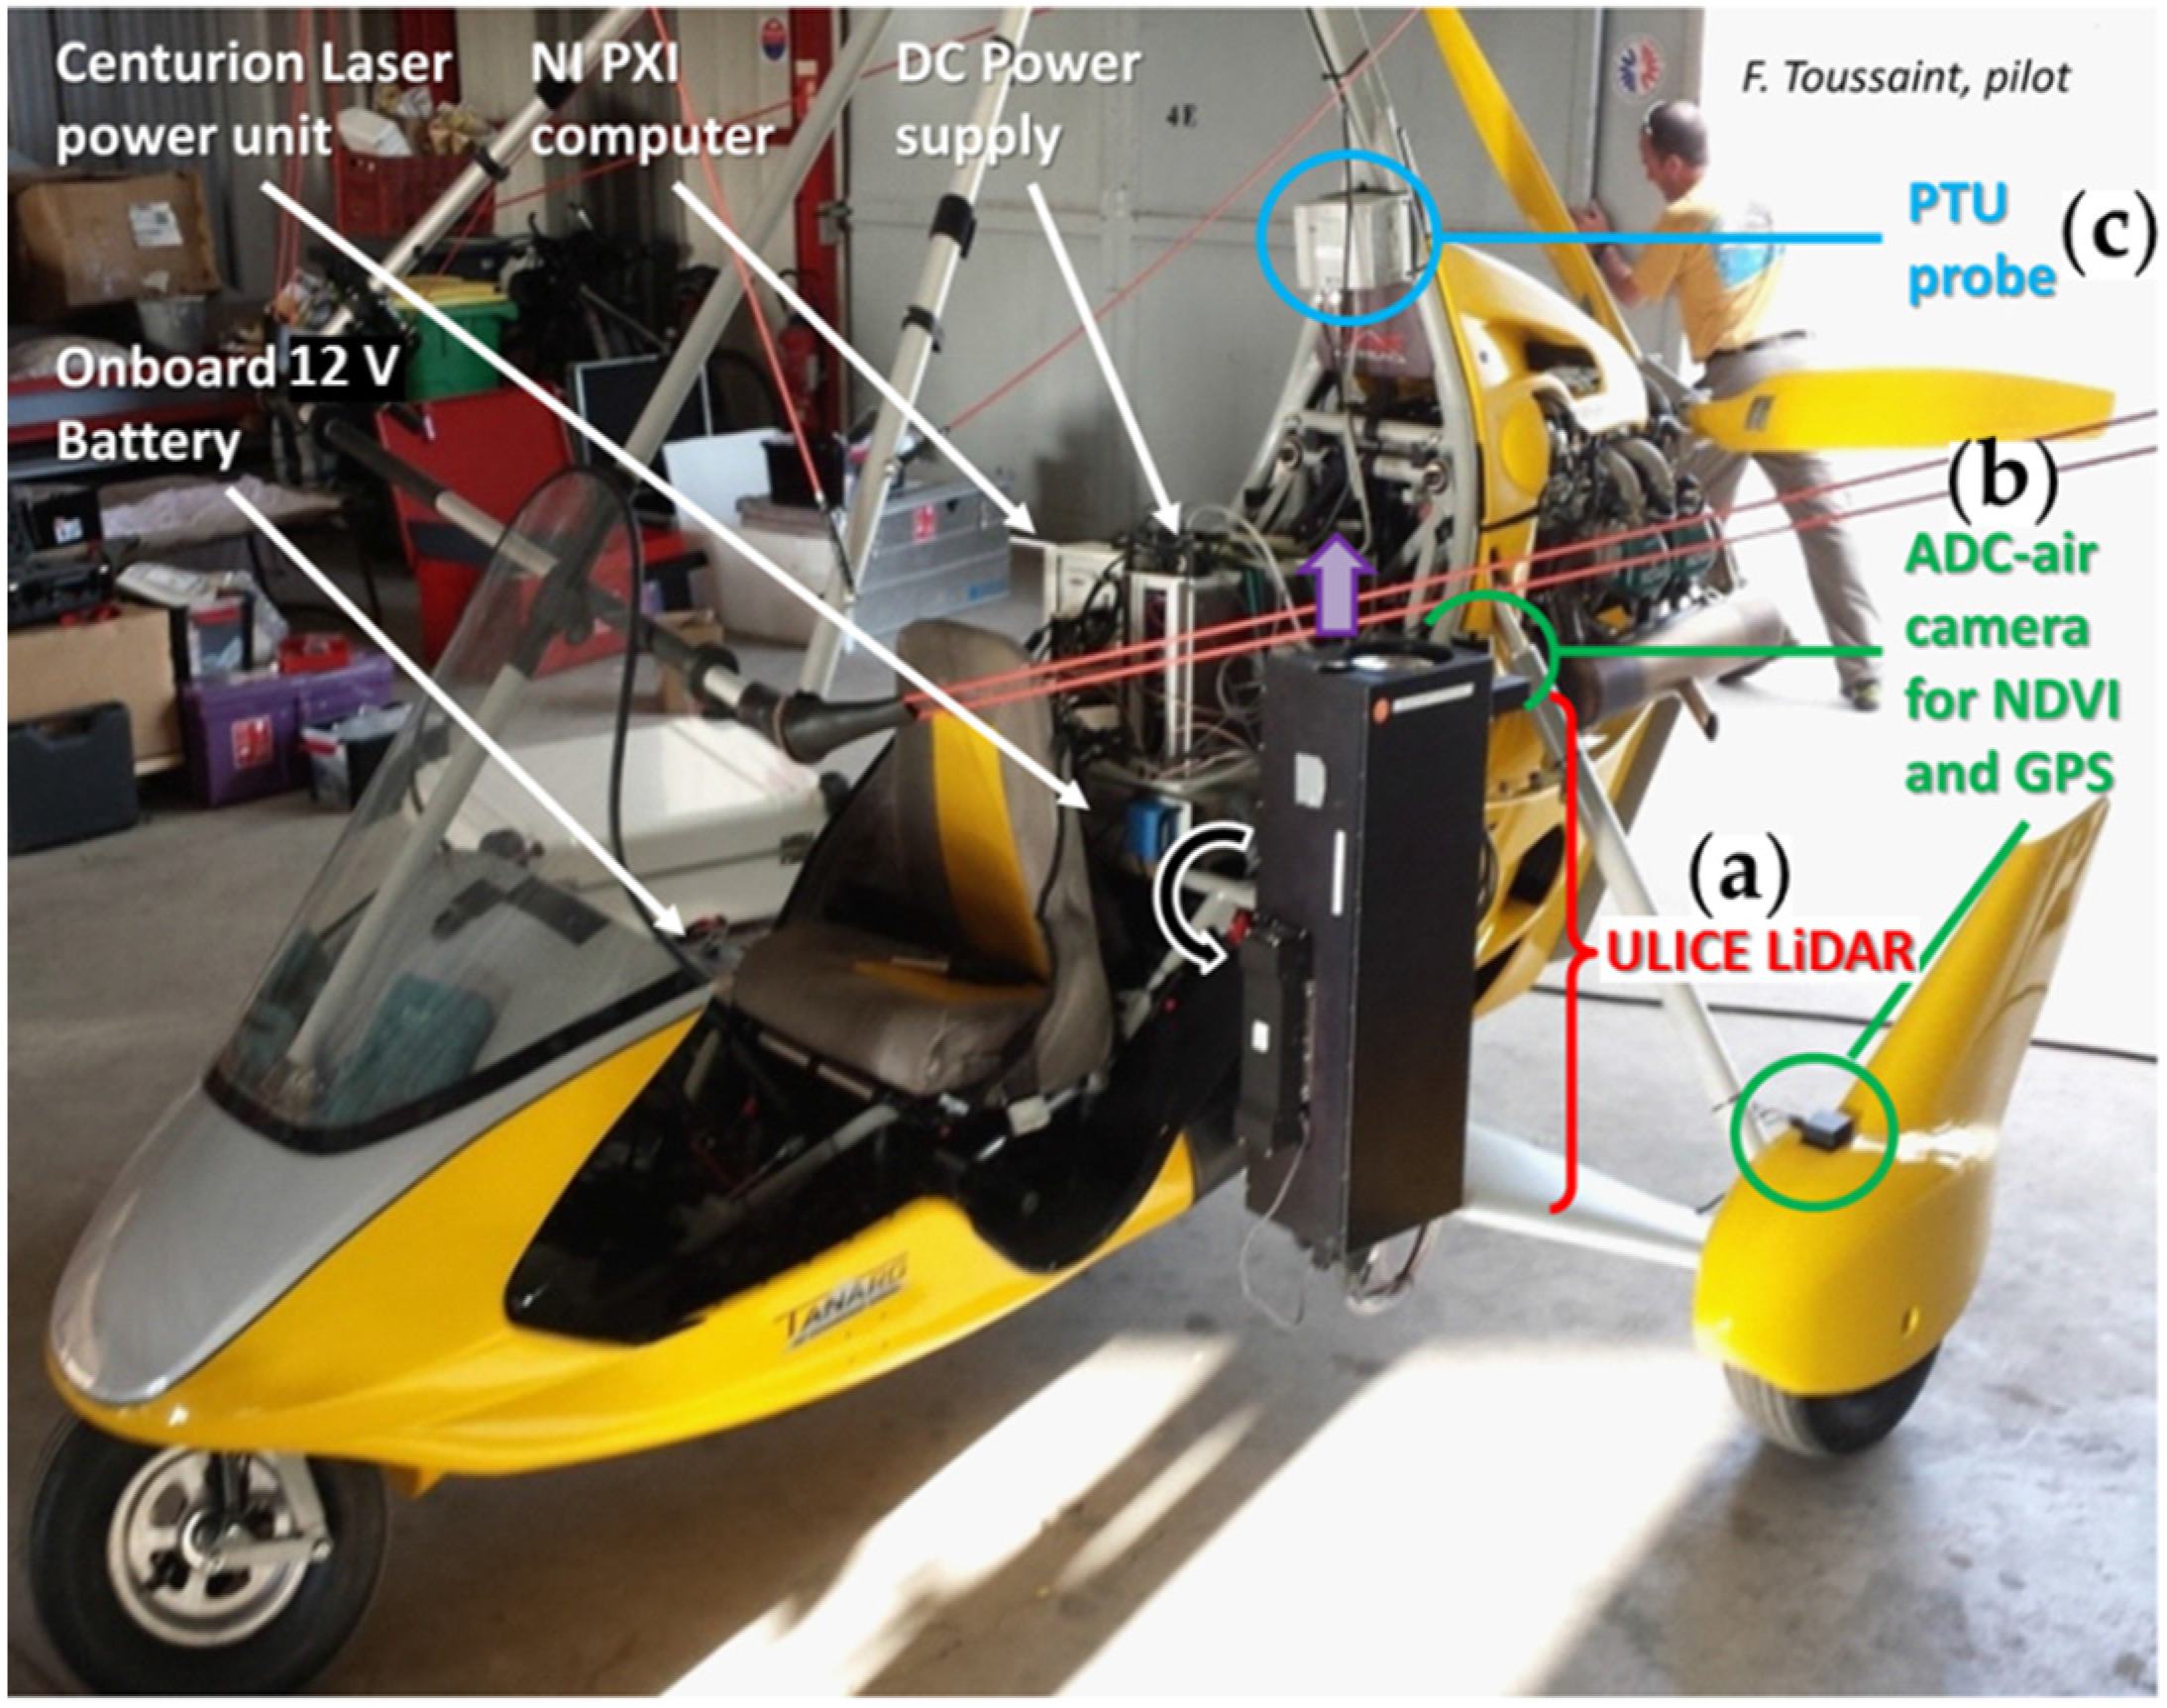
2.2.1. Airborne LiDAR and Instrumentation

The LiDAR system used during the campaign is the Ultraviolet LiDAR for Canopy Experiment (ULICE; [19]) developed at Laboratoire des Sciences du Climat et de l’Environnement (LSCE) with the support of CNES (Centre National d’Etudes Spatiales). It was integrated into an autonomous payload flown on an ultra-light aircraft (ULA) shown in Figure 2. The ULICE system characteristics and the airborne payload are given in Table 2. The ultraviolet domain is well suited both for eye safety at low carrier altitude and for precise retrievals over dense forests with little distortion due to multiple scattering (Shang and Chazette, 2014). As recommended by several authors [20,26,27,28,29], a large LiDAR footprint is preferred so that the laser can better penetrate the dense tropical forests. Shang and Chazette [26] estimated an optimal laser footprint diameter around 20 m for dense forests, whereas Riaño et al. [30] found that the Leaf Area Index (LAI) was better estimated using laser footprints between 7.5 and 12.5 m. The ULICE system was thus modified to obtain a large and controllable sounding area on the ground (approximately a 1-m to 10-m footprint diameter for a flight altitude of ~350 m above the ground level (agl)). The effect of LiDAR footprint size will be studied in Section 2.4.
Figure 2. Autonomous payload (~80 kg) implemented on an ultra-light aircraft, including (a) the Ultraviolet LiDAR for Canopy Experiment (ULICE). The other instruments are also onboard: (b) a Tetracam ADC (Agricultural Digital Camera) air camera is used to get the photosynthesis activity index (Normalized Difference Vegetation Index (NDVI)) images over the forest canopy; the ancillary positioning instrument, called the MTi-G system, consists of a Global Positioning System (5-m accuracy) and an inclinometer (0.7° accuracy); (c) a Vaisala PTU-300 pressure/temperature/relative humidity probe is used for altitude correction and control of the tropical high humidity conditions that could affect the transmittance of LiDAR optics.
Remotesensing 08 00043 g002
Table 2. Summary of the ULICE characteristics.
ULICE Characteristics
Emitter (laser)Quantel Centurion, diode-pumped, air-cooled, 6 mJ, 8 ns, 100 Hz, 354.7 nm
Output beamEyesafe ~40 × 30-mm beam, tunable 0 to 40 mrad divergence with Altechna MoTex Expander (at 1/e²)
Receiver2 channels with different optical densities (OD)
TelescopeRefractive, 150-mm diameter, 280-mm effective focal length
FilteringNo spatial filtering, wideband Thorlabs 355 nm ± 5 nm interference filters for large angular acceptancy (36 mrad)
Field of view33 mrad for Channel #0, 26 mrad for Channel #1
DetectionHamamatsu H10721 photo-multiplier tubes. Channel #0: 3.0 OD; Channel #1: 4.0 OD
Data acquisition12 bits, 200-MHz sampling, 2-channel NI-5124 digitizer, 33-Hz actual profile frequency
Sounding areaTunable up to ~30 mrad on Channel #0, <22 mrad on Channel #1 (at 1/e²)
An ancillary positioning instrument (inclinometer and GPS), an MTi-G system by XSense, is also onboard the ULA. It provides the horizontal geolocation of the ULA with 5-m accuracy and the direction of the laser beam with 0.7° accuracy (i.e., 3.6 m at the ground for a flight altitude of 300 m·agl).With such uncertainties, the study performed at Réunion Island should be statistical, because we cannot distinguish one tree from another. A Tetracam ADC (Agricultural Digital Camera) air camera is also onboard to map the photosynthesis activity index (Normalized Difference Vegetation Index (NDVI)) over the forest canopy to check the scene heterogeneity. However, its images showed high NDVI (>0.65) over all of the observed sites, making it rather irrelevant for the validation of other ecological parameters, such as LAI [31].

2.2.2. Field Data Collection

During two months around the airborne measurements, four representative sub-plots of ~0.2 ha were set up in four forest sites (CM, TM, ML-150 and ML-250 sites, as shown in Table 1), where in situ measurements were performed. Within each sub-plot, all trees with diameter at breast height (DBH) >7 cm were identified. The tree top height (TTH) and the DBH were measured using a dendrometer and forestry measuring tapes, respectively. For trees with multiple stems, each significant stem was recorded individually. The uncertainties on the TTH from in situ measurements in a dense tropical forest have been evaluated during the experiment in the order of ±4 m (several measurements on the same tree with different operators with a dendrometer). This is due to the difficulty in identifying the tree top among other branch extremities.

2.2.3. Other Data Collections

Digital terrain models (DTM) of 500-m or 5-m resolution for the whole Réunion Island were provided by the Parc National de la Réunion (J.-C. Notter, personal communication). The topography of Réunion Island is given in Figure 1, using the DTM-500 m. The slope of each sampled site was evaluated using the DTM-5 m.
MODIS (Moderate Resolution Imaging Spectroradiometer) Level 3 land products were compared with LiDAR observations. The 8-day LAI products derived from MODIS onboard Terra and Aqua are considered [31]. On 8-day syntheses from May to August 2014, LAI values retrieved on 1-km pixels were averaged after screening for cloud contamination (i.e., values below the median were removed).

2.3. LiDAR Data Processing

From airborne LiDAR measurements, the forest structural and optical parameters are estimated; they are in turn used to evaluate ecological parameters, such as LAI. In this study, three key parameters are estimated from the LiDAR backscatter profiles to characterize the sampled forest sites: the canopy height (CH), the vertical profile of apparent foliage (Fapp), which informs both the canopy density and the vertical distribution of leaf biomass along the profile, and the LAI, which is linked to the integral of the latter parameter.

2.3.1. Forest Structural Parameter: Canopy Height

The canopy height (CH) parameter is assessed from the full-waveform LiDAR profile using the threshold approach documented in Chazette et al. [32] and applied to forest detection by Cuesta et al. [18] and Shang and Chazette [19]. CH is estimated as the distance between the first return, at the upper surface of the vegetation, and the last return, which is normally the ground echo. For dense forests, the laser beam cannot always penetrate the leaves and reach the ground, so the last return of the backscattered LiDAR signal is not necessarily the ground echo. Nevertheless, as frequent measurements were performed (33 Hz), allowing some overlap, the ground level can be correctly located thanks to time-integrating signal processing in almost all cases and be the reference to estimate the CH. An example is given in Figure 3. Note that a parasitic echo (undershot) can be observed beneath the ground echo, which is due to the rebounding, non-linear response of the detector to the strong pulse returned by the ground. The standard deviation of LiDAR-derived CH was assessed to be ~1.5 m when only considering measurement noise and signal processing errors. Shang and Chazette [26] assessed that LiDAR signal distortion due to the surface slope can lead to a relative CH uncertainty of ~5% for a slope of 30° (see Table 1) and a 10-m footprint, as is the case in our present study. As a result, the standard deviation of our LiDAR-derived CH should be of the order of ~2 m. We do not consider geolocation errors in this statistical study.
Figure 3. Example of ground echo and canopy top detection from a range-corrected LiDAR signal explained in arbitrary units (a.u.) for a section of flight over the tropical forest of Bélouve (BF). The difference between the ranges of these two points yields the canopy height (CH). Note that the y-axis is not the ground elevation, but the distance from the emitter. ULA, ultra-light aircraft.
Remotesensing 08 00043 g003

2.3.2. Forest Optical Parameters

The range-corrected backscattered airborne LiDAR signal Sv [33,34], taken at a height above ground level (agl) h inside the forest cover, can be expressed by the LiDAR equation [35]:
S v ( h ) = K × T a 2 × B E R × α c a n o p y ( h ) × exp ( F O T ( h ) )
where K is the instrumental constant and Ta is the atmospheric transmission. The backscatter to extinction ratio BER is a classical parameter used in LiDAR analyses [26,36], which characterizes the probability that an intercepted photon would be backscattered by a scattering layer; it is assumed to be constant for all canopy levels in this study. The canopy extinction coefficient αcanopy (h) is defined as the sum of the absorption and scattering coefficients in the canopy. The forest optical thickness (FOT) is defined only in the forest layer between the considered height (h) and the canopy height (CH) and is given by:
F O T ( h ) = h C H α c a n o p y ( h ) · d h
Following the method proposed by Ni-Meister et al. [37], we define the transmittance height profile (THP) by taking a ratio of the energy from canopy returns to the total energy, which characterizes the amount of skylight intercepted by vegetation at a given level [38]:
T H P ( h ) = R v ( h ) R v ( 0 )   ×   ε
with:
ε = 1 1 + ρ v ρ g · R g R v ( 0 )
where ρv and ρg are the canopy and ground reflectance, respectively. The integrated range-corrected canopy return Rv(h) (respectively ground return Rg) is defined as the integral of the LiDAR signal from the canopy top CH to height level h (respectively in the equivalent width of the ground echo ∆hGE, ΔhGE ~4 m):
{ R v ( h ) = h C H S v ( h ) · d h = K · T a 2 · B E R · [ 1 e x p ( F O T ( h ) ) ]   R g ( h ) = h G E 2 + h G E 2 S g ( h ) · d h = K · T a 2 · exp ( F O T ( 0 ) ) · ρ g π · h G E · h G E 2 + h G E 2 g ( h ) · d h
where the normalized ground echo g(h) is modelled as a Gaussian function [39] and can be calibrated by using the returned laser pulse at nadir over a flat surface.
Thus, as BER is equal to ρ v π , THP can be expressed as a function of FOT:
T H P ( h ) = 1 exp ( F O T ( h ) )
The ε parameter is usually estimated using a known ratio of canopy and ground reflectance, which was estimated around 2.5 [21] or 2 [38,40] at a 1064 nm wavelength. However, the reflectance values are not available in our study area. Nevertheless, the reflectance ratio can be estimated using only LiDAR measurements as follows. Assuming FOT(0) >> 1 (i.e., ε 1 ), which is realistic for thick tropical forests, as highlighted by Shang and Chazette [26], an initial FOT estimator can be evaluated from Equations (3) to (6), and is given for h > 0 by:
F O T i ( h ) ˜ l n ( 1 R v ( h ) R v ( 0 ) )
This leads to a second assessment:
F O T ( h ) ˜ = l n ( 1 ε · R v ( h ) R v ( 0 ) )
which is made after a correction of the first order using the ε parameter explained as:
ε = 1 e x p ( F O T ( h 0 ) ˜ )
with h0 chosen inside the undergrowth layer of the forest (2 to 3 m above the ground level).
Meanwhile, the reflectance ratio (ρvg) can be determined using the LiDAR signal by:
ρ v ρ g R v ( 0 )   R g · e x p ( F O T ( h 0 ) ˜ ) 1 e x p ( F O T ( h 0 ) ˜ )
A final estimate is obtained after correcting for bias towards high values, which can be assessed very reliably using a simulator of the LiDAR measurements taking inversed profiles for each sampling site as an input. Such an algorithm converges within a relative uncertainty of ~20% after corrections of the bias.
This iterative approach was chosen as an alternative to the one based on ground echo normalization of forest transmittance as proposed by Ni-Meister et al. [37]. The reliance of the latter on an accurate estimate of the ground to vegetation reflectance ratio is incompatible with the very diverse and variable forest grounds found at Réunion Island (leaves and debris, soil, lava) and leads to important errors on the retrieved ecological parameters. This inversion process has been applied to each suitable LiDAR profile acquired during the flights above the tropical forests of Réunion Island, in order to characterize the various tropical forest sites.

2.3.3. Forest Ecological Parameters

Several studies have shown that LiDAR is a powerful instrument to retrieve the LAI [41,42]. The LAI can be derived from LiDAR measurements by (e.g., [21]):
L A I ( h ) = C × h C H F a p p ( z ) G · d z
with the “apparent foliage profile” (Fapp), which can be identified as the vertical profile of vertical projections of foliage elements, defined by the following equation as in Ni-Meister et al. [37]:
  F a p p ( h ) = d ln ( 1 ε · R v ( h ) R v ( 0 ) ) d h
Comparing Equations (2) and (8), we find that the Fapp is actually the canopy extinction coefficient αcanopy in the classical LiDAR equation. We will use Fapp in the following.
All of this mathematical development can be used whatever the wavelength, but for visible or infrared wavelengths, it may be necessary to consider the multiple scattering effect due to leaves and branches [26]. The multiple scattering enhances the backscatter LiDAR signal and makes the LiDAR signal distorted. It can be taken into account by using a multiple scattering parameter as in Platt [43], Berthier et al. [44] and Shang and Chazette [26].
The LAI is an integration of Fapp. The random orientation of foliage [37] is introduced as G = 0.5. Clumping coefficient C has been assessed by Chen et al. [45] around 1.58 using the bidirectional reflectances derived from the Polarization and Directionality of the Earth Reflectance (POLDER, [46]) instrument onboard the Advanced Earth Observing Satellite (ADEOS), as well as by He et al. [47] using the MODIS BRDF (Bidirectional Reflectance Distribution Function) product, yielding C = 1.54 ± 0.05 over most tropical forests and on Réunion Island. Note that this clumping coefficient is the reciprocal of the clumping index defined as the ratio of the effective LAI and the true LAI in some literature [45,47]. The LAI here calculated is a crude estimate of the true LAI, because it takes into account the contributions of branches and trunks. Tang et al. [21] considered that the majority of the backscattered energy measured (93%) was due to leaves, whereas only 7% came from the rest of the tree. Nevertheless, such a value is not justified in their article, and we do not have the capacity to verify it in the current study.

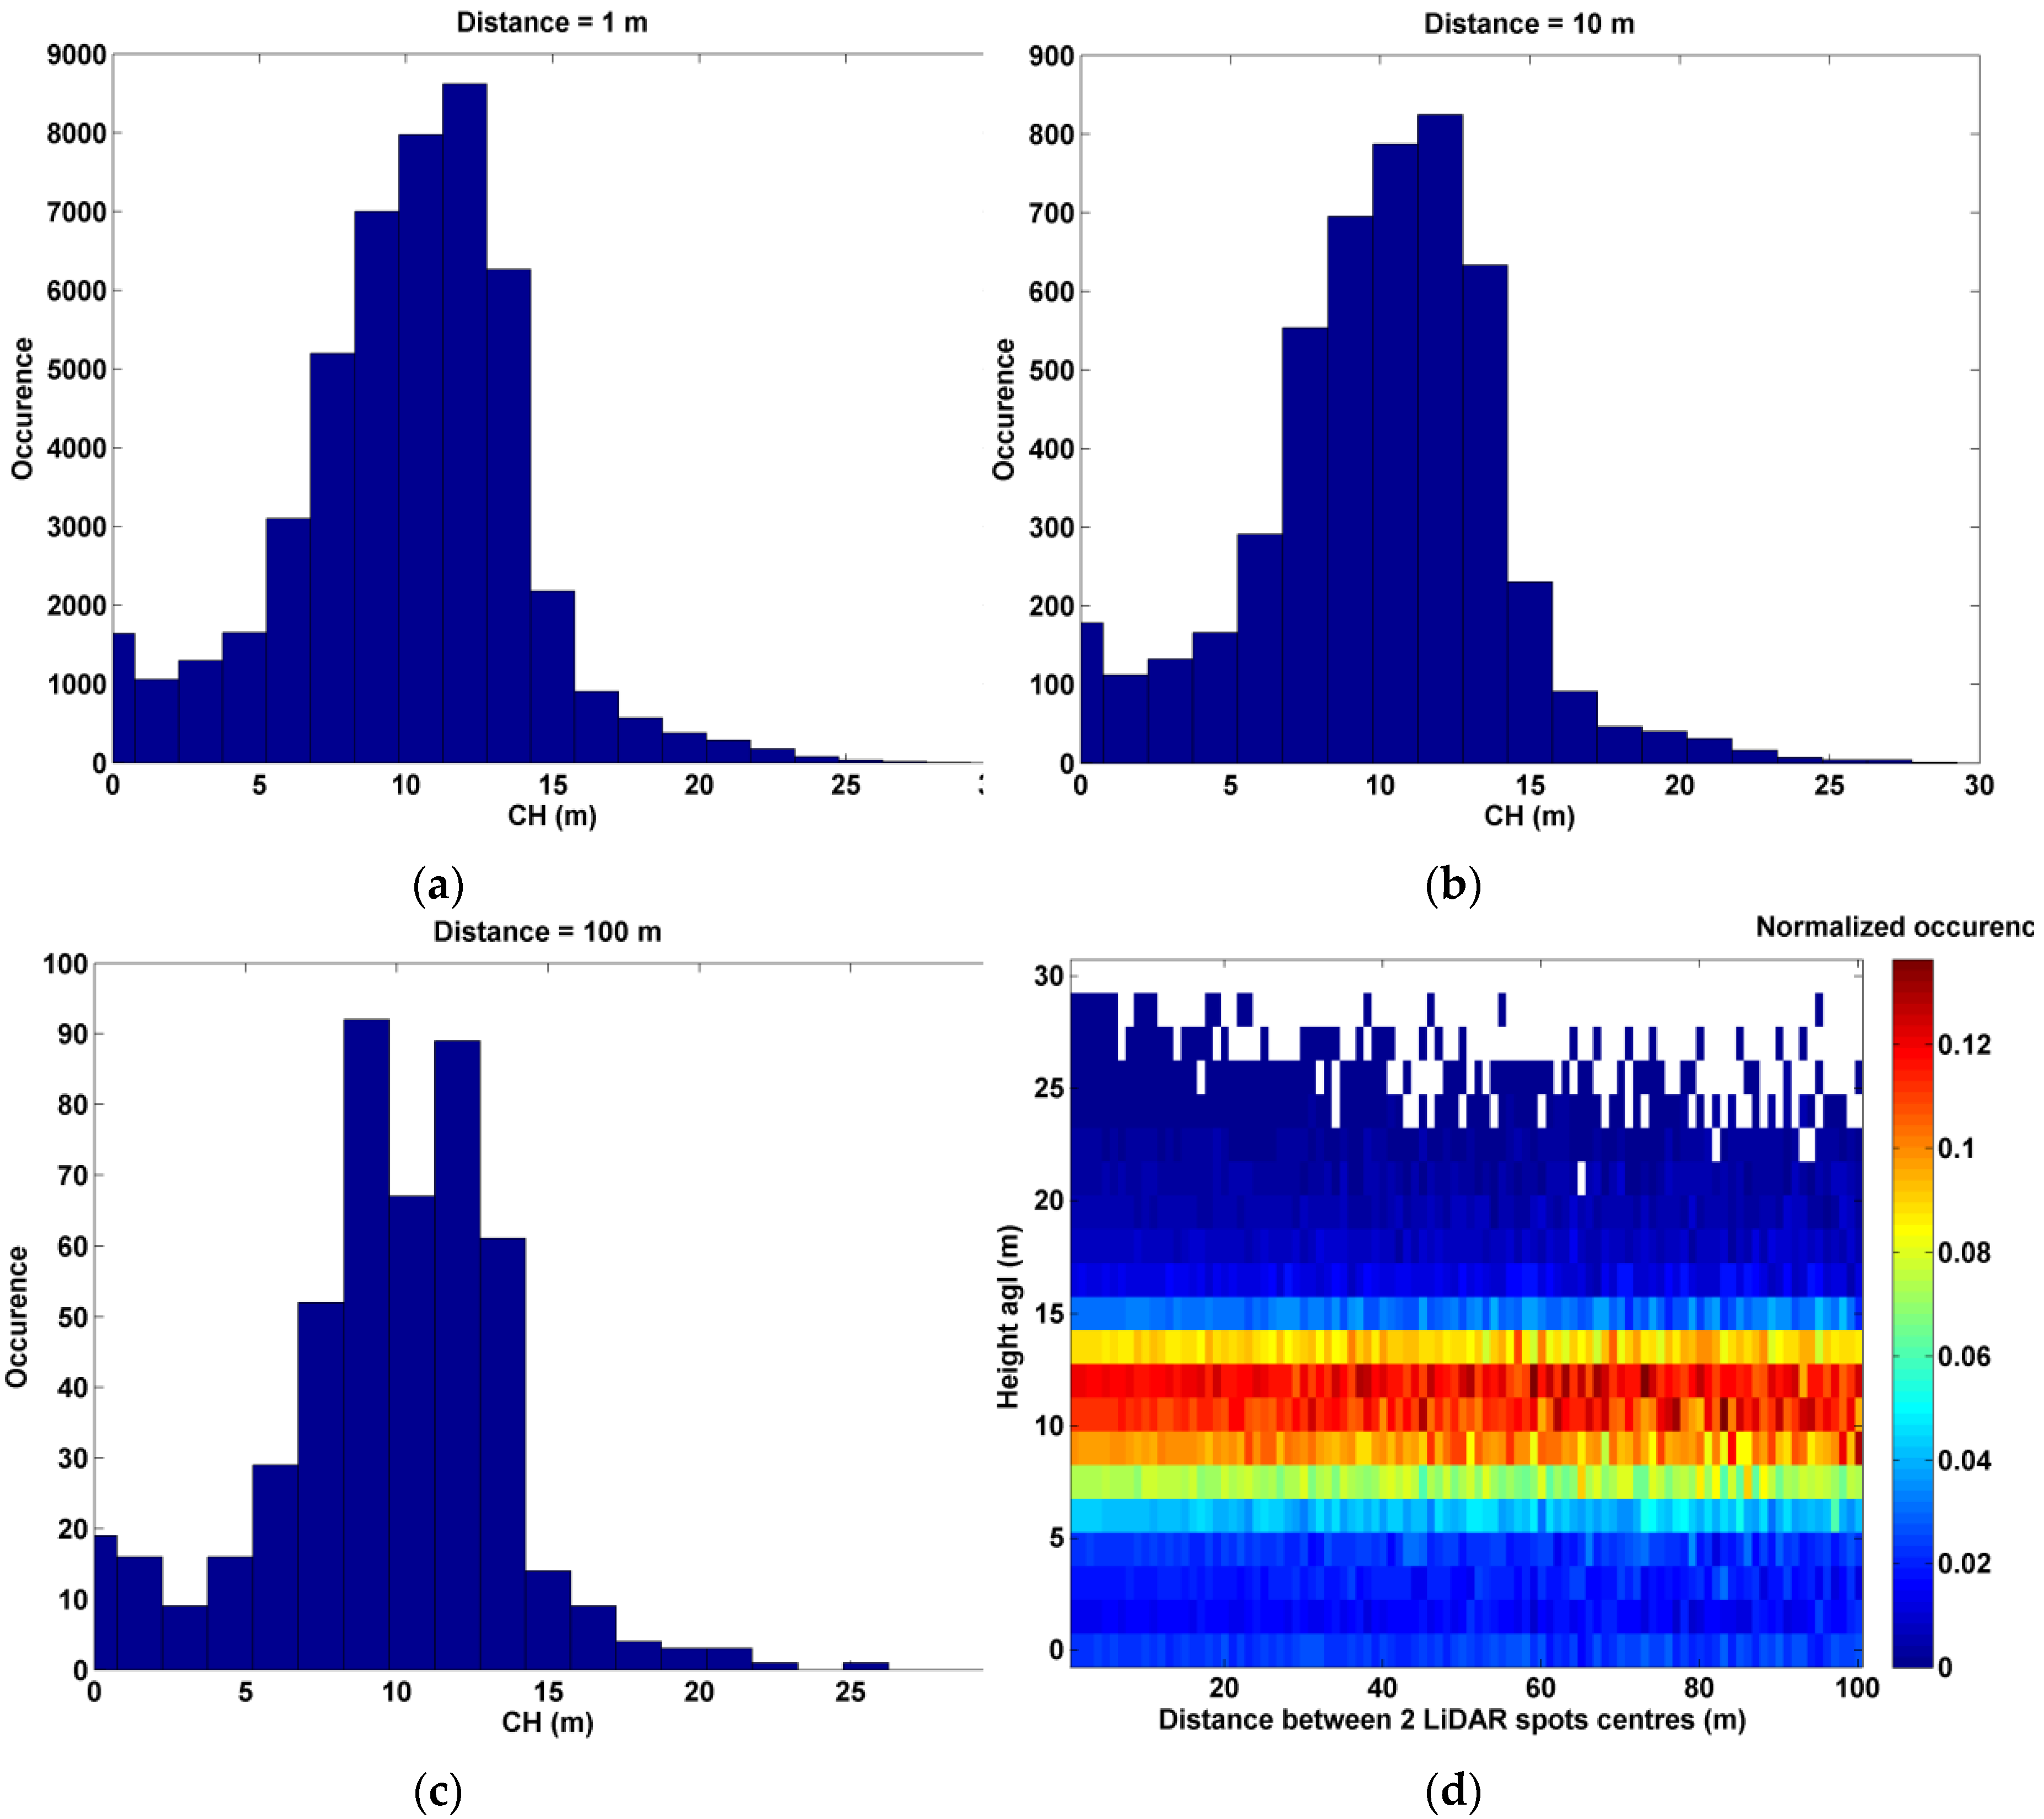
2.4. Sampling Strategy

Spatial sampling is a key parameter when using airborne LiDAR to characterize forest plots. Figure 4 gives an overview of the study sites and examples of LiDAR measurements performed continuously from the ULA. Note that the availability of ground echoes with a good signal-to-noise ratio (SNR) is highly variable with the forest site, depending on the vegetation density or the existence of gaps due to dead trees. We therefore had to adapt the sampling approach or find a representative sample for all of the sites.
Weather conditions with almost daily cloud formation over the tropical forest sites, coupled with trade winds or recirculation currents often exceeding 10 m·s−1, forced us to revise our initial sampling strategy of forest sites. It was not realistic to expect ground traces to be sufficiently numerous and close to each other to reproduce a 3D vision of forest structures. Nevertheless, we had to check that our samples remained representative.
The horizontal sampling grid during our airborne LiDAR experiment is defined by three independent parameters: the diameter of the laser footprint (d), the sampling along the ground track of the ULA (ΔX) and the sampling along the perpendicular to the ground track (ΔY). The last one must be more specifically defined, as it is based on successive passes of the ULA above the same forest site.
Laser footprint: In order to evaluate the influence of the laser footprint size (d) on the retrieval of the ground echo for a flat surface, three specific flights have been conducted at the same flight altitude over the Tamarind site (TM) with laser footprints at the ground level of 4, 10 and 20 m, respectively. We note no significant difference in the statistical distributions of tree structures between these experiments. Indeed, the treefall gaps help to identify the ground echo when using a sufficiently large laser footprint. A laser footprint of ~10 m associated with a ~350-m flight altitude was therefore considered for the entire sampling campaign. This footprint size is comparable to the overall span of dominant trees, and the ground echoes could be perceived from the optically thinner areas between the trees at each laser shot. Such a value is adequate for a correct assessment of the LAI, as shown by Riaño et al. [30], who found that LAI was better estimated using laser footprints between 7.5 and 12.5 m.
Figure 4. Photos for the 7 studied sites: coastal (CT), Tamarind (TM), Cryptomeria (CM), Bélouve (BF), and Mare-Longue (ML-150, -250 and -550) sites. Examples of continuous LiDAR measurements performed over the sites are also given.
Remotesensing 08 00043 g004
Along-track and cross-track samplings: The influence of the along-track and cross-track sampling distances (ΔX and ΔY) on the horizontal sampling was evaluated, in order to ensure that the sampling was sufficient to accurately retrieve the canopy structure, i.e., the correct CH distribution. After the accumulation of a sufficient number of samples, ΔX and ΔY were found to be log-normally distributed. On the long flight (~40 km) performed over the Bélouve site (BF), we assessed the mean value and standard deviation of ΔX to be 0.9 ± 0.5 m. Such a value is fully suitable for sampling dense tropical forest from an airborne LiDAR. The sampling distance ΔY between each ground track was around 100-times (respectively 10-times) larger than ΔX in the BF site (respectively other sites), because a flight pattern including too many overpasses over the forest plot is not feasible. To assess the effect of reducing the horizontal sampling frequency, the CH distribution is computed with artificially increased ΔX values ranging from 1 to 100 m, i.e., using only a fraction of the LiDAR shots. The results, presented in Figure 5, show that the CH distribution at ΔX = 10 m is similar to the reference CH distribution, which is the one at the native resolution of ΔX ≈ 1 m. Moreover, in Figure 5d, CH histograms appear similar for values of ΔX between 1 and 100 m. Hence, the distance ΔY, which is most difficult to keep during the flights, does not significantly affect the statistical studies performed on the different tropical forest sites. These results on the horizontal sampling also demonstrate the strong homogeneity of the dense tropical cloud forest of Bélouve. Note that similar results are obtained for the tropical rain forest of Mare-Longue.
Figure 5. Distribution of the canopy height (CH) computed using a varying fraction of the LiDAR footprints in order to simulate an effective sampling distance between two consecutive footprints along the ULA ground-track of 1 m (a); 10 m (b) and 100 m (c). The two-dimensional representation is given in (d).
Remotesensing 08 00043 g005

3. Results and Discussion on Retrieved Tropical Forest Parameters
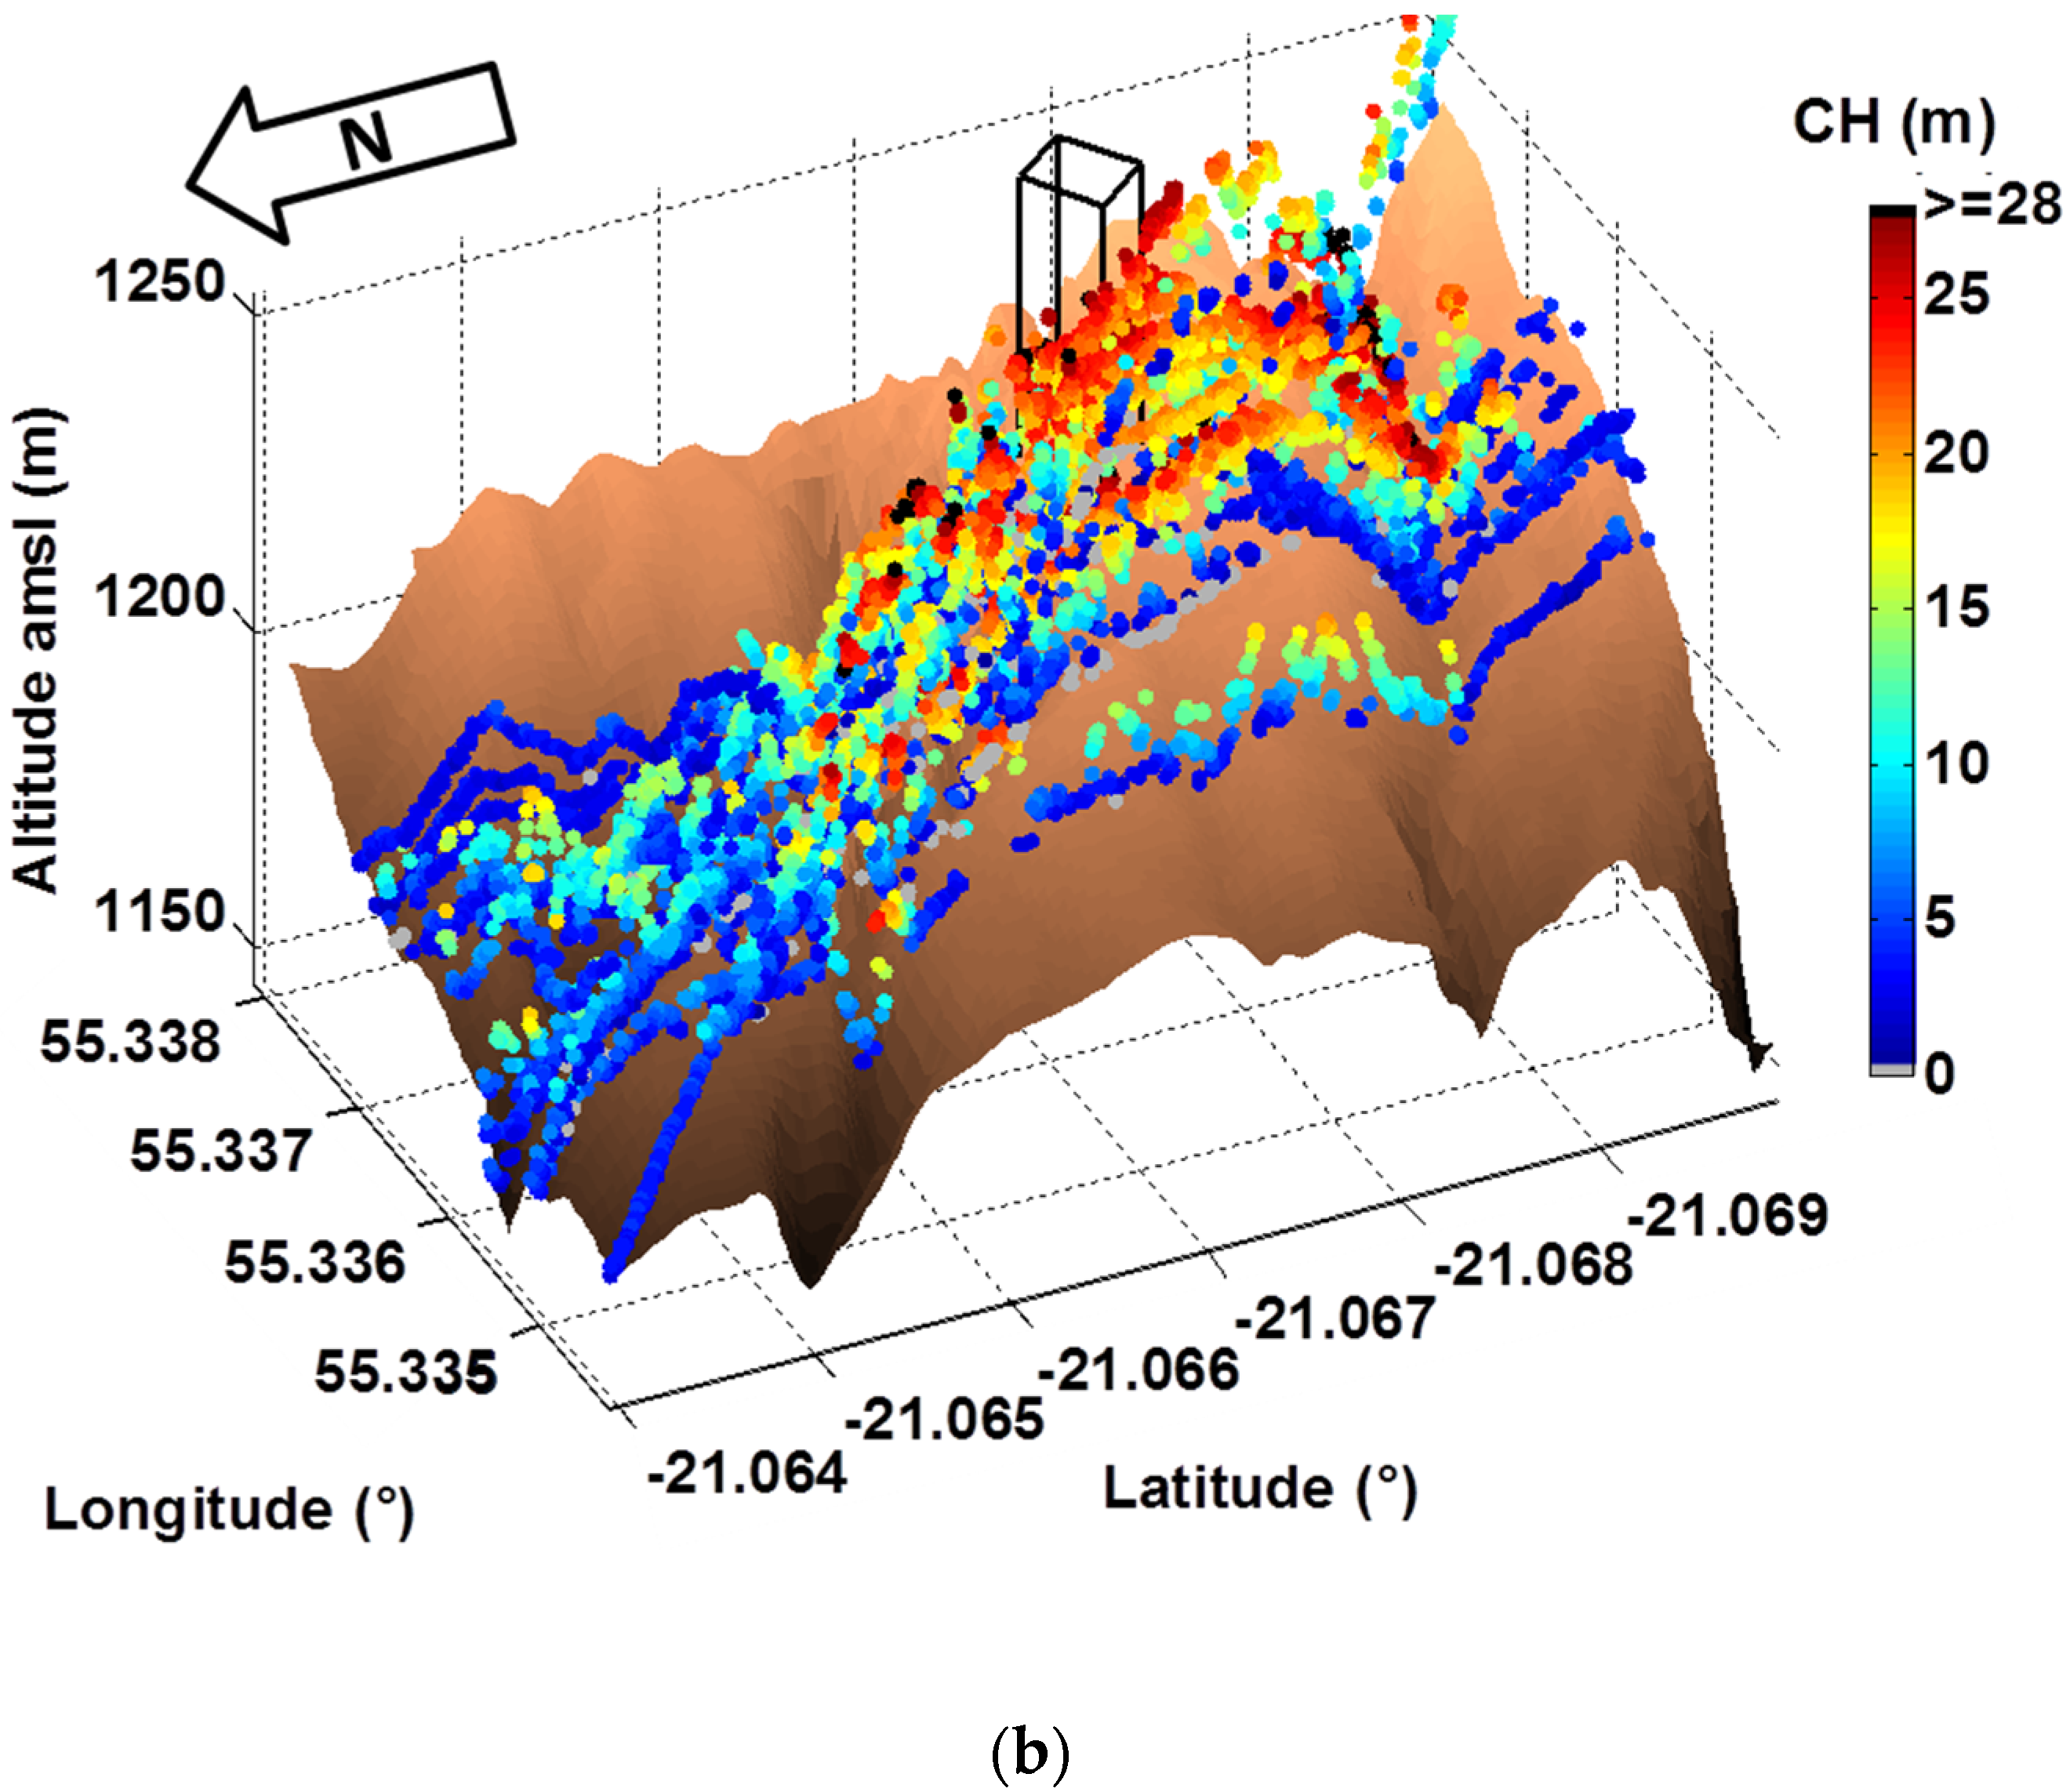
Each parameter estimated from the airborne LiDAR measurements over the tropical forests of Réunion Island will be analyzed and discussed in this section. The results derived from LiDAR measurements on the various sites will also be compared.

3.1. Canopy Height

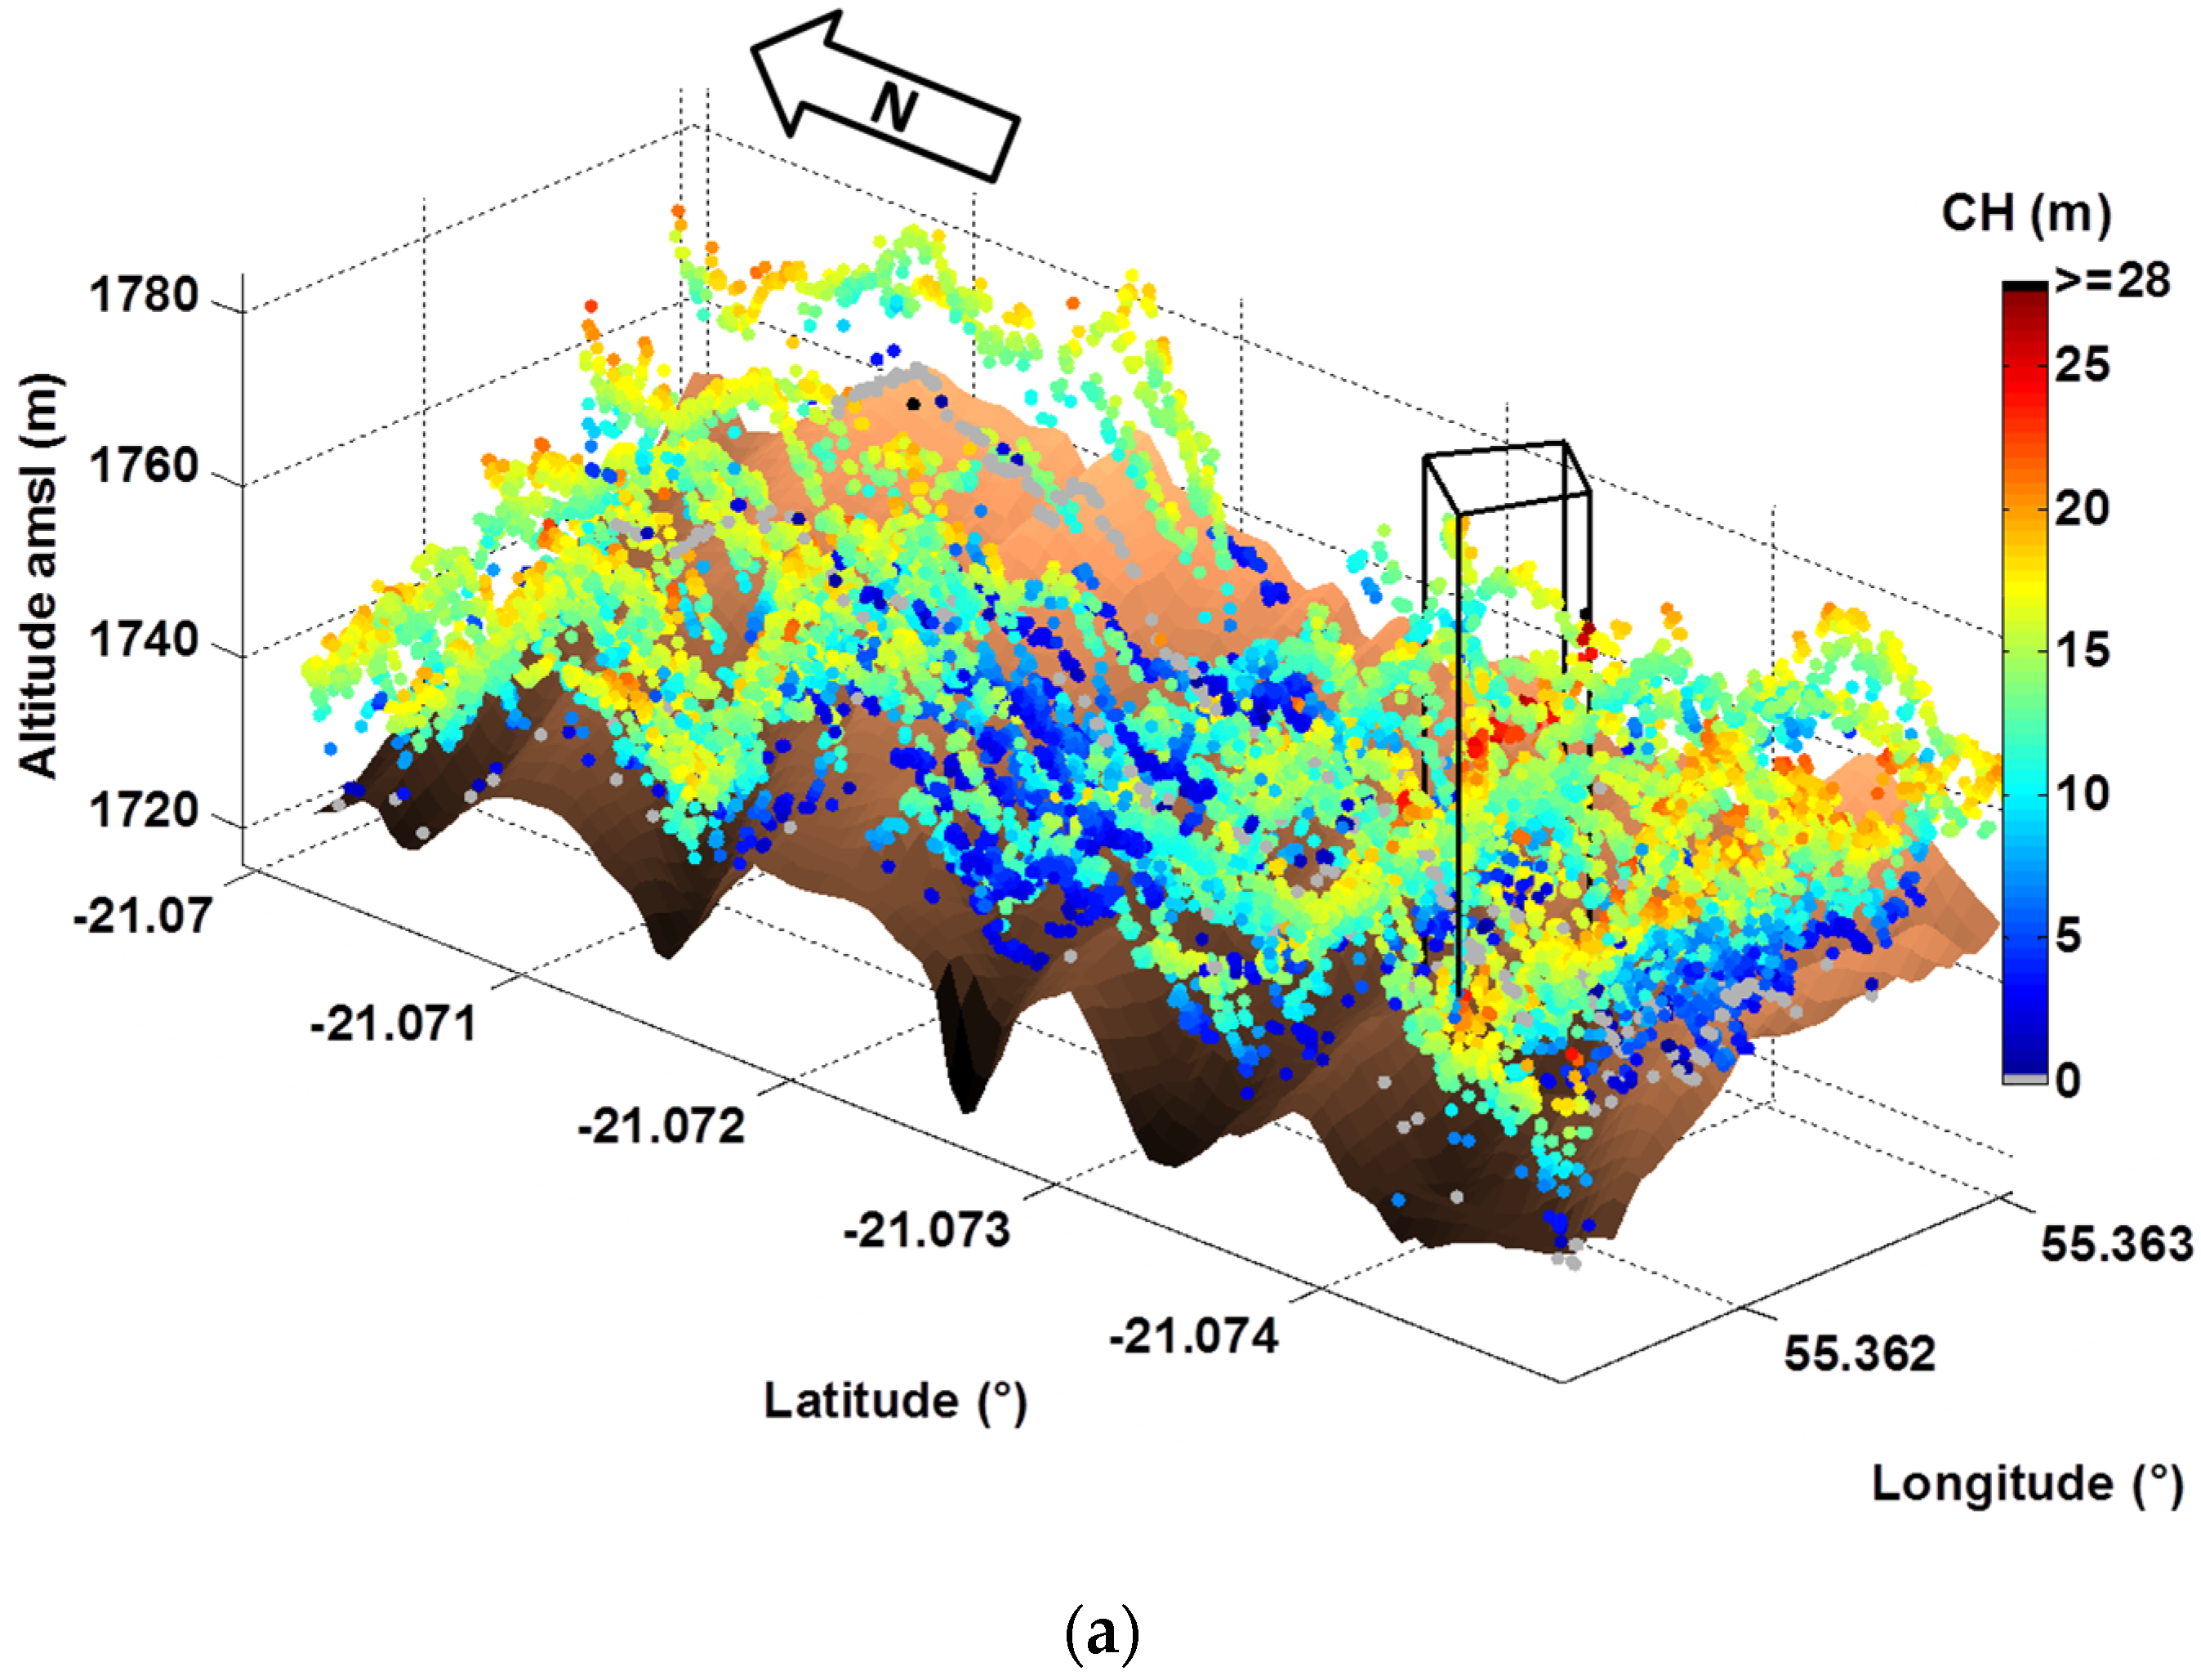
3.1.1. LiDAR-Derived Canopy Height

The number of available laser profiles on each sampled site is closely related to weather conditions during the experiment (Table 3). The two last sites of the Mare-Longue area are likely insufficiently characterized because the number of samplings is not enough for a reliable statistic. Nevertheless they are also taken into account in Table 3 where the mean, median and maximum values of retrieved CH are given, together with the standard deviation around the mean value, which represents so-called canopy rugosity. The statistic has been established on ~90% of the LiDAR profiles, when the ground echoes can be well located. The largest CH values are in the same range on all sites (~30 m), except for ML-250 and -550. The mean and median values are similar, which indicates that there is no significant bias due to outliers in the statistics. The standard deviation is larger than 5 m for the coastal site (CT), i.e., large canopy rugosity, pointing out larger differences in terms of tree maturity on these sites. On the Cryptomeria site (CM), LiDAR observations also show large canopy rugosity. That is because the sub-plot of interest, which has uniform tree height (~22 m), is surrounded with low vegetation. As expected, for the Mare-Longue sites, we observe that CH decreases when altitude increases. It is less noticeable elsewhere, because tree species vary between plots.
Table 3. Statistics (mean, median and standard deviation (SD)) for both the canopy height (CH) and the assessment of the LAI on the 7 sites: coastal (CT), Tamarind (TM), Cryptomeria (CM), Bélouve (BF) and Mare-Longue (ML-150, -250 and -550) sites. Profiles with CH < 5 m are not considered. Bold characters highlight the 4 forest sites where in situ measurements are available (see Table 1). The maximal CH derived from the LiDAR is also indicated.
CTTMCMBFML-150ML-250ML-550
Number of samples162112,660579042,71496391518658
CH (m)
Mean16.214.415.811.416.315.013.2
Median16.515.016.511.317.315.012.8
SD (rugosity)5.73.16.13.13.83.62.5
Max29.328.529.328.530.824.021.0
LAI (m2/m2)
Mean3.54.85.05.17.87.56.7
Median2.84.24.14.56.76.75.9
SD2.72.53.33.03.93.93.7
LAI from MODIS (m2/m2)
Number of pixels (number of valid observations per pixel) 2 (10)4 (14)3 (14)
Mean-5.45.15.9
SD-0.50.40.3
Figure 6 gives examples of samplings performed over the TM and CM sites with sampling distances ΔX ≈ 1 m and ΔY ≈ 10 m. The presence of both valleys and clear areas observed on the ADC-air vegetation camera image can explain the inhomogeneity in the LiDAR CH measurements.
Figure 6. Horizontal samplings performed on the (a) Tamarind (TM) and (b) Cryptomeria (CM) sites with a laser footprint of 10 m. The horizontal sampling distances along and perpendicular to the ground track are ~1 and ~10 m, respectively. The brown color corresponds to the ground numerical model at a 5-m resolution provided by the Parc National de la Réunion (J.-C. Notter, personal communication). The locations of the sub-plots where in situ measurements were performed are highlighted using thick black lines.
Remotesensing 08 00043 g006aRemotesensing 08 00043 g006b

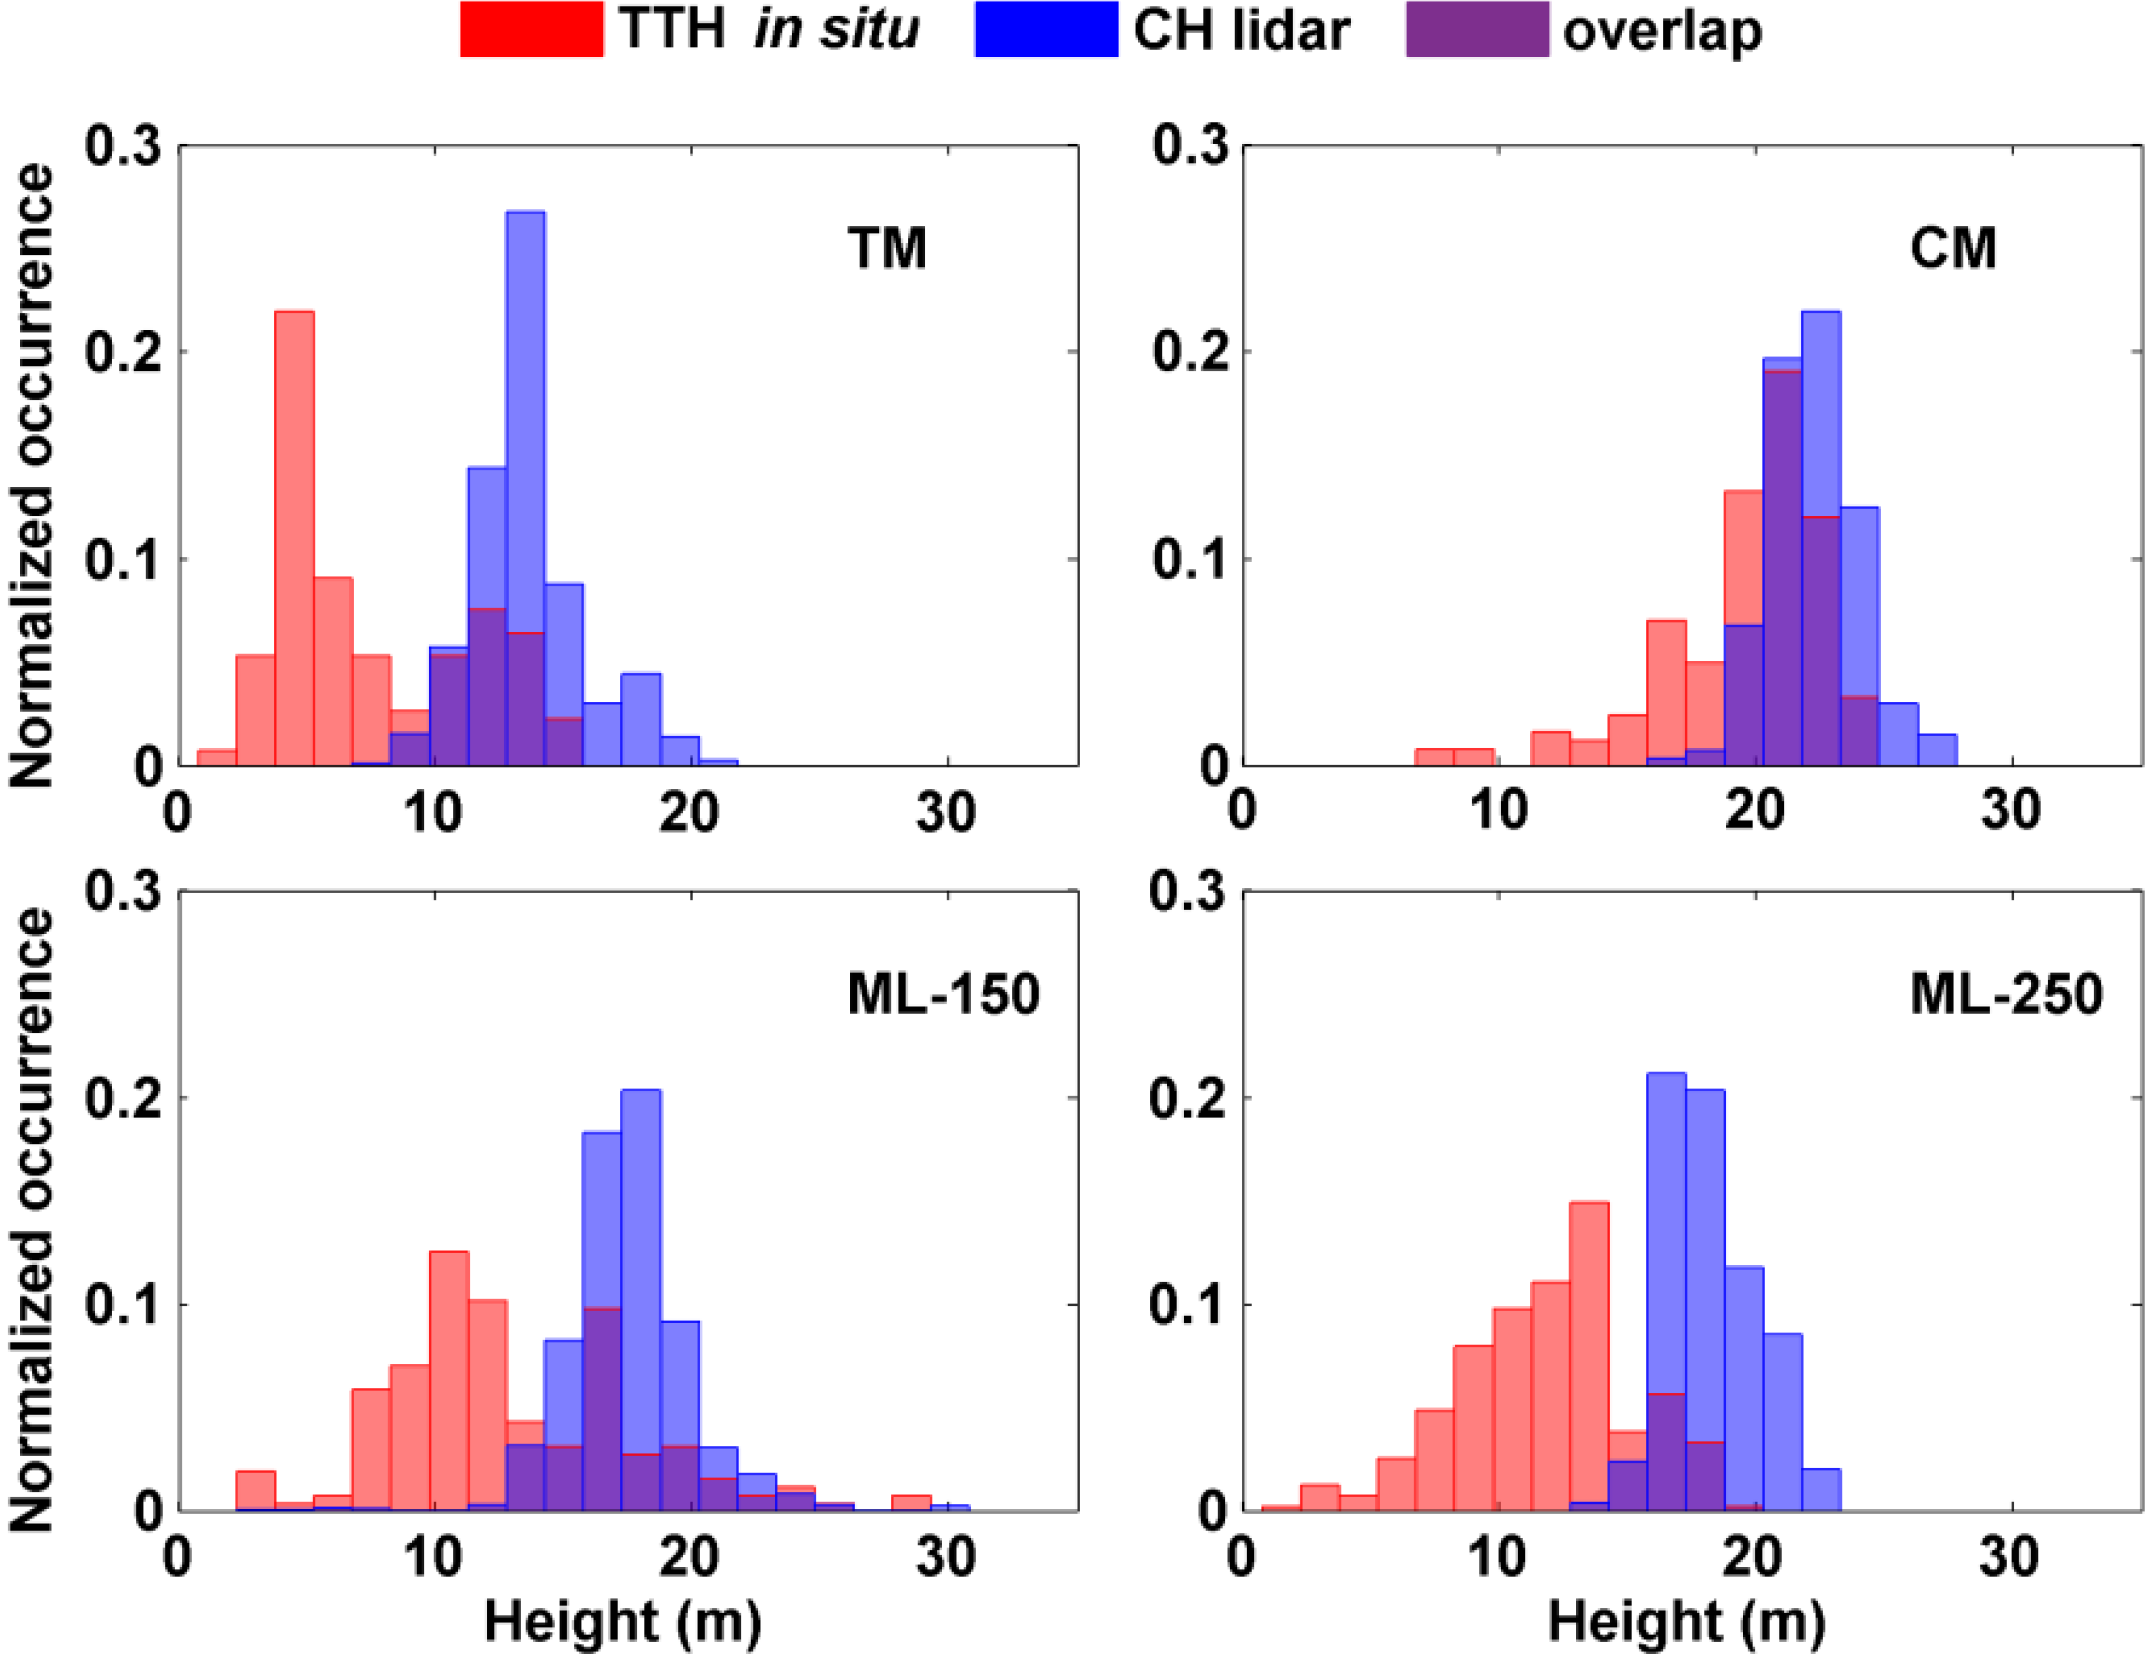
3.1.2. Comparison with in Situ Measurements

In the four sampled sub-plots, the LiDAR-derived canopy heights (CH) were compared to the tree top heights (TTH) from in situ measurements. Their statistical moments and normalized distributions are given in Table 4 and in Figure 7, respectively. Understandably, for in situ measurements, the sampling areas were reduced (~0.2 ha), but the sub-plots were chosen so as to be as representative as possible of the extended sites. The agreement is quite good between the two distributions for the Cryptomeria site (CM). This is not the case for the others. With a LiDAR footprint diameter of 10 m, numerous smaller trees are hidden by the higher trees; the LiDAR-derived CH distribution is then biased toward the higher trees, whereas ground measurements can underestimate actual TTH as the tree top may not always be well identified because of the complex canopy. It is thus necessary to consider the apparent foliage profile to better identify the underlying trees.
Table 4. Statistics (mean, median, maximal values and standard deviation (SD)) for both the tree top height (TTH) as measured from the in situ census and the canopy height (CH) retrieved by LiDAR measurements in 4 sub-plots of ~0.2 ha: Tamarind (TM), Cryptomeria (CM) and Mare-Longue (ML-150, -250) sites. The values are given for sub-plots well identified in the main sites (Table 1). All trees with diameters at breast height higher than 7 cm are considered in in situ measurements.
Sub-Plot
TMCMML-150ML-250
Location21°4′25″S, 55°21′44″E21°4′3″S, 55°20′13″E21°21′29″S, 55°44′43″E21°21′2″S, 55°44′39″E
Number of LiDAR profiles6352452371164
Number of in situ values176161170259
LiDAR CH (m)
Mean 14.022.617.918.5
Median 13.522.518.018.0
SD2.21.82.51.8
max21.827.830.823.3
In Situ TTH (m)
Mean 7.519.512.911.8
Median 5.820.411.812.1
SD3.73.24.83.4
max1524.128.919.2
Figure 7. Distributions of the tree top height (TTH) from in situ (red) and canopy height (CH) from LiDAR (blue) measurements for the sub-plots of Tamarind site (TM), the Cryptomeria site (CM) and Mare-Longue tropical rain forest sites at 150 m (ML-150) and 250 m (ML-250) amsl. The overlapping parts are in purple. Uncertainty on retrieved heights is 4 m (2 m) for in situ (LiDAR) measurements.
Remotesensing 08 00043 g007
In Figure 6, the Tamarind (TM) and Cryptomeria (CM) sub-plots are highlighted. We notice that the TM sub-plot has scarcer vegetation than its surroundings, whereas the CM sub-plot is denser than its surroundings. Images of the ADC-air vegetation camera obtained over Mare-Longue (ML) and Bélouve (BF) present on the contrary a good homogeneity, as well as high NDVI (>0.8), typical of primary tropical forest growing on regular slopes, which is coherent with the results previously discussed in Figure 5. We also found out that LiDAR-derived CHs are comparable between Table 3 and Table 4 for the TM and ML-150 sites. Note that for BF and ML-500, it was difficult to access the site and almost impossible to identify the top of a tree from neighbors. Consequently, in situ measurements have not been considered as valid for these two sites. For the CM site where trees have about the same maturity, the differences between CH derived from LiDAR and TTH derived from in situ measurements are ~3 m, which is included in the standard deviation of CH and TTH as discussed previously (~2 m and ~4 m, respectively). For the others, the discrepancy is larger (>6 m) as for the TM site.

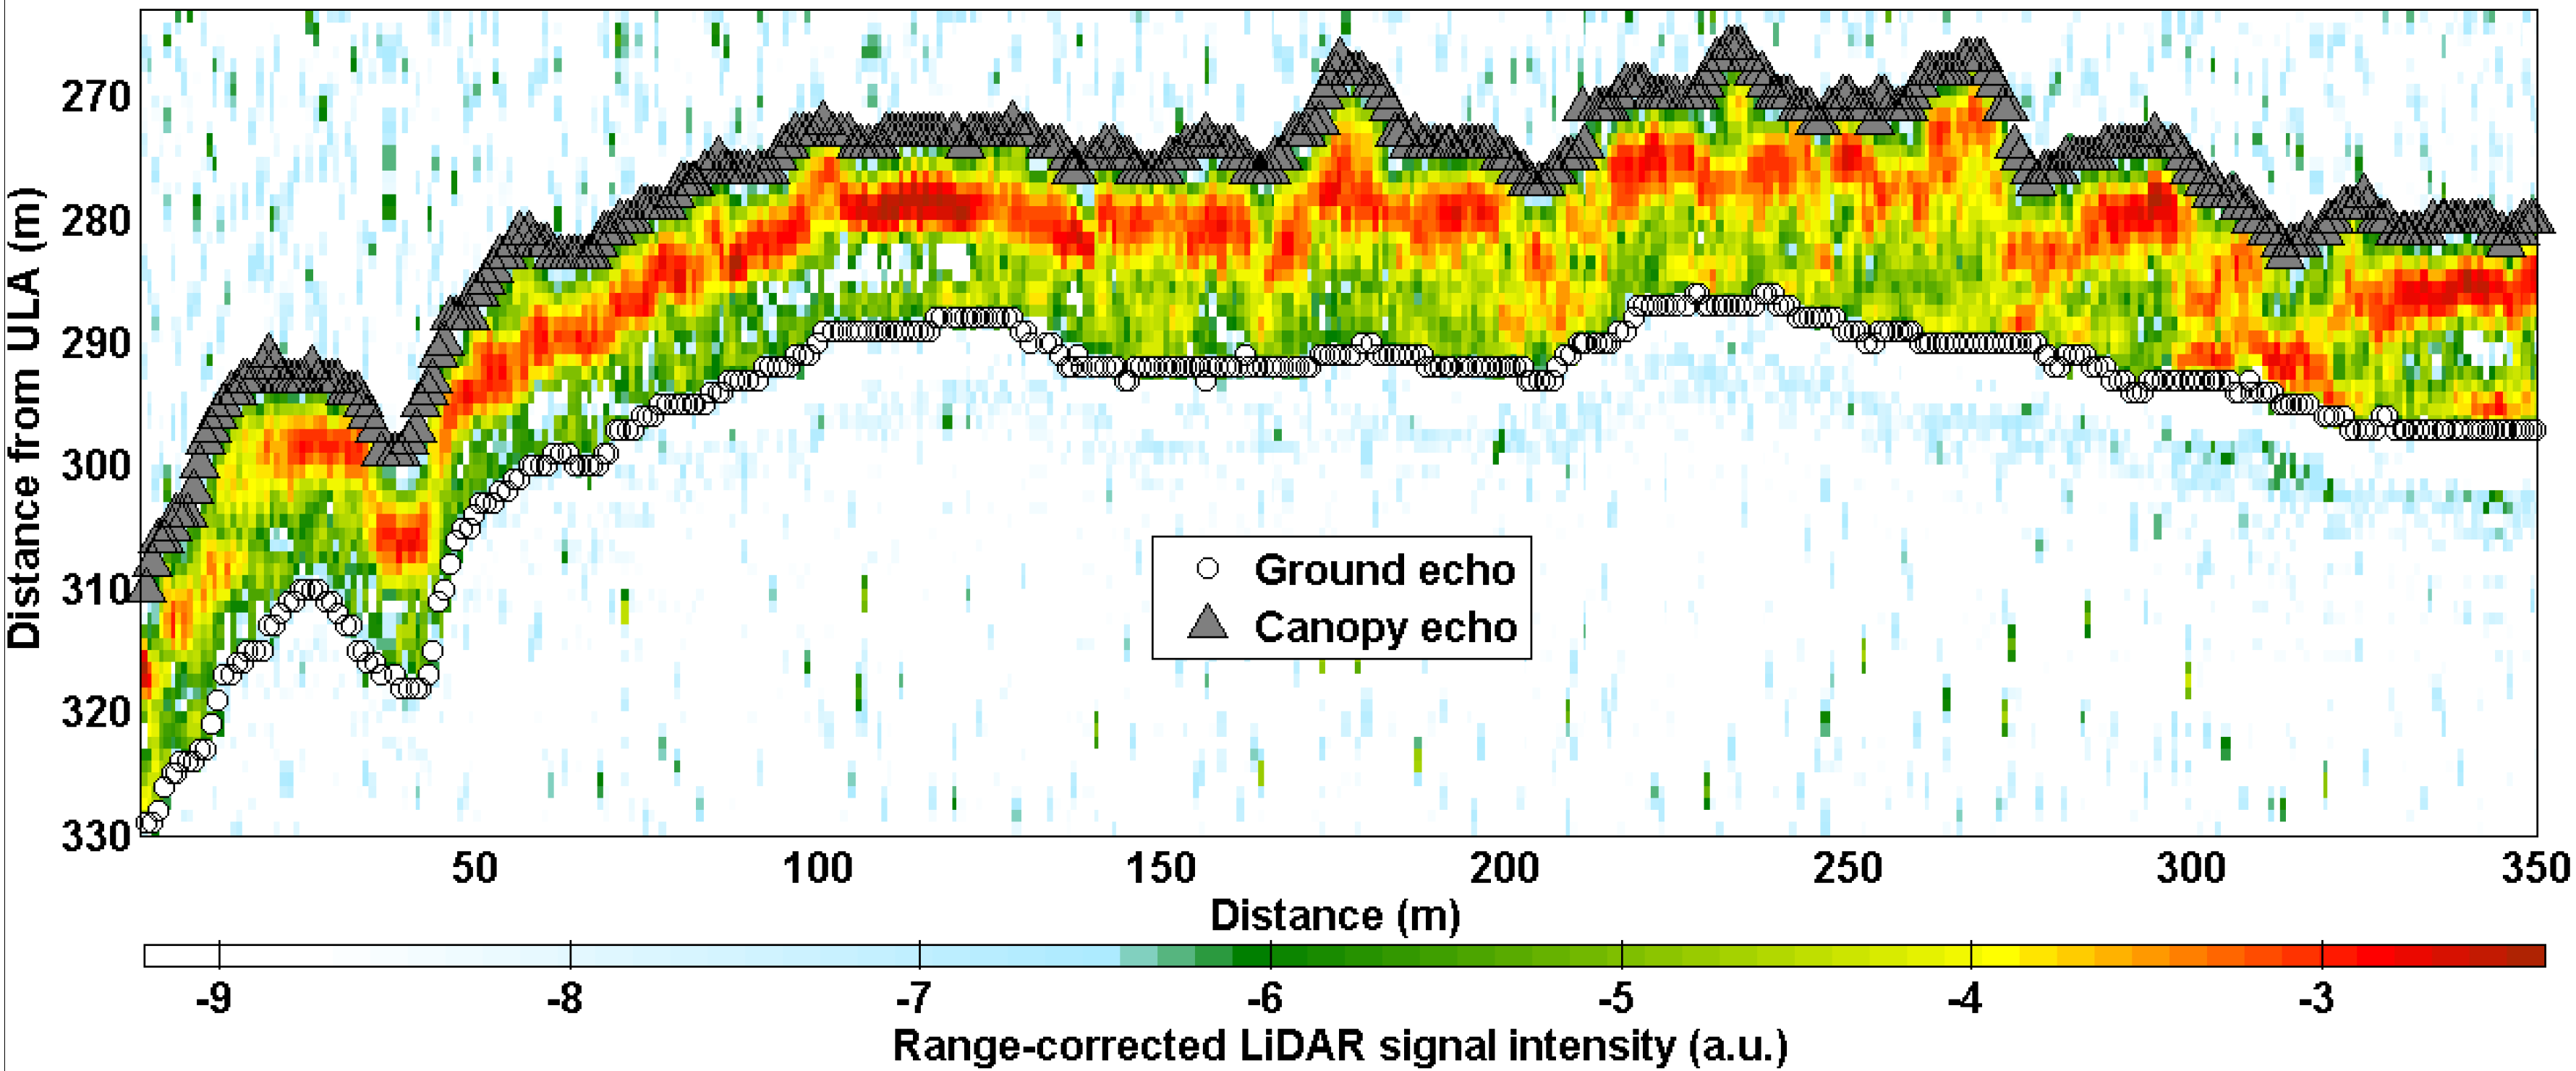
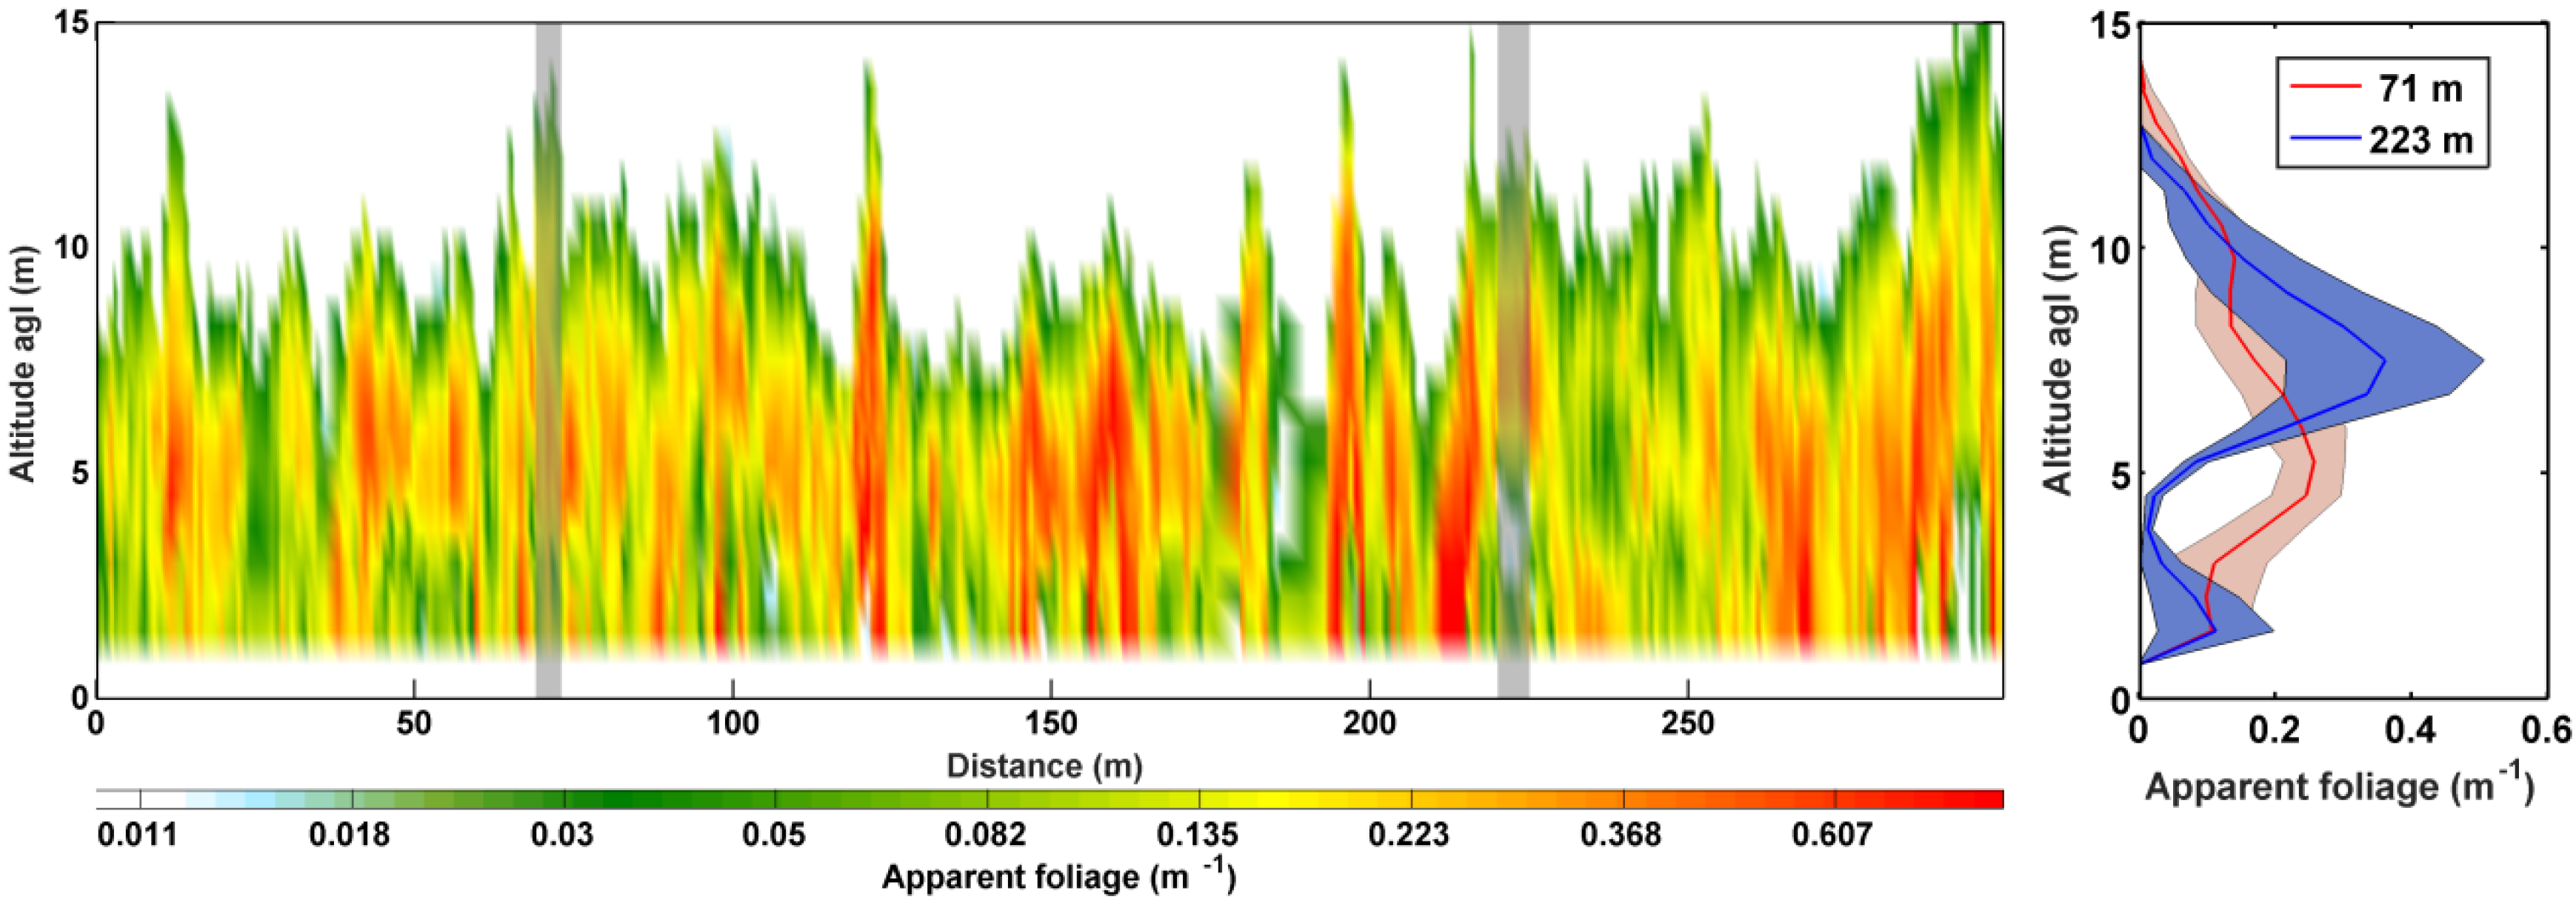
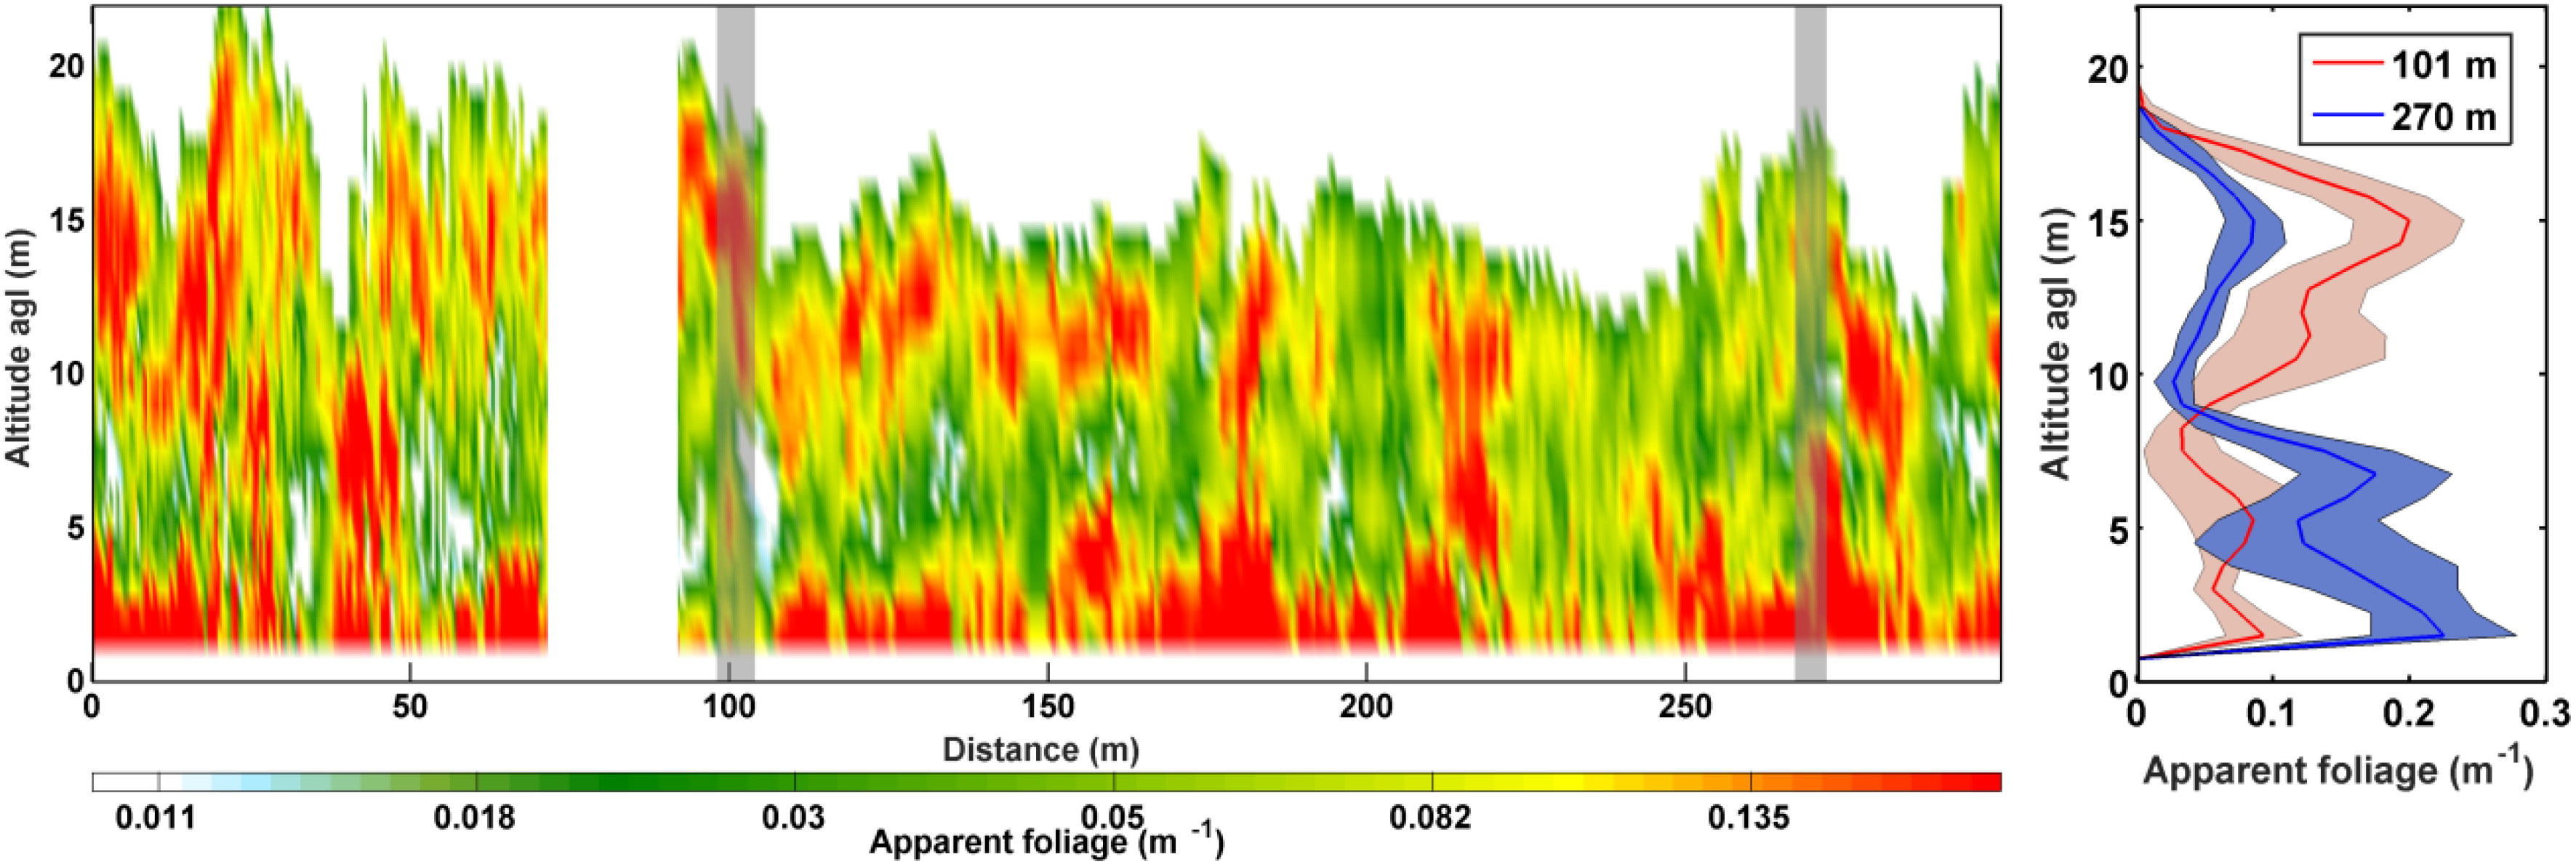
3.2. Understanding Results with Apparent Foliage Profiles

The canopy height (CH) does not provide enough resolved information on the vertical structure of the forest systems, which can be very complex because of the presence of multiple layers of saplings, as well as undergrowth (i.e., tree ferns, ferns, bushes). Hence, it is preferable to consider the vertical profile of the apparent foliage (Fapp). Such a profile is corrected from the extinction of the upper canopy. Parker et al. [48] have shown that Fapp is an important constraint for energy, water and nutrient flows through forest cover. This is due to the contrasted contributions of the different canopy levels to both photosynthesis and carbon storage [48].
Figure 8. Evolution of the forest vertical profile of the LiDAR-derived apparent foliage (Fapp) along a transect of the Bélouve site (BF, left panel). Two specific vertical profiles are shown in the right panel, and their locations are highlighted in transparent gray in the left panel.
Remotesensing 08 00043 g008
As an example, we focus here on two different flight segments obtained on the Bélouve (BF) and Tamarind (TM) sites. The first site is very dense with continuous vegetation from ground to the canopy (as seen in the field), whereas the second one is composed of several distinct internal structures. Figure 8 shows the evolution of the apparent foliage as a function of distance along the transect in the BF. Two typical vertical profiles are also given. Certain profiles can show pronounced peaks, which identify the precise position of the tree crown or, on the contrary, smoother shapes due to the likely contribution of branches of nearby trees, lianas and, in the lower part of the profile, important undergrowth. Overall, because of the high density of trees in the tropical montane forest of BF, the LiDAR profiles mainly highlight only one vertical structure with one peak. This is also the case for the Cryptomeria (CM) site, but not for the same reason, because it is an exploited plot and there are generally no overlapping trees. On the contrary, for the TM site, which lies on the slope of Piton Maïdo, the convoluted tree trunks and complex development in response to storm winds lead to the existence of two superimposed layers, as can be seen in Figure 9. The profiles show there is generally an area with a lower density of vegetation between the two layers (between 4 and 8 m·agl), leading to less backscattered signal. This complex structure may be the source of discrepancies between airborne measurements and the in situ census made from the ground level. Another interesting and concrete conclusion is that the energy and water vapor fluxes between the forest and the atmosphere are mainly at the crown level of the trees for Tamarinds, even if undergrowth also contributes below ~8 m·agl. In contrast, for the BF site, these fluxes are distributed over the whole vertical forest structure.
Figure 9. Evolution of the forest vertical profile of the LiDAR-derived apparent foliage (Fapp) along a transect of the Tamarind site (TM, left panel). Two specific vertical profiles are given in the right panel, and their locations are highlighted in transparent gray in the left panel. The gap between the distances of 70 to 90 m corresponds to LiDAR shots with big pointing angles (the angle between the actual LiDAR line of sight and the nadir direction is larger than 20°), which were not considered in our study.
Remotesensing 08 00043 g009

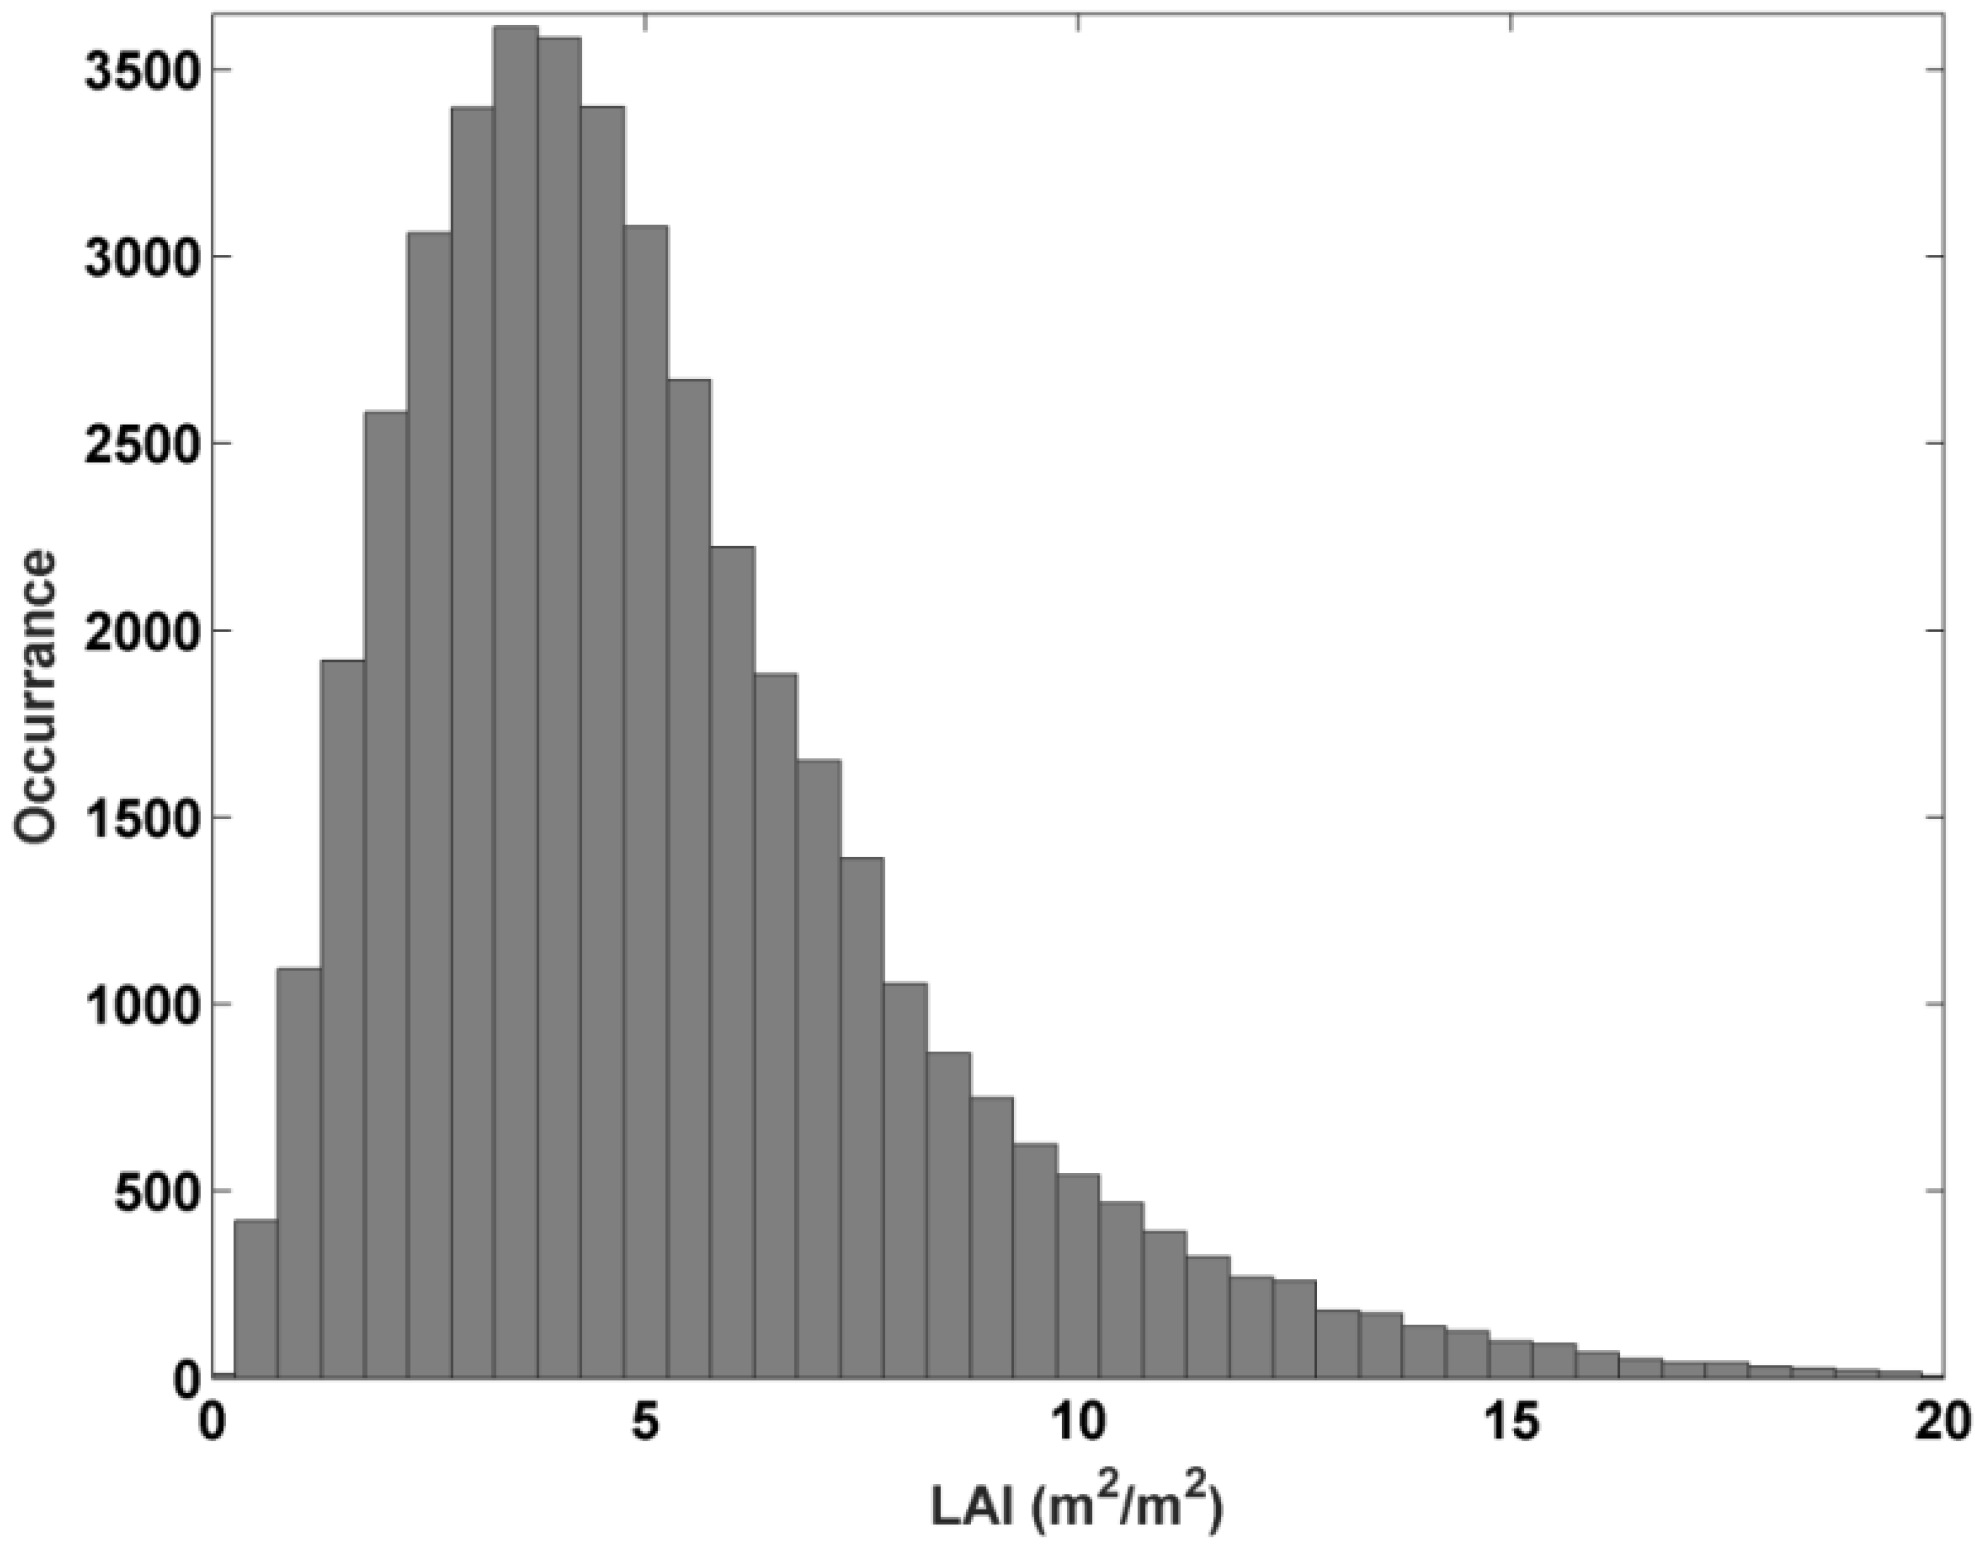
3.3. Leaf Area Index

LAI is also a key parameter linked to the plant respiration and photosynthesis, as explained by Gower and Norman [49]. It is important for vegetation growth (carbon sequestration) estimation [50]. Such a parameter is also a strong constraint for forest ecosystem modelling. It characterizes the forest interaction surface and exchange efficiency with the atmosphere.

3.3.1. LiDAR-Derived LAI

The LAI has been retrieved from each individual LiDAR profile to complement the characterization of the sampled forest sites. The LAI values are found to be log-normal distributed for all sampled forest sites, with the mean LAI ( L A I ¯ ) ranging from about 3.5 to 7.8 m2/m2 (Table 3). The standard deviation is between 2.5 and 3.9 m2/m2, not necessarily correlated with the one of CH (Table 3). The tropical rain forests of Réunion Island (ML-150) have been shown to be associated with the higher mean LAI of 7.8 m2/m2. Such a value contrasts with the one retrieved for the tropical montane cloud forest of Bélouve, which is shown to be ~5 m2/m2 on average. This difference may be explained in terms of plant nutrient supply between these two forest categories [51]. As an example, the histogram of LAI derived from the LiDAR for the Bélouve site is also presented in Figure 10. The LAI value varies much for the same site from one point to another, likely due to very important difference in terms of nutrient availability in the ground.
Figure 10. Histogram of the LAI derived from the airborne LiDAR for the tropical mountain rain forests of Bélouve (BF).
Remotesensing 08 00043 g010

3.3.2. Inter-Comparison and Discussion
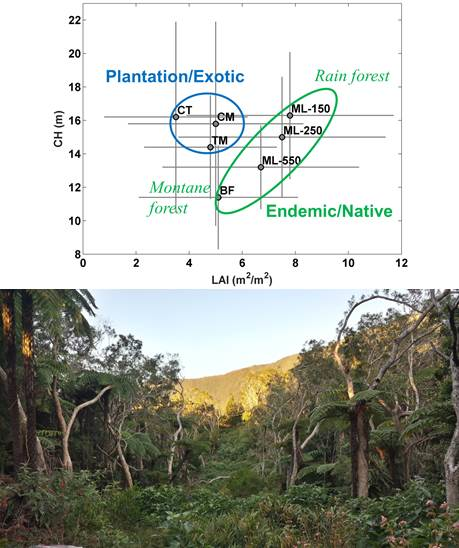
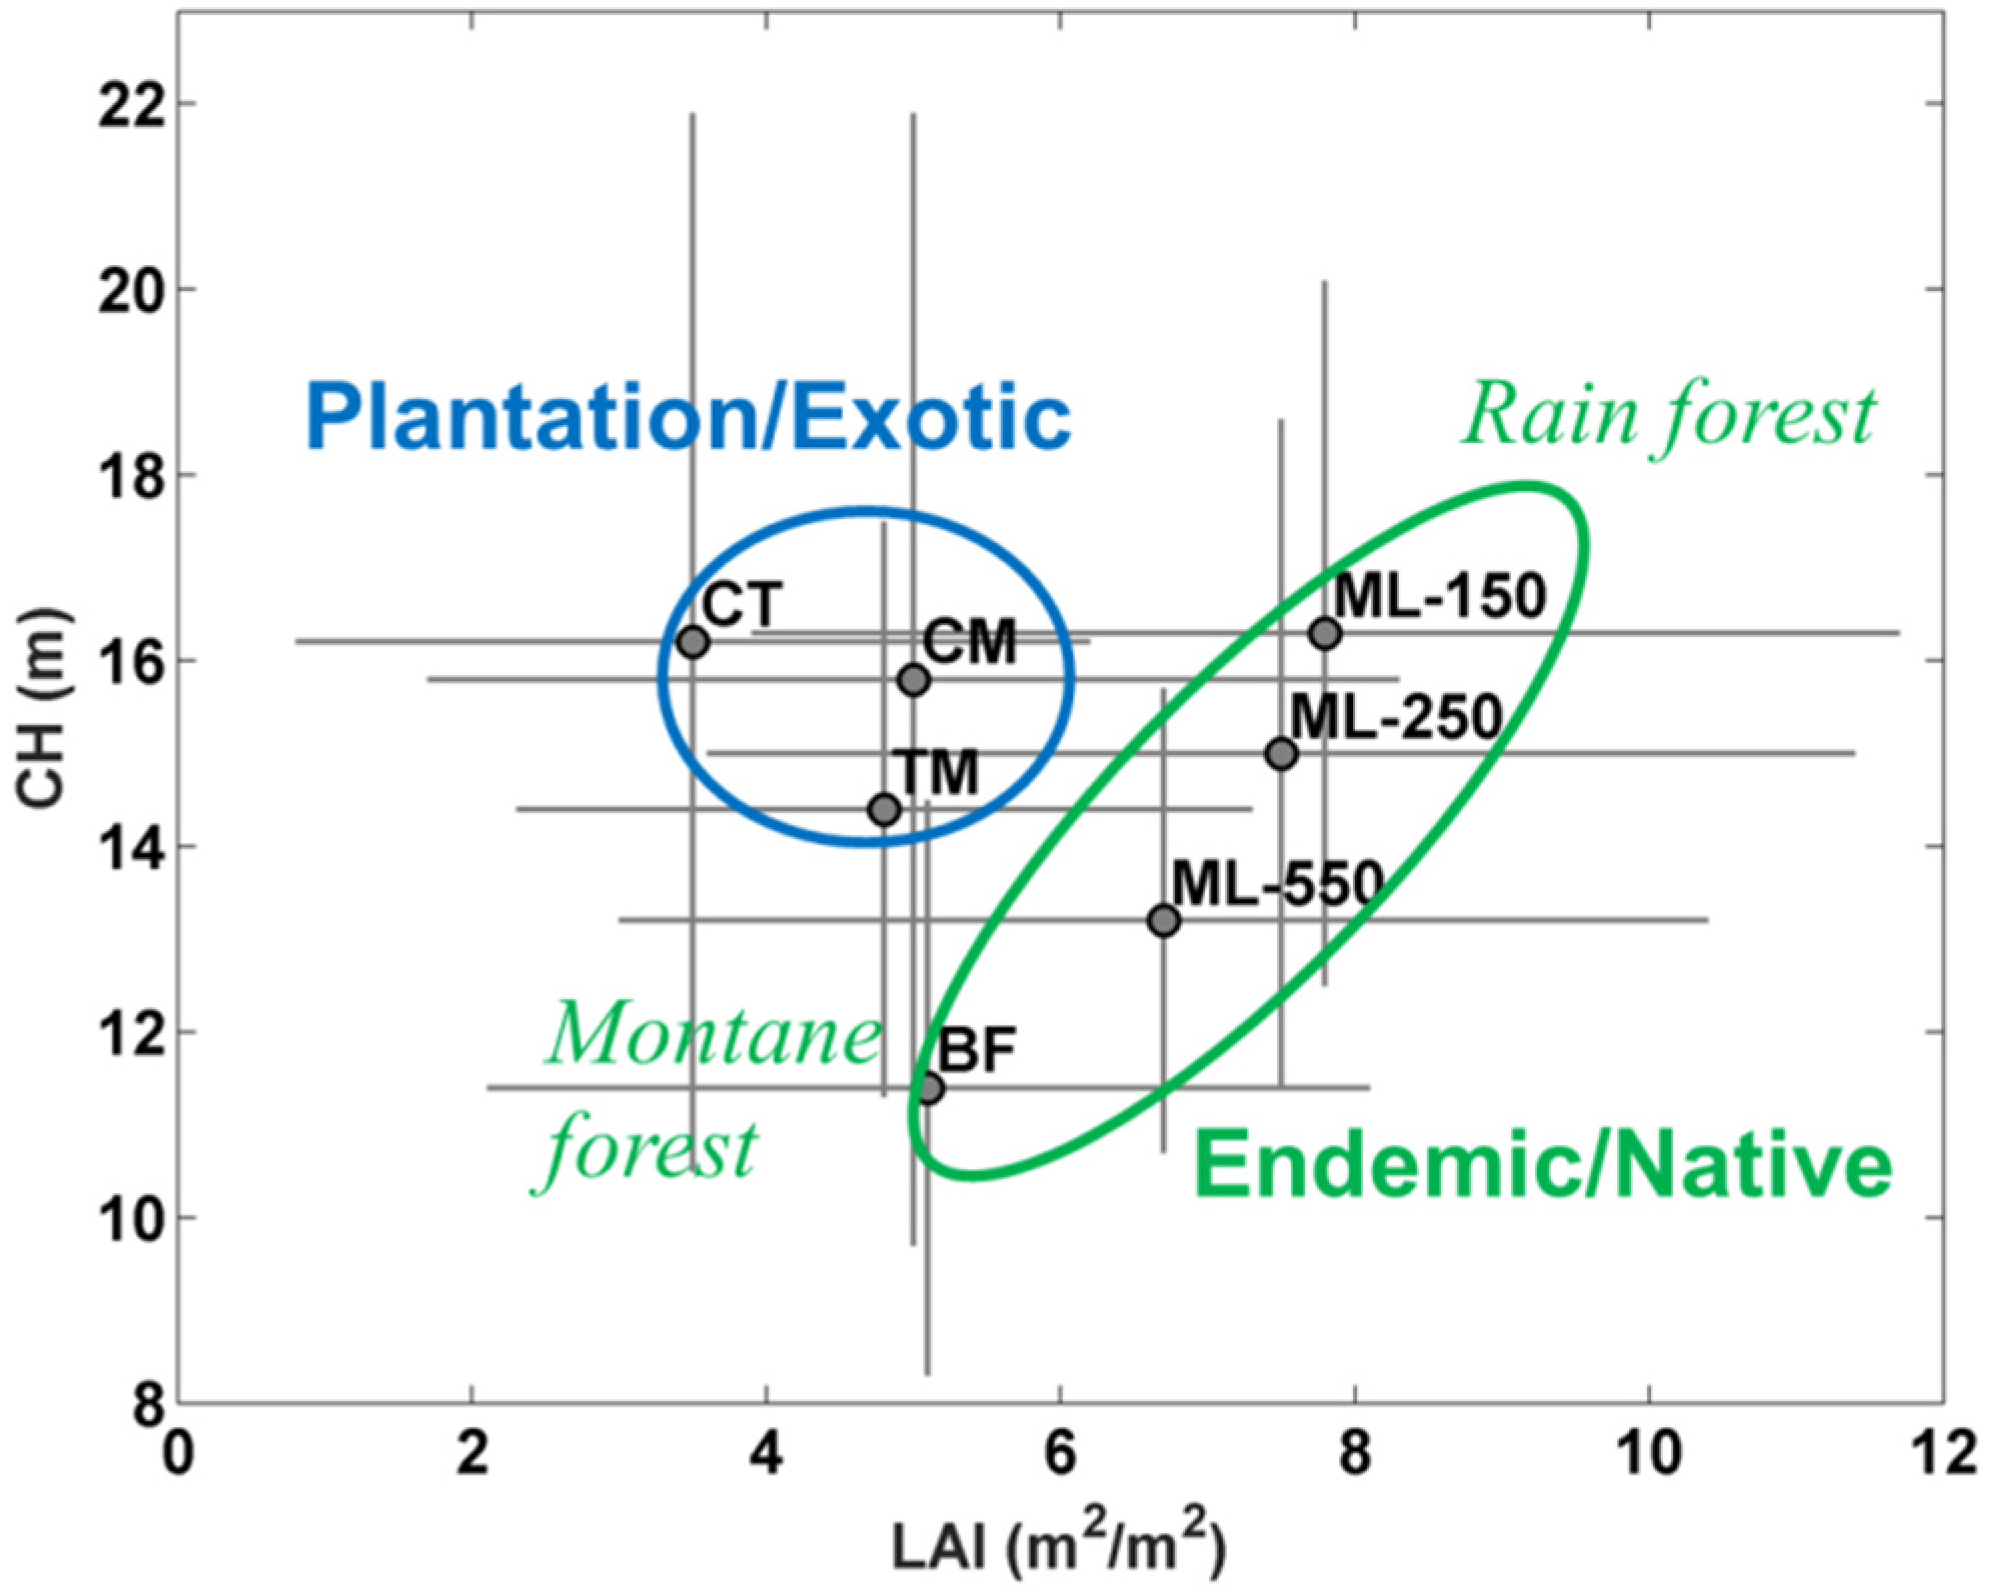
In this part, we will compare the LiDAR- and MODIS-derived LAI and discuss previous results published in the scientific literature.
The comparison with our observations was possible only on the large sampled areas due to the low spatial resolution of MODIS. Even though the LAI algorithm from satellite observations usually assumes that the ground is flat and does not handle mutual shadows due to the terrain, the agreement is very good on Bélouve (ground almost flat; Table 1) and sites situated on the foothills of the Piton Maïdo (TM and CM, ~5 m2/m2; ground with a certain slope; Table 1). LiDAR-derived mean LAIs for ML-150, -250 and -550 (7.8, 7.5 and 6.7 m2/m2, respectively) present higher differences with MODIS-derived LAI (5.9 m2/m2). The small slopes in these sites (Table 1) are not related to a better agreement, as the sampled surface is too small. We believe that LiDAR measurements offer a better assessment of LAI than MODIS, as this LiDAR metric has already been validated by Tang et al. [21] and MODIS-derived LAI saturates at certain value levels because of the nature of the tool [31]. In addition, the clumping of vegetation structure is less considered by the MODIS LAI algorithm; so it is normal that the LAI is underestimated. As previously explained, it is difficult to conclude for both ML-250 and ML-550, because the number of samples obtained over these sites is not significant.
Mature evergreen tropical forests usually have large LAI, more than 4 m2/m2, as shown for example in Doughty and Goulden [52] using monthly MODIS observations over tropical forests of Brazil. Cristiano et al. [53] also found mean LAI to be larger than 7 m2/m2 for native subtropical forests of Argentina, Brazil and Paraguay. Moreover, the mean LAI derived from our LiDAR measurements is within the range of values deduced from the LiDAR- or tower-derived cumulative LAI of Tang et al. [21], which give LAI between 5 and 9 m2/m2 for secondary and old-growth forests. Asner et al. [54] performed a global synthesis of LAI from various ecological and remote sensing studies. The mountain tropical forest of Bélouve, the TM and the CM sites are associated with mean LAI very close to the one compiled by these authors, which found for tropical deciduous and evergreen broadleaves LAI between 3.9 and 4.8 m2/m2 on 78 samplings, with a maximal value close to 9 m2/m2. Our standard deviations are in the same range as obtained by Asner et al. [54], which give values from 0.7 to 4.3 m2/m2.

3.4. Classification

Regarding the average values and variability of both CH and L A I ¯ , the seven sites are in two distinct groups (Figure 11): the endemic forests and the planted/exotic forests, with their locations shown in Figure 1. The higher L A I ¯ are for the three Mare-Longue (ML) sites; the largest value is found for ML-150. The site of Bélouve (BF) with L A I ¯ = 5.1 appears to be isolated from the other endemic forest sites ( L A I ¯ = 7.8 for ML-150). Indeed, although the ML and BF sites shelter the densest and most native tropical forests of the island, they are located at very different altitudes. The BF forest is characterized by a soil composed of little mineralized organic material, as limited by the temperature conditions. This can contribute to a limitation of nutrient supplies, as shown by Tanner et al. [55] for tropical mountain rain forests of Hawaii, Costa Rica and Colombia, which grow mainly on a lava substrate. The previous coarse separation of forest biomes confirms the work of Strasberg et al. [23].
Figure 11. Mean (dot) and standard deviations (line segments) of forest LiDAR-derived LAI against the canopy height (CH) for the seven sites: coastal (CT), Tamarind (TM), Cryptomeria (CM), Bélouve (BF) and Mare-Longue (ML-150, -250 and -550) sites. Measurements with CH < 5 m are not considered.
Remotesensing 08 00043 g011

4. Conclusions

Airborne LiDAR measurements conducted in May 2014 over several tropical forest sites of Réunion Island allow one to clearly identify the different types of coverage thanks to key parameters derived from airborne LiDAR measurements: the canopy height (CH), the forest LAI and the vertical profiles of the apparent foliage (Fapp), introduced in previous works (e.g., [37]), but evaluated without measuring ground and vegetation reflectance values.
LiDAR-derived CH histograms have been compared to the tree top height (TTH) measured during in situ censuses. The CH and TTH statistical values (mean, median, maximal values and standard deviation (SD)) are shown to be in agreement, where it is possible for an operator to distinguish the tree top from the ground (e.g., Cryptomeria site). We derived the LAI from LiDAR measurements alone. The LiDAR- and MODIS-derived LAI are shown to be in good agreement. The LiDAR-derived LAI values are also in the range of usual values regarding previous results published in the scientific literature.
We have shown that the simultaneous use of LiDAR-derived CH and LAI is sufficient to coarsely classify forests of Réunion Island. The endemic and exotic forests are well distinguished. Hence, we can recommend airborne LiDAR measurements as a relevant means for studying forest where ground-based observations are scarce and difficult to obtain. Besides this main result, this study gives new technical insights on the capability of LiDAR to penetrate through dense forest, on the choice of the laser footprint and spatial sampling, taking into account the forest heterogeneity, and on the retrieval of the LAI, in complementarity with the method of Tang at al. [21].
Finally, this campaign was an opportunity to compose an original and diverse LiDAR database that will help further works on remote sensing of tropical forests, mainly for the inter-annual evolution of the forest cover of Réunion Island, which is a rich United-European (French) diverse tropical ecosystem listed as World Heritage by UNESCO.

Acknowledgments

The experiments have been funded by the Centre National d’Etudes Spatiales (CNES), the Commissariat à l’Energie Atomique et aux Energies Alternatives (CEA) and the Université de la Réunion through the federation Observatoire des Milieux Naturels et des Changements Globaux (OMNCG) of the Observatoire des Sciences de l’Univers de la Réunion (OSU-R). We are also grateful for the support offered by the Direction Générale de l’Armement (DGA) and the Institut Pierre Simon Laplace (IPSL). We thank J.-C. Notter (Parc National de la Réunion) for providing the digital terrain model. We also thank F. Maignan (LSCE), C. Bacour (LSCE) and G. Dedieu (Centre d’Etudes Spatiales de la BIOsphère) for useful discussions and F. Toussaint for planning and performing the ULA flights.

Author Contributions

All authors contributed significantly to this manuscript. Xiaoxia Shang wrote the manuscript draft with contributions from Patrick Chazette. Xiaoxia Shang and Patrick Chazette analyzed the data. All authors performed the experiments. Patrick Chazette directed the experiments. All authors revised the manuscript draft and provided valuable suggestions for the revision.

Conflicts of Interest

The authors declare no conflict of interest.

References

  1. Franklin, S.E.; Hall, R.J.; Moskal, L.M.; Maudie, A.J.; Lavigne, M.B. Incorporating texture into classification of forest species composition from airborne multispectral images. Int. J. Remote Sens. 2000, 21, 61–79. [Google Scholar] [CrossRef]
  2. Popescu, S.C.; Wynne, R.H.; Scrivani, J.A. Fusion of small-footprint LiDAR and multispectral data to estimate plot- level volume and biomass in deciduous and pine forests in Virginia, USA. Soc. Am. For. 2001, 50, 551–565. [Google Scholar]
  3. Etteieb, S.; Louhaichi, M.; Kalaitzidis, C.; Gitas, I.Z. Mediterranean forest mapping using hyper-spectral satellite imagery. Arab. J. Geosci. 2012, 6, 5017–5032. [Google Scholar] [CrossRef]
  4. Hilton, F.; Armante, R.; August, T.; Barnet, C.; Bouchard, A.; Camy-Peyret, C.; Capelle, V.; Clarisse, L.; Clerbaux, C.; Coheur, P.-F.; et al. Hyperspectral earth observation from IASI: Five years of accomplishments. Bull. Am. Meteorol. Soc. 2012, 93, 347–370. [Google Scholar] [CrossRef]
  5. Huesca, M.; Merino-de-Miguel, S.; Gonzalez-Alonso, F.; Martinez, S.; Miguel Cuevas, J.; Calle, A. Using AHS hyper-spectral images to study forest vegetation recovery after a fire. Int. J. Remote Sens. 2013, 34, 4025–4048. [Google Scholar] [CrossRef]
  6. Hyde, P.; Dubayah, R.; Walker, W.; Blair, J.B.; Hofton, M.; Hunsaker, C. Mapping forest structure for wildlife habitat analysis using multi-sensor (LiDAR, SAR/InSAR, ETM+, Quickbird) synergy. Remote Sens. Environ. 2006, 102, 63–73. [Google Scholar] [CrossRef]
  7. Beets, P.N.; Reutebuch, S.; Kimberley, M.O.; Oliver, G.R.; Pearce, S.H.; McGaughey, R.J. Leaf Area Index, biomass carbon and growth rate of radiata pine genetic types and relationships with LiDAR. Forests 2011, 2, 637–659. [Google Scholar] [CrossRef]
  8. Parker, G.G.; Harding, D.J.; Berger, M.L. A portable LiDAR system for rapid determination of forest canopy structure. J. Appl. Ecol. 2004, 41, 755–767. [Google Scholar] [CrossRef]
  9. Jupp, D.L.B.; Culvenor, D.S.; Lovell, J.L.; Newnham, G.J.; Strahler, A.H.; Woodcock, C.E. Estimating forest LAI profiles and structural parameters using a ground-based laser called “Echidna”. Tree Phys. 2009, 29, 171–181. [Google Scholar] [CrossRef] [PubMed]
  10. Yang, X.; Strahler, A.H.; Schaaf, C.B.; Jupp, D.L.B.; Yao, T.; Zhao, F.; Wang, Z.; Culvenor, D.S.; Newnham, G.J.; Lovell, J.L.; et al. Three-dimensional forest reconstruction and structural parameter retrievals using a terrestrial full-waveform LiDAR instrument (Echidna®). Remote Sens. Environ. 2013, 135, 36–51. [Google Scholar] [CrossRef]
  11. Greaves, H.E.; Vierling, L.A.; Eitel, J.U.H.; Boelman, N.T.; Magney, T.S.; Prager, C.M.; Griffin, K.L. Estimating aboveground biomass and leaf area of low-stature Arctic shrubs with terrestrial LiDAR. Remote Sens. Environ. 2015, 164, 26–35. [Google Scholar] [CrossRef]
  12. Dassot, M.; Constant, T.; Fournier, M. The use of terrestrial LiDAR technology in forest science: Application fields, benefits and challenges. Ann. For. Sci. 2011, 68, 959–974. [Google Scholar] [CrossRef]
  13. Asner, G.P.; Mascaro, J.; Muller-Landau, H.C.; Vieilledent, G.; Vaudry, R.; Rasamoelina, M.; Hall, J.S.; Breugel, M. A universal airborne LiDAR approach for tropical forest carbon mapping. Oecologia 2012, 168, 1147–1160. [Google Scholar] [CrossRef] [PubMed]
  14. Asner, G.P.; Powell, G.V.N.; Mascaro, J.; Knapp, D.E.; Clark, J.K.; Jacobson, J.; Kennedy-Bowdoin, T.; Balaji, A.; Paez-Acosta, G.; Victoria, E.; et al. High-resolution forest carbon stocks and emissions in the Amazon. Proc. Natl. Acad. Sci. USA 2010, 107, 16738–16742. [Google Scholar] [CrossRef] [PubMed]
  15. Leitold, V.; Keller, M.; Morton, D.C.; Cook, B.D.; Shimabukuro, Y.E. Airborne LiDAR-based estimates of tropical forest structure in complex terrain: Opportunities and trade-offs for REDD+. Carbon Balance Manag. 2015, 10. [Google Scholar] [CrossRef] [PubMed]
  16. Drake, J.B.; Dubayah, R.O.; Clark, D.B.; Knox, R.G.; Blair, J.B.; Hofton, M.A.; Chazdon, R.L.; Weishampel, J.F.; Prince, S. Estimation of tropical forest structural characteristics using large-footprint LiDAR. Remote Sens. Environ. 2002, 79, 305–319. [Google Scholar] [CrossRef]
  17. Dubayah, R.O.; Sheldon, S.L.; Clark, D.B.; Hofton, M.A.; Blair, J.B.; Hurtt, G.C.; Chazdon, R.L. Estimation of tropical forest height and biomass dynamics using LiDAR remote sensing at La Selva, Costa Rica. J. Geophys. Res. 2010, 115. [Google Scholar] [CrossRef]
  18. Cuesta, J.; Chazette, P.; Allouis, T.; Flamant, P.H.; Durrieu, S.; Sanak, J.; Genau, P.; Guyon, D.; Loustau, D.; Flamant, C. Observing the forest canopy with a new ultra-violet compact airborne LiDAR. Sensors 2010, 10, 7386–7403. [Google Scholar] [CrossRef] [PubMed]
  19. Shang, X.; Chazette, P. Interest of a full-waveform flown UV LiDAR to derive forest vertical structures and aboveground carbon. Forests 2014, 5, 1454–1480. [Google Scholar] [CrossRef]
  20. Blair, J.B.; Rabine, D.L.; Hofton, M.A. The laser vegetation imaging sensor: A medium-altitude, digitisation-only, airborne laser altimeter for mapping vegetation and topography. ISPRS J. Photogramm. Remote Sens. 1999, 54, 115–122. [Google Scholar] [CrossRef]
  21. Tang, H.; Dubayah, R.; Swatantran, A.; Hofton, M.; Sheldon, S.; Clark, D.B.; Blair, B. Retrieval of vertical LAI profiles over tropical rain forests using waveform LiDAR at La Selva, Costa Rica. Remote Sens. Environ. 2012, 124, 242–250. [Google Scholar] [CrossRef]
  22. Tang, H.; Brolly, M.; Zhao, F.; Strahler, A.H.; Schaaf, C.L.; Ganguly, S.; Zhang, G.; Dubayah, R. Deriving and validating Leaf Area Index (LAI) at multiple spatial scales through LiDAR remote sensing: A case study in Sierra National Forest, CA. Remote Sens. Environ. 2014, 143, 131–141. [Google Scholar] [CrossRef]
  23. Strasberg, D.; Rouget, M.; Richardson, D.M.; Baret, S.; Dupont, J.; Cowling, R.M. An assessment of habitat diversity and transformation on La Réunion Island (Mascarene Islands, Indian Ocean) as a Basis for Identifying Broad-scale Conservation Priorities. Biodivers. Conserv. 2005, 14, 3015–3032. [Google Scholar] [CrossRef]
  24. Cadet, T.; Figier, J. Réserve Naturelle de Mare-Longue: Etude Floristique et Ecologique; Université de la Réunion: Saint-Denis, France, 1989. [Google Scholar]
  25. Strasberg, D. Diversity, size composition and spatial aggregation among trees on a 1-ha rain forest plot at La Réunion. Biodivers. Conserv. 1996, 5, 825–840. [Google Scholar] [CrossRef]
  26. Shang, X.; Chazette, P. End-to-end simulation for a forest-dedicated full-waveform LiDAR onboard a satellite initialized from airborne ultraviolet LiDAR experiments. Remote Sens. 2015, 7, 5222–5255. [Google Scholar] [CrossRef]
  27. Lefsky, M.A.; Harding, D.; Cohen, W.B.; Parker, G.; Shugart, H.H. Surface LiDAR remote sensing of basal area and biomass in deciduous forests of eastern Maryland, USA. Remote Sens. Environ. 1999, 67, 83–98. [Google Scholar] [CrossRef]
  28. Drake, J.B.; Dubayah, R.O.; Knox, R.G.; Clark, D.B.; Blair, J.B. Sensitivity of large-footprint LiDAR to canopy structure and biomass in a neotropical rainforest. Remote Sens. Environ. 2002, 81, 378–392. [Google Scholar] [CrossRef]
  29. Means, J.E.; Acker, S.A.; Harding, D.J.; Blair, J.B.; Lefsky, M.A.; Cohen, W.B.; Harmon, M.E.; McKee, W.A. Use of large-footprint scanning airborne LiDAR to estimate forest stand characteristics in the western cascades of Oregon. Remote Sens. Environ. 1999, 67, 298–308. [Google Scholar] [CrossRef]
  30. Riaño, D.; Valladares, F.; Condés, S.; Chuvieco, E. Estimation of Leaf Area Index and covered ground from airborne laser scanner (LiDAR) in two contrasting forests. Agric. For. Meteorol. 2004, 124, 269–275. [Google Scholar] [CrossRef]
  31. Yang, W.; Tan, B.; Huang, D.; Rautiainen, M.; Shabanov, N.V.; Wang, Y.; Privette, J.L.; Huemmrich, K.F.; Fensholt, R.; Sandholt, I.; et al. MODIS Leaf Area Index products: From validation to algorithm improvement. IEEE Trans. Geosci. Remote Sens. 2006, 44, 1885–1898. [Google Scholar] [CrossRef]
  32. Chazette, P.; Pelon, J.; Mégie, G. Determination by spaceborne backscatter LiDAR of the structural parameters of atmospheric scattering layers. Appl. Opt. 2001, 40, 3428–3440. [Google Scholar] [CrossRef] [PubMed]
  33. Chazette, P.; Dabas, A.; Sanak, J.; Lardier, M.; Royer, P. French airborne LiDAR measurements for Eyjafjallajökull ash plume survey. Atmos. Chem. Phys. 2012, 12, 7059–7072. [Google Scholar] [CrossRef]
  34. Chazette, P.; Bocquet, M.; Royer, P.; Winiarek, V.; Raut, J.-C.; Labazuy, P.; Gouhier, M.; Lardier, M.; Cariou, J.-P. Eyjafjallajökull ash concentrations derived from both LiDAR and modeling. J. Geophys. Res. Atmos. 2012, 117. [Google Scholar] [CrossRef]
  35. Measures, R.M. Laser Remote Sensing: Fundamentals and Applications; Wiley, J., Ed.; Krieger Publishing Company: Malabar, FL, USA, 1984. [Google Scholar]
  36. Chazette, P.; David, C.; Lefrère, J.; Godin, S.; Pelon, J.; Mégie, G. Comparative LiDAR study of the optical, geometrical, and dynamical properties of stratospheric post-volcanic aerosols, following the eruptions of El Chichon and Mount Pinatubo. J. Geophys. Res. 1995, 100. [Google Scholar] [CrossRef]
  37. Ni-Meister, W.; Jupp, D.L.B.; Dubayah, R. Modeling LiDAR waveforms in heterogeneous and discrete canopies. IEEE Trans. Geosci. Remote Sens. 2001, 39, 1943–1958. [Google Scholar] [CrossRef]
  38. Ahmed, R.; Siqueira, P.; Hensley, S. A study of forest biomass estimates from LiDAR in the northern temperate forests of New England. Remote Sens. Environ. 2013, 130, 121–135. [Google Scholar] [CrossRef]
  39. Hofton, M.A.; Minster, J.B.; Blair, J.B. Decomposition of laser altimeter waveforms. IEEE Trans. Geosci. Remote Sens. 2000, 38, 1989–1996. [Google Scholar] [CrossRef]
  40. Lefsky, M.A.; Cohen, W.B.; Acker, S.A.; Parker, G.G.; Spies, T.A.; Harding, D. LiDAR remote sensing of the canopy structure and biophysical properties of Douglas-fir western hemlock forests. Remote Sens. Environ. 1999, 70, 339–361. [Google Scholar] [CrossRef]
  41. Farid, A.; Goodrich, D.C.; Bryant, R.; Sorooshian, S. Using airborne LiDAR to predict Leaf Area Index in cottonwood trees and refine riparian water-use estimates. J. Arid Environ. 2008, 72, 1–15. [Google Scholar] [CrossRef]
  42. Solberg, S.; Brunner, A.; Hanssen, K.H.; Lange, H.; Næsset, E.; Rautiainen, M.; Stenberg, P. Mapping LAI in a Norway spruce forest using airborne laser scanning. Remote Sens. Environ. 2009, 113, 2317–2327. [Google Scholar] [CrossRef]
  43. Platt, C.M.R. Remote sounding of high clouds. III: Monte Carlo calculations of multiple-scattered LiDAR returns. J. Atmos. Sci. 1981, 38, 156–167. [Google Scholar] [CrossRef]
  44. Berthier, S.; Chazette, P.; Couvert, P.; Pelon, J.; Dulac, F.; Thieuleux, F.; Moulin, C.; Pain, T. Desert dust aerosol columnar properties over ocean and continental Africa from LiDAR in-Space Technology Experiment (LITE) and Meteosat synergy. J. Geophys. Res. 2006, 111, D21202. [Google Scholar] [CrossRef]
  45. Chen, J.M.; Rich, P.M.; Gower, S.T.; Norman, J.M.; Plummer, S. Leaf Area Index of boreal forests: Theory, techniques, and measurements. J. Geophys. Res. 1997, 102, 29429–29443. [Google Scholar] [CrossRef]
  46. Leroy, M.; Deuzé, J.L.; Bréon, F.M.; Hautecoeur, O.; Herman, M.; Buriez, J.C.; Tanré, D.; Bouffiès, S.; Chazette, P.; Roujean, J.L. Retrieval of atmospheric properties and surface bidirectional reflectances over land from POLDER/ADEOS. J. Geophys. Res. 1997, 102, 17023–17037. [Google Scholar] [CrossRef]
  47. He, L.; Chen, J.M.; Pisek, J.; Schaaf, C.B.; Strahler, A.H. Global clumping index map derived from the MODIS BRDF product. Remote Sens. Environ. 2012, 119, 118–130. [Google Scholar] [CrossRef]
  48. Parker, G.G.; Lefsky, M.A.; Harding, D.J. Light transmittance in forest canopies determined using airborne laser altimetry and in-canopy quantum measurements. Remote Sens. Environ. 2001, 76, 298–309. [Google Scholar] [CrossRef]
  49. Gower, S.T.; Norman, J.M. Rapid estimation of Leaf Area Index in conifer and broad-leaf plantations. Ecology 1991, 72, 1896. [Google Scholar] [CrossRef]
  50. Ellsworth, D.S.; Reich, P.B. Canopy structure and vertical patterns of photosynthesis and related leaf traits in a deciduous forest. Oecologia 1993, 96, 169–178. [Google Scholar] [CrossRef]
  51. Knyazikhin, Y.; Glassy, J.; Privette, J.L.; Tian, Y.; Lotsch, A.; Zhang, Y.; Wang, Y.; Morisette, J.T.; Votava, P.; Myneni, R.B.; et al. MODIS Leaf Area Index (LAI) and fraction of photosynthetically active radiation absorbed by vegetation (FPAR) product (MOD15). Algorithm Theor. Basis Doc. 1999, 4, 1–14. [Google Scholar]
  52. Doughty, C.E.; Goulden, M.L. Seasonal patterns of tropical forest Leaf Area Index and CO2 exchange. J. Geophys. Res. 2008, 113, G00B06. [Google Scholar]
  53. Cristiano, P.; Madanes, N.; Campanello, P.; Francescantonio, D.; Rodríguez, S.; Zhang, Y.-J.; Carrasco, L.; Goldstein, G. High NDVI and potential canopy photosynthesis of South American subtropical forests despite seasonal changes in Leaf Area Index and air temperature. Forests 2014, 5, 287–308. [Google Scholar] [CrossRef]
  54. Asner, G.P.; Scurlock, J.M.O.; Hicke, J. Global synthesis of Leaf Area Index observations: Implications for ecological and remote sensing studies. Glob. Ecol. Biogeogr. 2003, 12, 191–205. [Google Scholar] [CrossRef]
  55. Tanner, E.V.J.; Vitousek, P.M.; Cuevas, E. Experimental investigation of nutrient limitation of forest growth on wet tropical mountains. Ecology 1998, 79, 10–22. [Google Scholar] [CrossRef]

