Figure 1.
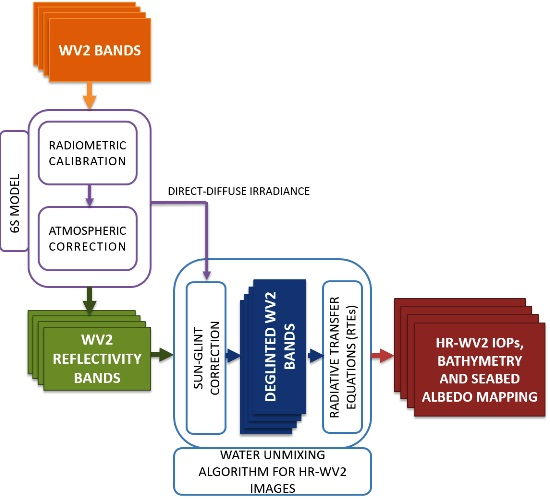
Schematic procedure of the proposed multispectral high resolution WorldView-2 processing chain for shallow coastal waters applications.
In the following sections, the remote sensing data used in the analysis and the different modules are presented in detail.
2.1. WorldView-2 Multispectral Imagery and Study Area
This study is based on Ortho Ready Standard WV-2 imagery, resampled to 2.0 m spatial resolution, using 11-bit data in eight spectral bands: coastal (400–450 nm), blue (450–510 nm), green (510–580 nm), yellow (585–625 nm), red (630–690 nm), red edge (705–745 nm), NIR1 (770–895 nm), and NIR2 (860–1040 nm). At nadir, the collected nominal ground sample distance is 0.46 m (panchromatic) and 1.84 m (multispectral). The nominal swath width is 16.4 km. This implies that WV-2 and the new WV-3 (with spatial resolution of 0.31 m and 1.24 m) satellites provide finer spatial resolution and more spectral information in the visible spectrum than previous satellites, positioning them as the forerunner for oceanographic parameters mapping.
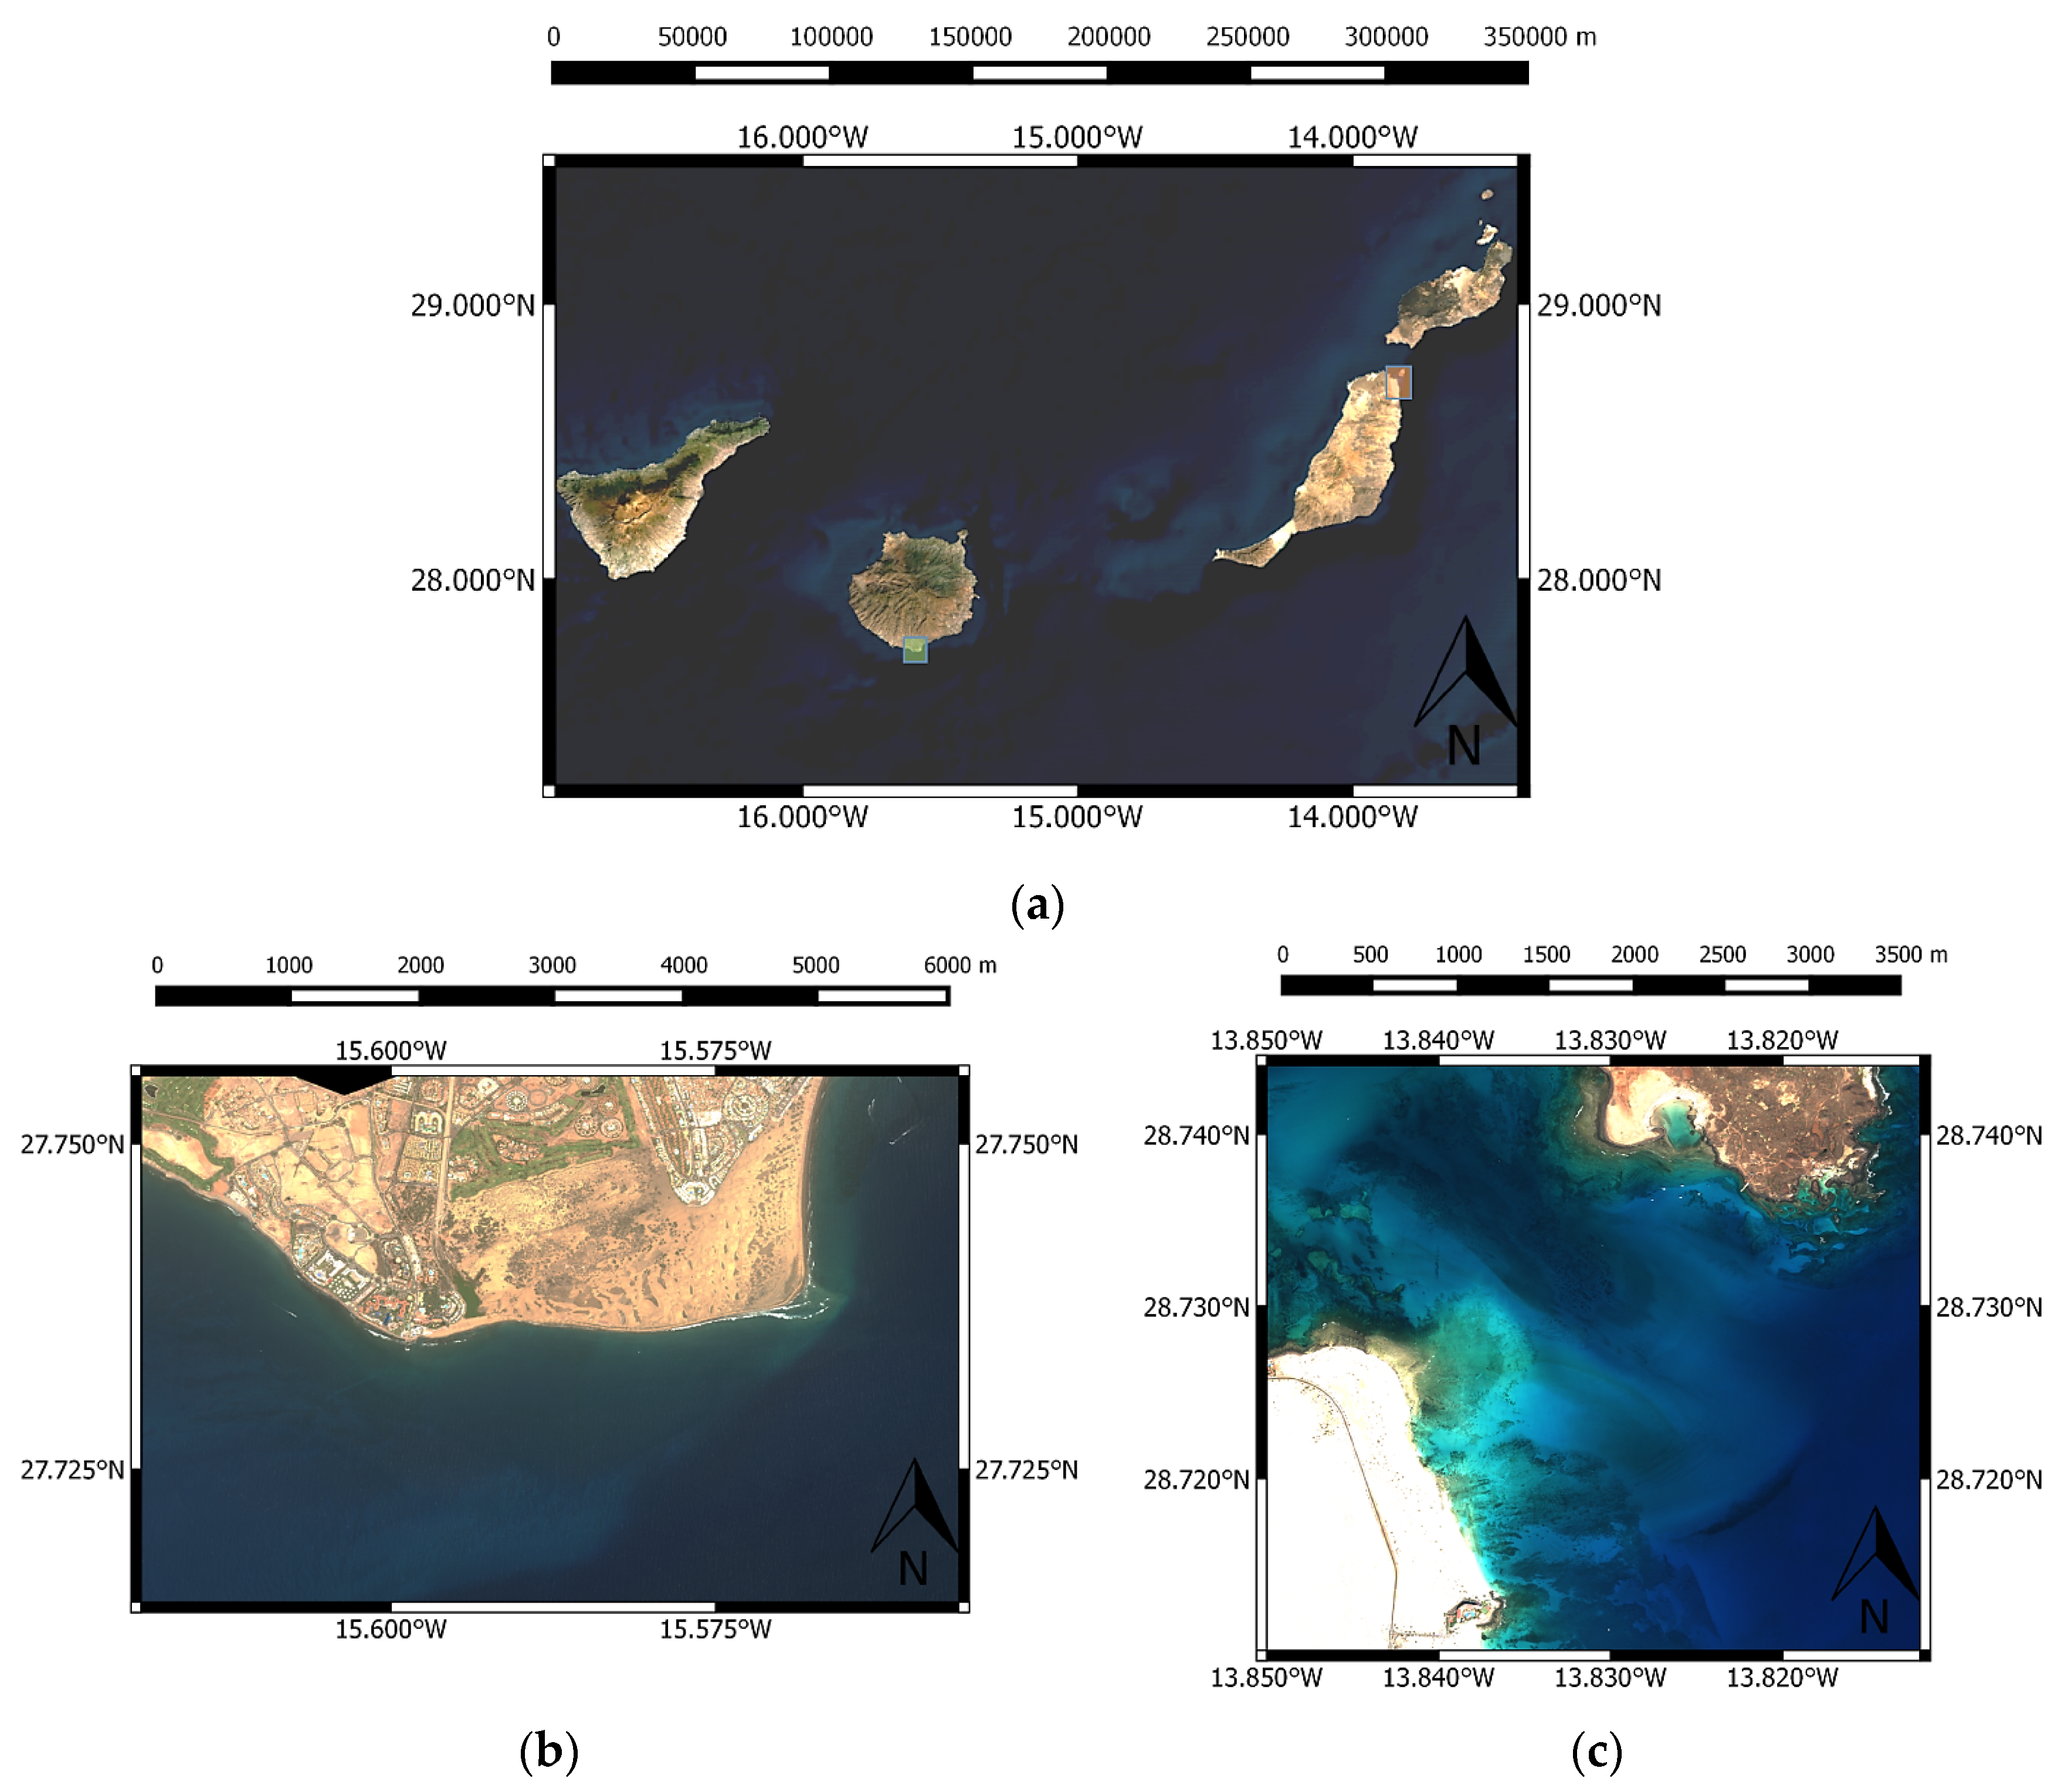
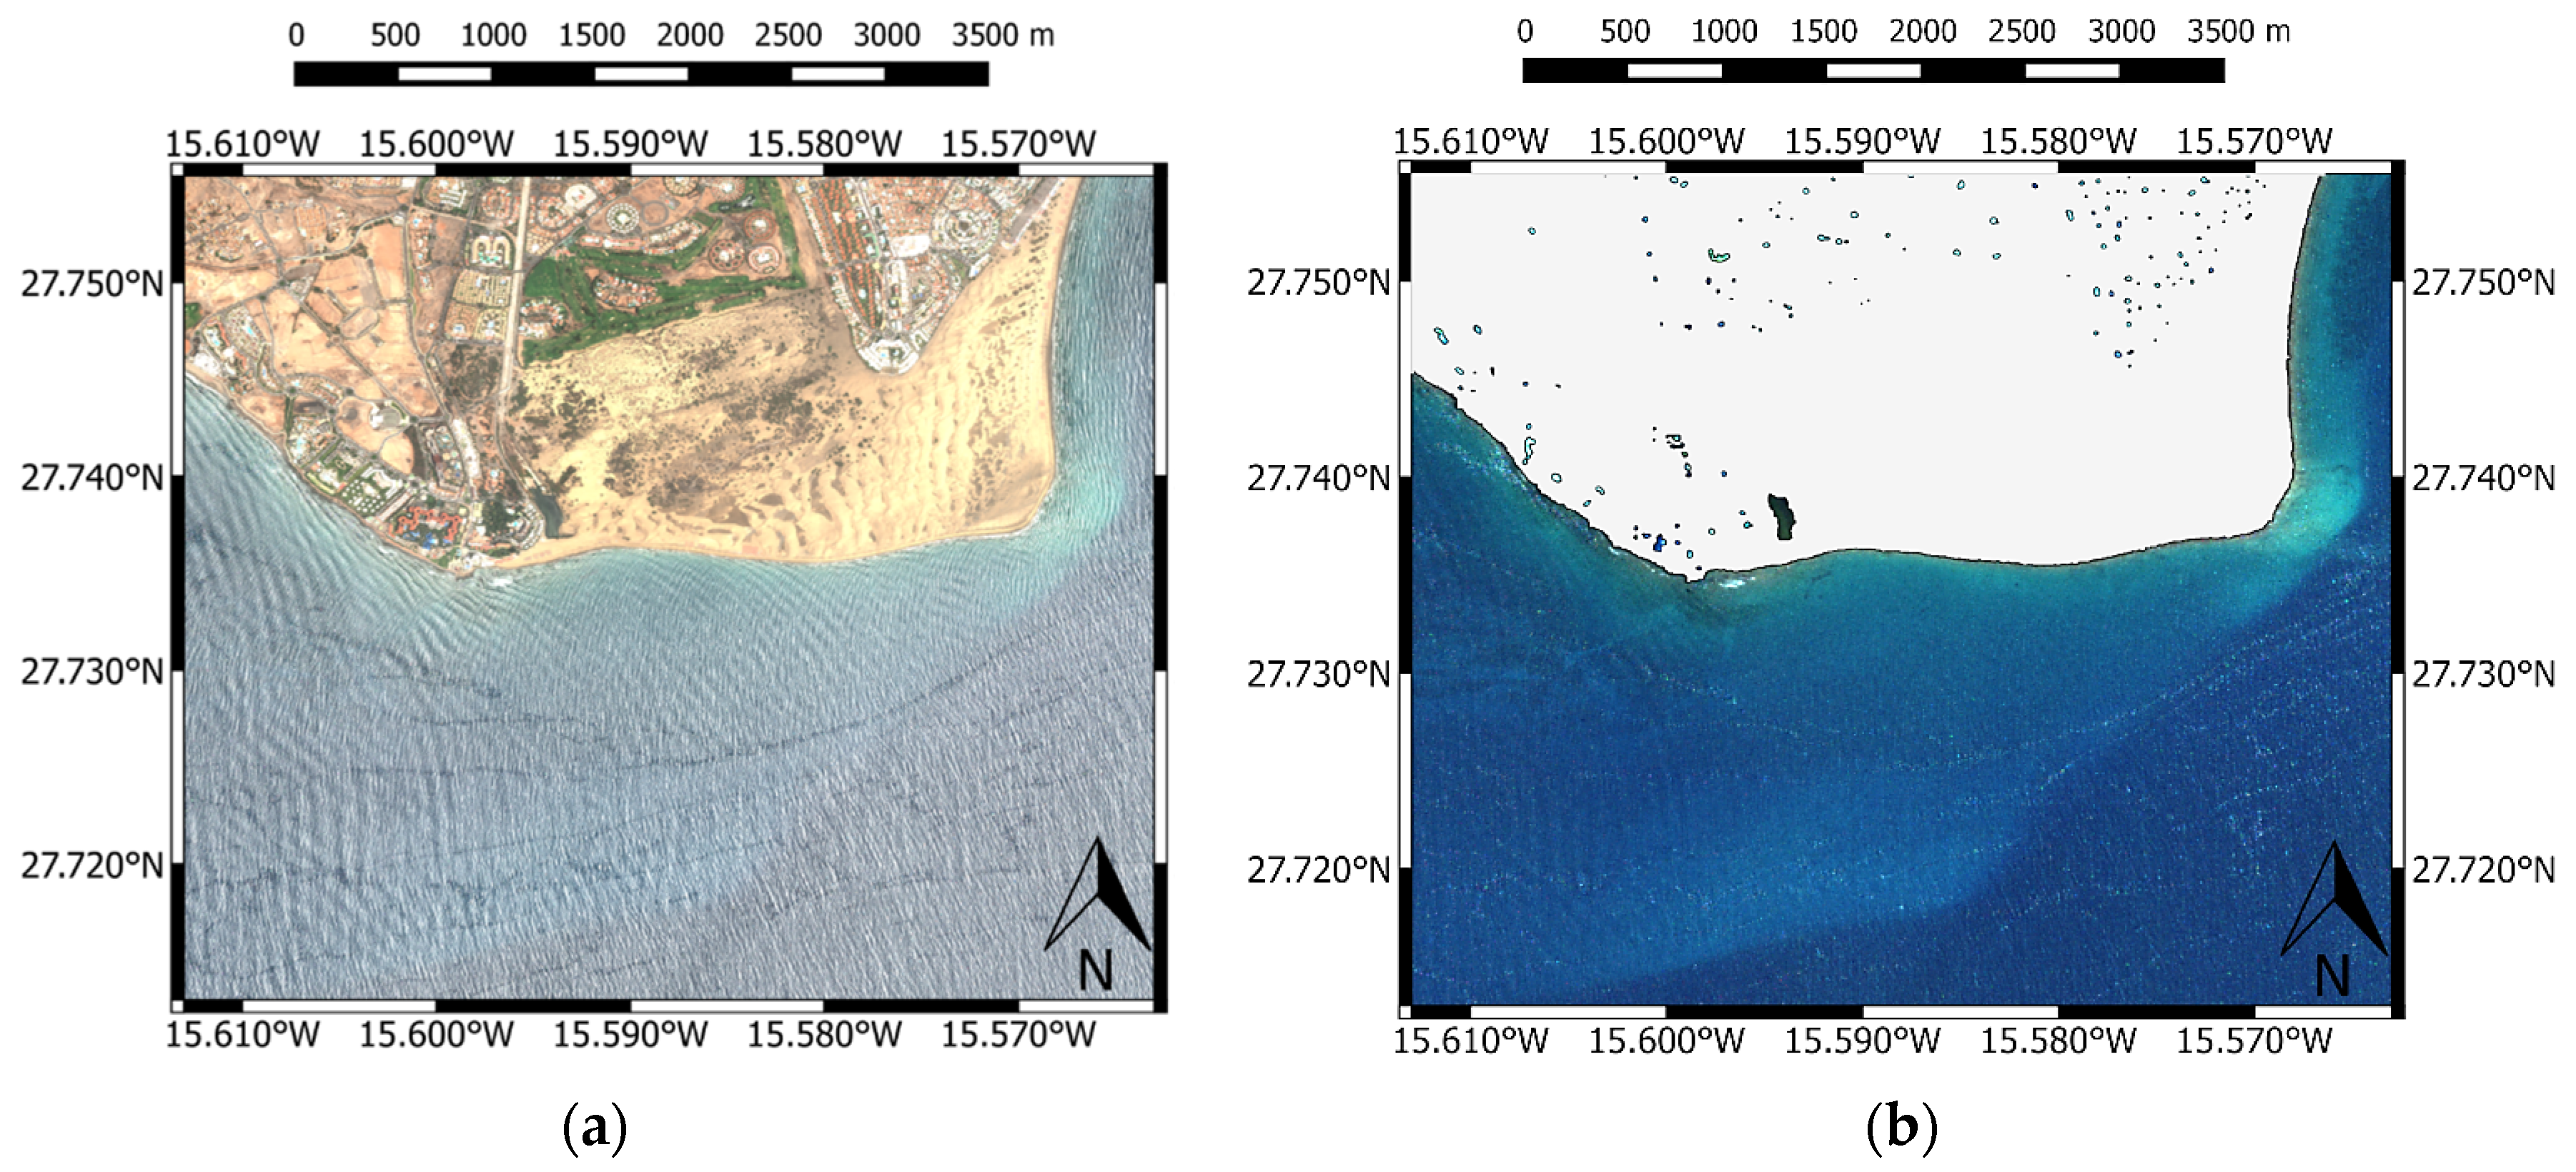
The study area selected is the Canary Islands coastal environment, off the northwest African coast, as shown in
Figure 2. In addition, in
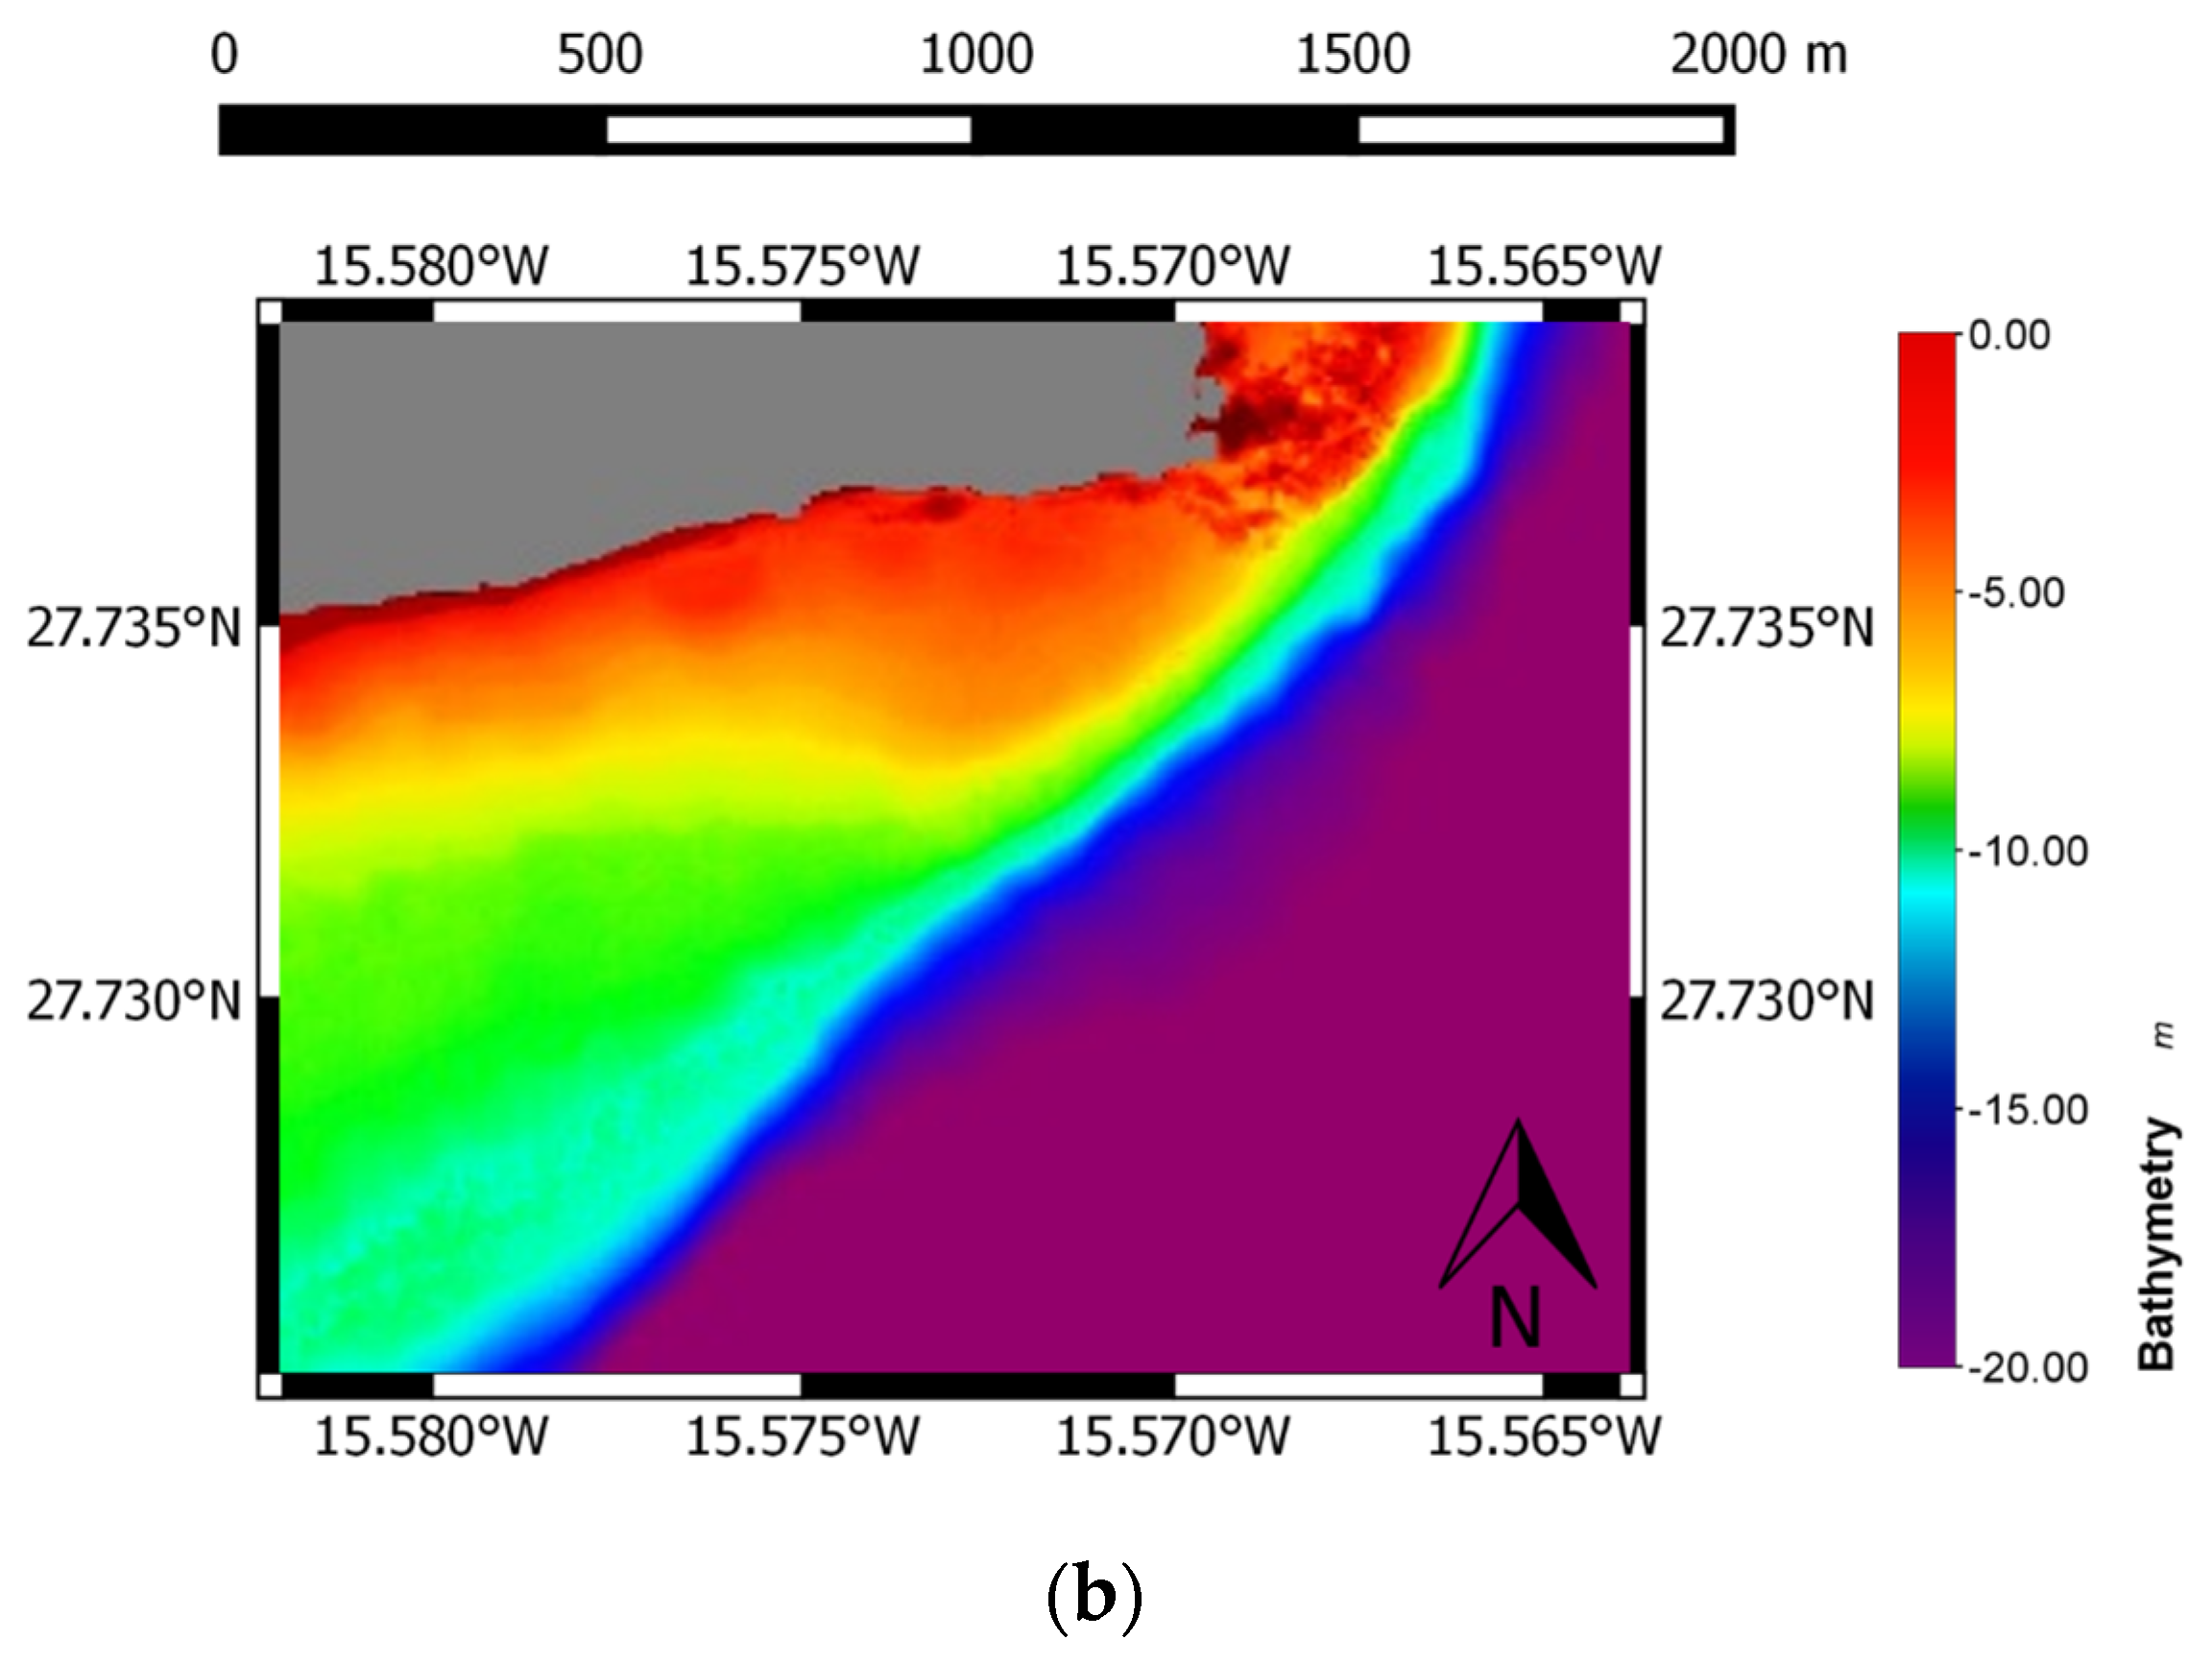
Figure 2, two high resolution Ortho Ready Standard images acquired by WorldView-2 satellite of two different Canary Islands coastal areas, Maspalomas (Gran Canaria Island) and Corralejo-Lobo Island (Fuerteventura Island), are presented. The Natural Reserve of the Dunes of Maspalomas, which covers an area of approximately 403.9 hectares, consists of three ecosystems: Palmeral, La Charca Lake, and the Dunes. This natural resource extends into the sea creating a perfect habitat for the seagrass beds, which have a great importance in the biodiversity of the Canary Islands coast.
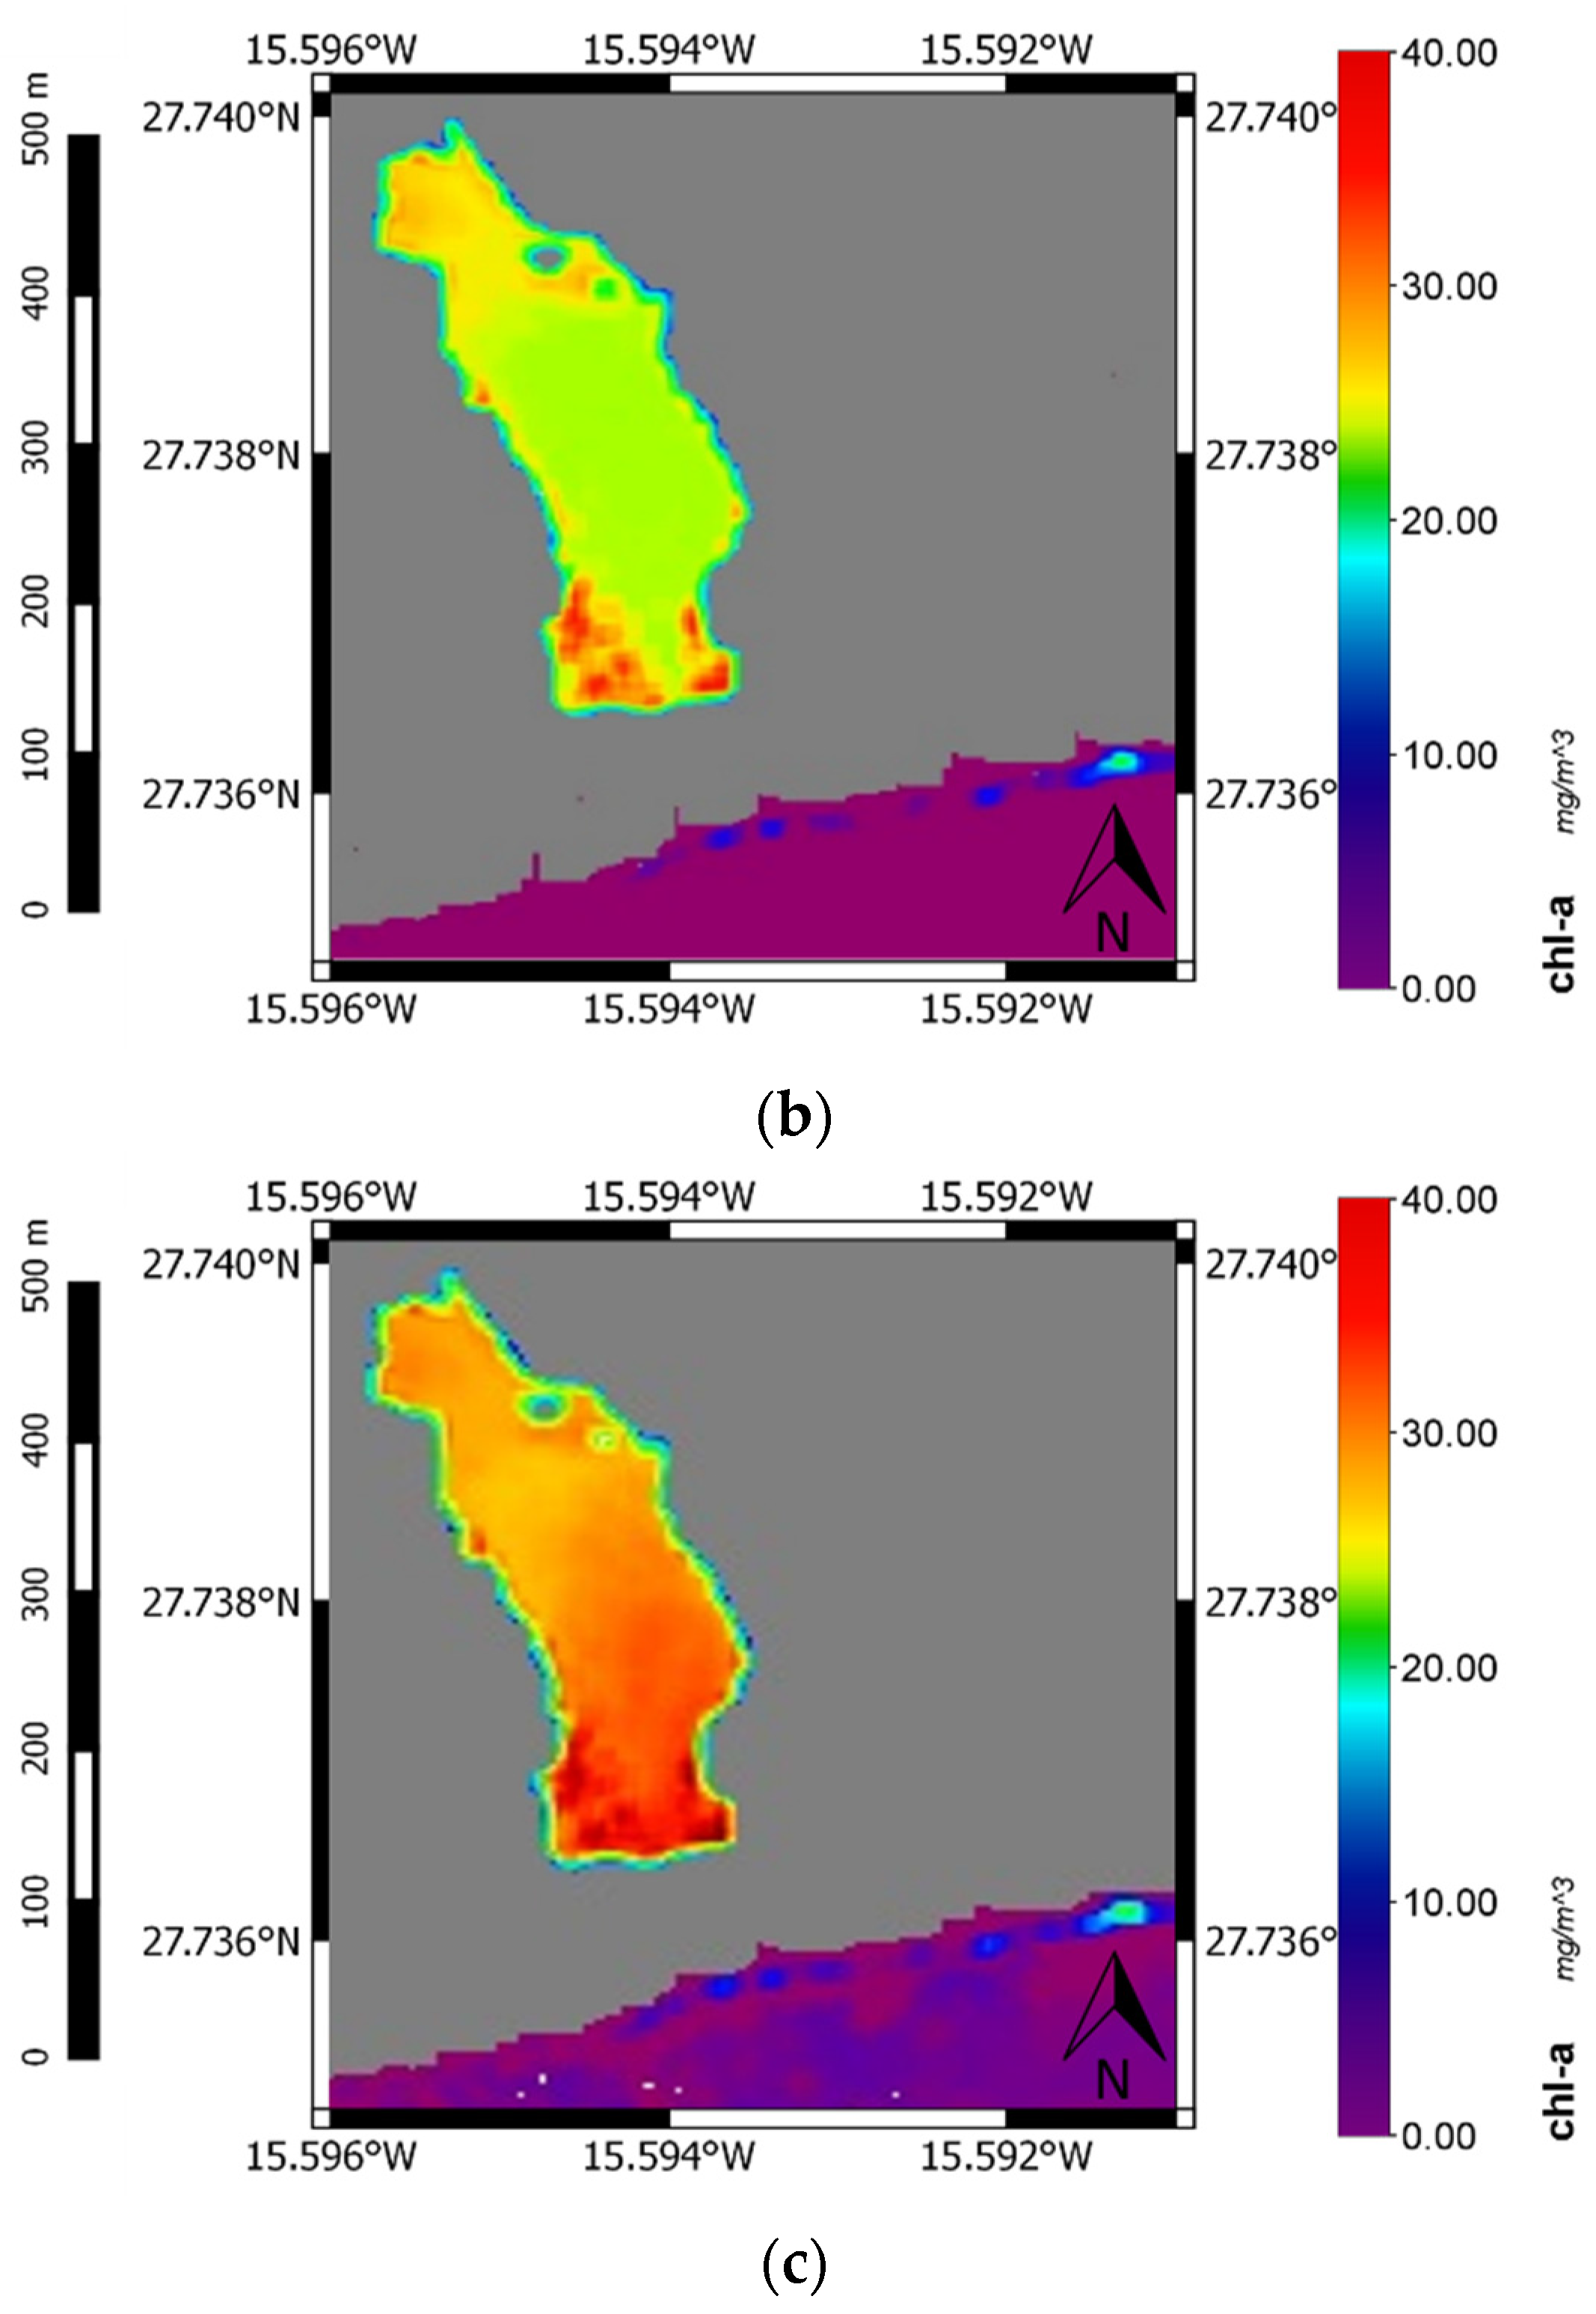
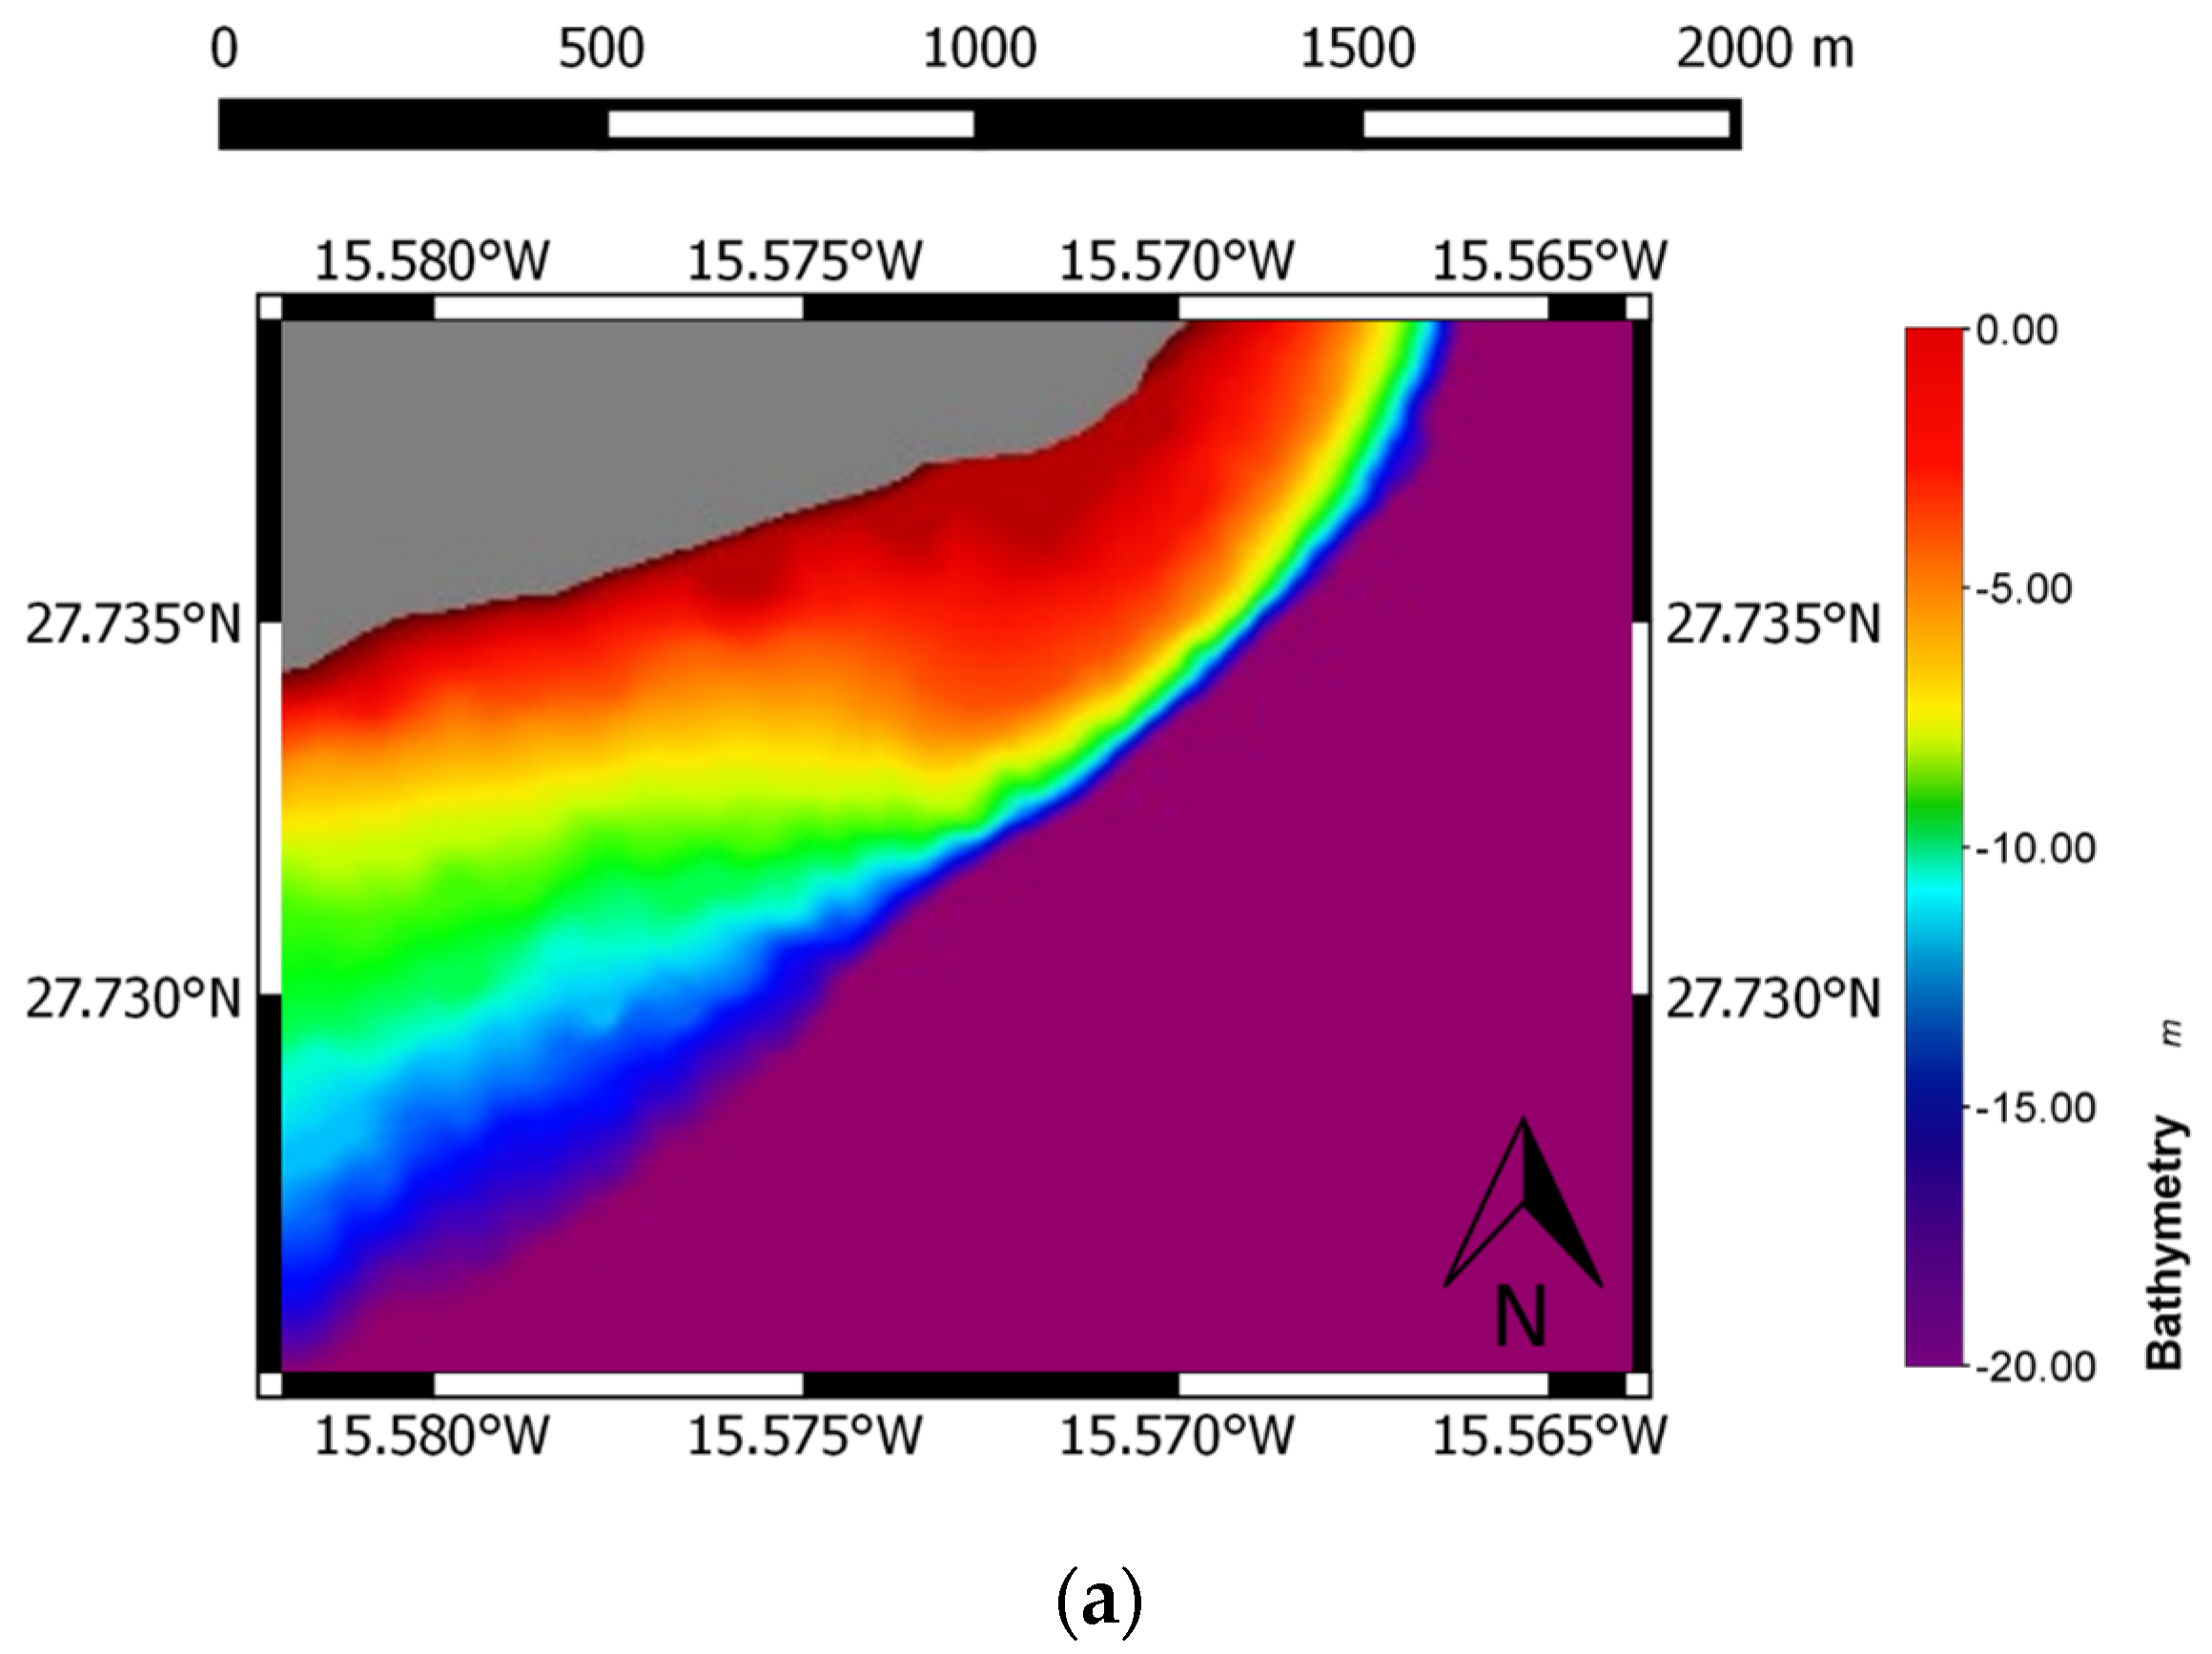
Figure 2.
(a) Location of study area (The Canary Islands); (b,c) WV-2 images of two Canary Islands singular littoral zones: (b) Maspalomas (Gran Canaria Island, 11 August 2013) area; and (c) Corralejo-Lobo Island (Fuerteventura Island, 28 October 2010) area.
Figure 2.
(a) Location of study area (The Canary Islands); (b,c) WV-2 images of two Canary Islands singular littoral zones: (b) Maspalomas (Gran Canaria Island, 11 August 2013) area; and (c) Corralejo-Lobo Island (Fuerteventura Island, 28 October 2010) area.
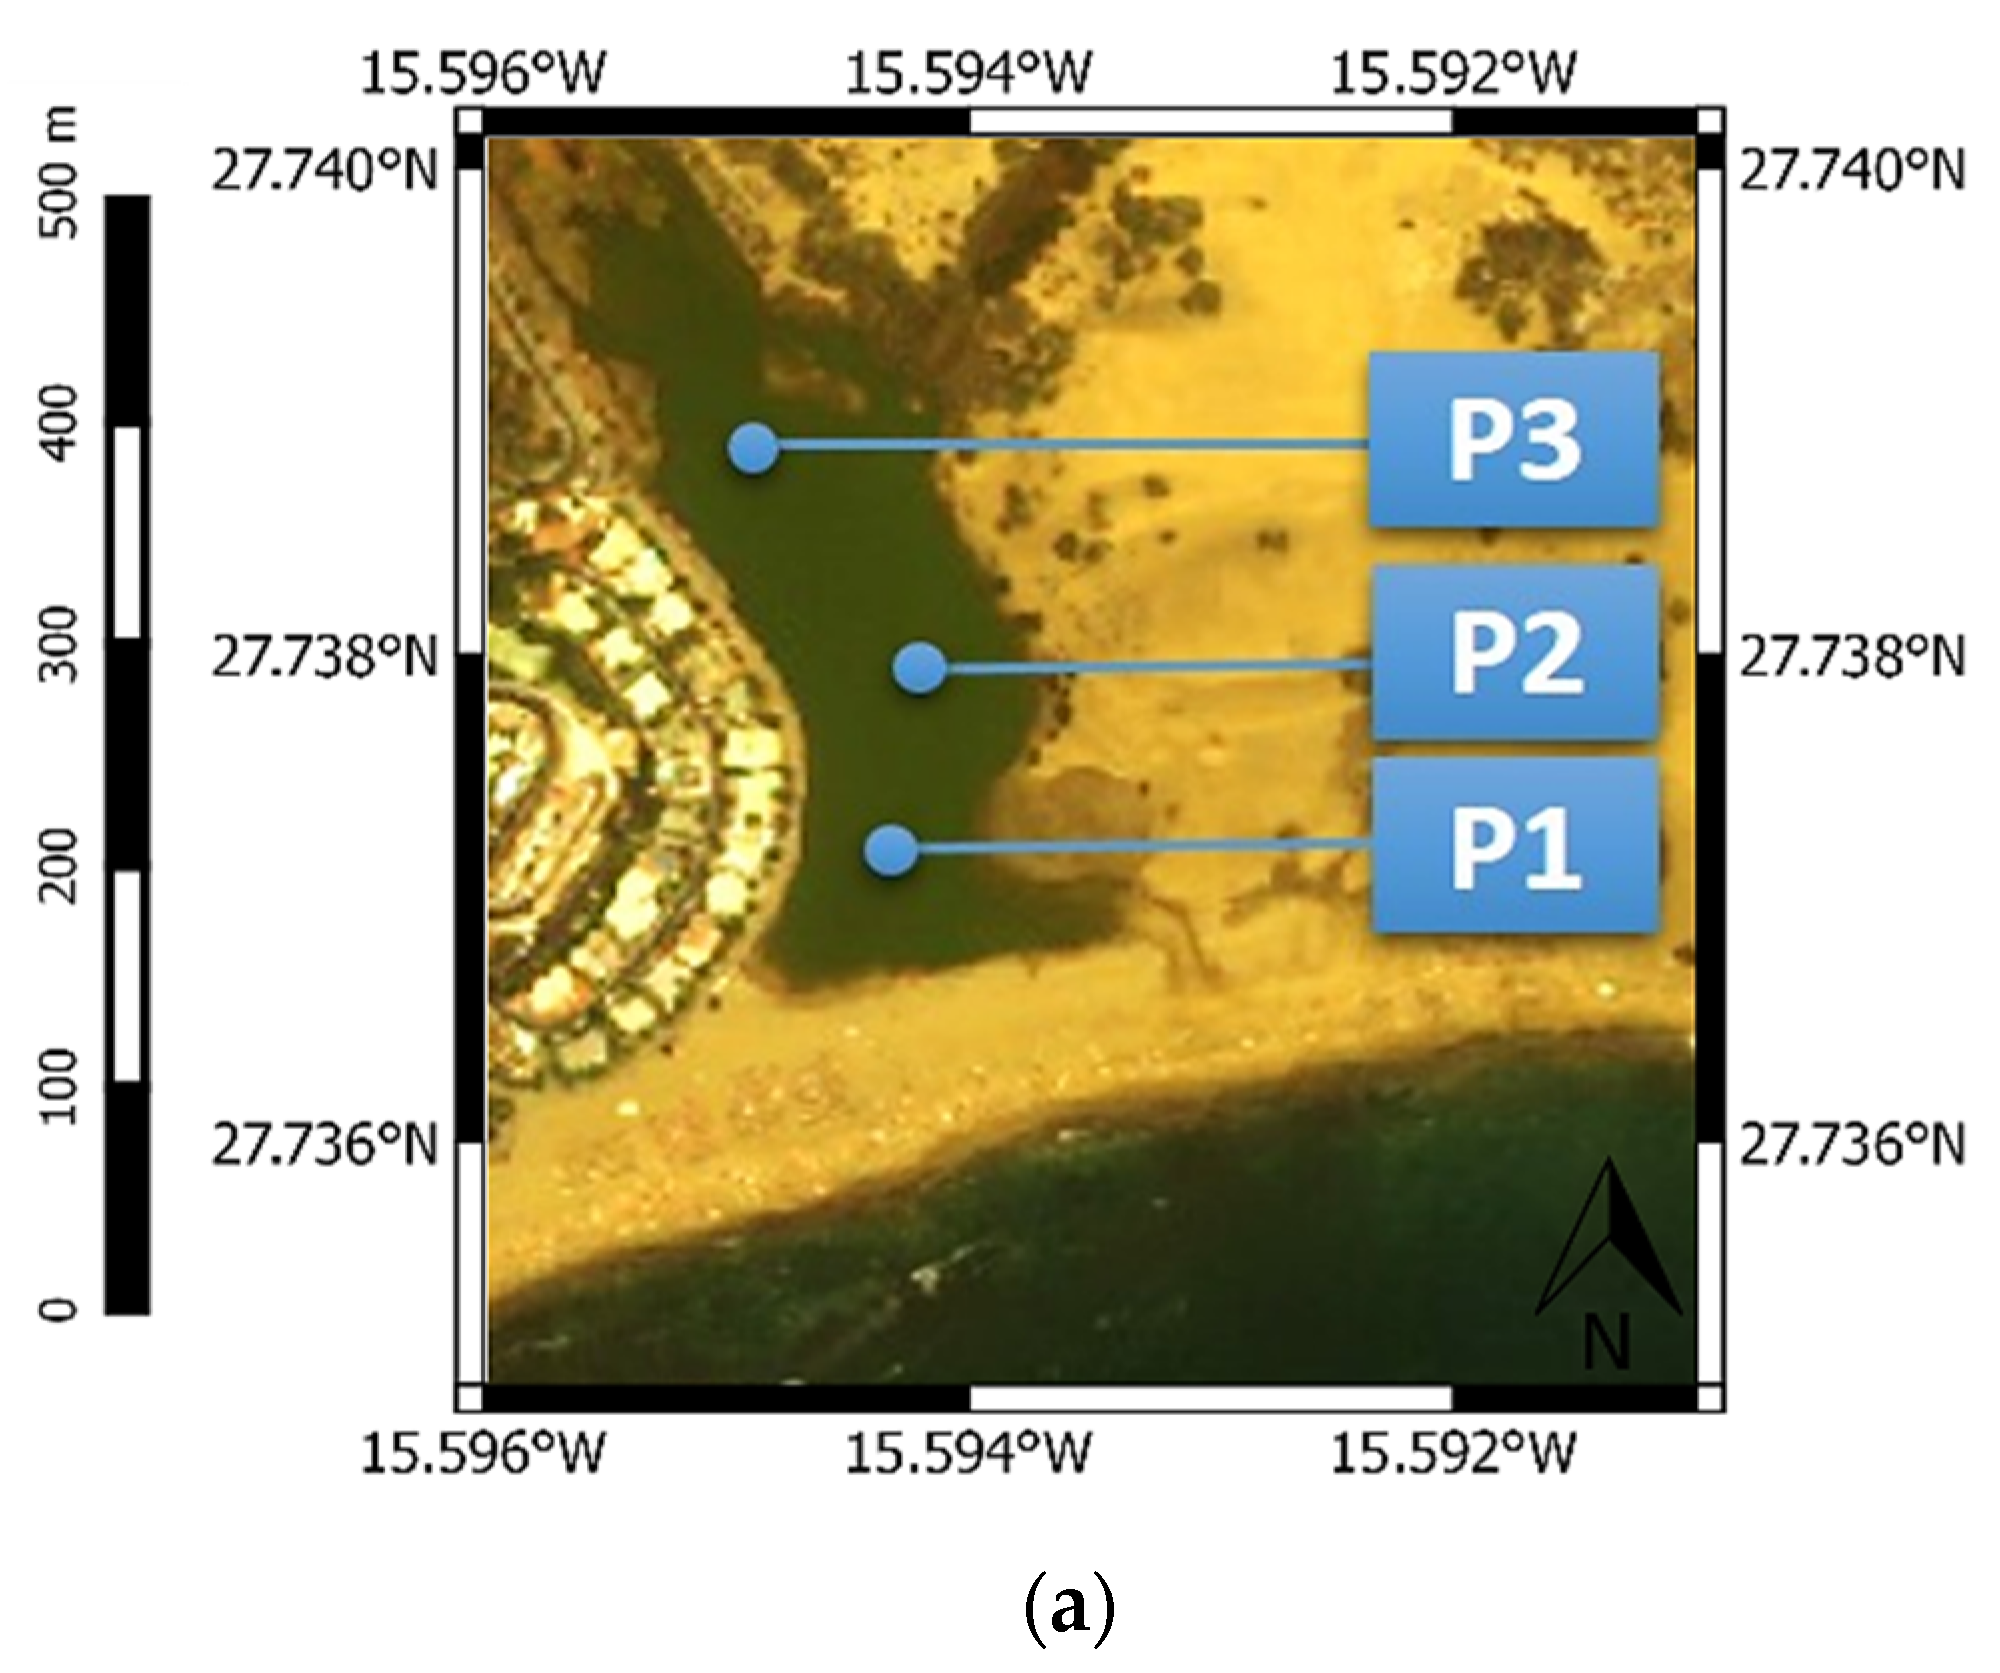
In order to validate the results obtained in the surface reflectance, after the atmospheric correction, a spectroradiometer was used for an in situ sampling. Specifically, the ADS Fieldspec 3 instrument was recording the in situ reflectance above the sea water in the optical and NIR bands. Likewise, the water quality of the Maspalomas coast and La Charca Lake has been sampled in order to obtain phytoplankton, turbidity, and CDOM concentrations.
2.3. Sun Glint Multispectral Data Correction Algorithm
Specular reflection of direct sun light on water surfaces is a serious inconvenience for the retrieval of water quality, bathymetry and seafloor mapping in shallow-water environments. In the last decades, glint correction methods have been developed for open ocean imaging and higher resolution coastal applications [
5,
10]. These techniques are based on the assumption the near-infrared (NIR) radiation of deep water zones is negligible and, in consequence, NIR bands give an indication of the amount of glint in the received signal. To correct it, the spectrum for a deep water part of the image is manually selected and used to establish the relationship between the NIR and glint radiances, as reviewed in [
5].
In our previous study [
4], we followed the common procedure suggested by [
5]. As indicated, one or more regions of the image are selected where a range of sun glint is evident, but where the underlying spectral brightness would be expected to be consistent,
i.e., areas of deep and clear water. For each visible band, all the selected pixels are included in a linear regression (
bi) of NIR brightness against the visible band brightness, as follows,
where
is the surface reflectance;
is the remote sensing reflectance;
is the deglinted remote sensing reflectance;
is the minima NIR reflectance of the areas;
is the subsurface remote sensing reflectance;
and
are coefficients, based on Hydrolight simulations [
10], which depend on the zenithal angle [
11],
= (0° = 0.5236, 30° = 0.5169, 60° = 0.4933),
= (0° = 2.1941, 30° = 2.3001, 60° = 2.6796).
In
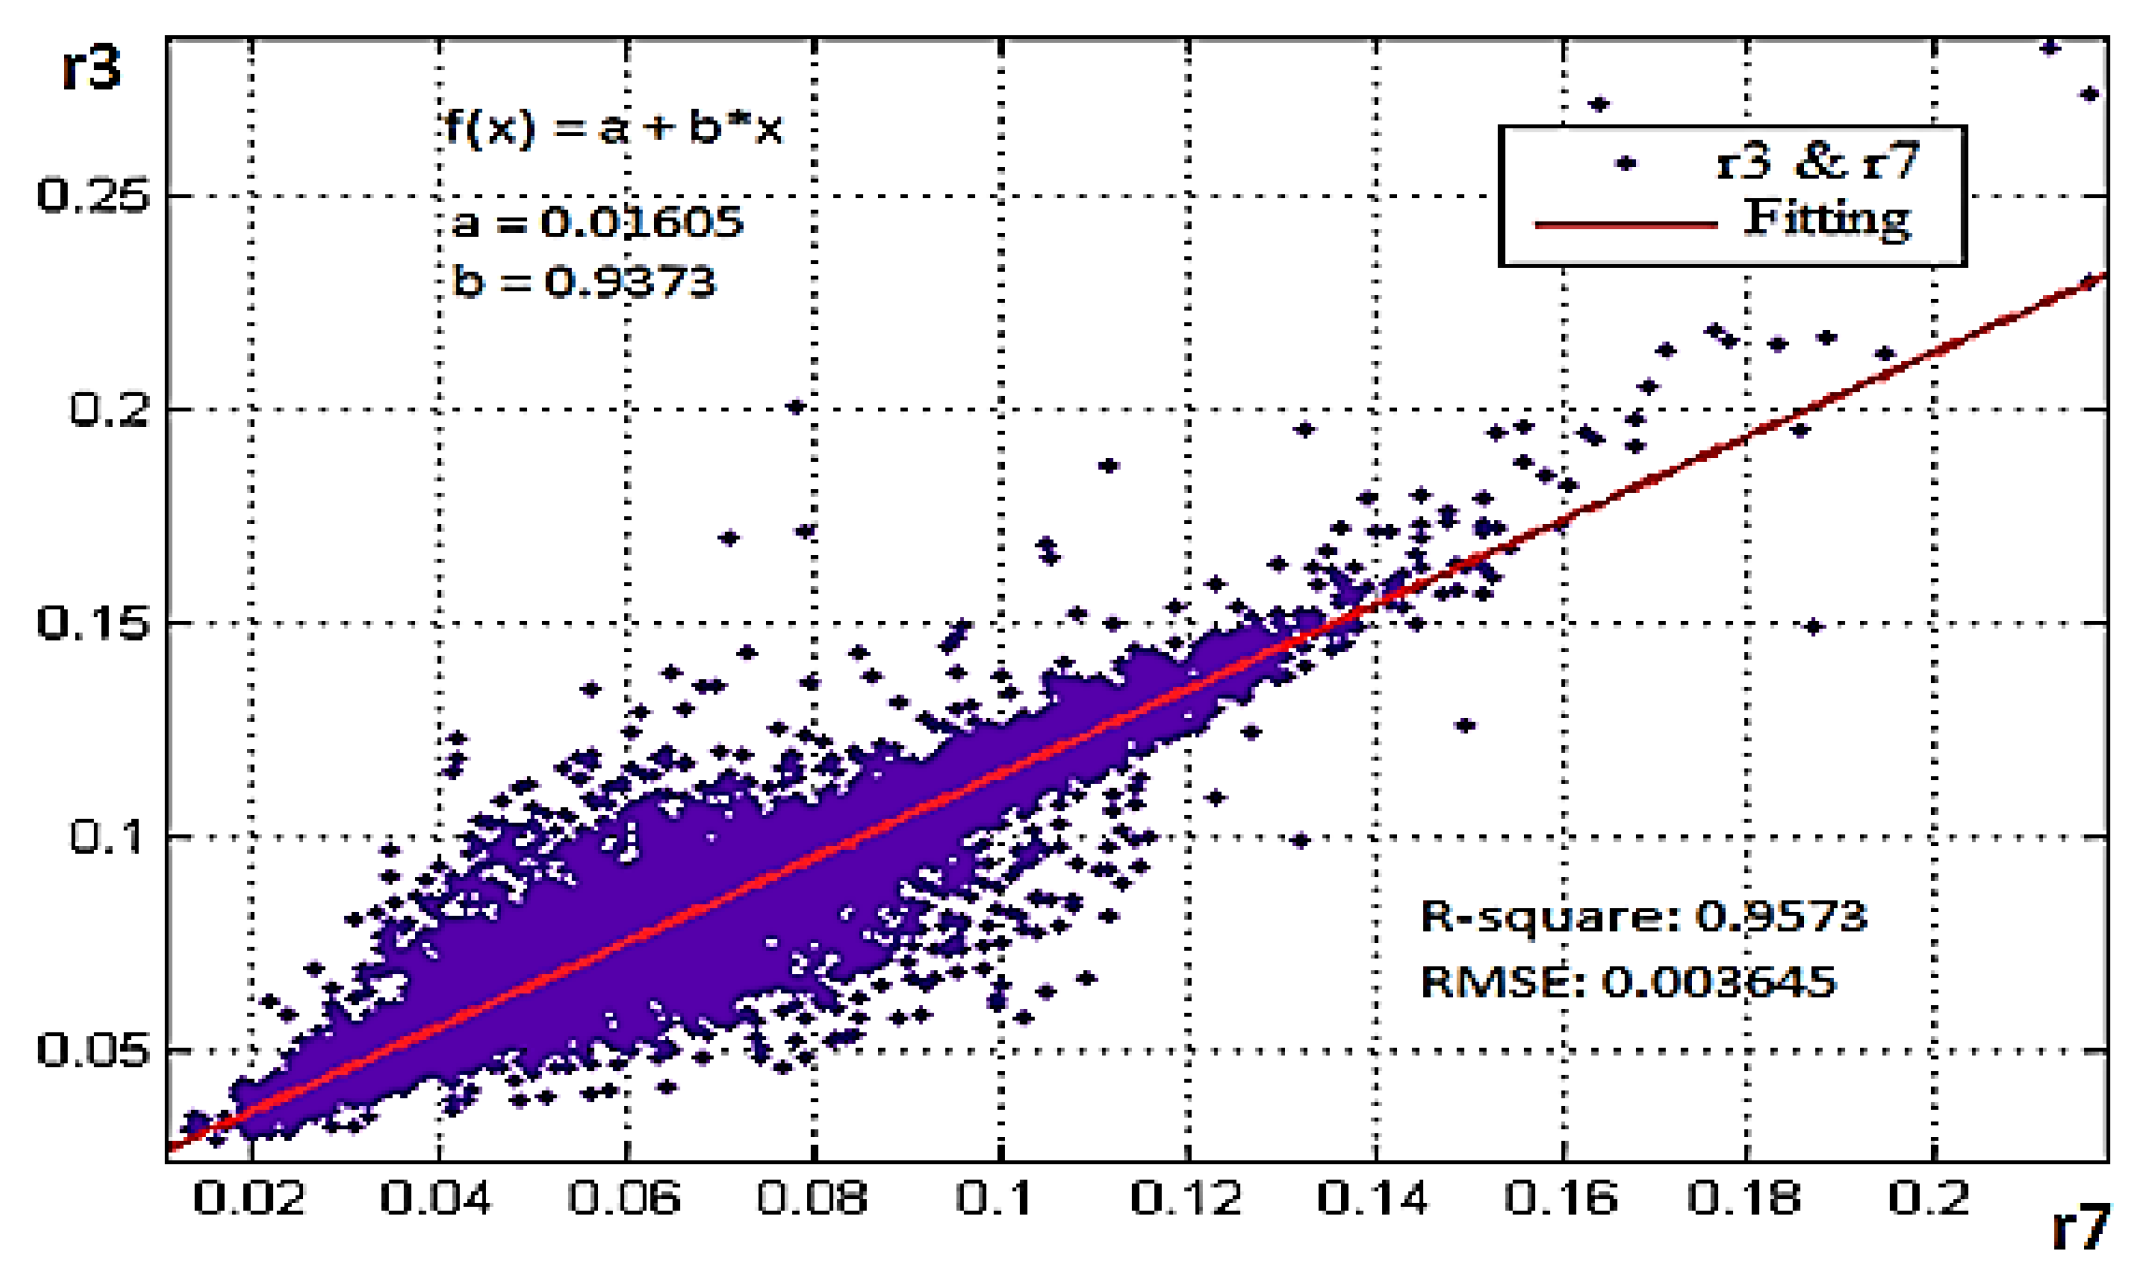
Figure 3, an example of linear fitting of the WV-2 reflectance bands R3 and R7 is presented. This example corresponds with a suitable scenario of wind and sea conditions (Maspalomas area, May 2012). We can observe a good fitting result with
R2 = 0.9573, obtaining a slope parameter
b = 0.9373.
Table 1 presents the linear fitting results of the visible channels with the corresponding NIR group bands. Note that it is important to use the correct subgroup sensor bands (MS1 and MS2) with its corresponding NIR channel since the WV-2 subgroup sensor bands are not temporally correlated, otherwise very low fitting quality will be obtained [
12].
Figure 3.
Linear fitting of the green (R3) and NIR1 (R7) WV-2 bands.
Figure 3.
Linear fitting of the green (R3) and NIR1 (R7) WV-2 bands.
Table 1.
Linear NIR and visible band fitting results.
Table 1.
Linear NIR and visible band fitting results.
| | R7 | R8 | R2 | a | b | min (ρTOC (NIR)) |
|---|
| R1 | | X | 0.8513 | 0.04074 | 0.7854 | 0.0064 |
| R2 | X | | 0.9561 | 0.03918 | 0.8943 | 0.0082 |
| R3 | X | | 0.9373 | 0.01605 | 0.9673 | 0.0082 |
| R4 | | X | 0.8836 | 0.01434 | 0.9848 | 0.0064 |
| R5 | X | | 0.9582 | 0.006162 | 1.003 | 0.0082 |
| R6 | | X | 0.7946 | 0.004212 | 1.007 | 0.0064 |
We can appreciate how the ai parameter corresponds to the quite clear ocean water reflectance (being a greatly reduced reflectance), when the glint contribution is null. The other important fact that we can observe is how the bi parameter tends to 1 when the bands move towards the NIR band wavelength.
In this context, we propose a new method based on physical principles for the removal of sea surface effects from high-resolution imagery. The new deglinting algorithm attempts to obtain a physical relation to the slope bi, which is calculated from an empirical way in the traditional algorithm.
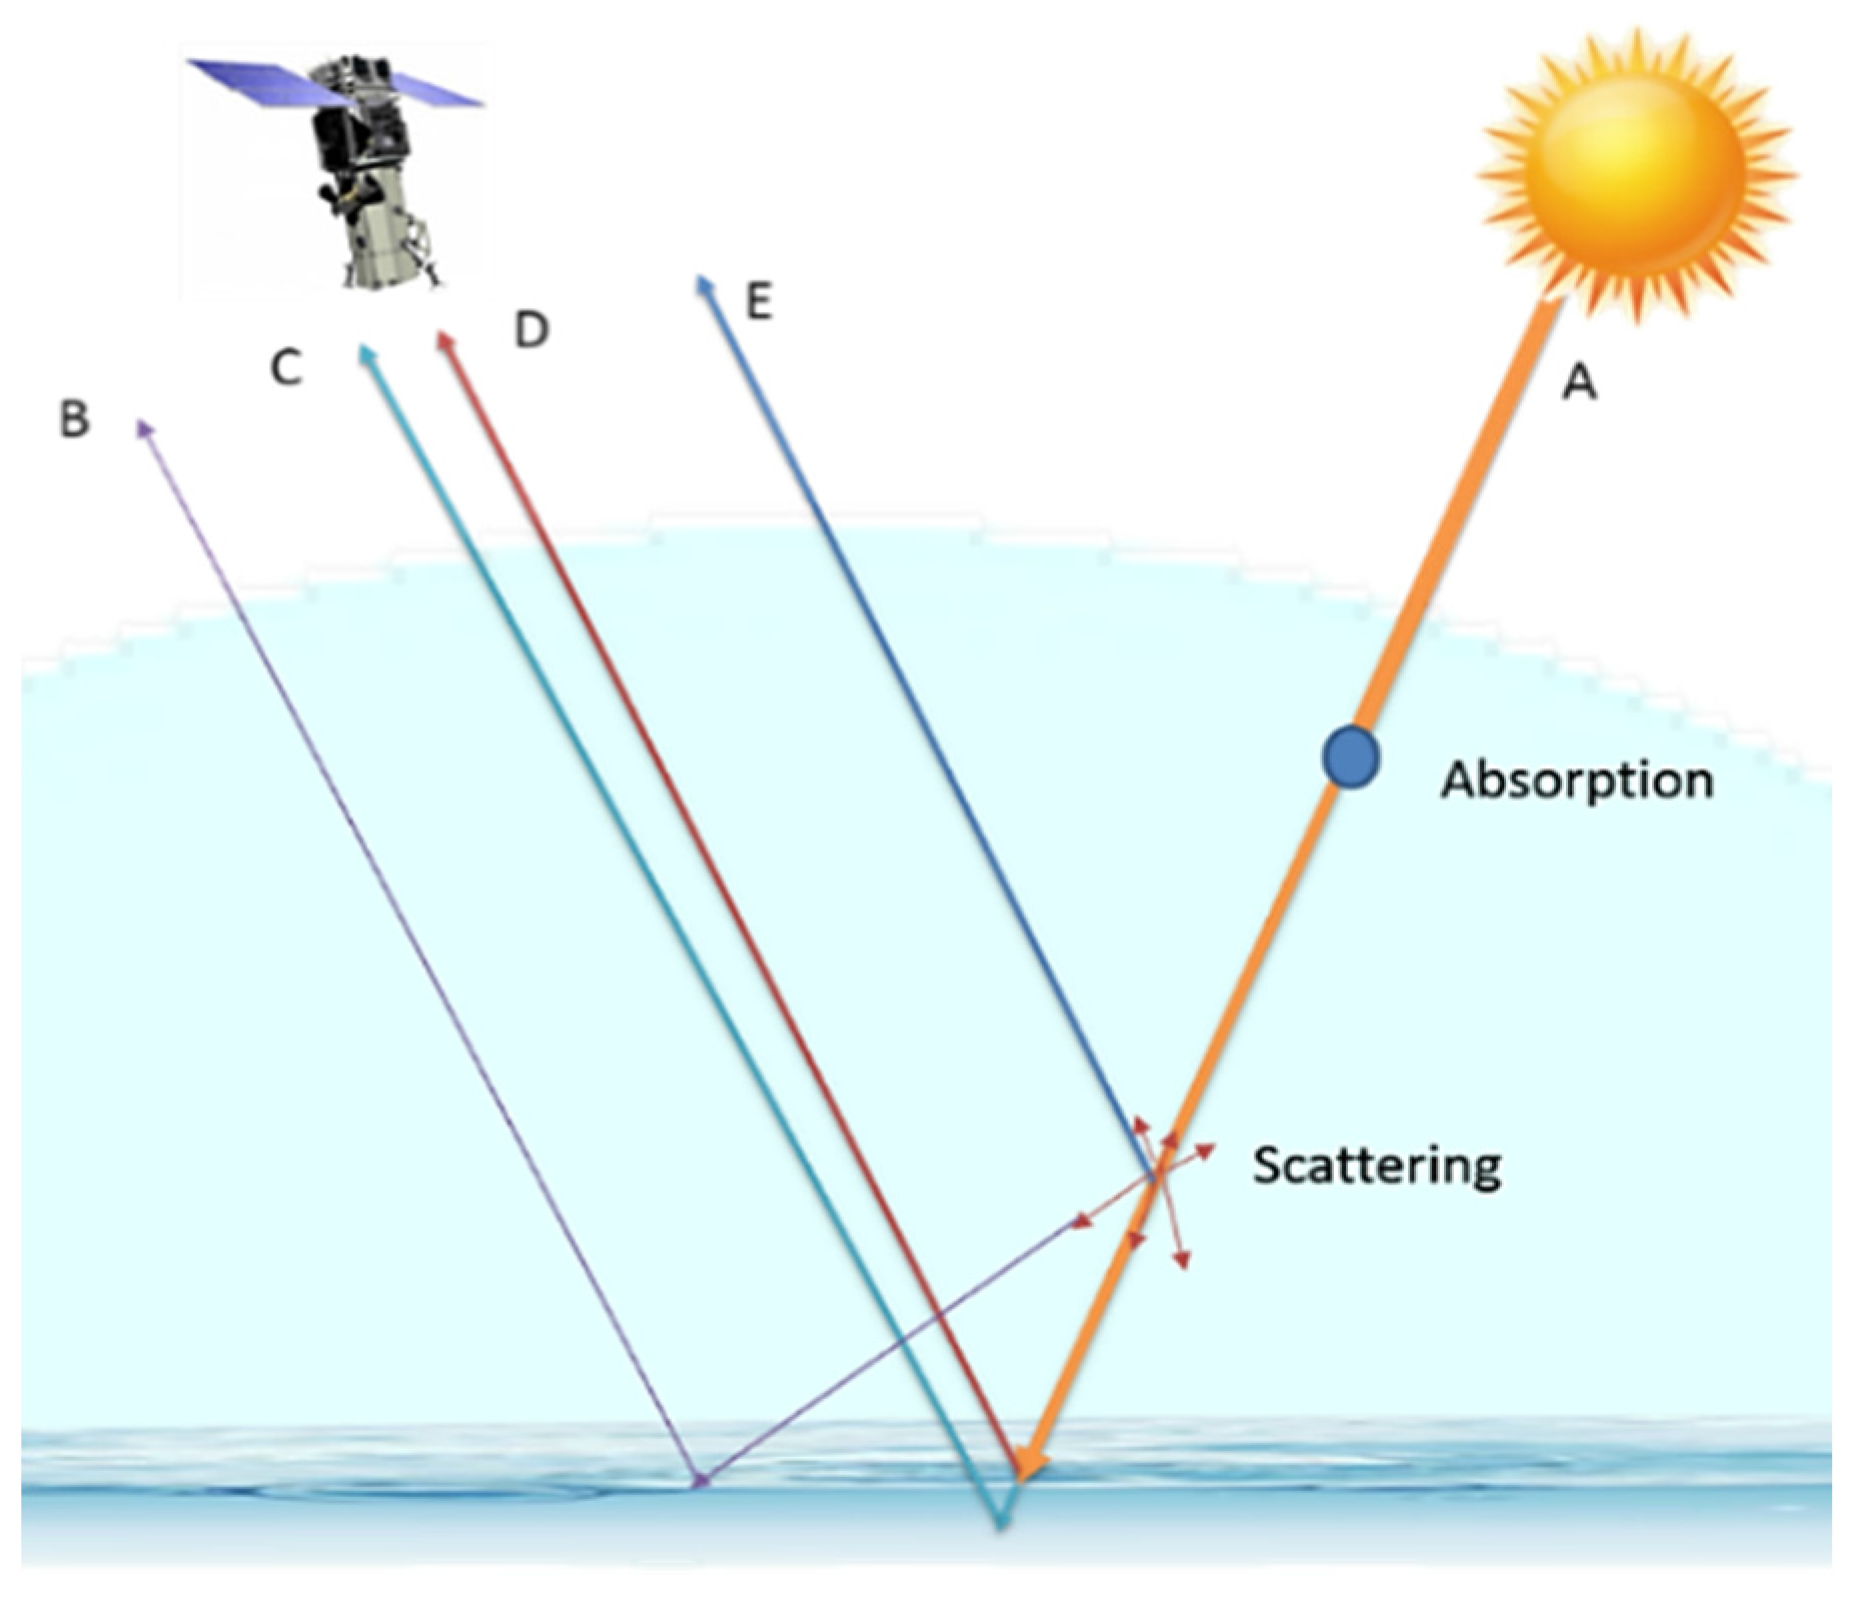
Observing the simplified schematic diagram [
13], which shows routes by which light can reach a remote sensing detector (see
Figure 4), we can model the physical phenomena underlying in the slope parameter
bi. Therefore, the simplified model is:
- ▪
A-route is the down directed sun beam.
- ▪
B-route is the scattering of the atmosphere to the water surface and then reflected to the satellite (sky-glint).
- ▪
C-route is the water-leaving reflectance transmitted through the atmosphere and the air-water surface.
- ▪
D-route is the specular reflection of the water surface (sun glint).
- ▪
E-route is the single or multiple backscattering of the atmosphere (Rayleigh and aerosol).
Once corrected the atmospheric disturbances (absorption and E-route component), and following the assumption that in the NIR band the water absorbs all radiation, the reflectivity of this band corresponds only to the specular contribution of surface brightness. In rough water conditions, specular reflectivity is mainly due to the direct irradiation, while diffuse irradiation represents a minor contribution. The diffuse irradiation is distributed equally in all directions (due to the Rayleigh scattering phase function [
14]), producing an average brightness of all the contributions of the light scattered by the atmosphere with different angles (B-route component), making it fundamentally independent of the sea state [
15].
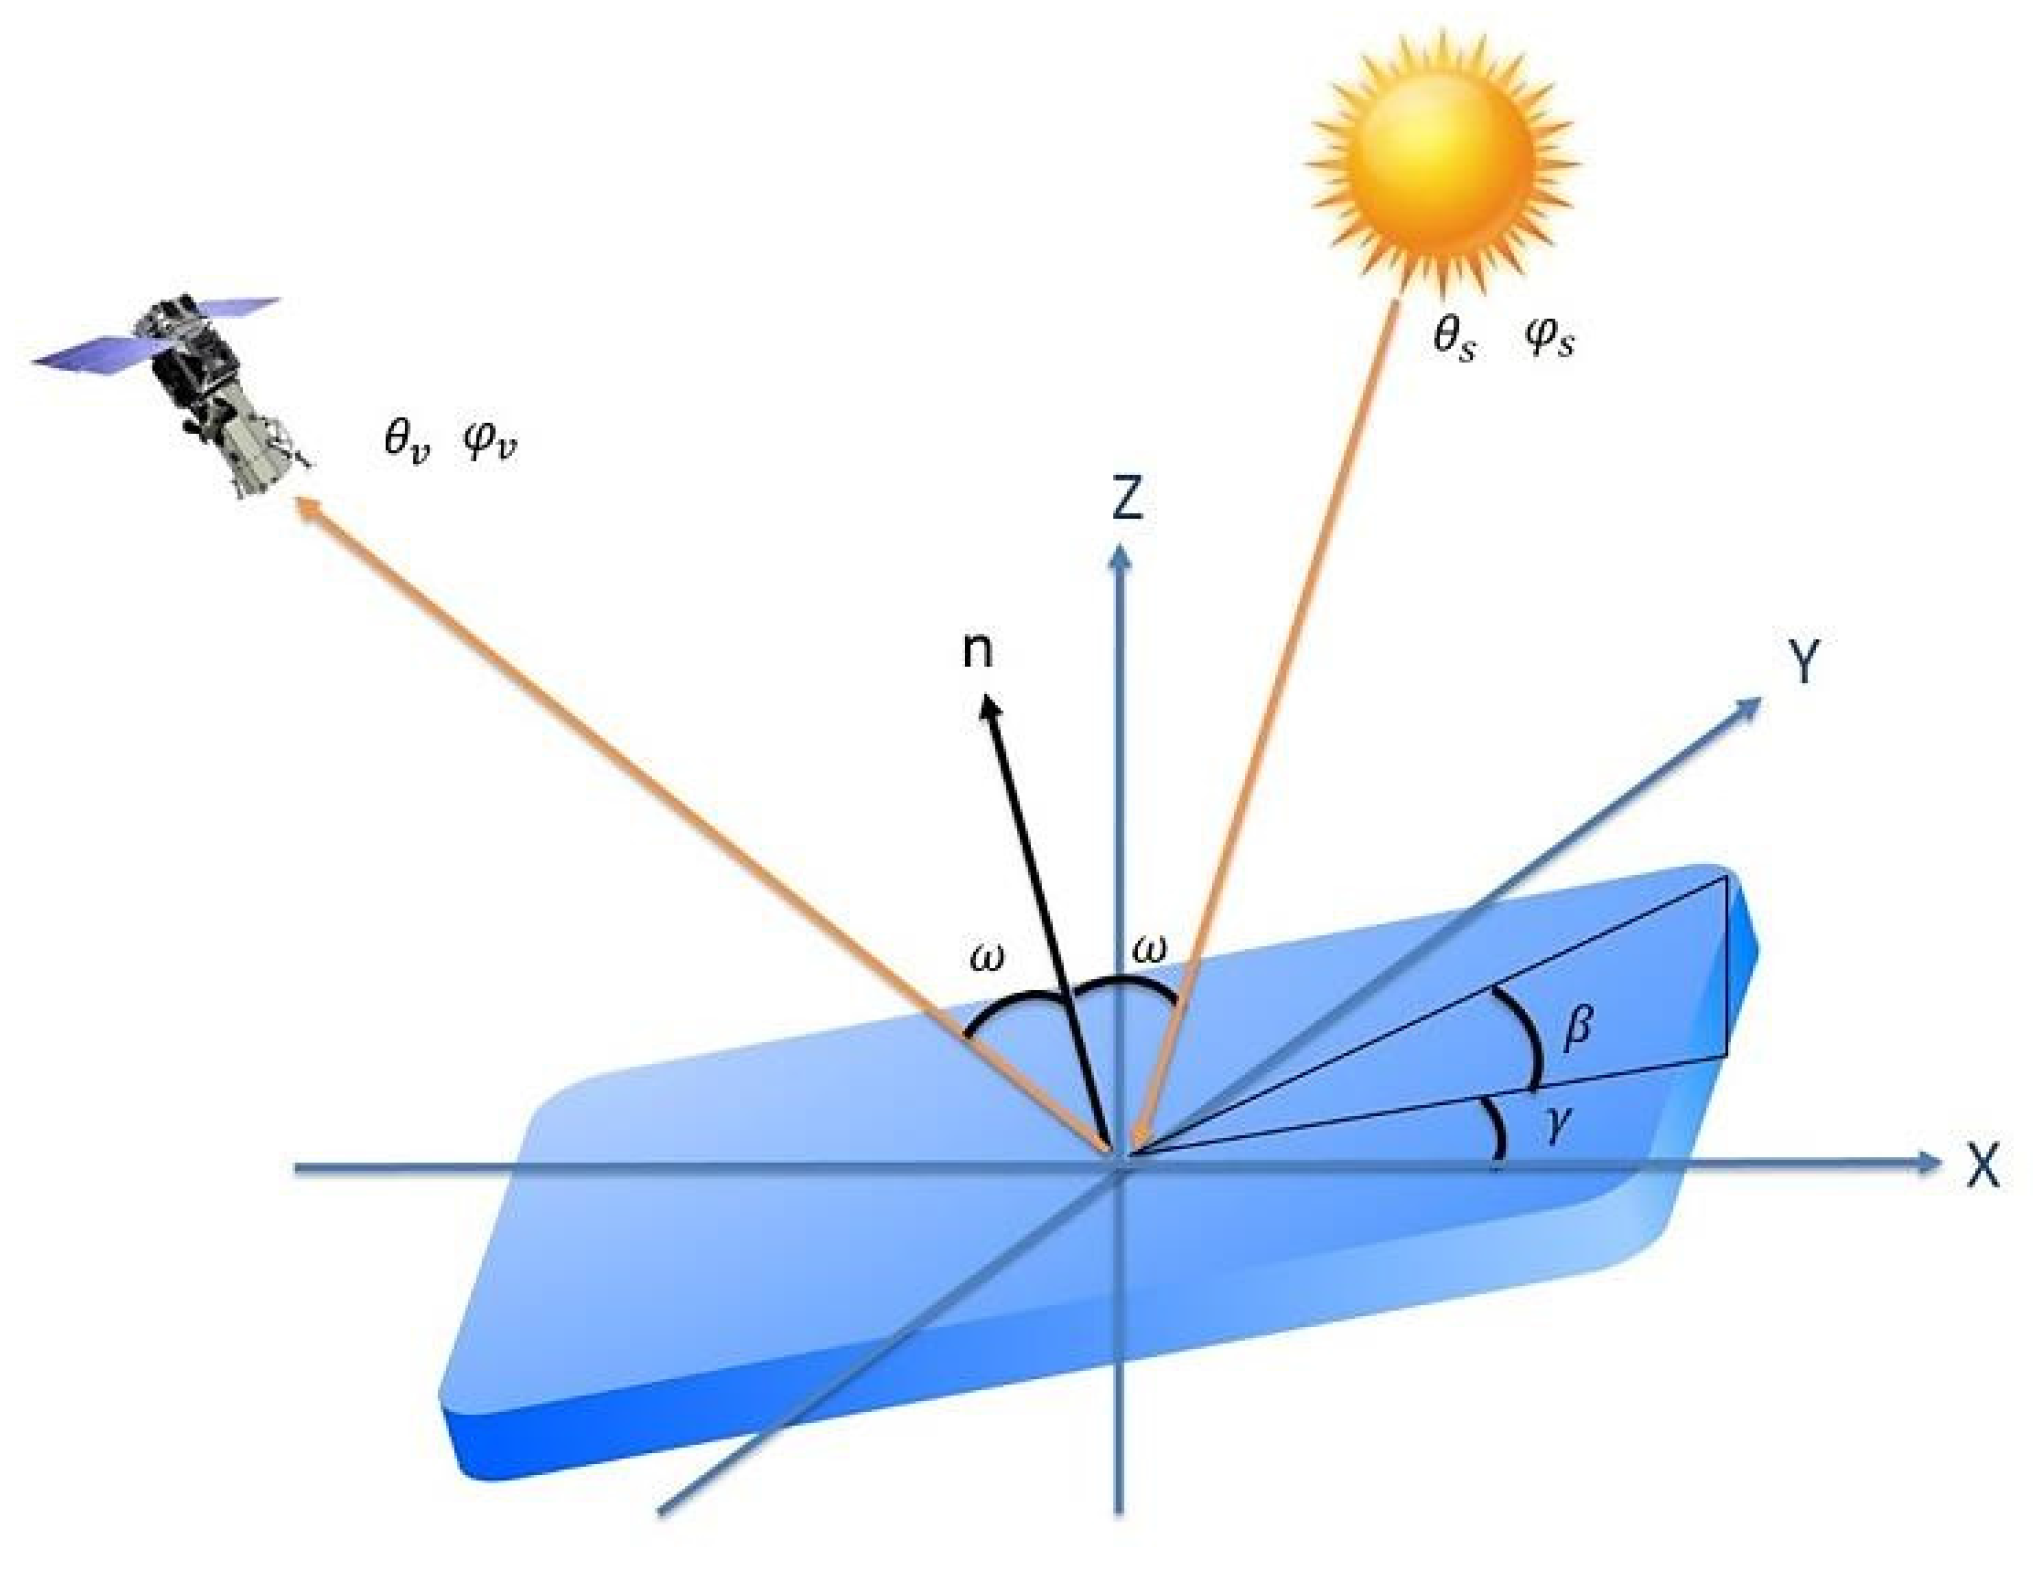
Figure 4.
Simplified schematic diagram showing routes by which light reaches a remote sensing detector.
Figure 4.
Simplified schematic diagram showing routes by which light reaches a remote sensing detector.
In order to measure the specular reflected reflectance compared to the radiation transmitted by the water surface, the Fresnel formula is often used [
5,
13]. This formula depends on the wavelength of the light used to obtain the refractive index (
n) of the sea water, and the incident angle of the light with respect to the surface (
):
Considering that a 2 × 2 m
2 pixel contains some facets with different incident angles obtained in small time windows, we can use the statistical approach, used in low resolution images, to present the problem [
13,
16],
where
is the sun glint reflectance at the surface,
is the radiance reflected in the surface towards the sensor,
Eλ is the irradiance incident on the surface,
is the Fresnel reflectance with respect the incident angle (
ω),
is the provability of specular surface with respect the solar and satellite zenith angles (
) and the solar and satellite azimuth angles (
),
β is the slope inclination angle relative to the flat surface.
Figure 5 shows the specular reflection geometry on a flat surface and the related angles.
Figure 5.
Specular reflection geometry on a flat surface.
Figure 5.
Specular reflection geometry on a flat surface.
Contrary to the specular sun glint, sky glint is weakly dependent on the sea state, allowing to model this reflectance by a parameter which depends on the solar zenith angle and the wind speed [
17],
where
is the sky glint reflectance at the surface,
is the sky glint correction coefficient relative to the sun zenith angle and the wind speed (
),
is the sky leaving radiance.
Using this approach, and dividing the contribution of the sun glint by the normalized irradiance parameters, we can obtain the following relations between the sea reflectance and the normalize irradiance for the optical and NIR bands,
where
is the normalized direct irradiance,
is the normalized diffuse irradiance, and
is the deglinted water-leaving reflectance.
By using two in-layer points of the fitted line (
Figure 3), we can obtain the following relationship for the slope
parameter,
where
is the maximum sun glint reflectance of the two in-layer points due to the higher level of faces oriented with specular angle,
is the minimum sun glint reflectance due to the lower level of faces oriented with specular angle. Note how
due to Fresnel reflectance of the different optical wavelengths vary only slightly since the reflectance index is very similar, being the same assumption that is made in the traditional method.
Next, in
Table 2 the direct and diffuse normalized irradiance parameters, produced with the 6S, are shown. In the same way, the direct irradiances ratio between the bands to correct and the corresponding NIR are presented.
Table 2.
Direct-Diffuse irradiance comparison.
Table 2.
Direct-Diffuse irradiance comparison.
| | R1 | R2 | R3 | R4 | R5 | R6 | R7 | R8 |
|---|
| 0.214 | 0.158 | 0.114 | 0.091 | 0.077 | 0.067 | 0.058 | 0.052 |
| 0.786 | 0.842 | 0.886 | 0.909 | 0.923 | 0.933 | 0.942 | 0.948 |
| 0.829 | 0.893 | 0.941 | 0.958 | 0.979 | 0.984 | - | - |
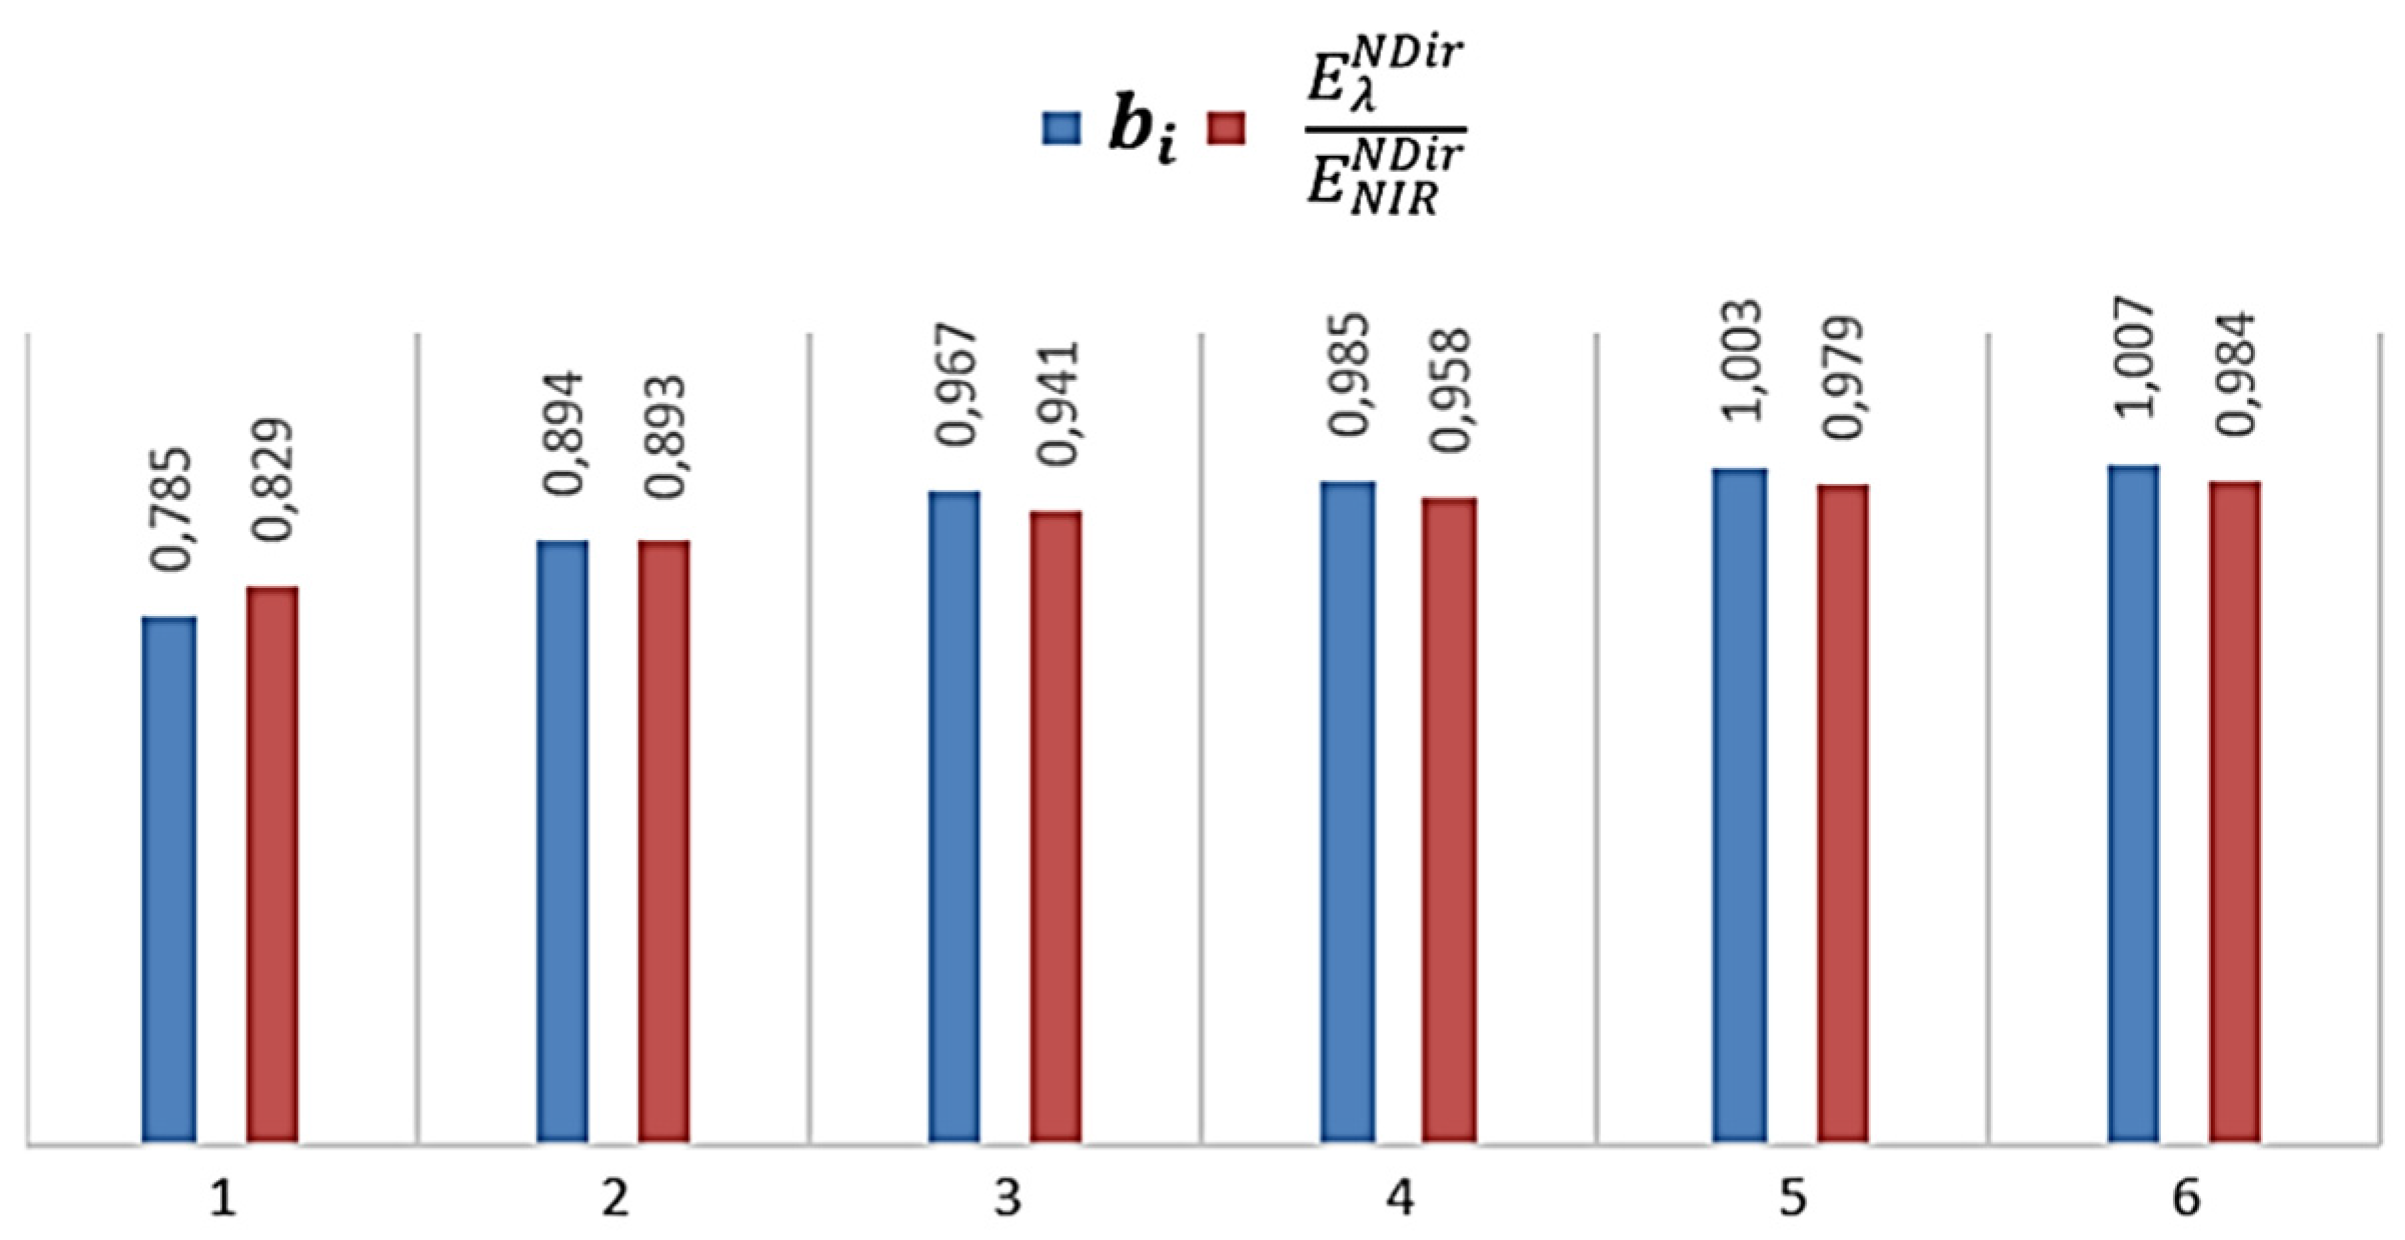
Figure 6 displays the comparison chart of the results of slope
bi, obtained through linear fitting,
versus the ratio of 6S direct irradiance parameters.
Figure 6.
Slope bi, obtained by linear fitting (blue); and optical-band/NIR direct irradiance ratio (red).
Figure 6.
Slope bi, obtained by linear fitting (blue); and optical-band/NIR direct irradiance ratio (red).
It can be observed that results are quite similar, although the biggest difference is located in the blue coastal band, where the error in the 6S aerosol modeling has a bigger impact on the result of direct-diffuse normalized irradiance computation.
Thus, Equation (9) provides the new deglinting method based on the direct-irradiance ratio. The minimum NIR reflectance has been removed from the equation, since this value is more connected with residual atmospheric aerosol reflectance values than real NIR seawater contribution. The slope has been replaced by the direct-irradiance ratio, providing a fully automatic procedure avoiding the dependence of the selected areas for calculation of the slope
bi, where such areas must be deep and without turbidity. This is not always possible in shallow coastal environments and in inland waters, allowing, as well, to obtain a fully automatic deglinting algorithm,
2.4. Deglinting Algorithm Integrated into the Radiative Transfer Modeling (RTM)
Coastal regions are one of the environments with more biodiversity around the globe. Therefore, the mapping of these areas is critical to preserve such shallow coastal ecosystems. Water leaving radiance emanating from shallow coastal waters contains information about the water optical properties, depth and bottom albedo. As previously described, the removal of sun glint is essential to the marine radiative modeling. The algorithms based on eliminating sun glint through the NIR band have a weak point in common: the reflectivity of the water in this channel is not always negligible in very shallow environments and in water with high concentrations of turbidity. These assumptions are very common in coastal and in inland waters, causing significant errors even without the presence of sun glint. To overcome this problem, this paper proposes to integrate the sun glint removal algorithm in the radiative transfer model with the goal of modeling the contribution of the NIR reflectance of coastal waters, which will allow us to eliminate this contribution of the specular NIR reflectance.
The forward radiative transfer problem can be solved numerically. Nevertheless, the inverse problem is more challenging. In our context, an efficient multichannel physics-based algorithm has been implemented, capable of solving through optimization the RTE (Radiative Transfer Equations) of coastal waters by integrating the new automatic deglinting algorithm. This new procedure has yielded good results using the radiative model to compute water quality, as it considers the physical phenomena of water absorption-backscattering (
kd) and the relationship between the seafloor albedo, its depth and the water Inherent Optical Properties (IOPs), since they are a function of water quality and the chlorophyll-a, turbidity, and CDOM concentrations. In consequence, the RTE allows us to model the reflectivity and it can be expressed by [
1,
4,
18,
19],
where
is the modeled subsurface reflectivity;
is the subsurface reflectivity of the deep water;
is the seafloor albedo;
is the subsurface solar zenith angle;
is the subsurface view angle;
and
are the optical path-elongation factors for scattered photons from the water column and the bottom;
kd is the diffuse attenuation coefficient; and
z is the depth [
19,
20,
21,
22].
In order to model the NIR above surface reflectance parameter (
) we have used the RTE expression (Equation (10)) above the surface (Equation (3)).
is integrated in the deglinting expression (Equation (9)) in the optimization procedure, which allows to remove the NIR water reflectance amount in very shallows waters (usually less than 2 m deep), and high suspended solid content, as it is commonly found in very near shore areas,
In the implementation of the gradient optimization technique, Levenberg-Marquardt algorithm (LMA) [
23] for solving the nonlinear cost function was employed (Equation (10)). The cost function expression is defined in Equation (10), where the modeled reflectances are compared with the deglinted above surface reflectance, trying to minimize the
error. The initialization of the
z parameter has been performed using the ratio algorithm result [
24], for better and faster optimization convergence,
The use of the first six optical plus NIR bands, increases the spectral information, properly removing the sun glint in near shore environments. This fact lets the reflectance unmixing of the water IOPs, the depth and seafloor, which allows more precise water quality calculation even with large matter concentration, and at short depths with non-negligible bottom NIR reflectance influence.


