
Interannual Variations in Growing-Season NDVI and Its Correlation with Climate Variables in the Southwestern Karst Region of China

Abstract
:
1. Introduction
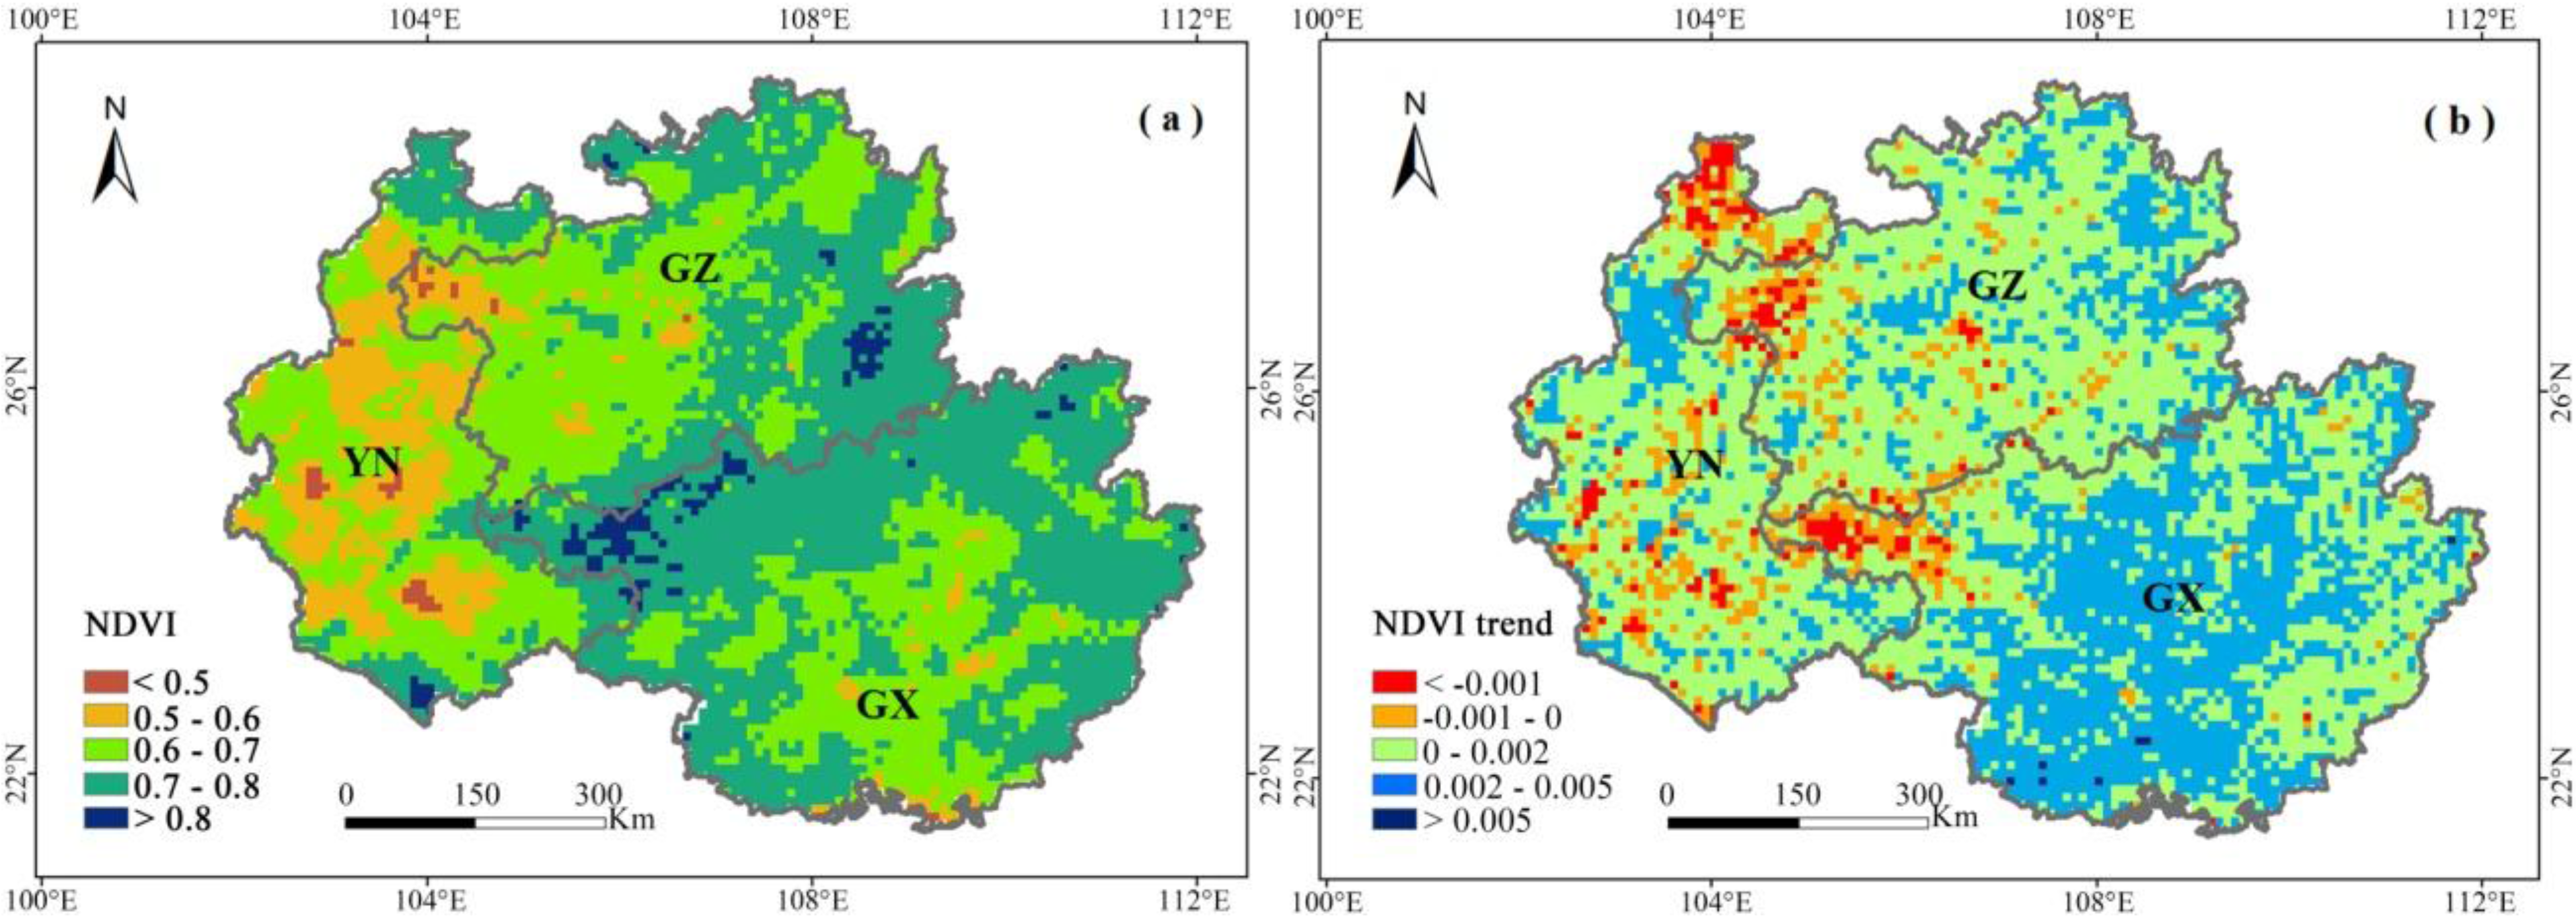
2. Study Area

3. Materials and Methods
3.1. Data
3.1.1. Normalized Difference Vegetation Index (NDVI) Dataset
3.1.2. Meteorological Data
3.2. Methods
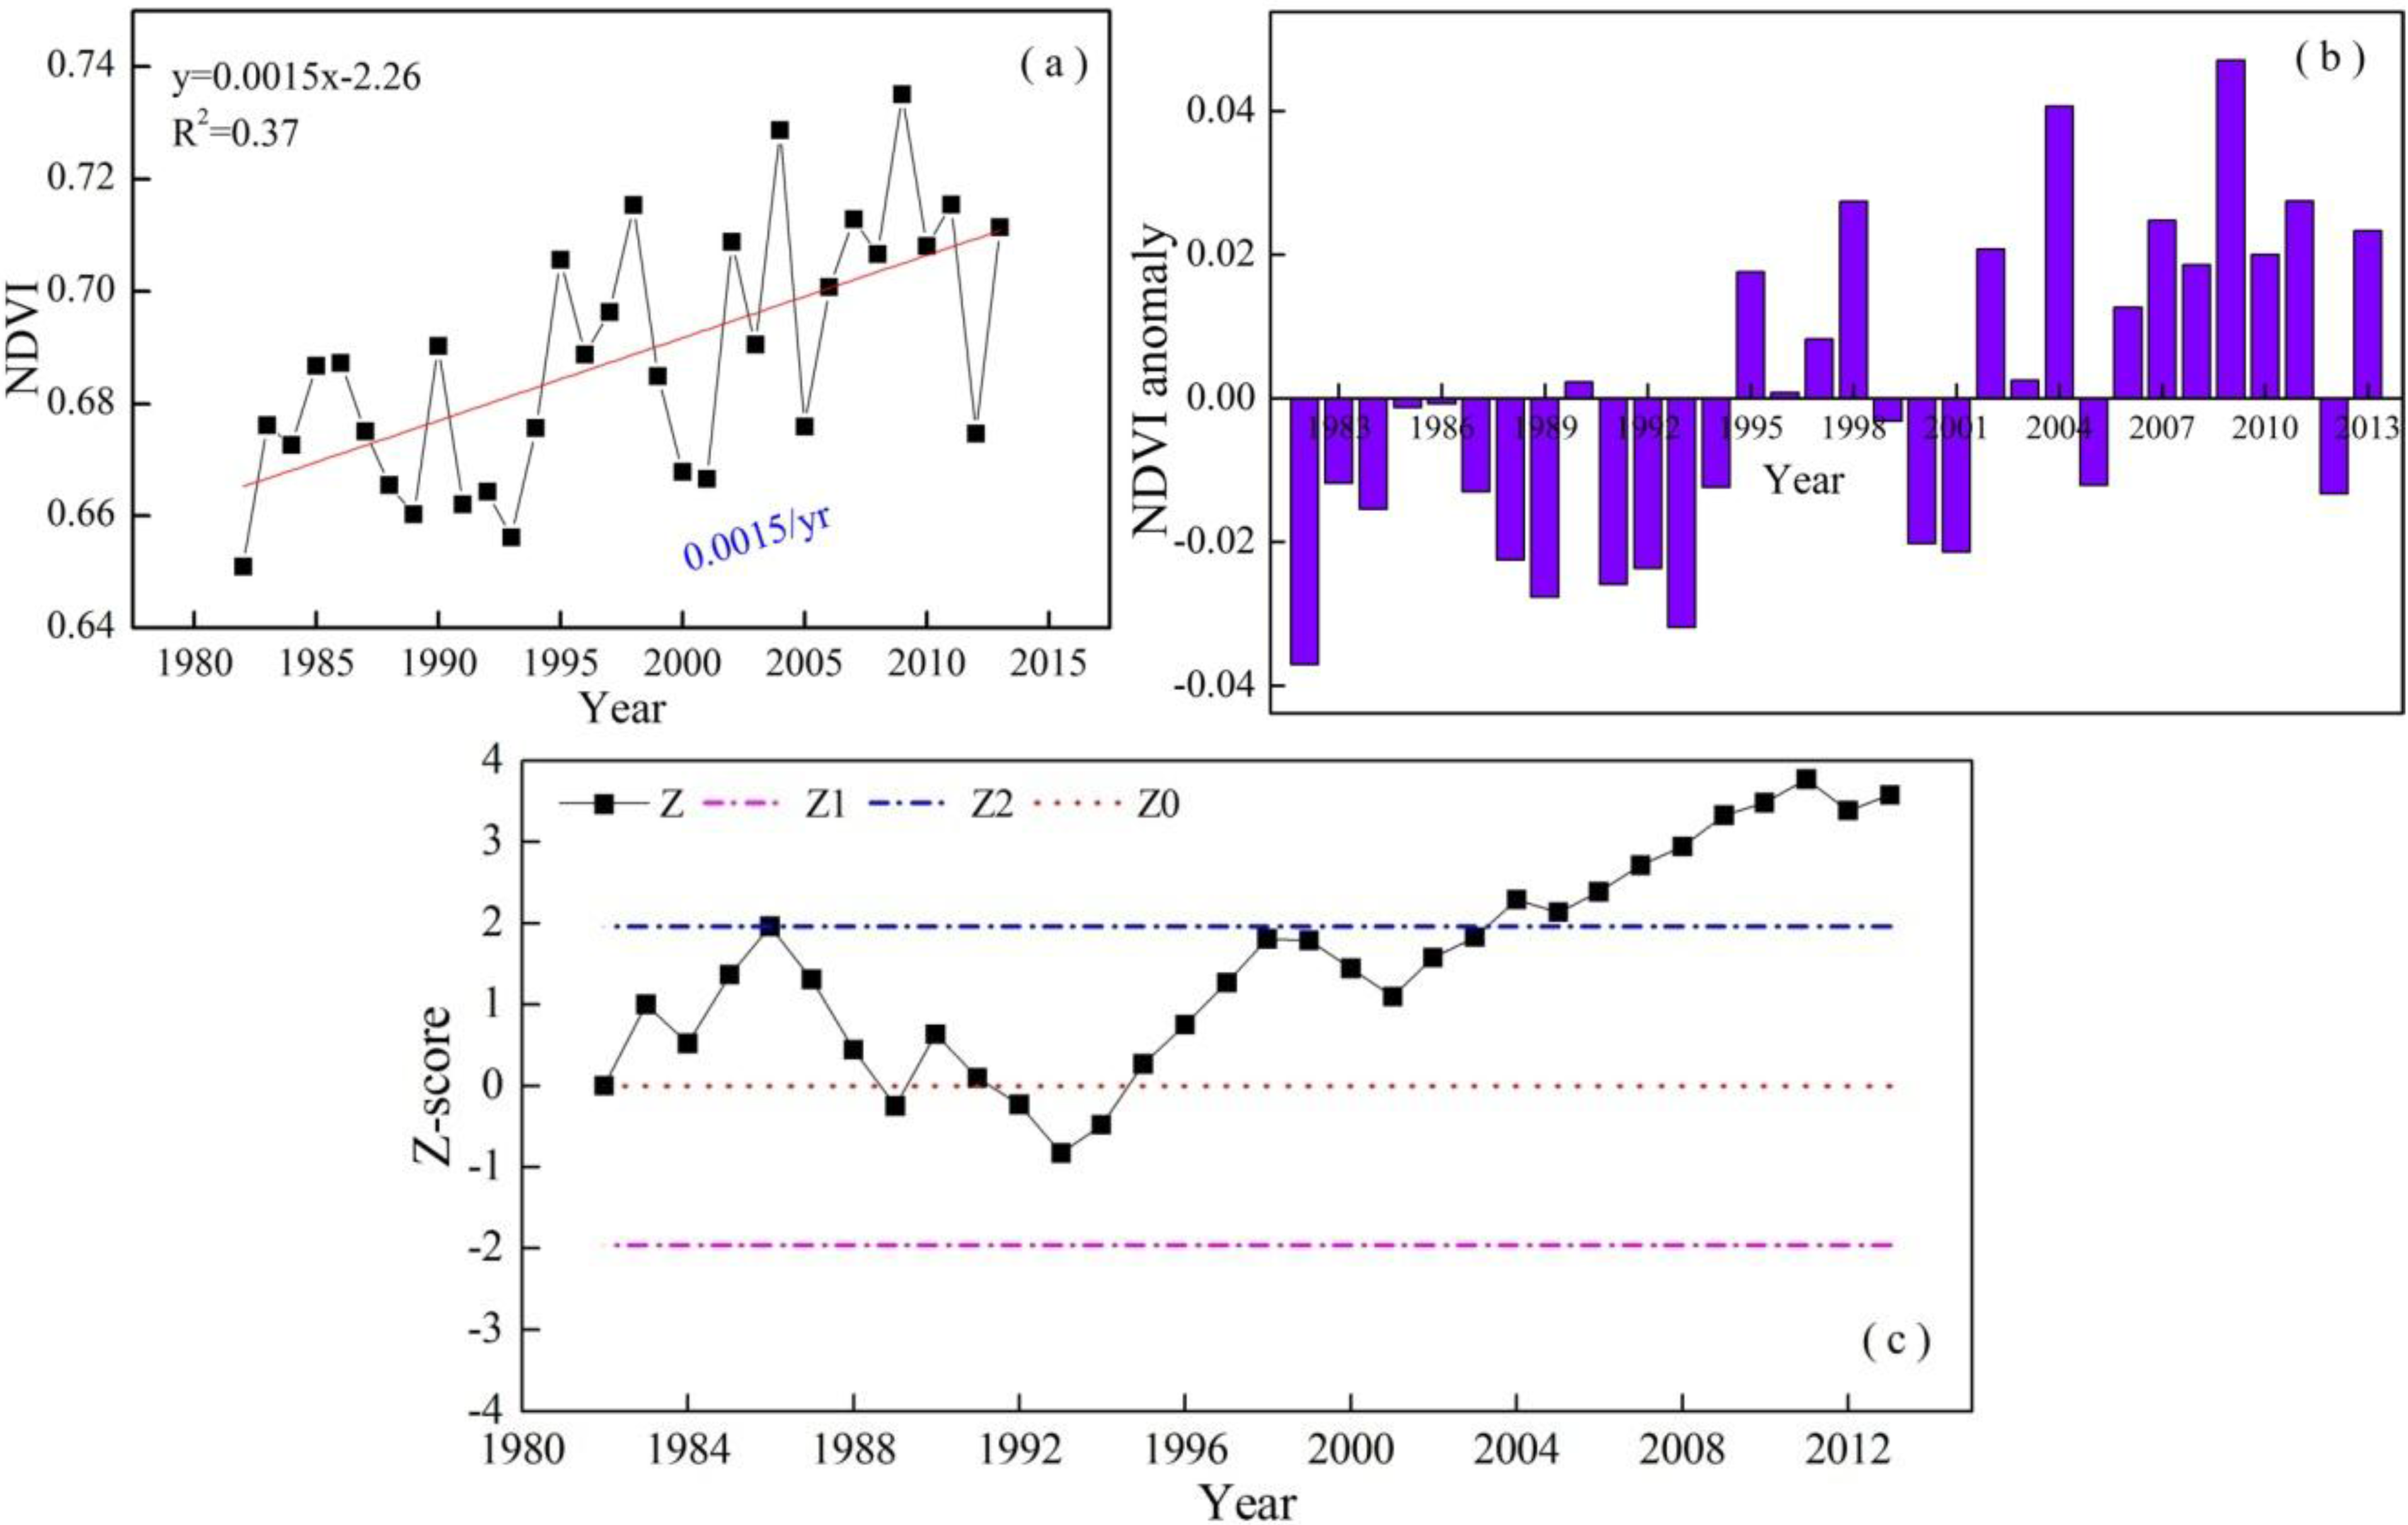
3.2.1. Trend Analysis and Mann-Kendall Test
- (1)
- Trend Analysis
- (2)
- Mann-Kendall Test
3.2.2. Multivariate Regression Analysis
- (1)
- Ordinary Linear Square
- (2)
- Geographically Weighted Regression (GWR)
4. Results and Analysis
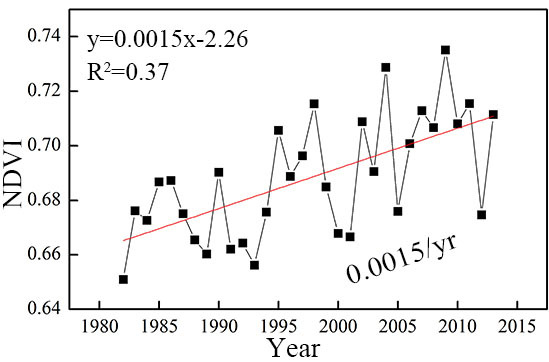
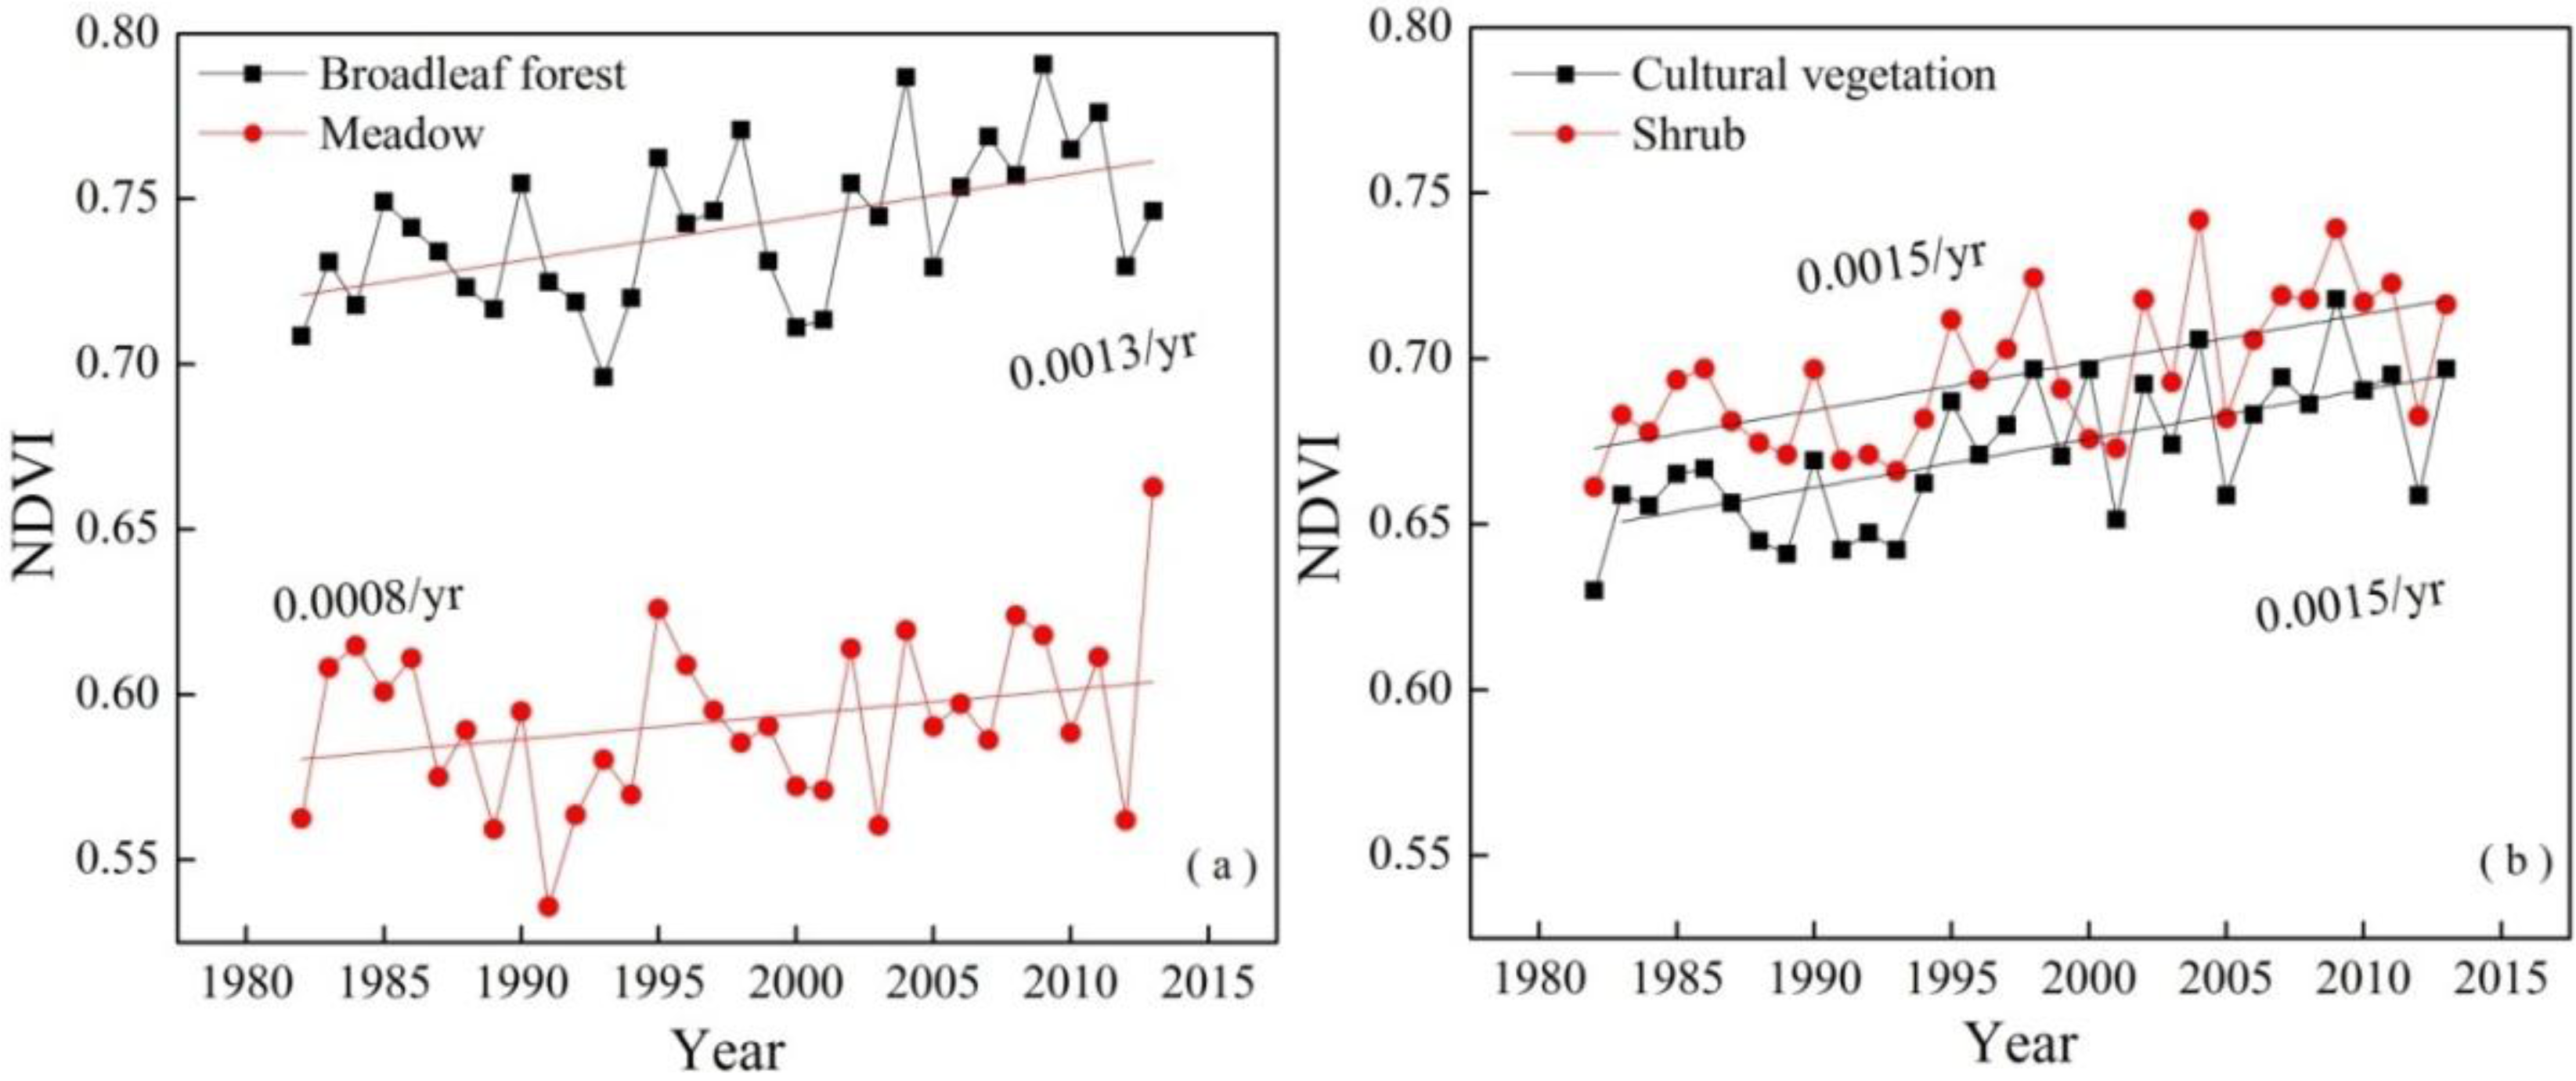
4.1. Temporal-Spatial Variations in Growing-Season NDVI


| Vegetation Type | Growing-Season NDVI Value | NDVI Rate | Correlation Coefficients | |||
|---|---|---|---|---|---|---|
| Average | Maximum | Minimum | Temperature | Precipitation | ||
| Broadleaf forest | 0.7412 | 0.8501 | 0.5056 | 0.0013 | 0.315 ** | 0.173 ** |
| Shrub | 0.6952 | 0.8369 | 0.4866 | 0.0015 | 0.149 ** | 0.130 ** |
| Grassland | 0.6946 | 0.8405 | 0.4126 | 0.0013 | 0.493 ** | 0.289 ** |
| Coniferous forest | 0.6871 | 0.8270 | 0.3932 | 0.0016 | 0.252 ** | 0.063 |
| Cultural vegetation | 0.6706 | 0.8398 | 0.3576 | 0.0015 | 0.374 ** | 0.182 ** |
| Meadow | 0.5910 | 0.7319 | 0.4741 | 0.0008 | 0.412 ** | −0.109 |

4.2. Relationship between NDVI and Climate Variables
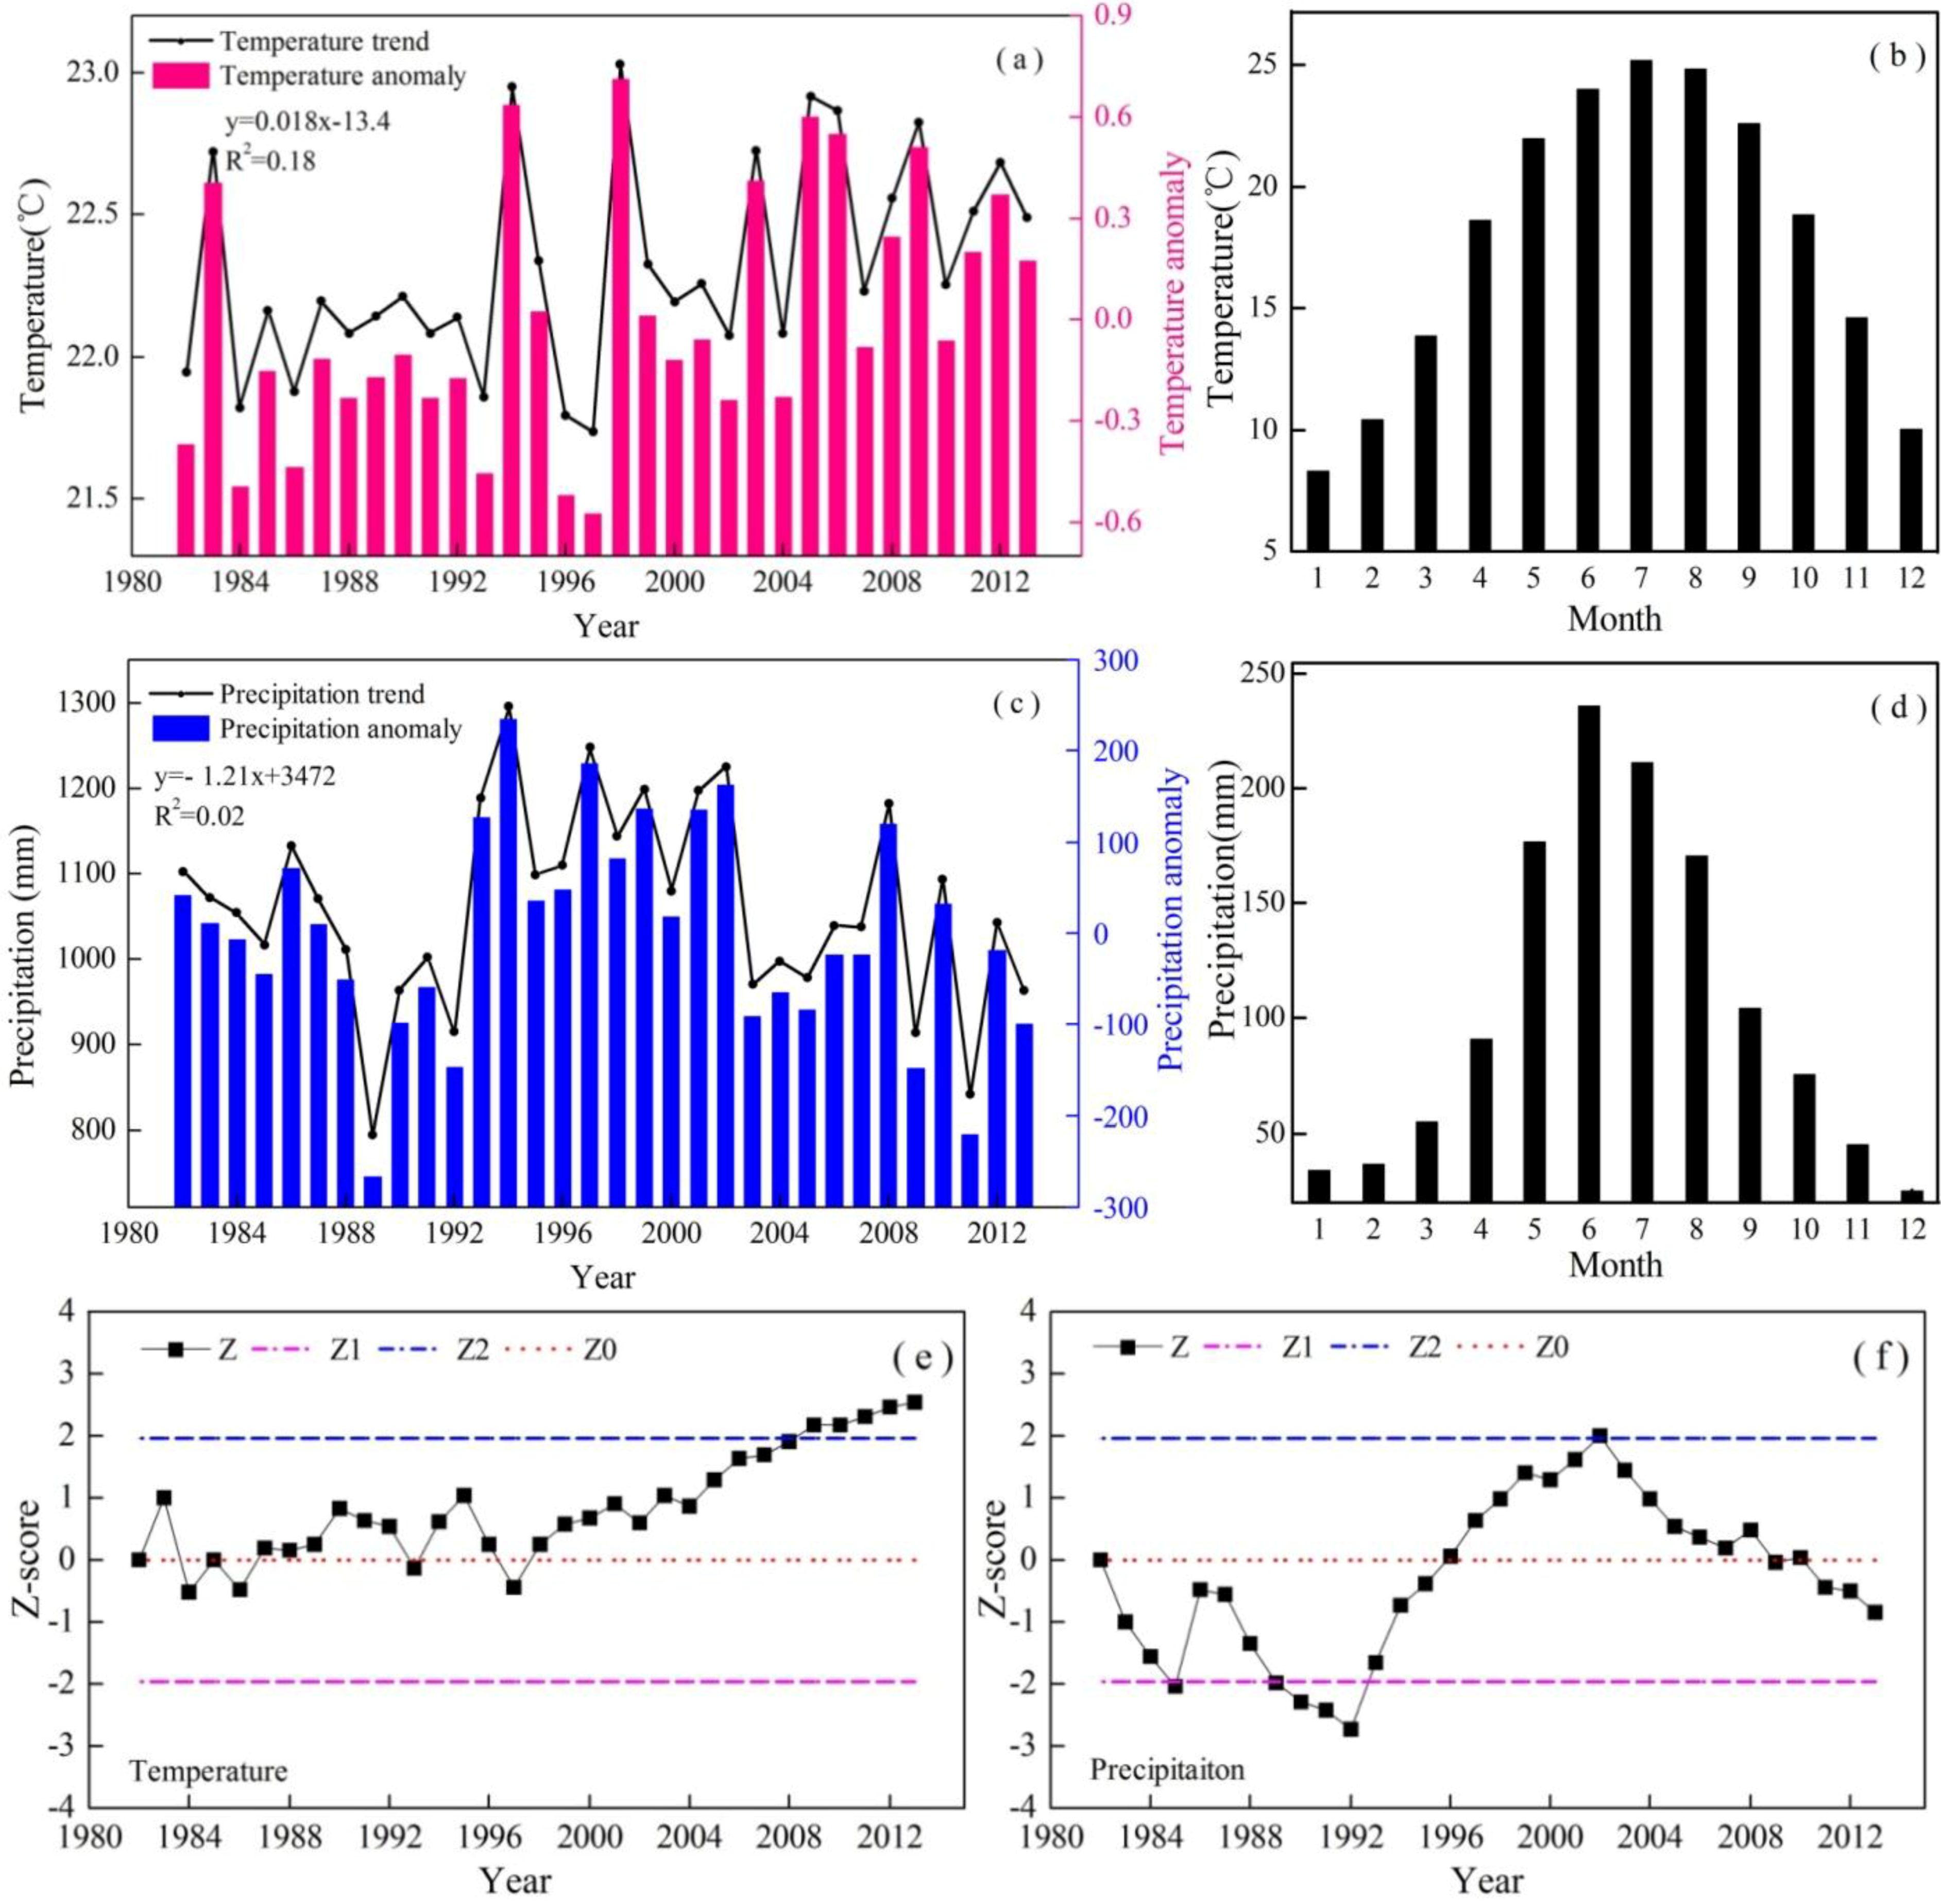
4.2.1. Interannual Variations in Temperature and Precipitation
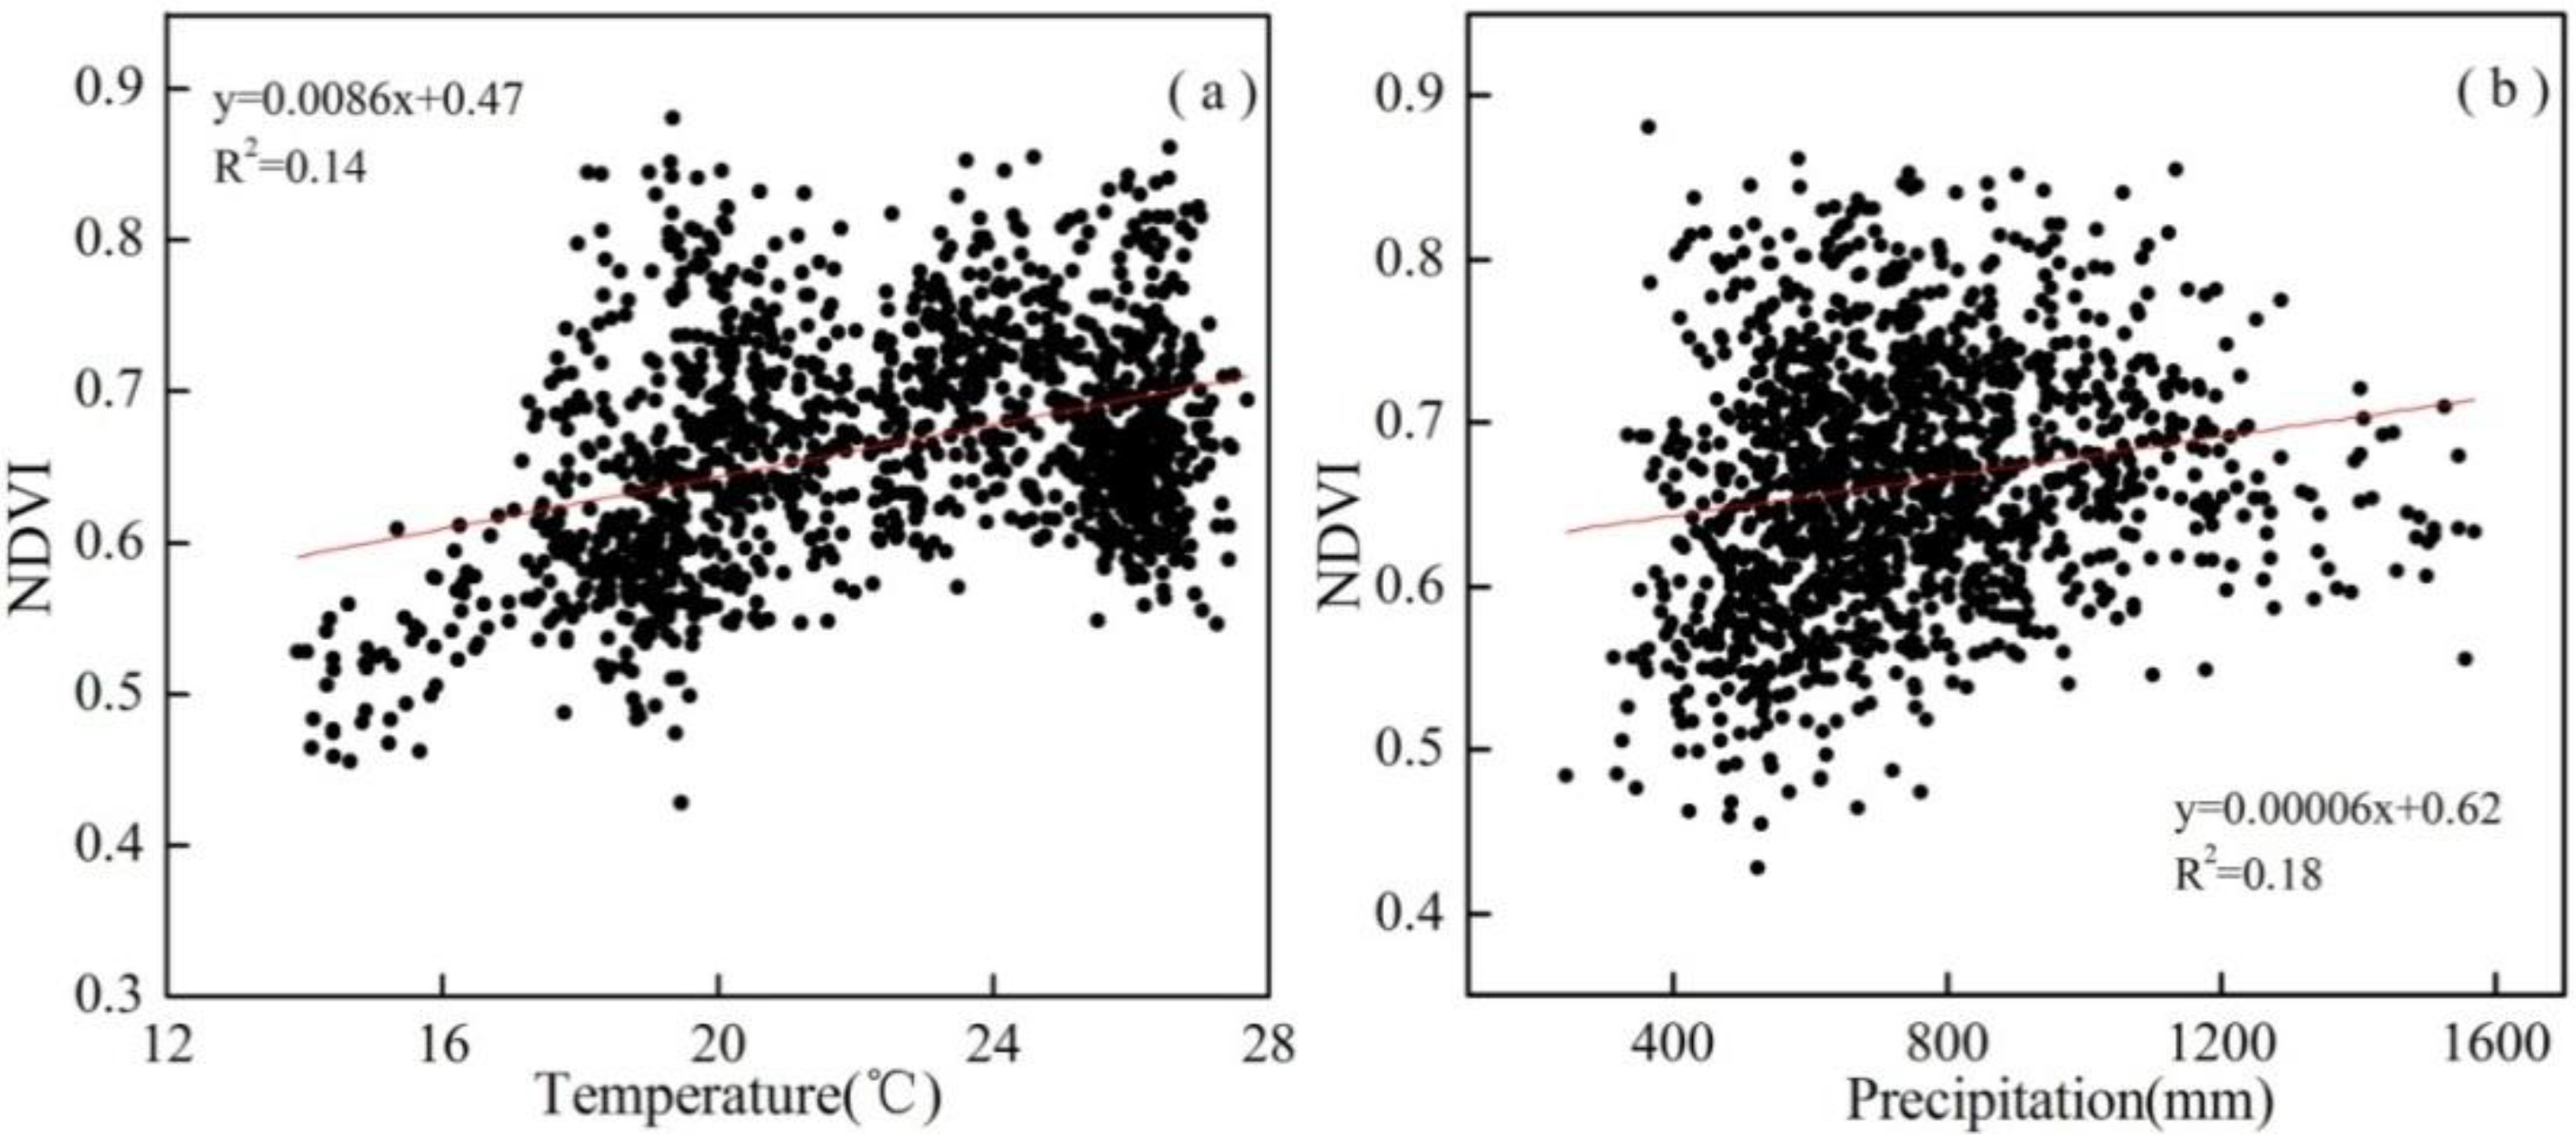
4.2.2. OLS Analysis for Temporal Relationship

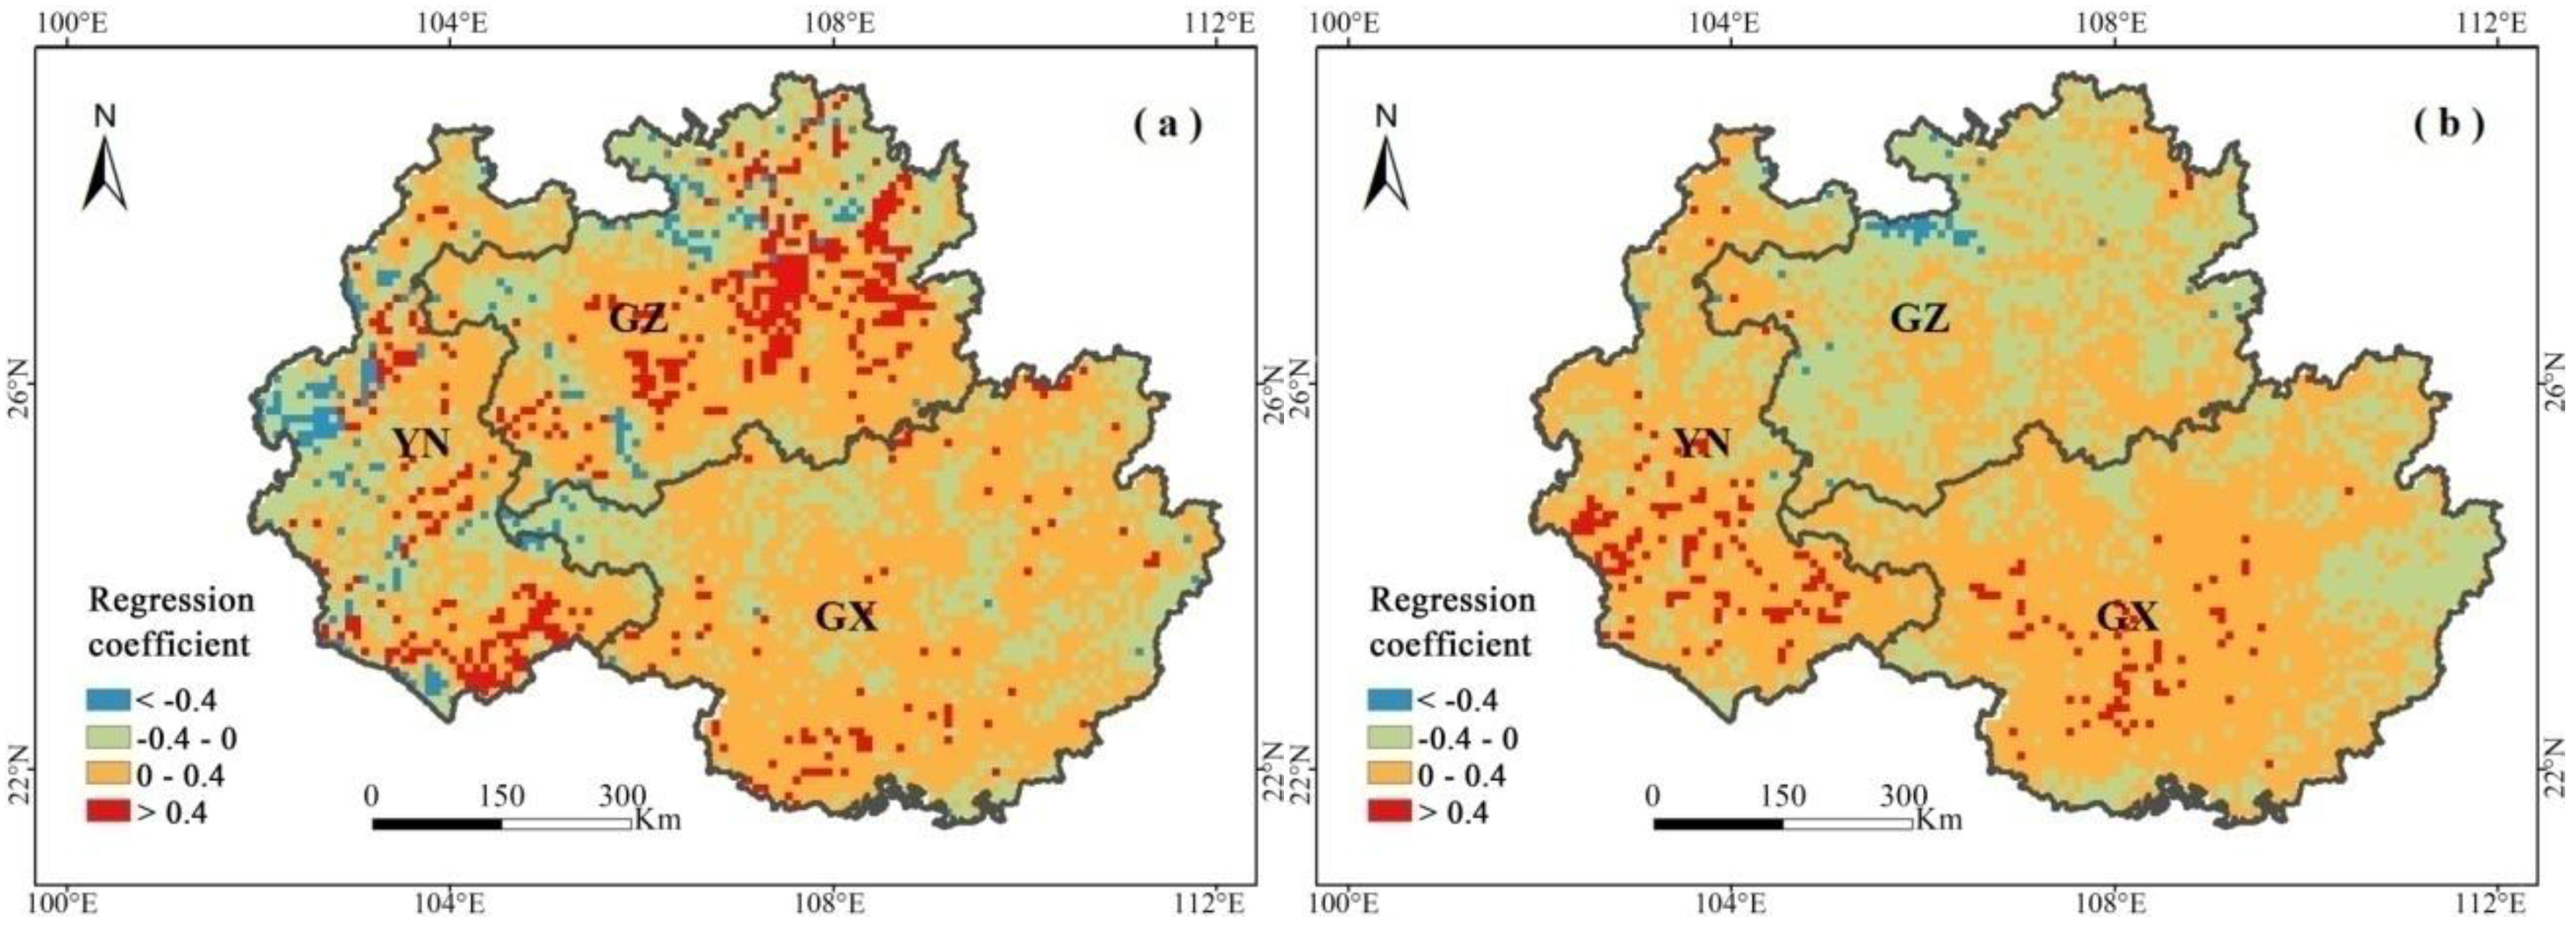
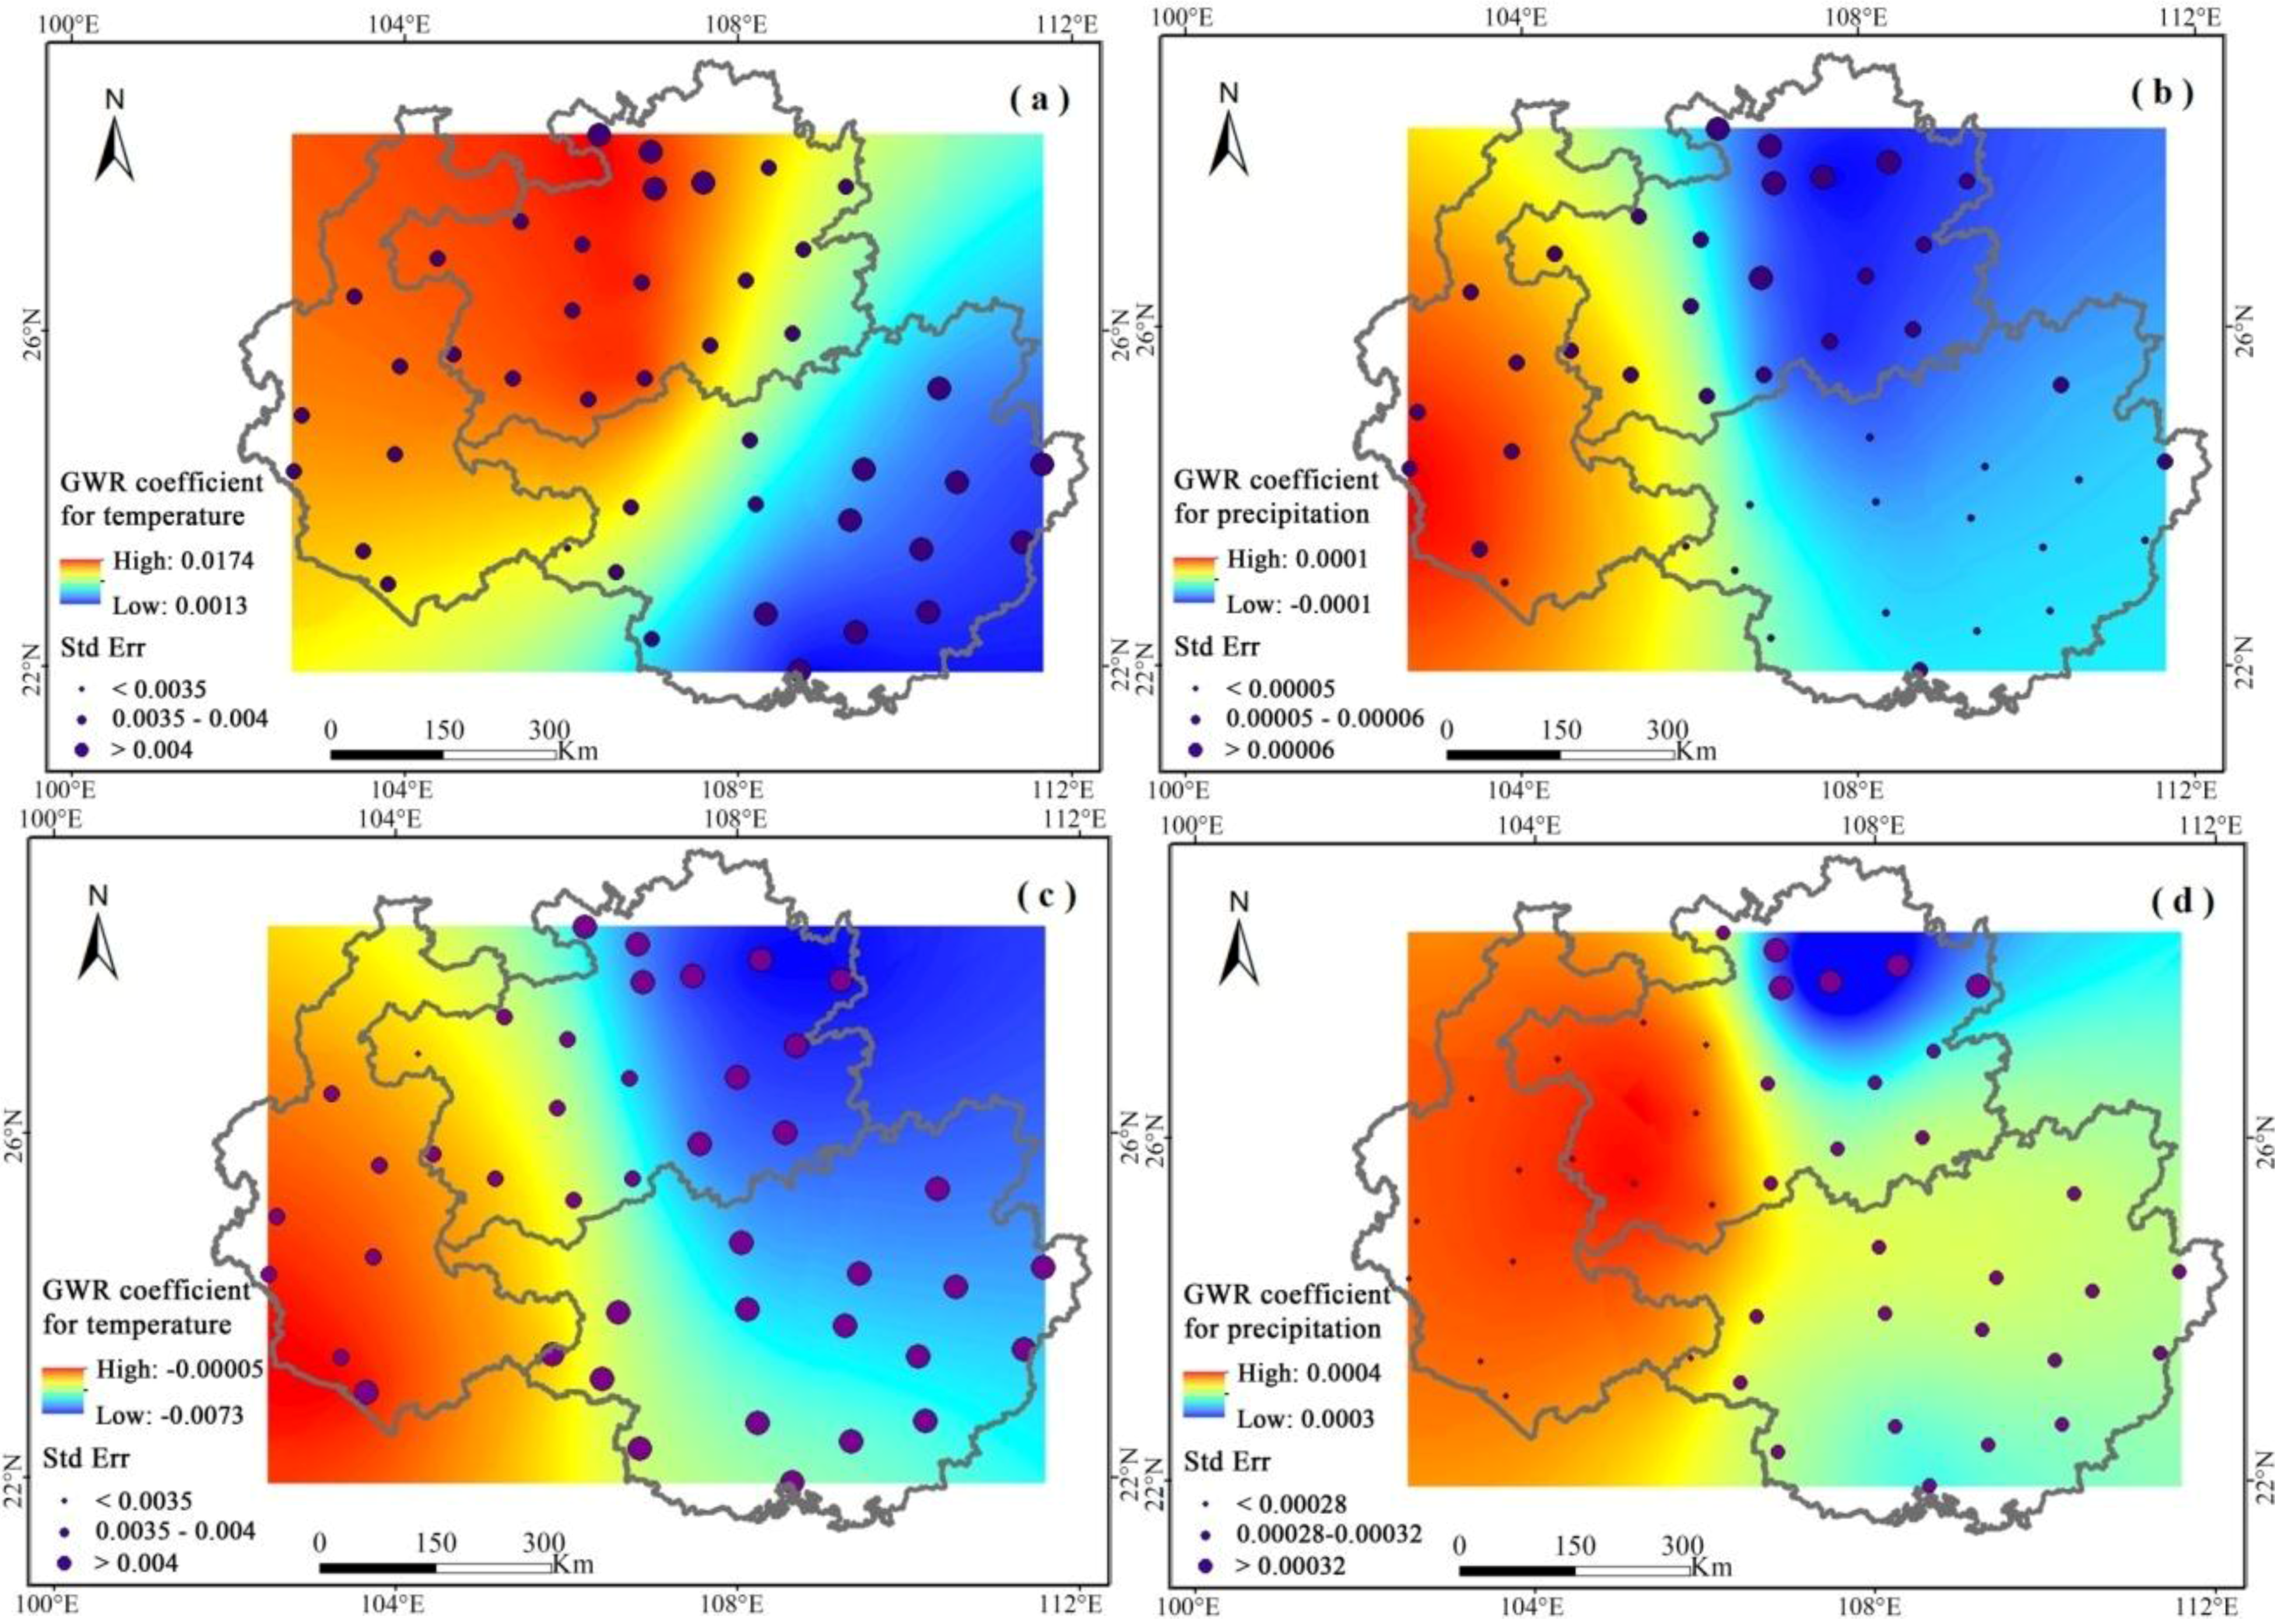
4.2.3. GWR Analysis for Spatial Relationships

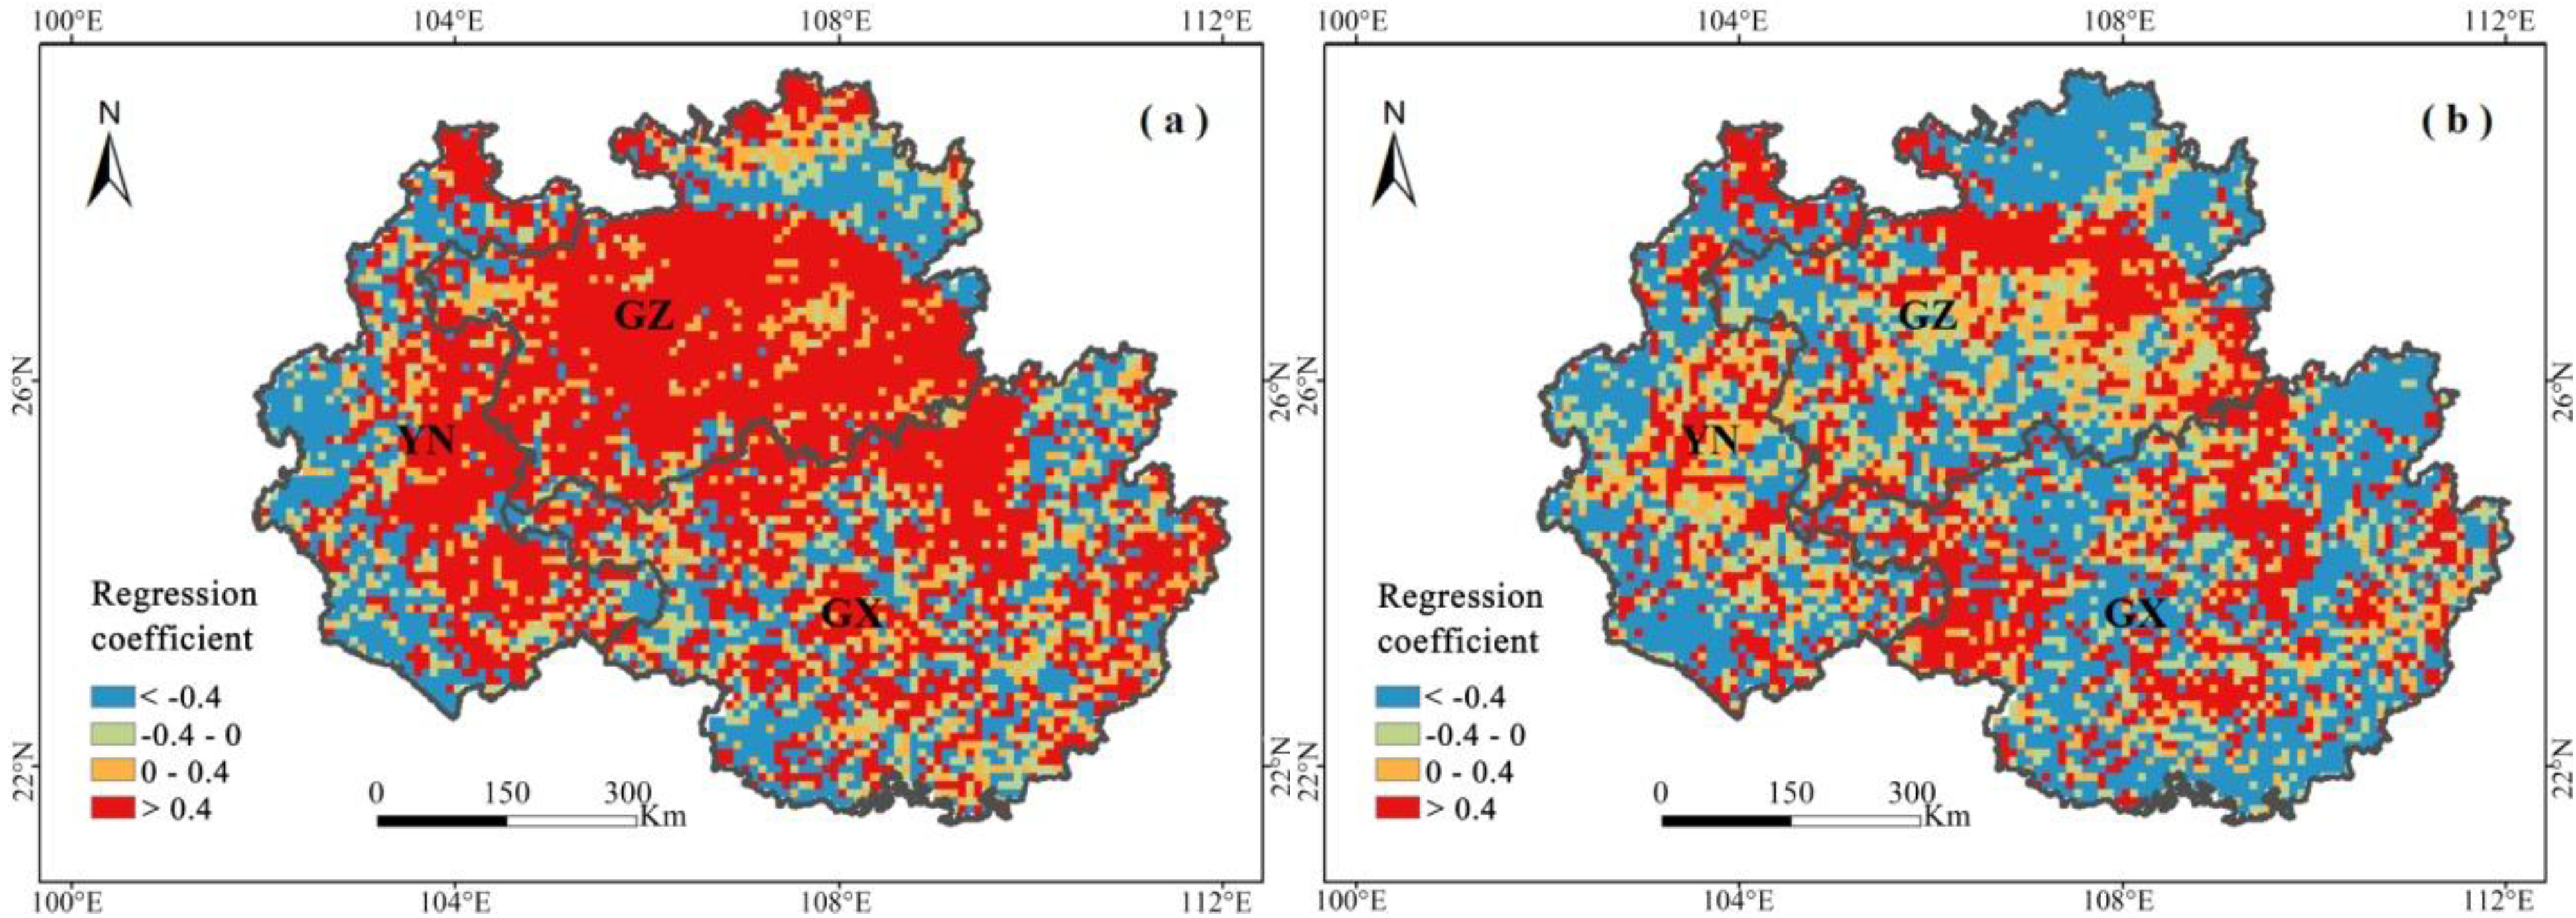
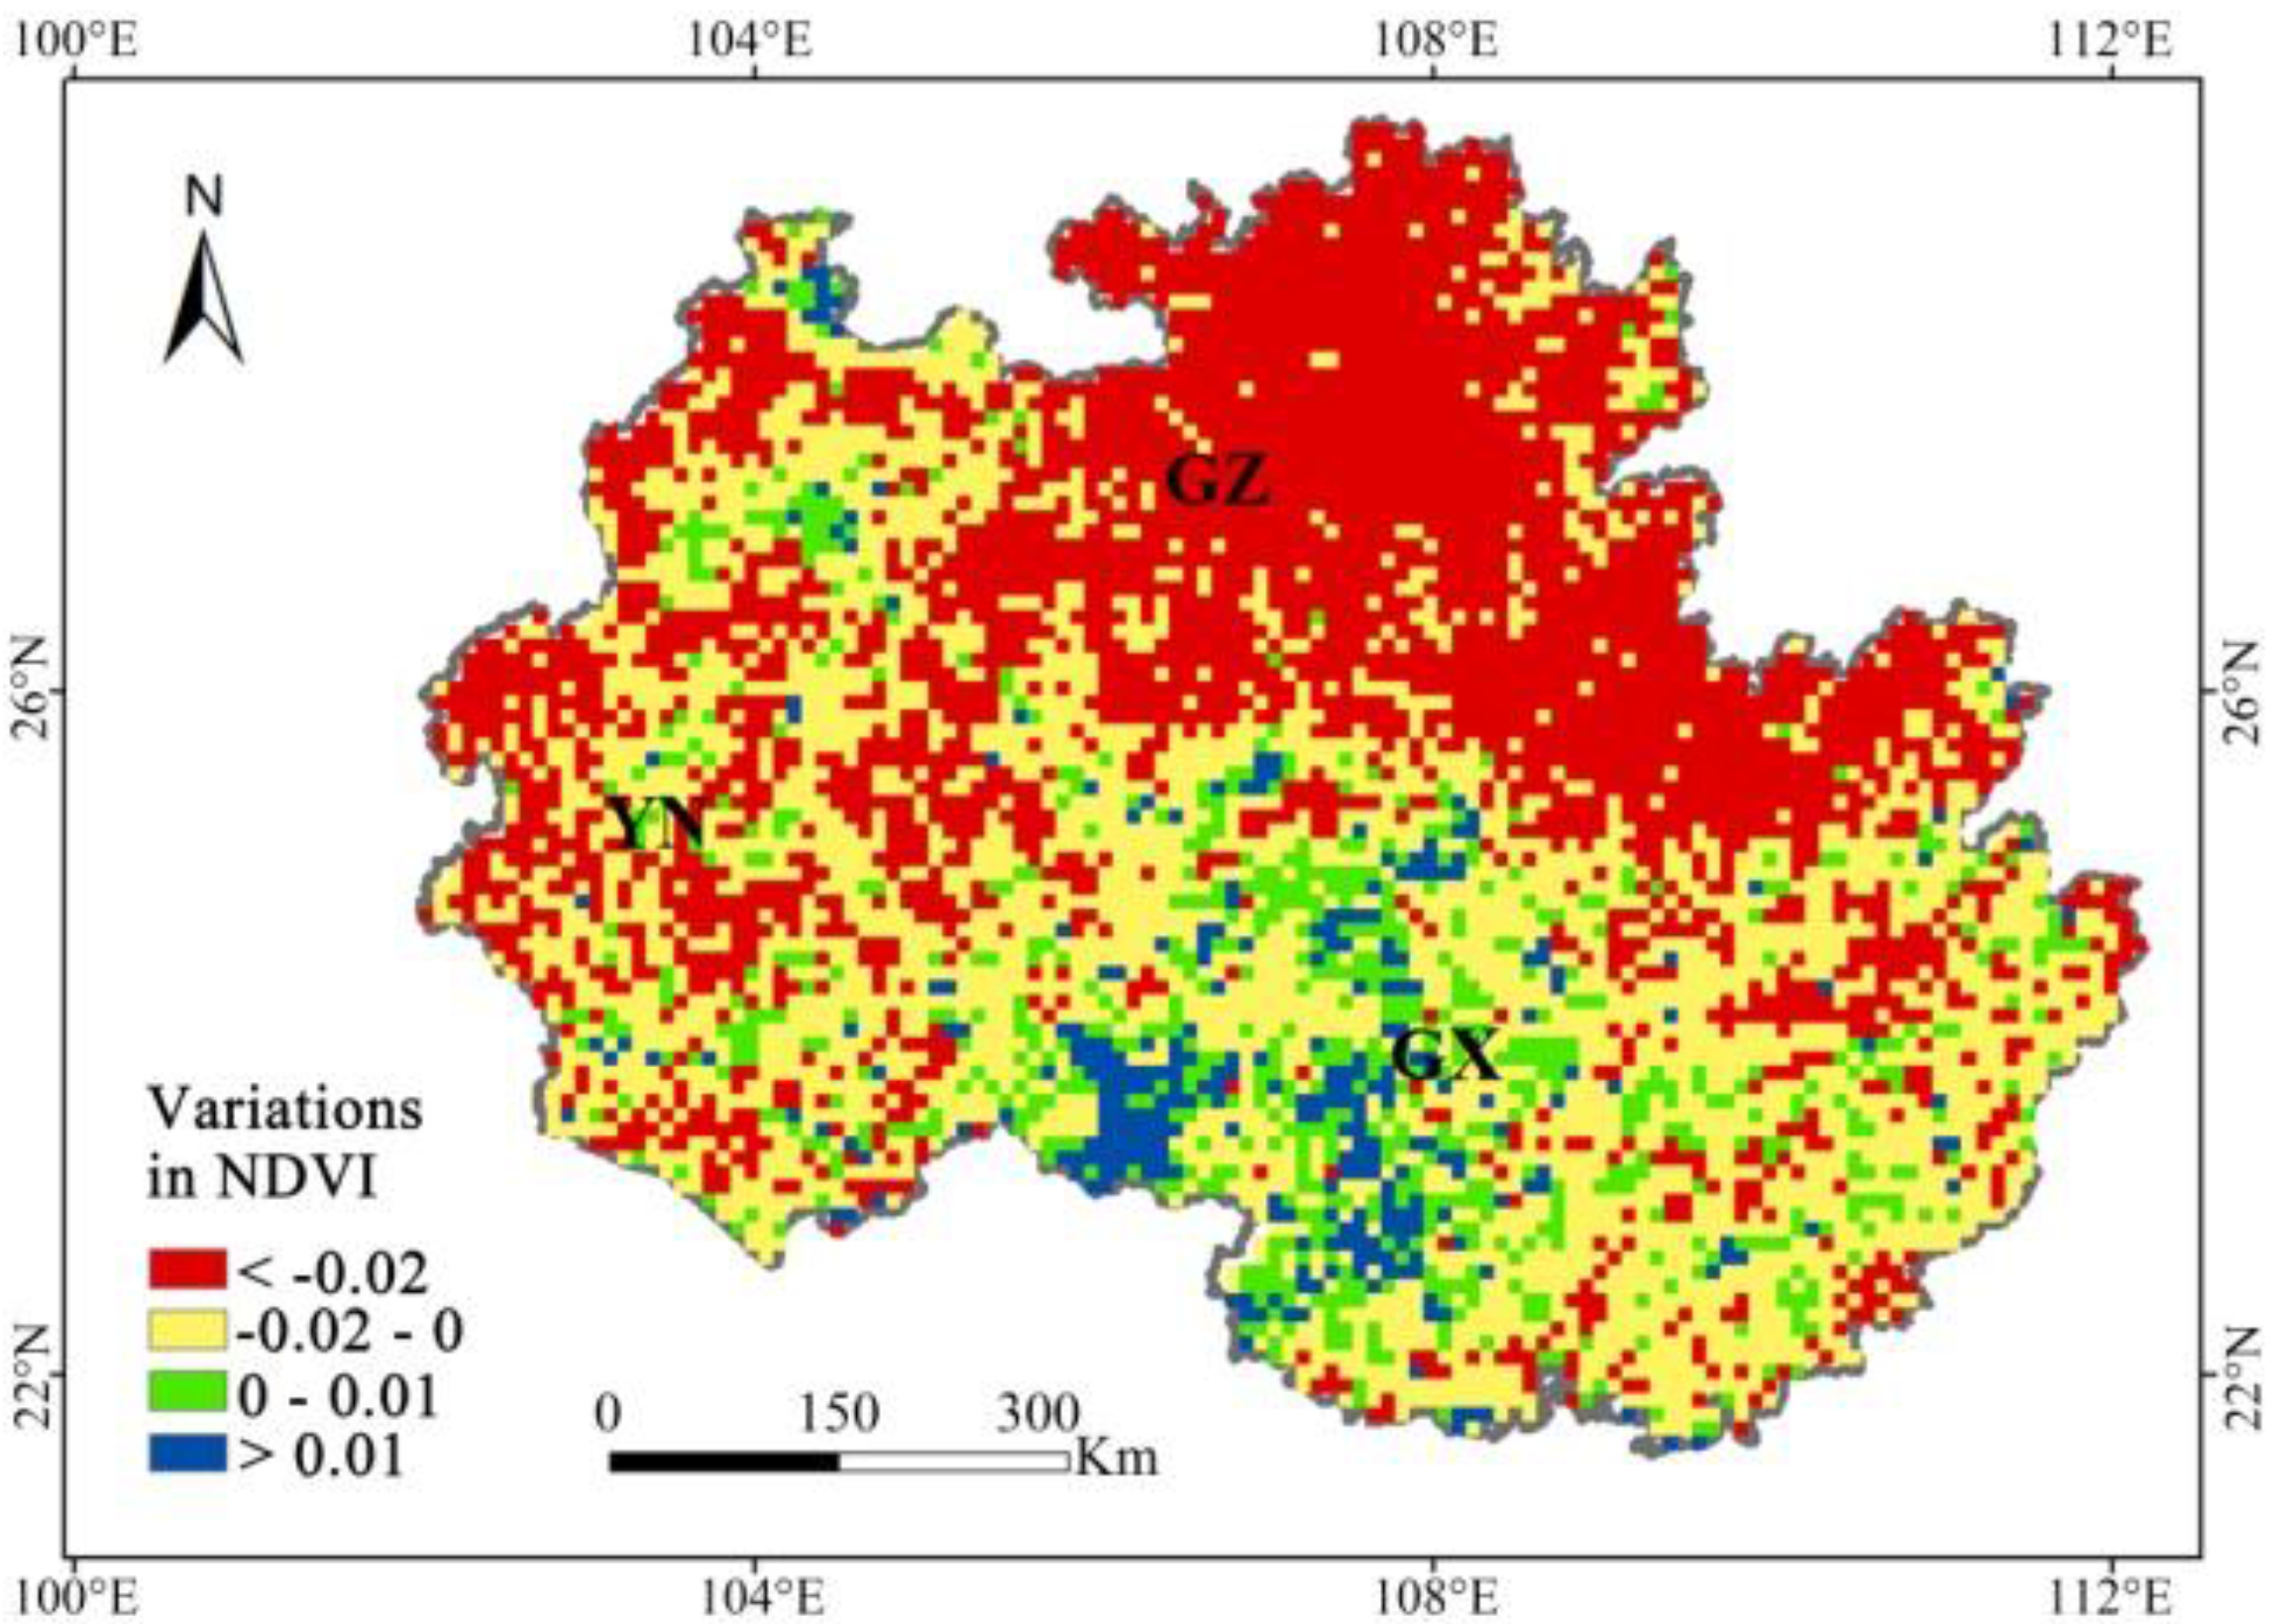
4.3. Variation Characteristics in NDVI during 2009–2012 and Its Correlation with Climate Variables

5. Discussion
6. Conclusions
Acknowledgments
Author Contributions
Conflicts of Interest
References
- Walker, B.; Steffen, W. IGBP Science No.1: A Synthesis of GCTE and Related Research. Available online: http://www.igbp.net/download/18.1b8ae20512db692f2a680007651/1376383135146/science-1.pdf (accessed on 14 June 2015).
- Parmesan, C.; Yohe, G. A globally coherent fingerprint of climate change impacts across natural systems. Nature 2003, 421, 37–42. [Google Scholar] [CrossRef] [PubMed]
- Sun, H.Y.; Wang, C.Y.; Niu, Z.; Li, B. Analysis of the vegetation cover change and the relationship between NDVI and environmental factors by using NOAA time series data. J. Remote Sens. 1998, 2, 204–210. (In Chinese) [Google Scholar]
- Piao, S.L.; Cui, M.D.; Chen, A.P.; Wang, X.H.; Ciais, P.; Liu, J.; Tang, Y.H. Altitude and temperature dependence of change in the spring vegetation green-up date from 1982 to 2006 in the Qinghai-Xizang Plateau. Agric. For. Meteorol. 2011, 151, 1599–1608. [Google Scholar] [CrossRef]
- Piao, S.L.; Wang, X.H.; Ciais, P.; Zhu, B.; Wang, T.; Liu, J. Changes in satellite-derived vegetation growth trend in temperate and boreal Eurasia from 1982 to 2006. Global Chang. Biol. 2011, 17, 3228–3239. [Google Scholar] [CrossRef]
- Beck, P.S.A.; Atzberger, C.; Hogda, K.A. Improved monitoring of vegetation dynamics at very high latitudes, a new method using MODIS NDVI. Remote Sens. Environ. 2006, 100, 321–336. [Google Scholar] [CrossRef]
- Mao, D.H.; Wang, Z.M.; Song, K.S.; Liu, D.W.; Zhang, B.; Zhang, S.M.; Luo, L.; Zhang, C.H. The vegetation NDVI variation and its responses to climate change and LUCC from 1982 to 2006 year in northeast permafrost region. Chin. Environ. Sci. 2010, 31, 283–292. [Google Scholar]
- Zhang, X.X.; Ge, Q.S.; Zheng, J.Y. Impacts and lags of global warming on vegetation in Beijing for the last 50 years based on remotely sensed data and phonological information. Chin. J. Ecol. 2005, 24, 123–130. (In Chinese) [Google Scholar]
- Xin, Z.B.; Xu, J.X.; Zheng, W. The impact of climate change and human activities on vegetation coverage in the Loess Plateau. Sci. China Ser. D Earth Sci. 2007, 37, 1504–1514. [Google Scholar]
- Brookshire, E.N.J.; Weaver, T. Long-term decline in grassland productivity driven by increasing dryness. Nat. Commun. 2015, 6. [Google Scholar] [CrossRef] [PubMed]
- Zhao, M.; Running, S.W. Drought-induced reduction in global terrestrial net primary production from 2000 through 2009. Science 2010, 329, 940–943. [Google Scholar] [CrossRef] [PubMed]
- Park, H.S.; Sohn, B. Recent trends in changes of vegetation over East Asia coupled with temperature and rainfall variations. J. Geophys. Res. 2010, 115. [Google Scholar] [CrossRef]
- Qin, D.H.; Plattner, G.K.; Tignor, M.; Allen, S.K.; Boschung, J.; Nauels, A.; Xia, Y.; Bex, V.; Midgley, P.M.; et al. Climate Change 2013: The Physical Science Basis; Cambridge University Press: Cambridge, UK; New York, NY, USA, 2013. [Google Scholar]
- Piao, S.L.; Ciais, P.; Huang, Y.; Shen, Z.H.; Peng, S.S.; Li, J.S.; Zhou, L.P.; Liu, H.Y.; Ma, Y.C.; Ding, Y.H.; et al. The impacts of climate change on water resources and agriculture in China. Nature 2010, 467, 43–51. [Google Scholar] [CrossRef] [PubMed]
- Eastman, J.; Sangermano, F.; Machado, E.; Rogan, J.; Anyamba, A. Global trends in seasonality of Normalized Difference Vegetation Index (NDVI), 1982–2011. Remote Sens. 2013, 5, 4799–4818. [Google Scholar] [CrossRef]
- Dai, S.P.; Zhang, B.; Wang, H.J.; Wang, Y.M.; Guo, L.X.; Wang, X.N.; Li, D. Vegetation cover change and the driving factors over northwest China. J. Arid Land 2011, 3, 25–33. [Google Scholar]
- Meng, M.; Ni, J.; Zong, M. Impacts of changes in climate variability on regional vegetation in China: NDVI-based analysis from 1982 to 2000. Ecol. Res. 2011, 26, 421–428. [Google Scholar] [CrossRef]
- Sun, J.; Cheng, G.; Li, W.; Sha, Y.; Yang, Y. On the variation of NDVI with the principal climatic elements in the Tibetan Plateau. Remote Sens. 2013, 5, 1894–1911. [Google Scholar] [CrossRef]
- Guo, B.; Zhou, Y.; Wang, S.X.; Tao, H.P. The relationship between NDVI and climate factors in the semi-arid region: A case study in Yalu Tsangpo River basin of Qinghai-Tibet Plateau. J. Mt. Sci. 2014, 11, 926–940. [Google Scholar] [CrossRef]
- Zhou, X.Y.; Shi, H.D.; Wang, X.R. Impact of climate change and human activities on vegetation coverage in the Mongolian Plateau. Arid Zone Res. 2014, 31, 604–610. (In Chinese) [Google Scholar]
- Wang, Z.S.; Huang, M.; Yan, H.M.; Wang, J.B.; Yue, X.L. Spatiotemporal variations of vegetation and climate impacts on it in Ghana from 1982–2006. J. Geo. Inform. Sci. 2015, 17, 78–85. (In Chinese) [Google Scholar] [CrossRef]
- Cai, H.Y.; Yang, X.H.; Wang, K.J.; Xiao, L.L. Is forest restoration in the southwest China Karst promoted mainly by climate change or human-induced factors? Remote Sens. 2014, 6, 9895–9910. [Google Scholar] [CrossRef]
- Yuan, D.X. World correlation of Karst ecosystem: Objectives and implementation plan. Adv. Earth Sci. 2001, 16, 461–466. (In Chinese) [Google Scholar]
- Cai, Y.L.; Meng, J.J. Ecological reconstruction of degraded land: A social approach. Sci. Geogr. Sin. 1999, 19, 198–204. (In Chinese) [Google Scholar]
- Huang, Q.H.; Cai, Y.L. Spatial pattern of Karst rock desertification in the middle of Guizhou province, southwestern China. Environ. Geol. 2006, 52, 1325–1330. [Google Scholar] [CrossRef]
- Peng, J.; Cai, Y.L.; He, G.; Wang, W.B.; Huang, Q.H.; Yan, F. Land use/cover change in ecologically fragile Karst areas: A case study in Maotiaohe river basin, Guizhou, China. J. Mt. Sci. 2007, 25, 566–576. (In Chinese) [Google Scholar]
- Yang, Q.Q.; Wang, K.L.; Zhang, C.H.; Yue, Y.M.; Tian, R.C.; Fan, F.D. Spatio-temporal evolution of rocky desertification and its driving forces in Karst areas of northwestern Guangxi, China. Environ. Earth Sci. 2011, 64, 383–393. [Google Scholar] [CrossRef]
- Liu, J.; Tan, X.; Wan, J.; Ma, J.; Zhang, N. Comparative analysis between the 2010 severe drought in southwest China and typical drought disasters. Chin. Water Resour. 2011, 9, 17–20. [Google Scholar]
- Wang, W.; Wang, W.J.; Li, J.S.; Wu, H.; Xu, C.; Liu, T. The impact of sustained drought on vegetation ecosystem in southwest China based on remote sensing. Procedia Environ. Sci. 2010, 2, 1679–1691. [Google Scholar] [CrossRef]
- Sellers, P.J.; Meeson, B.W.; Hall, F.G.; Asrar, G.; Murphy, R.E.; Schiffer, R.A.; Bretherton, F.P.; Dickinson, R.E.; Ellingson, R.G.; Field, C.B. Remote sensing of the land surface for studies of global change: Models-Algorithms-Experiments. Remote Sens. Environ. 1995, 51, 3–26. [Google Scholar] [CrossRef]
- Fang, J.Y.; Piao, S.L.; Tang, Z.Y.; Peng, C.H.; Ji, W. Interannual variability in net primary productivity and precipitation. Science 2001, 293, 1723. [Google Scholar] [CrossRef] [PubMed]
- Tucker, C.J.; Pinzon, J.E.; Brown, M.E.; Slayback, D.A.; Pak, E.W.; Mahoney, R.; Vermote, E.F.; el Saleous, N. An extended AVHRR 8-km NDVI dataset compatible with MODIS and SPOT vegetation NDVI data. Int. J. Remote Sens. 2005, 26, 4485–4498. [Google Scholar] [CrossRef]
- Mao, D.H.; Wang, Z.M.; Luo, L.; Ren, C.Y. Integrating AVHRR and MODIS data to monitor NDVI changes and their relationships with climatic parameters in northeast China. Int. J. Appl. Earth Obs. Geoinf. 2012, 18, 528–536. [Google Scholar] [CrossRef]
- Wang, J.; Meng, J.J.; Cai, Y.L. Assessing vegetation dynamics impacted climate change in the southwestern Karst region of China with AVHRR NDVI and AVHRR NPP time-series. Environ. Geol. 2008, 54, 1185–1195. [Google Scholar] [CrossRef]
- Li, H.X.; Wei, X.H.; Zhou, H.Y. Rain-use efficiency and NDVI-based assessment of Karst ecosystem degradation or recovery: A case study in Guangxi, China. Environ. Earth Sci. 2014. [Google Scholar] [CrossRef]
- Chen, H.L. Variations of Vegetation Cover and Its Impact on Climate and Water Source in Huanghe-Huaihe-Haihe Zone; Chinese Academy of Meteorological Sciences: Beijing, China, 2007. (In Chinese) [Google Scholar]
- Piao, S.L.; Mohammat, A.; Fang, J.Y.; Cai, Q.; Feng, J. NDVI-based increase in growth of temperate grasslands and its responses to climate changes in China. Glob. Environ. Chang. 2006, 16, 340–348. [Google Scholar] [CrossRef]
- Holben, B.N. Characteristics of maximum-value composite images from temporal AVHRR data. Int. J. Remote Sens. 1986, 7:11, 1417–1434. [Google Scholar] [CrossRef]
- China Meteorological Data Sharing Service System. The Monthly Surface Meteorological Dataset of China. Available online: http://cdc.nmic.cn/dataSetLogger.do?changeFlag=dataLogger&tpCat=SURF&titleName=%E5%9C%B0%E9%9D%A2%E6%B0%94%E8%B1%A1%E8%B5%84%E6%96%99 (accessed on 11 April 2015).
- Chen, F.J.; Shen, Y.J.; Hu, Q.L.; Qi, Y.Q.; Zhang, Y.C. Responses of NDVI to climate change in the Hai Basin. J. Remote Sens. 2011, 15, 401–414. [Google Scholar]
- Mann, H.B. Nonparametric tests against trend. Econometrica 1945, 13, 245–259. [Google Scholar] [CrossRef]
- Kendall, M.G. Rank Correlation Methods; Hafner: New York, NY, USA, 1962. [Google Scholar]
- Lanzante, J.R. Resistant, robust and non-parametric techniques for the analysis of climate data: Theory and examples, including applications to historical radiosonde station data. Int. J. Climatol. 1996, 16, 1197–1226. [Google Scholar] [CrossRef]
- Wei, F.Y. Modern Statistic Diagnosing and Predicting Techniques of Climate; China Meteorological Press: Beijing, China, 1999. (In Chinese) [Google Scholar]
- Chen, Y.; Li, B.G.; Liu, G.; Zhan, Z.G. System Analysis of Resources and Environment; Beijing Normal University Press: Beijing, China, 2009; pp. 20–24. (In Chinese) [Google Scholar]
- Fotherigham, A.S.; Brusdon, C.; Charlton, M. Geographically Weighted Regression: The Analysis of Spatially Varying Relationships; John Wiley & Sons: West Sussex, UK, 2002. [Google Scholar]
- Li, Z.; Huffman, T.; McConkey, B.; Townley-Smith, L. Monitoring and modeling spatial and temporal patterns of grassland dynamics using time-series MODIS NDVI with climate and stocking data. Remote Sens. Environ. 2013, 138, 232–244. [Google Scholar] [CrossRef]
- Wang, S.W.; Ye, J.L.; Gong, D.Y.; Zhu, J.H.; Yao, T.D. Construction of mean annual temperature series for the last one hundred years in China. Q. J. Appl. Meteorol. 1998, 9, 392–401. (In Chinese) [Google Scholar]
- Cao, L.J.; Zhao, P.; Yan, Z.W.; Jones, P.; Zhu, Y.N.; Yu, Y.; Tang, G.L. Instrumental temperature series in eastern and central China back to the nineteenth century. J. Geophys. Res. Atmos. 2013, 118, 8197–8207. [Google Scholar] [CrossRef]
- Zhang, S.F.; Su, Y.S.; Song, D.D.; Zhang, Y.Y.; Song, H.Z.; Gu, Y. The Historical Drought of China; Hehai University Press: Nanjing, China, 2008; pp. 111–666. (In Chinese) [Google Scholar]
- Liu, J.G.; Wan, J.H.; Tan, X.M.; Ma, J.M.; Zhang, N.Q. Drought in southwest China from autumn 2009 to spring 2010 and its comparative analysis with historical drought events. J. Disaster Prev. Mitig. Eng. 2011, 31, 196–200. (In Chinese) [Google Scholar]
- Fang, J.Y.; Piao, S.L.; He, J.Y. Increasing terrestrial vegetation activity in China, 1982–1999. Sci. Chin. Life Sci. 2004, 47, 229–240. [Google Scholar]
- Li, Z.X.; He, Y.Q.; An, W.L.; Song, L.L.; Zhang, W.; Catto, N.; Wang, Y.; Wang, S.J.; Liu, H.C.; Cao, W.H.; et al. Climate and glacier change in southwestern China during the past several decades. Environ. Res. Lett. 2011, 6, 45404–45427. [Google Scholar] [CrossRef]
- Lu, A.G. Precipitation effects on temperature: A case study in China. J. Earth Sci. 2011, 22, 792–798. [Google Scholar]
- Liu, F.; Wang, S.J.; Luo, H.B.; Liu, Y.S.; Liu, H.Y. Micro-habitats in Karst forest ecosystem and variability of soils. Acta Pedol. Sin. 2008, 45, 1055–1062. (In Chinese) [Google Scholar]
- Liu, C.Q. Biogeochemical Processes and the Surface Material Cycle: The Cycles of Biogenic Elements of Soil—Vegetation System in the Southwestern Karst China; Science Press: Beijing, China, 2009. [Google Scholar]
- Du, X.L.; Wang, S.J. Space-time distribution of soil water in a Karst area: A case study of the Wangjiazhai catchment, Qingzhen, Guizhou Province. Earth Environ. 2008, 36, 193–201. (In Chinese) [Google Scholar]
- Bao, G.; Qin, Z.H.; Bao, Y.H.; Zhou, Y.; Li, W.J.; Sanjjav, A. NDVI-based long-term vegetation dynamics and its response to climatic change in the Mongolian Plateau. Remote Sens. 2014, 6, 8337–8358. [Google Scholar] [CrossRef]
- Zhang, Y.L.; Gao, J.G.; Liu, L.S.; Wang, Z.F.; Ding, M.J.; Yang, X.C. NDVI-based vegetation changes and their responses to climate change from 1982 to 2011: A case study in the Koshi River Basin in the middle Himalayas. Glob. Planet. Chang. 2013, 108, 139–148. [Google Scholar] [CrossRef]
- Peng, S.S.; Piao, S.L.; Ciais, P.; Fang, J.Y.; Wang, X.H. Change in winter snow depth and its impacts on vegetation in China. Glob. Chang. Biol. 2010, 16, 3004–3013. [Google Scholar] [CrossRef]
- Jiang, D.J.; Zhang, H.; Zhang, Y.; Wang, K. Interannual variability and correlation of vegetation cover and precipitation in Eastern China. Theor. Appl. Climatol. 2014, 118, 93–105. [Google Scholar] [CrossRef]
© 2015 by the authors; licensee MDPI, Basel, Switzerland. This article is an open access article distributed under the terms and conditions of the Creative Commons Attribution license (http://creativecommons.org/licenses/by/4.0/).
Share and Cite
Hou, W.; Gao, J.; Wu, S.; Dai, E. Interannual Variations in Growing-Season NDVI and Its Correlation with Climate Variables in the Southwestern Karst Region of China. Remote Sens. 2015, 7, 11105-11124. https://doi.org/10.3390/rs70911105
Hou W, Gao J, Wu S, Dai E. Interannual Variations in Growing-Season NDVI and Its Correlation with Climate Variables in the Southwestern Karst Region of China. Remote Sensing. 2015; 7(9):11105-11124. https://doi.org/10.3390/rs70911105
Chicago/Turabian StyleHou, Wenjuan, Jiangbo Gao, Shaohong Wu, and Erfu Dai. 2015. "Interannual Variations in Growing-Season NDVI and Its Correlation with Climate Variables in the Southwestern Karst Region of China" Remote Sensing 7, no. 9: 11105-11124. https://doi.org/10.3390/rs70911105