Article

Aerosol Optical and Microphysical Properties of Four Typical Sites of SONET in China Based on Remote Sensing Measurements

1
State Key Laboratory of Remote Sensing Science, Institute of Remote Sensing and Digital Earth, Chinese Academy of Sciences, Beijing 100101, China
2
University of Chinese Academy of Sciences, Beijing 100049, China
*
Author to whom correspondence should be addressed.
Remote Sens. 2015, 7(8), 9928-9953; https://doi.org/10.3390/rs70809928
Submission received: 28 March 2015 / Revised: 24 July 2015 / Accepted: 28 July 2015 / Published: 5 August 2015

Abstract

:
The current understanding of columnar aerosol optical and microphysical properties of different regions and seasons in China is insufficient due to the lack of measurements. Aiming to improve descriptions of aerosol models over China, this paper presents a systematic aerosol characterization of different sites based on a newly developed remote sensing network for aerosol observation, the Sun-sky radiometer Observation NETwork (SONET). One year of ground-based solar and sky radiation measurements of four typical sites of SONET (Beijing–urban-industrial site, Zhangye—rural site, Minqin—desert site, Zhoushan–oceanic site) are used to retrieve aerosol properties using similar inversion algorithms with AErosol RObotic NETwork (AERONET), including aerosol optical depth, Ångström exponent, volume size distribution, complex refractive index, single scattering albedo, and percentage of spherical particles. The retrieved properties among sites and seasons are found to be different in terms of magnitude, spectral dependence, and partition of fine and coarse mode, which can be primarily explained by different aerosol composition and mixing states that closely relate to the local climate, the natural environment, and most importantly, the ubiquitous anthropogenic impacts. For example, large dust particles greatly contribute to the low fine mode fraction in both volume concentration and optical depth for the Minqin site through the entire year, while abundant small particles that mainly come from emission sources dominate the size distribution and light extinction of aerosol in the summer at the Beijing site. The results also show general agreements with other studies on the aerosol properties at each site, however, some unique features are still noticeable, especially at the desert site and oceanic site (e.g., the unusually strong aerosol absorptivity indicated by the large imaginary refractive index and low single scattering albedo at the Minqin and Zhoushan sites), which can be partly attributed to the existence of absorbing particles coming from anthropogenic sources.

Graphical Abstract

1. Introduction

Atmospheric aerosol is one of the most important determining factors of direct radiative forcing and indirect effects on clouds [1]. The assessments of radiative forcing depend greatly on aerosol optical properties [2,3]. For example, direct radiative forcing from aerosol is primarily connected to aerosol concentration (aerosol optical depth, AOD), particle size, and absorption/scattering properties [4]. However, the complicated aerosol optical properties still bring very large uncertainties to the estimation of climate change at a global scale [5,6], due to the highly inhomogeneous spatial distributions [7] and temporal variations [8] of the global aerosol. The diverse types of aerosol also lead to highly variable optical properties depending on different sources, emission rates, and removal mechanisms [9]. In addition, aerosol optical properties such as AOD, single scattering albedo (SSA), and fine mode fraction in optical depth (FMF) are also important since they are usually used to describe aerosol pollution events, as more and more significant atmospheric pollution caused by aerosols has caused serious health and traffic safety issues in recent years, especially in China [10,11]. Whether the assessments of aerosol radiative forcing and environmental effects are realistic and meaningful depends greatly on if the optical and microphysical properties of aerosol are well-grounded.
Aerosol properties can be obtained through laboratory measurements (e.g., [12,13]), but it is difficult to get the properties of columnar aerosol since the aerosols are mostly sampled at the surface level, and the sampling methods might alter the natural status of ambient aerosol [10,14]. Remote sensing techniques, especially ground-based remote sensing, can overcome these problems [15,16]. Satellite remote sensing plays an important role in aerosol detection as it can obtain aerosol information (e.g., AOD) with global coverage, however, it’s difficult to retrieve other properties like single scattering albedo (SSA) from satellite measurements [17,18]. Although the Ozone Monitoring Instrument (OMI) on the Aura satellite provides both AOD and SSA retrievals, their accuracies are quite low (~30% and 0.1 for AOD and SSA, respectively [19]) compared to ground-based retrievals, probably due to the impacts caused by uncertainties in surface albedo given that the surface information contributes largely to the measured radiance [20].
Ground-based remote sensing is a very useful approach for columnar aerosol detection [21] as it provides the multi-angle, multi-wavelength, and polarimetric measurements of solar and sky radiation [22,23]. Although measurements of a single instrument cannot provide global coverage, the aerosol observation networks built in the last decades have realized the integration of aerosol properties at regional and even global scales [24], making ground-based remote sensing a routine aerosol monitoring technique [25]. AErosol RObotic NETwork (AERONET) [24,26] uses CIMEL sun-sky radiometer CE318 to measure direct solar irradiance and diffuse sky radiance, and then derives aerosol optical and microphysical properties in a global context. Other networks focusing on global or regional aerosol detection include SKYNET [27], PHOTONS [28], AEROCAN [29], and CARSNET [30] and CHSNET [31] in China.
There are some studies on aerosol properties acquired by ground-based remote sensing over China. Some of them mainly focused on AOD and Ångström exponent (AE) (e.g., [30,31]), some additionally studied absorption and scattering coefficients, SSA, and the absorption Ångström exponent (AAE) (e.g., [32,33,34]). These studies did not attempt to investigate aerosol microphysical properties like complex refractive indices (RI) and size distribution. Fortunately, some other studies did more complete work [21,35]. For example, Xu et al. [36] analyzed the temporal variation of dust aerosol properties in a year, including AOD, AE, SSA, RI, size distribution, scattering phase function, and degree of linear polarization from sun-sky radiometer measurements. There is also some research focused on aerosol properties during some specific weather processes or pollution episodes [11,37,38,39]. For example, Li et al. [10] summarized the optical, microphysical, and chemical properties of haze aerosol during two pollution episodes in the winters of 2012 and 2013 in Beijing. Li et al. [34] found the decrease of residual aerosol and an unusual case of residual aerosol increase during the different processes of a haze episode. In addition, some research concentrated on the properties of a single type aerosol, e.g., urban-industrial (e.g., [40]), rural (e.g., [32]), desert dust (e.g., [41]), and oceanic [42].
Currently, there is still a lack of comprehensive analysis of aerosol properties and comparisons among different aerosol types (like the work of Dubovik et al. [20]) over China based on an observation lasting at least an entire year (in order to obtain seasonal variability), probably because at the present stage there are no sufficient measurements of columnar aerosol properties in China. This paper aims to utilize one-year, ground-based remote sensing measurements in a newly developed network based on CE318 [43], the Sun-sky radiometer Observation NETwork (SONET), to investigate the seasonal optical and microphysical properties of aerosol from four typical sites over China. We believe that such a detailed characterization of aerosols could significantly improve the descriptions of aerosol models over China, and also extend their applicability, for example, in modeling aerosol impacts on climate and in improving atmospheric radiative transfer models (like 6S) by providing more accurate and realistic parameters. In Section 2, SONET is briefly introduced and the selected urban-industrial, rural, desert dust, and oceanic sites are described. Section 3 introduces the retrieval methods of aerosol properties following the calibration of solar and sky radiation measurements. In Section 4, we present the columnar aerosol properties of the four sites, including aerosol optical depth, Ångström exponent, volume size distribution, complex refractive index, single scattering albedo, and percentage of spherical particles. The differences of aerosol properties among sites, seasons, and similarities with other studies are also analyzed by considering the regional climate, natural sources, and anthropogenic emissions in this section.

2. SONET and Observation Sites

2.1. Sun-Sky Radiometer Observation Network

SONET, established, manipulated, and maintained by the Institute of Remote Sensing and Digital Earth, Chinese Academy of Sciences, aims to acquire the optical, microphysical, and composition properties of aerosol from different regions in China to investigate aerosol radiative and environmental effects and to provide validation for satellite aerosol products. SONET has a dozen regular observation sites (including seven sites with observation lasting for more than one year and some recently added sites, as shown by Figure 1) and some temporary sites (for short-term experiments and campaigns) distributed all over China. SONET utilizes the standardized instrument sun-sky radiometer CE318 to acquire dozens of aerosol properties and one can find detailed descriptions of this network from Li et al. [43].
Figure 1. Locations of SONET observation sites. The three sites with measurements taken for more than one year (green dot) are not investigated in this study because of their proximity to the selected sites (red dot).
Remotesensing 07 09928 g001
The instruments provide direct solar irradiance measurements at nine individual spectral channels (340, 380, 440, 500, 675, 870, 936, 1020, 1640 nm) and sky radiance measurements in the almucantar (ALM) and principal plane (PP) configurations at 440, 675, 870, and 1020 nm. The sun and sky measurements are calibrated and then used to acquire aerosol optical and microphysical properties.

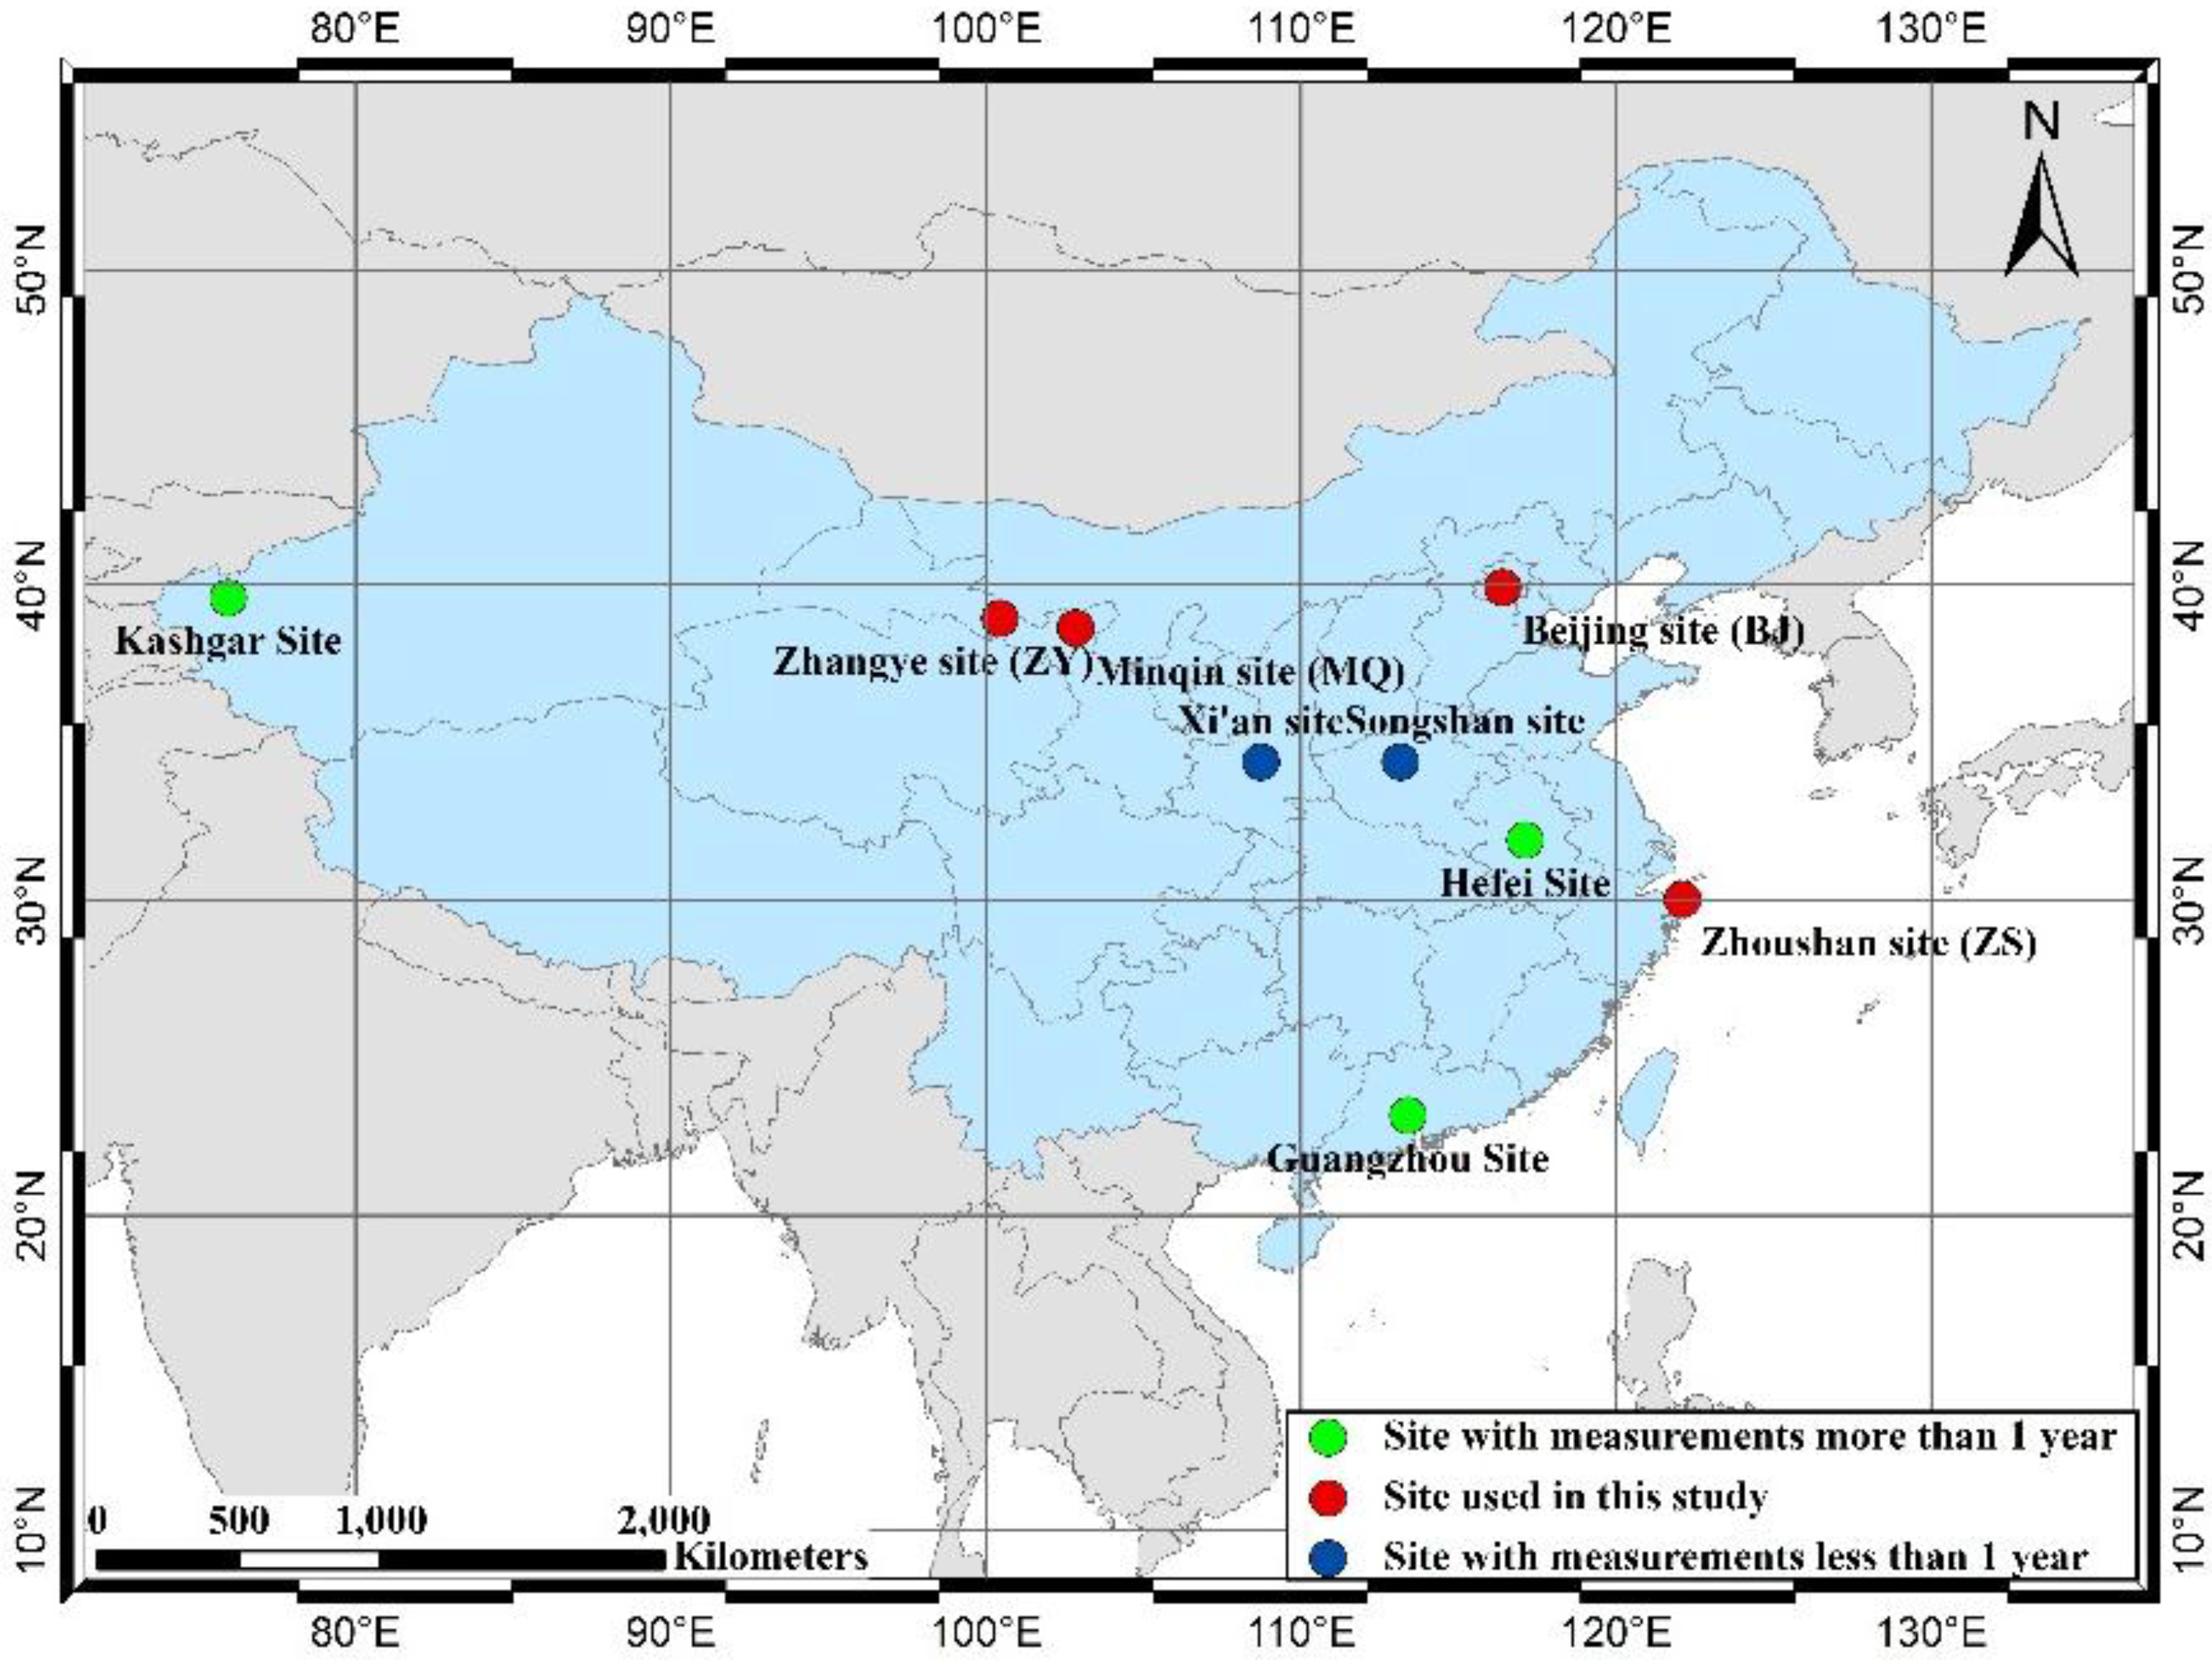
2.2. Observation Sites and Data

We chose four typical sites from SONET in this paper. The Beijing site (BJ), Zhangye site (ZY), Minqin site (MQ), and Zhoushan site (ZS) are considered representatives of urban-industrial, rural, desert dust, and oceanic sites, respectively, given their geographical locations, local climate, and natural and anthropogenic sources (other currently available sites in SONET also belong to the four types). We basically selected these sites by reference to the key aerosol types of Dubovik et al. [20] (i.e., the urban-industrial type, desert dust type, and oceanic type), and the cluster analysis of Omar et al. [9] (i.e., the rural type). Because there is no typical biomass burning site in the current SONET, the characterization of this aerosol type is not attainable yet. We have to mention that this paper is concerned more with aerosol properties of typical sites rather than properties of aerosol types, as many previous studies have done, due to the lack of “pure aerosol” models in China. However, as measurements for different sites or aerosol types accumulate, studies on pure aerosol types in China will certainly be conducted.
The Beijing site (BJ; 40.00°N, 116.38°E; 59 m) is a typical urban-industrial site that is dominated by polluted aerosols. Sometimes it is also affected by dust generated locally or transported from remote northern regions of China (e.g., Inner Mongolia Province). Beijing is located in the North China Plain with its three sides surrounded by mountains that decrease wind speed and prevent the migration and diffusion of atmospheric pollutants. Furthermore, increasing energy consumption, industry emissions, and motor vehicles together make Beijing a vulnerable city that suffers from serious haze pollution, especially in winter days with steady atmospheric stratification and a thick inversion layer [10].
The Zhangye site (ZY; 38.85°N, 100.36°E; 1589 m) is located on a residential building in the Wuxing Village in the hinterland of the Hexi Corridor in the west of China, surrounded mainly by farmland and no industrial or vehicle sources. Towns, villages, and industrial and mining regions together only take up about 1% of the total area of Zhangye; most of the rest of the area is composed of farmland, forestland, and grassland. In this study, ZY is treated as a representative of the rural site.
The Minqin site (MQ; 38.63°N, 103.09°E; 1363 m) is located on a building at the northwest edge of Minqin County in the northeast of the Hexi Corridor, only a few kilometers from the Badain Jaran Desert. Due to the arid climate, poor precipitation, rare vegetation, and serious desertification, Minqin County is one of the most dust-affected regions in China [36], and is accordingly selected as a dust-dominating site.
The Zhoushan site (ZS; 29.99°N, 122.19°E; 29 m) is located on a building in the south of the main island of the Zhoushan Archipelago, about 1 km from the East China Sea. The atmosphere in Zhoushan is clean thanks to the high precipitation throughout the year and high forest coverage all over the islands. Perennial sea winds in Zhoushan also bring good, natural purification ability to the atmosphere. In this paper we selected ZS as a representative of the oceanic site.
Data used in this paper are summarized in Table 1. We collected measurements of an entire year (from March to the following February) for each site to investigate seasonal variations of aerosol properties (spring: March to May, summer: June to August, autumn: September to November, winter: December to February). ZY data is one year later than the other sites (from March 2013 to February 2014) because it was established later.
Table 1. Summary of measurements of the four typical sites and seasons *.
Site Observation PeriodSeasonN. of Aerosol Optical DepthN. of Retrievals (Size Distribution)N. of Retrievals (Other Parameters)
Beijing (BJ) March 2012–February 2013Spring284215128
Summer21210356
Autumn396232144
Winter374204102
Zhangye (ZY) March 2013–February 2014Spring40712753
Summer4249926
Autumn33029575
Winter1558739
Minqin (MQ) March 2012–February 2013Spring32310073
Summer31110453
Autumn40418664
Winter137857
Zhoushan (ZS) March 2012–February 2013Spring460206180
Summer2788846
Autumn335232144
Winter282150135
* The last three columns are the number of AOD measurements (level 1.5, direct sun measurements passed cloud screening), the number of volume size distribution retrievals (under criterions of solar zenith > 50 degrees and sky residual errors < 5%), and the number of the refractive index, SSA, and sphericity (under criterions of AOD (440 nm) > 0.2, solar zenith >50 degrees, and sky residual errors < 5%). The criterions of data selection will be introduced in Section 3.2.

3. Methodology

3.1. Calibration of Sun-Sky Radiometer

The measurements of the sun-sky radiometer need to be calibrated before being added to inversion. For direct sun measurement calibration, we implemented a synchronous observation during a field campaign and compare all of the SONET instruments to a reference instrument calibrated by the Langley plot method at Izana, Spain by PHOTONS. This is based on the assumption that AOD measured by the reference instrument and calibrating instruments at the same time and same location should be equal. Applying this assumption to the Beer-Lambert law, we can derive
V 0 , cal ( λ ) = V c a l ( λ ) V r e f ( λ ) V 0 , r e f ( λ )
where the subscript cal and ref denote the calibrating instrument and reference instrument, respectively. V(λ) is the instrument signal at wavelength λ; V0(λ) is the instrument signal at the top of the atmosphere (TOA), i.e., the calibration constant at wavelength λ. In Equation (1), Vcal and Vref are measurements and V0,ref is already known, and we can directly calculate the constant of the calibrating instrument. The accuracy of AOD after this calibration method can reach up to 0.01–0.02 [24]. Note that measurements at 936 nm are seriously affected by water vapor absorption, so an improved Langley plot method is applied to this channel.
We apply a transferring calibration method proposed by Li et al. [44,45] to obtain sky calibration coefficient Csky. This method was developed based on the internal structure of the instrument. The V0 and Csky are connected by the aureole calibration coefficient Caur. A geometric parameter, solid angle Ω, is used to associate V0 and Caur, then Caur is further related to Csky by the aureole and dark-sky measurements at a scanning angle of 6° as they are assumed to measure the same radiance. The relationship between V0 and Csky is accordingly established and the calibration coefficients of the sky measurement can be obtained. Uncertainty of the transferring calibration method is estimated to be 3%–5%. Details of the transferring calibration method can be found in Li et al. [44].

3.2. Inversion of Aerosol Properties

Since measurements of CE318 are easily affected by clouds and unstable weather, an appropriate data-screening algorithm for both sun and sky measurements should be implemented before inversion. For direct sun measurements, the cloud screening algorithm of AERONET [46] is performed, based on an assumption that signal values during one triple-measurement should be at a relatively high level (the signals are dependent on gains) and close enough to each other under cloud-free weather. For sky measurements at the ALM mode, an asymmetry test is utilized to screen the measurements at some angles that are possibly sheltered while keeping at least 21 measurements in one ALM scan [47].
AOD of each wavelength (340–1640 nm) are acquired using direct sun measurements passed through cloud screening based on the Beer-Bouguer-Lambert law:
F ( λ ) = F 0 ( λ ) exp [ m τ ( λ ) ]
where F and F0 are measured solar irradiance at the surface and TOA, respectively. m denotes equivalent optical airmass and τ(λ) is total optical depth at wavelength λ. The key to obtain AOD (τaer) is to eliminate the contributions of absorbing gases (τgas) and Rayleigh molecule scattering (τRay) from the total optical depth:
τ a e r ( λ ) = τ ( λ ) τ R a y ( λ ) τ g a s ( λ )
τgas can be obtained by calculating the effective absorbing coefficients of absorbing components such as CO, O3, and NOx, and τRay is derived from the empirical model proposed by Frohlich and Shaw [48]. According to the derived AOD at different wavelengths, Ångström exponent (AE) is calculated using
τ a e r ( λ 1 ) / τ a e r ( λ 2 ) = ( λ 1 / λ 2 ) A E
where λ1 and λ2 can be different wavelength pairs. The AE of SONET data is calculated with AOD at 440 and 870 nm, the same as AERONET.
Other optical and microphysical properties of aerosol are obtained utilizing the statistical estimation-based algorithm developed by Dubovik and King [49] and Dubovik et al. [50], which is also the standard inversion algorithm of AERONET products. The derived spectral AOD, the sky radiance measurements at different wavelengths and different scattering angles, together with surface albedo obtained from MODIS [10], and solar zenith and observation azimuth are input to the optimized numerical inversion. In the inversion, aerosol particles are assumed to be spheroids, and the discrete ordinates method [51] is employed for atmospheric radiative transfer modeling. The inversion algorithm simulates sky spectral radiance at certain observation geometries and searches for the best fit of all input data with various a priori constraints [49]. The upper limit of the real refractive index (n) is set to be 1.7 for SONET, instead of 1.6 as in AERONET. This boundary value has also been used by some other research (e.g., [52,53]). Another difference with the AERONET retrieval concerns ground reflectance: for SONET the ground reflectance is assumed to be Lambertian with the albedo obtained from a five-year, half-monthly average MODIS climatology [10,23].
The optical and microphysical properties of aerosol investigated in this study include AOD, AE, size distribution, RI (real part n and imaginary part k), SSA, and sphericity. Note that AOD, SSA, and RI are given at the four AERONET standard wavelengths (440, 675, 870, and 1020 nm). The volume size distribution of aerosol is retrieved in accordance to the best fit to a two-mode lognormal size distribution and provided in 22 discrete size bins ranging from 0.05 to 15 μm. The uncertainties of these aerosol properties, as listed in Table 2, can also be found in previous studies (e.g., [10,20,49]). The criterions of the solar zenith >50 degrees and sky residual <5% are applied to retrievals including size distribution, spectral n, k, SSA, and the percentage of spherical particles to ensure the high quality of the retrievals. We should mention that we do not perform restriction of AOD (440 nm) >0.4 for n, k, and SSA, as with AERONET level 2 products ([54]). The strict AERONET criteria would screen almost all retrievals at a clean site (e.g., ZY) due to the low aerosol optical depth (see Section 4.1), and thus it would be impossible to analyze the aerosol properties. Alternatively, we use a more liberal limitation in this study, AOD (440 nm) >0.2, on the basis of the solar zenith and sky residual criterions. We also apply manual viewing to the retrievals. For example, we have extra polarization measurements at each site, which can be used to verify the reliability of those retrievals under low AOD situations [55]. We should note that such data criteria can possibly result in the inconsistency of data samples, and it cannot be used for certain study fields (e.g., the climatic effect of aerosols). In this study, however, we primarily present a systematic characterization of aerosols, and the inconsistency would not affect it much because most of the parameters are analyzed independently and they mainly have good data integrity.
Table 2. Uncertainties of the complex refractive index (real and imaginary part), size distribution, SSA, and AOD [54] *.
Aerosol ParametersUncertainties
Refractive indexReal part n0.04 (0.025–0.05)
Imaginary part k40% (30%–100%)
Size distribution0.1 μm < r < 7 μm25% (15%–35%)
r > 7 μm & r < 0.1 μm50% (15%–100%)
SSA0.03 (0.03~0.07)
AOD0.01–0.02
* The values in the brackets denote the uncertainty range under different situations while the values outside are typical uncertainties of each parameter. Listed values cover different aerosol types including water-soluble, dust and biomass burning aerosol, and different aerosol loadings.

4. Results and Discussion

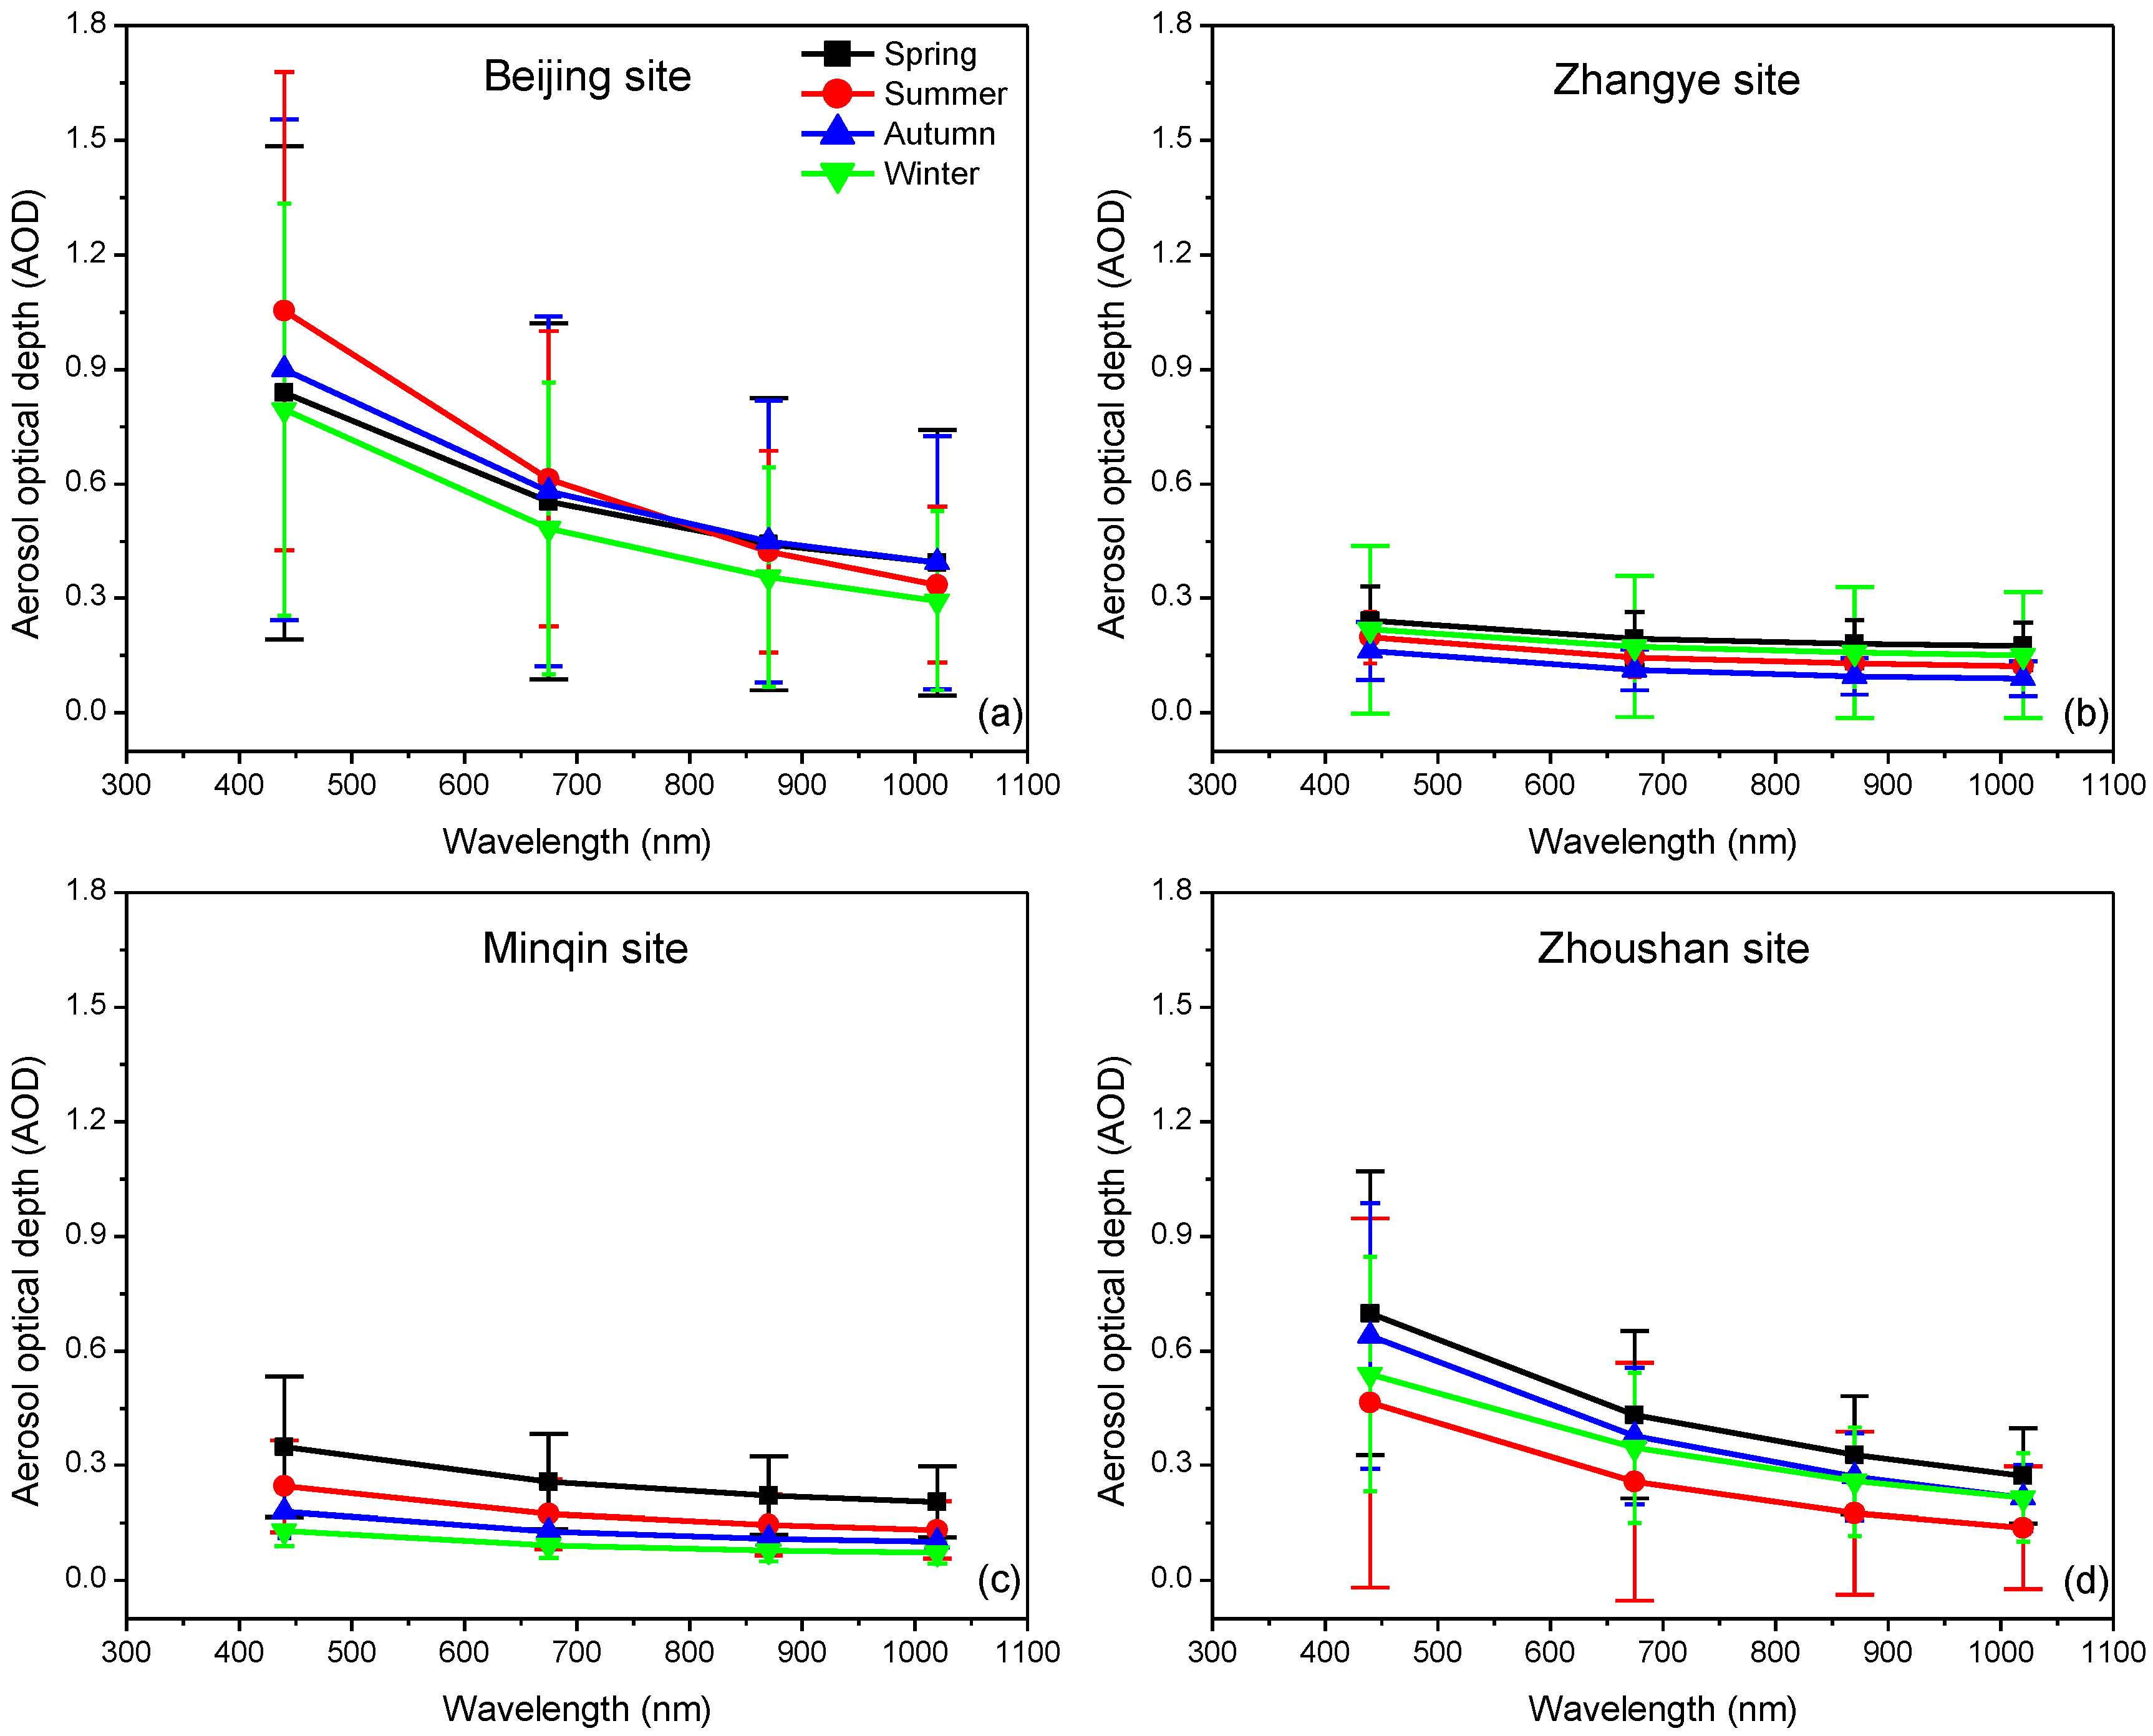
4.1. Aerosol Optical Depth

The seasonal averages of AOD of the four sites are shown in Figure 2. We can see that aerosol at BJ has stronger extinction than the other sites. For example, the average AOD in the summer is about 1.05 ± 0.63, much higher than for ZY (0.20 ± 0.07), MQ (0.25 ± 0.12), and ZS (0.46 ± 0.48). For the rural site ZY, in contrast, AOD is low and the average at all seasons is smaller than 0.3, thanks to very few emission sources in ZY. However, we compare AOD measurements of ZY with other studies (e.g., the rural/background type from [9]) and find that ZY has much larger aerosol loadings (0.15 at 675 nm) than other rural sites (0.04 at 673 nm), and these can be attributed to the high percentage of dust particles, considering ZY easily suffers from dust impacts. The annual average AOD at MQ (0.26 ± 0.09) is comparable to that of ZY (0.21 ± 0.03) while smaller than that of ZS (0.59 ± 0.10) and BJ (0.90 ± 0.11).
The observed high AOD in the summer of BJ is similar to some research (e.g., [4,18]). For ZY and MQ, we use the T-test to check the AOD differences between seasons. The results show that the AOD (440 nm) differences between spring and other seasons in MQ are statistically significant, and this is consistent with the seasonal variation of dust particles. However, in ZY, where aerosol is also affected by dust, there is no significant difference among seasons, probably because AOD are quite small at this site. In ZS, the smallest average AOD appears in the summer (0.46 ± 0.48) thanks to the strong self-cleaning capacity of the atmosphere at this season (i.e., frequent rainfall and maritime monsoons). We notice the seasonal average AOD of ZS shows a maximum (0.70 ± 0.37) in spring, when the northwest winds prevail, probably due to the transport of inland aerosols. Smirnov et al. [42] found the same spring seasonal peaks at Lanai, Hawaii, and attributed them to the long-range transport of Asian aerosols.
Table 3 summarizes the fine mode extinction, AODf, and fine mode fraction of AOD (FMF = AODf/AOD) at 440 nm. The extinction of BJ is dominated by fine mode aerosol throughout the whole year, though with considerable variation among seasons. Due to the existence of many coarse particles, FMF in spring is much smaller than in summer and winter, when the FMF is about 93% and 91%, respectively. ZS has a higher FMF with less variation among seasons than BJ. In summer, autumn, and winter, the FMF at ZS is around 90% and drops to 82% in spring. Compared to BJ and ZS, the coarse mode aerosol at ZY and MQ contributes more to the total extinction (with a FMF of 50%~70%), even exceeding fine mode aerosol (48% for ZY in spring), since these two sites are more easily affected by dust.
From Figure 2 we also notice some differences in AOD spectra among sites. The decreasing pattern of AOD spectra of BJ and ZS are more significant than ZY and MQ. This can be explained by the Ångström exponent (AE). AE is calculated by AOD at different wavelengths (see Equation (4)) and can reflect the particulate size of aerosols, so that a large AE means significant spectral dependency of optical depth and small particle size. In our study, the mixed or fine mode dominating aerosols of BJ and ZS show large AE and significant AOD spectra; for ZY and MQ, in contrast, AE is obviously lower and thus AOD has almost no spectral dependence (see Figure 3). Some seasonal differences in AOD can be explained by a similar reason. For example, in BJ, the difference of AOD between 440 and 870 nm in summer is more significant than in other seasons.
Figure 2. Seasonal average of aerosol optical depth of the four sites, (a) Beijing site; (b) Zhangye site; (c) Minqin site; (d) Zhoushan site. Error bar indicates the standard deviation of the average.
Remotesensing 07 09928 g002
Table 3. Fine mode aerosol optical depth (AODf) and fine mode fraction in optical depth (FMF) at 440 nm of the four sites in each season.
SiteSeasonAODf (440 nm)FMF (440 nm)
BJSpring0.63 ± 0.570.75
Summer0.98 ± 0.620.93
Autumn0.71 ± 0.610.79
Winter0.73 ± 0.530.91
ZYSpring0.12 ± 0.060.48
Summer0.11 ± 0.050.57
Autumn0.10 ± 0.050.63
Winter0.11 ± 0.110.52
MQSpring0.22 ± 0.160.64
Summer0.17 ± 0.090.68
Autumn0.12 ± 0.060.64
Winter0.13 ± 0.070.58
ZSSpring0.58 ± 0.360.82
Summer0.43 ± 0.480.92
Autumn0.57 ± 0.350.89
Winter0.49 ± 0.310.91
Figure 3. Ångström exponent indices statistics of the four sites. (a) Beijing site; (b) Zhangye site; (c) Minqin site; (d) Zhoushan site. The small squares and lines crossing in the box respectively denote mean and median values, the top and bottom short lines indicate maximum and minimum values, and the crosses denote the 1%–99% range. The box lines represent the lower quartile, median, and upper quartile values. The whiskers extend within 1.5 times of the interquartile range. The horizontal black lines indicate the dust aerosol (AE = 0.6, see Dubovik et al. [20]) in BJ, ZY, and MQ; for the ZS case, this threshold denotes oceanic aerosols with the comparative size as dust particles.
Remotesensing 07 09928 g003

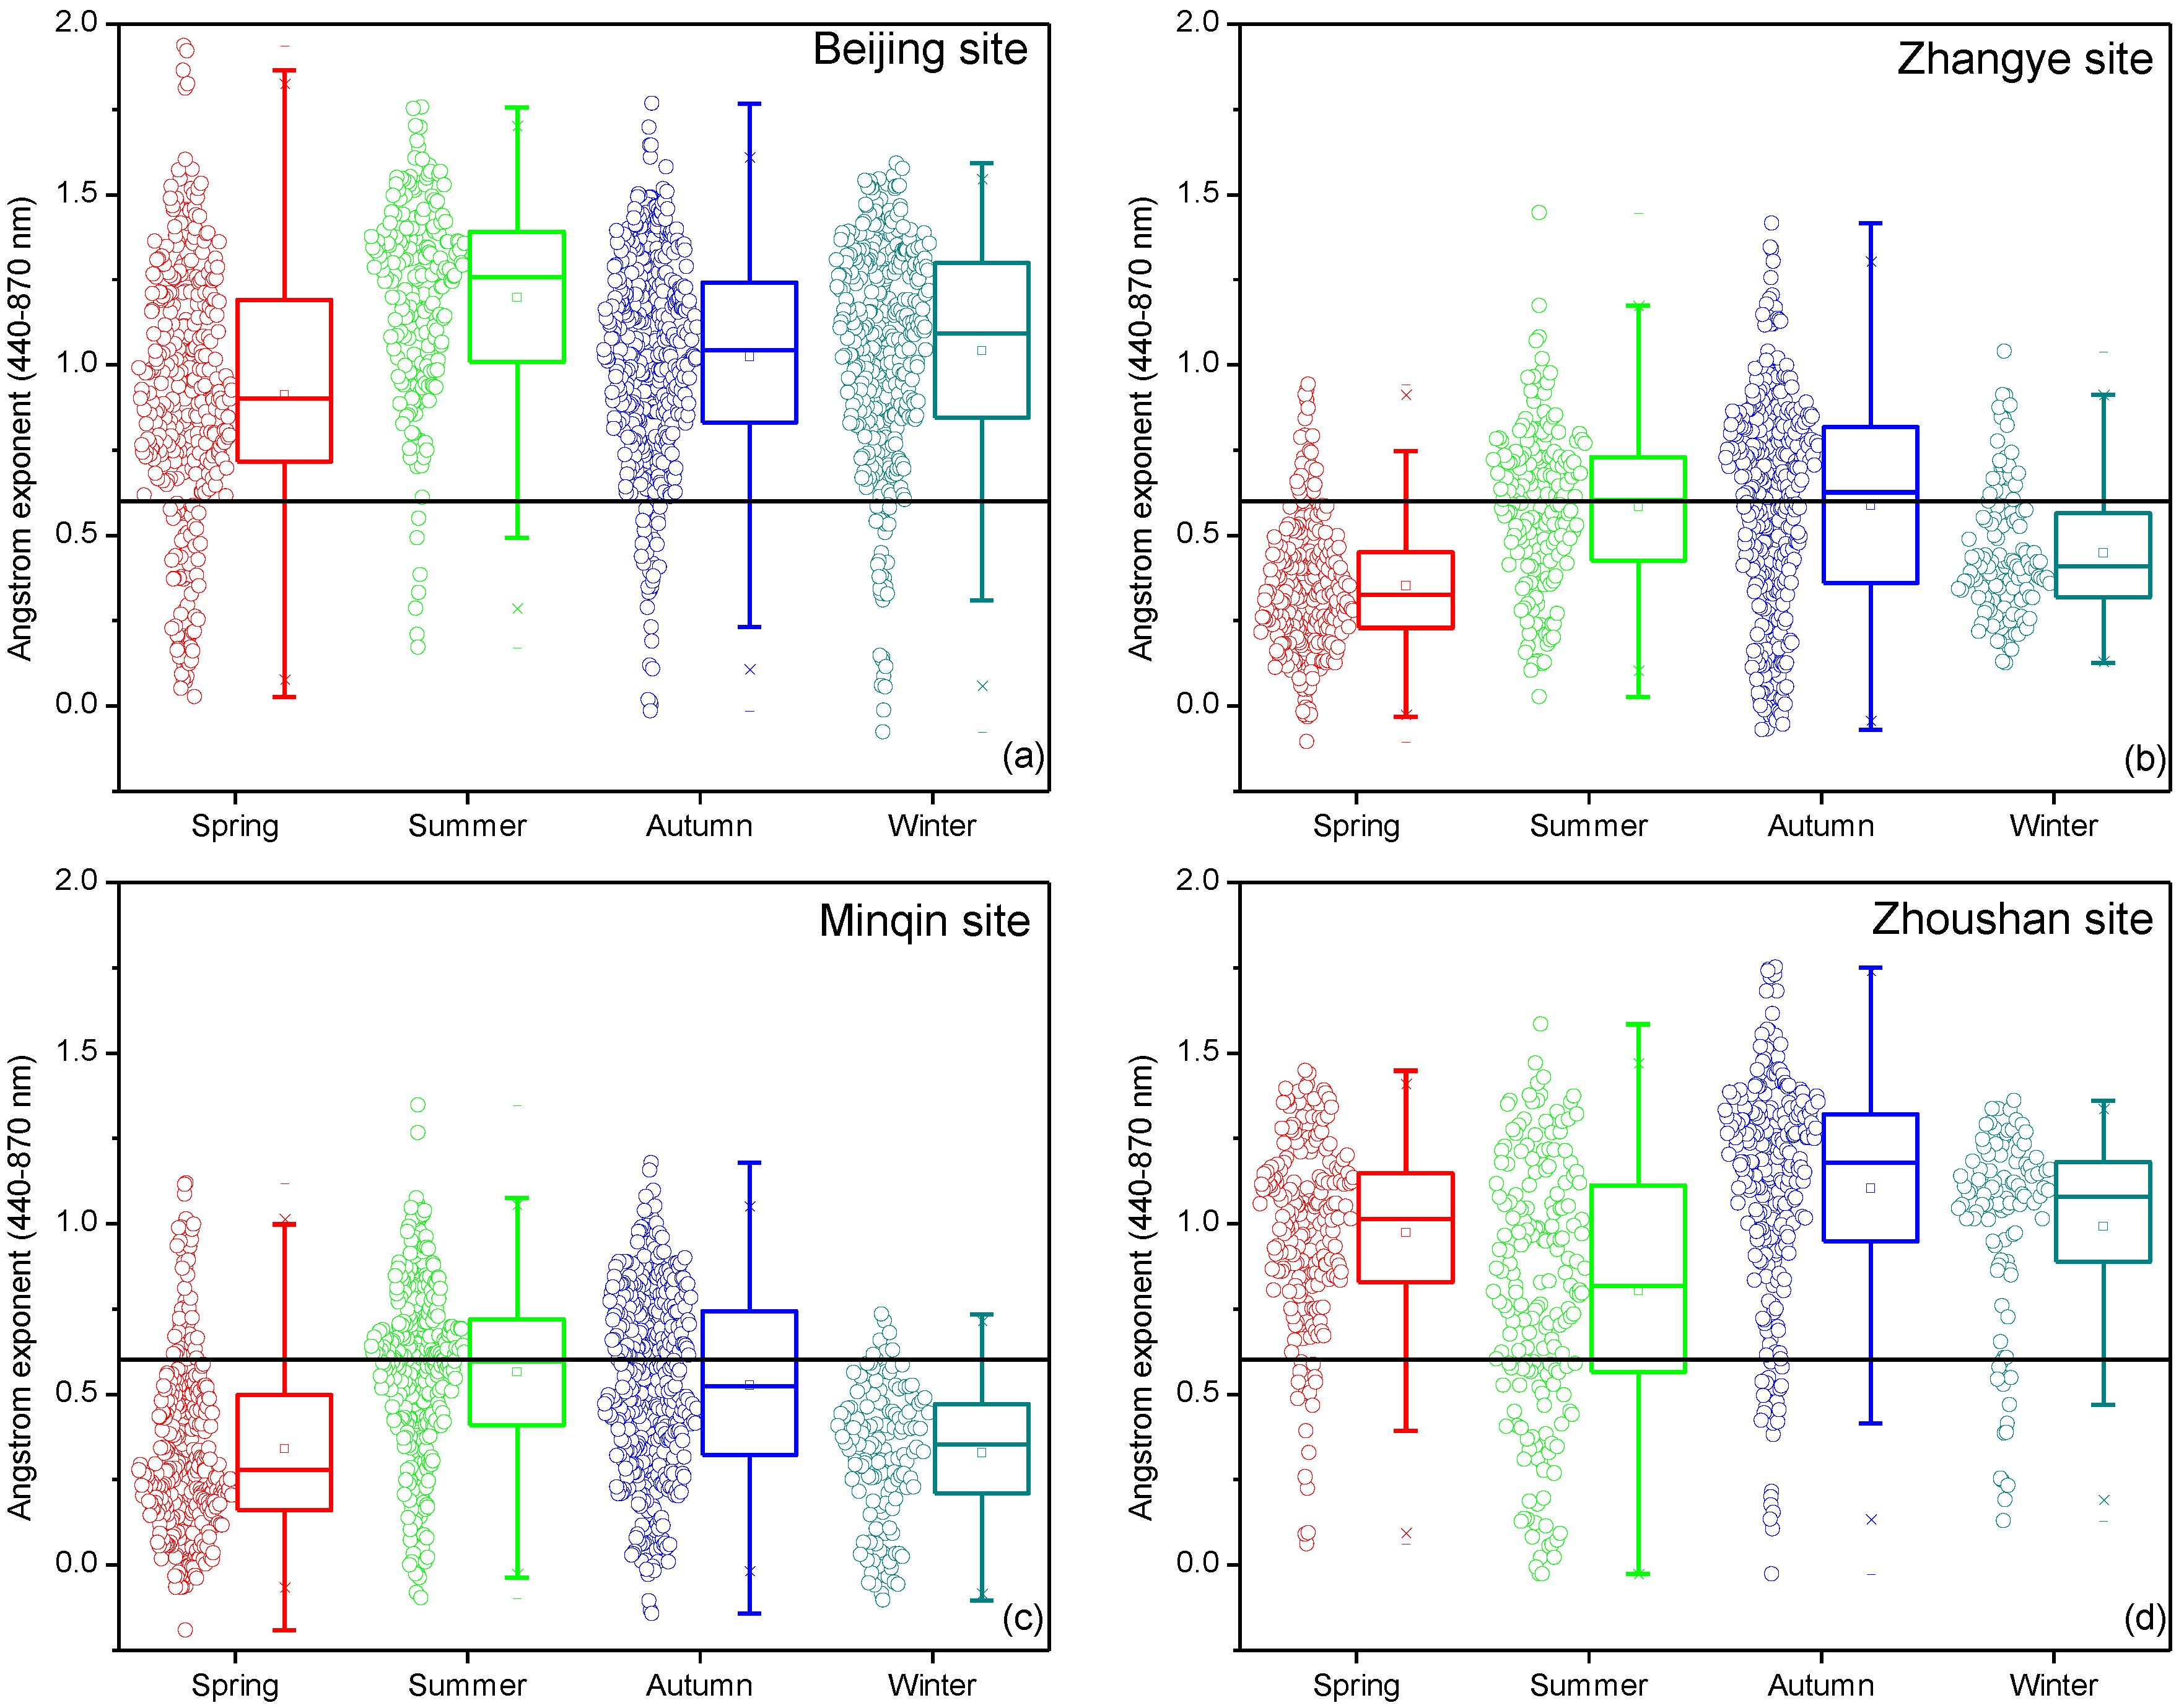
4.2. Ångström Exponent

Figure 3 shows AE distributions of the four sites. Most of the AE values at BJ and ZS are distributed between 0.5 and 1.5, indicating smaller particle size than ZY and MQ, where the majority of AE values are smaller than 1.0 with less variation. We compare our AE results with some AERONET sites of the same type and find general agreement. For example, the AE of desert dust site Solar Village was typically between 0.1 and 0.9 [20], in accordance with the AE range of MQ (with the annual average of 0.46 ± 0.28). Kim et al. [56] showed that the AE of Beijing derived from measurements during 2001–2004 was about 0.5–1.5, similar to our BJ results. For measurements at the oceanic site, the range of AE values of ZS is quite close to that of other maritime aerosol sites, e.g., Lanai and Tahiti [42].
We use a statistical value of 0.6 (the horizontal black lines in Figure 3) as a threshold for dust particles [20]. This assumption is reasonable for BJ, ZY, and MQ because most large particles (with AE <0.6) of these sites are dust particles, though this is not valid for ZS, where an AE below 0.6 probably indicates large sea salt particles. In the spring in BJ, about 17.7% of measured AE is categorized as large particles, more than other seasons, primarily attributed to the stronger dust transport during this period [56,57]. The AE in summer in BJ are relatively larger (>0.8) and this indicates the existence of more fine particles, in accordance with the fine mode dominating size distribution (see Section 4.3). This seasonal pattern is also observed by other studies [4,18]. For ZY, about 89.5% of the AE in spring are below 0.6 and about 53.2% of the AE in autumn are above 0.6, indicating the seasons with the most and the least coarse particles [26] of the year, respectively. MQ has a similar seasonal distribution of AE to ZY but with even lower values and a more concentrated distribution. In ZS there is no significant difference of AE between spring (0.97 ± 0.27), autumn (1.10 ± 0.34), and winter (0.99 ± 0.29). Additionally, they are apparently higher than some remote maritime sites, e.g., Lanai (0.76 ± 0.37), Nauru (0.43 ± 0.35), and Tahiti (0.74 ± 0.27), while similar to some mixed maritime sites, e.g., Bermuda (0.93 ± 0.41) [42]. This suggests the influence of substantial fine particles in ZS. However, the AE in summer is somewhat lower, about 0.80 ± 0.38, which might relate to sea salt particles and other scattering inorganic species (sulfate and nitrate) that have strong hygroscopic growth at circumstances with high relative humidity [58].

4.3. Volume Size Distribution

The volume size distributions of the four sites are shown in Figure 4, and the total volume concentration (TVC) and fine mode fraction in volume (VFMF) are listed in Table 4. We can see that the TVC of BJ in all seasons are the largest for all sites; for example, in the summer, the TVC of BJ is 0.26 ± 0.12 μm3/μm2, about 2.0~2.5 times that of other sites. The rural site ZY, in contrast, has the smallest TVC in all seasons except for winter. Additionally, the mean volume concentration of fine mode aerosol of each season in ZY is smaller than in other sites. In addition, we can obtain the same order from the AOD and TVC of the four sites that BJ > ZS > MQ > ZY. However, the seasonal variations of AOD are not exactly in the same order with volume size distribution. For example, AOD (440 nm) of BJ in spring is a little lower than in summer, but the TVC shows the reverse relation. This is because the particle number and extinction efficiency of dust particles may not be as much as fine particles, although their sizes are much larger.
We can also see some significant differences among seasons. For urban-industrial site BJ, we notice a fine-coarse mixed size distribution for all seasons, similar to Mexico City (also belonging to this type), according to Dubovik et al. [20]. The coarse mode-dominated size distribution in spring and autumn of BJ are very similar, corresponding to the VFMF of 25.8% ± 15.1% and 37.6% ± 16.7%, respectively. This can be explained by the strong northwest winds in spring and autumn that could bring abundant dust particles from remote sources and lead to frequent dust storms in this region [59]. Local dust raised by traffic and construction is another possible source of large particles. On the contrary, in summer and winter, the volume concentration of coarse mode and fine mode are quite close (VFMF are 50.8% ± 19.7% and 48.7% ± 14.0%, respectively), noting that fine mode dominates the number size distribution during these seasons. From Figure 4 we can see that substantial coarse-mode aerosol always appears in BJ, even in the fine mode-dominating pollution seasons (e.g., the winter), agreeing well with some research from Beijing (e.g., [4,60]). Kim et al. [56] showed a similar size distribution as our BJ results, except for the lower volume concentration of the coarse mode in autumn.
Figure 4. Seasonal average of volume size distributions of the four sites. (a) Beijing site; (b) Zhangye site; (c) Minqin site; (d) Zhoushan site.
Remotesensing 07 09928 g004
For ZY and MQ, the volume size distributions are dominated by coarse mode throughout the entire year, showing much less seasonal variation than BJ. This is probably because of the high level of dust particles that can be deduced in connection with the location (near dust sources), meteorology (dry and strong winds), and surface environment (low vegetation coverage) of the two sites. The annual average VFMF at ZY and MQ is about 12.6% and 18.7%, respectively, much lower than BJ (37.8%) and ZS (45.7%). Note that there is another sub-mode near the coarse mode for the two sites, similar to the Bahrain site in Persian Gulf and the Solar Village site in Saudi Arabia as described by Dubovik et al. [20]. Omar et al. [9] showed that the VFMF of background/rural-type aerosol was about 38%, much higher than that of ZY in this study. The abnormally low VFMF for the rural site of ZY can be attributed to dust impacts.
The volume fraction difference between coarse and fine modes in ZS is generally less than 10%, except for spring when the coarse mode dominates the size distribution. Knowing that most oceanic aerosols have a much larger fraction of coarse mode [9,20,42], we attribute this exceptionally high level of fine mode in ZS to the outcome of industrial and traffic developments in Zhoushan City in recent years that generate abundant small particles from primary and secondary sources. The emissions from Shanghai City, which is about 100 km northwest of Zhoushan City, is another possible fine particle source for aerosol observed in ZS, especially in the spring months when northwest winds prevail. From Figure 4 we also notice that the volume geometric mean radius of the coarse mode of ZS is between 2 and 3 μm, agreeing with other oceanic sites [42]. In addition, the separation radius between the fine and coarse modes of ZS is about 0.7–0.9 μm, while for dust-dominated size distribution in this study, i.e., MQ, ZY, and spring and autumn of BJ, the separation radius is about 0.3–0.5 μm.
Table 4. Total volume concentration (TVC) and fine mode fraction in volume (VFMF) of the four sites in each season.
SiteSeasonTotal Volume Concentration (μm3/μm2)VFMF
BJSpring0.36 ± 0.300.26 ± 0.15
Summer0.26 ± 0.120.51 ± 0.20
Autumn0.25 ± 0.140.38 ± 0.17
Winter0.20 ± 0.110.49 ± 0.14
ZYSpring0.15 ± 0.060.07 ± 0.03
Summer0.10 ± 0.040.14 ± 0.09
Autumn0.08 ± 0.040.17 ± 0.09
Winter0.13 ± 0.120.07 ± 0.02
MQSpring0.16 ± 0.080.18 ± 0.12
Summer0.11 ± 0.070.21 ± 0.12
Autumn0.09 ± 0.040.18 ± 0.11
Winter0.11 ± 0.090.12 ± 0.07
ZSSpring0.21 ± 0.090.39 ± 0.14
Summer0.13 ± 0.090.55 ± 0.14
Autumn0.17 ± 0.070.50 ± 0.19
Winter0.14 ± 0.060.45 ± 0.17

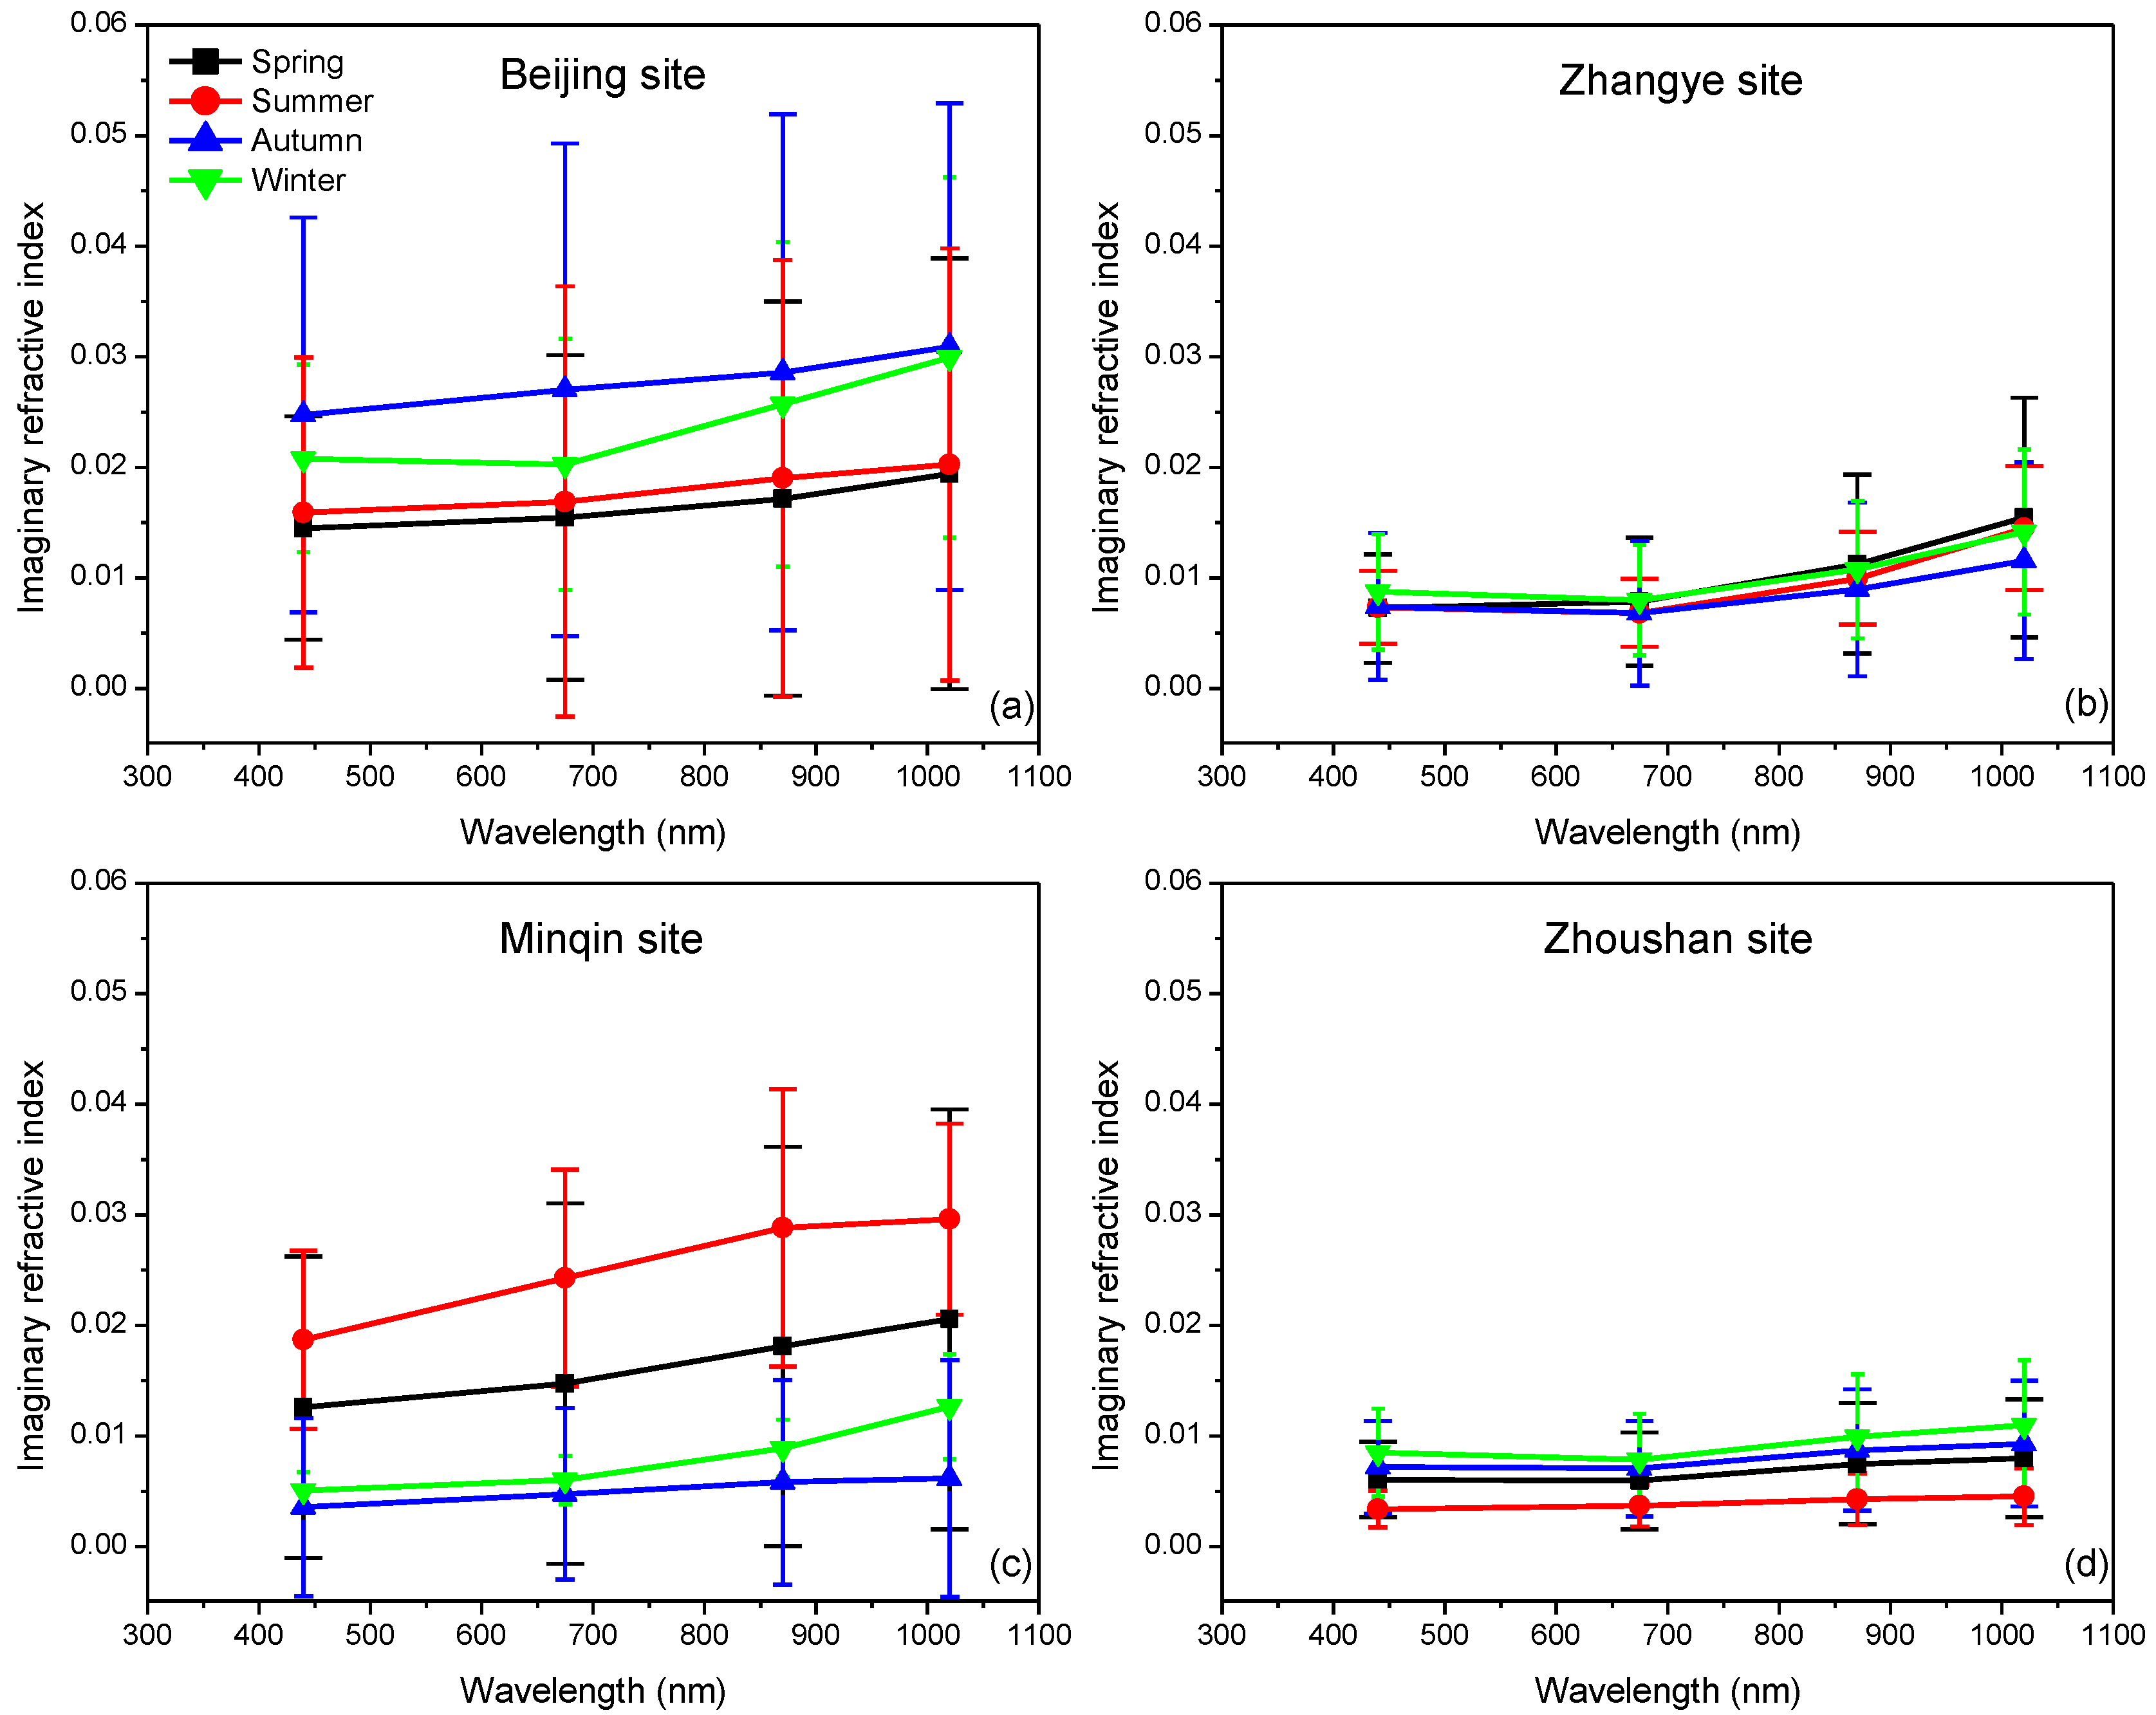
4.4. Aerosol Complex Refractive Index

The seasonal averages of n of the four sites are shown in Figure 5. We use T-tests to see if the differences of the real refractive indices between the sites are significant. The statistics illustrate that the annual average n (at 440 nm) of MQ (1.56 ± 0.10) and ZY (1.57 ± 0.07) is obviously higher than ZS (1.45 ± 0.07), similar to the results as shown in Figure 5. This can be attributed to the different contents of aerosol water. The n of dry particles (normally distributed within 1.45~1.70) is much higher than that of water (1.33), therefore, n can reflect the water uptake of aerosol to some extent [58]. MQ and ZY are located in the northwest inland area of China with a typical temperate continental climate, and drought throughout the entire year results in high n values. On the contrary, ZS is surrounded by ocean with a subtropical monsoon marine climate and high precipitation most of the year, and that is the reason why it has the lowest n. The climate in BJ is neither too dry nor too wet, and its n is lower than MQ and ZY but higher than ZS.
T-tests for testing seasonal differences of n are also performed, and the results show that in BJ and ZS, the n differences between summer and other seasons are statistically significant, although from Figure 5 we can see some large variabilities between the seasons at the two sites. The differences of n between the seasons relate to atmospheric conditions under which there is a low n in the wet season (e.g., summer in BJ) and a high n in the dry season (e.g., spring at BJ). In ZS, n in summer is extremely low, about 1.38 ± 0.04, close to the water. We also find n shows no obvious spectral dependence [61]. For example, the average n at the four wavelengths of ZS in summer is 1.38 ± 0.04, 1.40 ± 0.04, 1.40 ± 0.04, and 1.39 ± 0.03, respectively.
Figure 5. Seasonal average of real refractive indices of the four sites, (a) Beijing site; (b) Zhangye site; (c) Minqin site; (d) Zhoushan site. Error bar indicates the standard deviation of the average.
Remotesensing 07 09928 g005
Generally, k reflects absorption of aerosols and a larger k probably indicates stronger aerosol absorption. Figure 6 shows the seasonal average of k at each site. We can see the k of ZS and ZY are obviously lower than the other two sites. For a typical oceanic site, aerosol is mainly composed of non-absorbing components like sea salt, organic matter, and inorganic species, resulting in very small k values. However, the annual average of k (at 440 nm) at ZS is about 0.007 ± 0.004, larger than the typical value of 0.001 [42]. Considering the coarse mode at ZS is mainly sea salt, the enhancement in k is most likely caused by fine mode aerosols, which usually come from remote transport or local anthropogenic sources such as vehicle emissions and shipping industries that produce significant amounts of organic and elemental carbon [9]. At ZY, clean atmosphere and few emissions are the reasons for the low k (0.008 ± 0.005). On the contrary, BJ has a much larger population and stronger anthropogenic emissions such as vehicles, industry combustion, and cooking [61], which are also the main sources of absorbing components such as black carbon and brown carbon, resulting in a high level of k (0.019 ± 0.014). The moderate level of k values at MQ (annual average of 0.013 ± 0.011) can be attributed to the high content of another absorbing component, mineral dust [62], and possibly the existence of absorbing carbonaceous particles emitted from anthropogenic sources.
Figure 6 also reflects the seasonal differences of k at each site. For example, the k of MQ in spring is obviously higher than that in autumn and winter, probably due to dust particles during the spring months. We also find comparable k values in summer and spring at MQ from T-test results between seasons, which can be partly attributed to the existence of small but absorbing particles from anthropogenic sources in Minqin County, noticing the higher proportion of fine particles than in other seasons (see Table 3 and Table 4) because the aerosol absorption in summer should have been weaker than that in spring if dust is the only source of absorption in MQ. However, the seasonal variation of k in ZY, where the aerosol is also greatly affected by dust particles, is much smaller than MQ according to the T-test results. Additionally, the T-tests of k values between MQ and ZY for each season also show statistically significant differences between the two sites except for in autumn. We should mention that k is dependent on wavelength [61]. For example, for the BJ winter case, k shows a decreasing pattern at 440~675 nm, while there is an increasing or neutral trend at 675~1020 nm. This can be explained by the increased absorption at short wavelengths by brown carbon [63], which is known as a partly absorbing component and usually comes from incomplete or low temperature combustion processes [14,64] such as the coal burning emissions from the city heat supply. This is probably why the k at 440 nm in the winter of BJ increases more significantly than other seasons.
Figure 6. Seasonal average of imaginary refractive indices of the four sites, (a) Beijing site; (b) Zhangye site; (c) Minqin site; (d) Zhoushan site. Error bar indicates the standard deviation of the average.
Remotesensing 07 09928 g006

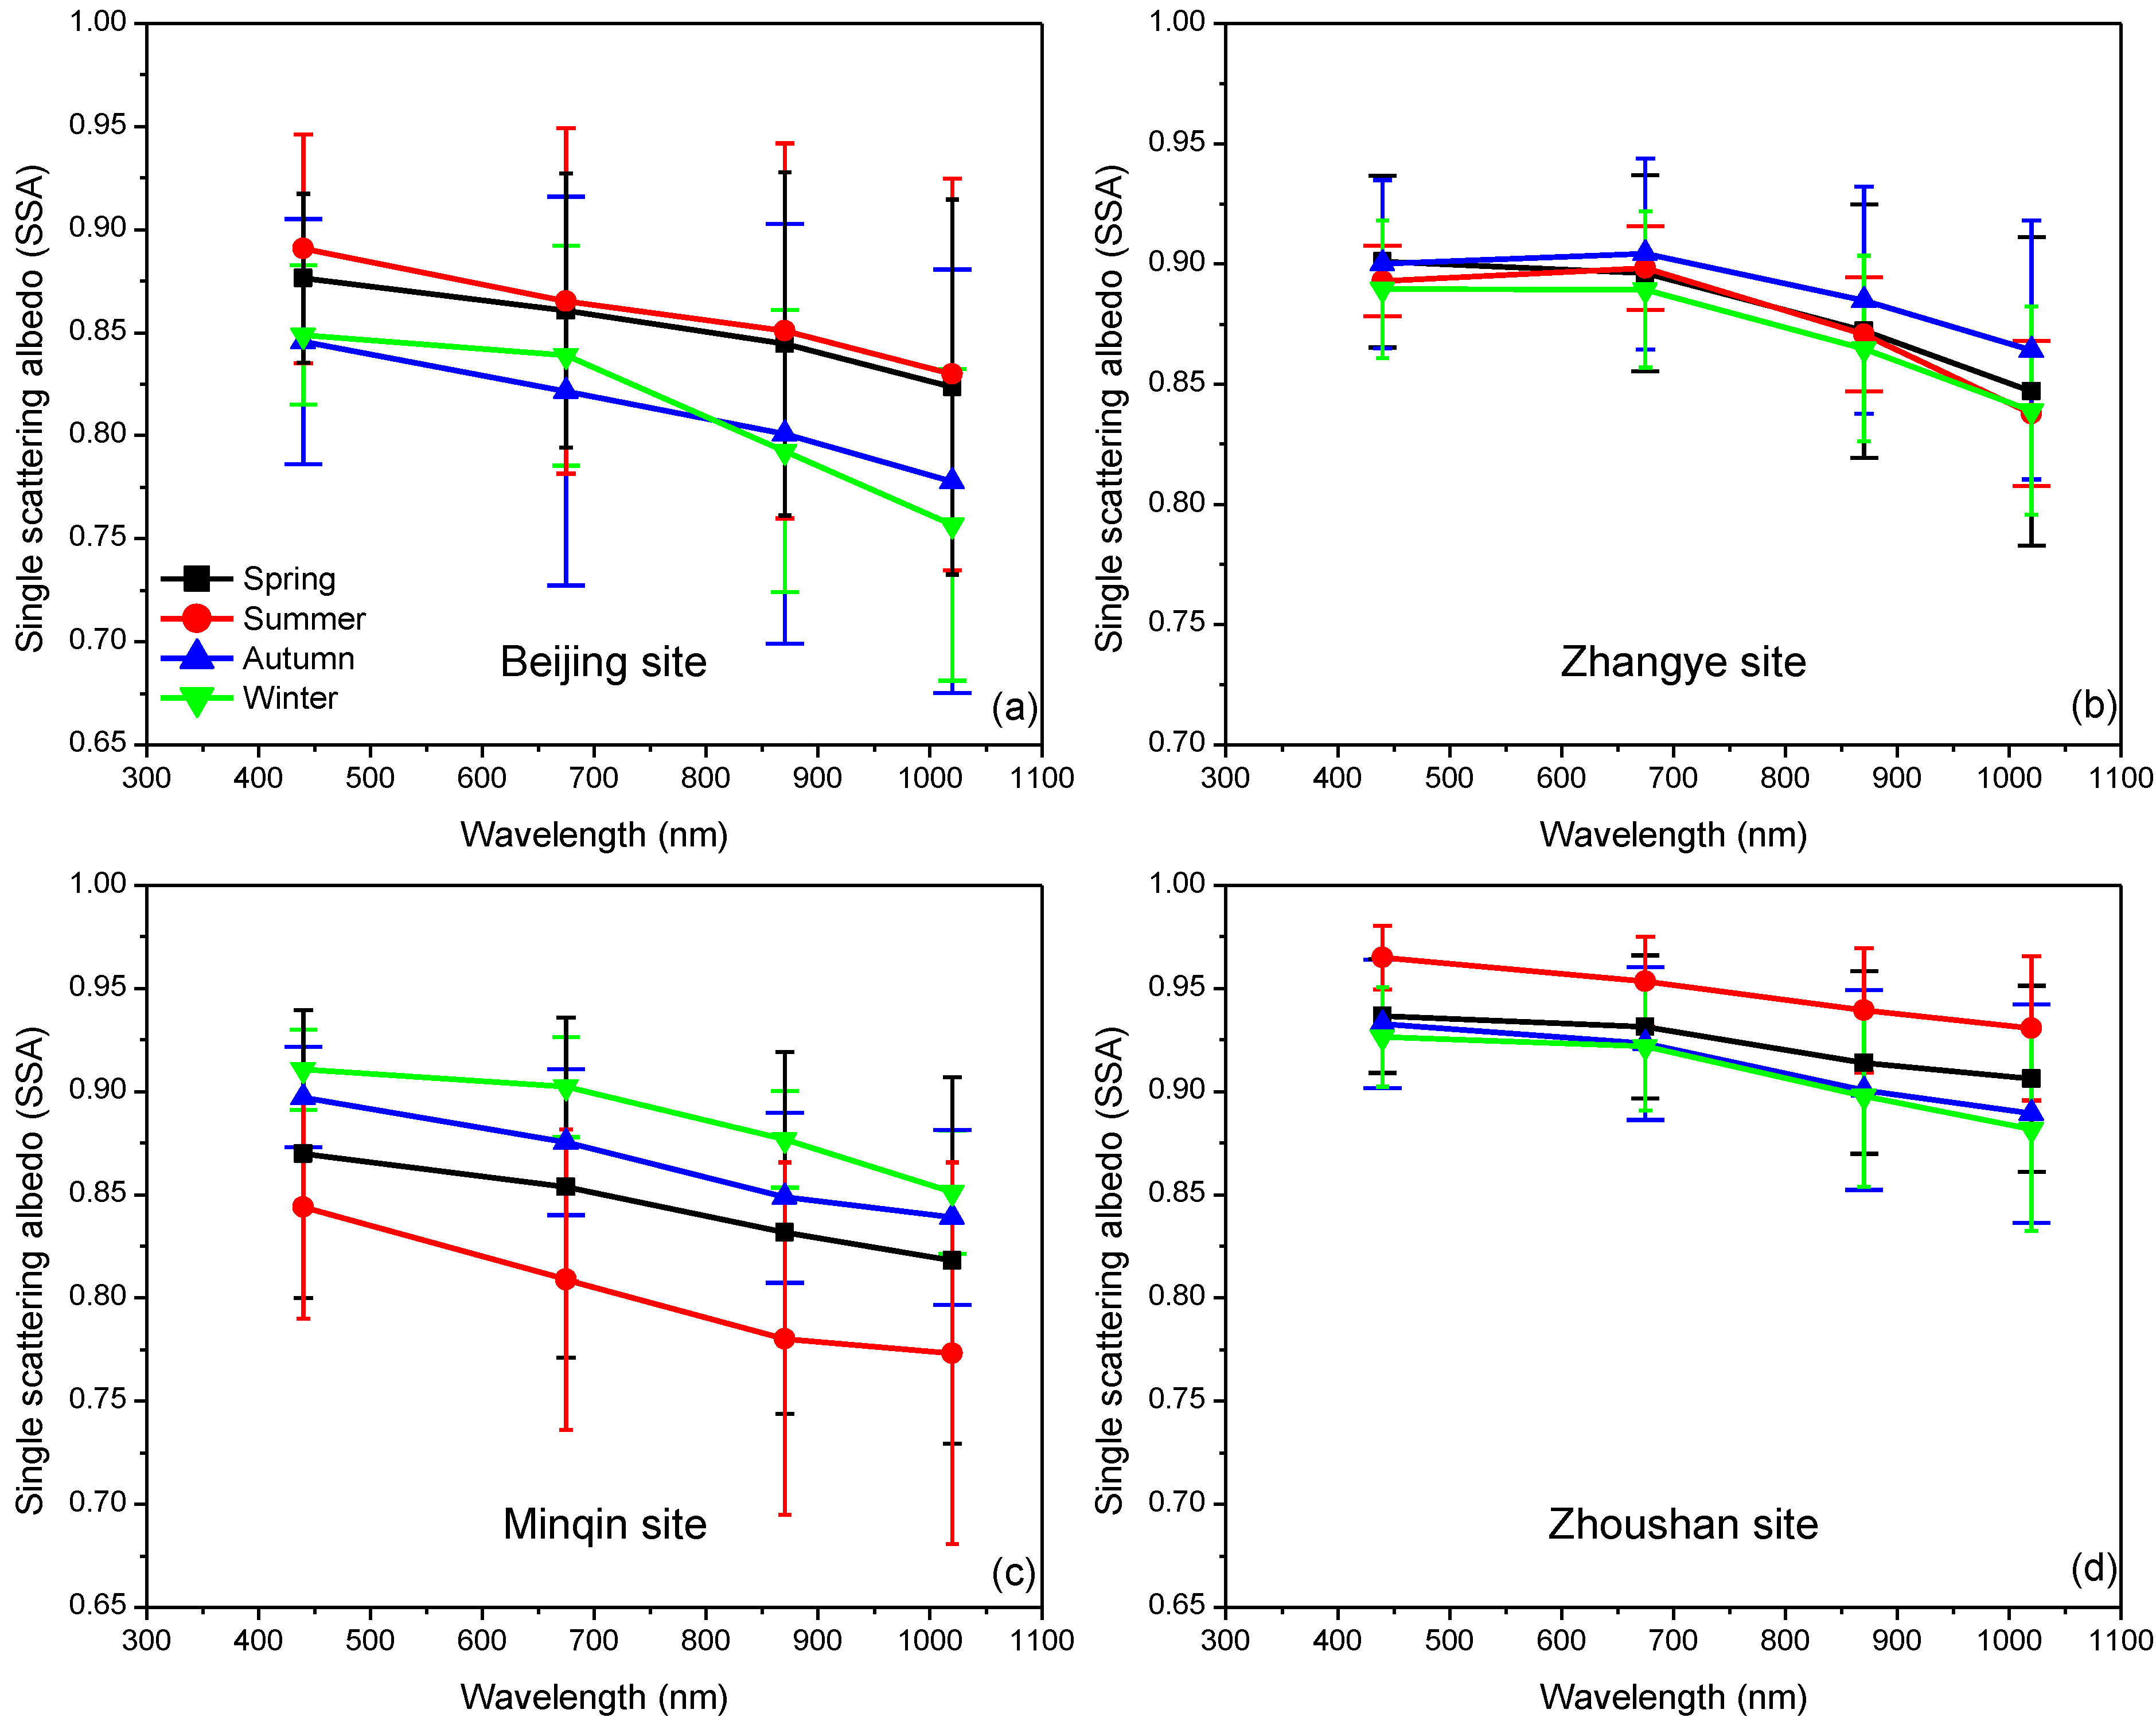
4.5. Single Scattering Albedo

Seasonal SSA characteristics of the four sites are shown in Figure 7. SSA describes the aerosol absorbing/scattering property and depends greatly on aerosol composition and mixing states. The annual average SSA (440 nm) of MQ is 0.87 ± 0.06, smaller than other reported measurements of desert dust sites (mostly larger than 0.90) [20,65], illustrating the strong absorptivity of this site. We primarily attribute this to the absorbing aerosols from anthropogenic sources in Minqin County [36], especially in summer, as well as the higher content level of absorbing hematite [66] or other iron oxides in the dust aerosol at this site [67]. We also find decreasing SSA spectra at MQ, similar to previous research at this site (e.g., [36]), and this can be attributed to the existence of fine particles. We calculate SSA of fine and coarse mode at MQ individually and find some significant differences between the two modes, as expected. The annual average SSAs of fine mode at MQ are 0.93 ± 0.05, 0.91 ± 0.07, 0.87 ± 0.08, and 0.85 ± 0.09 at given wavelengths, showing an obvious decreasing pattern along with the wavelengths, while the SSAs of coarse mode are 0.77 ± 0.08, 0.80 ± 0.09, 0.80 ± 0.09, and 0.81 ± 0.08, similar to other desert dust aerosols [65,68]. This probably indicates the existence of fine particles at MQ. ZS has the highest SSA (0.94 ± 0.03) because the dominant components of such an oceanic site are sea salt and inorganic species, which are responsible for the majority of aerosol scattering [69]. However, we find ZS has a lower SSA at all wavelengths compared to other oceanic type aerosols, e.g., Lanai, Hawaii [20]. This is very likely caused by local emissions and aerosol transport that brings absorbing particles to this site. The annual average SSAs of BJ at the four wavelengths are 0.86 ± 0.05, 0.84 ± 0.08, 0.82 ± 0.09, and 0.80 ± 0.09, quite close to the spectral pattern of Mexico City (urban-industrial type site), as Dubovik et al. [20] described, but with lower SSA values. Omar et al. [9] found the SSA at 673 nm to be 0.88 for the background/rural type of aerosol, in accordance with the ZY result (0.89 ± 0.01).
The maximal difference of SSA (440 nm) among seasons in ZY (0.01) is weaker than other sites (MQ: 0.07, BJ: 0.05, and ZS: 0.04), due to the simpler aerosol composition (fewer emissions), more stable mixing state (perennially dry climate), and lower aerosol loading at this site. Noticing the large variabilities within seasons in BJ, we use T-tests to check if the SSA values between seasons are statistically different. From the test results, we find significant SSA differences between any two seasons except for the spring-summer and autumn-winter pair. That is consistent with the results as shown in Figure 7a. For BJ, SSA in summer is the largest, attributed to the scattering aerosol and complicated mixing states, while SSA in winter and autumn is much lower because the carbonaceous particles emitted from the city heat and other anthropogenic sources during this period enhance the aerosol absorption. Eck et al. [18] reported similar SSA seasonal differences for Beijing, higher in summer (0.90~0.98) and lower in winter (0.76~0.90). Lee et al. [3] investigated the dependence of SSA on total precipitable water (TPW) and FMF, and found that median and high SSA at 440 nm (>0.92) related to high TPW and FMF, close to the conditions of the BJ summer case in this study with a low n (see Figure 5) and high FMF (see Table 3). For MQ, lower SSAs in spring and summer compared to autumn and winter are primarily caused by dust aerosols and polluted aerosols, respectively. In ZS, SSA is higher in summer and lower in other seasons, agreeing well with k seasonal differences (showing the opposite variation trend, see Figure 6).
Figure 7. Seasonal average of single scattering albedo of the four sites, (a) Beijing site; (b) Zhangye site; (c) Minqin site; (d) Zhoushan site. Error bar indicates the standard deviation of the average.
Remotesensing 07 09928 g007

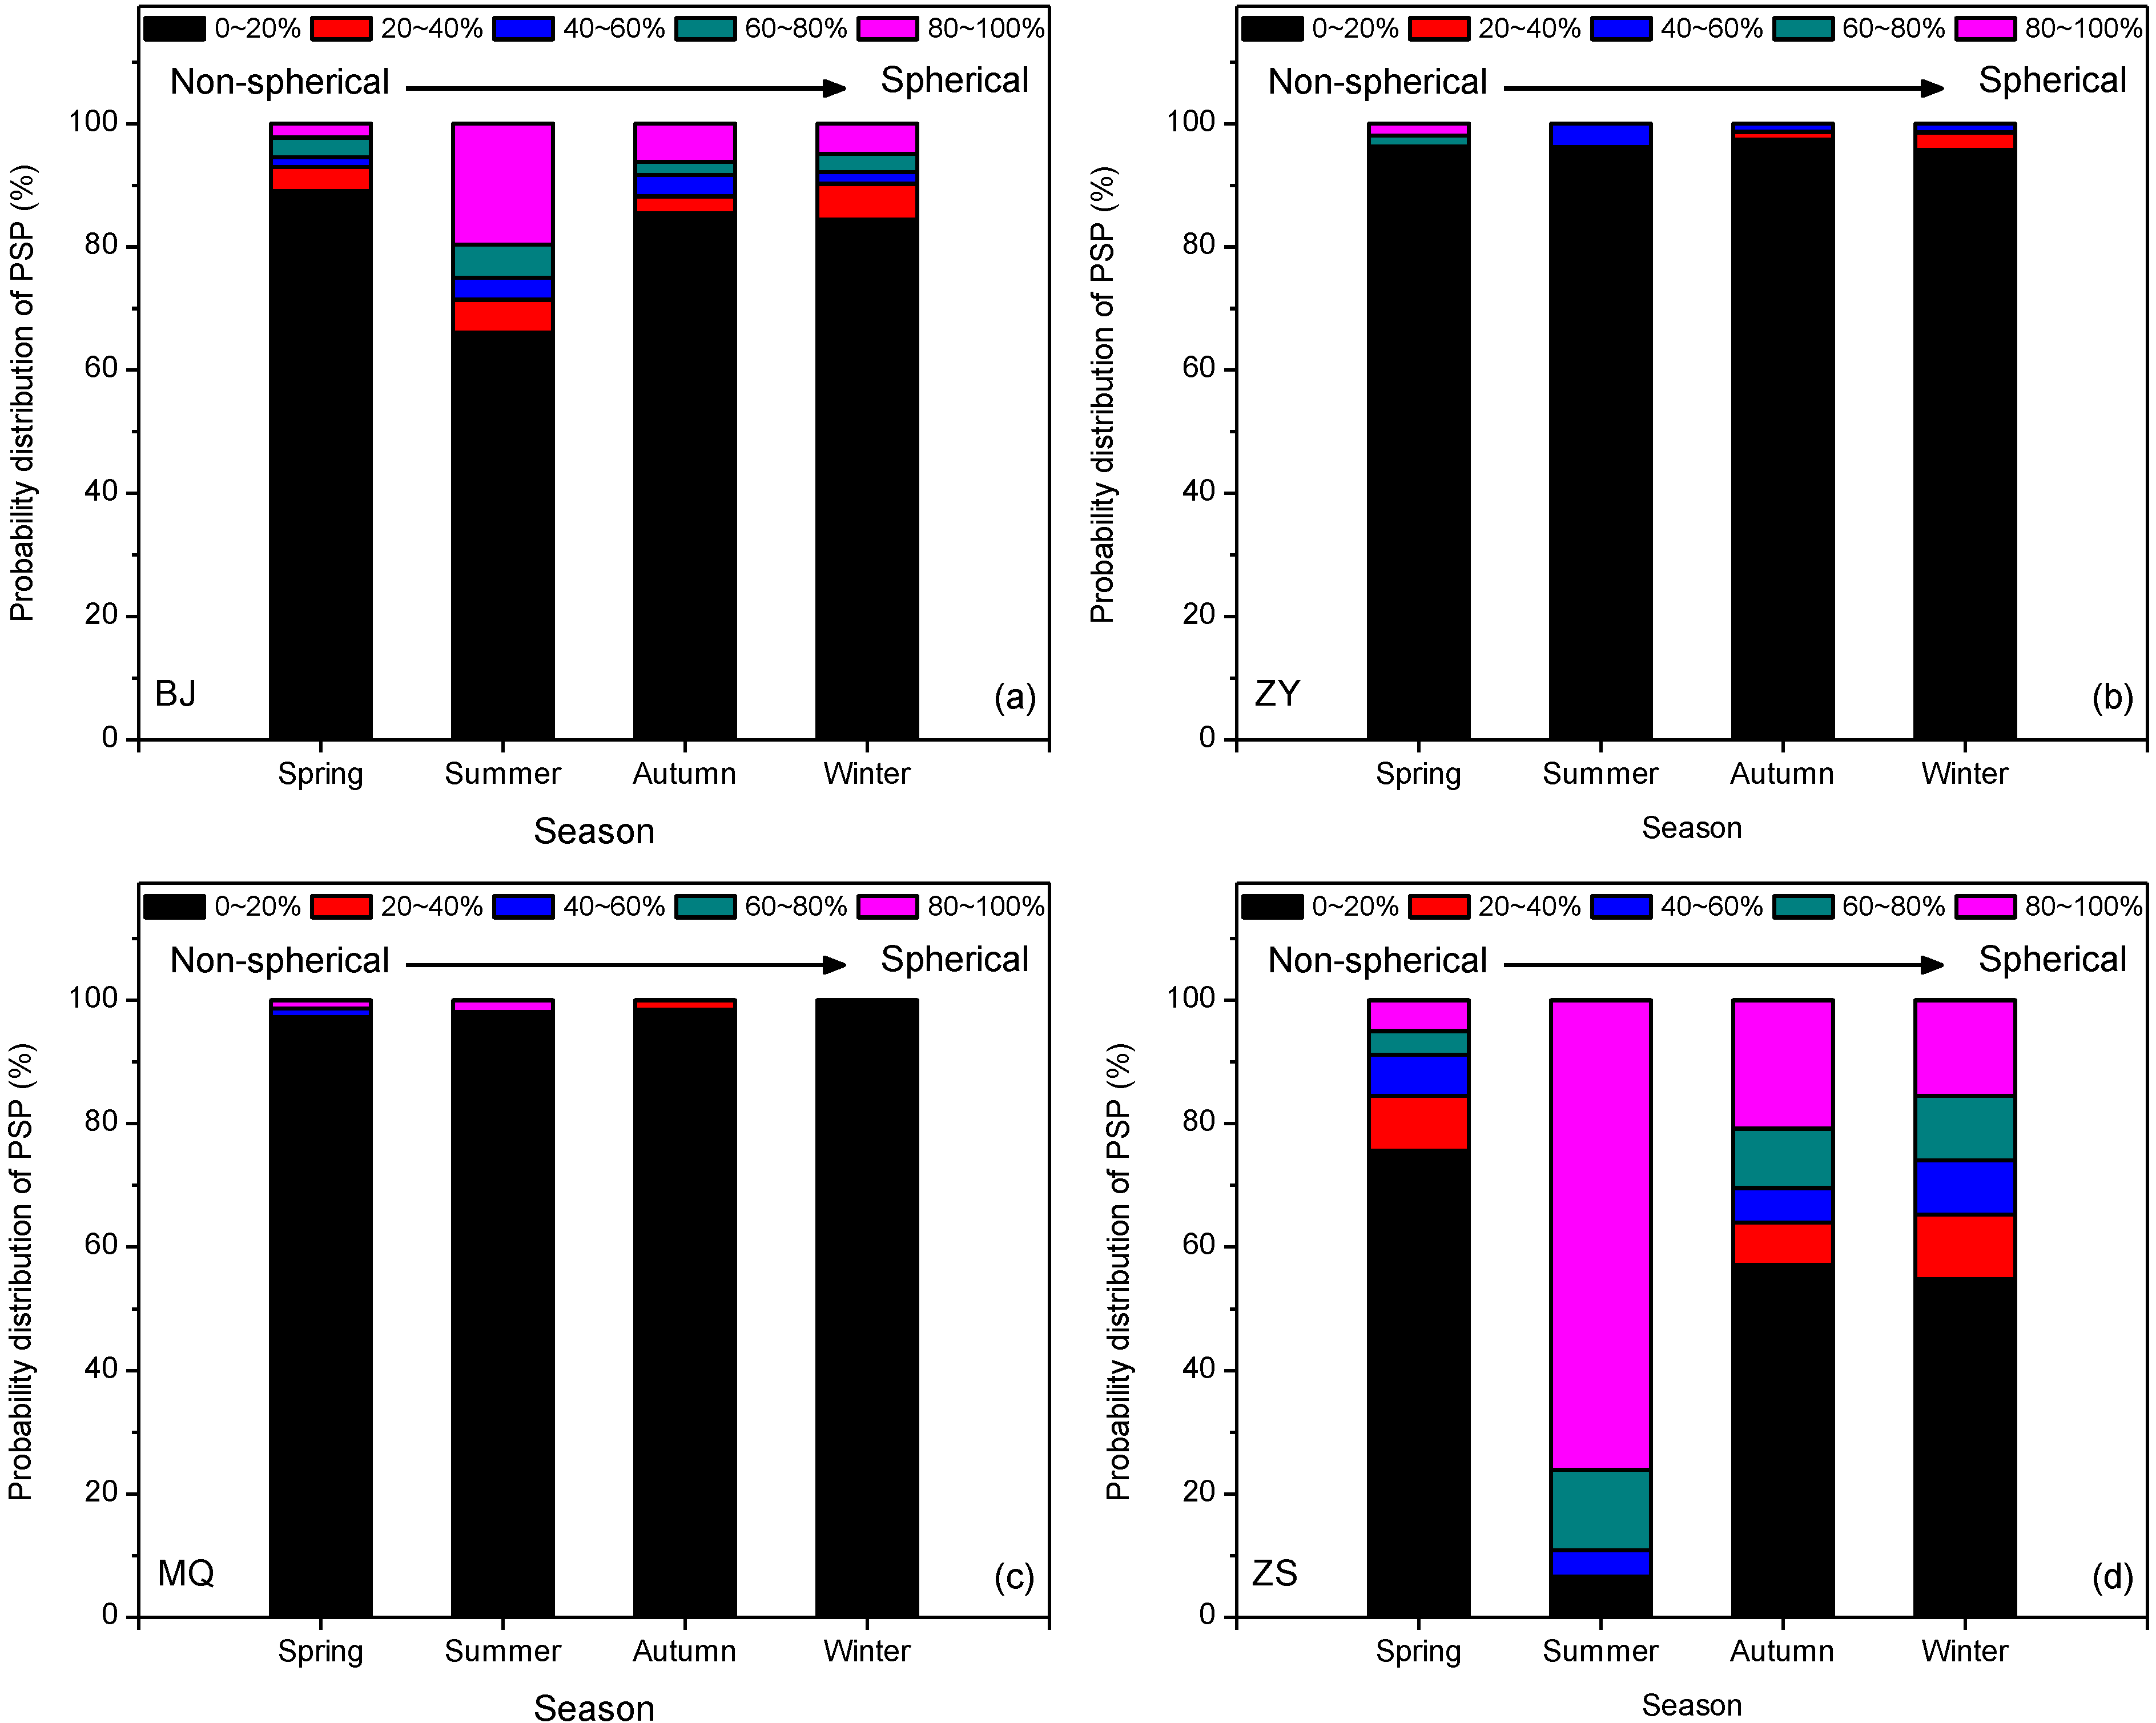
4.6. Percentage of Spherical Particles

Figure 8 shows the probability distribution of the percentage of spherical particles (PSP) at each site. PSP can be interpreted as a reflection of aerosol composition and mixing state. Dust particles are supposed to have low PSP due to their high appearance frequency of complex shapes [70] and large particulate size, while smaller aerosol components such as carbonaceous or inorganic particles from biomass burning and pollutions are usually treated as spherical particles considering that they are not sensitive to particle shape distribution [50,71]. Aerosol water uptake is also considered an impact factor on PSP because it may affect both the internal mixing state and surface morphology of particles [14,72] when the relative humidity is very high.
Low PSP in the spring, autumn, and winter in BJ indicate the domination of non-spherical particles (e.g., dust aerosol), while in the summer the higher PSP may be related to the wet atmosphere or different aerosol species that can be either spherical or small-size particles. The low PSP level in spring at BJ (nearly 90% of measurements have a PSP lower than 20%) can be partly attributed to frequent dust storm weather. We notice that in autumn and winter in BJ, PSP is a little higher than in spring, and this is probably because of the higher percentage of fine particles (see Table 4). For MQ and ZY, PSP is very low throughout the entire year (with an annual average of 2.1% and 2.2%, respectively) without significant differences among seasons. In the two sites, the overwhelming majority of aerosol is dominated by non-spherical particles in all seasons noting that more than 95% of the PSP measurements are distributed within the range of 0%~20%, due to the large amount of dust particles in the atmosphere and the relatively dry climate. On the contrary, aerosol particles in ZS are much closer to spherical than in other sites noticing that the percentage of sphere-like particles (PSP ≥ 60%, dark cyan and magenta in Figure 6) is the largest among all sites during each season. We find the sphere-like particle domination in summer of ZS (nearly occupying 90% of all measurements), although there is a considerable part of coarse particles. This implies the difference of particulate shape between dust and sea salt, as most of the dust particles are non-spherical while sea salt particles are much closer to spherical at a high relative humidity level [50].
Figure 8. The probability distribution of the percentage of spherical particles (PSP) of the four sites, (a) Beijing site; (b) Zhangye site; (c) Minqin site; (d) Zhoushan site. The different colors indicate the probabilities of PSP lying within each of the five sub-ranges.
Remotesensing 07 09928 g008

5. Conclusions

Based on the newly developed Sun-sky radiometer Observation NETwork (SONET), this paper presents the optical and microphysical properties of aerosol for four typical sites over China to enhance the understanding of columnar aerosol. One-year measurements of the sun-sky radiometer are used to derive aerosol properties by using inversion algorithms similar to AERONET, including aerosol optical depth (AOD), Ångström exponent (AE), volume size distribution, complex refractive indices (real part n and imaginary part k), single scattering albedo (SSA), and the percentage of spherical particles (PSP). The criterions of solar zenith >50 degrees and sky residual <5% are used for selecting size distribution, and AOD (440 nm) >0.2 is additionally employed for n, k, SSA, and PSP. This may result in some data inconsistency but probably has no significant impact on the characterization of aerosols. T-tests are used to test if the differences in properties are statistically significant.
Beijing is a typical urban-industrial site with high aerosol loading (AOD is 0.90 ± 0.11 and total volume concentration is 0.26 ± 0.12 μm3/μm2) and is mainly dominated by fine particles, especially in summer and winter, when the fine mode fractions in volume concentration (VFMF) and in optical depth (FMF) are ~50% and ~0.9, respectively. However, this site is easily affected by dust particles in spring (VFMF is ~26% and FMF is ~0.75). Aerosol in the Beijing site has strong absorptivity (k and SSA are 0.019 ± 0.014 and 0.86 ± 0.05, respectively) on account of abundant absorbing particles from emission sources, especially in autumn and winter.
On the contrary, aerosol in the rural site of Zhangye has much lower loading (AOD is 0.21 ± 0.03) and is less absorbing (k is 0.008 ± 0.005). Nevertheless, the major difference between aerosol in Zhangye and other reported rural sites is the abnormally large particulate size (VFMF is ~12.6% and AE is mainly smaller than 1.0) due to the significant dust impacts, which also lead to a remarkably small PSP (~2.2%, comparable to desert site Minqin).
The dust-dominated site Minqin has a low VFMF (~18.7%) and AE (0.46 ± 0.28), with small seasonal variations. Aerosol absorptivity at the Minqin site is mainly caused by dust particles, however, k and SSA in the summer are comparable to those in the spring, suggesting that the absorbing aerosol from emission sources greatly contributes to the strong absorptivity. The anthropogenic impacts can also explain the difference in SSA between the Minqin site (0.87 ± 0.06) and the other reported desert dust sites (mostly > 0.90).
Aerosol in the oceanic site Zhoushan has weak absorptivity, indicated by a low k (0.007 ± 0.004) and high SSA (0.94 ± 0.03), due to the dominance of non-absorbing components like sea salt and inorganic species. However, compared with other oceanic sites (typical k value of 0.001), aerosol in Zhoushan still shows some absorptivity. This can be explained by the fine and absorbing particles emitted from remote and local anthropogenic sources, which could also result in a particle size comparable to some mixed maritime sites (with an AE of about 0.9–1.1).
The properties of aerosol are mainly determined by its composition and mixing states. For a certain type of aerosol, we find general agreement on aerosol properties with other studies, which can be interpreted as characteristics of this aerosol type. However, some differences still exist, primarily related to the specific climate (e.g., dry or wet conditions, precipitation, and monsoons), nearby natural sources (e.g., dust or sea salt), and most importantly, the ubiquitous anthropogenic sources (e.g., industrial and traffic emission) that have impacts on even remote desert dust and oceanic sites.

Acknowledgments

This work was supported by the National Natural Science Foundation of China (Grant No. 41222007), Strategic Priority Research Program of the Chinese Academy of Sciences (Grant No. XDA05100202), and CAS/SAFEA International Partnership Program for Creative Research Teams (Grant No. KZZD-EW-TZ-09).

Author Contributions

All authors identified the framework of this study, and contributed extensively to this paper. Yisong Xie and Zhengqiang Li defined the research theme, wrote the paper, and edited the manuscript; Donghui Li designed and performed the observation experiment. Kaitao Li processed and analyzed the data; Hua Xu proposed meaningful suggestions for this manuscript.

Conflicts of Interest

The authors declare no conflict of interest.

References

  1. Haywood, J.; Boucher, O. Estimates of the direct and indirect radiative forcing due to tropospheric aerosols: A review. Rev. Geophys. 2000, 38, 513–543. [Google Scholar]
  2. Haywood, J.M.; Shine, K.P. The effect of anthropogenic sulfate and soot aerosol on the clear-sky planetary radiation budget. Geophys. Res. Lett. 1995, 22, 603–606. [Google Scholar]
  3. Lee, J.; Kim, J.; Song, C.H.; Kim, S.B.; Chun, Y.; Sohn, B.J.; Holben, B.N. Characteristics of aerosol types from AERONET sunphotometer measurements. Atmos. Environ. 2010, 44, 3110–3117. [Google Scholar]
  4. Eck, T.F.; Holben, B.N.; Dubovik, O.; Smirnov, A.; Goloub, P.; Chen, H.B.; Chatenet, B.; Gomes, L.; Zhang, X.Y.; Tsay, S.C.; et al. Columnar aerosol optical properties at AERONET sites in Central Eastern Asia and aerosol transport to the tropical mid-Pacific. J. Geophys. Res. Atmos. 2005. [Google Scholar] [CrossRef]
  5. He, X.; Li, C.C.; Lau, A.K.H.; Deng, Z.Z.; Mao, J.T.; Wang, M.H.; Liu, X.Y. An intensive study of aerosol optical properties in Beijing urban area. Atmos. Chem. Phys. 2009, 9, 8903–8915. [Google Scholar]
  6. Van Beelen, A.J.; Roelofs, G.J.H.; Hasekamp, O.P.; Henzing, J.S.; Rockmann, T. Estimation of aerosol water and chemical composition from AERONET sun-sky radiometer measurements at Cabauw, the Netherlands. Atmos. Chem. Phys. 2014, 14, 5969–5987. [Google Scholar] [CrossRef]
  7. Liu, P.F.; Zhao, C.S.; Zhang, Q.; Deng, Z.Z.; Huang, M.Y.; Ma, X.C.; Tie, X.X. Aircraft study of aerosol vertical distributions over Beijing and their optical properties. Tellus B 2009, 61, 756–767. [Google Scholar]
  8. Ma, N.; Zhao, C.S.; Nowak, A.; Muller, T.; Pfeifer, S.; Cheng, Y.F.; Deng, Z.Z.; Liu, P.F.; Xu, W.Y.; Ran, L.; et al. Aerosol optical properties in the north China plain during Hachi campaign: An in-situ optical closure study. Atmos. Chem. Phys. 2011, 11, 5959–5973. [Google Scholar]
  9. Omar, A.H.; Won, J.G.; Winker, D.M.; Yoon, S.C.; Dubovik, O.; McCormick, M.P. Development of global aerosol models using cluster analysis of Aerosol Robotic Network (AERONET) measurements. J. Geophys. Res. Atmos. 2005, 110. [Google Scholar] [CrossRef]
  10. Li, Z.; Gu, X.; Wang, L.; Li, D.; Xie, Y.; Li, K.; Dubovik, O.; Schuster, G.; Goloub, P.; Zhang, Y.; et al. Aerosol physical and chemical properties retrieved from ground-based remote sensing measurements during heavy haze days in Beijing winter. Atmos. Chem. Phys. 2013, 13, 10171–10183. [Google Scholar] [Green Version]
  11. Che, H.; Xia, X.; Zhu, J.; Li, Z.; Dubovik, O.; Holben, B.; Goloub, P.; Chen, H.; Estelles, V.; Cuevas-Agullo, E.; et al. Column aerosol optical properties and aerosol radiative forcing during a serious haze-fog month over north China plain in 2013 based on ground-based sunphotometer measurements. Atmos. Chem. Phys. 2014, 14, 2125–2138. [Google Scholar]
  12. Lewis, K.; Arnott, W.P.; Moosmuller, H.; Wold, C.E. Strong spectral variation of biomass smoke light absorption and single scattering albedo observed with a novel dual-wavelength photoacoustic instrument. J. Geophys. Res. Atmos. 2008, 113, D16203. [Google Scholar]
  13. Kirchstetter, T.W.; Novakov, T.; Hobbs, P.V. Evidence that the spectral dependence of light absorption by aerosols is affected by organic carbon. J. Geophys. Res. Atmos. 2004. [Google Scholar] [CrossRef]
  14. Xie, Y.S.; Li, Z.Q.; Li, L.; Wang, L.; Li, D.H.; Chen, C.; Li, K.T.; Xu, H. Study on influence of different mixing rules on the aerosol components retrieval from ground-based remote sensing measurements. Atmos. Res. 2014, 145, 267–278. [Google Scholar]
  15. Kokhanovsky, A.A.; von Hoyningen-Huene, W.; Burrows, J.P. Atmospheric aerosol load as derived from space. Atmos. Res. 2006, 81, 176–185. [Google Scholar]
  16. Park, R.S.; Song, C.H.; Han, K.M.; Park, M.E.; Lee, S.S.; Kim, S.B.; Shimizu, A. A study on the aerosol optical properties over East Asia using a combination of CMAQ-simulated aerosol optical properties and remote-sensing data via a data assimilation technique. Atmos. Chem. Phys. 2011, 11, 12275–12296. [Google Scholar]
  17. Li, J.; Carlson, B.E.; Dubovik, O.; Lacis, A.A. Recent trends in aerosol optical properties derived from AERONET measurements. Atmos. Chem. Phys. 2014, 14, 12271–12289. [Google Scholar]
  18. Eck, T.F.; Holben, B.N.; Sinyuk, A.; Pinker, R.T.; Goloub, P.; Chen, H.; Chatenet, B.; Li, Z.; Singh, R.P.; Tripathi, S.N.; et al. Climatological aspects of the optical properties of fine/coarse mode aerosol mixtures. J. Geophys. Res. Atmos. 2010. [CrossRef]
  19. Liu, Q.; Hong, Y.L. Comparison of aerosol single scattering albedo derived from the Ozone Monitoring Instrument with aerosol robotic network observations. Atmos. Ocean. Sci. Lett. 2012, 5, 264–269. [Google Scholar]
  20. Dubovik, O.; Holben, B.; Eck, T.F.; Smirnov, A.; Kaufman, Y.J.; King, M.D.; Tanre, D.; Slutsker, I. Variability of absorption and optical properties of key aerosol types observed in worldwide locations. J. Atmos. Sci. 2002, 59, 590–608. [Google Scholar]
  21. Che, H.; Shi, G.; Uchiyama, A.; Yamazaki, A.; Chen, H.; Goloub, P.; Zhang, X. Intercomparison between aerosol optical properties by a prede skyradiometer and cimel sunphotometer over Beijing, China. Atmos. Chem. Phys. 2008, 8, 3199–3214. [Google Scholar]
  22. Smirnov, A.; Holben, B.N.; Dubovik, O.; Frouin, R.; Eck, T.F.; Slutsker, I. Maritime component in aerosol optical models derived from aerosol robotic network data. J. Geophys. Res. Atmos. 2003. [Google Scholar] [CrossRef]
  23. Li, Z.Q.; Goloub, P.; Devaux, C.; Gu, X.F.; Deuze, J.L.; Qiao, Y.L.; Zhao, F.S. Retrieval of aerosol optical and physical properties from ground-based spectral, multi-angular, and polarized sun-photometer measurements. Remote Sens. Environ. 2006, 101, 519–533. [Google Scholar]
  24. Holben, B.N.; Eck, T.F.; Slutsker, I.; Tanre, D.; Buis, J.P.; Setzer, A.; Vermote, E.; Reagan, J.A.; Kaufman, Y.J.; Nakajima, T.; et al. AERONET—A federated instrument network and data archive for aerosol characterization. Remote Sens. Environ. 1998, 66, 1–16. [Google Scholar]
  25. Toledano, C.; Cachorro, V.E.; Gausa, M.; Stebel, K.; Aaltonen, V.; Berjon, A.; de Galisteo, J.P.O.; de Frutos, A.M.; Bennouna, Y.; Blindheim, S.; et al. Overview of sun photometer measurements of aerosol properties in Scandinavia and Svalbard. Atmos. Environ. 2012, 52, 18–28. [Google Scholar] [Green Version]
  26. Holben, B.N.; Tanre, D.; Smirnov, A.; Eck, T.F.; Slutsker, I.; Abuhassan, N.; Newcomb, W.W.; Schafer, J.S.; Chatenet, B.; Lavenu, F.; et al. An emerging ground-based aerosol climatology: Aerosol optical depth from AERONET. J. Geophys. Res. Atmos. 2001, 106, 12067–12097. [Google Scholar]
  27. Nakajima, T.; Sekiguchi, M.; Takemura, T.; Uno, I.; Higurashi, A.; Kim, D.; Sohn, B.J.; Oh, S.N.; Nakajima, T.Y.; Ohta, S.; et al. Significance of direct and indirect radiative forcings of aerosols in the East China sea region. J. Geophys. Res. Atmos. 2003. [Google Scholar] [CrossRef]
  28. Goloub, P.; Li, Z.; Dubovik, O.; Blarel, L.; Podvin, T.; Jankowiak, I.; Lecoq, R.; Lecoq, R.; Deroo, C.; Chatenet, B.; et al. Photons/AERONET sunphotometer network overview. Description-activities-results-art. Proc. SPIE 2008. [Google Scholar] [CrossRef]
  29. Bokoye, A.I.; Royer, A.; O’Neill, N.T.; Cliche, P.; Fedosejevs, G.; Teillet, P.M.; McArthur, L.J.B. Characterization of atmospheric aerosols across Canada from a ground-based sunphotometer network: Aerocan. Atmos. Ocean 2001, 39, 429–456. [Google Scholar]
  30. Che, H.Z.; Zhang, X.Y.; Chen, H.B.; Damiri, B.; Goloub, P.; Li, Z.Q.; Zhang, X.C.; Wei, Y.; Zhou, H.G.; Dong, F.; et al. Instrument calibration and aerosol optical depth validation of the China aerosol remote sensing network. J. Geophys. Res. Atmos. 2009. [Google Scholar] [CrossRef]
  31. Xin, J.Y.; Wang, Y.S.; Li, Z.Q.; Wang, P.C.; Hao, W.M.; Nordgren, B.L.; Wang, S.G.; Liu, G.R.; Wang, L.L.; Wen, T.X.; et al. Aerosol optical depth (AOD) and angstrom exponent of aerosols observed by the Chinese Sun Hazemeter Network from August 2004 to September 2005. J. Geophys. Res. Atmos. 2007. [Google Scholar] [CrossRef]
  32. Garland, R.M.; Yang, H.; Schmid, O.; Rose, D.; Nowak, A.; Achtert, P.; Wiedensohler, A.; Takegawa, N.; Kita, K.; Miyazaki, Y.; et al. Aerosol optical properties in a rural environment near the mega-city Guangzhou, China: Implications for regional air pollution, radiative forcing and remote sensing. Atmos. Chem. Phys. 2008, 8, 5161–5186. [Google Scholar]
  33. Yan, P.; Tang, J.; Huang, J.; Mao, J.T.; Zhou, X.J.; Liu, Q.; Wang, Z.F.; Zhou, H.G. The measurement of aerosol optical properties at a rural site in Northern China. Atmos. Chem. Phys. 2008, 8, 2229–2242. [Google Scholar]
  34. Li, Z.Q.; Eck, T.; Zhang, Y.; Zhang, Y.H.; Li, D.H.; Li, L.; Xu, H.; Hou, W.Z.; Lv, Y.; Goloub, P.; et al. Observations of residual submicron fine aerosol particles related to cloud and fog processing during a major pollution event in Beijing. Atmos. Environ. 2014, 86, 187–192. [Google Scholar]
  35. Chen, H.; Gu, X.; Cheng, T.; Li, Z.; Yu, T. The spatial-temporal variations in optical properties of atmosphere aerosols derived from AERONET dataset over China. Meteorol. Atmos. Phys. 2013, 122, 65–73. [Google Scholar]
  36. Xu, H.; Li, Z.Q.; Li, D.H.; Li, L.; Chen, X.F.; Xie, Y.S.; Li, K.T.; Chen, C.; Zhang, Y.H. Ground-based polarimetric remote sensing of dust aerosol properties in Chinese deserts near Hexi Corridor. Adv. Meteorol. 2014, 2014, 240452. [Google Scholar]
  37. Xie, Y.S.; Li, D.H.; Li, K.T.; Zhang, L.; Chen, C.; Xu, H.; Li, Z.Q. Aerosol optical and microphysical properties in haze days based on ground-based remote sensing measurements. J. Remote Sens. 2013, 17, 970–980. [Google Scholar]
  38. Min, M.; Wang, P.C.; Zong, X.M.; Xia, J.R.; Meng, X.Y. Observation and study on aerosol properties in hazy days. Clim. Environ. Res. 2009, 14, 153–160. [Google Scholar]
  39. Yu, X.N.; Li, X.M.; Deng, Z.R.D.; de, Q.Y.Z.; Yuan, S. Optical properties of aerosol during haze-fog episodes in Beijing. Environ. Sci. 2012, 33, 1057–1062. [Google Scholar]
  40. Xia, X.; Chen, H.; Goloub, P.; Zhang, W.; Chatenet, B.; Wang, P. A compilation of aerosol optical properties and calculation of direct radiative forcing over an urban region in Northern China. J. Geophys. Res. Atmos. 2007. [Google Scholar] [CrossRef]
  41. Liu, Y.; Huang, J.; Shi, G.; Takamura, T.; Khatri, P.; Bi, J.; Shi, J.; Wang, T.; Wang, X.; Zhang, B. Aerosol optical properties and radiative effect determined from sky-radiometer over loess Plateau of Northwest China. Atmos. Chem. Phys. 2011, 11, 11455–11463. [Google Scholar]
  42. Smirnov, A.; Holben, B.N.; Kaufman, Y.J.; Dubovik, O.; Eck, T.F.; Slutsker, I.; Pietras, C.; Halthore, R.N. Optical properties of atmospheric aerosol in maritime environments. J. Atmos. Sci. 2002, 59, 501–523. [Google Scholar]
  43. Li, Z.Q.; Li, D.H.; Li, K.T.; Xu, H.; Chen, X.F.; Chen, C.; Xie, Y.S.; Li, L.; Li, L.; Li, W.; et al. Sun-sky radiometer observation network with the extension of multi-wavelength polarization measurements. J. Remote Sens. 2015, 19, 495–519. [Google Scholar]
  44. Li, Z.Q.; Blarel, L.; Podvin, T.; Goloub, P.; Buis, J.P.; Morel, J.P. Transferring the calibration of direct solar irradiance to diffuse-sky radiance measurements for CIMEL sun-sky radiometers. Appl. Opt. 2008, 47, 1368–1377. [Google Scholar]
  45. Li, Z.Q.; Goloub, P.; Blarel, L.; Yang, B.Y.; Li, K.T.; Podvin, T.; Li, D.H.; Xie, Y.S.; Chen, X.F.; Gu, X.F.; et al. Method to intercalibrate sunphotometer constants using an integrating sphere as a light source in the laboratory. Appl. Opt. 2013, 52, 2226–2234. [Google Scholar]
  46. Smirnov, A.; Holben, B.N.; Eck, T.F.; Dubovik, O.; Slutsker, I. Cloud-screening and quality control algorithms for the AERONET database. Remote Sens. Environ. 2000, 73, 337–349. [Google Scholar]
  47. Holben, B.N.; Eck, T.F.; Slutsker, I.; Smirnov, A.; Sinyuk, A.; Schafer, J.; Giles, D.; Dubovik, O. AERONET’S Version 2.0 Quality Assurance Criteria-Art. Available online: http://aeronet.gsfc.nasa.gov/new_web/PDF/AERONETcriteria_final1.pdf (accessed on 28 March 2015).
  48. Frohlich, C.; Shaw, G.E. New determination of Rayleigh-scattering in the terrestrial atmosphere. Appl. Opt. 1980, 19, 1773–1775. [Google Scholar]
  49. Dubovik, O.; King, M.D. A flexible inversion algorithm for retrieval of aerosol optical properties from sun and sky radiance measurements. J. Geophys. Res. Atmos. 2000, 105, 20673–20696. [Google Scholar]
  50. Dubovik, O.; Sinyuk, A.; Lapyonok, T.; Holben, B.N.; Mishchenko, M.; Yang, P.; Eck, T.F.; Volten, H.; Munoz, O.; Veihelmann, B. Application of spheroid models to account for aerosol particle nonsphericity in remote sensing of desert dust. J. Geophys. Res. Atmos. 2006, 111. [Google Scholar] [CrossRef]
  51. Nakajima, T.; Tanaka, M. Algorithms for radiative intensity calculations in moderately thick atmospheres using a truncation approximation. J. Quant. Spectrosc. Radiat. 1988, 40, 51–69. [Google Scholar]
  52. Barnard, J.C.; Fast, J.D.; Paredes-Miranda, G.; Arnott, W.P.; Laskin, A. Technical note: Evaluation of the WRF-Chem “aerosol chemical to aerosol optical properties” module using data from the MILAGRO campaign. Atmos. Chem. Phys. 2010, 10, 7325–7340. [Google Scholar]
  53. Kassianov, E.; Barnard, J.; Pekour, M.; Berg, L.K.; Shilling, J.; Flynn, C.; Mei, F.; Jefferson, A. Simultaneous retrieval of effective refractive index and density from size distribution and light-scattering data: Weakly absorbing aerosol. Atmos. Meas. Tech. 2014, 7, 3247–3261. [Google Scholar]
  54. Dubovik, O.; Smirnov, A.; Holben, B.N.; King, M.D.; Kaufman, Y.J.; Eck, T.F.; Slutsker, I. Accuracy assessments of aerosol optical properties retrieved from aerosol robotic network (AERONET) sun and sky radiance measurements. J. Geophys. Res. Atmos. 2000, 105, 9791–9806. [Google Scholar]
  55. Li, Z.; Goloub, P.; Dubovik, O.; Blarel, L.; Zhang, W.; Podvin, T.; Sinyuk, A.; Sorokin, M.; Chen, H.; Holben, B.; et al. Improvements for ground-based remote sensing of atmospheric aerosol properties by additional polarimetric measurements. J. Quant. Spectrosc. Radiat. Transf. 2009, 110, 1954–1961. [Google Scholar]
  56. Kim, S.W.; Yoon, S.C.; Kim, J.; Kim, S.Y. Seasonal and monthly variations of columnar aerosol optical properties over East Asia determined from multi-year MODIS, LiDAR, and AERONET sun/sky radiometer measurements. Atmos. Environ. 2007, 41, 1634–1651. [Google Scholar]
  57. Takemura, T.; Nakajima, T.; Higurashi, A.; Ohta, S.; Sugimoto, N. Aerosol distributions and radiative forcing over the Asian pacific region simulated by spectral radiation-transport model for aerosol species (SPRINTARS). J. Geophys. Res. Atmos. 2003, 108. [Google Scholar] [CrossRef]
  58. Schuster, G.L.; Lin, B.; Dubovik, O. Remote sensing of aerosol water uptake. Geophys. Res. Lett. 2009, 36. [Google Scholar] [CrossRef]
  59. Huebert, B.J.; Bates, T.; Russell, P.B.; Shi, G.Y.; Kim, Y.J.; Kawamura, K.; Carmichael, G.; Nakajima, T. An overview of ACE-Asia: Strategies for quantifying the relationships between Asian aerosols and their climatic impacts. J. Geophys. Res. Atmos. 2003, 108. [Google Scholar] [CrossRef]
  60. Anderson, T.L.; Masonis, S.J.; Covert, D.S.; Ahlquist, N.C.; Howell, S.G.; Clarke, A.D.; McNaughton, C.S. Variability of aerosol optical properties derived from in situ aircraft measurements during ACE-Asia. J. Geophys. Res. Atmos. 2003, 108. [Google Scholar] [CrossRef]
  61. Wang, L.; Li, Z.Q.; Tian, Q.J.; Ma, Y.; Zhang, F.X.; Zhang, Y.; Li, D.H.; Li, K.T.; Li, L. Estimate of aerosol absorbing components of black carbon, brown carbon, and dust from ground-based remote sensing data of sun-sky radiometers. J. Geophys. Res. Atmos. 2013, 118, 6534–6543. [Google Scholar]
  62. Koven, C.D.; Fung, I. Inferring dust composition from wavelength-dependent absorption in aerosol robotic network (AERONET) data. J. Geophys. Res. Atmos. 2006, 111. [Google Scholar] [CrossRef]
  63. Bahadur, R.; Praveen, P.S.; Xu, Y.Y.; Ramanathan, V. Solar absorption by elemental and brown carbon determined from spectral observations. Proc. Natl. Acad. Sci. USA 2012, 109, 17366–17371. [Google Scholar]
  64. Feng, Y.; Ramanathan, V.; Kotamarthi, V.R. Brown carbon: A significant atmospheric absorber of solar radiation? Chem. Phys. 2013, 13, 8607–8621. [Google Scholar]
  65. Kim, D.; Chin, M.; Yu, H.; Eck, T.; Sinyuk, A.; Smirnov, A.; Holben, B. Dust optical properties over North Africa and Arabian Peninsula derived from the AERONET dataset. Atmos. Chem. Phys. 2011, 11, 10733–10741. [Google Scholar]
  66. Gillespie, J.B.; Lindberg, J.D. Ultraviolet and visible imaginary refractive-index of strongly absorbing atmospheric particulate matter. Appl. Opt. 1992, 31, 2112–2115. [Google Scholar]
  67. Jia, X.P.; Wang, H.B. Analysis of atmospheric dust composition and its influence in Hexi Corridor, Gansu. J. Desert Res. 2009, 29, 156–161. [Google Scholar]
  68. Li, Z.Q.; Goloub, P.; Blarel, L.; Damiri, B.; Podvin, T.; Jankowiak, I. Dust optical properties retrieved from ground-based polarimetric measurements. Appl. Opt. 2007, 46, 1548–1553. [Google Scholar]
  69. Irshad, R.; Grainger, R.G.; Peters, D.M.; McPheat, R.A.; Smith, K.M.; Thomas, G. Laboratory measurements of the optical properties of sea salt aerosol. Atmos. Chem. Phys. 2009, 9, 221–230. [Google Scholar]
  70. Reid, J.S.; Jonsson, H.H.; Maring, H.B.; Smirnov, A.; Savoie, D.L.; Cliff, S.S.; Reid, E.A.; Livingston, J.M.; Meier, M.M.; Dubovik, O.; et al. Comparison of size and morphological measurements of coarse mode dust particles from Africa. J. Geophys. Res. Atmos. 2003, 108. [Google Scholar] [CrossRef]
  71. Martins, J.V.; Artaxo, P.; Liousse, C.; Reid, J.S.; Hobbs, P.V.; Kaufman, Y.J. Effects of black carbon content, particle size, and mixing on light absorption by aerosols from biomass burning in Brazil. J. Geophys. Res. Atmos. 1998, 103, 32041–32050. [Google Scholar]
  72. Lesins, G.; Chylek, P.; Lohmann, U. A Study of Internal and External Mixing Scenarios and Its Effect on Aerosol Optical Properties and Direct Radiative Forcing. Available online: http://onlinelibrary.wiley.com/doi/10.1029/2001JD000973/pdf (accessed on 28 March 2015).

