
Building Façade Recognition Using Oblique Aerial Images


Abstract
:
1. Introduction
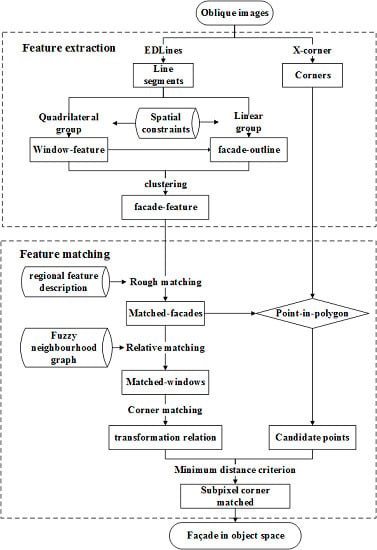
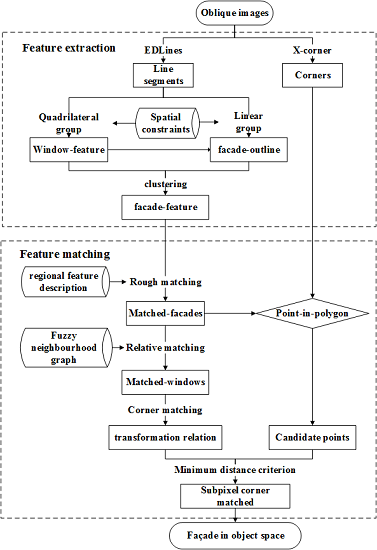
2. Methodology
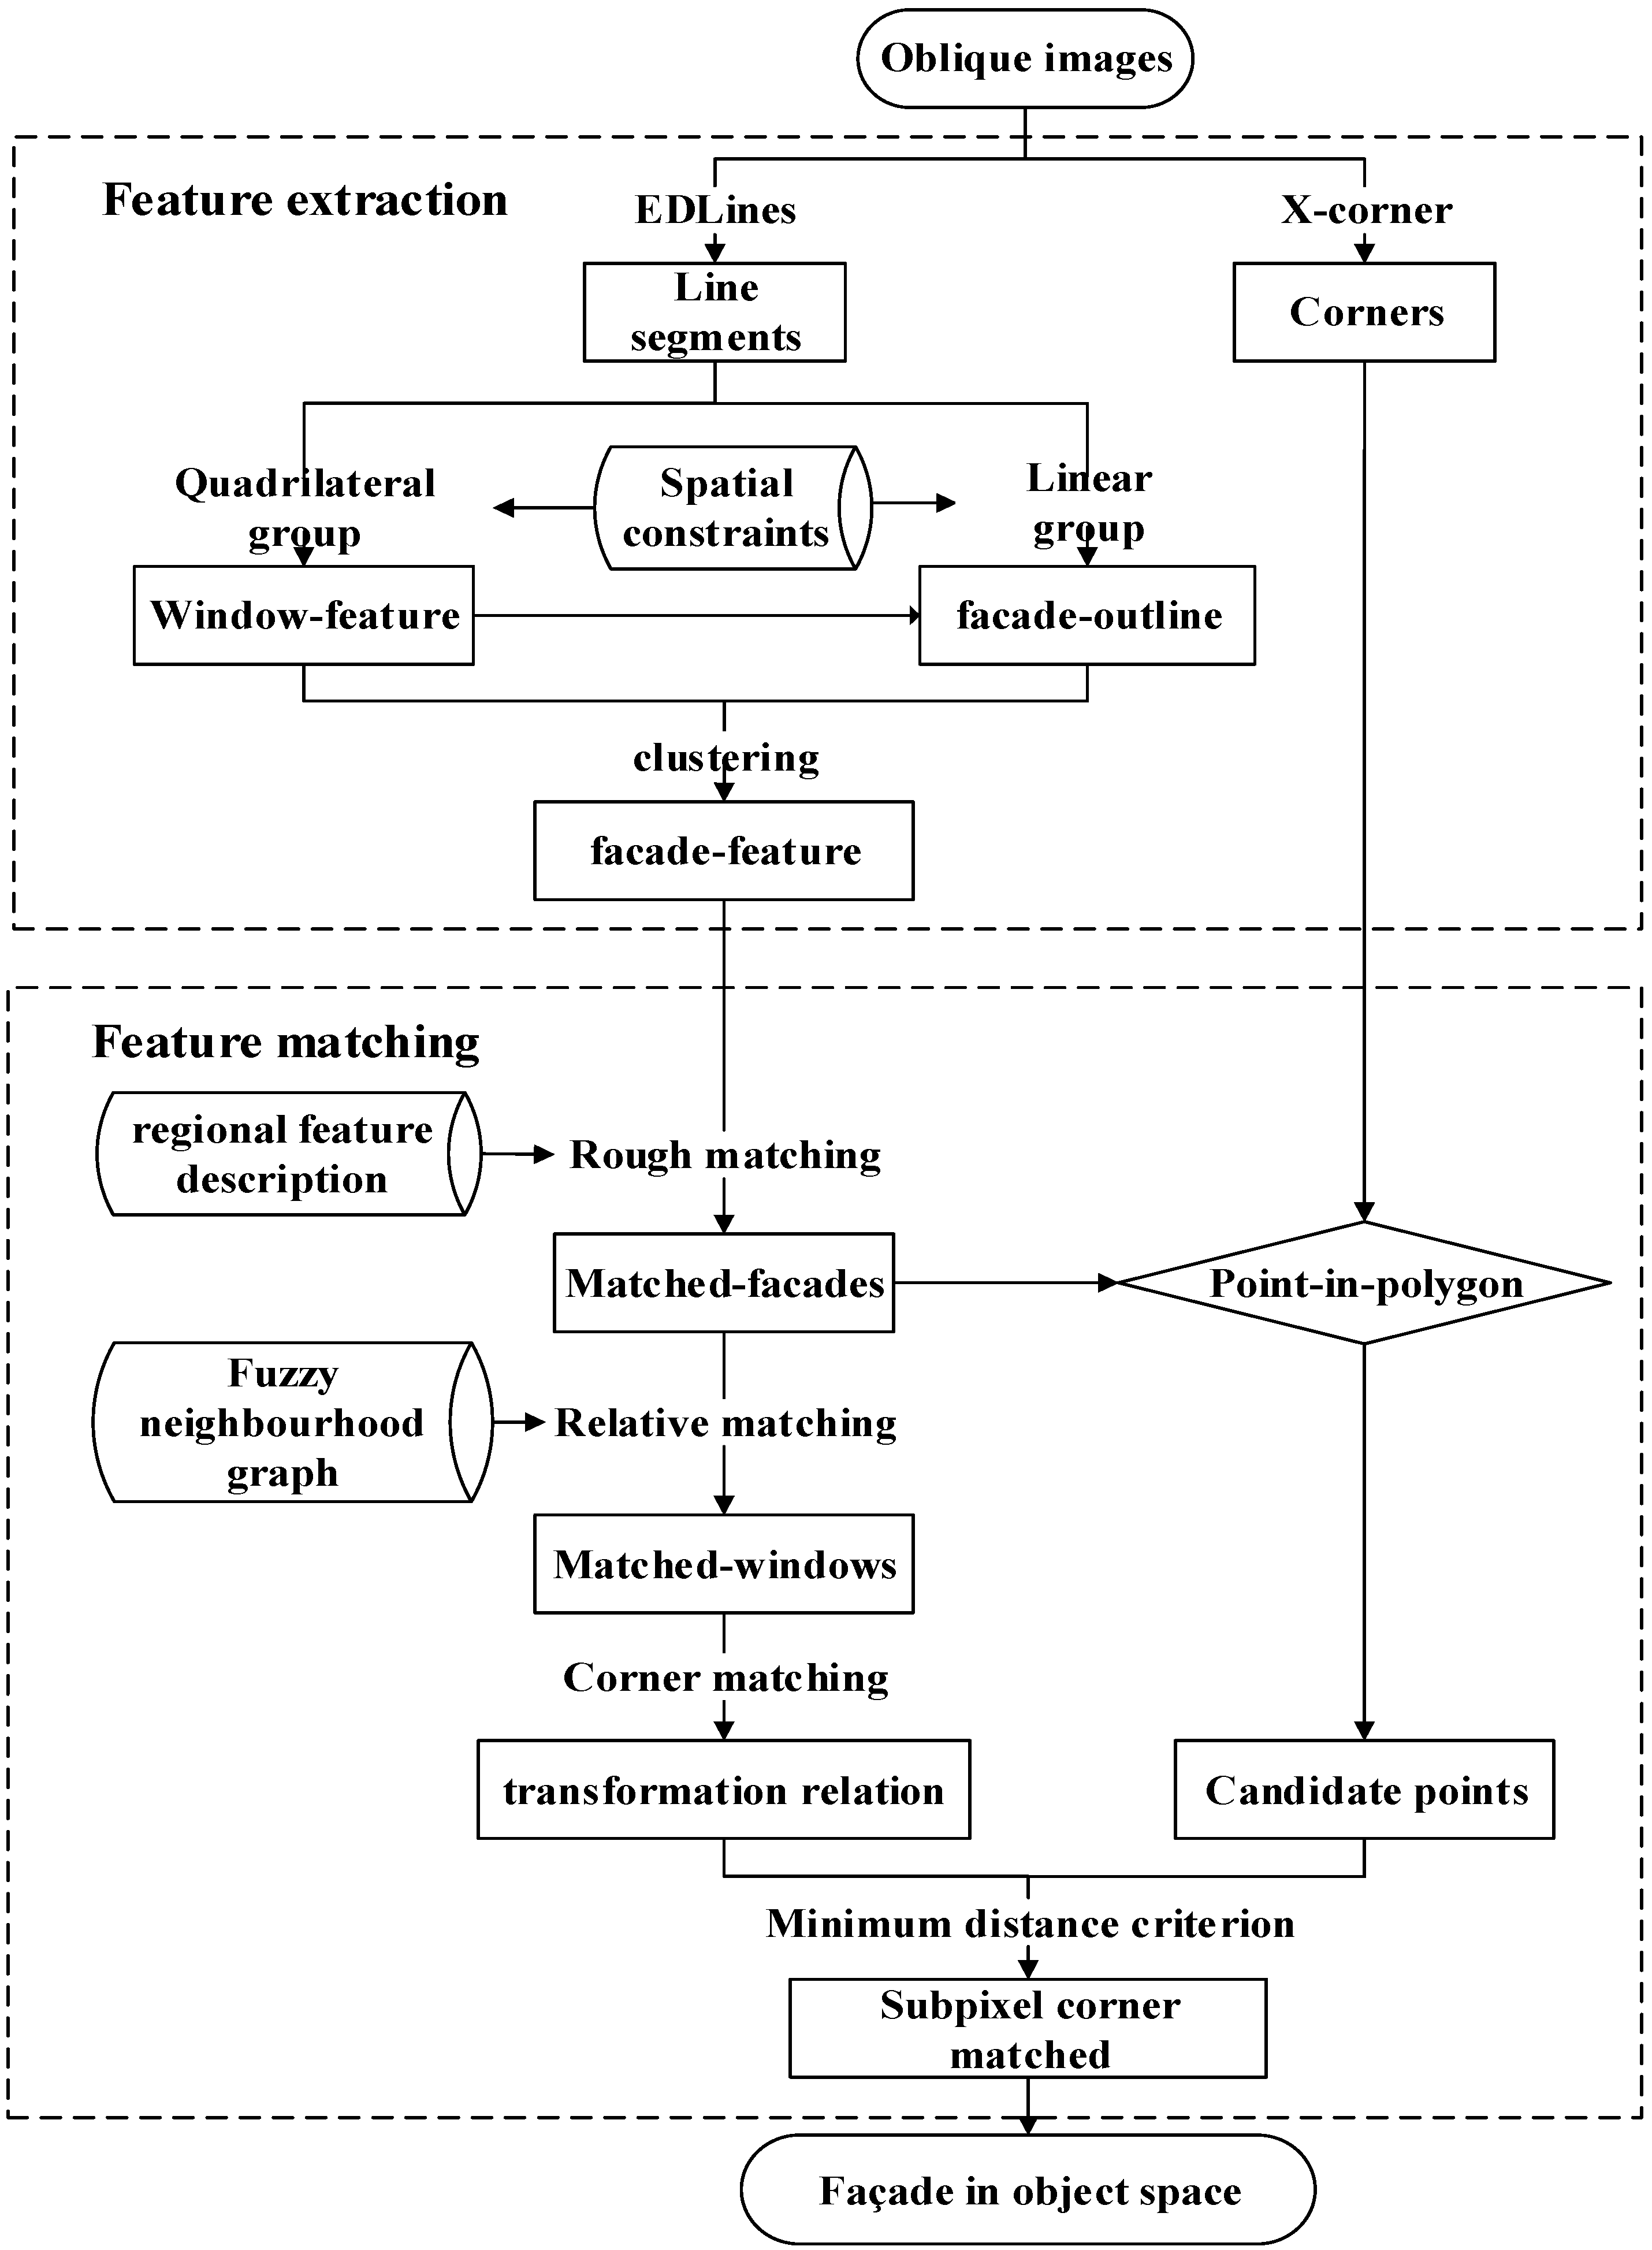
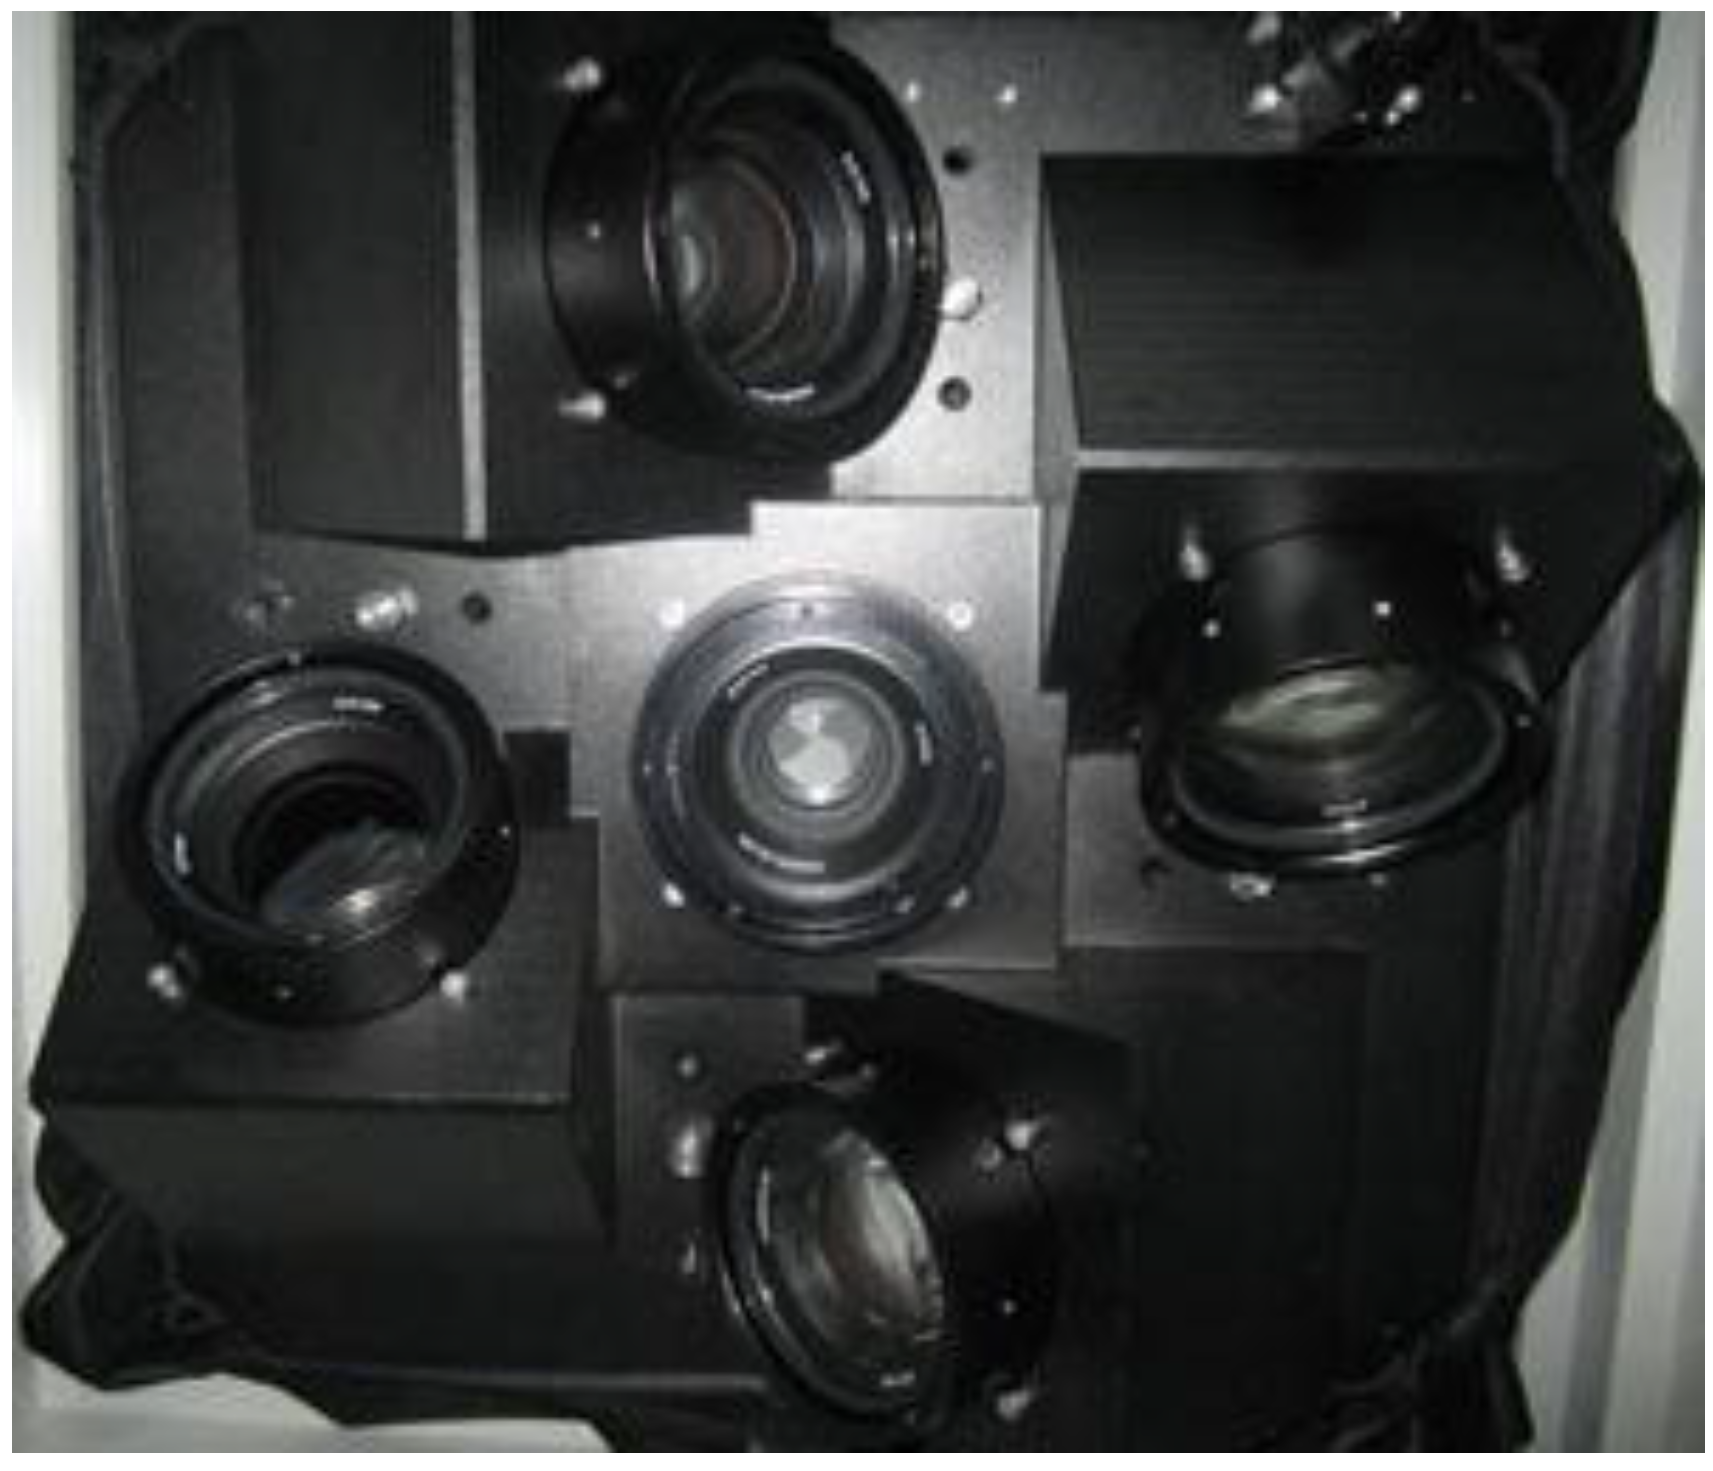
2.1. Materials

2.2. Feature Detection
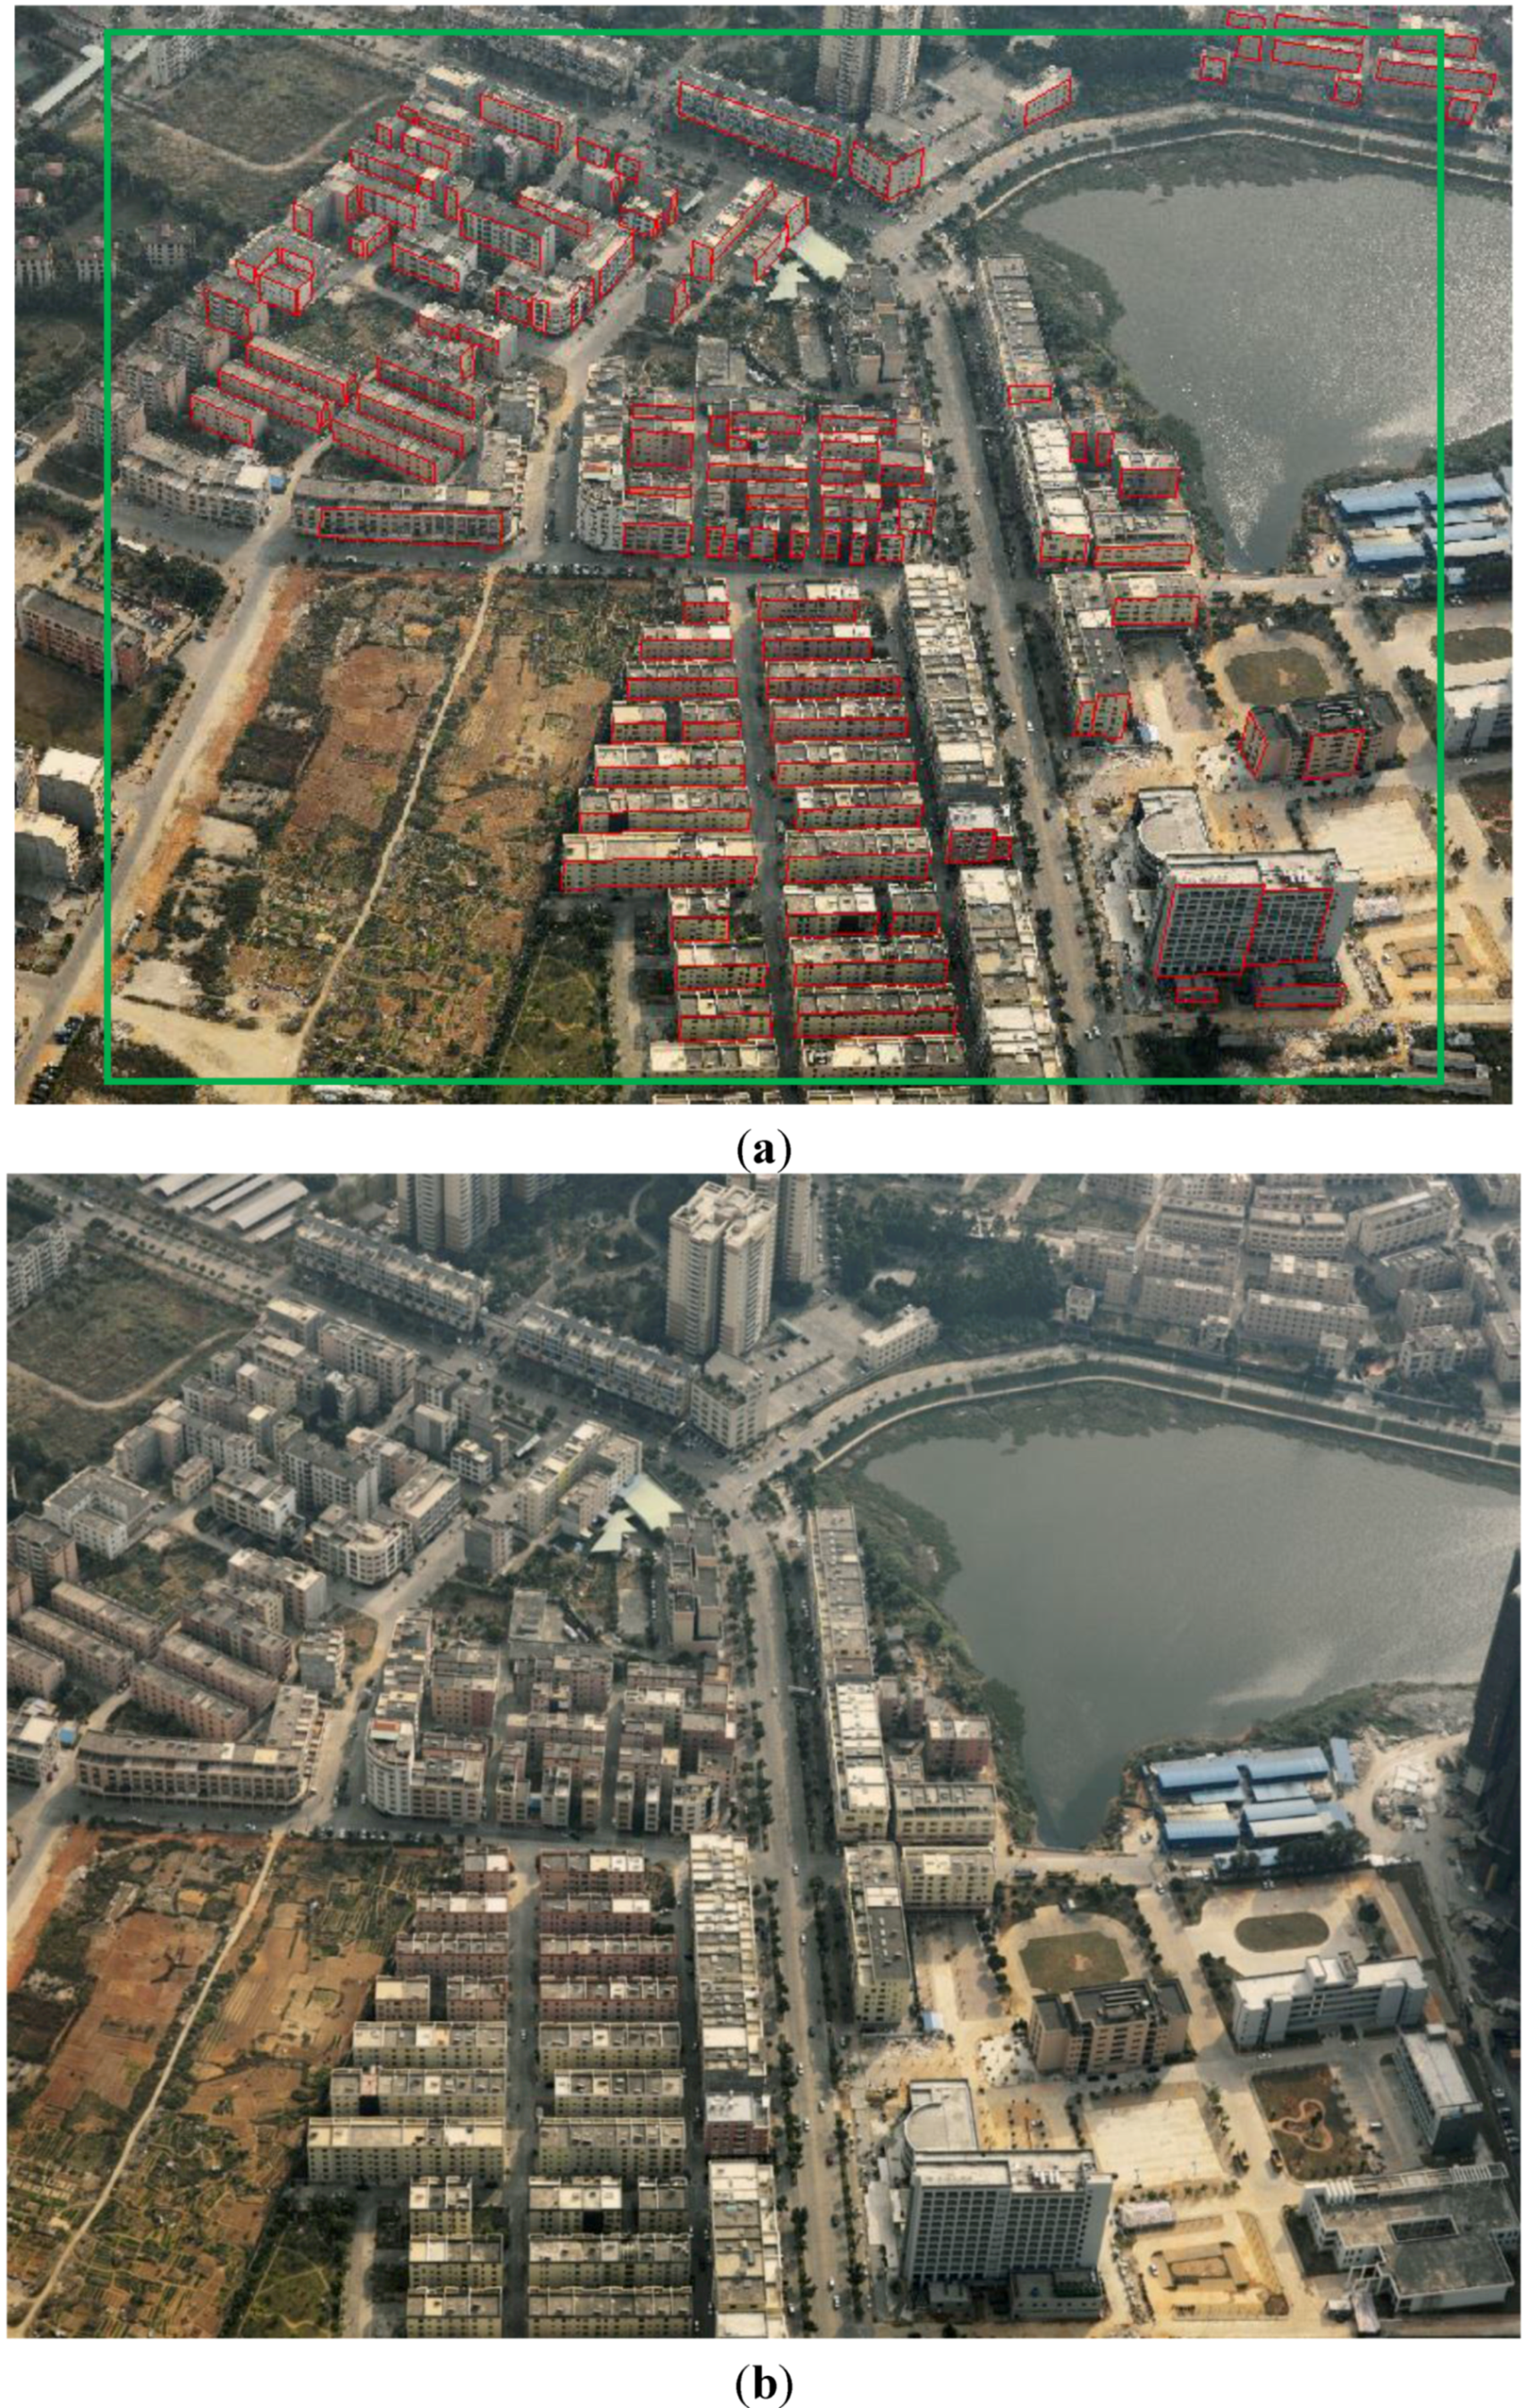
2.2.1. Line Segment Extraction
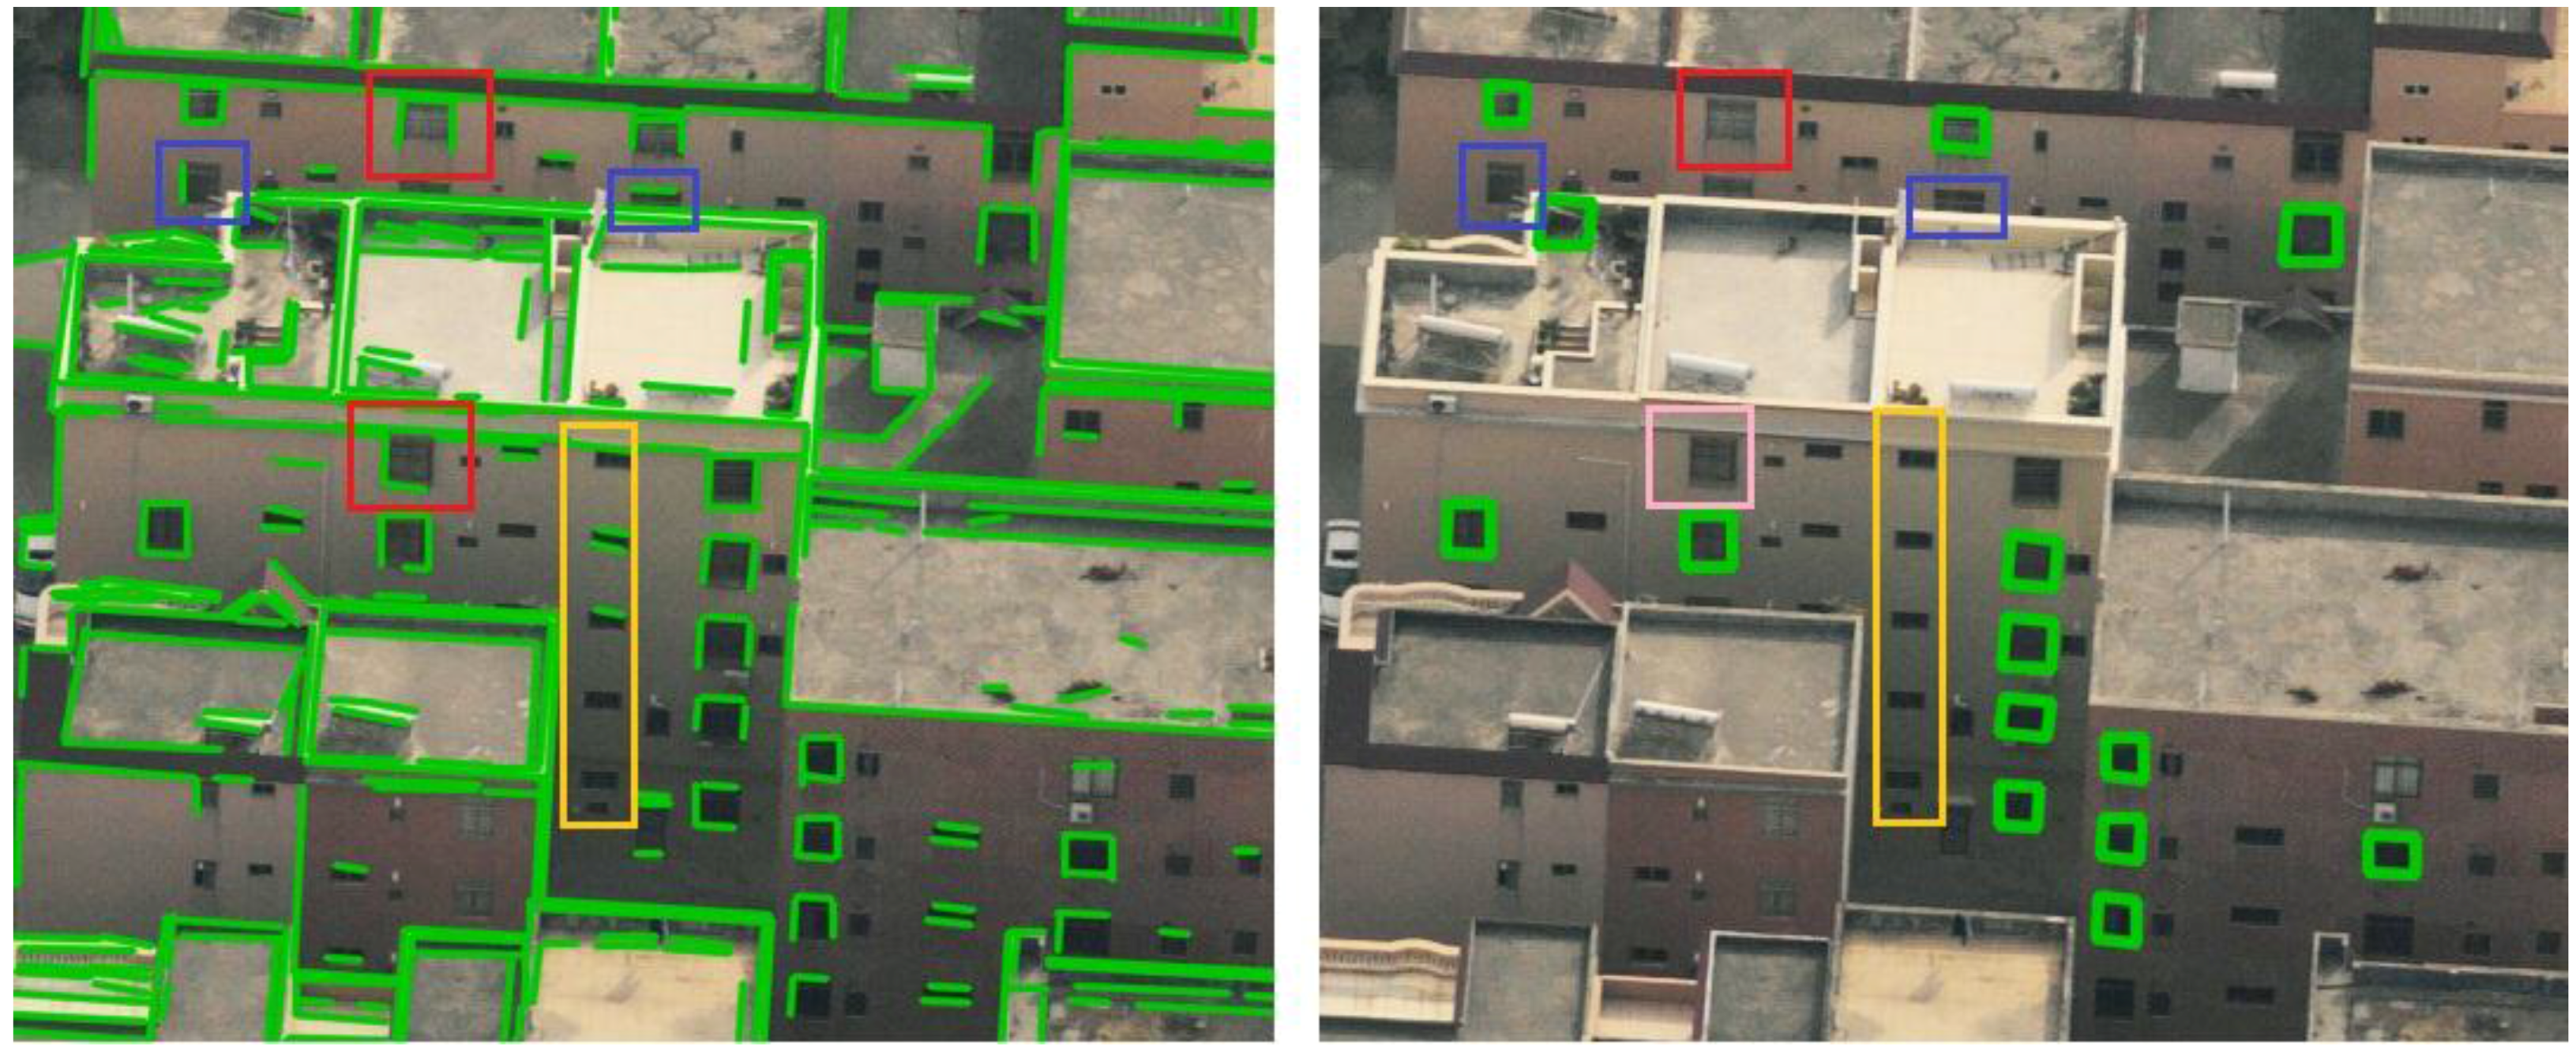
2.2.2. Window Regional Feature Grouping
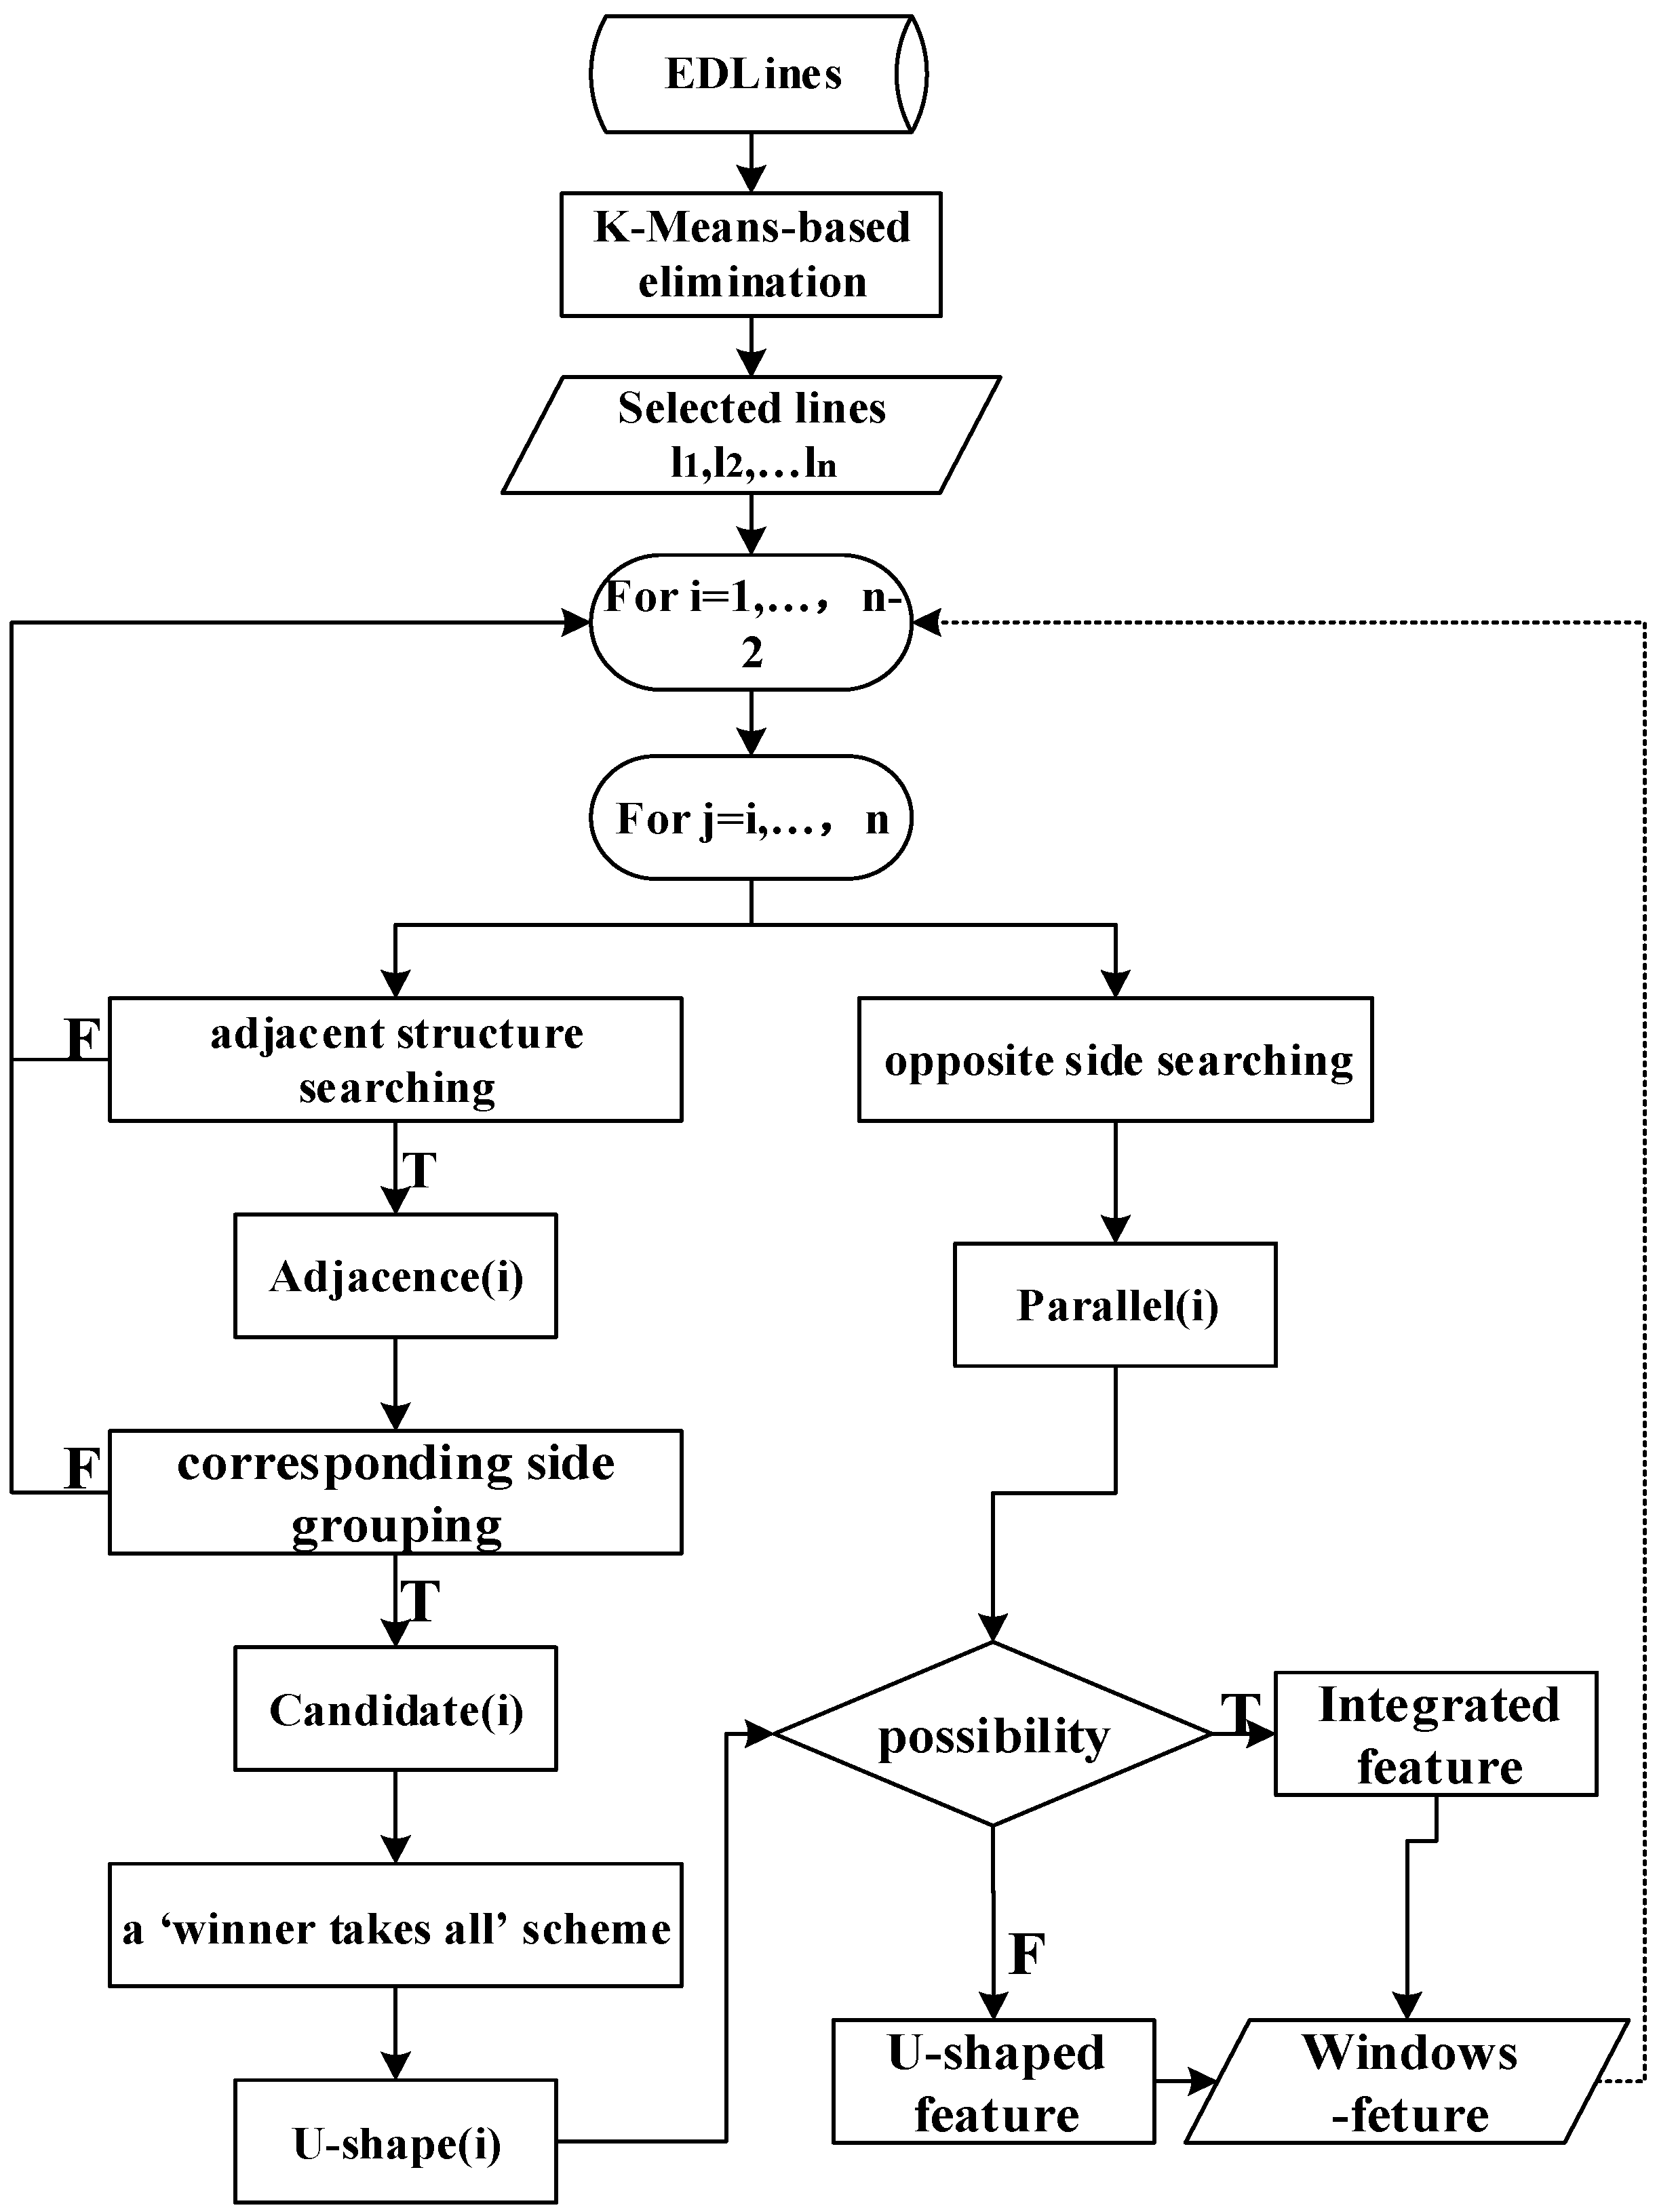
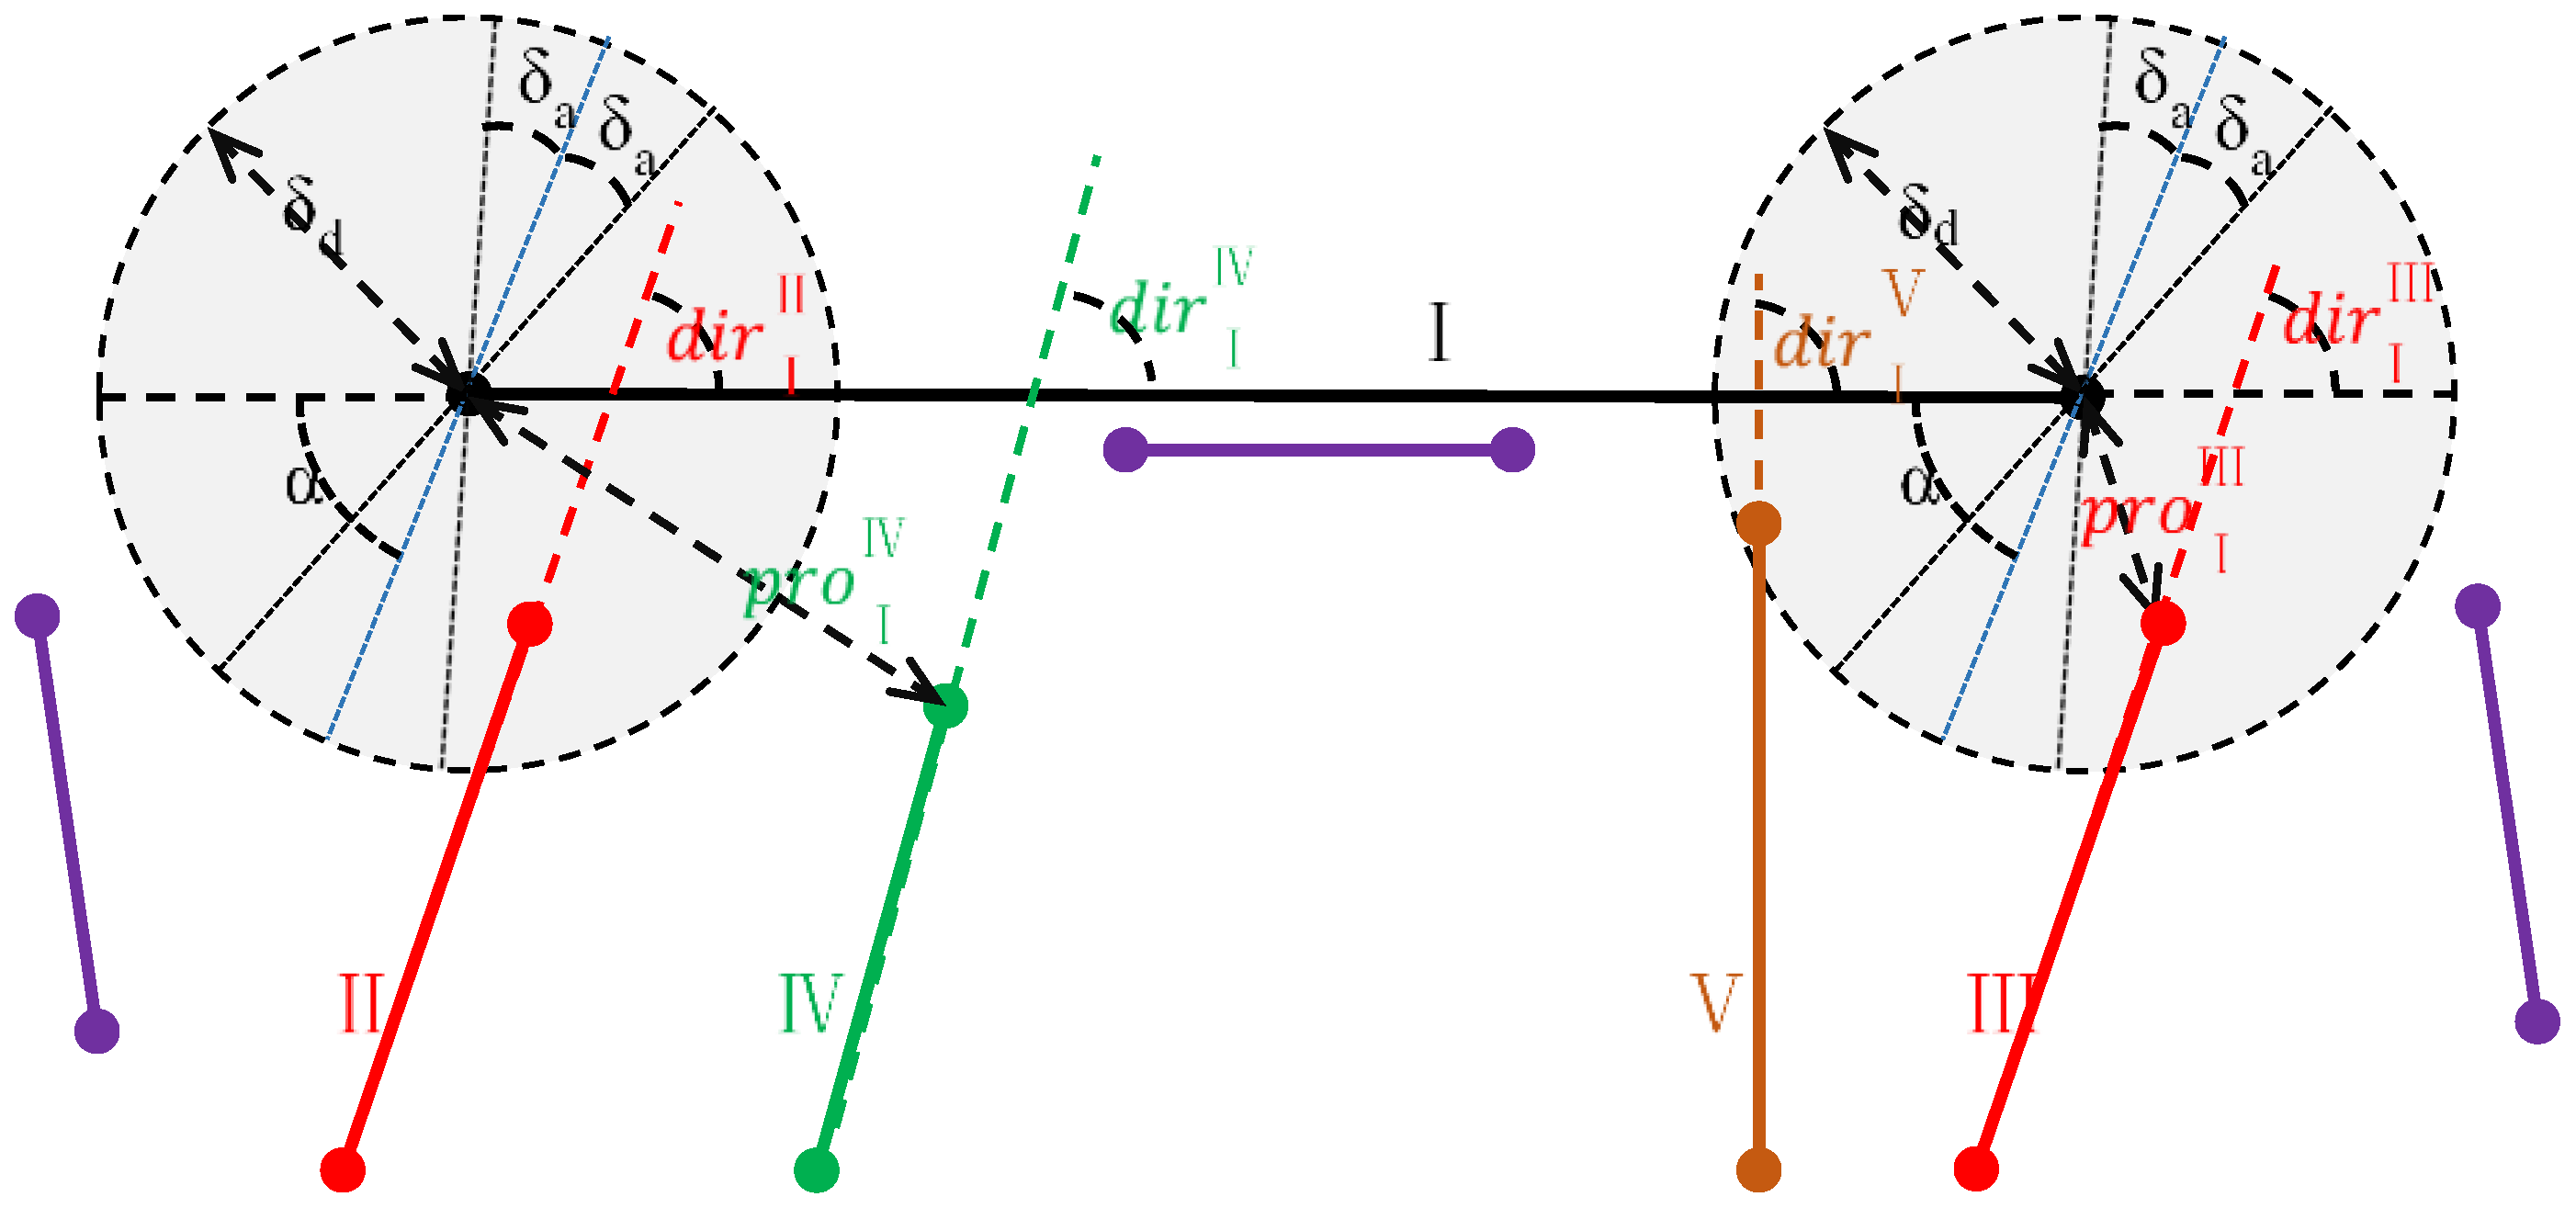
Searching for Candidate Adjacent Segments
Determining the Best U-shaped Structure
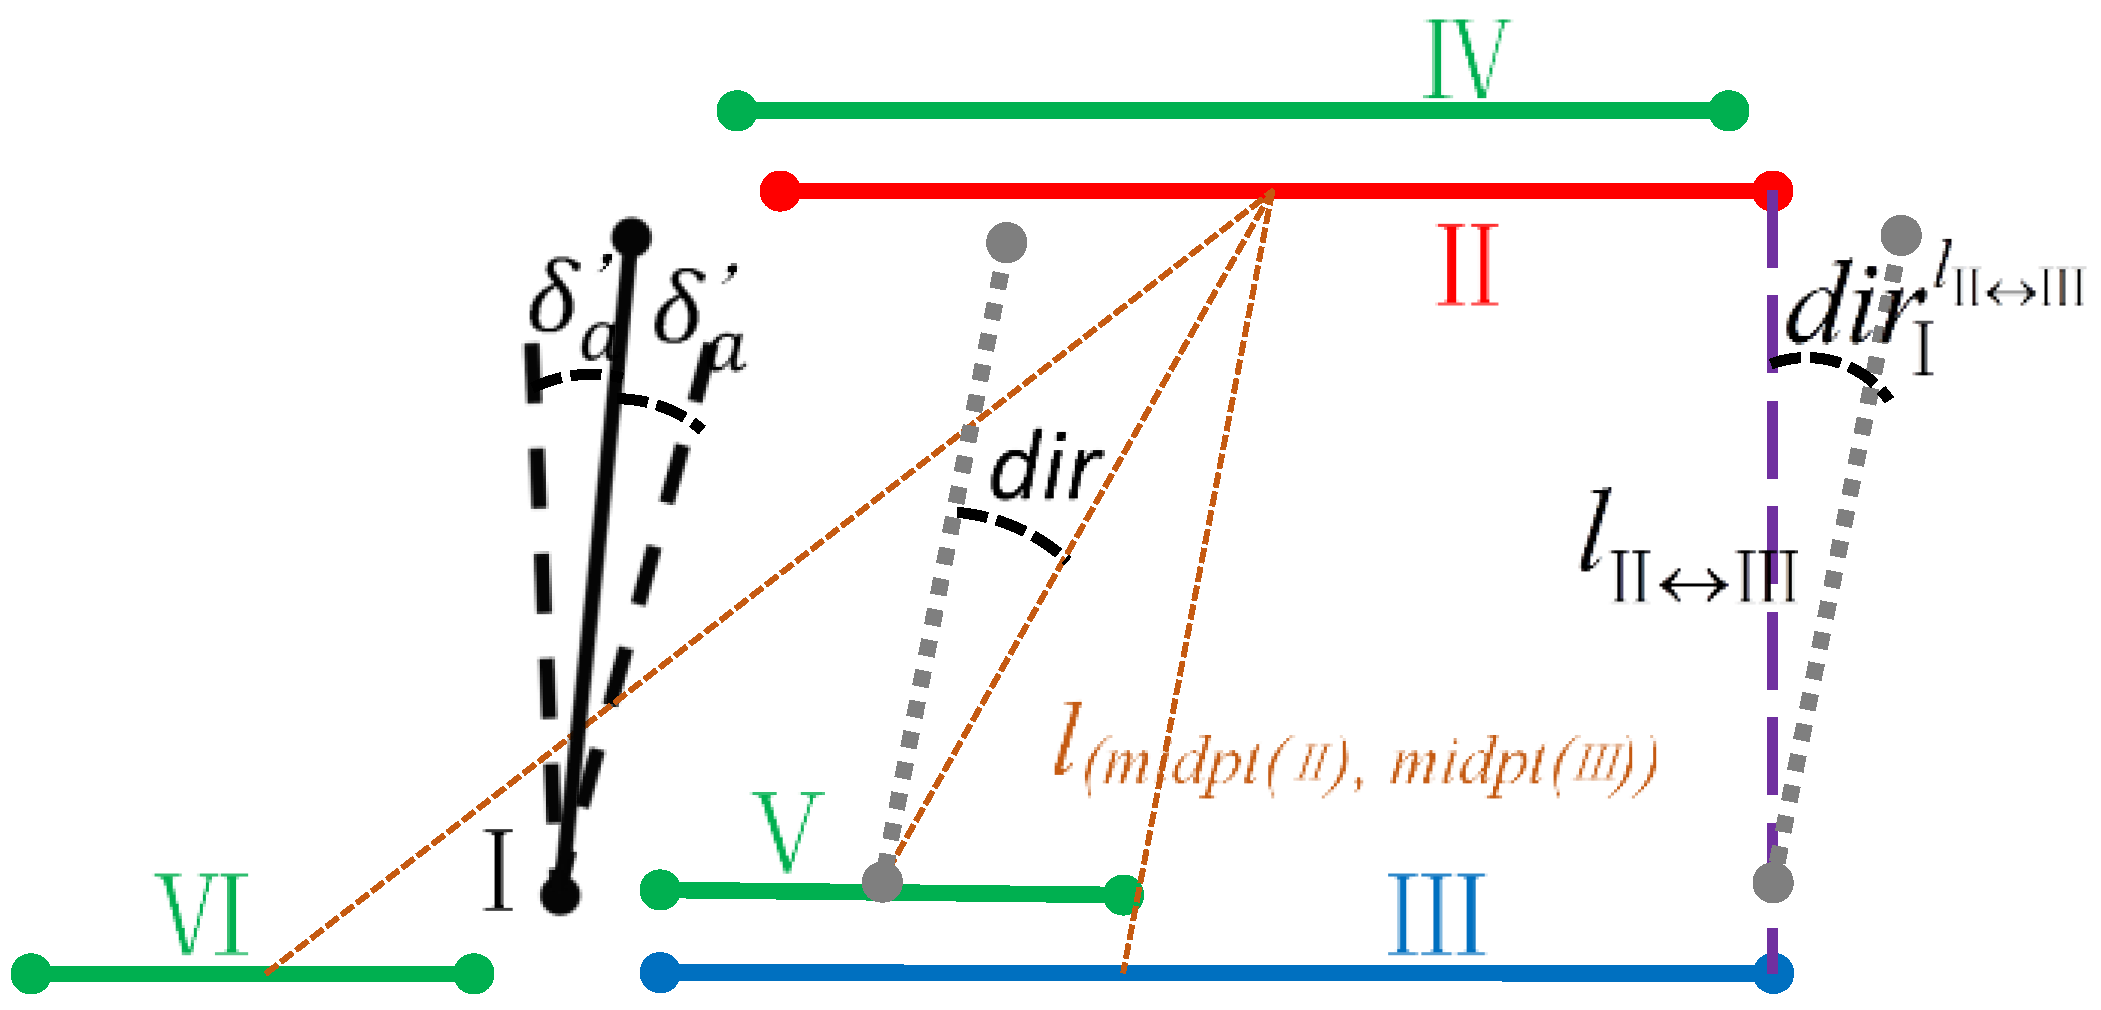
Search for Candidate Parallel Edges
Generating the Windows Regional Feature
Parameter Setting in the Processing
2.2.3. Selection and Linear Grouping of Façade Edges

Judging Edge Directions through Cluster Analysis
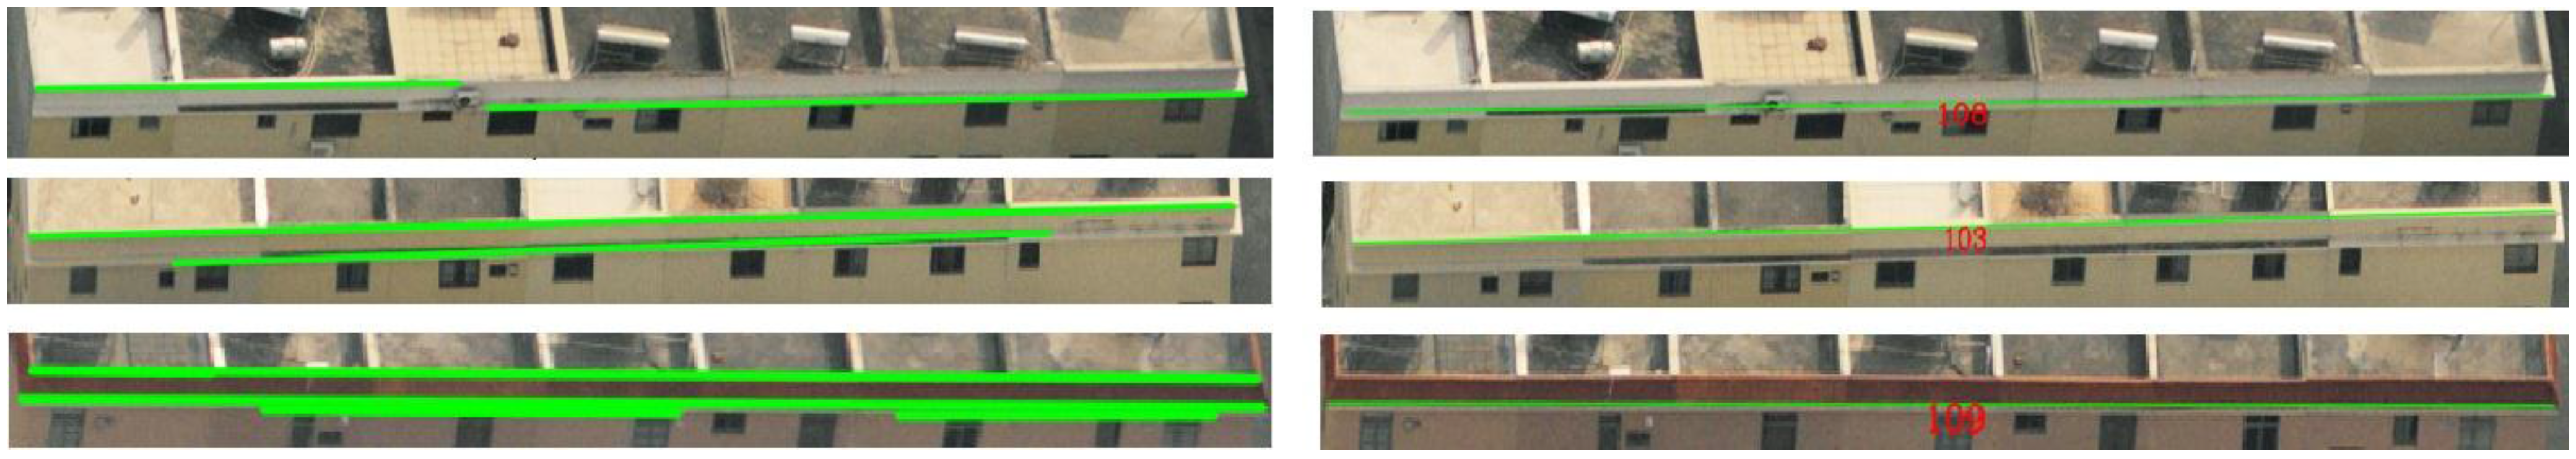
Façade Linear Feature Organization
- If no window regional feature is located between two straight lines, the shorter one is eliminated.
- If no window regional feature is located below the straight line within a certain range, the line is eliminated.
- If many windows are located above the straight line within a certain range, the line is eliminated.
- If two lines partially overlap, the lines are replaced by a new line that extends the longer line to fully cover the shorter one (Figure 9 (left)).
- If two lines are nearly collinear but are far apart from each other and there is another line in the neighbourhood that overlaps both lines, the lines are replaced by a new line that connects the farthest endpoints (Figure 9 (right)).

2.2.4. Façade Regional Feature Construction Based on Plane Sweeping Methods
2.3. Feature Matching and Reconstruction
2.3.1. Coarse Matching Based on the Façade Features
Generating and Matching Seeds
Matching Entire Façades
2.3.2. Coarse Matching Based on the Window Features
Construction of a Window Topological Graph
Fuzzy Weighting
Iterated Matching
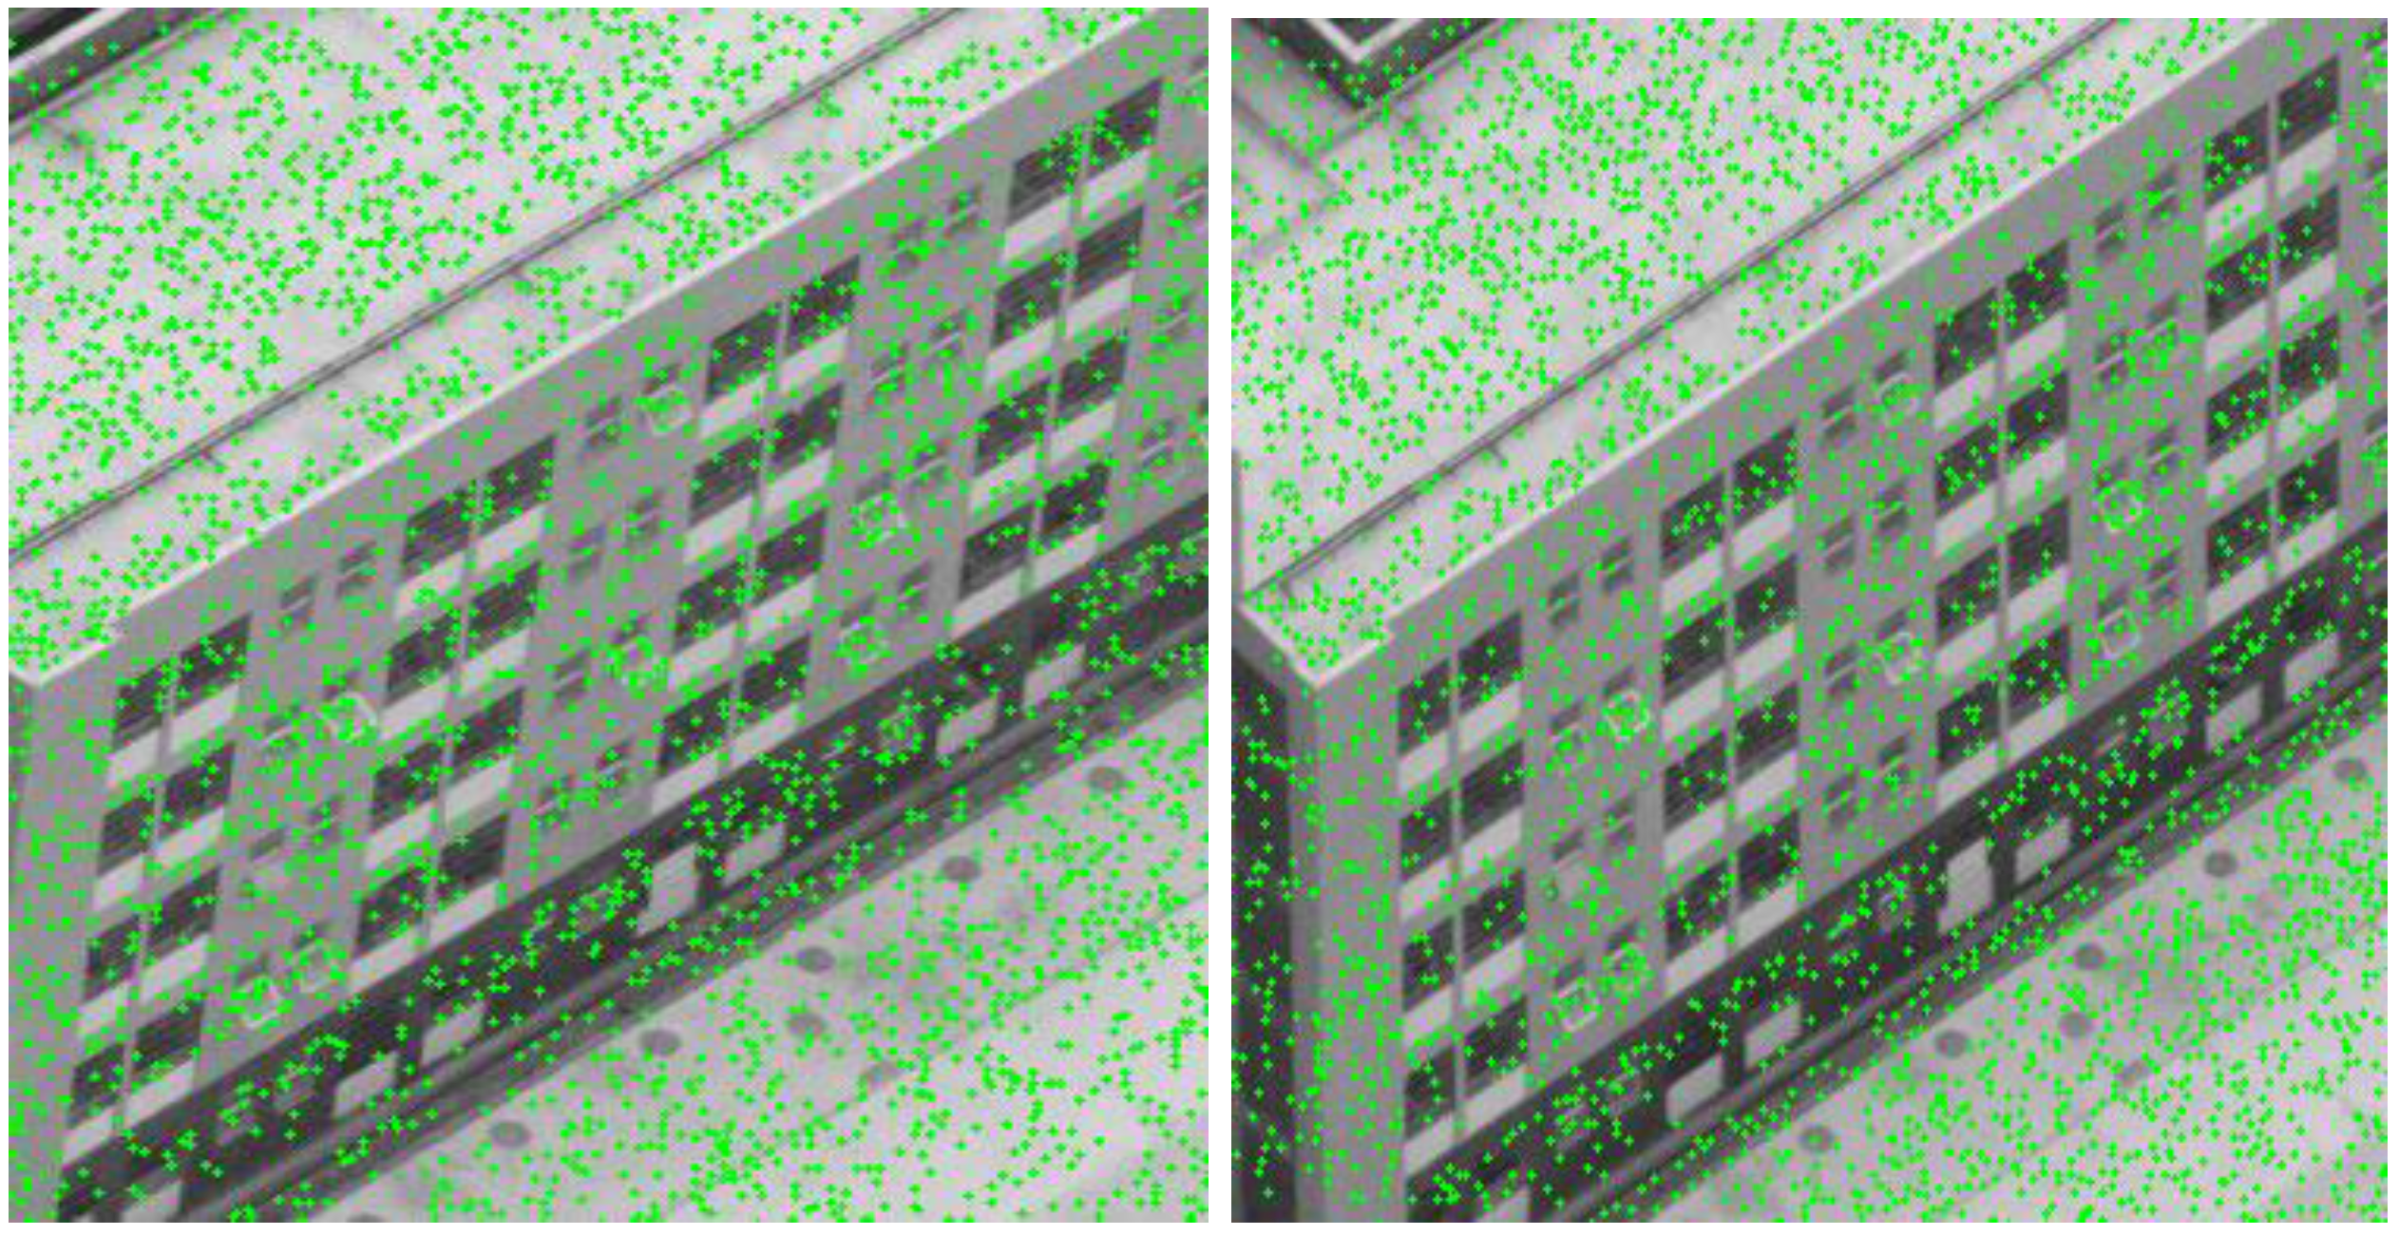
2.3.3. Fine Matching Based on X-Corner Features
2.3.4. Spatial Localization of the Façade
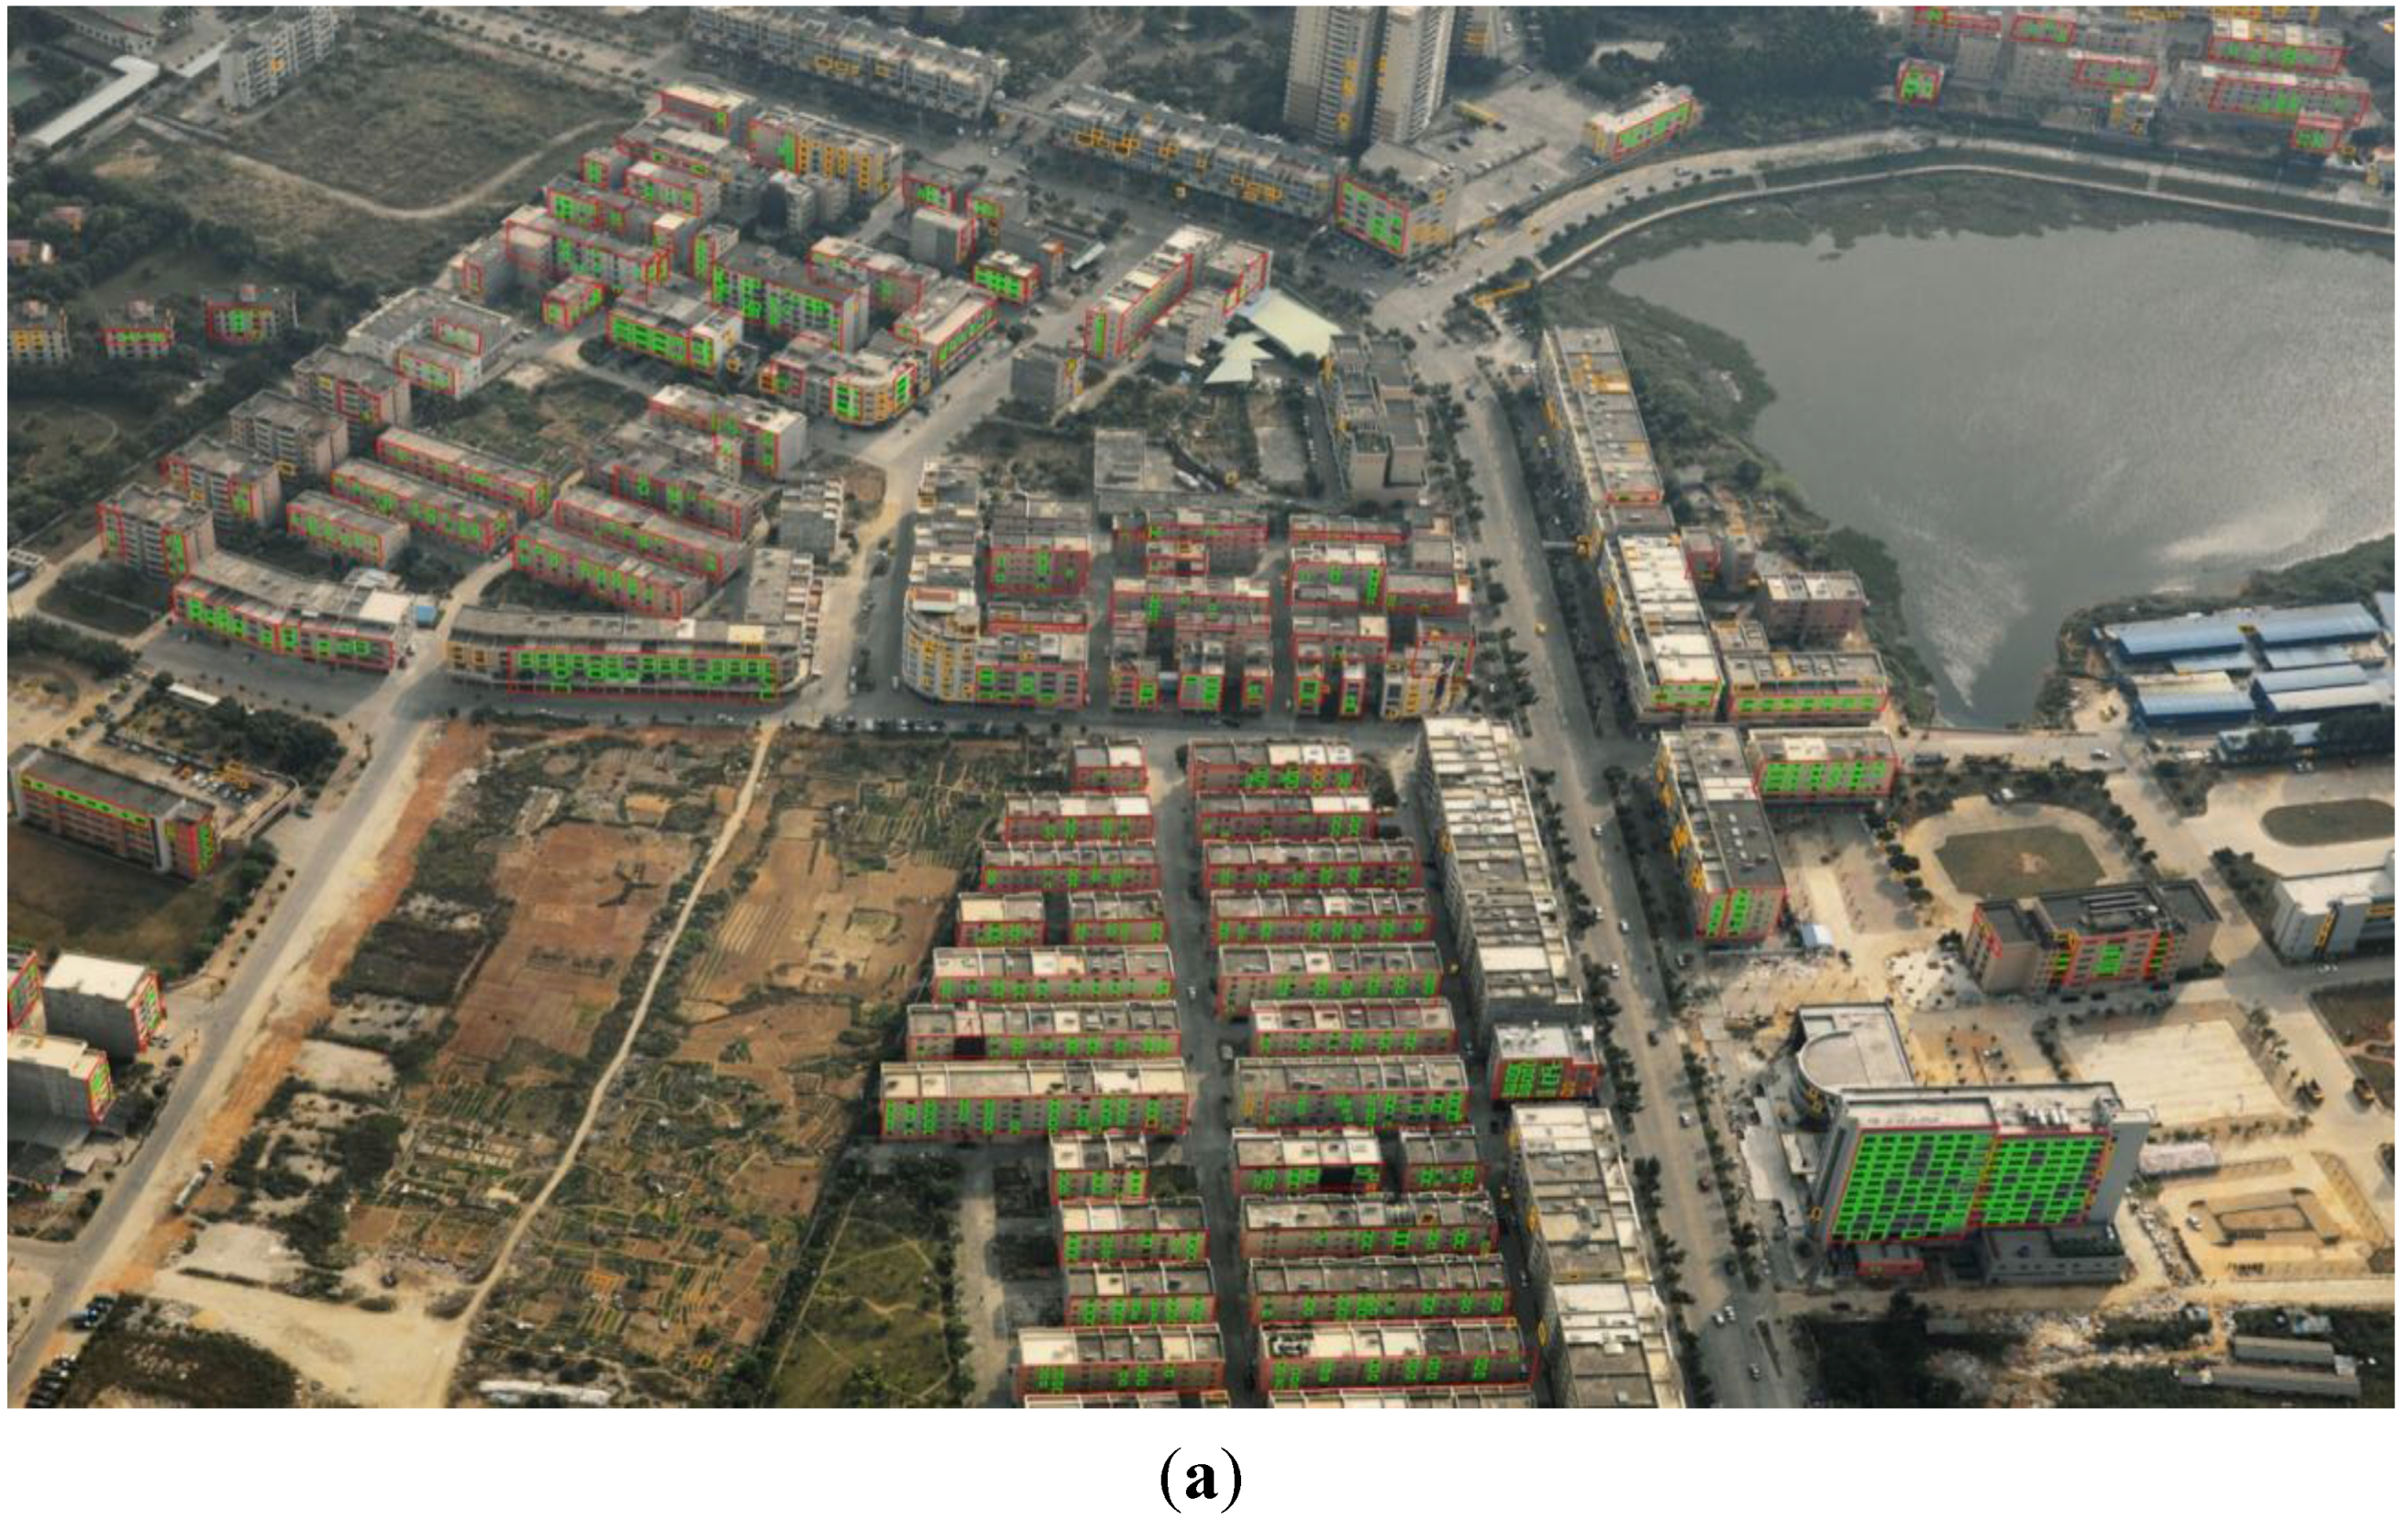
3. Experimental Results and Evaluation
3.1. Failure of Conventional Approach


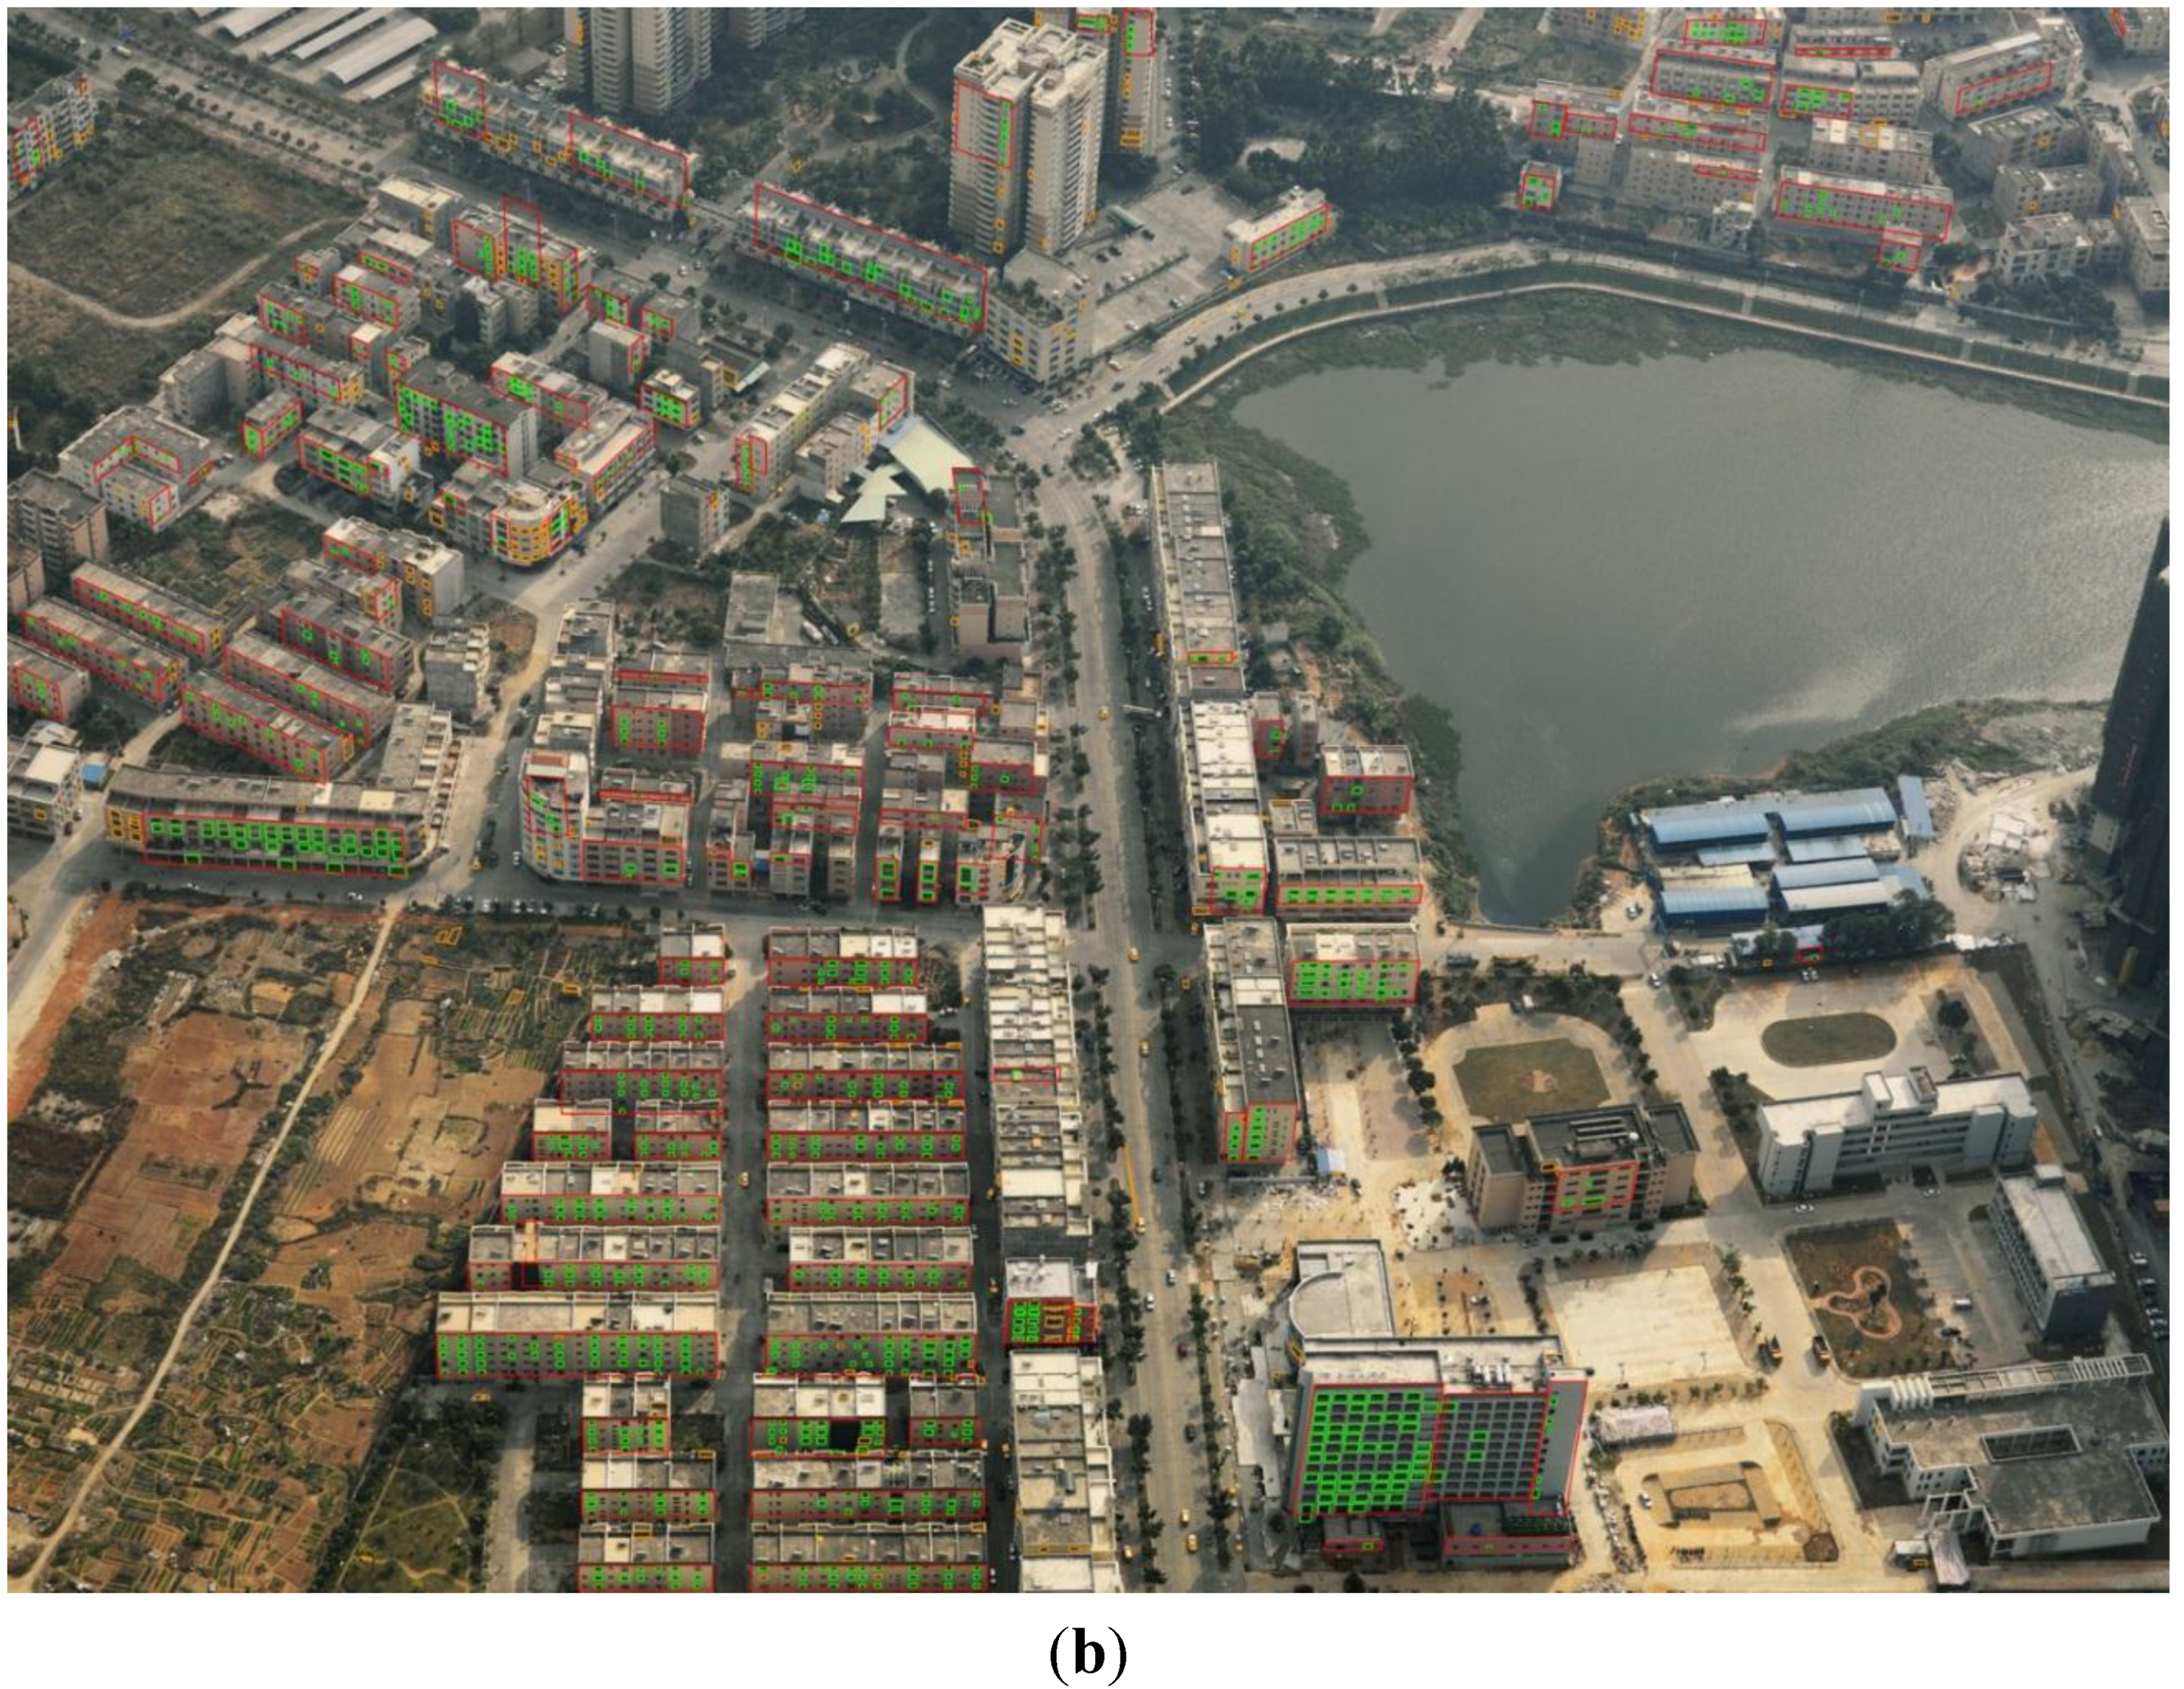
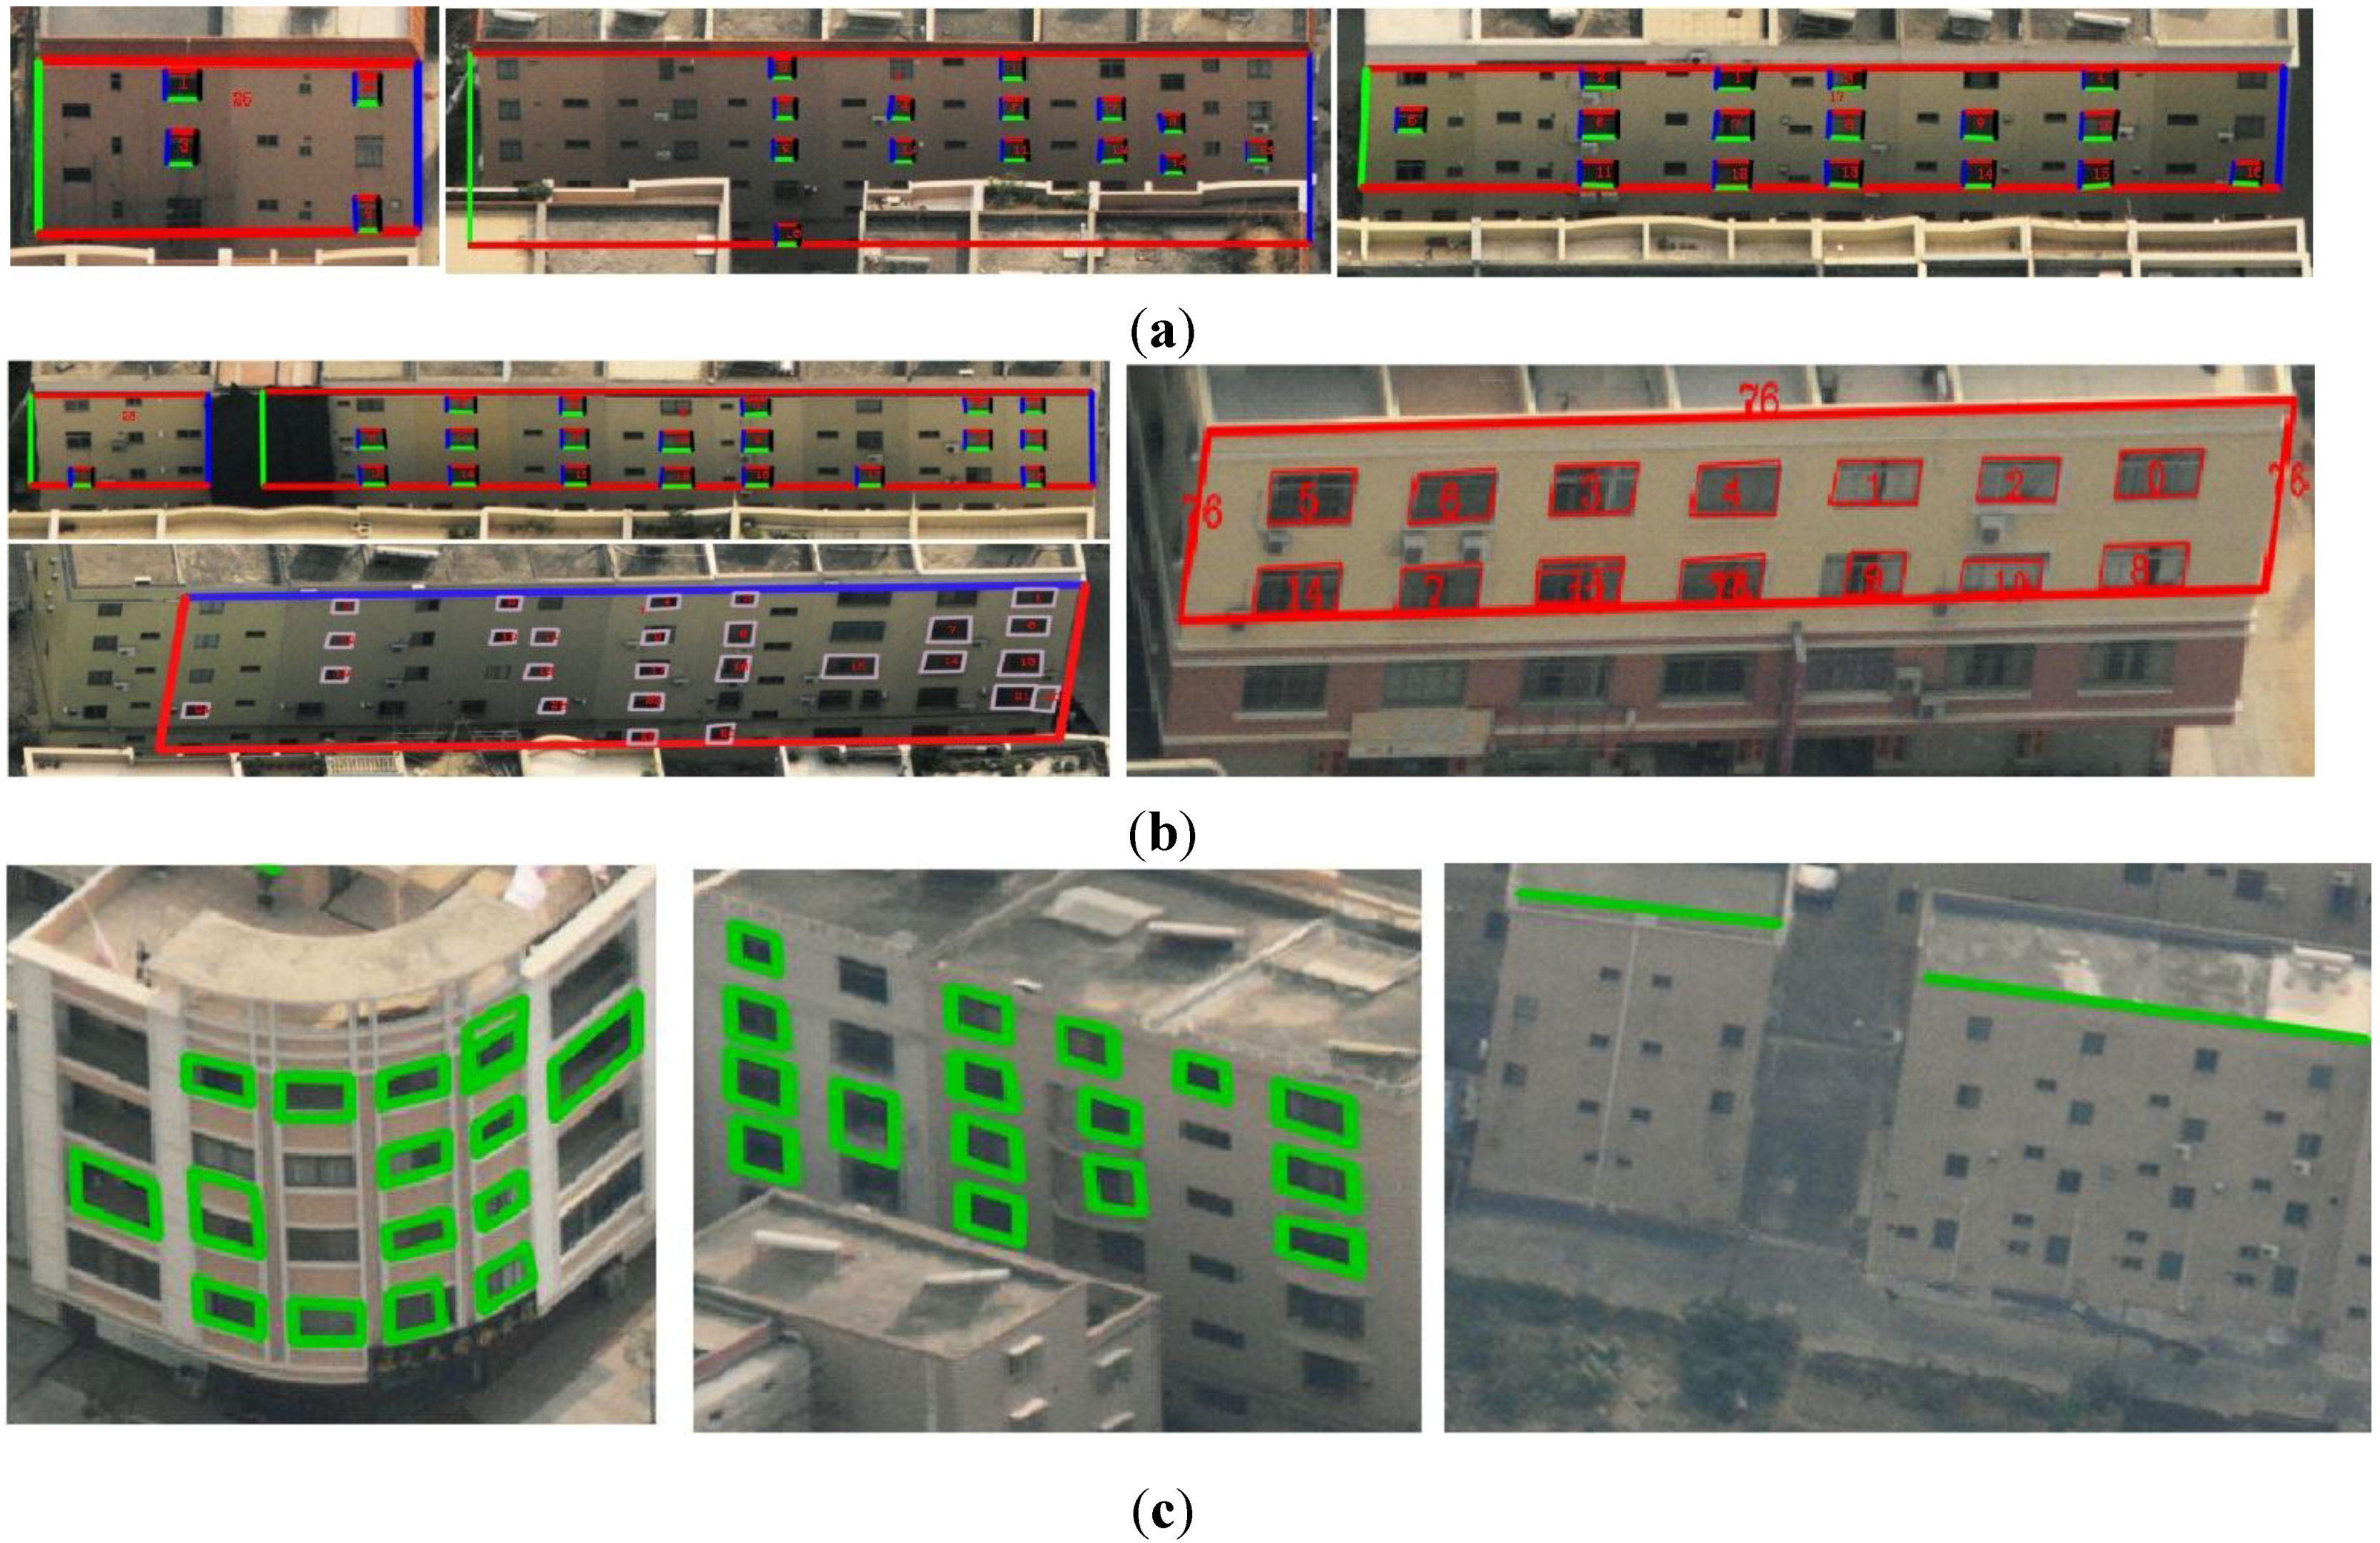
3.2. Evaluation of Regional-Feature Detection


| >50% | >25% | >0% | Failure (No) | |
|---|---|---|---|---|
| reference | 73/70 | 23/22 | 22/21 | 7/14 |
| target | 57/52 | 23/20 | 37/34 | 10/21 |
| Image | No. of TP | No. of FP | No. of FN | Precision | Recall | Overall Accuracy | F1-score |
|---|---|---|---|---|---|---|---|
| Reference | 112 | 3 | 15 | 97.3% | 88.2% | 86.2% | 92.5% |
| Search | 106 | 4 | 21 | 96.4% | 83.5% | 80.9% | 89.5% |
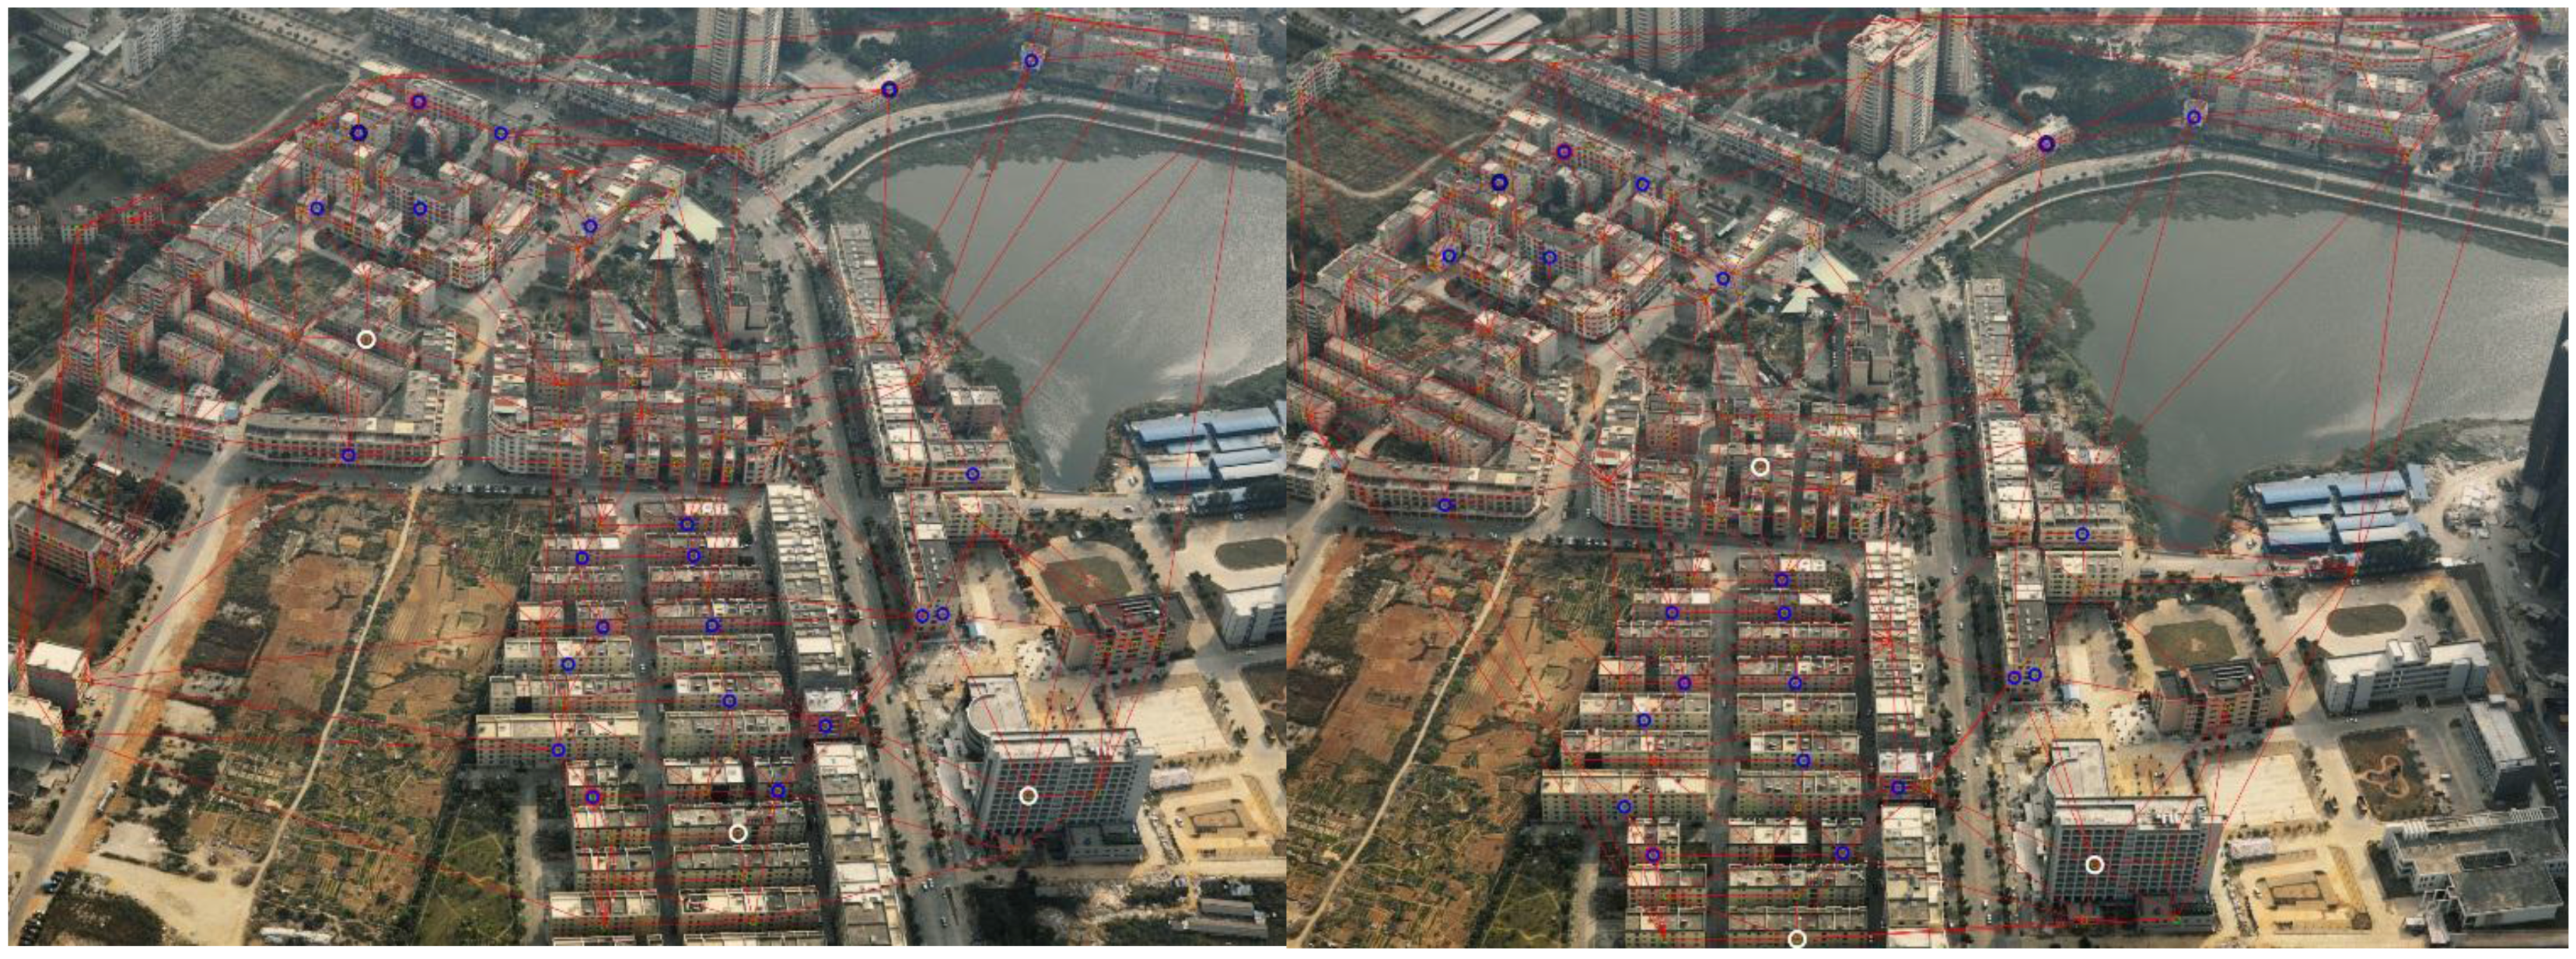
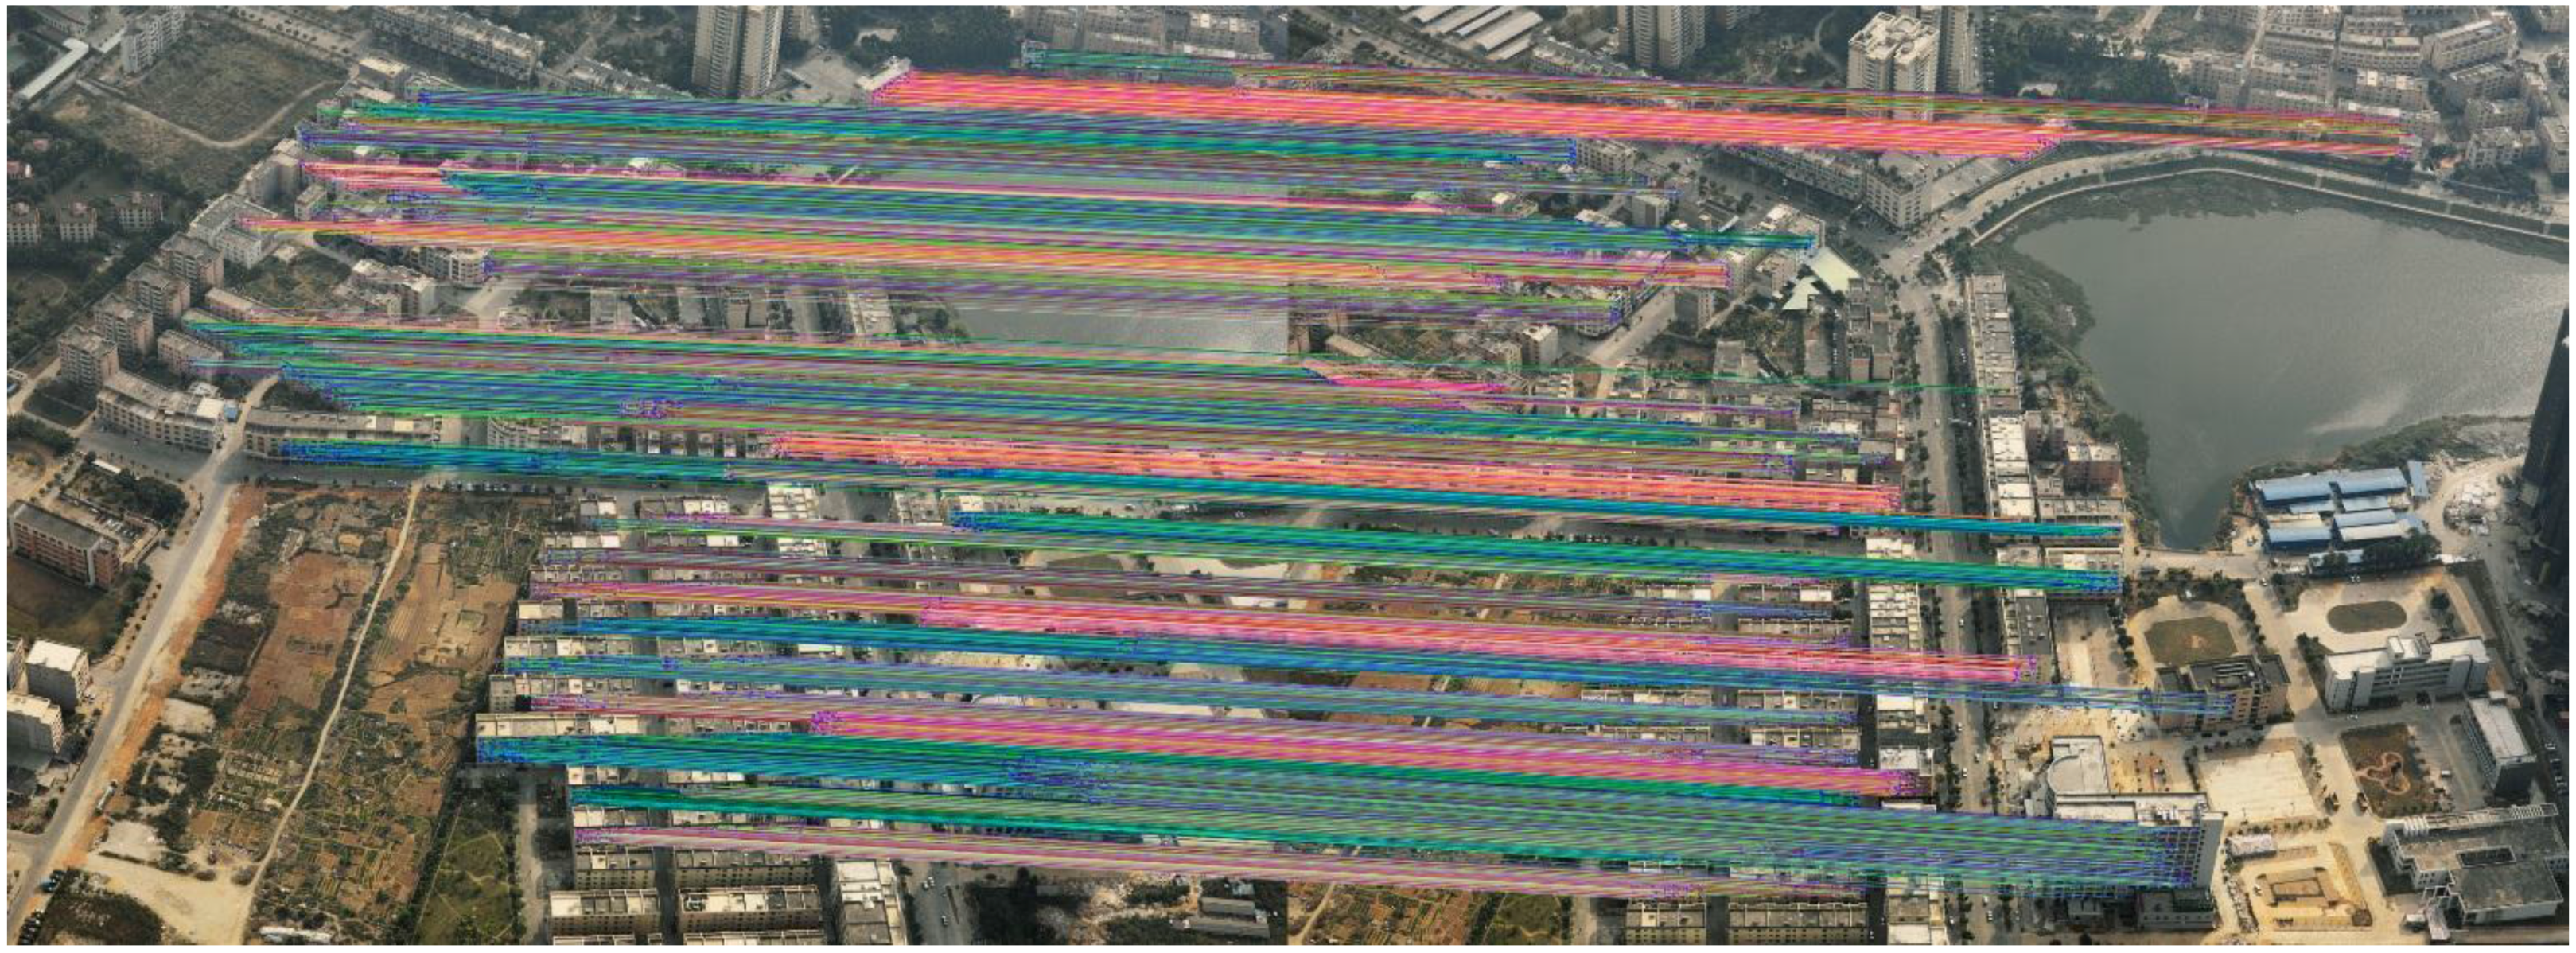
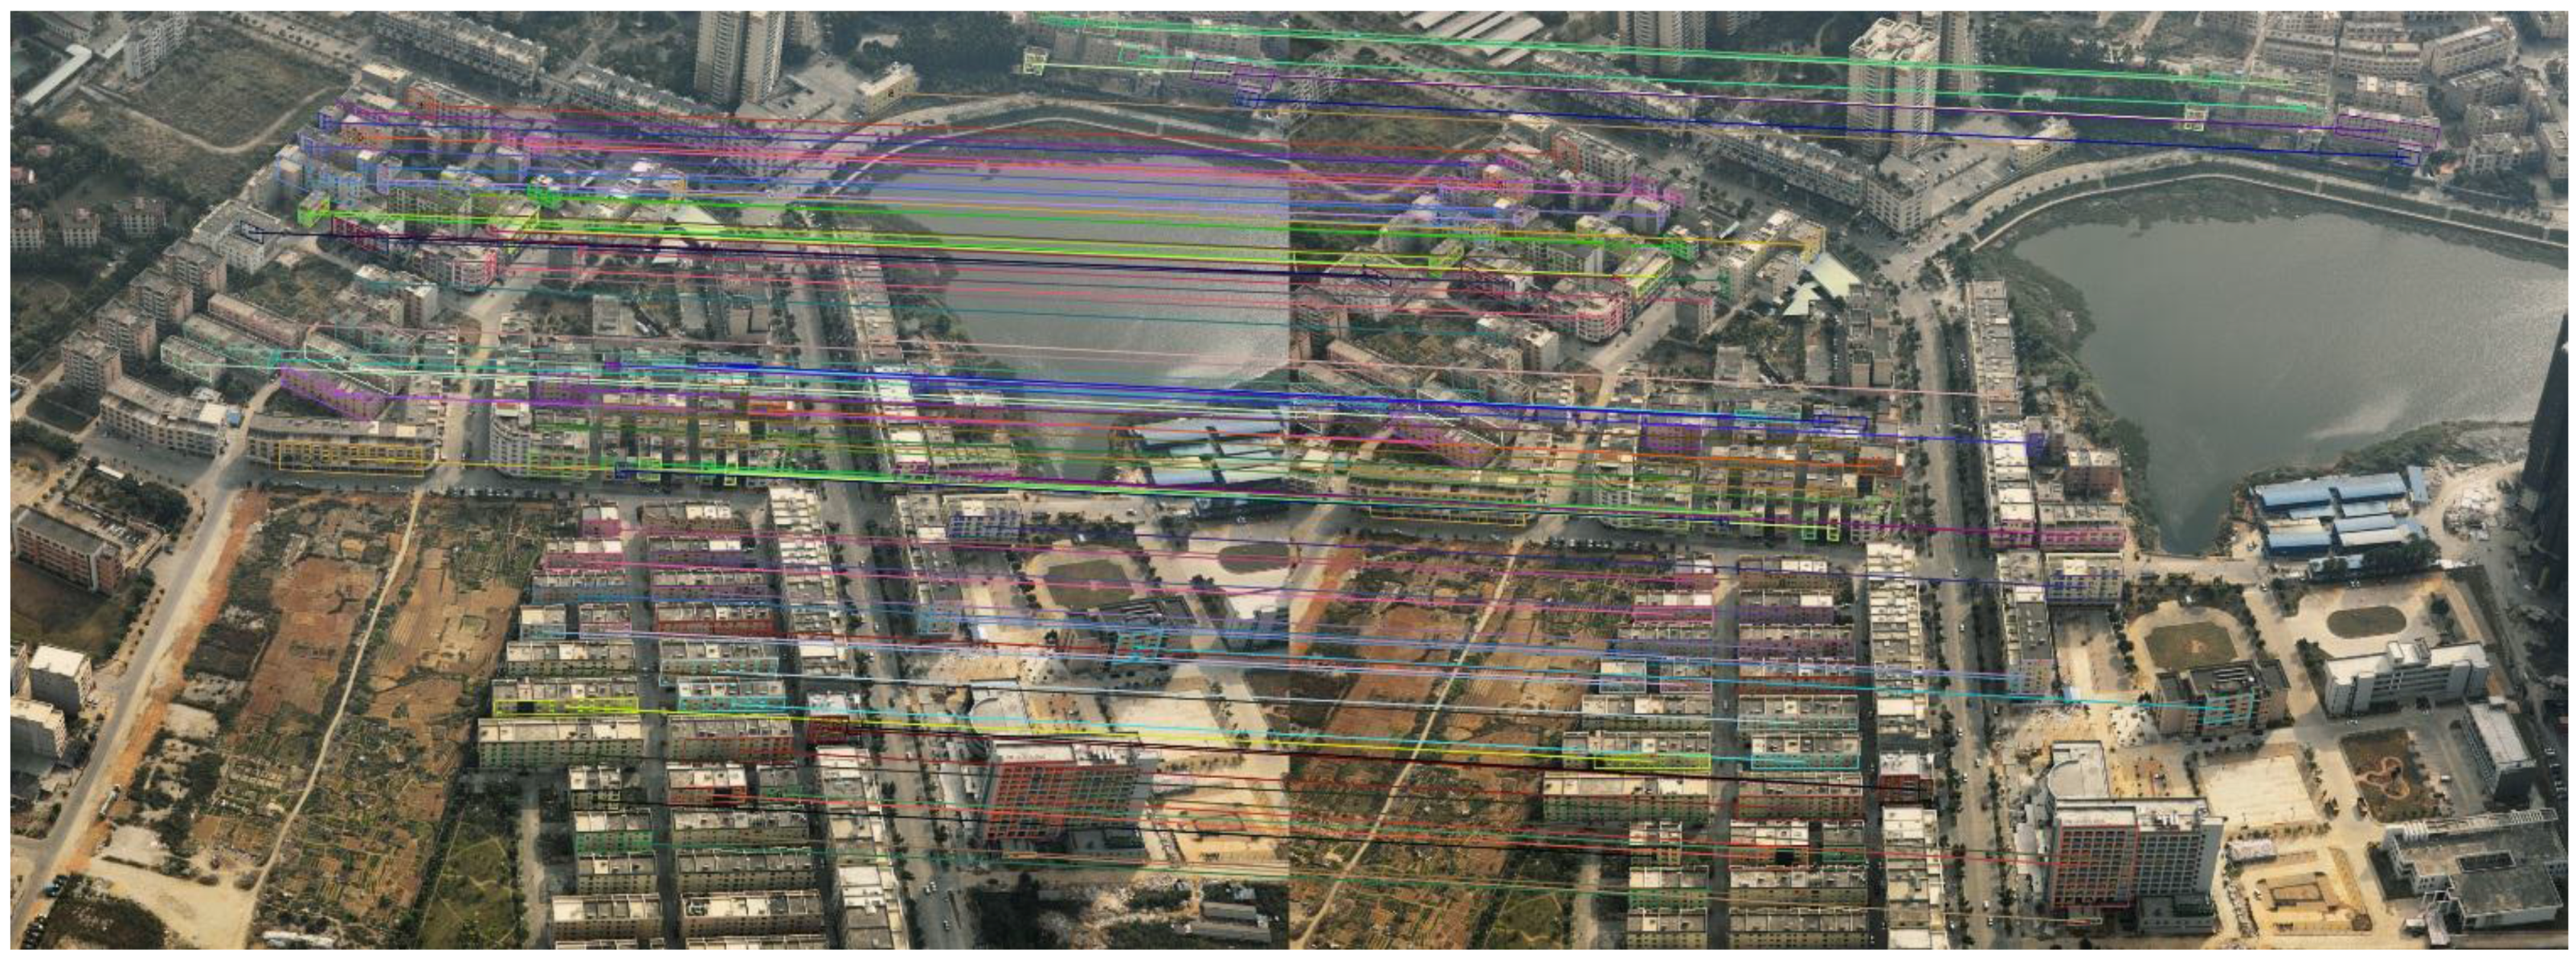
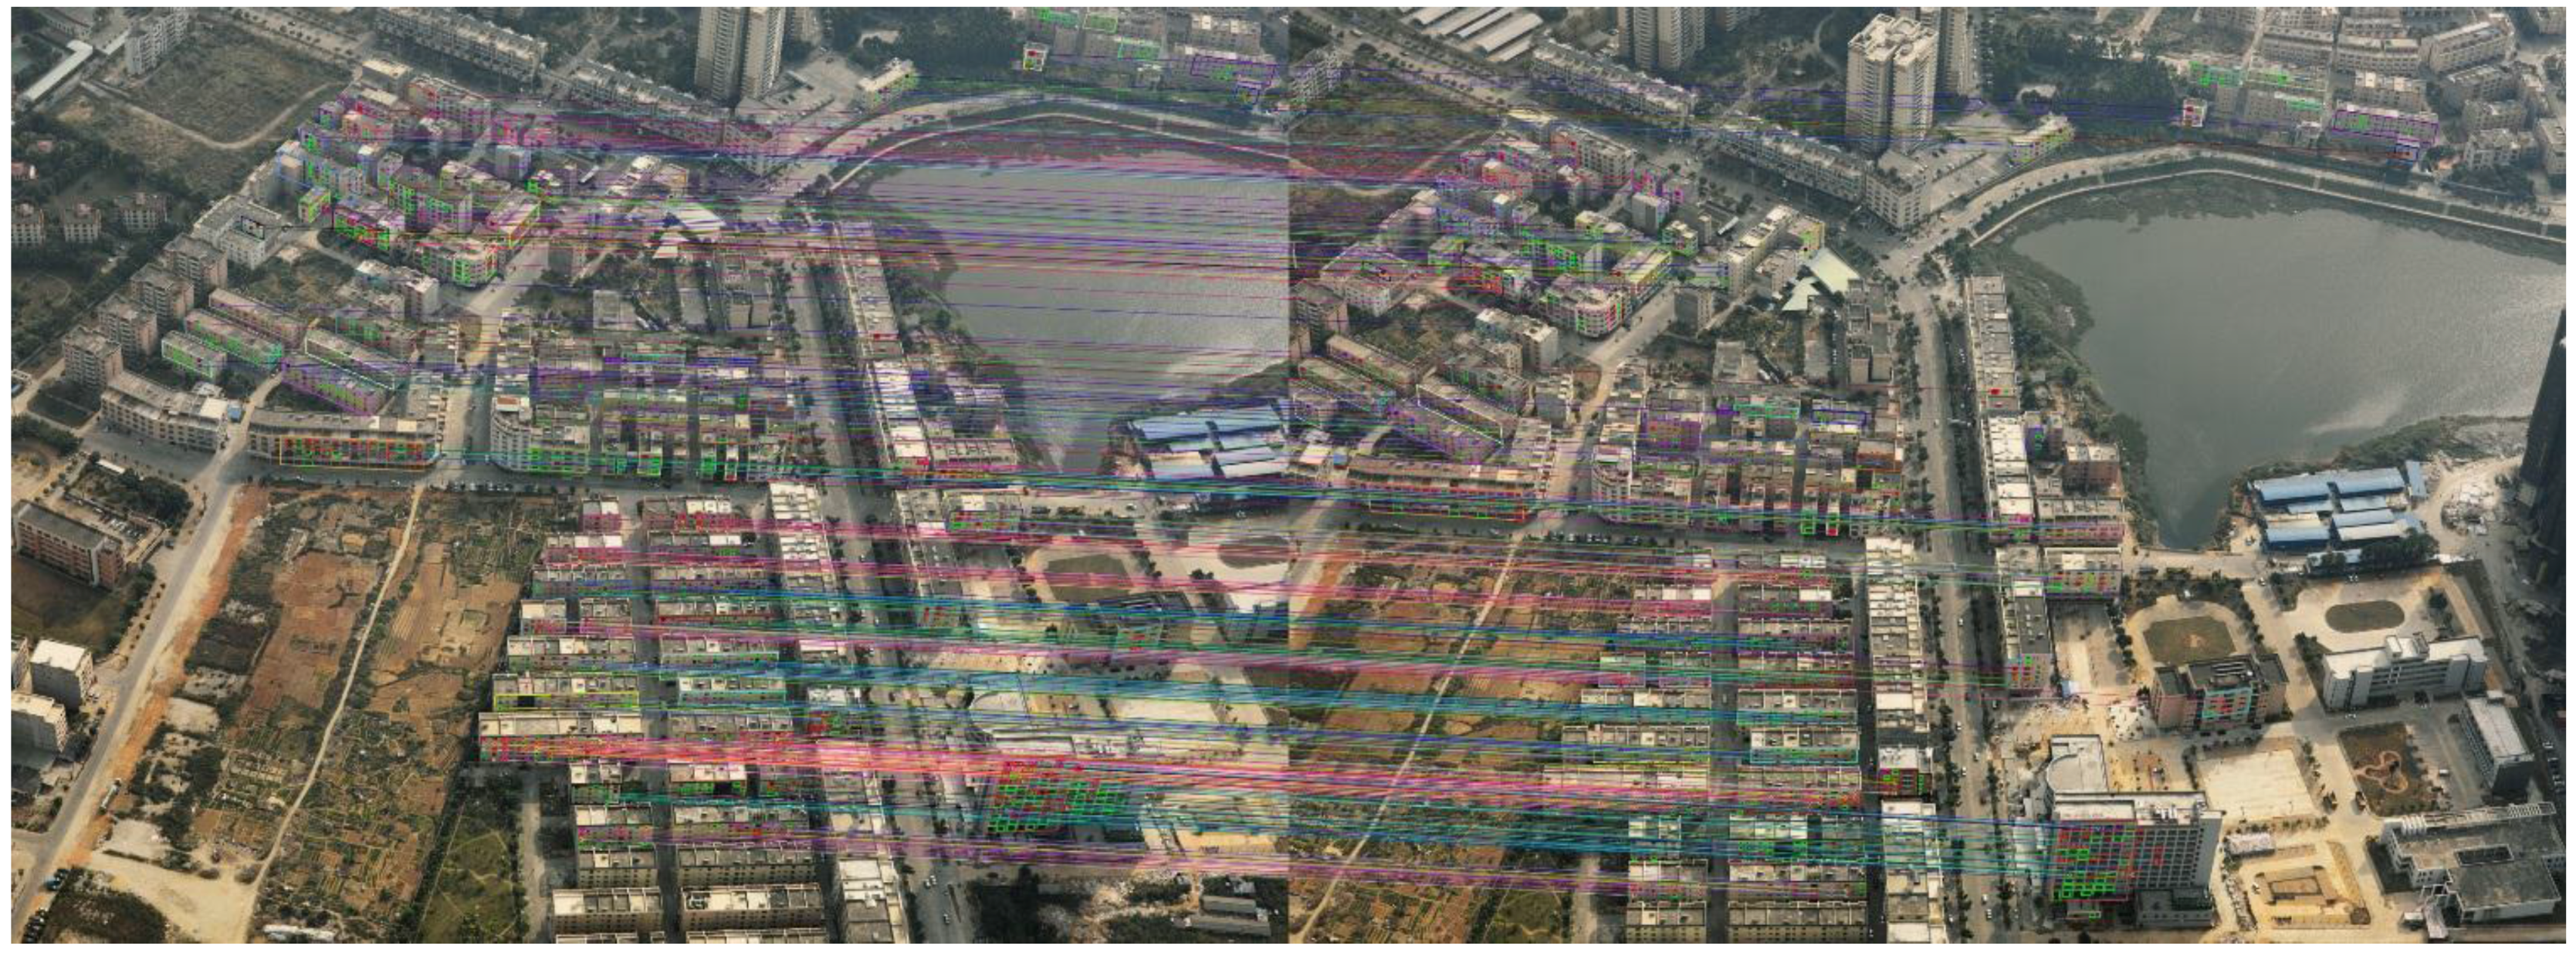
3.3. Evaluation of Feature Matching

| Correct Matches | Correct Non-Matches | Predicted Positive/Negative | ||
|---|---|---|---|---|
| Predicted matches | TP = 93 | FP = 0 | P’ = 93 | PPV = 100% |
| Predicted non-matches | FN = 3 | TN = 26 | N’ = 29 | |
| Actual positive/negative | P = 96 | N = 26 | Total = 122 | |
| TPR = 96.9% | FPR = 0 | ACC = 97.5% |
| Correct Matches | Correct Non-Matches | Predicted Positive/Negative | ||
|---|---|---|---|---|
| Predicted matches | TP = 431 | FP = 4 | P’ = 435 | PPV = 99.1% |
| Predicted non-matches | FN = 66 | TN = 536 | N’ = 602 | |
| Actual positive/negative | P = 497 | N = 540 | Total = 1037 | |
| TPR = 86.7% | FPR = 0.7% | ACC = 93.2% |

| <0.001(%) | <0.01(%) | <0.1(%) | <1(%) | <2(%) | ||
|---|---|---|---|---|---|---|
| X-corner | n | 59.5 | 32.7 | 7.8 | 0 | 0 |
| v | 61.2 | 26.9 | 11.9 | 0 | 0 | |
| Intersection | n | 8.3 | 20.4 | 23.1 | 38.8 | 9.4 |
| v | 10.3 | 15.2 | 28.0 | 27.1 | 20.4 | |
4. Conclusions
Acknowledgments
Author Contributions
Conflicts of Interest
References
- Kang, Z.; Zhang, L.; Zlatanova, S.; Li, J. An automatic mosaicking method for building façade texture mapping using a monocular close-range image sequence. ISPRS J. Photogramm. Remote Sens. 2010, 65, 282–293. [Google Scholar] [CrossRef]
- Truong-Hong, L.; Laefer, D.F. Octree-based, automatic building façade generation from LiDAR data. Comput.-Aided Des. 2014, 53, 46–61. [Google Scholar] [CrossRef]
- Jurisch, A.; Mountain, D. Evaluating the viability of Pictometry® imagery for creating models of the built environment. In Computational Science and Its Applications–ICCSA 2008; Springer Berlin Heidelberg: Berlin, Germany, 2008; pp. 663–677. [Google Scholar]
- Wang, Y.; Schultz, S.; Giuffrida, F. Pictometry’s proprietary airborne digital imaging system and its application in 3D city modelling. Int. Arch. Photogramm. Remote Sens. Spat. Inf. Sci. 2008, 37, 1065–1066. [Google Scholar]
- Frueh, C.; Sammon, R.; Zakhor, A. Automated texture mapping of 3D city models with oblique aerial imagery. In Proceedings of the 2nd International Symposium on 3D Data Processing, Visualization and Transmission, 2004 (3DPVT 2004), Thessaloniki, Greece, 9 September 2004; IEEE: Piscataway, NJ, USA, 2004; pp. 396–403. [Google Scholar]
- Grenzdörffer, G.J.; Guretzki, M.; Friedlander, I. Photogrammetric image acquisition and image analysis of oblique imagery. Photogramm. Rec. 2008, 23, 372–386. [Google Scholar] [CrossRef]
- Wang, M.; Bai, H.; Hu, F. Automatic texture acquisition for 3D model using oblique aerial images. In Proceedings of the First International Conference on Intelligent Networks and Intelligent Systems 2008 (ICINIS’08), Wuhan, China, 1–3 November 2008; pp. 495–498.
- Lin, C.; Nevatia, R. 3-D descriptions of buildings from an oblique view aerial image. In Proceedings of the International Symposium on Computer Vision 1995, Coral Gables, FL, USA, 21–23 November 1995; pp. 377–382.
- Xiao, J.; Gerke, M.; Vosselman, G. Building extraction from oblique airborne imagery based on robust façade detection. ISPRS J. Photogramm. Remote Sens. 2012, 68, 56–68. [Google Scholar] [CrossRef]
- Nyaruhuma, A.P.; Gerke, M.; Vosselman, G.; Mtalo, E.G. Verification of 2D building outlines using oblique airborne images. ISPRS J. Photogramm. Remote Sens. 2012, 71, 62–75. [Google Scholar] [CrossRef]
- Meixner, P.; Leberl, F. Characterizing building façades from vertical aerial images. Int. Arch. Photogramm. Remote Sens. Spat. Inf. Sci. 2010, 38, 98–103. [Google Scholar]
- Zebedin, L.; Klaus, A.; Gruber, B.; Karner, K. Façade reconstruction from aerial images by multi-view plane sweeping. In Proceedings of the ISPRS Commission III—Photogrammetric Computer Vision PCV ' 06, Bonn, Germany, 20–22 September 2006.
- Zhong, B.; Xu, D.; Yang, J. Vertical corner line detection on buildings in quasi-Manhattan world. In Proceedings of the 2013 20th IEEE International Conference on Image Processing (ICIP), Melbourne, VIC, Australia, 15–18 September 2013; pp. 3064–3068.
- Noronha, S.; Nevatia, R. Detection and modeling of buildings from multiple aerial images. IEEE Trans. Pattern Anal. Mach. Intell. 2001, 23, 501–518. [Google Scholar] [CrossRef]
- GEO-VISION. Available online: http://www.jx4.com/Products/cp/SWDC_5shuzihangkongqingxiesheyingyi/20140411/471.html (accessed on 12 August 2015).
- Akinlar, C.; Topal, C. EDLines: A real-time line segment detector with a false detection control. Pattern Recognit. Lett. 2011, 32, 1633–1642. [Google Scholar] [CrossRef]
- Zhang, Y.; Liu, Y.; Zou, Z. Comparative study of line extraction method based on repeatability. J. Comput. Inf. Syst. 2012, 8, 10097–10104. [Google Scholar]
- Izadi, M.; Saeedi, P. Three-dimensional polygonal building model estimation from single satellite images. IEEE Trans. Geosci. Remote Sens. 2012, 50, 2254–2272. [Google Scholar] [CrossRef]
- Schiele, B.; Crowley, J.L. Object recognition using multidimensional receptive field histograms. In Proceedings of the 4th European Conference on Computer Vision Cambridge, UK, 15–18 April 1996; Springer Berlin Heidelberg: Berlin, Germany, 1996; pp. 610–619. [Google Scholar]
- Shi, J.; Tomasi, C. Good features to track. In Proceedings of the 1994 IEEE Computer Society Conference on Computer Vision and Pattern Recognition 1994 (CVPR’94), Seattle, WA, USA, 21–23 June 1994; pp. 593–600.
- Lucchese, L.; Mitra, S.K. Using saddle points for subpixel feature detection in camera calibration targets. In Proceedings of the 2002 Asia-Pacific Conference on Circuits and Systems 2002 (APCCAS’02), Denpasar, Indonesia, 28–31 October 2002; IEEE: Piscataway, NJ, USA, 2002; Volume 2, pp. 191–195. [Google Scholar]
- Chen, D.; Zhang, G. A new sub-pixel detector for x-corners in camera calibration targets. In Proceedings of 13th International Conference in Central Europe on Computer Graphics, Visualization and Computer Vision, Plzen, Czech Republic, 31 January–4 February 2005.
- Sukup, J.; Meixner, P.; Sukup, K. Using PixoView technology—Testing measurement accuracy in oblique photography. GeoInformatics 2009, 12, 12–14. [Google Scholar]
- Fawcett, T. An introduction to ROC analysis. Pattern Recognit. Lett. 2006, 27, 861–874. [Google Scholar] [CrossRef]
- Ok, A.O. Automated detection of buildings from single VHR multispectral images using shadow information and graph cuts. ISPRS J. Photogramm. Remote Sens. 2013, 86, 21–40. [Google Scholar] [CrossRef]
- Szeliski, R. Computer Vision: Algorithms and Applications; Springer Science & Business Media: Berlin, Germany, 2010. [Google Scholar]
© 2015 by the authors; licensee MDPI, Basel, Switzerland. This article is an open access article distributed under the terms and conditions of the Creative Commons Attribution license (http://creativecommons.org/licenses/by/4.0/).
Share and Cite
Yang, X.; Qin, X.; Wang, J.; Wang, J.; Ye, X.; Qin, Q. Building Façade Recognition Using Oblique Aerial Images. Remote Sens. 2015, 7, 10562-10588. https://doi.org/10.3390/rs70810562
Yang X, Qin X, Wang J, Wang J, Ye X, Qin Q. Building Façade Recognition Using Oblique Aerial Images. Remote Sensing. 2015; 7(8):10562-10588. https://doi.org/10.3390/rs70810562
Chicago/Turabian StyleYang, Xiucheng, Xuebin Qin, Jun Wang, Jianhua Wang, Xin Ye, and Qiming Qin. 2015. "Building Façade Recognition Using Oblique Aerial Images" Remote Sensing 7, no. 8: 10562-10588. https://doi.org/10.3390/rs70810562