Article

Fourteen-Year Record (2000–2013) of the Spatial and Temporal Dynamics of Floating Algae Blooms in Lake Chaohu, Observed from Time Series of MODIS Images

1
State Key Laboratory of Lake Science and Environment, Nanjing Institute of Geography and Limnology, Chinese Academy of Sciences, Nanjing 210008, China
2
Dipartimento di Biotecnologie, Chimica e Farmacia, University of Siena, CSGI, Via Aldo Moro 2, Siena 53100, Italy
*
Author to whom correspondence should be addressed.
Remote Sens. 2015, 7(8), 10523-10542; https://doi.org/10.3390/rs70810523
Submission received: 19 May 2015 / Revised: 7 June 2015 / Accepted: 7 August 2015 / Published: 17 August 2015

Abstract

:
As the fifth largest freshwater lake in China, Lake Chaohu has drawn increasing attention due to the decline in water quality and the occurrence of massive algal blooms. We applied an algae pixel-growing algorithm to MODIS Terra or Aqua data (2100 images) to characterize surface floating algae bloom dynamics from 2000 to 2013 with respect to meteorological and lake nutrient conditions. The results show an increase in surface algal bloom coverage, frequency, and duration with a trend toward earlier bloom formation. Importantly, spatial and temporal patterns in the historically less compromised eastern and middle lake areas show that water quality conditions are deteriorating. This has occurred at the same time as lake management has made a catchment scale effort to reduce impact. Our results show that nutrient concentrations were not the main driver of inter-annual bloom variations. Local meteorological conditions, in particular wind speed and temperature, played an important role in the dynamics of floating algal bloom. This highlights the important challenges for lake management.

Graphical Abstract

1. Introduction

The eutrophication of freshwater water bodies has become a global environmental challenge [1,2]. Freshwater lakes provide fundamental ecological services, including water supply, fisheries, and flood mitigation [3,4]. Following three decades of rapid economic development, eutrophication has become the most important water quality problem in China. A recent investigation in 2013 from the China State Environmental Protection Agency (SEPA) indicated that 57.4% of lakes surveyed were eutrophic, with an additional 27.8% in a hypereutrophic state. Of the six largest freshwater lakes in China, all but Lake Poyang and Lake Dongting were identified as eutrophic [5]. In these four lakes, massive algal blooms have limited the availability of fresh water to the surrounding population [6,7,8].
Lake Chaohu, the fifth largest freshwater lake in China, with a surface area of 760 km2 and an average water depth of 3 m, was a major potable water source for Hefei City with its population of 7.6 million (Figure 1a) [9]. In the 1980s, cyanobacterial blooms occurred throughout the lake from May to November each year [10]. The cyanobacteria were up to 98.8% of total phytoplankton biomass in 1984 [11], 94.4% in 1987–1988 [10], 88.7% in 2002–2003 [12,13], 99.4% in 2011–2012 [14], and 99.3% in 2012–2013 (authors’ unpublished data). As a result of increasing eutrophication and the reoccurrence of cyanobacteria-dominated blooms, the water supply for Hefei City was changed to Dongpu Reservoir in 2007 [9]. In recent years, effluents were diverted and nutrient loads reduced, and numerous dams/sluice gates and water transfer projects were built for flood control, navigation, irrigation, and drinking water. To reduce the risk of floating algae blooms, a water transfer project was initiated in 2012 to divert 300 m3/s water from Yangtze River to Lake Chaohu, shortening residence time in the lake and reducing nutrient concentrations [15,16]. In fact, the construction of the sluice gate in 1962 at the outlet of Lake Chaohu, and the related increase in residence time, has been identified as one of the potential causes of the increased eutrophication [17].
Satellite remote sensing provides rapid, synoptic, and regular information on important lake characteristics (physical and biogeochemical). Over the past two decades, advances in sensor technology and algorithm development have led to the use of remote sensing to monitor algal blooms in traditionally challenging ecosystems such as coastal seas and lakes, where variable optically conditions are present [18,19,20,21,22,23,24]. The normalized difference vegetation index (NDVI), the enhanced vegetation index (EVI), and the floating algae index (FAI) have been shown to provide good estimates of floating algal blooms coverage [25]. However, it has been found that NDVI and EVI are particularly sensitive to aerosol characteristics (type and thickness), sun glint, and solar viewing geometry with respect to FAI. The latter has been found to be relative stable under different environmental and observational conditions [22], in particular with respect to atmospheric turbidity. According to recent research [26,27], FAI derived from Moderate Resolution Imaging Spectroradiometer (MODIS) measurements can provide not only the real-time but also long-term historical information about surface algal blooms. MODIS has global coverage twice per day with medium resolution, which can be used to identify sub-pixel information, particularly important for accurate identification of surface bloom coverage and temporal dynamics [25].
The campaign to reduce eutrophication in Lake Chaohu would benefit from a better understanding of the long-term dynamics of algal blooms and their underlying mechanisms. The present study was undertaken to (1) identify and analyze the spatial and temporal trends in surface algal blooms at multiple temporal dimensions and (2) explore the underlying mechanisms influencing algal blooms in Lake Chaohu with respect to nutrients and meteorological conditions.
Figure 1. (a) Lake Chaohu, China, (source: 1:250,000 basic geographic information data provided by the National Administration of Surveying, Mapping, and Geo-information of China) and the three lake segments, West Lake (WL), Central Lake (CL), and East Lake (EL). The red areas represent major cities. (b) Sampling sites of measurements made in 2008, 2012, and 2013 in Lake Chaohu.
Remotesensing 07 10523 g001

2. Methods

2.1. MODIS Data Acquisition and Processing

A total of 2100 MODIS images covering the years 2000–2013 were obtained for Lake Chaohu from the NASA EOS Data Gateway (EDG). Data were georeferenced to UTM projection with an error of less than 0.5 pixel. The 500 m resolution data at 1240 nm were resampled to 250 m resolution (to match the resolution at 645 nm).

2.2. FAI Algorithm

MODIS data were converted to Rayleigh-corrected reflectance (Rrc) by removing the molecular (Rayleigh) scattering effects [28]. The Floating Algal Index (FAI) was used as [22]:
F A I M O D I S = R r c ( 859 ) R r c ( 859 ) with   R r c ( 859 ) = R r c ( 645 ) + [ R r c ( 1240 ) R r c ( 645 ) ] · ( 859 645 ) / ( 1240 645 )

2.3. Floating Algal Bloom Coverage Algorithm

Floating algal bloom coverage for each pixel was achieved using an algae pixel-growing algorithm (APA) that expresses the FAI of the central pixel of a 3 × 3 pixel window as a linear composition of the maximum and minimum FAI in the window [25]:
F A I M O D I S p i x e l = γ · F A I M O D I S ( M a x p i x e l ) + ( 1 γ ) · F A I M O D I S ( M i n p i x e l )
where γ is the decomposition parameter of the 3 × 3 pixel window.
We defined the algae coverage as the proportion of floating algae in each pixel. Considering that the thickness of floating algae is variable, the assumption is made that mixed pixels are covered by the thinnest floating algae. The relationship of FAI and coverage of a mixed pixel can be expressed as
F A I = α · F A I a l g a e + ( 1 α ) · F A I n o n a l g a e = ( F A I a l g a e F A I n o n a l g a e ) · α + F A I n o n a l g a e
where α is the coverage of the thinnest floating algae (FAI=FAIalgae) in a mixed pixel, and FAIalgae and FAInon-algae are the thresholds of floating algae and non-algae, respectively. Consequently, FAI has a linear relationship with floating algae coverage for mixed pixels. The FAI of a max pixel and a min pixel in a 3 × 3 pixel window could be expressed as
F A I M O D I S = m · α + k
where m and k are the slope and intercept, respectively. Combining Equations (3) and (4), the coverage of the mixed pixel is described as
α M O D I S p i x e l = γ · α M a x + ( 1 γ ) · α M i n
where αMax and αMin are the maximum and minimum algal bloom coverage in a 3 × 3 pixel window, and αMODISpixel is the basic data on algal bloom coverage for subsequent analysis. If αMODISpixel is not zero, then the algal bloom area of the pixel is 0.25 × 0.25 × αMODISpixel. For the whole lake, the algal bloom area is calculated by 0.25 × 0.25 × i α M O D I S p i x e l i .

2.4. Analysis

It should be noted that algal blooms were defined in the present study as the rapid increase and accumulation of algal biomass on the lake surface, with no intention of estimating total phytoplankton biomass in the water column. From the 14-year dataset, three variables were determined regarding the dynamics of the floating algae: bloom initiation, annual duration, and frequency. The annual cycle was examined from the first of February to the end of January of the following year, based on annual meteorological cycles and previous experience. Bloom initiation for each pixel was considered as the first non-zero APA value after February 1, and bloom duration was defined as the number of days from the initial date to the last date before January 31 of the following year. A significant lake-wide algal bloom was defined as when 25% of the lake area contained non-zero αMODISpixel values.
The bloom frequency for every pixel is defined as Equation (6):
F i , j = C i , j T C j
where Fi,j is the relative frequency of bloom occurrence in the ith pixel during time j; Ci,j is the count of bloom occurrence in same pixel; and TCj is the total count of MODIS images.
To avoid cloud-induced bias, bloom coverage of individual lake sections was considered only when containing at least 75% cloud-free pixels. To avoid the impact of meteorological conditions on algal bloom detection (wind, ice), daily information on wind speed, water temperature, and surface ice was obtained. As wind speed greater than 4 m/s has been used as a threshold for determining the vertical distribution of algal blooms, datasets where the synchronous average wind speed were greater than 4.0 m/s were not used [29,30,31]. Water column temperatures below 5 °C inhibit cyanobacteria renewal [32] and floating ice negatively influences the accuracy of FAI and APA algorithm performance [25,27]. Thus, datasets with an average temperature below 0 °C images were not utilized.

2.5. In Situ Data Acquisition

Annual mean concentrations of total nitrogen and total phosphorus were derived from existing literature [7,33,34,35,36,37]. The monthly mean TN and TP in 2008 were obtained from Jia [7]. Monthly measurements of surface water (<0.5 m) in 2012 and 2013 were made across Lake Chaohu (Figure 1b). TP and TN concentrations were determined using combined persulfate digestion [38], followed by spectrophotometric analysis for soluble reactive phosphorus and nitrate. TN and TP recovery efficiencies were 98.4% and 99.7%, respectively. The data of nutrient loadings and socioeconomic parameters (2000–2010), including population, Gross Domestic Product (GDP), and total waste, were obtained from the Anhui Province Statistics Bureau. Meteorological data, including temperature (T), sunshine hours (S), wind speed (W), and precipitation (P), were obtained from meteorological station #58321 of the China Meteorological Administration (Figure 1a), which is the nearest national station to Lake Chaohu. All meteorological data were calculated as the difference between their daily average in the given year and a standard value (the mean of the daily average of each variable from 2000 to 2013); these variables are represented as ΔTmean, ΔTmax , ΔTmin, ΔW, ΔP, and ΔS, respectively [39].

3. Results

3.1. Time Series of Floating Algal Blooms

The accumulation of sub-pixel floating algal bloom area (a pixel area multiplied by its algal bloom coverage) was used to estimate floating algal bloom-covered area. The daily variation of bloom area in each lake section of Lake Chaohu was highly variable over the 14-year period (Figure 2). Because of the variability of daily bloom area and its sensitivity to daily variations in wind speed, the monthly maxima were used to analyze bloom area dynamics [26]. The monthly maximum bloom area demonstrated a clear increase in bloom area over the study period, especially for the central lake and east lake sections. Furthermore, a shift in bloom area occurred in 2005, making two distinct periods, 2000–2004 and 2006–2013. Between 2000 and 2005, there was an increasing trend in the yearly maxima in the central lake section, while the west lake section had the highest coverage and the highest yearly maxima in all years except 2005.

3.2. Floating Algal Bloom Frequency

The frequency of significant blooms increased from 6.6% of the total images for the year with average bloom area of 69.3 km2 in 2000 to 32.1% with 158.9 km2 in 2007 (Table 1 and Table 2). After 2007, the frequency of significant blooms was stable around 20%, but the average bloom area reached 212.8 km2 in 2012 (Table 2). Individual lake sections showed clear differences, with the west lake section showing the highest number of days with significant bloom coverage throughout the study period with a maximum coverage near the north shore, near the lower reaches of Nanfei River. The east lake section showed an increase in bloom area throughout the study period. Most blooms occurred in the summer and fall. In 2007, blooms persisted in the west section of the lake throughout most of the year (328 days).
Figure 2. Daily area coverage of floating algae blooms for each lake segment and for the whole of Lake Chaohu. The solid circles represent the monthly maxima in floating algae blooms.
Remotesensing 07 10523 g002
Table 1. Frequency of significant floating algae blooms in each lake segment of Lake Chaohu *.
YearEast LakeMiddle LakeWest LakeLake Chaohu
Number of ImagesPercent of ImagesNumber of ImagesPercent of ImagesNumber of ImagesPercent of ImagesNumber of ImagesPercent of Images
200021.675.74839.386.6
20011610.21710.84830.62214.0
2002169.82314.03521.32515.2
2003159.82315.04730.72214.4
2004179.3179.35731.12413.1
20051911.72213.55835.63018.4
20062214.21912.36240.02918.7
20072717.04427.78754.75132.1
20083620.93822.17342.44827.9
20092718.52919.96242.53926.7
20101911.72817.24930.13622.1
20113119.33219.94729.23622.4
20123319.92816.97042.24124.7
20132314.12112.95634.42917.8
* The values shown represent the number and percentage of images where significant algae blooms were found from the cyanobacteria coverage imagery using Algae Pixel algorithm (APA) imagery. “Significant” was defined as when the bloom pixel area (floating algae coverage ≥ 0) exceeded 25% of the total surface area of the lake segment.
Table 2. Mean and standard deviation of monthly maxima of floating algae bloom area in each lake segment of Lake Chaohu *.
YearEast LakeMiddle LakeWest LakeLake Chaohu
MeanStandard DeviationMeanStandard DeviationMeanStandard DeviationMeanStandard Deviation
200011.2511.0220.9223.0358.4442.4269.3055.46
200127.8823.6927.6627.4067.2964.28103.6476.64
200218.4522.4320.7322.9951.5862.5073.1478.62
200329.6036.8429.0739.6370.0064.72107.56101.96
200430.0425.4739.6248.2187.6656.50126.5590.90
200551.7064.1652.1965.1482.0056.50168.34163.07
200637.7132.5036.1629.6982.5655.39139.2698.85
200749.9337.1645.0527.1889.0348.82158.9094.53
200858.7148.9542.4322.4998.7159.91166.9392.93
200943.6632.7530.9727.8472.7561.28130.0292.19
201038.4545.0835.0835.5669.0864.97114.2197.05
201168.4863.2454.0445.7875.8166.23181.07163.12
201273.5057.3560.4632.3496.0574.50212.77135.83
201341.6337.0847.0145.3969.8956.18148.55111.42
* This is based on the assumption that the monthly maxima (solid circles in Figure 2) can represent the monthly bloom conditions after interference from the wind mixing is removed. The average of the monthly maxima is the annual mean of bloom covering area. For reference, the size (total area) of each lake segment is given. Annual coverage and standard deviation are given in km2.
To examine changes in coverage, coverage frequency was defined as the ratio of the days where coverage was elevated and the total days where MODIS images were available for the year (Figure 3). Heavy blooms (bloom area >80 km2) occurred very frequently in 2007, 2008, and 2012. Moderate bloom coverage (20–80 km2) was frequent throughout the study period. Low bloom coverage (<20 km2) was most frequent except in 2007 and 2008.
Figure 3. The percentage of days with different algal bloom areas in Lake Chaohu from 2000 to 2013, 80 km2 and 20 km2 lake algal bloom coverage, equivalent to 10% and 2.5% of the total area of Lake Chaohu, respectively.
Remotesensing 07 10523 g003
Table 3. Timing in Julian days and duration of significant floating algae blooms in each lake segment of Lake Chaohu *.
YearEast LakeMiddle LakeWest LakeLake Chaohu
Initiation DayDurationInitiation DayDurationInitiation DayDurationInitiation DayDuration
2000106155106173106176106165
20011311259516161295115279
200215111815024576193102145
2003155111140126105291145130
200411523611523669282119232
2005692601171476726769234
200665332653326533265301
200754319453284532845328
200885216852346129598212
200968242692356830768242
2010130257533345330953230
201170276992927028870261
201270264702745727770274
201310125810125866293101258
* The values shown represent the starting days (1–366) and durations (in days) of significant algae bloom. “Significant” was defined as when the bloom algae area (floating algae coverage≥ 0) exceeded 25% of the total surface area of the lake segment. Duration was defined as the difference between the last and first days when significant bloom occurred.

3.3. Floating Bloom Initiation and Duration

Initial bloom date was later in the east and central lake sections from 2000 to 2003 (Table 3), beginning an average of 12 days later each year. After 2003, initiation occurred earlier each year until 2013, excluding 2010 in the east and 2005 and 2013 in the middle lake section (Figure 4a). In most years, the first blooms were observed in the north area of west lake section, while the center of East Lake was usually last. In 2007, initiation occurred in a similar period throughout the lake and on the earliest date for each section.
Bloom duration was defined as the difference between the first and last day that surface blooms were observed (Table 3 and Figure 4b). The west lake had the longest bloom duration and the center had the least. For the whole lake, 2007 had the longest duration, as more than 3/4 of the entire lake was covered with blooms for more than 10 months. Persistent blooms were also found in the west lake section in 2012 and 2013.
Figure 4. (a) Initial date of floating algae blooms in Lake Chaohu = Julian day when the bloom algae area exceeded 25% of the total surface area of the lake. (b) Duration of floating algae blooms in Lake Chaohu, defined as the difference between the last day and the initial day when blooms were identified (coverage > 0) using the algal bloom pixel growing algorithm (APA) and MODIS data.
Remotesensing 07 10523 g004

3.4. Bloom Frequency

The west lake section experienced more frequent blooms than the other two sections (middle and east) (Figure 5). Figure 2 indicates that 2007 was the worst year, which is quite similar to Lake Taihu [26,39]. For the west lake section, the blooms fluctuated after 2007. The northern area close to the mouth of Nanfei River was the location of the first floating algae blooms (Figure 6). After April, the blooms expanded to the center of the west section. The most extensive bloom coverage occurred in August and September, after which the blooms receded to the northern area of the west lake section. The elevated algal bloom coverage in the west section is consistent with the results of the distribution of pigments and nutrients [13,14]. The western region of Lake Chaohu is near the city of Hefei, which is the capital of Anhui Province, where elevated population and industry activities are present. A large number of pollutants (particularly nitrogen and phosphorus) are discharged into Lake Chaohu by the Nanfei River, Shiwuli River, Tangxi River, and Pai River, resulting in significantly higher nutrient concentrations in the west section compared to the middle and east section of the lake. This nutrient pattern is the primary reason for obvious decreasing trends from the western to eastern regions for the annual average bloom coverage.
Figure 5. (a) Annual surface bloom frequency of Lake Chaohu from 2000 to 2013. (b) Annual average frequency of floating algae blooms in each lake segment of Lake Chaohu, including West Lake (WL), Central Lake (CL), and East Lake (EL), when algal bloom coverage > 0, using the algal bloom pixel growing algorithm (APA) and MODIS images.
Remotesensing 07 10523 g005
Figure 6. (a) Monthly surface bloom frequency of Lake Chaohu. (b) Monthly average frequency of floating algae blooms in each lake segment of Lake Chaohu, including West Lake (WL), Central Lake (CL), and East Lake (EL), when algal bloom coverage > 0, using the algal bloom pixel growing algorithm (APA) and MODIS images.
Remotesensing 07 10523 g006

4. Discussion

4.1. Environmental Drivers of Inter-Annual Surface Bloom Dynamics

General increases in phytoplankton biomass, as well as increases in the frequency and duration of algal blooms, have been associated with an overall increase in nutrient inputs [
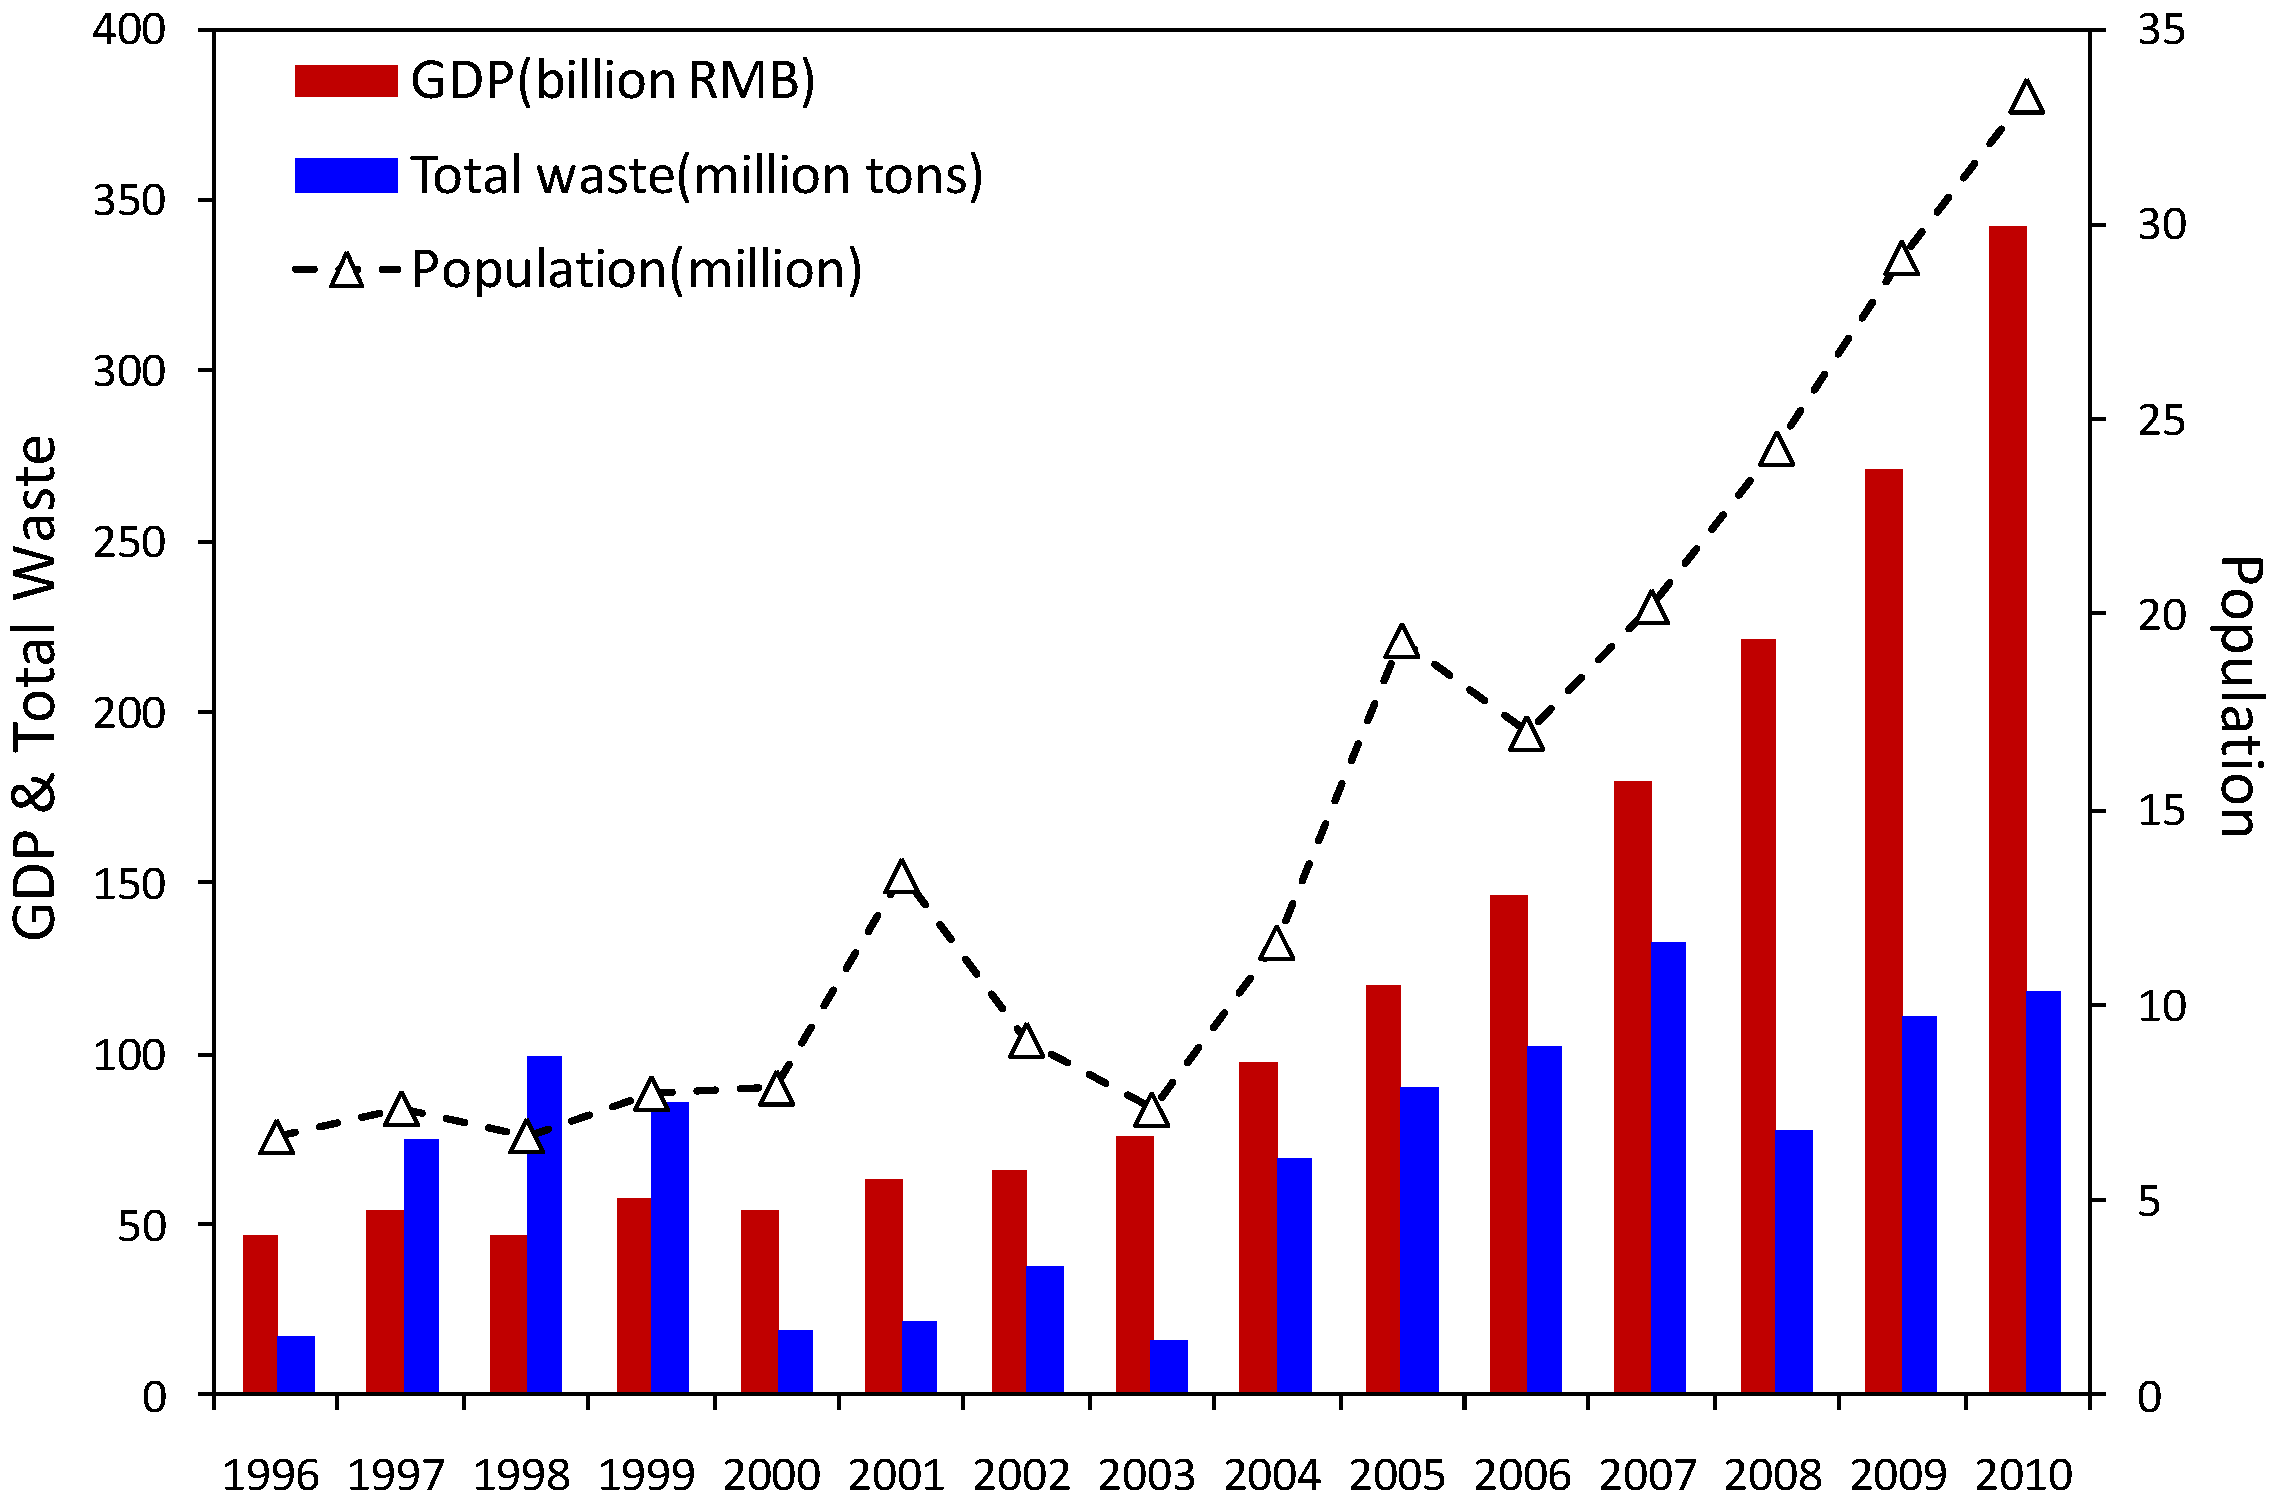
40]. Similar to other lakes in eastern China, Lake Chaohu is undergoing eutrophication due to the increase in population, economic activity, and wastewater generated in its catchment [9]. Population, GDP, and waste increased from 7.88 million people, 53.9 billion RMB, and 18.7 million tons in 2000 to 33.3 million people, 342.6 billion RMB, and 118.8 million tons in 2010, respectively, with a significant increase after 2004 (Figure 7). However, nutrient concentrations have behaved less uniformly: TN ranged from 1.5 to 3.0 mg/L and TP ranged from 0.15 to 0.23 mg/L [7,33,34,35,36,37]. TN showed a reduction from 0.33 mg/L in 2003 to 0.20 mg/L in 2011, and TP showed a decreasing trend. Despite these reductions, the average nutrient concentrations (TN: 2.20 ± 0.42 mg/L; TP: 0.18 ± 0.03mg/L) exceeded cyanobacteria growth requirements [39,41]. Although nutrient enrichment is a prerequisite to bloom formation, the role of nutrient concentrations in controlling floating algae bloom dynamics might be limited due to elevated concentrations and low inter-annual variation [23,27].
Figure 7. Social and economic indices including GDP, population, and total waste in Lake Chaohu Basin, 1996 to 2010.
Remotesensing 07 10523 g007
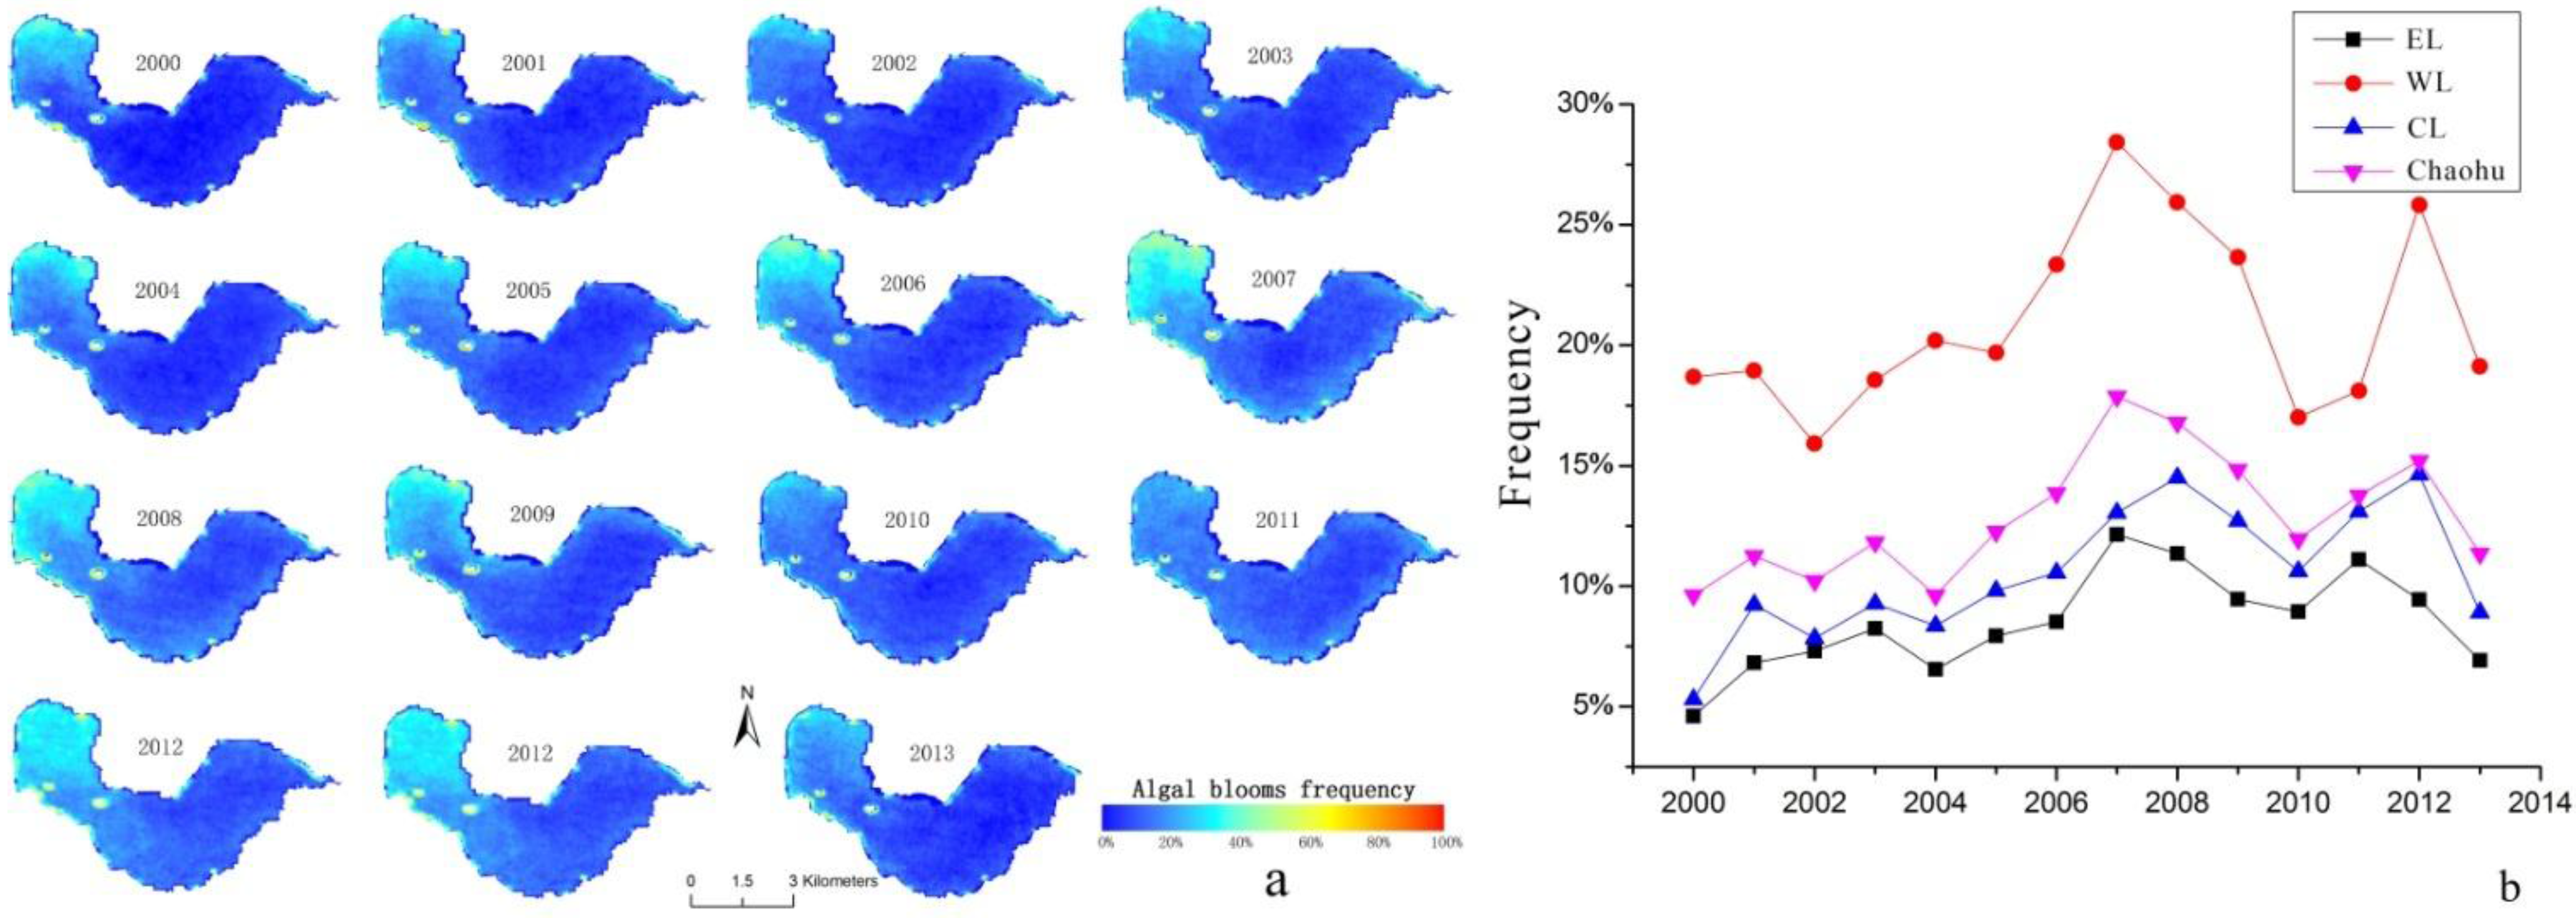
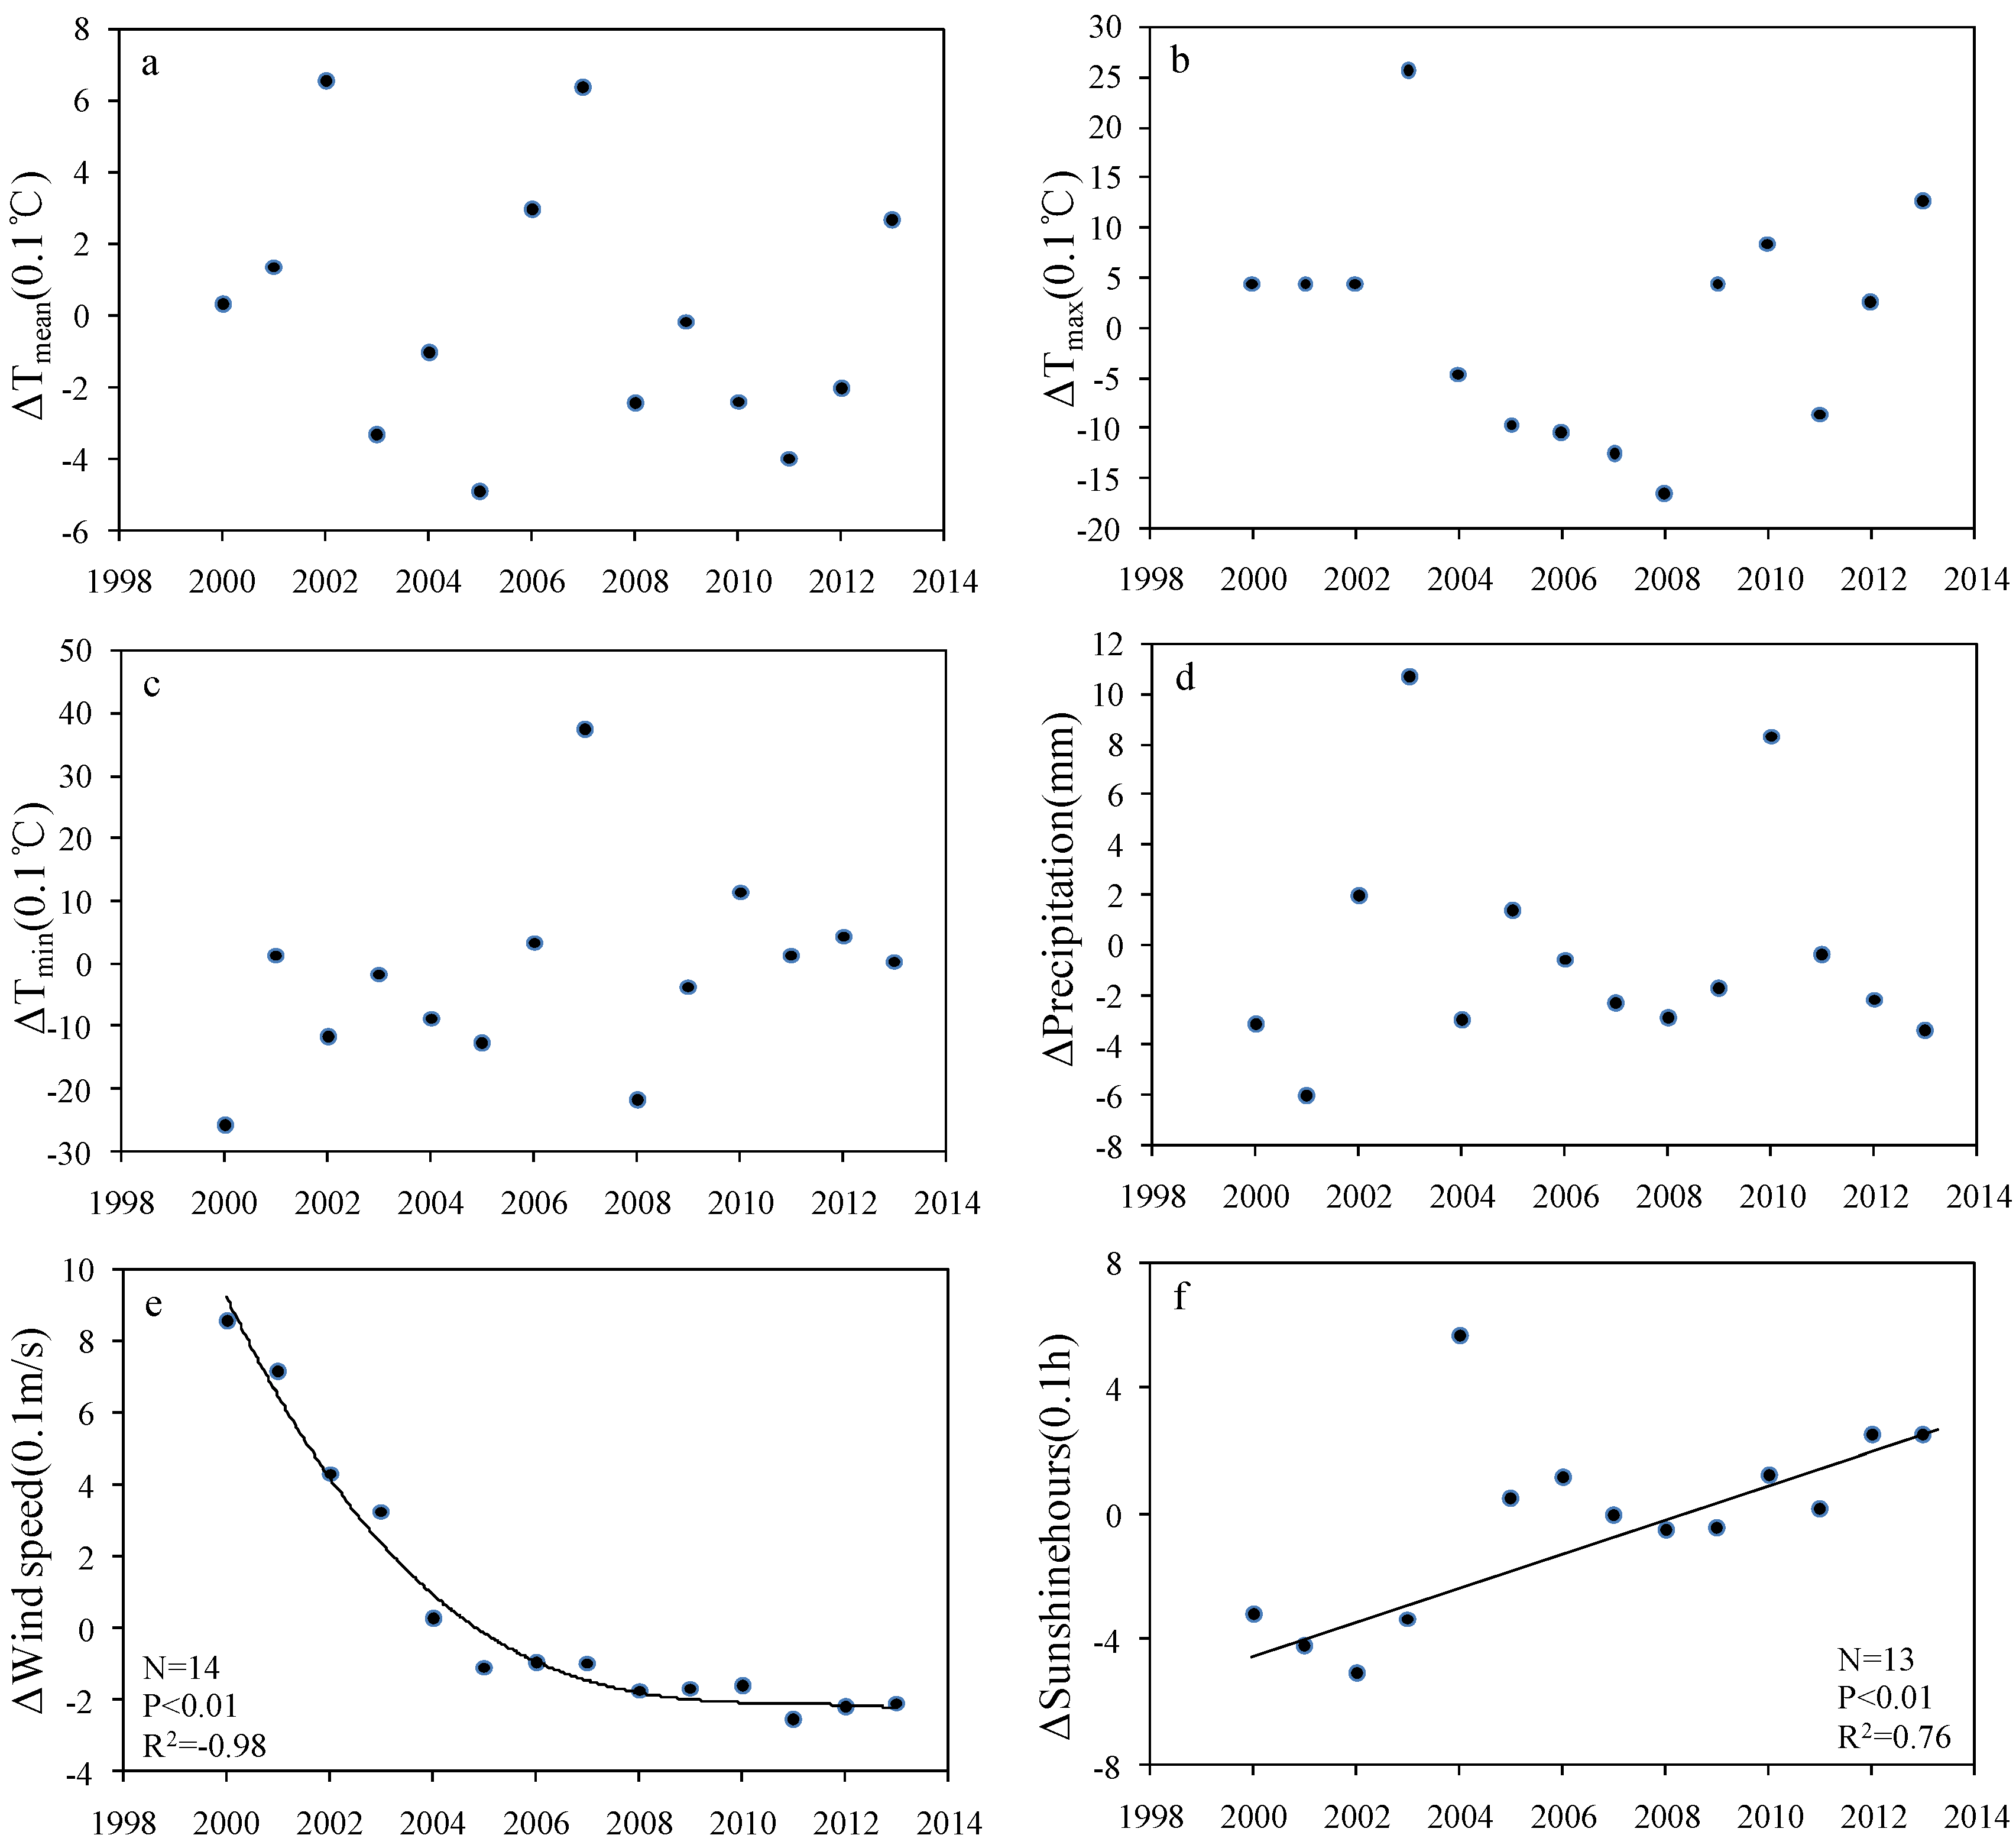
In high nutrient conditions, studies show that the magnitude, spatial extent, and duration of blooms are influenced by temperature, wind conditions (mixing), and solar insolation [30,42,43,44]. The average temperature had no significant trend in Lake Chaohu (Figure 8a), even though ΔTmean in 2002 and 2007 were 0.3 °C higher. ΔTmax showed two patterns: before 2008, it declined at a rate of 0.23 °C per year, except in 2003; after 2008 it increased by 0.29 °C per year (Figure 8b). ΔTmin increased weakly except 2007, and the ΔTmin of 2007 is much higher than the other years (Figure 8c). ΔP had no significant trend (Figure 8d). The daily mean wind speed decreased by 1.1 m/s, and sunlight hours increased by 0.8 h over the 14 years. We compared the relationship between meteorological variables (ΔTmean, ΔTmax, ΔTmin, ΔW, ΔP, and ΔS) and algal bloom dynamics (initiation date, duration, bloom significant days, and average bloom area) (Table 4). As expected, wind anomaly had the highest correlation with the initial bloom date, bloom days, and average bloom area (Table 2), with a poor correlation with duration (Table 4). Precipitation was inversely correlated to duration. Sunlight hours from the meteorological station had a significant relationship with bloom coverage area and duration. This favors cyanobacteria accumulation at the water surface [45,46]. ΔTmax and ΔTmin were correlated with the initial bloom date and duration (p < 0.05) (Table 4).
Figure 8. Trend in daily average anomalies of mean (a), maximum (b), and minimum (c) temperatures; precipitation (d); wind speed (e); and sunshine hours (f) during the period 2000–2013 for Lake Taihu. The line shows the linear regression against year.
Remotesensing 07 10523 g008
Table 4. Relationship between initial bloom date, duration, bloom significant days, and frequency of floating algae blooms in Lake Chaohu and climate variables.
Initial DateDurationΔTmeanΔTmaxΔTminΔPΔWΔS
Initial dater1.000−0.665 **−0.0950.531−0.534 *0.0740.597 *−0.318
Durationr−0.665 **1.0000.243−0.538 *0.701 **−0.497−0.4760.464
Significant daysr−0.640 *0.564 *0.007−0.4950.530−0.065−0.772 **0.332
Mean bloom area ***r−0.4860.583 *−0.368−0.4640.308−0.203−0.796 **0.592
* represents p < 0.05; ** represents p < 0.01. *** Mean bloom area is based on the assumption that the monthly maxima (solid circles in Figure 2) can represent the monthly bloom conditions after interference from the wind mixing is removed.
Average air temperature, winter temperature (including the previous December to February) and effective temperatures for one week, two weeks, and a month before the initial bloom date were compared to the annual initial bloom date (Table 5). No temperature thresholds were identified for average air temperature, winter temperature, and effective temperatures regarding the initial bloom date. In winter, the average temperature in the last decade was 4.6 (±1.0) °C, and the average chlorophyll a concentration was about 16.0 μg/L, allowing for enough cyanobacteria in the water column to create limited surface blooms with favorable conditions (Figure 6).
Table 5. General temperature features of floating algae at time of bloom formation in Lake Chaohu from 2000 to 2013.
YearJulian Day of Initial TimeAir Temperature (°C)Winter Average Temperature (°C)Effective Temperature (°C) *
One Week before Initial TimeTwo Weeks before Initial TimeOne Month before Initial Time
200010611.74.454.997181.4
200111518.64.738.281.7139.8
2002102126.352.8120.7243.7
200314522.44.696.1177.7341.4
200411918.45.368.5140.9246.4
20056916.83.31.2–24–133.6
20066514.93.8–18.8–33.2–109.7
2007458.55.72.6-0.9–84.7
20089819.13.44375.4138.9
20096812.25.3–23.1–55.5–54.1
20105311.44.8–35.3–77.6–125.2
20117010.24.1–4.5–28.7–103.4
2012706.23.5–22.9–54.2–135.1
201310114.93.939.680.4108
* Effective temperatures of one week, two weeks, and one month before initial time, which were defined as∑(Ti-T0 ), and T0 was the average winter temperature.

4.2. Environmental Drivers of Monthly Surface Bloom Dynamics

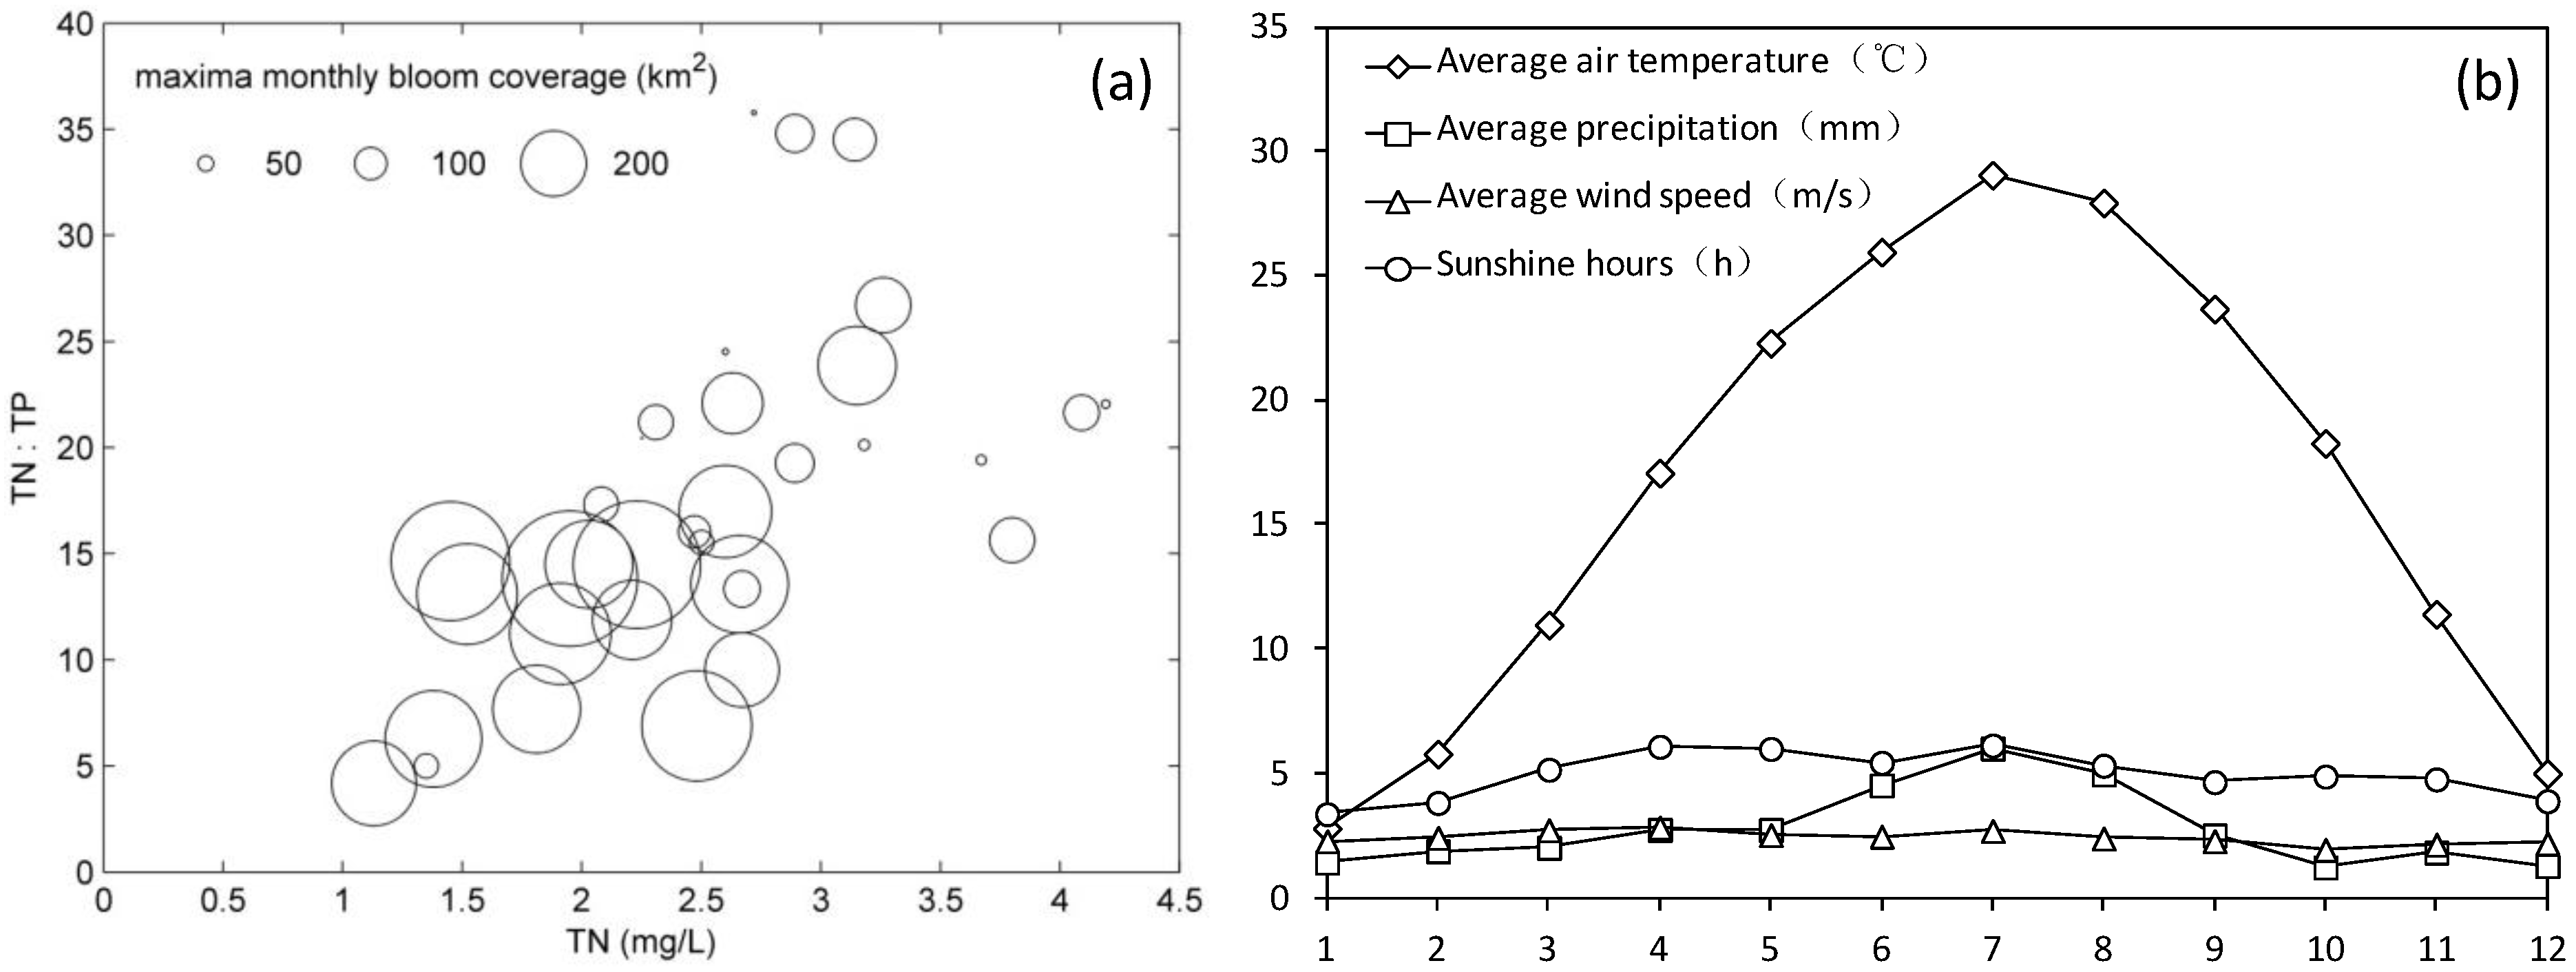
Comparing monthly nutrient ratios and concentrations from three separate years (2008, 2012, and 2013) to monthly maximum bloom coverage (using monthly maxima), a significant negative correlation with TN (r = −0.503, N = 34) and TN/TP (r = −0.512, N = 34) was found (Table 6). TN concentration increased in the spring when water levels were lowest and decreased in the summer when water levels were the highest, showing opposite trends to that of the bloom coverage. During periods of heavy surface blooms, TN:TP ratios ranged from 5:1 to 20:1 and TN concentrations were between 1.0 and 3.0 mg/L (Figure 9a). Previous studies indicated that low TN:TP mass ratios favor both nitrogen-fixing and non-nitrogen-fixing cyanobacteria [47]. In competition experiments, Microcystis dominates at a TN:TP supply ratio < 44 [48].
Due to the typical subtropical monsoon climate, only air temperature and precipitation showed seasonal behavior, as the seasonality of wind speed and sunshine hours was relatively weak (Figure 9b). Temperature was hypothesized as a key factor in the growth and cessation of floating algae blooms [49,50]. Our results indicated that monthly average temperature covaried with maximum monthly bloom coverage (r = 0.677, n = 156). Microcystis aeruginosa was shown to grow and enter the water column at 9 °C, resulting in a close correlation between algal recruitment and cumulative temperatures (sum of effective temperatures) [32]. In Lake Chaohu, bloom expansion occurred from May to October when air temperatures were near or above 20 ℃. Cyanobacteria exhibit optimal growth rates at higher temperatures and compete more effectively with diatoms, chlorophytes, and cryptophytes [51]. In a recent study of phytoplankton in Lake Chaohu, the photosynthetic rate of M. wesenbergii was found to be greater than that of M. viridis as temperature increased between spring and summer [7]. When the temperature decreased between summer and autumn, this favored the growth of M. aeruginosa. Similar changes occurred between autumn and winter, as M. viridis replaced M. aeruginosa.
While monthly average precipitation was also correlated with maximum monthly bloom coverage (r = 0.298, N = 156), a clear direct cause is unlikely and coincident temperature increases are a more likely determinant. Increases in cloudiness and direct precipitation inhibit the formation of floating algae blooms [52].
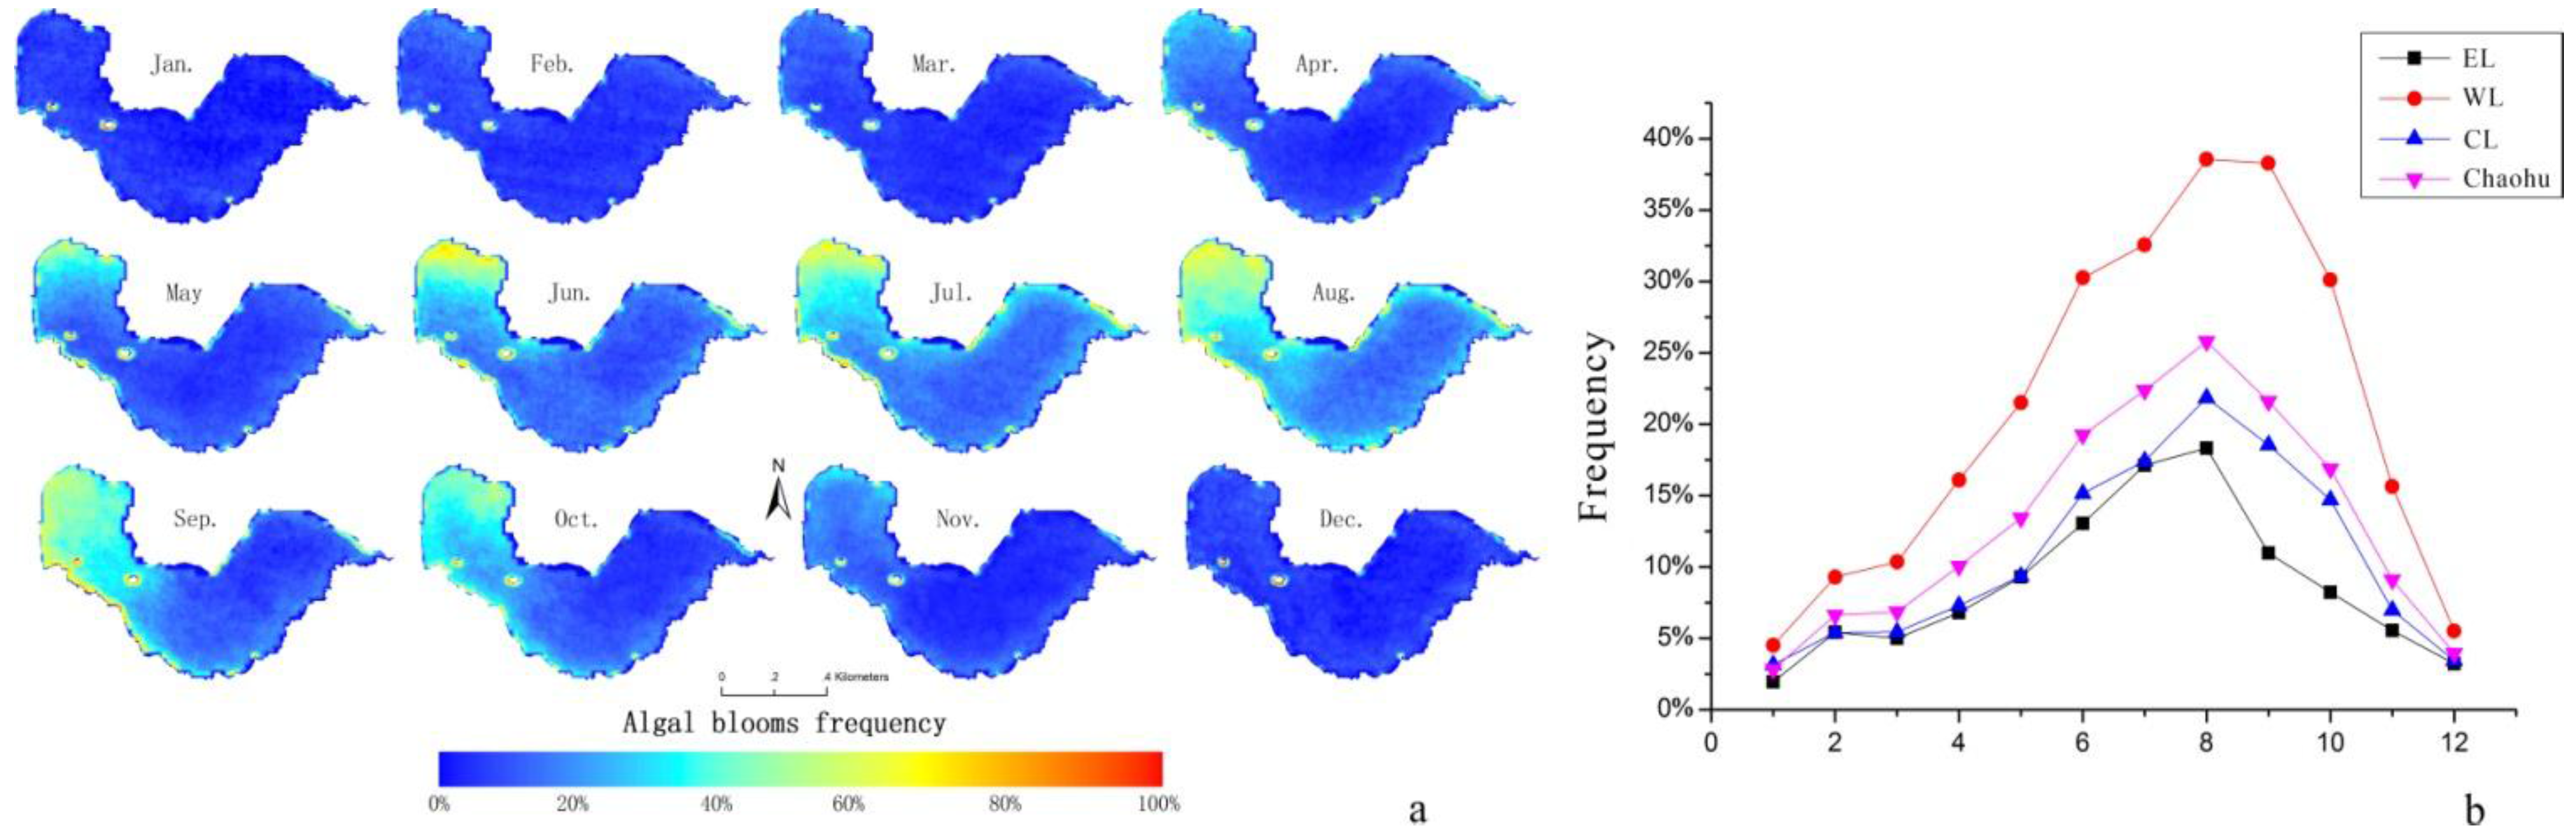
The monthly average wind speed in Lake Chaohu was at its maximum in March (2.72 m/s) and at its minimum in October (1.92 m/s). Blooms occurred most frequently with a south wind before August, while an east wind prevailed in autumn, favoring an accumulation of surface blooms on the north coast of the west section.
Table 6. Bivariate correlation analysis between monthly maxima algal bloom area and monthly water quality parameters.
TN (mg/L)TP (mg/L)Transparency (cm)TN/TP
Maximum algal bloom area (km2)Pearson Correlation−0.5030.2290.098−0.512
Sig. (2-tailed)0.0020.1920.5820.002
N34343434
Figure 9. (a) Nutrient concentration (TN) and stoichiometry (TN to TP ration) with monthly maximum algal bloom coverage in Lake Chaohu during three different years (2008, 2012, and 2013). Bubble size is monthly maximum algal bloom area. (b) Monthly variations of temperature, wind speed, precipitation, and sunshine hours from 2000 to 2014.
Remotesensing 07 10523 g009

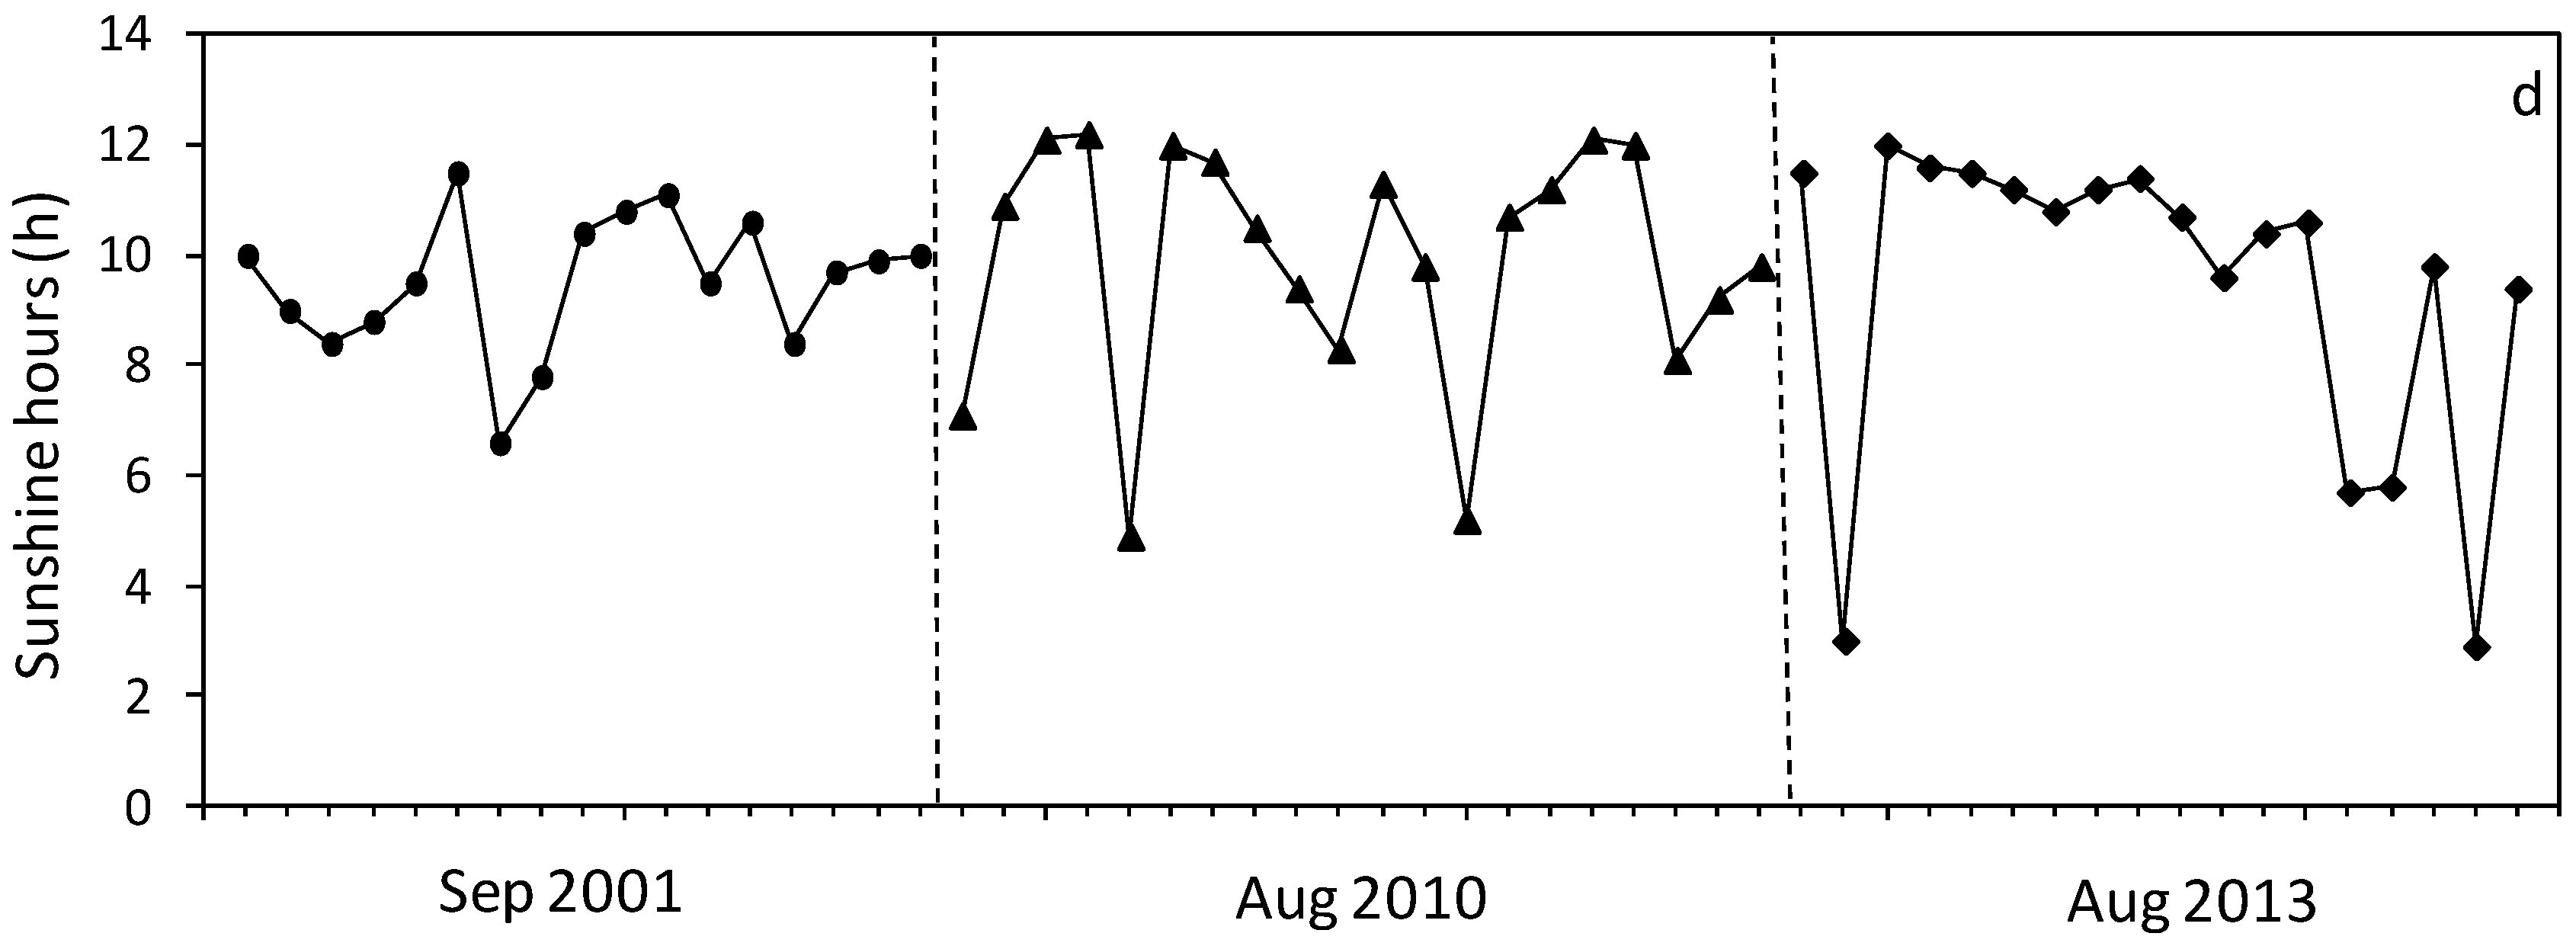
4.3. Environmental Drivers of Daily Surface Bloom Dynamics

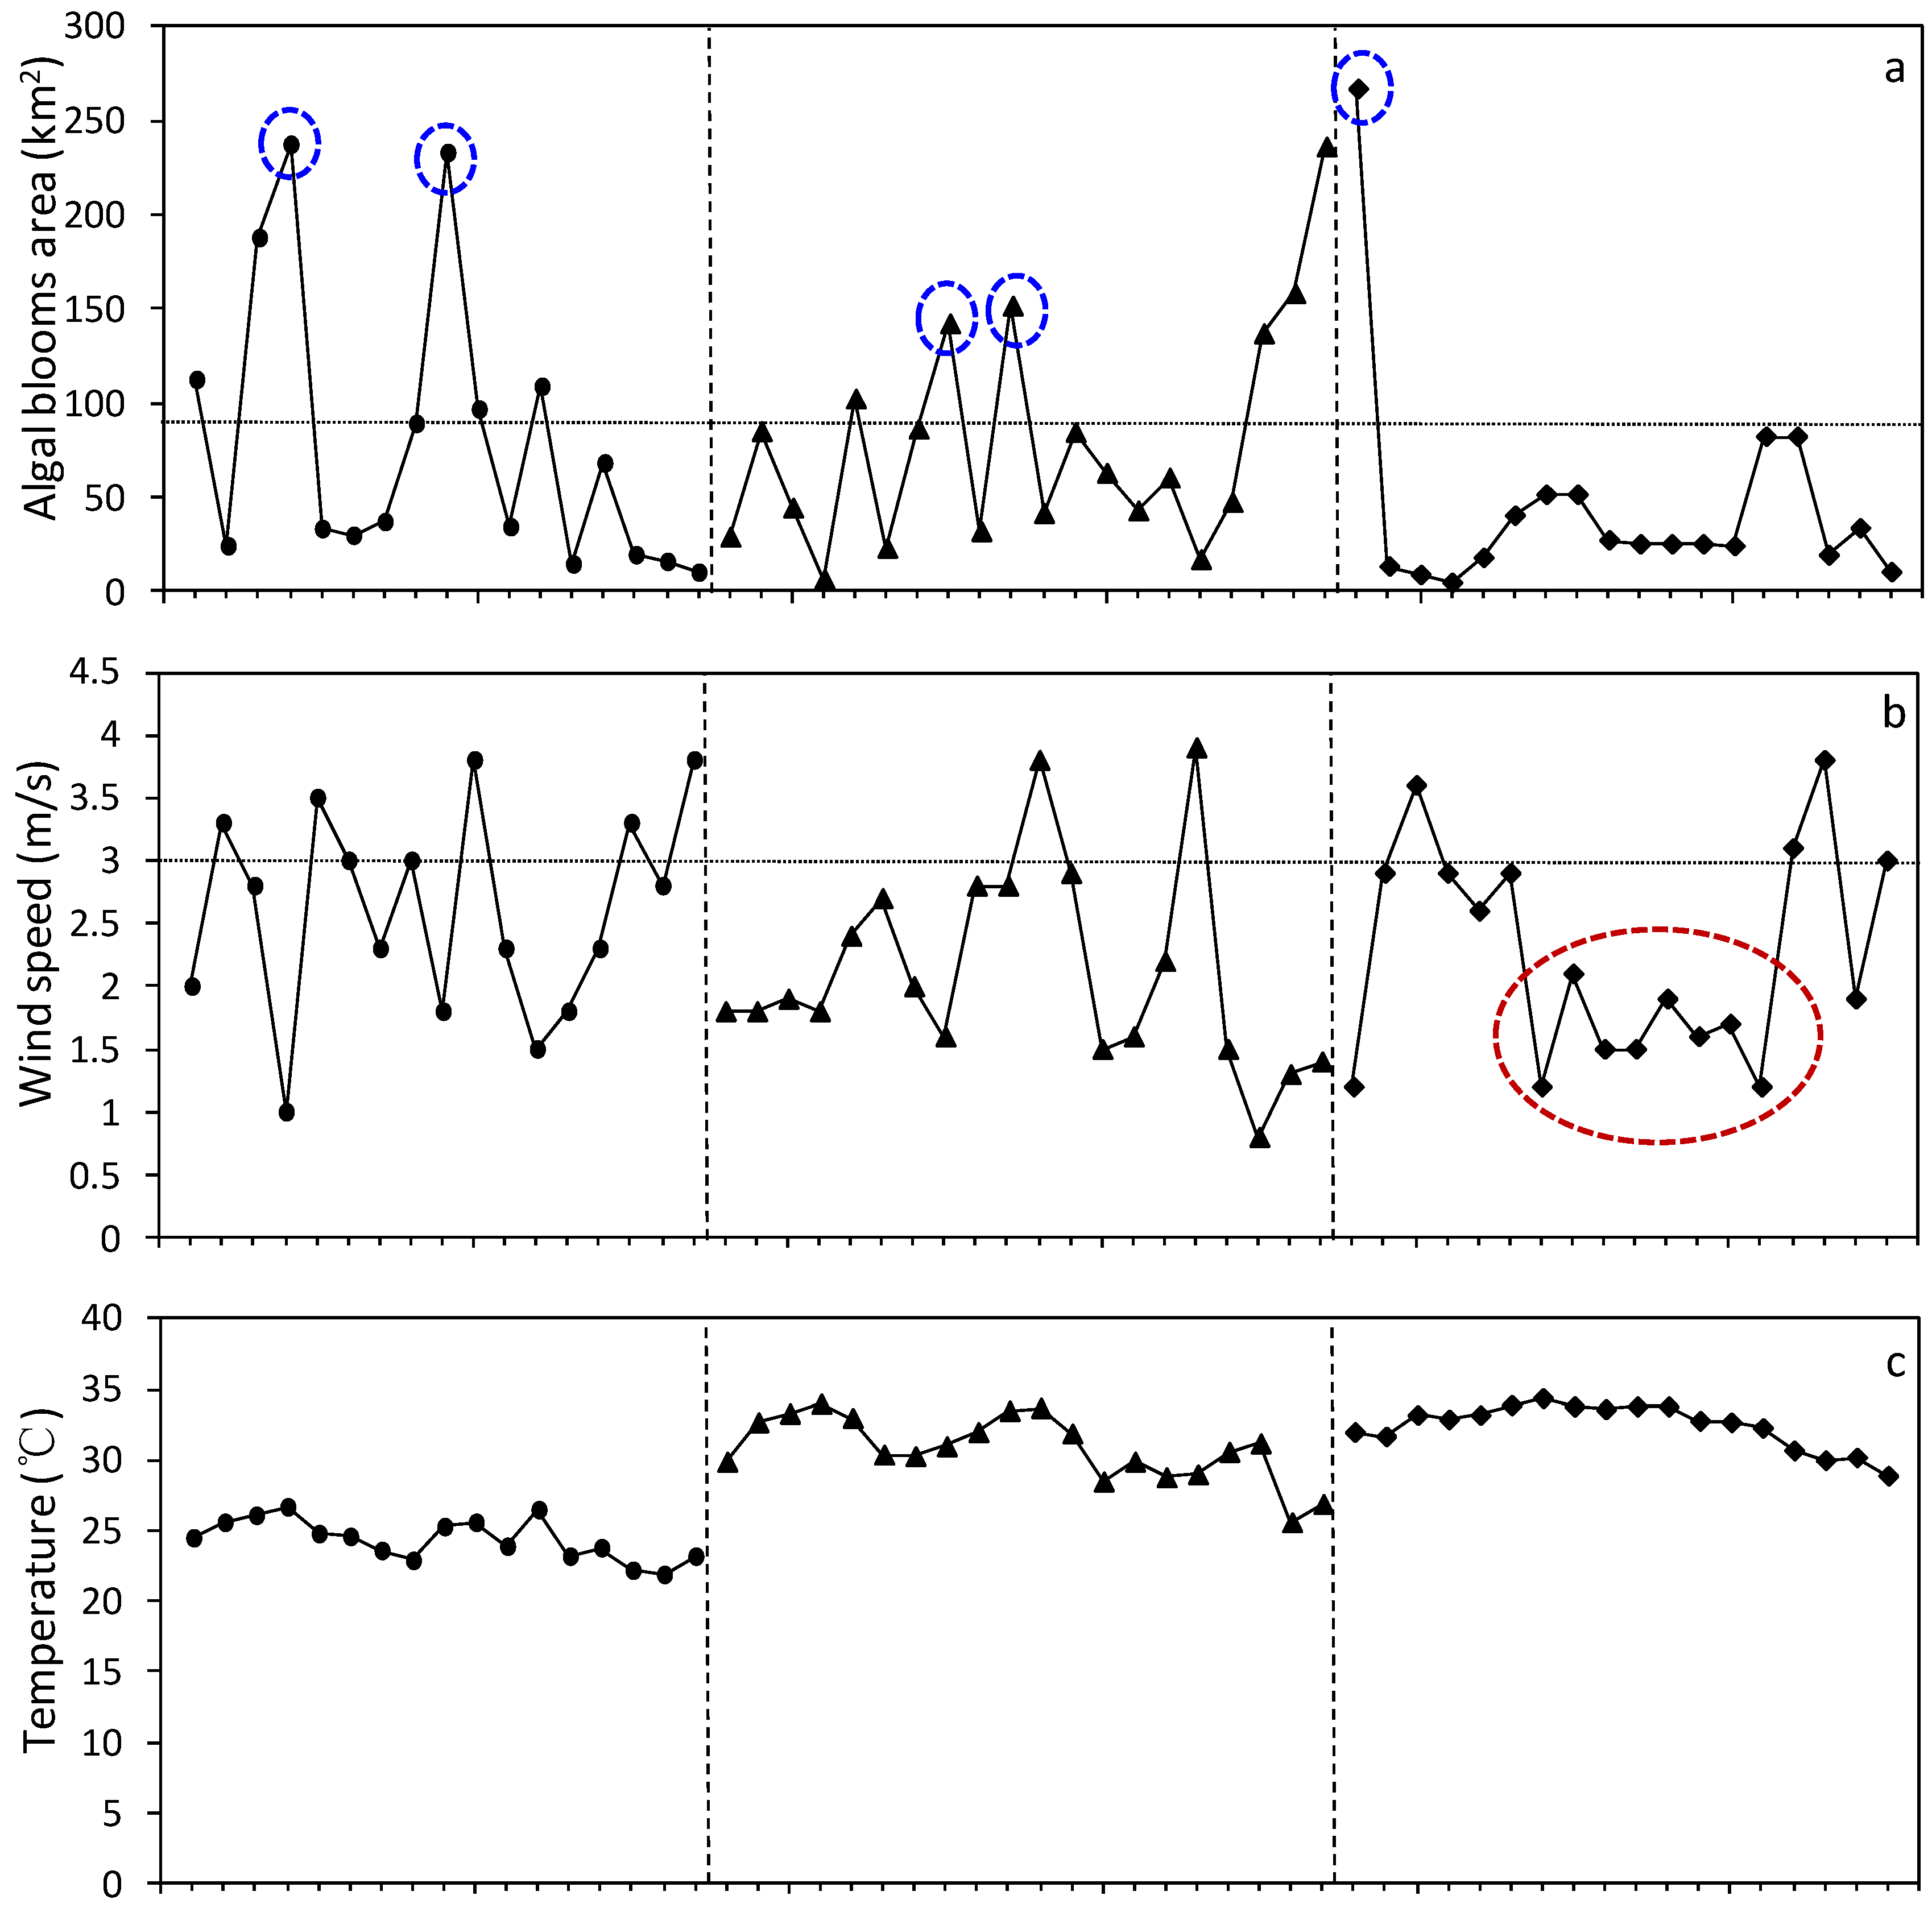
Using consecutive daily images, it was possible to examine bloom dynamics in more detail (Figure 10). When the temperature was stable (consecutive days in September 2001, August 2010, and August 2013), a negative relationship between bloom area and daily wind speed occurred, confirming earlier observations in shallow waterbodies by George and Edwards [29], and Hunter [30]. Weak winds do not produce the needed turbulence to mix the algae cells [31,53], allowing them to congregate at the surface to a depth of 0.3 m [54]. This was captured in the decrease in surface bloom area for 5–6 September 2001, showing a decrease from 237 km2 with a wind speed of 1.0 m/s to 33 km2 next day with a wind speed of 3.5 m/s (Figure 10b).
Similar dynamics occurred for 12–13 September 2001, 10–12 August 2010, and 2–3 August 2013 (Figure 10). It is unlikely that an extensive floating algae biomass could appear or disappear in a single day. In fact, without knowledge of the vertical distribution of the algae, the surface biomass delivered from satellite data cannot be used to determine the total cyanobacteria biomass. We can only assume that total biomass values are underestimated when wind conditions are elevated [44].
Figure 10. Three examples of daily algal bloom area, wind speed, temperature, and sunshine hours. The blue circles mark the examples where floating bloom area changed because of the wind speed. The red circle shows an example where low winds were not followed by severe blooms.
Remotesensing 07 10523 g010aRemotesensing 07 10523 g010b
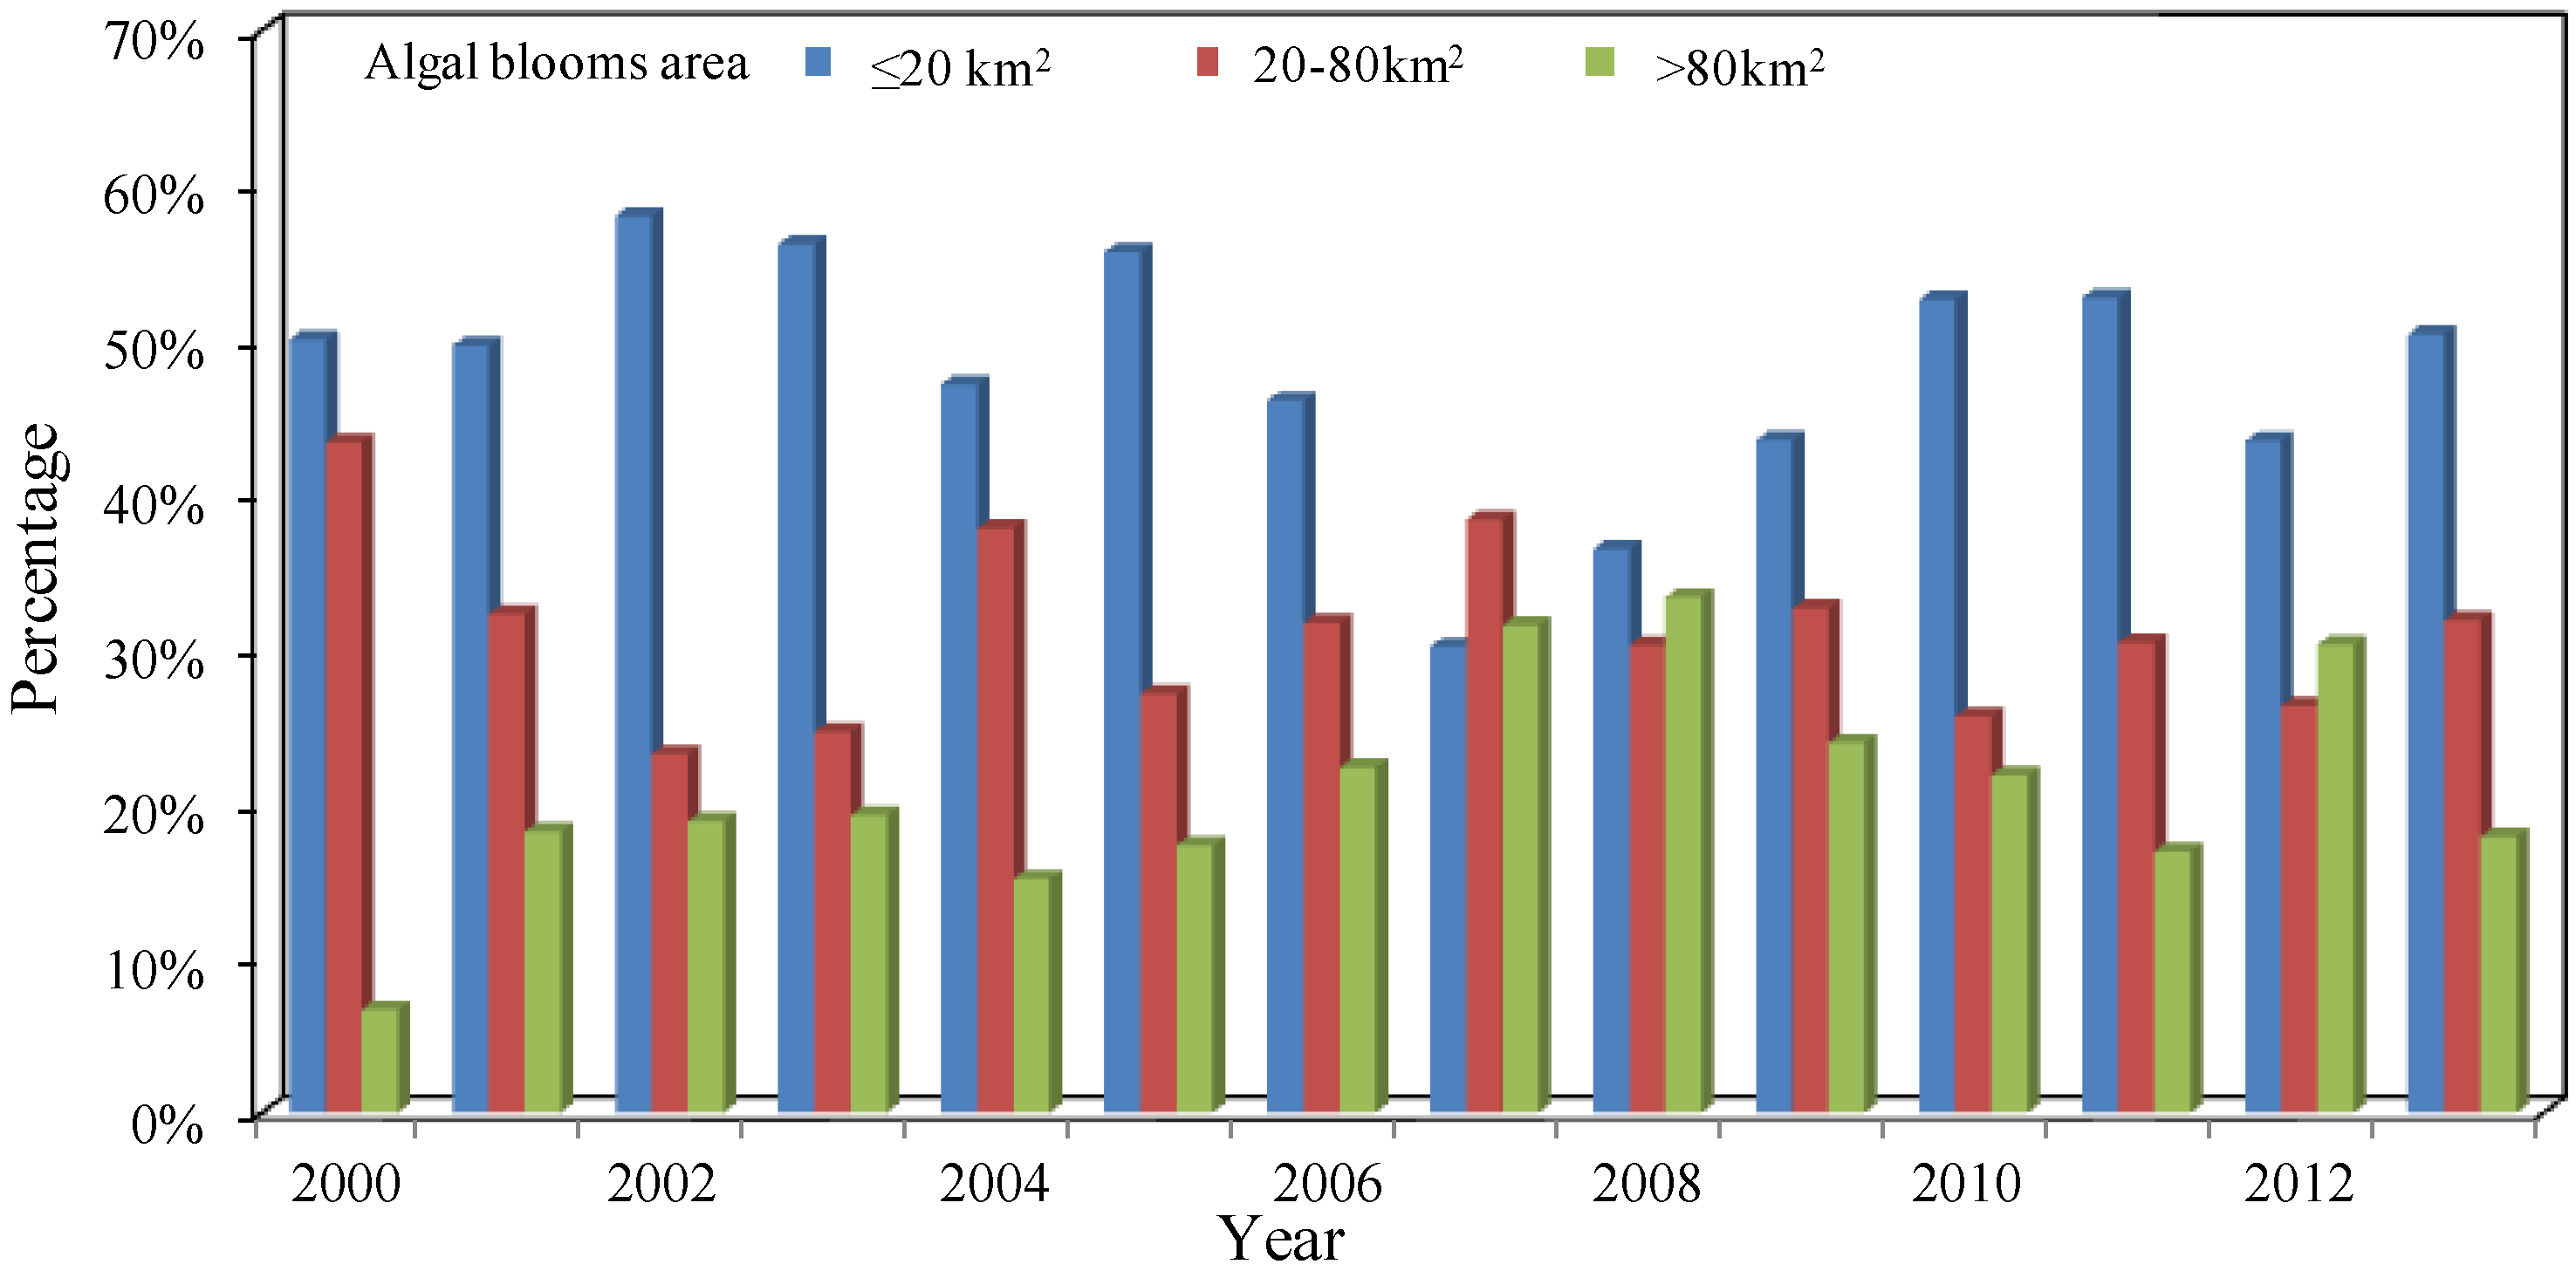
The results show that severe algal blooms (>80 km2) took place when wind speed was below 3.0 m/s. However, low winds were not always followed by severe blooms, under appropriate temperature and insolation conditions. For example, algal bloom area was no more than 50 km2 with persistent low wind (<2 m/s) for 10–17 August 2013, with air temperatures above 32 °C and sunshine hours of 10 hours each day. In this case, heavy blooms did not occur even with the low average wind, high temperature, and insolation, possibly due to a lag in bloom formation due to daily variability in wind speed, observed to have an amplitude of 0.6–1.1 m/s [55]. In the present study, we use the daily average wind speed, which might be not sufficient to explain instantaneous bloom conditions during the satellite passage. Another possibility may be that elevated temperatures may be above the optimal temperature for the species present, even while favoring thermal stratification [56].

5. Conclusions

Lake Chaohu has undergone growing eutrophication and more frequent occurrences of toxic algae blooms, posing an increased risk for recreational and potable water supplies. In recent years, the provincial and national governments made major efforts to control nutrient loads and modify hydrological inputs and outputs. In the present study, we used the APA approach with MODIS data to determine the spatial and temporal distribution of floating algae blooms over a 14-year period. The most striking result was the disconnection between the increase in bloom coverage and the dynamics of nutrient concentrations.
Local meteorological conditions (wind speed and sunlight hours) were seen to play a determining role in the changes over the study period in bloom coverage (increasing), bloom frequency (increasing), bloom duration (increasing), and bloom initiation (earlier). This is particularly evident in the eastern section of the lake, previously less impacted by algal blooms. The bloom characteristics of 2007 were unique in timing, duration, and coverage in Lake Chaohu and were similar to those of Lake Taihu.
Lake Chaohu has become a top national environmental priority and policy makers are exploring additional actions to address algal bloom management in Lake Chaohu. The APA approach using daily satellite coverage provides a new tool for analysis and validation of mitigation and management approaches, as well as an early warning system for lake authorities. As a major freshwater ecosystem in a catchment undergoing rapid economic and demographic expansion, the approaches developed in the present study contribute to the study and management of inland freshwater lakes in many areas of the world.

Acknowledgments

This work was supported by the State Key Program of National Natural Science of China (Grant No. 41431176), the National Natural Science Foundation of China (Grant No. 41471287), the National High Technology Research and Development Program of China (2014AA06A509), the 135-Program of NIGLAS (NIGLAS2012135014 and NIGLAS2012135010), and the Dragon 3 Cooperation Program.

Author Contributions

Yuchao Zhang developed the idea for the study and its design. Jinduo Xu and Min Zhang were responsible for the construction and validation of the dataset. Yuchao Zhang, Ronghua Ma, Hongtao Duan, Steven Loiselle and Min Zhang shared in the analysis and development of the discussion. Yuchao Zhang and Steven Loiselle finalized the manuscript. All authors read and approved the manuscript.

Conflicts of Interest

The authors declare no conflict of interest.

References

  1. Vitousek, P.M.; Mooney, H.A.; Lubchenco, J.; Melillo, J.M. Human domination of Earth’s ecosystems. Science 1997, 277, 494–499. [Google Scholar] [CrossRef]
  2. Callisto, M.; Molozzi, J.; Barbosa, J.L.E. Eutrophication: Causes, Consequences and Control; Ansari, A.A., Gill, S.S., Eds.; Springer: Dordrecht, The Netherlands, 2014. [Google Scholar]
  3. Guo, L. Doing battle with the green monster of Taihu Lake. Science 2007, 317, 1166. [Google Scholar] [CrossRef] [PubMed]
  4. Zhao, S.Q.; Fang, J.Y.; Miao, S.L.; Gu, B.; Tao, S.; Peng, C.H.; Tang, Z.Y. The 7-decade degradation of a large freshwater lake in central Yangtze River, China. Environ. Sci. Tech. 2005, 39, 431–436. [Google Scholar] [CrossRef]
  5. SEPA. Annual Chinese Environmental Quality Report; China Environmental Publishing: Beijing, China, 2013. [Google Scholar]
  6. Duan, H.; Ma, R.; Xu, X.; Kong, F.; Zhang, S.; Kong, W.; Hao, J.; Shang, L. Two-decade reconstruction of algal blooms in China’s Lake Taihu. Environ. Sci. Technol. 2009, 43, 3522–3528. [Google Scholar] [CrossRef] [PubMed]
  7. Jia, X.; Shi, D.; Shi, M.; Li, R.; Song, L.; Fang, H.; Yu, G.; Li, X.; Du, G. Formation of cyanobacterial blooms in Lake Chaohu and the photosynthesis of dominant species hypothesis. Acta Ecol. Sin. 2011, 31, 2968–2977. [Google Scholar]
  8. Dai, G.; Li, J.; Li, L.; Song, L. The spatio-temporal pattern of phytoplankton in the north basin of Lake Dianchi and related environmental factors. Acta Hydrobiol. Sin. 2012, 36, 946–957. (In Chinese) [Google Scholar] [CrossRef]
  9. Xie, P. Reading about the Histories of Cyanobacteria, Eutrophication and Geological Evolution in Lake Chaohu; Science Press: Beijing, China, 2009. [Google Scholar]
  10. Tu, Q.Y.; Gu, D.X.; Yi, C.Q.; Xu., Z.R.; Han, G.Z. The Researches on the Lake Chaohu Eutrophication; Publisher of University of Science and Technology of China: Hefei, China, 1990. (In Chinese) [Google Scholar]
  11. Meng, R.; Liu, Z. An evaluation of water pollution and eutrophication of the Chaohu Lake by means of phytoplankton. Acta Hydrobiol. Sin. 1986, 12, 13–26. (In Chinese) [Google Scholar]
  12. Deng, D.G. Ecological Studies on the Effects of Eutrophication on Plankton Communities in a Large Shallow Lake, Lake Chahu. Ph.D. Thesis, Institude of Hydrobiology, Chinese Acadamy of Sciences, Wuchang, China, 2004. [Google Scholar]
  13. Deng, D.G.; Xie, P.; Zhou, Q.; Yang, H.; Guo, L.-G. Studies on temporal and spatial variations of phytoplankton in Lake Chaohu. J. Integr. Plant Biol. 2007, 49, 409–418. [Google Scholar] [CrossRef]
  14. Jiang, Y.-J.; He, W.; Liu, W.-X.; Qin, N.; Ouyang, H.-L.; Wang, Q.-M.; Kong, X.-Z.; He, Q.-S.; Yang, C.; Yang, B.; et al. The seasonal and spatial variations of phytoplankton community and their correlation with environmental factors in a large eutrophic Chinese lake (Lake Chaohu). Ecol. Indic. 2014, 40, 58–67. [Google Scholar] [CrossRef]
  15. Xie, X.; Qian, X.; Qian, Y.; Zhang, Y.; Tian, F. Numerical simulation of hydrodynamics and water quality for water transfer from Yangtze River to Chaohu Lake. China Environ. Sci. 2008, 28, 1133–1137. (In Chinese) [Google Scholar]
  16. Xie, X.; Qian, X.; Zhang, Y.; Qian, Y.; Tian, F. Effect on Chaohu Lake water environment of water transfer from Yangtze River to Chaohu Lake. Res. Environ. Sci. 2009, 22, 897–891. (In Chinese) [Google Scholar]
  17. Gao, C.; Zhang, T. Eutrophication in Chinese context: Understanding various physical and socio-economic aspects. Ambio 2010, 39, 385–393. [Google Scholar] [CrossRef] [PubMed]
  18. Kahru, M.; Leppanen, J.M.; Rud, O.; Savchuk, O.P. Cyanobacteria blooms in the gulf of Finland triggered by saltwater inflow into the Baltic Sea. Mar. Ecol.-Prog. Ser. 2000, 207, 13–18. [Google Scholar] [CrossRef]
  19. Kutser, T. Quantitative detection of chlorophyll in cyanobacterial blooms by satellite remote sensing. Limnol. Oceanogr. 2004, 49, 2179–2189. [Google Scholar] [CrossRef]
  20. Gower, J.F.R. Red tide monitoring using AVHRR HRPT imagery from a local receiver. Remote Sens. Environ. 1994, 48, 309–318. [Google Scholar] [CrossRef]
  21. Le, C.; Li, Y.; Zha, Y.; Sun, D.; Huang, C.; Lu, H. A four-band semi-analytical model for estimating chlorophyll a in highly turbid lakes: The case of Taihu Lake, China. Remote Sens. Environ. 2009, 113, 1175–1182. [Google Scholar] [CrossRef]
  22. Hu, C. A novel ocean color index to detect floating algae in the global oceans. Remote Sens. Environ. 2009, 113, 2118–2129. [Google Scholar] [CrossRef]
  23. Stumpf, R.P.; Wynne, T.T.; Baker, D.B.; Fahnenstiel, G.L. Interannual variability of cyanobacterial blooms in Lake Erie. PLOS ONE 2012, 7, e42444. [Google Scholar] [CrossRef] [PubMed]
  24. Kahru, M.; Elmgren, R. Multidecadal time series of satellite-detected accumulations of cyanobacteria in the Baltic Sea. Biogeosciences 2014, 11, 3619–3633. [Google Scholar] [CrossRef]
  25. Zhang, Y.; Ma, R.; Duan, H.; Loiselle, S.A.; Xu, J.; Ma, M. A novel algorithm to estimate algal bloom coverage to subpixel resolution in Lake Taihu. IEEE J. Sel. Top. Appl. Earth Obs. Remote Sens. 2014, 7, 3060–3068. [Google Scholar] [CrossRef]
  26. Hu, C.; Lee, Z.; Ma, R.; Yu, K.; Li, D.; Shang, S. Moderate resolution imaging spectroradiometer (MODIS) observations of cyanobacteria blooms in Taihu Lake, China. J. Geophys. Res. Oceans 2010, 115, C04002. [Google Scholar] [CrossRef]
  27. Hu, C.; Lee, Z.; Ma, R.; Yu, K.; Li, D.; Shang, S. Moderate Resolution Imaging Spectroradiometer (MODIS) Observations of Cyanobacteria Blooms in Taihu Lake, China; Marine Science Faculty Publications; Paper 40; University of South Florida: Tampa, FL, USA, 2010; Available online: http://scholarcommons.usf.edu/msc_facpub/40 (accessed on 1 April 2010).
  28. Hu, C.; Chen, Z.; Clayton, T.D.; Swarzenski, P.; Brock, J.C.; Muller-Karger, F.E. Assessment of estuarine water-quality indicators using MODIS medium-resolution bands: Initial results from Tampa Bay, Fl. Remote Sens. Environ. 2004, 93, 423–441. [Google Scholar] [CrossRef]
  29. George, D.G.; Edward, R.W. The effect of wind on the distribution of chlorophyll-a and crustacean plankton in a shallow eutrophic reservoir. J. Appl. Ecol. 1976, 13, 667–690. [Google Scholar] [CrossRef]
  30. Hunter, P.D.; Tyler, A.N.; Willby, N.J.; Gilvear, D.J. The spatial dynamics of vertical migration by microcystis aeruginosa in a eutrophic shallow lake: A case study using high spatial resolution time-series airborne remote sensing. Limnol. Oceanogr 2008, 53, 2391–2406. [Google Scholar] [CrossRef]
  31. Cao, H.S.; Kong, F.X.; Luo, L.C.; Shi, X.L.; Yang, Z.; Zhang, X.-F.; Tao, Y. Effects of wind and wind-induced waves on vertical phytoplankton distribution and surface blooms of microcystis aeruginosa in Lake Taihu. J. Freshw. Ecol. 2006, 21, 231–238. [Google Scholar] [CrossRef]
  32. Cao, H.; Tao, Y.; Kong, F.; Yang, Z. Relationship between temperature and cyanobacterial recruitment from sediments in laboratory and field studies. J. Freshw. Ecol. 2008, 23, 405–412. [Google Scholar] [CrossRef]
  33. Wang, Q.; Li, C.; Wang, S.; Zhao, X. Analysis on temporal variation characteristics of entrophication in Chao Lake. J. Anhui Agric. Sci. 2011, 39, 19324. (In Chinese) [Google Scholar]
  34. Huang, M. Study on comprehensive assessment method for water quality eutrophication in Chaohu Lake. J. West Anhui University 2012, 28, 23–25. (In Chinese) [Google Scholar]
  35. Rong, J.; Wang, L. Application of the exponential smoothing law—Markov model in prediction of water quality of Chaohu Lake. J. Water Resour. Water Eng. 2013, 24, 98–102. (In Chinese) [Google Scholar]
  36. Zhu, Y.; Wang, F. Water quality in Chaohu Lake watershed and the its envirnmental objects. Envrion. Monit. Manage. Technol. 2004, 16, 22–24. (In Chinese) [Google Scholar]
  37. Zou, Q.; Zhou, L.; Wu, S. Integrated assessment on water quality of Lake Chaohu. Water Conser. Fishery 2007, 27, 57–59. (In Chinese) [Google Scholar]
  38. Ebina, J.; Tsutsui, T.; Shirai, T. Simultaneous determination of total nitrogen and total phosphorus in water using peroxodisulfate oxidation. Water Res. 1983, 17, 1721–1726. [Google Scholar] [CrossRef]
  39. Zhang, M.; Duan, H.; Shi, X.; Yu, Y.; Kong, F. Contributions of meteorology to the phenology of cyanobacterial blooms: Implications for future climate change. Water Res. 2012, 46, 442–452. [Google Scholar] [CrossRef] [PubMed]
  40. Hallegraeff, G.M. A review of harmful algal blooms and their apparent global increase. Phycologia 1993, 32, 79–99. [Google Scholar] [CrossRef]
  41. Qin, B.Q.; Zhu, G.W.; Gao, G.; Zhang, Y.L.; Li, W.; Paerl, H.; Carmichael, W. A drinking water crisis in Lake Taihu, China: Linkage to climatic variability and lake management. Environ. Manage. 2010, 45, 105–112. [Google Scholar] [CrossRef] [PubMed]
  42. Kong, F.; Hu, W.; Gu, X.; Yang, G.; Fan, C.; Chen, K. On the cause of cyanophyta bloom and pollution in water intake area and emergency measures in meiliang bay, Lake Taihu in 2007. J. Lake Sci. 2007, 19, 357–358. (In Chinese) [Google Scholar]
  43. Ren, J.; Shang, Z.; Jiang, M.; Qin, M.; Jiang, W. Meteorological condition of blue-green algae fast growth of Lake Taihu in 2007. J. Anhui Agric. Sci. 2008, 36, 11874–11875. (In Chinese) [Google Scholar]
  44. Wynne, T.T.; Stumpf, R.P.; Tomlinson, M.C.; Dyble, J. Characterizing a cyanobacterial bloom in western Lake Erie using satellite imagery and meteorological data. Limnol. Oceanogr. 2010, 55, 2025–2036. [Google Scholar] [CrossRef]
  45. Walsby, A.E.; Hayes, P.K.; Boje, R.; Stal, L.J. The selective advantadge of buoyancy provided by gas vesicles for planktonic cyanobacteria in the Baltic Sea. New Phytol. 1997, 136, 407–417. [Google Scholar] [CrossRef]
  46. Klausmeier, C.A.; Litchman, E. Algal games: The vertical distribution of phytoplankton in poorly mixed water columns. Limnol. Oceanogr. 2001, 46, 1998–2007. [Google Scholar] [CrossRef]
  47. Tilman, D. Phytoplankton community ecology: The role of limiting nutrients. Ann. Rev. Ecol. Systemat. 1982, 13, 349–372. [Google Scholar] [CrossRef]
  48. Fujimoto, N.; Sudo, R.; Sugiura, N.; Inamori, Y. Nutrient-limited growth of microcystis aeruginosa and phormidium tenue and competition under various N:P supply ratios and temperatures. Limnol. Oceanogr. 1997, 42, 250–256. [Google Scholar] [CrossRef]
  49. Sellner, K.G. Physiology, ecology, and toxic properties of marine cyanobacteria blooms. Limnol. Oceanogr. 1997, 42, 1089–1104. [Google Scholar] [CrossRef]
  50. Paerl, H.W.; Huisman, J. Blooms like it hot. Science 2008, 320. [Google Scholar] [CrossRef] [PubMed]
  51. Paerl, H.W.; Huisman, J. Climate change: A catalyst for global expansion of harmful cyanobacterial blooms. Environ. Microbiol. Rep. 2009, 1, 27–37. [Google Scholar] [CrossRef] [PubMed]
  52. JÖHnk, K.D.; Huisman, J.E.F.; Sharples, J.; Sommeijer, B.E.N.; Visser, P.M.; Stroom, J.M. Summer heatwaves promote blooms of harmful cyanobacteria. Global Chang. Biol. 2008, 14, 495–512. [Google Scholar] [CrossRef]
  53. Webster, I.T. Effect of wind on the distribution of phytoplankton cells in lakes. Limnol. Oceanogr 1990, 35, 989–1001. [Google Scholar] [CrossRef]
  54. Zhang, M.; Kong, F.; Wu, X.; Xing, P. Different photochemical responses of phytoplankters from the large shallow taihu lake of subtropical China in relation to light and mixing. Hydrobiologia 2008, 603, 267–278. [Google Scholar] [CrossRef]
  55. Dai, A.; Deser, C. Diurnal and semidiurnal variations in global surface wind and divergence fields. J. Geophys. Res. 1999, 104, 109–131. [Google Scholar] [CrossRef]
  56. Oliver, R.L.; Ganf, G.G. Freshwater blooms. In The Ecology of Cyanobacteria; Whitton, B.A., Potts, M., Eds.; Springer: Dordrecht, The Netherlands, 2000; pp. 149–194. [Google Scholar]

