Abstract
The aim of this paper is to propose a methodology combing multi-temporal X-band SAR images (TerraSAR-X) with continuous ground thetaprobe measurements, for the retrieval of surface soil moisture and texture at a high spatial resolution. Our analysis is based on seven radar images acquired at a 36° incidence angle in the HH polarization, over a semi-arid site in Tunisia (North Africa). The soil moisture estimations are based on an empirical change detection approach using TerraSAR-X data and ground auxiliary thetaprobe network measurements. Two assumptions were tested: (1) roughness variations during the three-month radar acquisition campaigns were not accounted for; (2) a simple correction for temporal variations in roughness was included. The results reveal a small improvement in the estimation of soil moisture when a correction for temporal variations in roughness is introduced. By considering the estimated temporal dynamics of soil moisture, a methodology is proposed for the retrieval of clay and sand content (expressed as percentages) in soil. Two empirical relationships were established between the mean moisture values retrieved from the seven acquired radar images and the two soil texture components over 36 test fields. Validation of the proposed approach was carried out over a second set of 34 fields, showing that highly accurate clay estimations can be achieved. Maps of soil moisture, clay and sand percentages at the studied site are derived.
1. Introduction
Physical soil parameters play an essential role in the functioning of the continental water cycle. Soil moisture is a key parameter that can be used for multi-domain applications, hydrology and agronomy in particular. In the case of semi-arid and arid regions, this parameter is particularly important for water resources and irrigation management decisions, understanding land surface processes, and estimating runoff and soil erosion potential [1]. Spatio-temporal soil moisture information is increasingly used as input or a means of validation for multi-hydrological water balance models [2]. The spatial distribution of water in the soil varies both vertically and laterally, as a consequence of variations in precipitation and evapotranspiration, and the influences of topography, soil texture, and vegetation. The temporal variability of soil water properties can arise from factors such as texture, tillage, cropping and other management practices. These can adversely affect yield and complicate irrigation scheduling [3,4]. In order to optimize and protect water resources, which are often very limited, an accurate estimation of the soil’s water content is needed, to determine the expected evapotranspiration flux. Considerable efforts are thus devoted to improving the evaluation of evapotranspiration, and to understanding its relationship with the vegetation cover and the soil’s water content [5]. Soil texture is also an essential parameter, allowing pedotransfer functions to be determined, from which hydrodynamic soil parameters such as the wilting point, field capacity and saturated hydraulic conductivity can be derived. Soil particle sizes are classified into three textural groups, based on their physical dimensions: sand (2.0–0.5 mm), silt (0.5 mm–2 µm), and clay (soil fraction <2 µm). The water retention characteristics of soils are highly dependent on their particle size distribution. The variability of a soil’s texture, its clay content in particular, thus has a significant influence on its spatial moisture distribution and can lead to difficulties when interpreting soil moisture measurements recorded over large areas for the purposes of irrigation scheduling decisions.
Clay content is considered to be the most relevant parameter, since it is related to the exchange capacity of soils [6,7], has a strong influence on the soilʼs hydraulic properties such as water storage and availability for crop plants, field capacity and wilting point, and is the first statistical factor to be taken into account when building pedotransfer functions [8,9]. Soil property products could be integrated into intelligent irrigation algorithms in the field of smart agriculture, thereby contributing to an improvement in the accuracy of numerical model forecasting, or hydrological models used for water predictions [10].
Imaging Synthetic Aperture Radar (SAR) sensors have demonstrated their potential for the effective measurement and monitoring of soil surface characteristics at a high spatial resolution [2,3,4,5,6,7,8]. Over bare agricultural areas, the backscattered radar signal is very sensitive to the soil’s dielectric constant (soil moisture) [11,12,13,14,15,16,17,18,19,20]. For bare soils, various theoretical and empirical approaches have been developed to analyze the relationship between surface parameters and radar signals [21,22,23,24,25,26]. Among these, the “linear approach” linking surface soil moisture to calibrated SAR measurements (SIRC, ERS, RADARSAT, ASAR, TerraSAR-X) is widely used [14,27,28]. In recent years, different operational algorithms based on a change detection approach have been proposed to map soil moisture. This is particularly relevant for low and medium spatial resolutions (active microwave) [29,30].
For the estimation of soil textures, different methodologies have also been proposed in recent decades, using specific multi- and hyper-spectral optical sensors [7,31,32,33]. Numerous experimental studies have shown that the soil texture has only a very limited influence on radar signals, such that it may not be possible to directly retrieve one component of soil texture from such data. However, in recent years qualitative relationships have been observed between soil texture and high frequency X-band radar measurements [18,19]. In this context, Zribi et al., (2012) [34] developed an empirical inversion approach, allowing the soil clay content to be estimated from processed TerraSAR-X radar signals. The proposed methodology evaluates the rate at which the observed surface dries following a rainfall event, and uses this to determine the percentage of clay in the soil. An accuracy equal to 120 g/kg was retrieved.
In recent years, various approaches have been proposed for soil moisture monitoring, whereas fewer studies have concentrated on the analysis of soil texture. The aim of this paper is to demonstrate that it is possible to retrieve both of these soil parameters (moisture and texture) from the same experimental campaign, using a single radar signal configuration (one incidence angle, one polarization). The present paper proposes an empirical algorithm based on the use of high-resolution radar TerraSAR-X observations, along with point-measurements based on coarse grid observations, to determine the soil moisture and texture at the spatial resolution of the radar data. A change detection method has been proposed and implemented in this study as a convenient way to determine these soil parameters.
Our paper is organized into five sections. The next section presents the database and ground measurements used in the proposed study. Section 3 explains the methodologies used for soil moisture estimations, and validation of the results based on comparisons between the estimations and in situ measurements. Section 4 describes the approach used for soil texture retrieval. Conclusions and perspectives from this study are discussed in Section 5.
2. Datasets and Study Site
2.1. Study Site Description
Our study site is situated in the Kairouan plain (9°23ʹ−10°17ʹE, 35°1ʹ−35°55ʹN, in Central Tunisia. The climate in this region is semi-arid, with an average annual rainfall of approximately 300 mm/year, characterized by a rainy season lasting from October to May, with the two rainiest months being October and March [17]. As is generally the case in semi-arid areas, the rainfall patterns in this area are highly variable over time and space. The mean temperature in Kairouan City is 19.2 °C (minimum of 10.7 °C in January and maximum of 28.6 °C in August). The mean annual potential evapotranspiration (Penman) is close to 1600 mm. The landscape is mainly flat. The vegetation in this area is dominated by agriculture (cereals, olive trees, and market gardens). Various crops are grown, and their rotation is typical of semi-arid regions.
2.2. Satellite Images
Seven TerraSAR-X images (X-Band ~9.65 GHz) were acquired (HH polarization, incidence angle of 36°). Table 1 summarizes the main characteristics of the SAR images recorded at the Kairouan site. All of the TSX images correspond to a “Single-look Slant Range Complex: SSC” TSX product with a Single-look complex format, having a ground pixel spacing of approximately 2 m. The SAR images were firstly multi-looked to reduce speckle using the NEST software (https://earth.esa.int/web/nest/home/). For all images, five looks were used in the azimuth and range directions (resulting pixel size ~ 9 × 9 m2). The images were then radiometrically calibrated to derive the backscattering coefficients σ0, and then geo-referenced using the SRTM 3Sec as a DEM (Auto download in NEST software). The mean radar signals were computed for each test field.

Table 1.
Main characteristics of the X-band SAR images: Pol: Polarization, Inc: Incidence Angle, Desc: Descendant and Asc: Ascendant.
| Nr | Sensor | Date of Acquisition (dd/mm/yyyy) | Acquisition Time (UTC) | Acquisition Mode | Pol Mode | Inci. | Orbit | Geometric Resolution (m) |
|---|---|---|---|---|---|---|---|---|
| 1 | TSX | 09/11/2013 | 17:13:34 | Spotlight | HH | 36° | Asc | 1.8 |
| 2 | TSX | 20/11/2013 | 17:13:34 | Spotlight | HH | 36° | Asc | 1.8 |
| 3 | TSX | 01/12/2013 | 17:14:17 | Spotlight | HH | 36° | Asc | 1.8 |
| 4 | TSX | 12/12/2013 | 17:14:17 | Spotlight | HH | 36° | Asc | 1.8 |
| 5 | TSX | 23/12/2013 | 17:14:16 | Spotlight | HH | 36° | Asc | 1.8 |
| 6 | TSX | 14/01/2014 | 17:14:15 | Spotlight | HH | 36° | Asc | 1.8 |
| 7 | TSX | 25/01/2014 | 17:14:15 | Spotlight | HH | 36° | Asc | 1.8 |
2.3. Ground Measurements
All ground measurements of surface soil parameters were carried out over several bare soil reference fields located at the Kairouan site. Between November 2013 and January 2014 (three months), ground campaigns were carried out at the same time as the seven satellite acquisitions. Fifteen bare soil reference fields were considered for soil moisture ground measurements, with different types of roughness ranging from smooth to ploughed surfaces. The surface areas of these study fields ranged between 1.6 and 17 ha. The ground measurements made on the test fields involved the characterization of the following soil parameters: soil moisture using a theta-probe instrument, soil roughness using a pin profiler, soil bulk density and soil texture.
2.4. Soil Moisture
For each test field, approximately 20 handheld thetaprobe measurements were made at a depth of 5 cm. The samples were taken from various locations in each reference field, within a two-hour time frame between 3:40 p.m. and 5:40 p.m., coinciding with the time of each overhead satellite acquisition. The thetaprobe measurements were calibrated with gravimetric measurements recorded during previous campaigns [17]. The volumetric moisture “mv” ranged between 4.7% and 31.6 vol. % for all the taprobe measurements (Table 2).
Over the studied site, in addition to the moisture measurements carried out in test fields, a network of seven continuous thetaprobe stations, installed in bare soil locations, provided moisture measurements every 3 h (Figure 1). At each station, the measurements were made at depths of 5 and 40 cm.
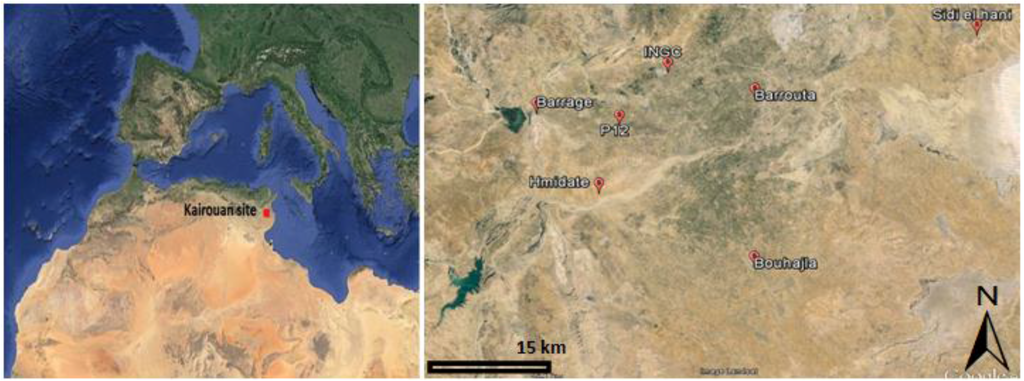
Figure 1.
Localization of the study site and the seven continuous thetaprobe stations.
2.5. Soil Roughness
The surface geometry was characterized by means of a 1 m long pin profiler with a resolution of 2 cm. Ten roughness profiles, five parallel and five perpendicular to the tillage row direction, were established in all reference fields during three different ground campaigns. Two main surface roughness parameters, the root mean square surface height (Hrms) and the correlation length (l), were determined from the mean correlation function, which was computed from the digitized soil profiles. Table 2 provides the ranges of soil roughness for three experimental campaigns. It is important to note that sowing is generally carried out after the first rainfall, between the end of October and the beginning of November. As a consequence, the soil roughness dynamics during experimental campaigns are generally related to soil degradation. Table 2 summarizes the results of the ground measurements made during the campaigns.
Table 2.
Ground measurements (volumetric moisture “mv” and roughness) ranges during experimental campaigns.
| Date (dd/mm/yy) | Soil Moisture Range (%) | Soil Roughness Range (cm) |
|---|---|---|
| 09/11/13 | 4 < mv < 9 | 0.54 < s < 3.2 2.5 < l < 6.4 |
| 20/11/13 | 6 < mv < 12 | - |
| 01/12/13 | 5 < mv < 11 | - |
| 12/12/13 | 5 < mv < 9 | 0.49 < s < 3.4 2.3 < l < 7.4 |
| 23/12/13 | 20 < mv < 30 | - |
| 14/01/14 | 13 < mv < 23 | - |
| 25/01/14 | 7 < mv < 18 | 0.38 < s < 1.9 3.5 < l < 8 |
2.6. Soil Texture
Soil texture measurements were carried out not only in the fifteen test fields selected for the development of our soil moisture methodology, but also in 55 different fields, in order to take a large range of soil textures into consideration. For each test field, three soil samples were collected for texture characterization. Various measurements were made in the laboratory, to determine the percentages of sand, silt and clay particles, characterizing the soil’s texture. The clay percentages ranged between 2.4% and 53.1% and the sand percentages ranged between 4.4% and 84.3%.
3. Soil Moisture Retrieval
We propose an algorithm based on the change detection method for the retrieval of surface bare soil moisture at a high spatial resolution. This approach takes advantage of the approximately linear dependence of radar backscattering signals (in decibels) on soil moisture [28,35]. The linear relationship is modeled as:
where S0 is the radar signal’s sensitivity to soil moisture (mv) and f(R) is a function of the roughness R.
In this study, two approaches to the implementation of the change detection method are considered. With the first of these, roughness variations are assumed to be negligible during the radar acquisition campaigns. In the second approach, a simple correction is introduced in order to take the temporal variations in roughness into account.
3.1. Methodology Description
3.1.1. Negligible Roughness Effect
We make the assumption that, during the experimental campaign, changes in soil roughness are insignificant in terms of any temporal change in the co-polarized, backscattered radar signal at the local scale. Soil roughness variations are mainly due to surface degradation that occurs after sowing, generally at the beginning of autumn (from the end of October to early November). Under this assumption, the difference between radar signals obtained by subtracting consecutive radar backscatter images acquired over a given area would be:
where Δmv is the difference in soil moisture between two successive image acquisitions (11 day period for the present study).
This can be rewritten as:
The change in soil moisture at the scale of a TerraSAR-X image, between two successive acquisitions, can be expressed as the average change over all of the image pixels:
where is the moisture variation for each pixel. This can be rewritten as:
S0 is estimated using Δσ0 derived from TerraSAR-X images, and derived from moisture measurements produced by the network of seven thetaprobe stations covering the image scene. For each pair of successive images, we estimate the difference between the mean radar signals calculated for each of the entire radar images, over a bare soil mask. Figure 2 shows the global land use map estimated from an optical SPOT/HRV image acquired on 25 November 2013. In order to retrieve the appropriate bare soil class, an empirical NDVI offset equal to 0.21 was applied.
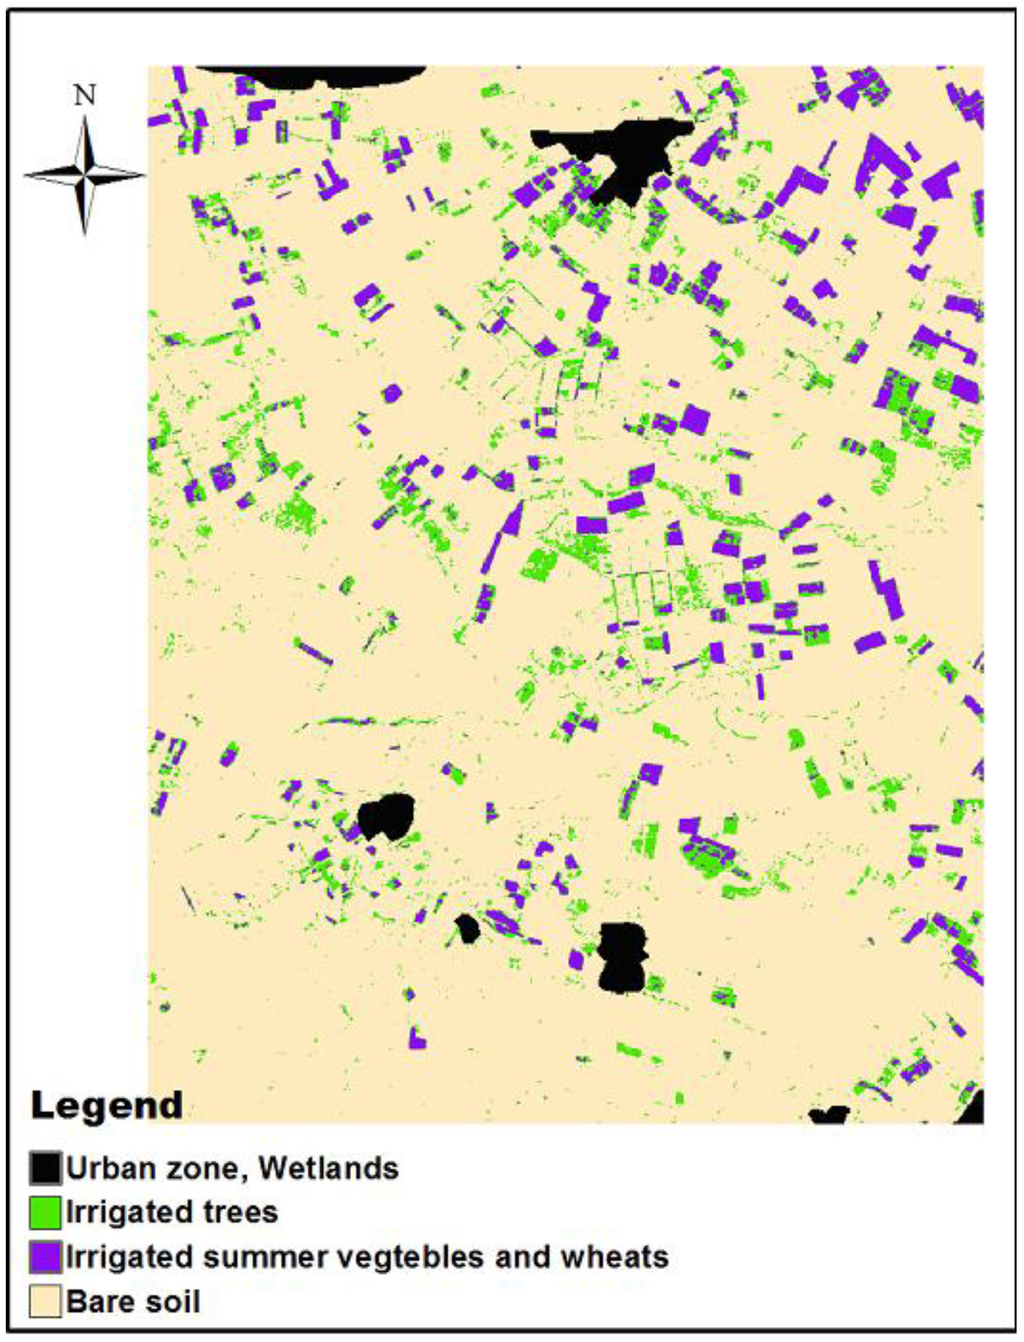
Figure 2.
Land use map.
In this case, as a consequence of the small number of radar acquisitions (seven), we divide the full image into three sub-images with appreciably different soil textures, in order to increase the number of conditions. Figure 3 illustrates the linear relationship between the change in mean radar signal and applied to the three sub-images for all successive radar images (11 days), and corresponding to a total of eighteen combinations. S0 is, thus, computed to be equal to 0.21 dB/vol. %.
This value of S0 at the studied site can be applied at the spatial resolution of the radar images, and for each pixel within the studied region.
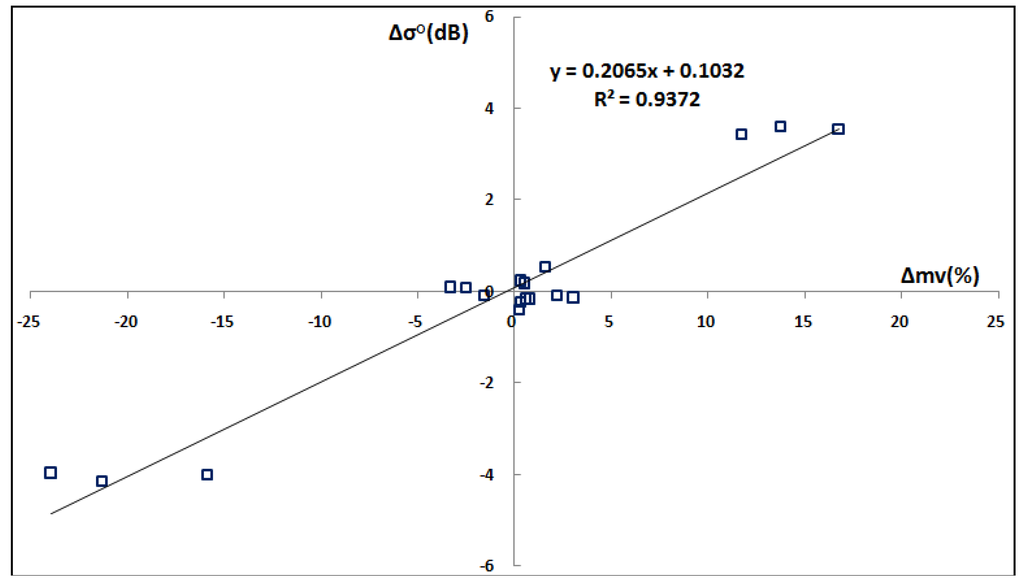
Figure 3.
Mean radar signal difference separated into three sub-images, between two successive radar images (over bare soil) Δσ (dB) as a function of moisture variations Δmv(%), applied to 7 successive radar images.
3.1.2. Considered Roughness Effect
It has been shown that the accuracy with which soil moisture can be retrieved by inverse backscattering models is affected by the influence of the surface roughness parameter on backscattered radar signals [11,30,35,36,37,38,39]. When only one radar configuration is used (HH, 36° incidence angle), it is not possible to extract both soil moisture and roughness, without making additional assumptions. In order to take the roughness effect into account, we initially analyzed radar images acquired on the driest days. For these images, it was assumed that the soil moisture was approximately constant, and that any spatial variability in the radar signals was produced by differences in surface roughness. During the experimental campaign, two TerraSAR images were acquired under very dry conditions (9 November, and 12 December 2013). Low moisture values, equal to approximately 5 vol. %, were recorded on these two dates by the thetaprobe stations. Ground measurements in the fifteen test fields also indicated low soil moistures, associated with a standard deviation of less than 1 vol. %. We, thus, consider that on these two dates, the spatial heterogeneity was related to roughness variations only, such that the difference between the two images acquired on these two dates arise from changes in roughness only.
Figure 4 illustrates the relationship between Δσ (between the two acquisition dates) and ΔR (∆Hrms), for the different test fields. An approximately linear relationship is observed between the radar signals and roughness variations. When significant changes are observed in the radar signals from the test fields, these are due to a decrease in roughness resulting from soil degradation with erosion and runoff.
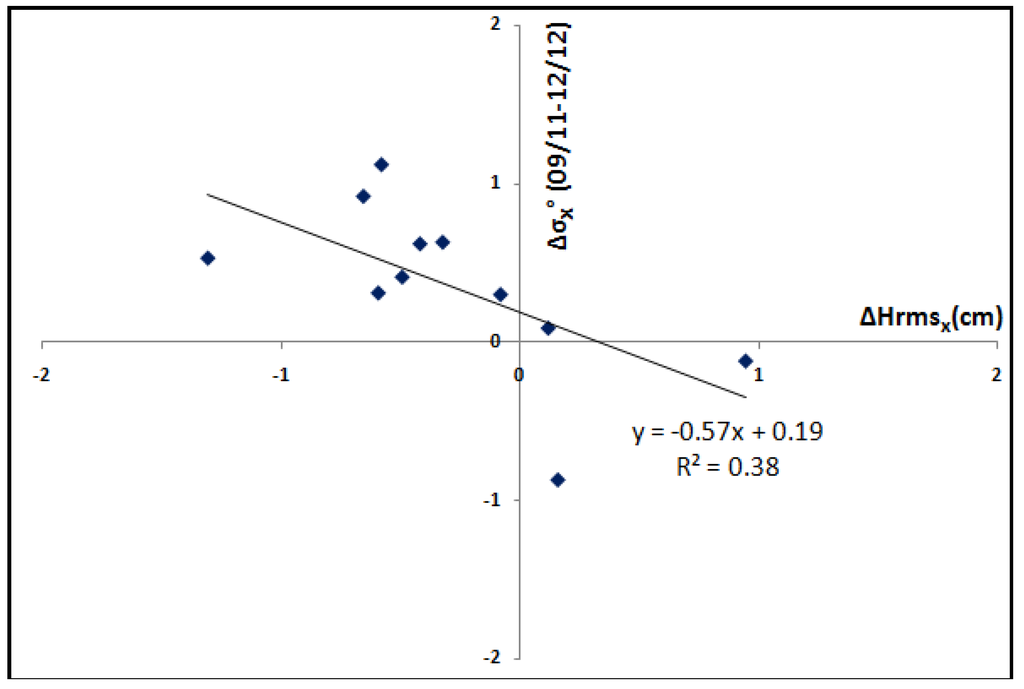
Figure 4.
Relationship between temporal variations in radar signal (ΔσX°) and soil roughness changes (ΔΗrmsX) over test fields, between the two driest images (9 November, and 12 December 2013).
We then considered local roughness variations, making the assumption that the global mean roughness level in the region remained almost stable during the experimental campaigns. This assumption could be validated by comparing the radar signal distributions corresponding to the two driest images recorded over bare soils. Almost the same mean (respectively −11.2 and −11.1 dB) and RMS (respectively 1.6 dB and 1.5 dB) were observed for the signals in these two images. The influence of roughness is, thus, introduced without modifying the sensitivity (S0) retrieved from the thetaprobe stations.
Using Equations (1) and (6), the local moisture variation at the scale of a single pixel can be written as:
where Δf(R) is the difference in radar signal resulting from roughness contributions, between two successive radar images.
For the present application, g(R) is the substation of radar signals corresponding to the two driest images. The difference between these two images is assumed to correspond to a simple, linear temporal variation in radar signal (measured in dB) over the period of time separating these image acquisitions.
This can be written:
where t (days) is the period between two successive images, and T is the period between the two driest images.
3.2. Soil Moisture Mapping and Validation Results
3.2.1. Moisture Estimation
For each date dt and each pixel (i, j), the soil moisture was estimated as:
where is the soil moisture at pixel (i,j) and date dt, is the soil moisture at pixel (i,j) and date dt-1,and is the temporal difference in soil moisture between the dates at pixel (i,j).
As discussed in Section 1, the soil moisture is considered to remain constant on the driest day. This is taken to be the mean value of the soil moisture measured by the ground thetaprobes. In the present case, the driest date (9 November 2013) is considered to represent the initial level of soil moisture, for the purposes of estimating soil moistures on other dates through the use of Equation (11).
3.2.2. Validation and Mapping
The proposed algorithms are validated by comparing the radar estimations with ground-truth measurements made in test fields characterized by soil moistures ranging between dry and wet conditions. Figure 5 shows the results of validation of the soil moisture retrieval algorithm, using two approaches, i.e., with and without the use of corrections for roughness variations. A very good agreement is found between the radar signal estimations and the ground measurements for both cases, with the RMSE equal to 3.3% (3.8%), and the bias equal to −0.3% (0.5%) respectively, when the roughness is (is not) taken into account.
A small improvement in the accuracy of the soil moisture estimations is observed when roughness variations are taken into account. The test fields used for validation of our algorithm are classed into two different datasets, with the first corresponding to low moisture values and the second to high values. This behavior is related to the climatic conditions of semi-arid regions, with a limited number of rainfall events and very high evaporation, leading to fast drying of the soil surfaces and a low probability of retrieving medium moisture levels.
All of the pixels in the bare soil class are considered to be valid candidates for soil moisture mapping. However, a radar signal from a small number of neighboring pixels is needed in order to minimize the addition of speckle noise to the results. We, thus, considered 3 × 3 pixel windows (approximately 0.07 ha) for the computation of effective radar signals in the bare soil class, and these were then used to estimate the soil moisture.
Approximately the same behaviors are also observed when moisture changes between successive radar acquisitions are considered (Figure 6). We observe a high level of agreement between estimations and ground measurements, with and without the use of corrections for variations in roughness.
Figure 7 shows the resulting soil moisture maps computed over bare soils at different dates. For wet days corresponding to rainfall events, such as that of 23 December 2013 (38.6 mm recorded by rain-gauges on 23 December 2013), a high soil moisture level is observed for all bare soil fields, with a mean value equal to 25.8%. On dates characterized by medium values of soil moisture, such as 14 January 2014 (18%), highly heterogeneous moisture values are observed. On dry dates, such as 20 November 2013, the spatial variations of soil moisture are less significant.
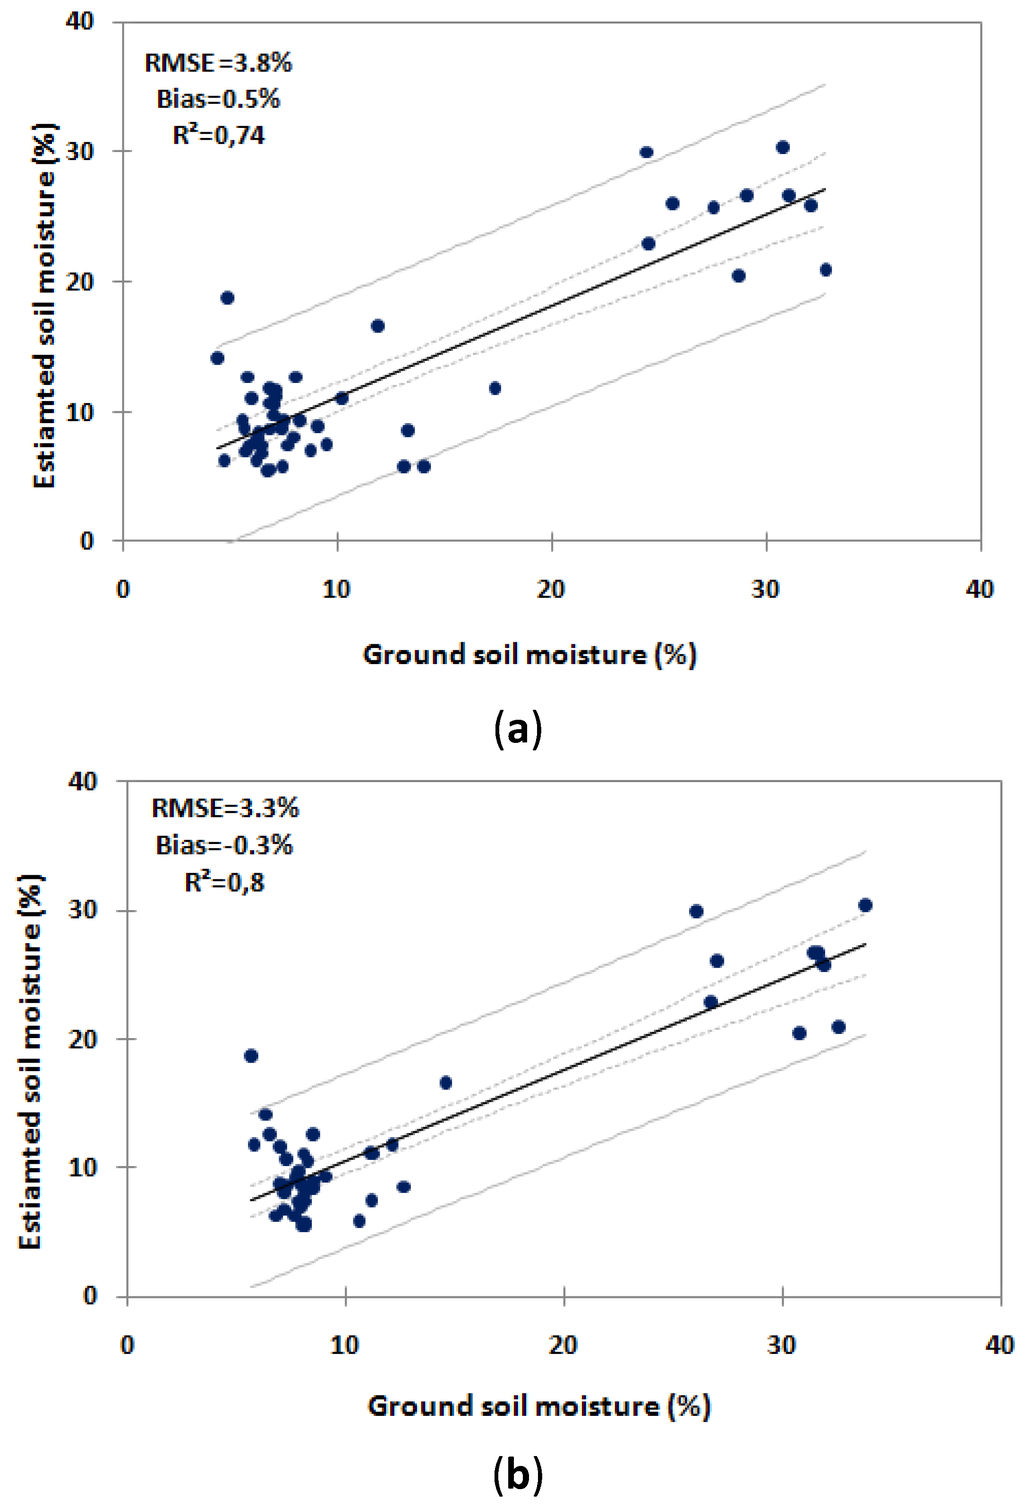
Figure 5.
Validation of the two proposed change detection approaches over 15 test fields (each point corresponds to one moisture condition in one test field): (a) assuming no change in roughness; (b) taking roughness changes into account.
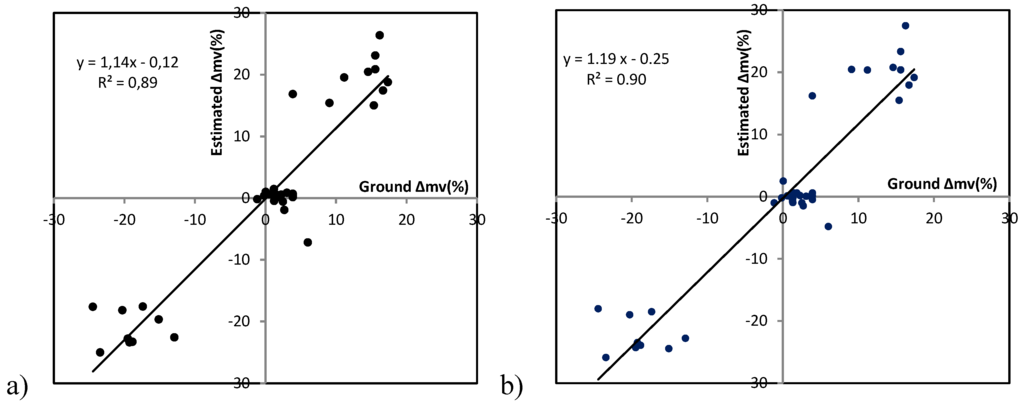
Figure 6.
Validation of the two proposed change detection approaches over 15 test fields (each point corresponds to one moisture change between two successive images in one test field): (a) assuming no change in roughness; (b) taking roughness changes into account.
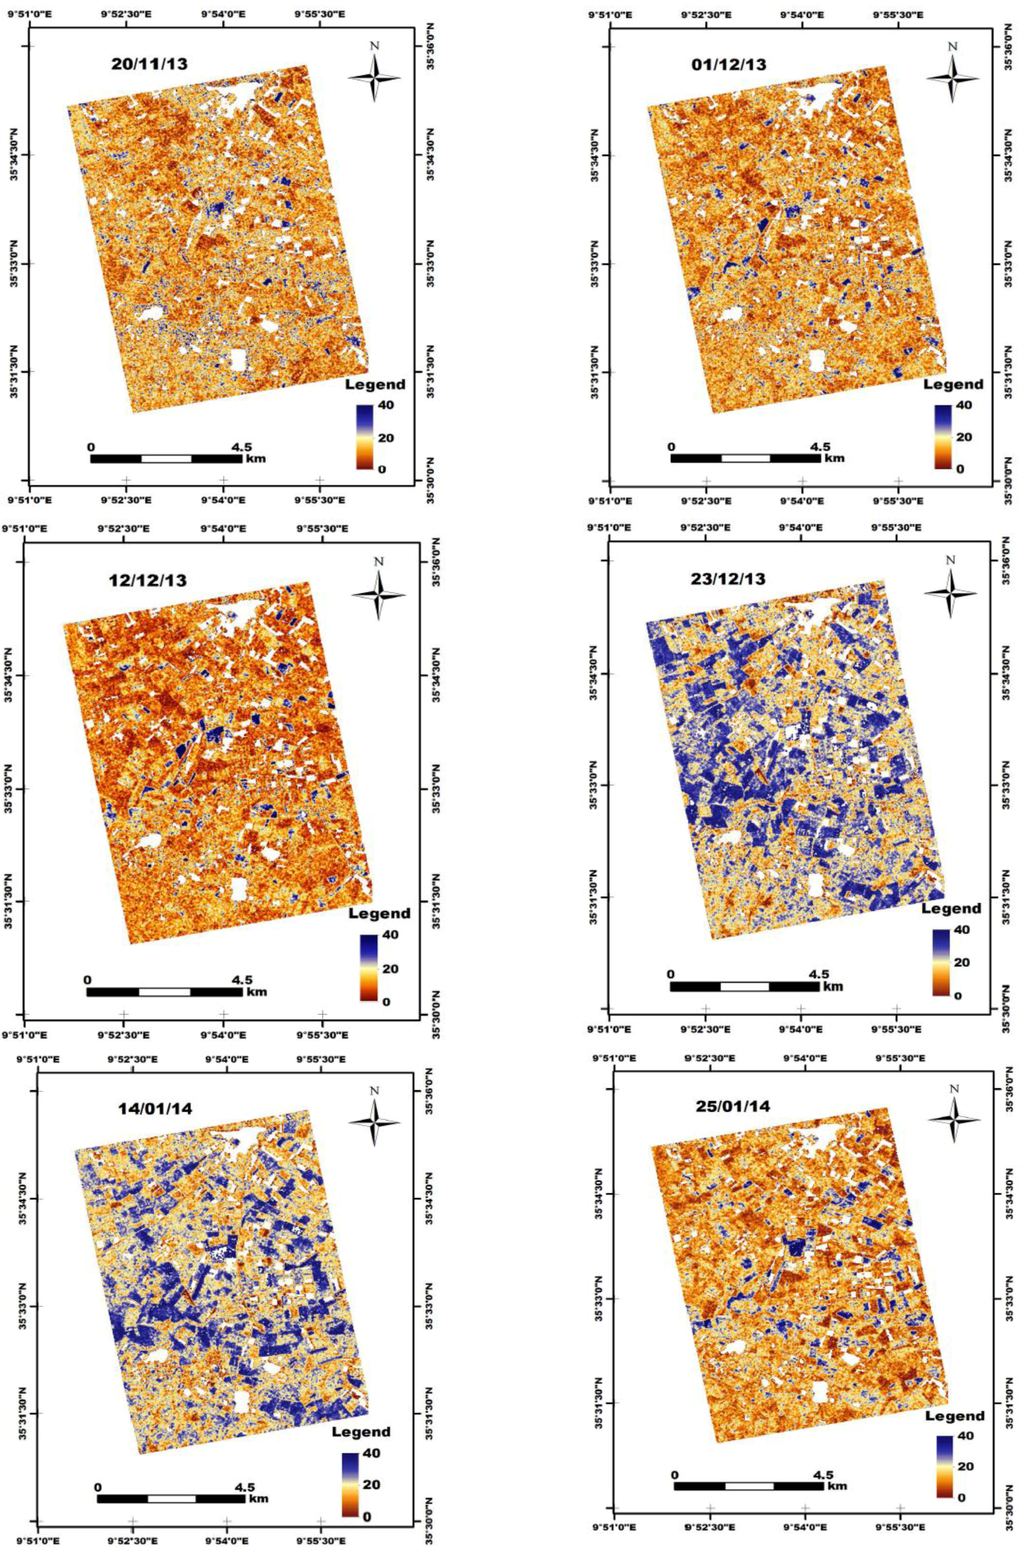
Figure 7.
Soil moisture mapping on six different dates.
4. Soil Texture Retrieval
4.1. Methodology
Soil texture is a function of the composite fractions of clay, silt and sand, from which it is made up. Fine-textured soils, especially clay soils, have a good water retention capacity. The size distribution of the voids in a soil depends mainly on the size distribution of the mineral particles it contains. For example, a soil comprising mainly sand-sized particles will have a high percentage of macro pores, which can drain freely. Soils having predominately sand-sized particles can hold the least amount of water, whereas soils having predominately clay-sized particles retain a much higher volume of water as a result of the predominance of micro-pores. In general, the smaller the size of a soil’s particles, the greater its volumetric water capacity [1,4,6,7,31,40]. In Zribi et al., (2012) [34], it was shown that there is a relationship between the measured decrease in intensity of backscattered radar signals due to evaporation and infiltration, and the fraction of clay present in the soil. This can be explained by the fact that clay soils dry more slowly than sandy soils. In the present study, seven soil moisture maps are derived from radar signals, over a period of three months. On the basis of the aforementioned characteristics and interactions of soil texture with soil moisture, we propose to develop a simple relationship between the soil’s mean level of moisture content and its texture (clay or sand), using the data corresponding to these seven maps. Figure 8 shows the linear relationship between the soil moisture determined from radar signals and the corresponding texture components (clay and sand) over 36 test fields.
It can be seen that the mean soil moisture clearly increases with increasing clay fraction, and decreases with increasing sand fraction, with correlations of R2 = 0.62, and R2 = 0.48, respectively. We observe a difference of approximately 5% in mean soil moisture for soils having a clay fraction between 10% and 48%, or a sand fraction between 7% and 58%. These results are of course coherent with the soil’s properties, as previously discussed.
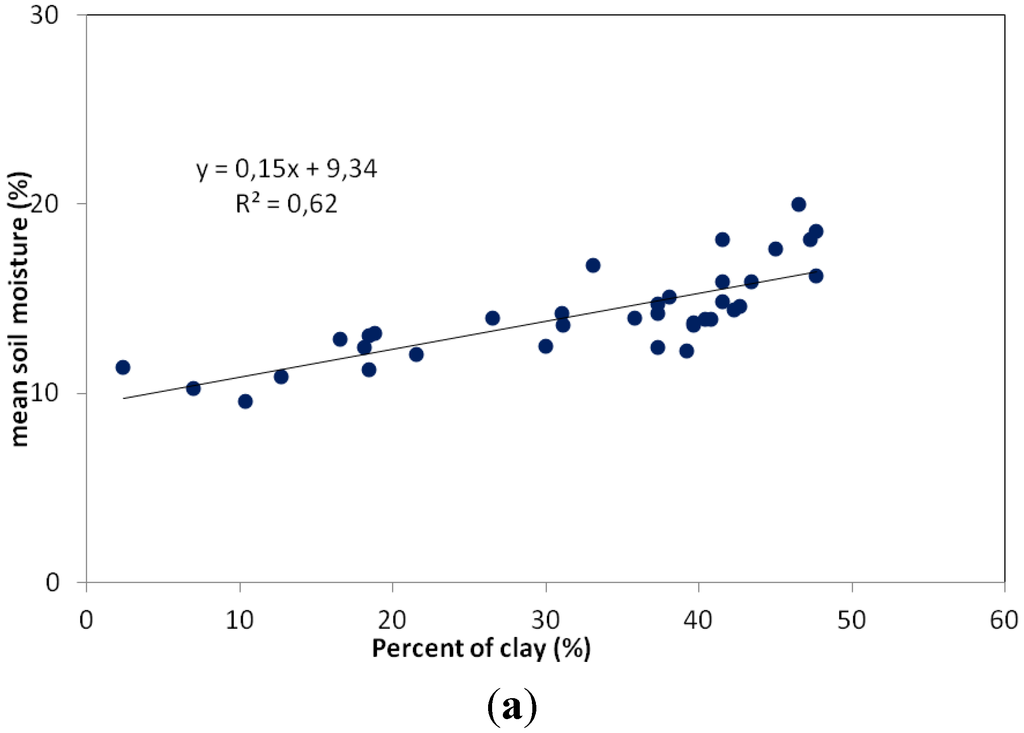
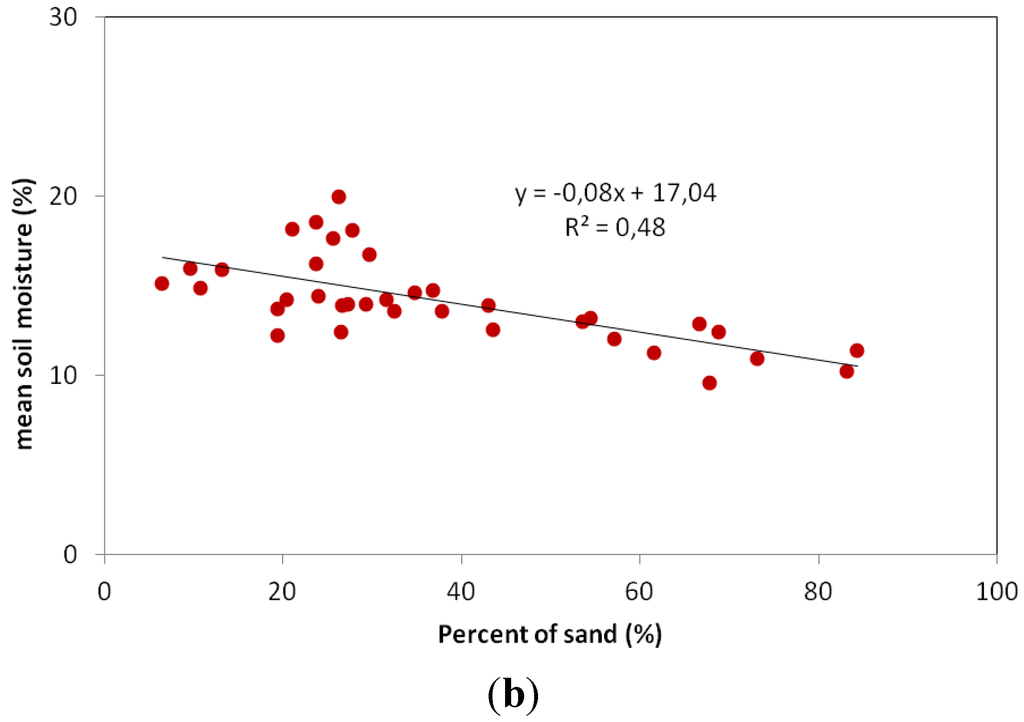
Figure 8.
Relationship between mean soil moisture, estimated from 7 radar moisture maps, and soil texture characteristics, for 34 test fields: (a) clay content (%); (b) sand content (%).
4.2. Validation
A second set of 34 test fields was used to validate the proposed empirical linear relationships between mean moisture content and clay or sand contents. Figure 9 and Figure 10 illustrate this validation by comparing radar-estimated values and ground measurements, over these test fields. In the case of the clay content a strong correlation is observed, with an RMSE equal to 10.8% (108 g/kg). In the case of the estimated sand content, the accuracy is lower with an RMSE equal to 18.6% (186 g/kg).
Following the process described above, it was possible to apply our validated model to the clay percentage map of these soils. On the basis of a land-use map, we took only bare soils into account. In order to eliminate the effects of local terrain heterogeneities and speckle in the radar signals, the soil’s clay content was estimated over cells defined by 3 × 3 pixel areas, corresponding to 27 × 27 m cells. Figure 11 shows the resulting soil clay map over the studied area. As confirmed by ground measurements, a generally lower percentage of clay and higher percentage of sand are observed in the soil of the olive groves.
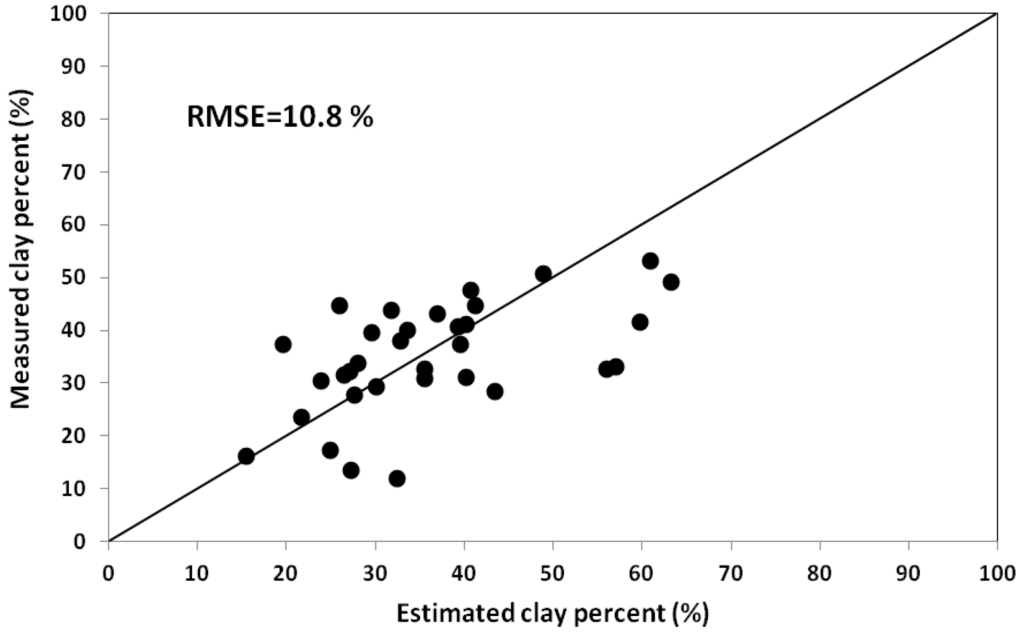
Figure 9.
Comparison between estimated and ground truth measurements of clay content over 34 test fields.
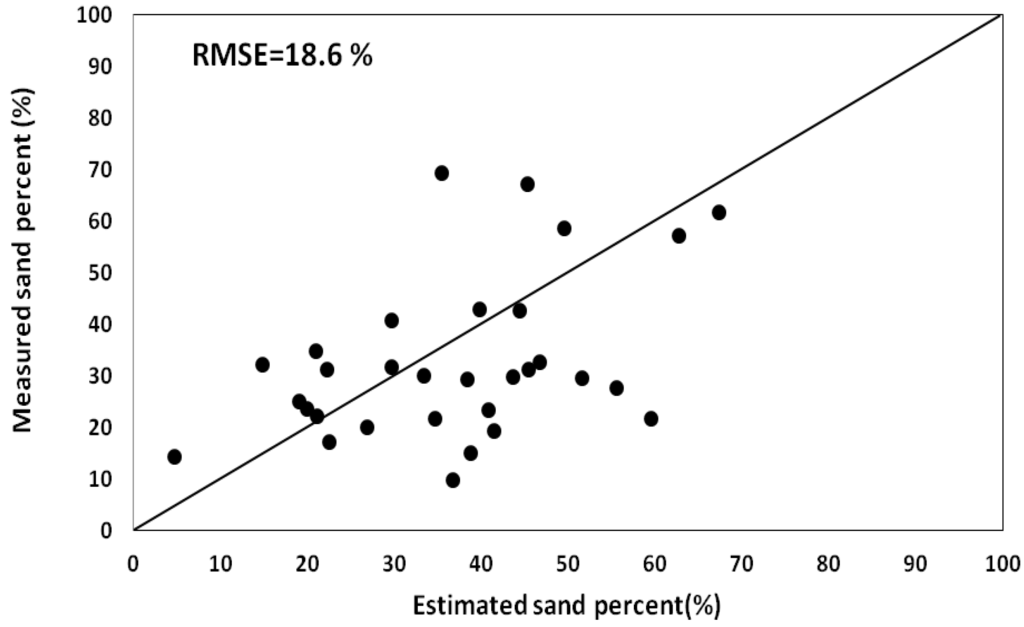
Figure 10.
Comparison between estimated and ground truth measurements of sand content over 34 test fields.
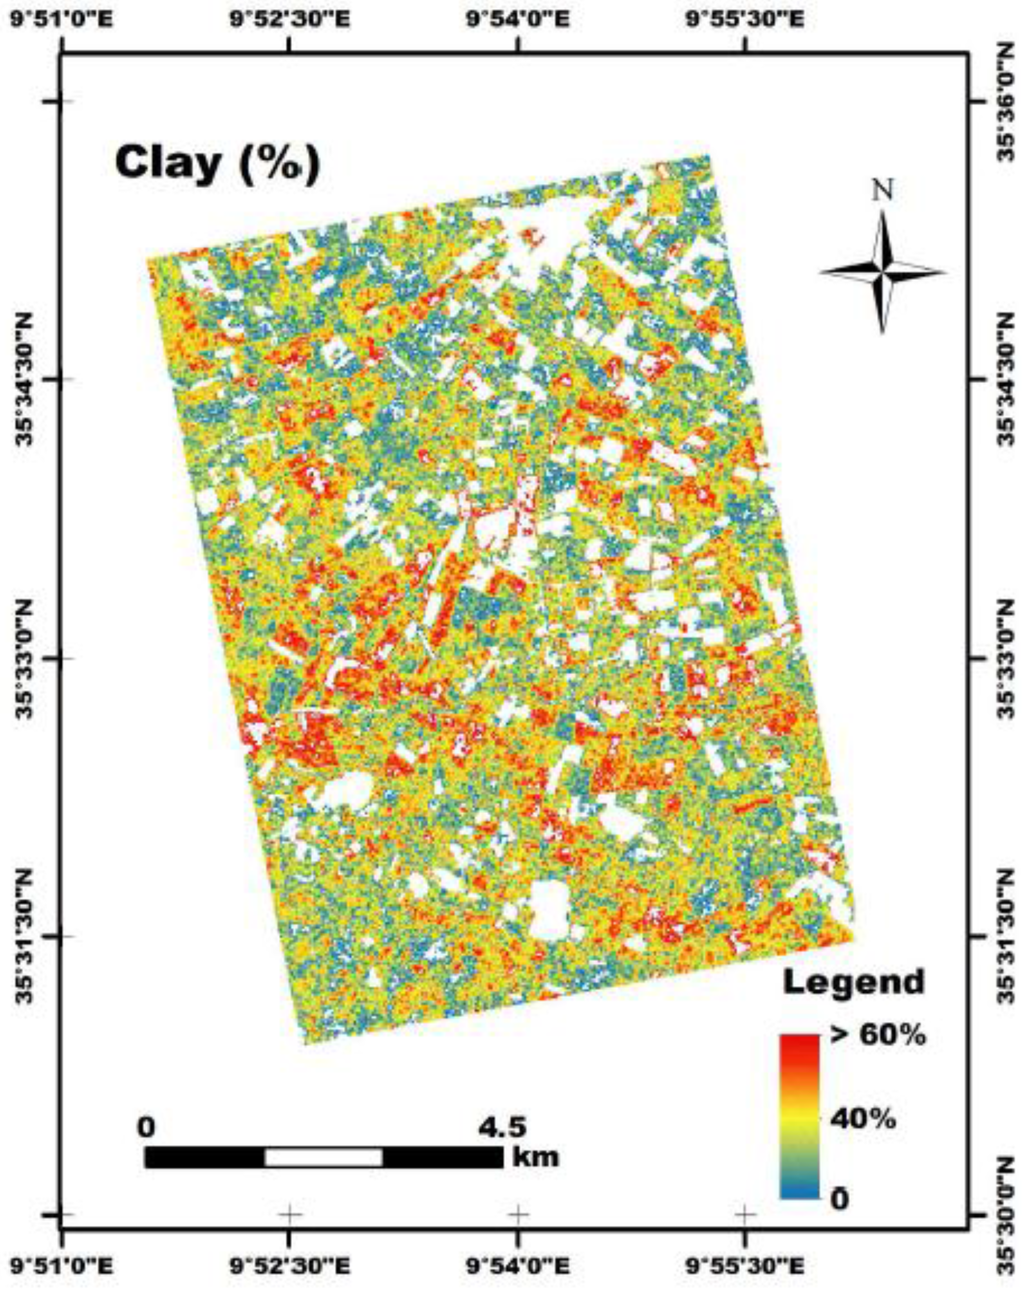
Figure 11.
Map of soil clay content.
5. Conclusions
This paper proposed and implemented a simple algorithm based on a change detection approach at the spatial resolution of the TerraSAR-X radar sensor, with auxiliary low-resolution estimates of soil moisture provided by a thetaprobe station network (seven points) installed on the studied site. The proposed approach allows the bare soil moisture and texture to be estimated, using multi-temporal radar acquisitions with just one configuration (one incidence angle, one polarization).
The first originality of this approach lies in the retrieval of two soil parameters (moisture and texture) using just one short wavelength SAR configuration.
A change detection methodology is applied, through the use of two different methods. The first of these considers moisture variations only, during the studied period, whereas the second includes the influence of temporal changes in roughness on the variability of soil moisture. In this case, it is assumed that variations in roughness make a linearly variable contribution to soil moisture over time. This effect is identified by using the driest images, for which roughness is the only parameter able to produce spatial variations in the radar signal.
For the two considered approaches, the soil moisture estimations were validated using ground measurements acquired over fifteen test fields, under different moisture conditions. These comparisons lead to a volumetric moisture RMSE equal to 3.8% and 3.3%, and a bias equal to 0.5% and 0.3%, respectively. A small improvement in estimation accuracy is achieved with the approach using roughness corrections.
A linear relationship was then established between ground-truth measurements of clay and sand content over 36 fields, and the mean value of moisture estimations from the seven processed dates, with a correlation coefficient, R2, equal to 0.62 and 0.48, respectively. This algorithm was validated by comparing radar estimations and ground truth observations over 34 fields. For clay and sand, we retrieve an rms error equal to 10.8% (equivalent to 108 g/kg) and 18.6% (equivalent to 186 g/kg), respectively. It is, thus, possible to accurately map the soil’s clay content. Optimal use of this approach could be made during the autumn, at the beginning of the rainy season: during this period, following the dry season, a high proportion of bare soils can be identified. As shown by other studies, although these empirical relationships are adapted to the proposed site, they would need to be calibrated for use at other test sites. In the case of surfaces having a vegetation cover, it should also be possible to implement the proposed algorithm, provided the vegetation is not affected by any changes during the experimental campaigns. This approach could also be applied to SENTINEL1 data, allowing moisture estimations to be made at a higher repeat rate. High-resolution data could be considered in synergy with low-resolution satellite moisture products (SMOS, ASCAT, SMAP, etc.), rather than with auxiliary products derived from ground measurements.
Acknowledgments
This study was funded by MISTRALS/SICMED, the ANR AMETHYST (ANR-12 TMED-0006-01) and TOSCA/CNES projects. We also wish to thank all of the technical teams of the IRD and INAT (Institut National Agronomique de Tunisie) for their strong collaboration and support with the implementation of ground-truth measurements. The authors wish to thank the German Space Agency (DLR) for kindly providing them with TSX images under proposal HYD0007.
Author Contributions
Azza Gorrab and Mehrez Zribi proposed methodology to use TerraSAR-X data to produce surface soil moisture and clay content maps over the Kairouan plain. Nicolas Baghdadi participated to results interpretation. Bernard Mougenot and Pascal Fanise participated to ground measurements. Zohra Lili Chabaane participated to experimental campaigns organization.
Conflicts of Interest
The authors declare no conflict of interest.
References
- Bezerra, B.G.; dos Santos, C.A.C.; da Silva, B.B.; Perez-Marin, A.M.; Bezerra, M.V.C.; Bezerra, J.R.C.; Ramana Rao, T.V. Estimation of soil moisture in the root-zone from remote sensing data. Rev. Bras. Ciênc. Solo 2013, 37, 596–603. [Google Scholar] [CrossRef]
- Pandey, V.; Pandey, P.K. Spatial and temporal variability of soil moisture. Int. J. Geosci. 2010, 1, 87–98. [Google Scholar] [CrossRef]
- Koster, R.D.; Dirmeyer, P.A.; Guo, Z.; Bonan, G.; Chan, E.; Cox, P.; Gordon, C.T.; Kanae, S.; Kowalczyk, E.; Lawrence, D.; et al. Regions of strong coupling between soil moisture and precipitation. Science 2004, 305, 1138–1140. [Google Scholar] [CrossRef] [PubMed]
- Zhang, X.; Zhang, X.; Li, G. The effect of texture and irrigation on the soil moisture vertical-temporal variability in an urban artificial landscape: A case study of Olympic Forest Park in Beijing. Front. Environ. Sci. Eng. 2015, 9, 269–278. [Google Scholar] [CrossRef]
- Simonneaux, V.; Duchemin, B.; Helson, D.; ER-Raki, S.; Olioso, A.; Chehbouni, A.G. The use of high-resolution image time series for crop classification and evapotranspiration estimate over an irrigated area in central Morocco. Int. J. Remote Sens. 2007, 29, 95–116. [Google Scholar] [CrossRef]
- Molin, J.P.; Faulin, G.D.C. Spatial and temporal variability of soil electrical conductivity related to soil moisture. Sci. Agric. 2013, 70, 1–5. [Google Scholar]
- Castaldi, F.; Casa, R.; Castrignanò, A.; Pascucci, S.; Palombo, A.; Pignatti, S. Estimation of soil properties at the field scale from satellite data: A comparison between spatial and non-spatial techniques. Eur. J. Soil Sci. 2014, 65, 842–851. [Google Scholar] [CrossRef]
- Frenkel, H.; Goertzen, J.O.; and Rhoades, J.D. Effects of clay type and content, exchangeable sodium percentage, and electrolyte concentration on clay dispersion and soil hydraulic conductivity. Soil Sci. Soc. Am. J. 1978, 42, 32–39. [Google Scholar] [CrossRef]
- Bresler, E. Analysis of trickle irrigation with application to design problems. Irrig. Sci. 1978, 1, 3–17. [Google Scholar] [CrossRef]
- Bastiaanssen, W.G.M.; Molden, D.J.; Makin, I.W. Remote sensing for irrigated agriculture: Examples from research and possible applications. Agric. Water Manag. 2000, 46, 137–155. [Google Scholar] [CrossRef]
- Ulaby, F.T.; Bradley, G.; Dobson, M.C. Microwave backscatter dependence on surface roughness, soil moisture, and soil texture. II—Vegetation-covered soil. IEEE Trans. Geosci. Electron. 1979, 17, 286–295. [Google Scholar] [CrossRef]
- Rao, P.V.N.; Raju, C.S.; Rao, K.S. Microwave remote sensing of soil moisture: Elimination of texture effect. IEEE Trans. Geosci. Remote Sens. 1990, 28, 1988–1991. [Google Scholar] [CrossRef]
- Morann, M.S.; Hymern, D.C.; Qin, J.; Sanon, E.E. Soil moisture evaluation using multi-temporal synthetic aperture radar (SAR) in semiarid rangeland. Agric. For. Meteorol. 2000, 105, 69–80. [Google Scholar] [CrossRef]
- Zribi, M.; Saux-Picart, S.; André, C.; Descroix, L.; Ottlé, O.; Kallel, A. Soil moisture mapping based on ARSAR/ENVISAT radar data over a Sahelian site. Int. J. Remote Sens. 2007, 28, 3547–3565. [Google Scholar] [CrossRef]
- Satalino, G.; Mattia, F.; Davidson, M.W.J.; le Toan, T.; Pasquariello, G.; Borgeaud, M. On current limits of soil moisture retrieval from ERS-SAR data. IEEE Trans. Geosci. Remote Sens. 2002, 40, 2438–2447. [Google Scholar] [CrossRef]
- Rahman, M.M.; Moran, M.S.; Thoma, D.P.; Bryant, R.; Holifield Collins, C.D.; Jackson, T.; Orr, B.J.; Tischler, M. Mapping surface roughness and soil moisture using multi-angle radar imagery without ancillary data. Remote Sens. Environ. 2008, 112, 391–402. [Google Scholar] [CrossRef]
- Zribi, M.; Chahbi, A.; Lili Chabaane, Z.; Duchemin, B.; Baghdadi, N.; Amri, R.; Chehbouni, A. Soil surface moisture estimation over a semi-arid region using ENVISAT ASAR radar data for soil evaporation evaluation. Hydrol. Earth Syst. Sci. 2011, 15, 345–358. [Google Scholar] [CrossRef]
- Baghdadi, N.; Zribi, M.; Loumagne, C.; Ansart, P.; Anguela, T.P. Analysis of TerraSAR-X data and their sensitivity to soil surface parameters over bare agricultural fields. Remote Sens. Environ. 2008, 112, 4370–4379. [Google Scholar]
- Aubert, M.; Baghdadi, N.; Zribi, M.; Douaoui, A.; Loumagne, C.; Baup, F.; El Hajj, M.; Garrigues, S. Analysis of TerraSAR-X data sensitivity to bare soil moisture, roughness, composition and soil crust. Remote Sens. Environ. 2011, 115, 1801–1810. [Google Scholar]
- Anguela, T.P.; Zribi, M.; Baghdadi, N.; Loumagne, C. Analysis of local variation of soil surface parameters with TerraSAR-X radar data over bare agricultural fields. IEEE Trans. Geosci. Remote. Sens. 2010, 48, 874–881. [Google Scholar] [CrossRef]
- Fung, A.K.; Li, Z.; Chen, K.S. Backscattering from a randomly rough dielectric surface. IEEE Trans. Geosci. Remote Sens. 1992, 30, 356–369. [Google Scholar] [CrossRef]
- Oh, Y.; Sarabandi, K.; Ulaby, F.T. An empirical model and an inversion technique for radar scattering from bare soil surfaces. IEEE Trans. Geosci. Remote Sens. 1992, 30, 370–382. [Google Scholar] [CrossRef]
- Dubois, P.; van Zyl, J.; Engman, T. Measuring soil moisture with imaging radars. IEEE Trans. Geosci. Remote Sens. 1995, 33, 915–926. [Google Scholar] [CrossRef]
- Zribi, M.; Dechambre, M. A new empirical model to retrieve soil moisture and roughness from Radar Data. Remote Sens. Environ. 2003, 84, 42–52. [Google Scholar]
- Gorrab, A.; Zribi, M.; Baghdadi, N.; Mougenot, B.; Lili Chabaane, Z. Potential of X-Band TerraSAR-X and COSMO-SkyMed SAR Data for the assessment of physical soil parameters. Remote Sens. 2015, 7, 747–766. [Google Scholar] [CrossRef]
- Thoma, D.P.; Moran, M.S.; Bryant, R.; Rahman, M.M.; Holifield Collins, C.D.; Keefer, T.O.; Noriega, R.; Osman, I.; Skrivin, S.M.; Tischler, M.A.; et al. Appropriate scale of soil moisture retrieval from high resolution radar imagery for bare and minimally vegetated soils. Remote Sens. Environ. 2008, 112, 403–414. [Google Scholar] [CrossRef]
- Quesney, A.; le H’egarat-Mascle, S.; Taconet, O.; Vidal-Madjar, D.; Wigneron, J.P.; Loumagne, C.; Normand, M. Estimation of watershed soil moisture index from ERS/SAR data. Remote Sens. Environ. 2000, 72, 290–303. [Google Scholar] [CrossRef]
- Le Hégarat-mascle, S.; Zribi, M.; Alem, F.; Weisse, A.; Loumagne, C. Soil moisture estimation From ERS/SAR Data : Toward an operational methodology. East 2002, 40, 2647–2658. [Google Scholar] [CrossRef]
- Wagner, W. Soil Moisture Retrieval from ERS Scatterometer Data; Vienna University of Technology: Vienna, Austria, 1998. [Google Scholar]
- Zribi, M.; Gorrab, A.; Baghdadi, N. A new soil roughness parameter for the modelling of radar backscattering over bare soil. Remote Sens. Environ. 2014, 152, 62–73. [Google Scholar] [CrossRef]
- Shabou, M.; Mougenot, B.; Lili Chabaane, Z.; Walter, C.; Boulet, G.; Ben Aissa, N.; Zribi, M. Soil clay content mapping using a time series of Landsat TM data in semi-arid lands. Remote Sens. 2015, 7, 6059–6078. [Google Scholar]
- Liu, F.; Geng, X.; Zhou, A.; Fraser, W.; Waddel, A. Soil texture mapping over low relief areas using land surface feedback dynamic patterns extracted from MODIS. Geoderma 2011, 171–172, 44–52. [Google Scholar]
- Casa, R.; Castaldi, F.; Pascucci, S.; Palombo, A.; Pignatti, S. A comparison of sensor resolution and calibration strategies for soil texture estimation from hyperspectral remote sensing. Geoderma 2013, 197–198, 17–26. [Google Scholar]
- Zribi, M.; Kotti, F.; Lili-Chabaane, Z.; Baghdadi, N. Soil texture mapping over a semi-arid area using TERRASAR-X radar data over a semi-arid area. IEEE Trans. Geosci. Remote Sens. Lett. 2012, 9, 353–357. [Google Scholar] [CrossRef]
- Le Morvan, A.; Zribi, M.; Baghdadi, N.; Chanzy, A. Soil moisture profile effect on radar signal measurement. Sensors 2008, 8, 256–270. [Google Scholar] [CrossRef]
- Zribi, M.; Baghdadi, N.; Holah, N.; Fafin, O.; Guérin, C. Evaluation of a rough soil surface description with ASAR-ENVISAT radar data. Remote Sens. Environ. 2005, 95, 67–76. [Google Scholar] [CrossRef]
- Davidson, M.W.; le Toan, T.; Mattia, F.; Satalino, G.; Manninen, T.; Borgeaud, M. On the characterization of agricultural soil roughness for radar remote sensing studies. IEEE Trans. Geosci. Remote Sens. 2000, 38, 630–640. [Google Scholar] [CrossRef]
- Verhoest, N.E.C.; Lievens, H.; Wagner, W.; Alvarez-Mozos, J.; Moran, M.S.; Mattia, F. On the soil roughness parameterization problem in soil moisture retrieval of bare surfaces from Synthetic Aperture Radar. Sensors 2008, 8, 4213–4248. [Google Scholar] [CrossRef]
- Lievens, H.; Vernieuwe, H.; Alvarez-Mozos, J.; de Baets, B.; Verhoest, N.E.C. Error in SAR-derived soil moisture due to roughness parameterization: An analysis based on synthetical surface profiles. Sensors 2009, 9, 1067–1093. [Google Scholar] [CrossRef] [PubMed]
- Mulder, V.L.; de Bruin, S.; Schaepman, M.E.; Mayr, T.R. The use of remote sensing in soil and terrain mapping—A review. Geoderma 2011, 162, 1–19. [Google Scholar] [CrossRef]
© 2015 by the authors; licensee MDPI, Basel, Switzerland. This article is an open access article distributed under the terms and conditions of the Creative Commons Attribution license (http://creativecommons.org/licenses/by/4.0/).