1. Introduction
In the last decade, satellite radar interferometry has been successfully applied as a remote-sensing tool to detect movements on the Earth’s surface due to its accuracy, high spatial resolution, non-invasiveness and long-term temporal coverage and sampling [
1,
2]. In addition, displacement information obtained through processing of space-borne radar images covers wide areas, so that mapping and monitoring ground instability is feasible, even at a regional scale.
In particular, advanced multi-temporal interferometric techniques that generate radar benchmarks using a multi-interferogram analysis of SAR (synthetic aperture radar) images,
i.e., persistent scatterer interferometry [
3], have been successfully used in the last few years for investigating active geological processes, such as landslides and subsidence [
4,
5,
6,
7,
8]. Persistent Scatterer Interferometry (PSI) relies on temporally stable and highly reflective ground elements, called PS (Persistent Scatterer), in correspondence with which yearly terrain motion rates can be measured with high precision. These scatterers are typically man-made structures (
i.e., buildings, pylons, roadways,
etc.) or natural elements (
i.e., rocks) with stable and strong backscattering and coherence characteristics [
9]. As a consequence, PSI data are particularly effective for urbanized areas where many radar benchmarks can be retrieved [
10]. Just on these populated and built-up areas, potential damages and losses caused by ground instability are stronger due to the higher value of the exposed elements at risk [
11].
In past research, space-borne advanced SAR interferometry has been used to map and monitor movements and related building deformations on landslide-prone and -affected areas [
11,
12,
13]. In particular, several works deal with the use of PS motion rates for detecting displacements in urbanized and cultural heritage sites [
14,
15,
16,
17,
18,
19], as well as for monitoring single urban structures [
20,
21].
In built-up areas, the effects of ground instability strongly redound on structures and infrastructures. The induced settlement and damage degree of buildings depend on their construction characteristics and on the geotechnical foundation ground properties. Therefore, some recent works combined InSAR tools with geotechnical features for identifying the potential occurrence of building damages [
22,
23,
24].
In particular, Sanabria
et al. in [
24] have proposed a method to develop a subsidence map by means of spatial interpolation of PSI displacement data acquired in the C-band, thus overcoming limitations related to the point-wise nature of PS information. This PSI-based methodology has been proven successful in identifying buildings susceptible to suffering subsidence-related damages in urban areas and estimating losses in terms of serviceability limit states.
Relying on the approach proposed by [
24], we have applied a similar procedure on the southwestern sector of Volterra (Tuscany, Italy), a partially urbanized area where ground instability threatens the urban fabric and historical heritage, as presented in [
25]. PSI data allowed us to locally detect the most unstable zones within the study area and consequently to identify the buildings subject to suffering terrain motions. The proposed PSI-based method allowed us to calculate the differential settlements of these buildings, overcoming the limitations due to the point-wise nature of PS information. The results were then compared and validated with background data and
in situ evidence to confirm the effectiveness of the proposed procedure.
2. Methodology
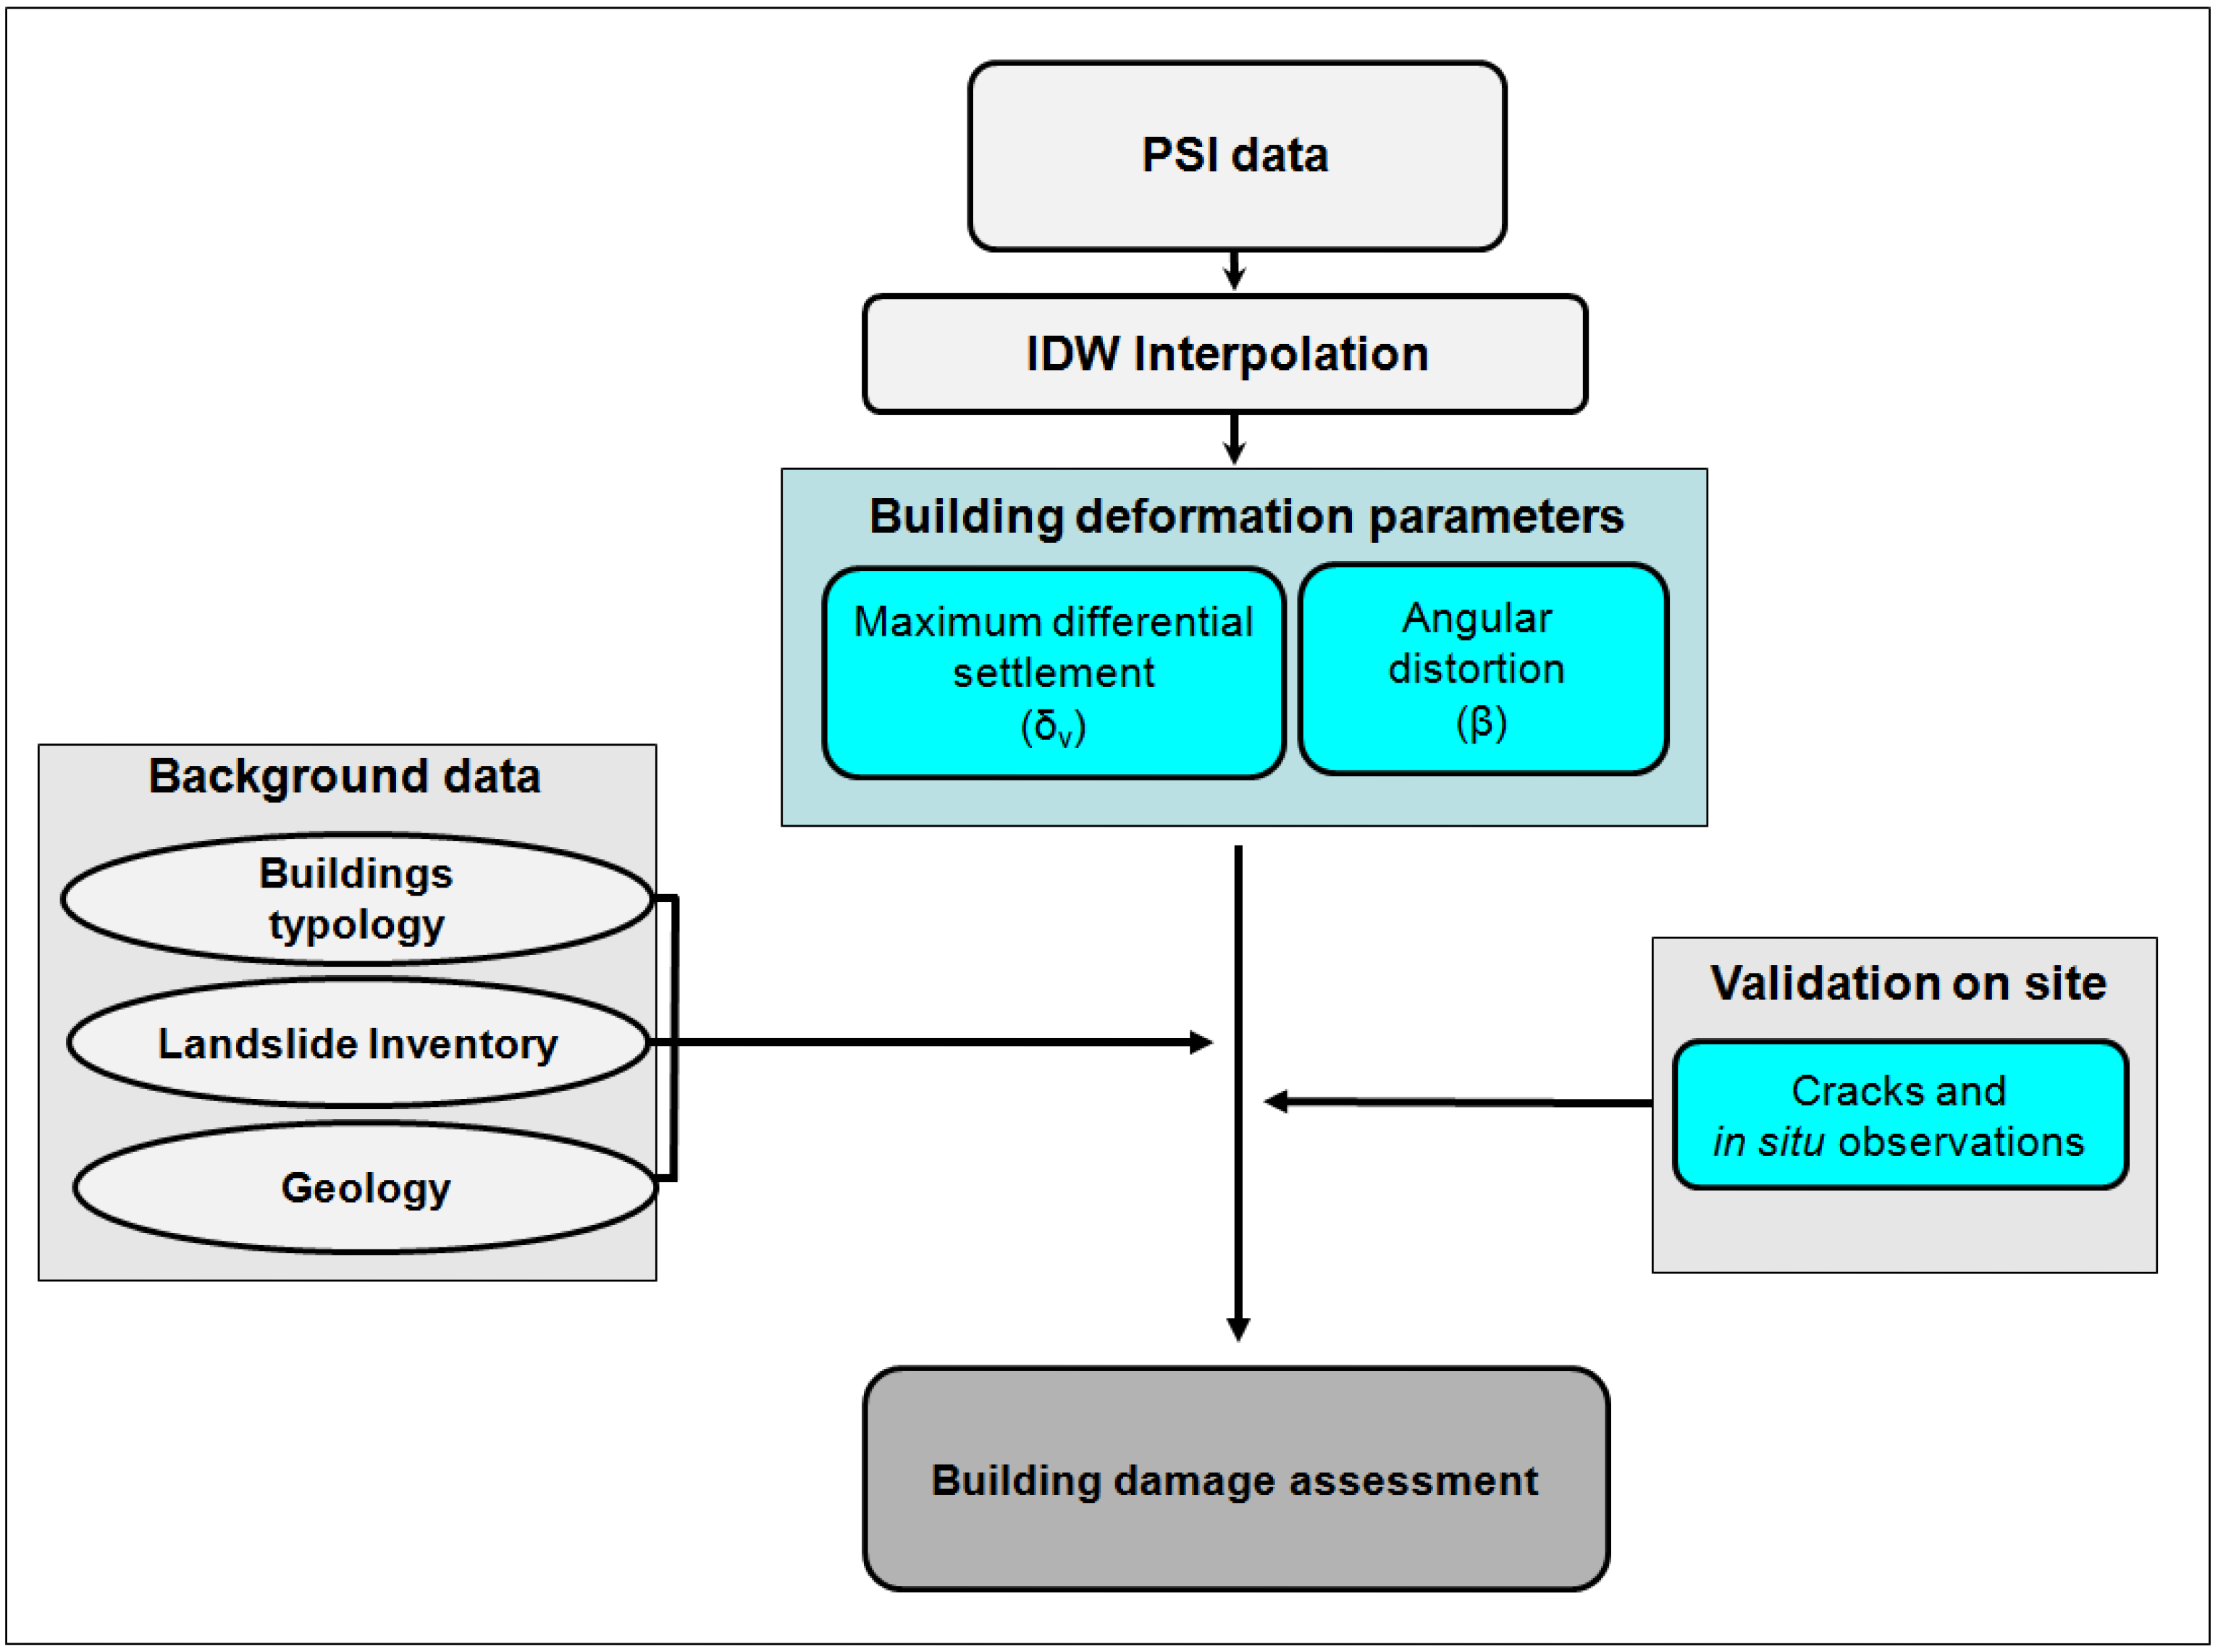
We propose an operative procedure to handle PSI displacement measurements combined with background data (building typology, landslide inventory, geological setting) and on-site evidence, finally leading to a building deformation assessment in the investigated area (
Figure 1).
Figure 1.
Methodology flowchart.
Figure 1.
Methodology flowchart.
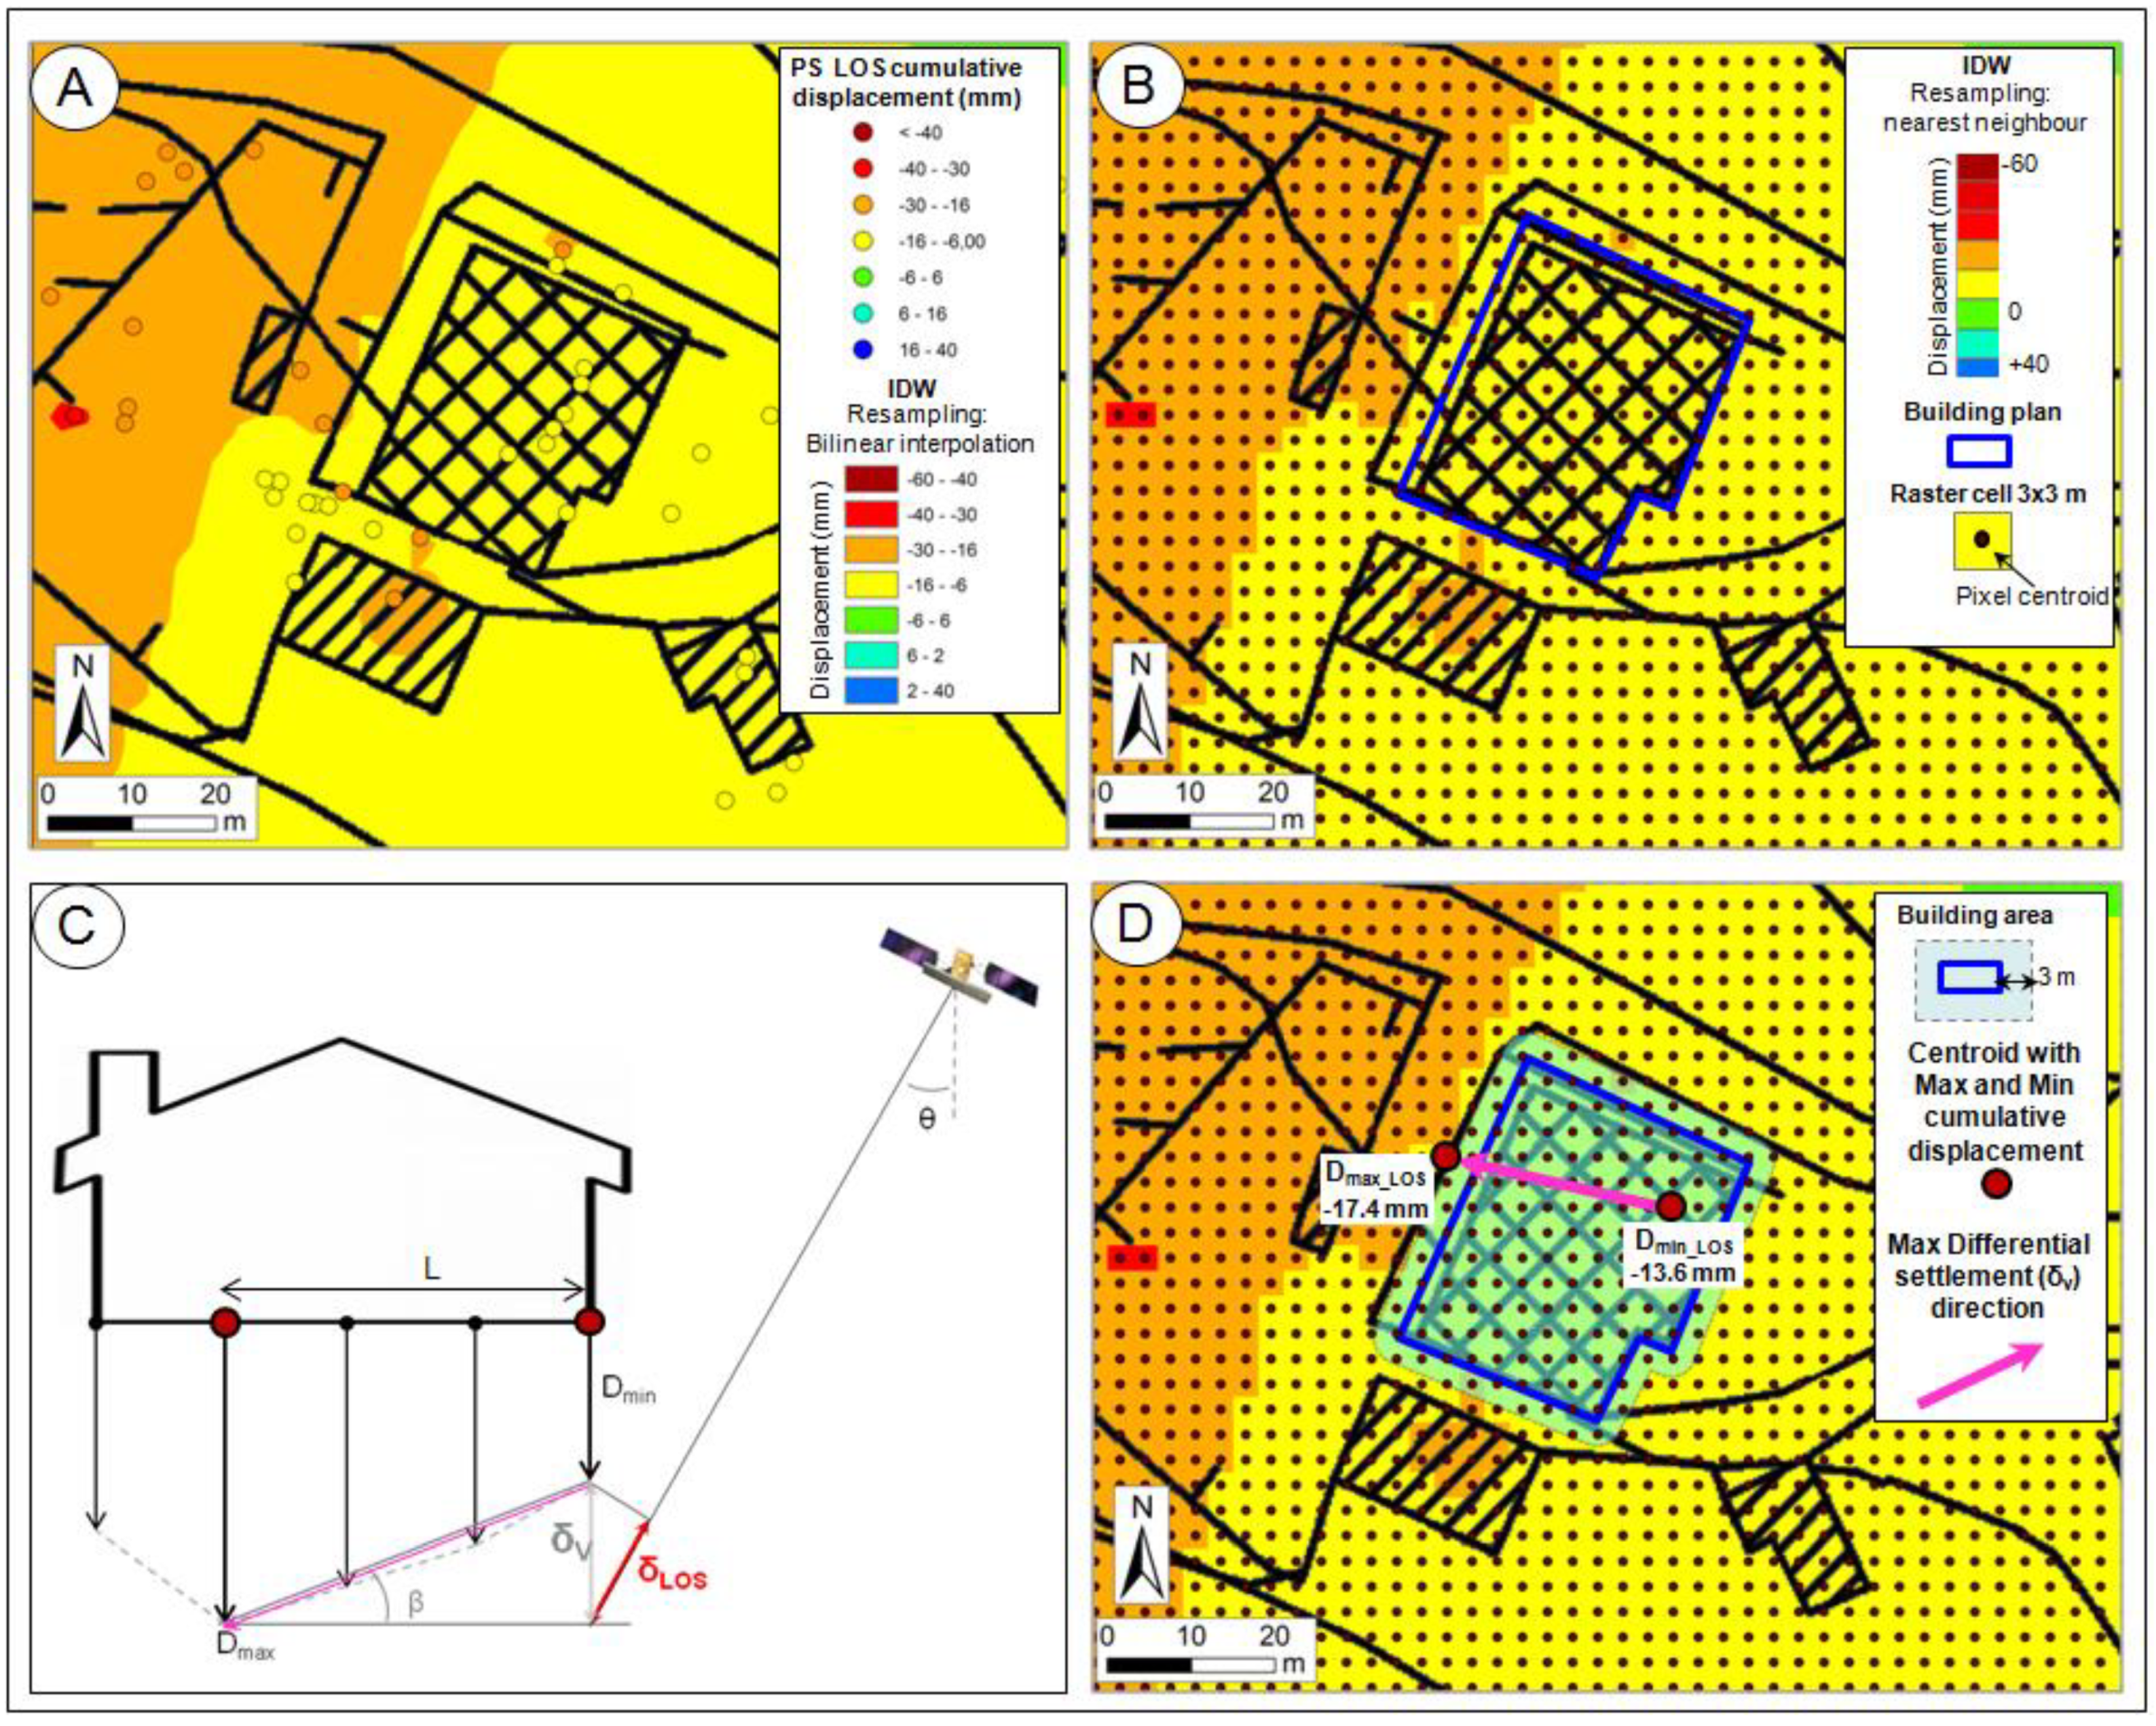
Mean yearly velocities and cumulative displacement provided by PSI data are measured along the satellite LOS (Line Of Sight) on a grid of point-like benchmarks on the ground. Since these measurements are characterized by a discrete point-sampling for certain locations, a surface interpolation of PS cumulative displacement rates is needed in order obtain a displacement map of the whole area and, thus, to estimate ground motion displacements occurring in the monitoring period, even where no PS are available.
Following this facet, we have used the Inverse Distance Weighted (IDW) interpolation method to create a continuous displacement-surface from the sample set of PSI point locations (
Figure 2a) [
26].
IDW is a deterministic method for spatial interpolation based on the basic principle of geography, which defines that elements that are close to each other are more similar than elements farther away [
27]. Using this principle, the IDW interpolator predicts a value for any unmeasured location by using the closest measured values and by assuming that each measured point has a local influence that diminishes with distance. Thus, IDW methods produce interpolated surfaces assuming that discrete values are mostly influenced by the nearby points and less by the more distant points. In the case of PSI datasets, the interpolating surface is a weighted average of the existing scatter points, and the weight assigned to each scatter point diminishes as the distance from the interpolation point to the scatter point increases.
Figure 2.
Step by step procedure for building damage characterization and estimation: (A) PSI data and derived IDW surface displayed as bilinear interpolation layered on building boundaries; (B) IDW surface displayed as a nearest-neighbor discrete raster, with pixel centroids obtained for each raster cell; (C) schematic representation of differential settlement parameters used within the analysis; (D) computation of differential settlement direction within an appropriate buffer around the building.
The resolution of the IDW interpolation cell is to be set according to the resolution of the employed space-borne radar image. For instance, the pixel size of the resulting surface would be set as 20 × 20 m if using medium-resolution C-band data (e.g., ERS 1/2 and ENVISAT) or as 3 × 3 m if exploiting high ground resolution X-band data (e.g., COSMO-SkyMed data).
The raster re-sampling is firstly a bilinear interpolation for general-purpose smoothing and then converted into a nearest-neighbor re-sampling for getting a discrete center-to-center raster display.
As a result, a displacement value is assigned to each pixel centroid of the interpolated surface, thus obtaining a regular grid of distributed rates (
Figure 2b).
Then, in order to detect movement directions and consequent expected damages on buildings, differential settlements of manufactures are calculated according to the criteria of serviceability limit states (SLS), which are those conditions that make the structure unsuitable for its projected use [
28,
29,
30]. In particular, we used the maximum vertical differential settlement (δ
v) and the angular distortion (β) calculated between the maximum and the minimum cumulative displacement (
Figure 2c) [
30,
31,
32,
33].
The maximum vertical differential settlement (δ
v) is defined as the unequal settling of a building, and it is computed as the maximum difference of vertical displacement between two points of the foundation. We chose these two points as the centroids with the maximum and the minimum cumulative displacement derived from PS time series. Thus, we calculated the δv value by using the following equation:
where D
min_LOS and D
max_LOS are the minimum and maximum displacements measured on the building along the satellite LOS during the three-year (2010–2013) monitoring period, δLOS is the maximum differential settlement between these two measurement points along the LOS and θ is the satellite incidence angle. It is worth highlighting that the δ
LOS value is divided by the cosine of the satellite incidence angle in order to obtain the maximum vertical differential settlement (δ
v) of a given structure [
24].
The angular distortion (β) we consider is related to the measured vertical settlement, and thus, it is computed as the ratio between δ
v and the distance (L) between the D
min_LOS and D
max_LOS measurement points:
The values Dmin_LOS and Dmax_LOS, used for the computation of δv, the distance L and β, are set as the maximum and minimum displacements provided by PS time series, measured during the monitoring period (2010–2013) and assigned to the centroids of the pixel cells included within the “building area”. The “building area” is the buffer area drawn around the plain-edge of the analyzed building. The size of this tolerance area is dimensioned accordingly to the cell size resolution of the displacement raster surface and consequently to the spatial resolution of the radar images.
As observed in the case of “control areas” defined by [
17], the use of a buffer allows taking into account even PS that do not lie within the building plain-edge, but that are the result of a backscattered signal mainly influenced by the structure itself, as a consequence of the metric resolution cell of SAR images. Moreover, the use of a buffer permits avoiding possible shifts in the georeferencing procedure of PSI data stacks, buildings and other cartographical layers.
The centroids of the two pixel cells included within the “building area” and selected for the calculation of D
min_LOS and D
max_LOS define the direction along which differential settlement is dominant (
Figure 2d).
Since differential settlements and relative building damages depend on the movements of the foundation soil, as well as on the type of the structure itself, the amount and direction of the computed parameters δ
v and β are cross-compared with background data, among which are the geological setting, the landslide inventory map and building typology information (
Figure 1). Finally, validation and interpretation of the estimated PSI settlements are obtained by matching up δ
v and β to local failures and building crack patterns recognized by
in situ observations, the geological setting and constructive features.
3. Volterra Case Study
The above-mentioned methodology was applied on the southwestern sector of Volterra (Tuscany region, Italy). This area was chosen as the test site, since it is partially landslide affected and characterized by a middle urban fabric density between the city center and the rural area. Moreover, this test site, which extends up about 86,500 m2, includes different building typologies, such as masonry structures and concrete buildings realized either in the 19th century or in recent years, with different foundation types (e.g., direct foundations or bearing piles).
3.1. Geological Background
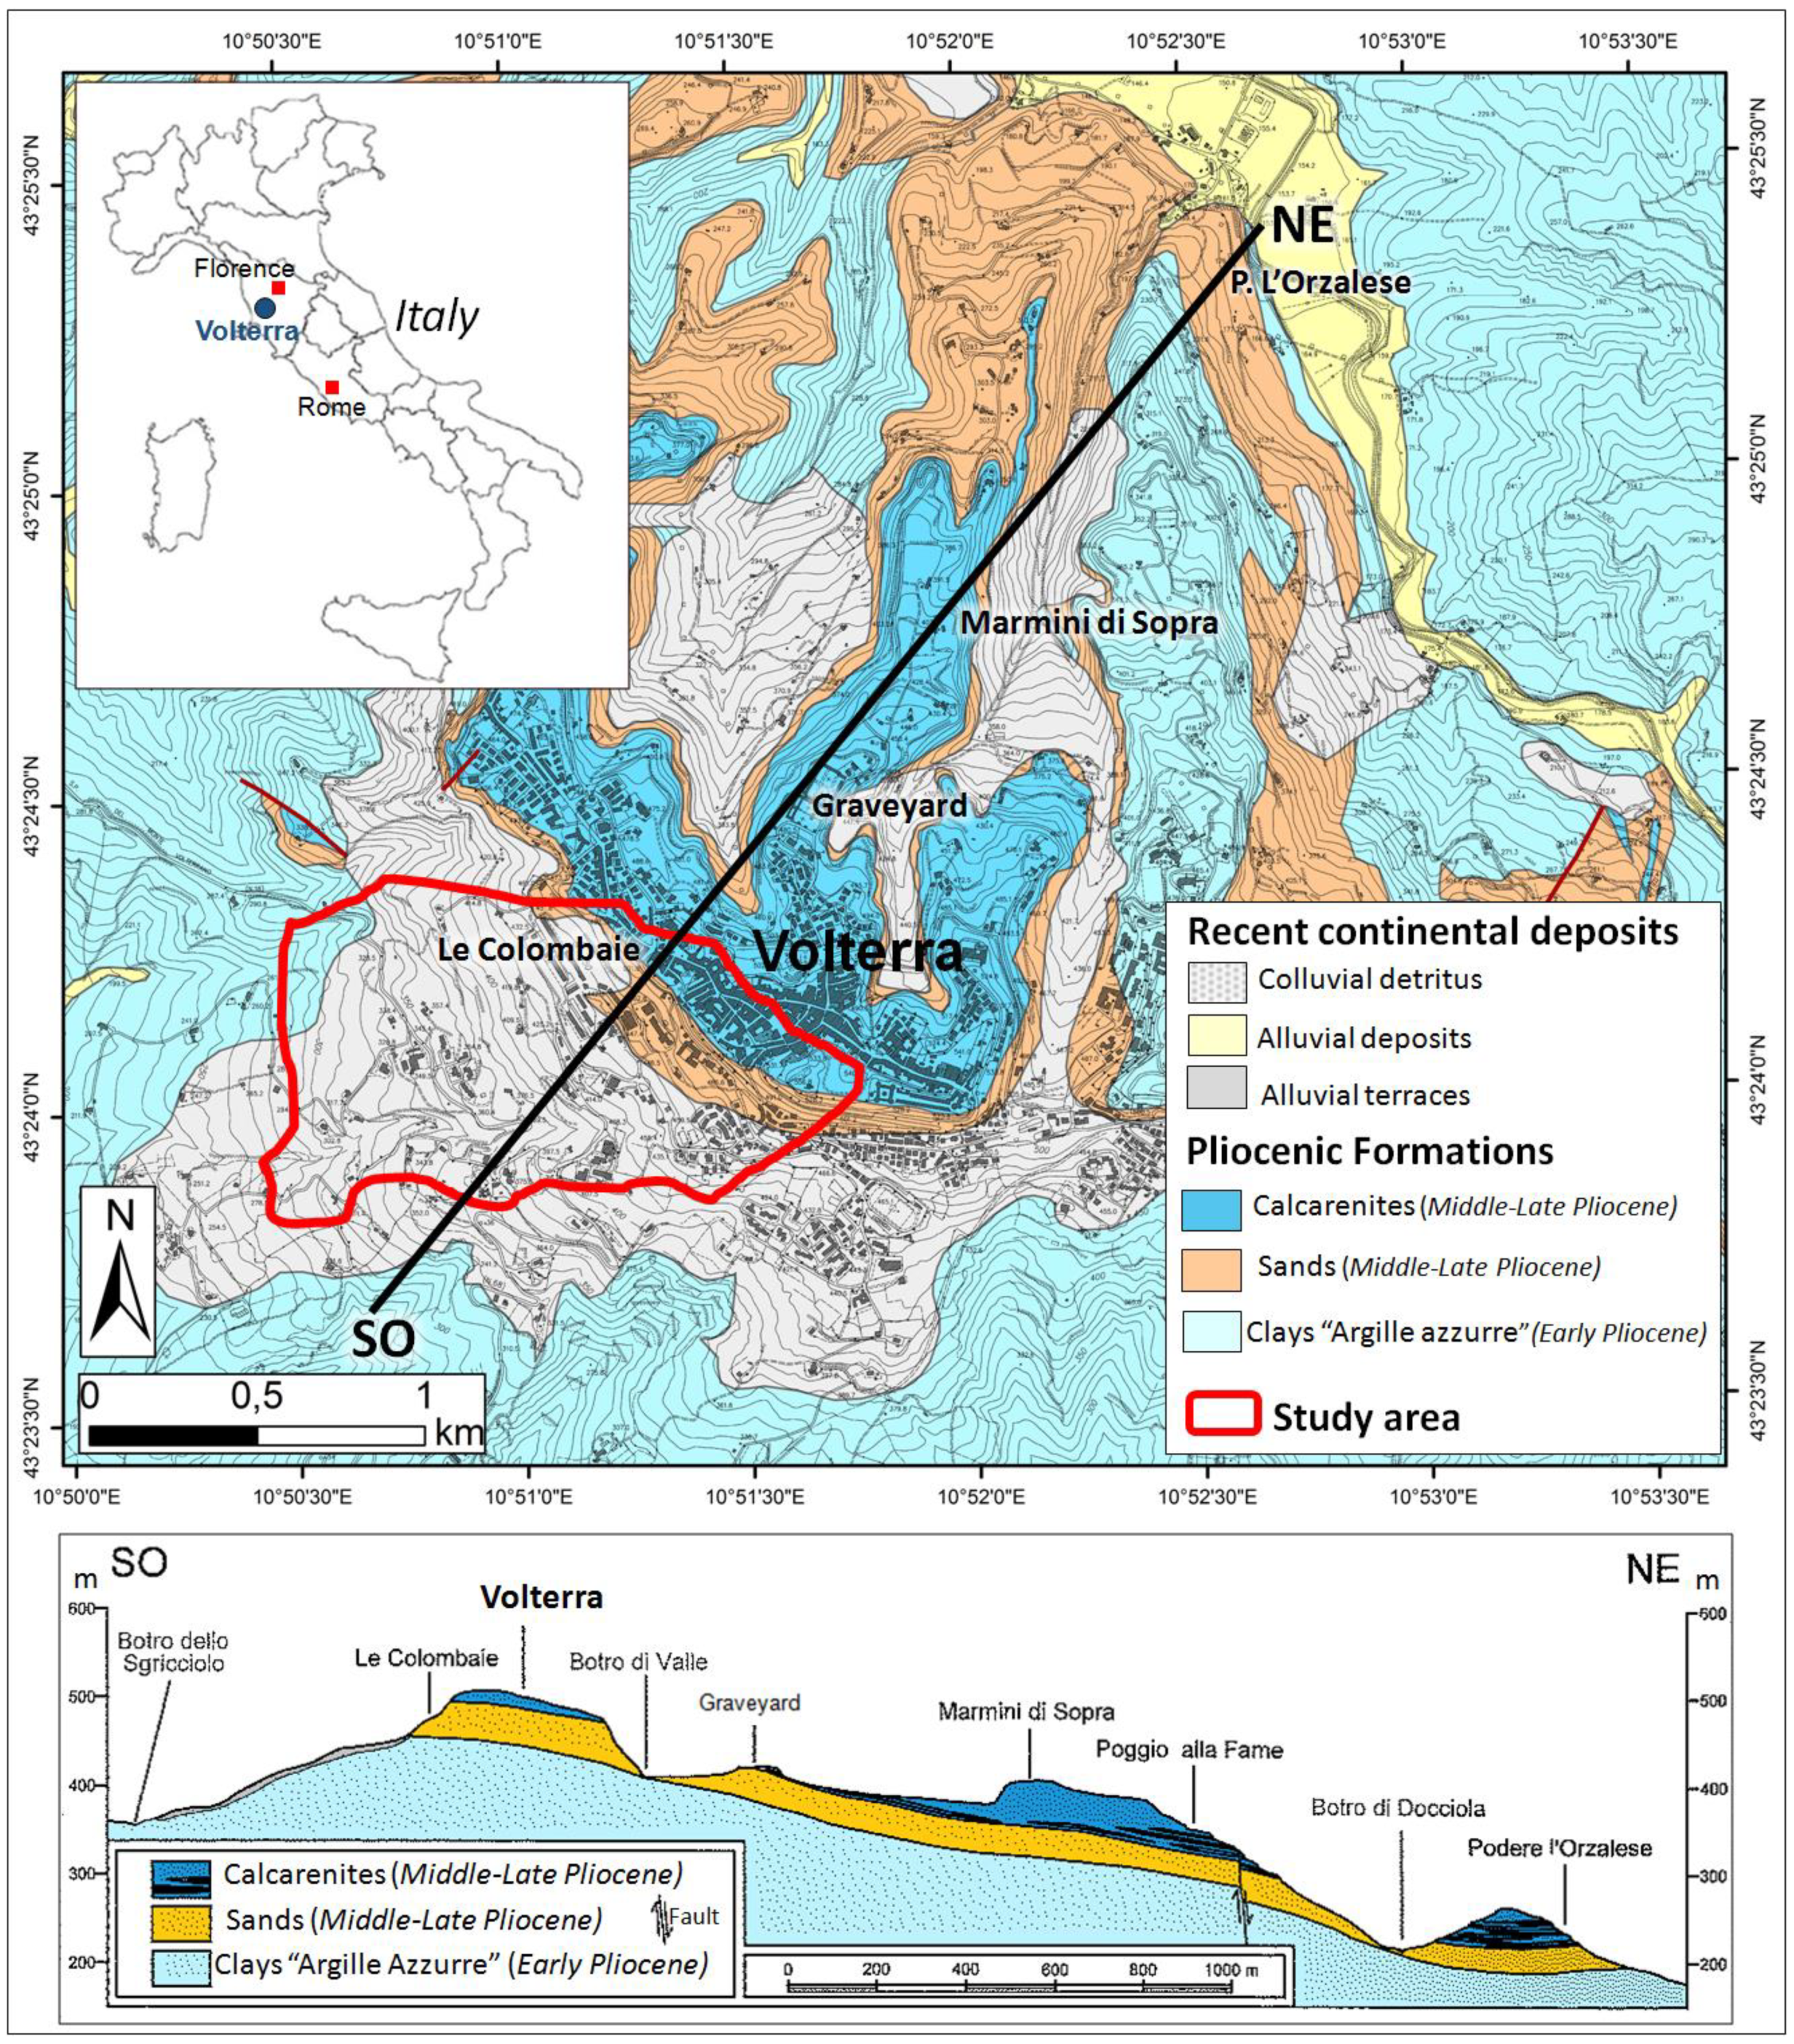
The town of Volterra is located on a tableland at 460–500 meters a.s.l. (above sea level) (
Figure 3). The geological setting of the area consists of a Pliocene marine sedimentary succession. The bottom of the stratigraphic sequence is represented by a thickness of marine clays (“Argille Azzurre”) of Early-Middle Pliocene age, overlapped by cemented sandy deposits (“Villamagna sands”). The calcarenites named “Volterra limestones” close the sedimentary succession and lay at the top of the tableland, on which the Volterra city center was built. These three lithological units are stacked in horizontal or sub-horizontal layers, slightly dipping towards northeast, with an inclination that never exceeds 10° [
34,
35] (
Figure 3).
Figure 3.
Volterra study area: geological map and section. In order to emphasize the morphology, a vertical exaggeration of 2× is applied to the section. Modified from [
34].
Figure 3.
Volterra study area: geological map and section. In order to emphasize the morphology, a vertical exaggeration of 2× is applied to the section. Modified from [
34].
The different geotechnical properties between the impermeable clays, the upper erodible Villamagna sands and well-cemented Volterra calcarenites determine the undermining of the clayey bases of the hill and consequent retrogressive slope failures that generate very steep, sub-vertical cliffs around the tableland.
Late Pliocene and Quaternary terrigenous debris lie upon the sandy-clay units, filling the valleys in the surrounding area. This extensive colluvial debris sheet, which lies on the sedimentary sequence, mainly derives from the gradual weathering of the upper sandy formations and calcarenites on which the city itself is built [
34].
The geological structure and topography of the tableland influence the typology and the spatial distribution of mass movements. On the southwestern slope of the Volterra hill (red polygon in
Figure 3), the Argille Azzurre mainly crops out, and the area turns out to be affected by gullies, typical of clayey soils. From an altitude of 450 m a.s.l., sands crop out, overlapped by calcarenites, where the Volterra city center is built. The main landslide typologies are represented by shallow translational slides and soil erosion, according to the available landslide inventory map provided by the Tuscany region and referring to 2012 (
Figure 4a,b).
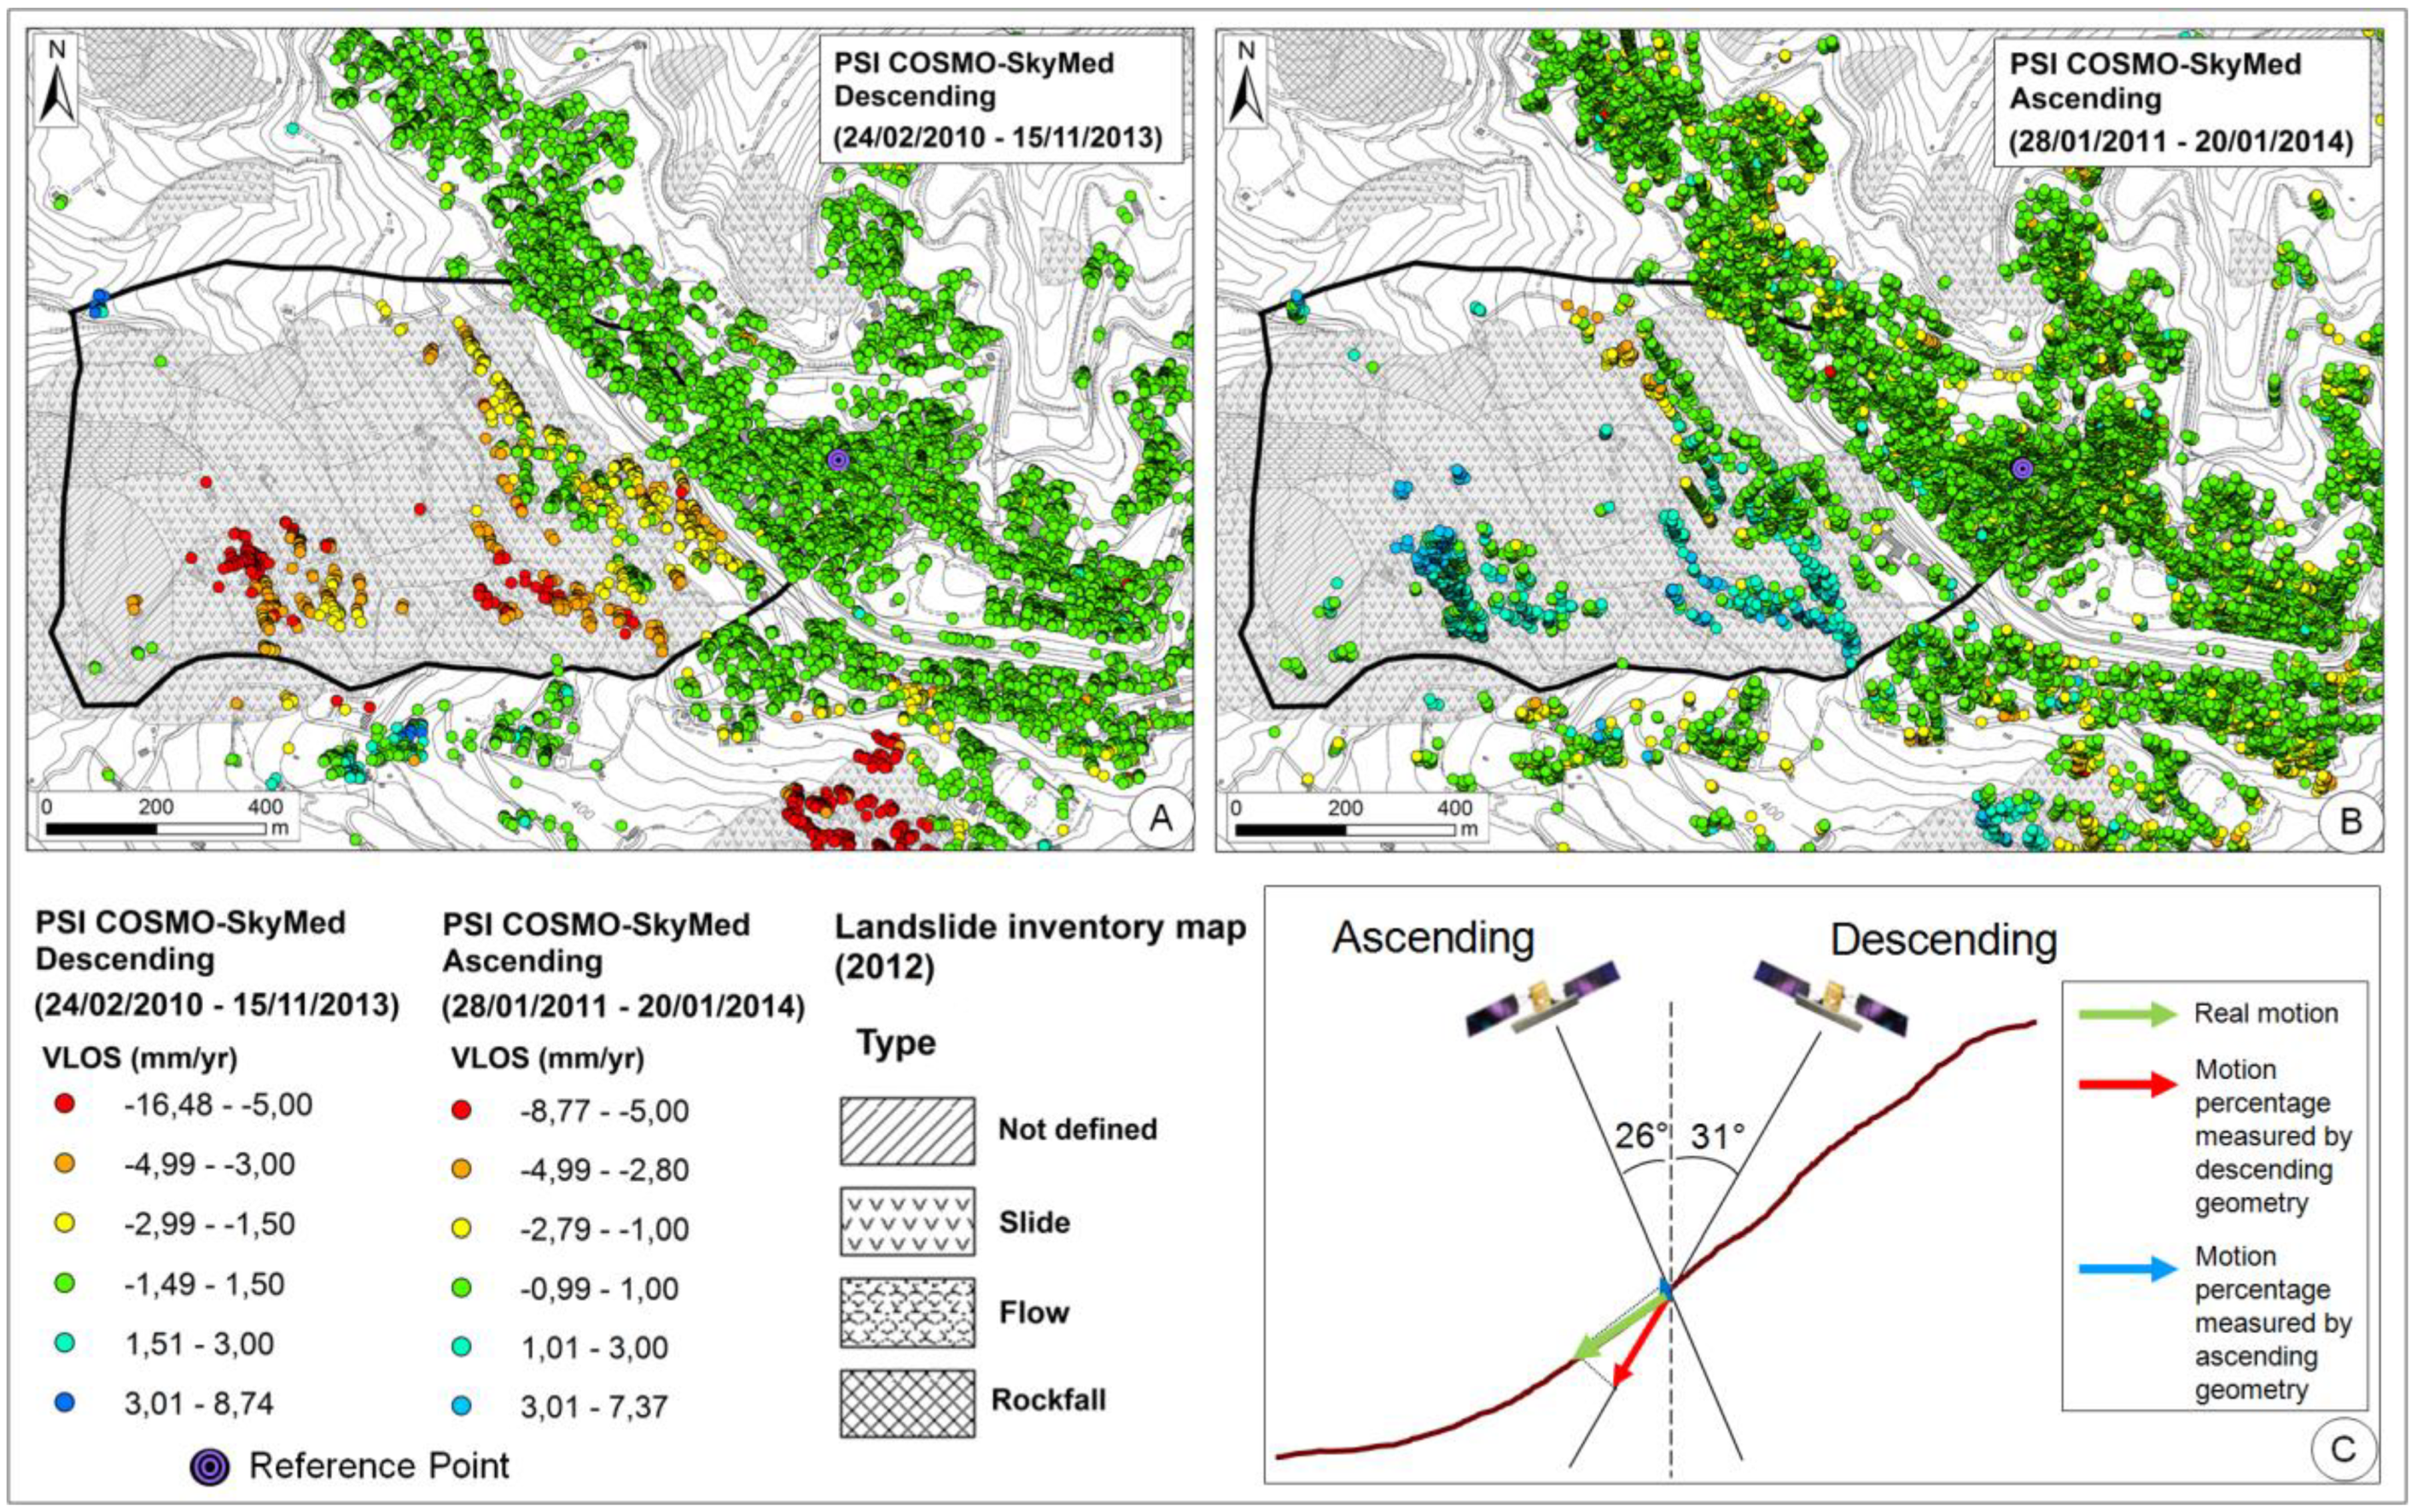
Figure 4.
Velocity rates and spatial distribution of available PSI data overlapped on the landslide inventory map of Volterra area provided by the Tuscany region. The close-up study area is the black-contoured sector: (A) PSI COSMO-SkyMed in descending orbit; (B) PSI COSMO-SkyMed in ascending orbit; (C) sketch representing the two COSMO-SkyMed acquisition geometries combined with the local topography of the study area.
The shallow colluvial deposits, made up of chaotic detritus, reach up to a thickness of 20 meters in the study area and contribute to determining the ground instability. As a result, diffuse landsliding of the area actually could result from shallow ground deformation related to the instability of the colluvial layer or to surface creep downslope, rather than to landslides.
3.2. PSI Data
Available satellite radar data over Volterra consist of 57 SAR images acquired in the X-band by the COSMO-SkyMed (CSK) satellite of ASI (Italian Space Agency) in the time spanning 2010–2014 and processed by means of the SqueeSAR™ approach, which is an evolution of PSInSAR™ [
36]. The acquisition parameters of the available SAR images are reported in
Table 1.
The SqueeSAR™ technique overcomes some limits of PSInSAR, the analysis of interferometric data-stacks, by extracting information not only from point-wise deterministic objects (
i.e., PS), but also from distributed scatterers (DS). DS are areas of moderate coherence in some interferometric pairs of stacks, where a sufficient high number of random small scatterers is present within a resolution cell with no dominant scatterer and follows the complex circular Gaussian distribution [
37,
38].
DS, which are widespread in rural areas, correspond to rangeland, pasture, shrubs, bare soils, etc., that do not produce the same high signal-to-noise ratios of PS, but are, however, discernible from the background noise. Thus, the SqueeSAR™ technique jointly processes PS and DS, making the density of terrain benchmarks higher, especially in semi- and non-urban areas.
Table 1.
Main features of the exploited PSI datasets in the Volterra area. CSK, COSMO-SkyMed.
Table 1.
Main features of the exploited PSI datasets in the Volterra area. CSK, COSMO-SkyMed.
| Feature | CSK | CSK |
|---|
| Wavelength | X (~3.1 cm) | X (~3.1 cm) |
| Incidence angle θ (°) | 26 | 31 |
| Geometry | Descending | Ascending |
| Azimuth x range PS cell resolution (m × m) | 3 × 3 | 3 × 3 |
| Revisit time (day) | 16 | 16 |
| Temporal span (day/month/years) | 24 February 2010–15 November 2013 | 28 January 2011–20 January 2014 |
| Processing method | SqueeSAR™ | SqueeSAR™ |
| No of used SAR images | 25 | 41 |
| No of PSI within study area | 1,623 | 2,484 |
In this work, PSI analysis was focused on the Volterra southwestern area, which is the most critical and unstable sector, as it is affected by extensive dormant mass movements and consequently characterized by the highest PSI ground motion rates (
Figure 4b,c).
The spatial distributions of PSI LOS velocities are shown in
Figure 4. The negative sign stands for an increasing distance of the benchmark from the satellite sensor, while a positive sign means a movement towards the satellite. Within the PSI velocity, stability thresholds are fixed at ±1.5 mm/year and ±1.0 mm/year in descending and ascending orbits, respectively, for distinguishing stable targets (displayed in a green color) from moving ones. Most of the published PSI landslide analyses have been performed on the C-band (4–8 GHz, 5.6-cm wavelength) and establish the stability LOS velocity threshold at ±2 mm/year [
13]. Since the LOS displacement sensitivity increases with the radar frequency, the stability thresholds in the X-band (8–12 GHz, 3.1-cm wavelength) have been set within a narrower range, at ±1.5 mm/year or 1.0 mm/year, being compatible with one and 1.5 standard deviation values of CSK PS populations, respectively, for the ascending and descending dataset. These values are also in accordance with stable threshold choices already tested and accepted by the scientific community [
5,
10,
14,
39].
The reference point of PSI datasets is located within the city center, which is the stable part of Volterra, as confirmed by landslide inventories and the absence of ground motion evidence, while the highest mean annual LOS velocities reach up tens of mm/year within the southwestern study area (
Figure 4).
When observing ground motions using satellite radar images, only the component of movement along the LOS is detected. Additionally, being that the satellite orbits polar and right-side looking, the same terrain movement can be measured with opposite signs and different modules from ascending and descending passes, thus making the slope dynamics interpretation not immediately intelligible [
6,
13]. Consequently, PSI-based displacement data depend on the combination of the sensor acquisition geometry (orbit and incidence angle) with the local topography (aspect and slope of the area) and with the real direction of movement [
4,
6]. Generally, radar data collected in ascending orbit are suitable for detecting E-facing slope movements, while descending geometry is more appropriate for W-facing slope movements. Therefore, given the west-facing orientation of the Volterra southwestern area, movements measured by the COSMO-SkyMed satellite in ascending geometry strongly underestimate the downslope motion, as they are minimized by the combination of slope topography and LOS, whereas movements recorded in descending orbit are a good approximation of the real displacements, as ground motion direction is nearly parallel to LOS direction (
Figure 4c). Consequently, for the PSI analysis on the study area, only the CSK dataset in descending geometry was considered and analyzed within the study area.
3.3. Analysis Results and Validation
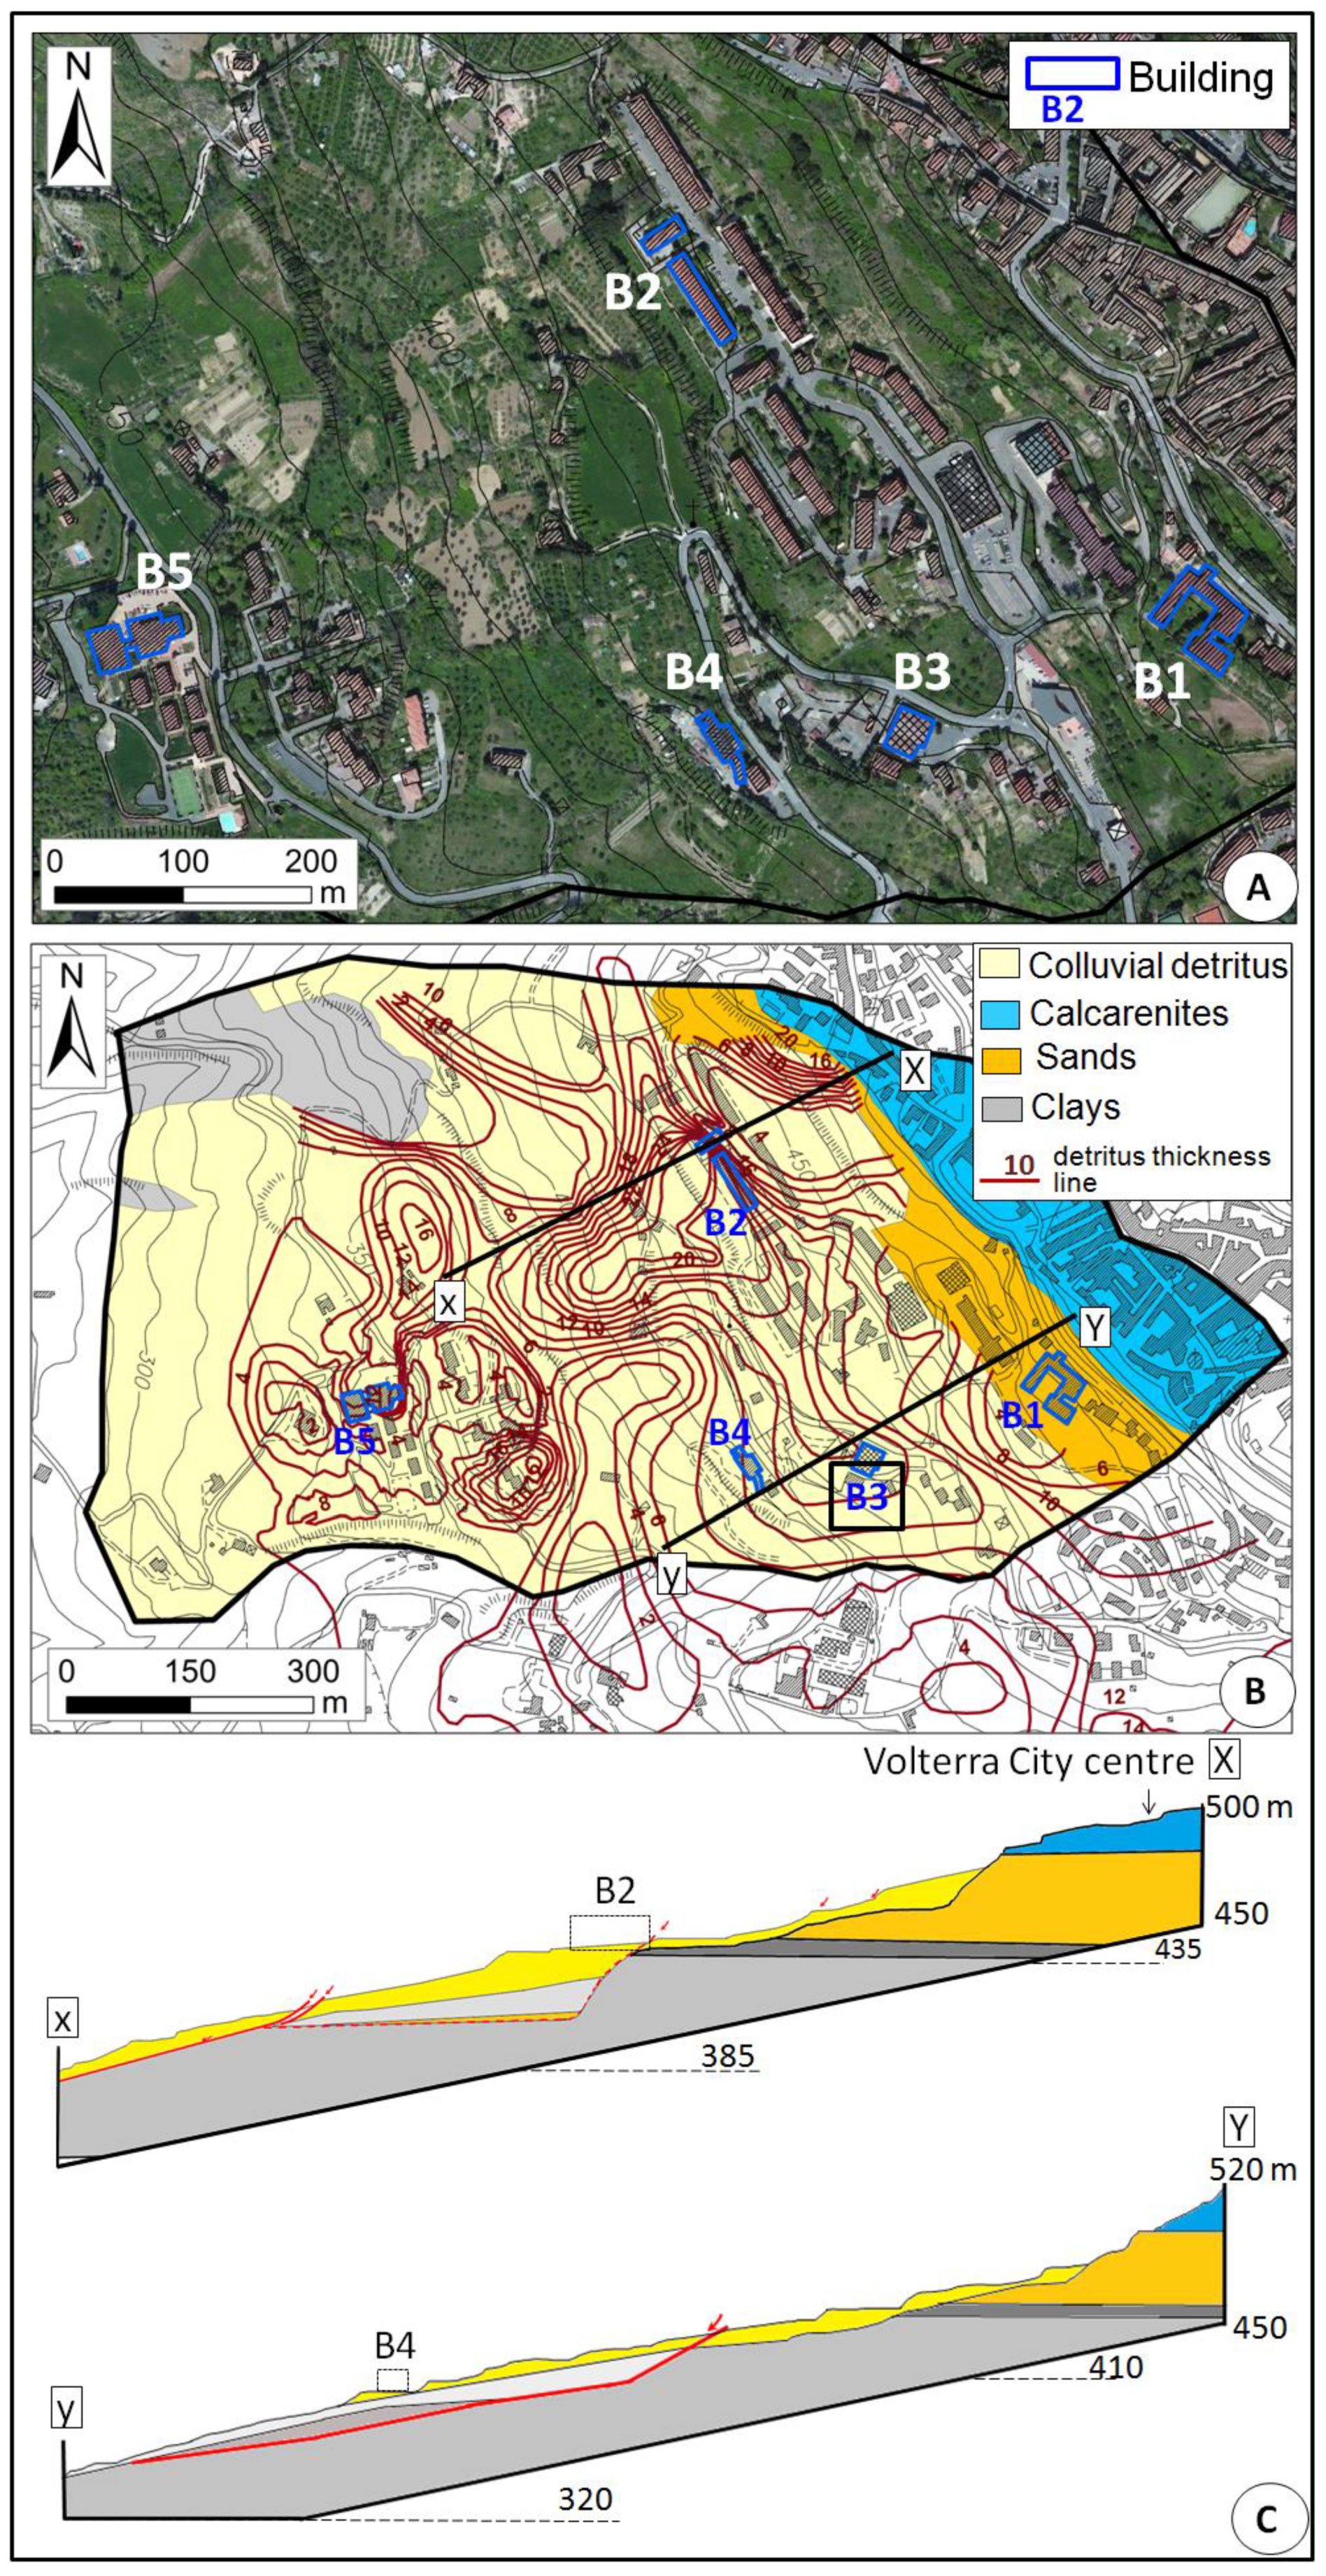
We present results on five example buildings (B1–B5 in
Figure 5) homogenously distributed in the test area (
Figure 5a) at different topographic elevations along the slope (from 340 m a.s.l. up to 470 m a.s.l.) (
Figure 5b,
Table 2). The selected structures are characterized by different construction typologies, age and foundations, as well as by different foundation ground, since they are located on sandy formations (B1) or clayey formations covered by colluvial deposits with very different thicknesses (B2 to B5).
On these buildings, we performed a deformation assessment throughout the PSI-based computation of differential settlement values. Then, we cross-compared these values with background data and crack pattern damages detected during a recent in situ survey, in order to validate the estimated building deformations.
The building damage assessment was performed considering descending CSK PSI data acquired in the recent three-year time interval 2010–2014 and analyzing their deformation time series. As during this acquisition period, no restoration activities were undertaken over the selected structures, the in situ surveys of building crack patterns, performed during 2014, can be considered reliable.
On the one hand, PS velocities detected on rocks and natural elements within a landslide phenomenon may reasonably be ascribed to the landslide itself; on the other hand, the measured displacement of PS on buildings represents the result of an interaction between the movement of the landslide and the mechanisms of the soil-structure system, and damages potentially derive from this interaction.
Figure 5.
(A) Location of the five case studies; (B) geological map of the study area; and (C) two longitudinal sections.
Figure 5.
(A) Location of the five case studies; (B) geological map of the study area; and (C) two longitudinal sections.
The resolution of the IDW interpolation has been set as three meters, according to the 3 × 3 m cell size of COSMO-SkyMed satellite images. By virtue of such a resolution, many PS show up on building facades and roofs, fitting the typical scale of constructive elements well.
Table 2.
Values of minimum and maximum line of sight (LOS) displacement during the period 2011–2013 (Dmin_LOS and Dmax_LOS, respectively), distance L between Dmin_LOS and Dmax_LOS, maximum vertical differential settlement (δv) and the related angular distortion (β) for each building (B1–B5) during the period 2011–2013.
| Building | Dmin_LOS (mm) | Dmax_LOS (mm) | L (m) | δv (mm) | β between Dmin_LOS and Dmax_LOS |
|---|
| B1 | −4.87 | −9.11 | 54.74 | 4.94 | 9.03 × 10⁻⁵ |
| B2 | B2i | −4.99 | −22.96 | 34.71 | 20.96 | 6.04 × 10⁻⁴ |
| B2ii | −7.86 | −12.55 | 29.68 | 5.47 | 1.84 × 10⁻⁴ |
| B3 | −13.59 | −17.38 | 27.70 | 4.42 | 1.59 × 10⁻⁴ |
| B4 | −15.75 | −41.35 | 66.06 | 29.86 | 4.52 × 10⁻⁴ |
| B5 | −22.35 | −39.34 | 36.24 | 19.82 | 5.46 × 10⁻⁴ |
As background data, we used a topographic map at 1:10,000 scale, a geological map of the Volterra municipality, digital color orthophotos with 1m resolution and the landslide inventory map of the area provided by the Tuscany region.
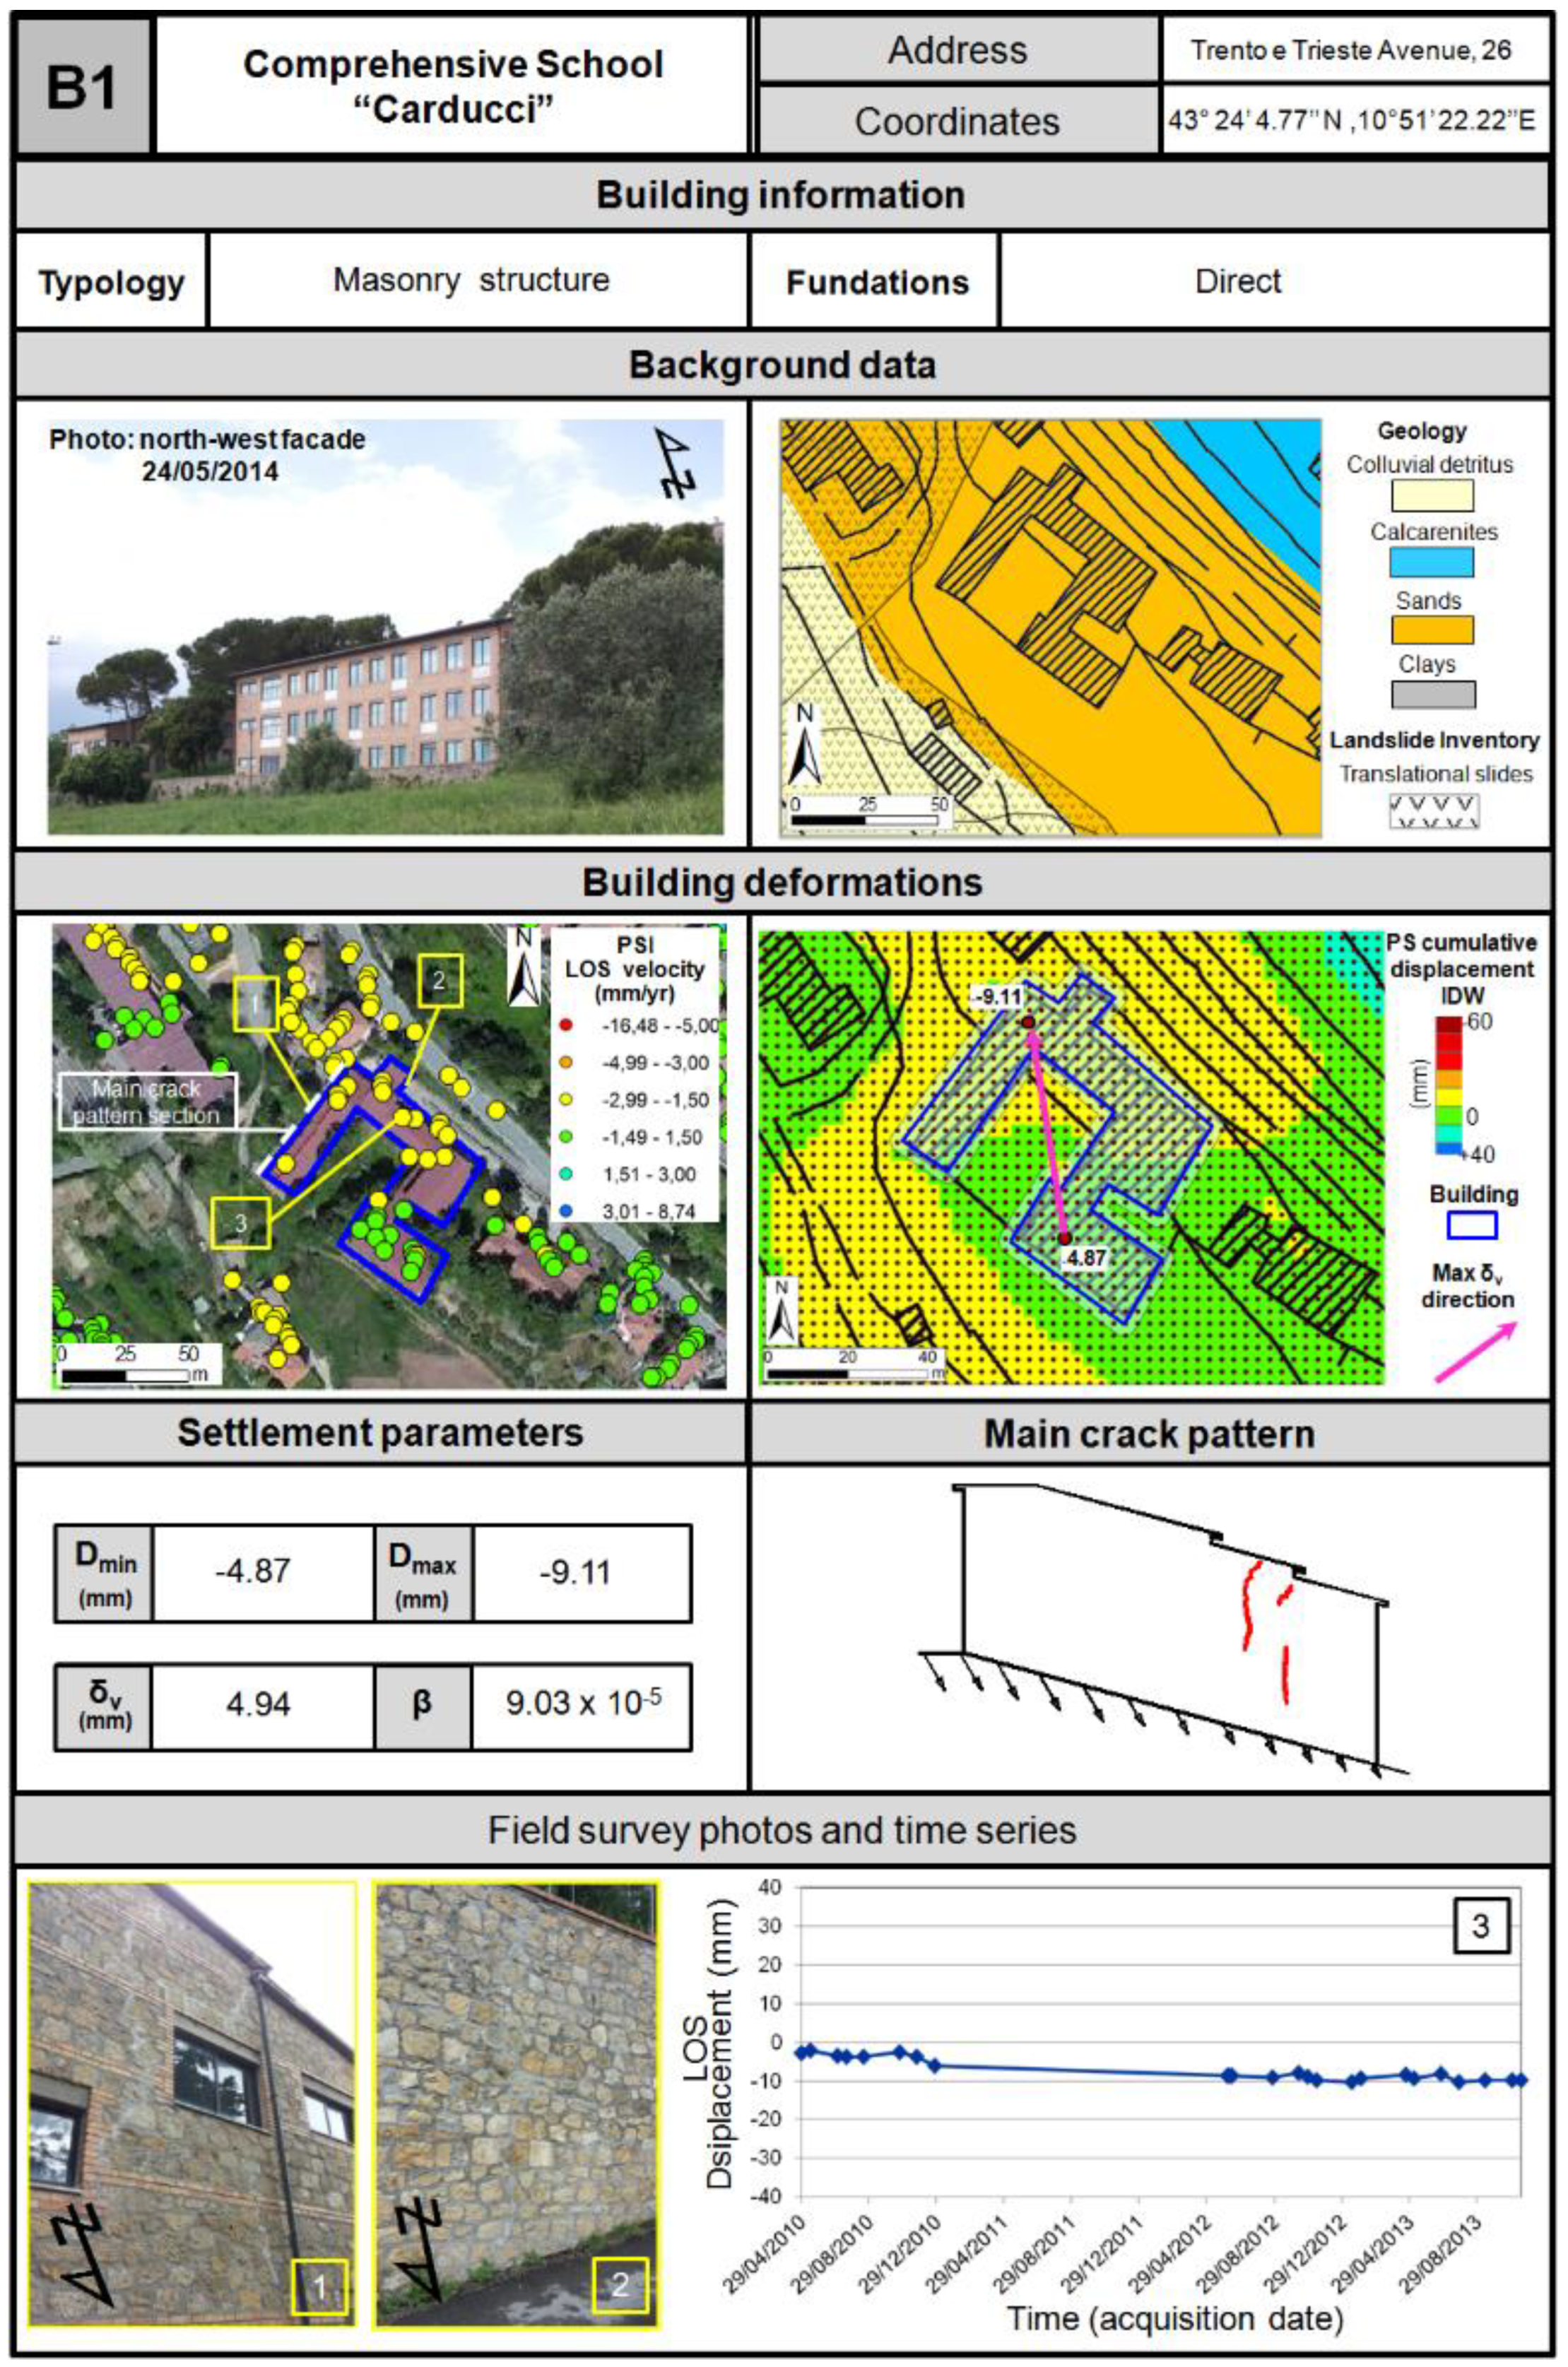
3.3.1. Building B1
Building B1 is a public comprehensive school and consists of a U-shaped masonry structure (
Figure 6). The edifice was built in 1933, and it is located on outcropping sands at an altitude of about 470 m a.s.l.
Validation
PSI data were validated with in situ checks performed in April–May, 2014. Although good overall conditions were recognized, some centimetric vertical cracks were detected in the external walls of the northwestern portion of the building. The position and the pattern of the cracks are compatible with the direction of the estimated maximum differential settlement (SE-NW-oriented vector). The low modules of both differential settlement (δv) and angular distortion (β) (4.94 mm and 9.03 × 10⁻⁵, respectively) are concordant with the geological setting, as the building is located on almost stable terrain, i.e., sandy formation, within an area not affected by recorded landslides.
Figure 6.
Analysis results of building B1: building information, background data, building deformations, settlement parameters, main crack pattern, some photos of the field survey and a PS time series (the gap during year 2011 is due to missing acquisitions).
Figure 6.
Analysis results of building B1: building information, background data, building deformations, settlement parameters, main crack pattern, some photos of the field survey and a PS time series (the gap during year 2011 is due to missing acquisitions).
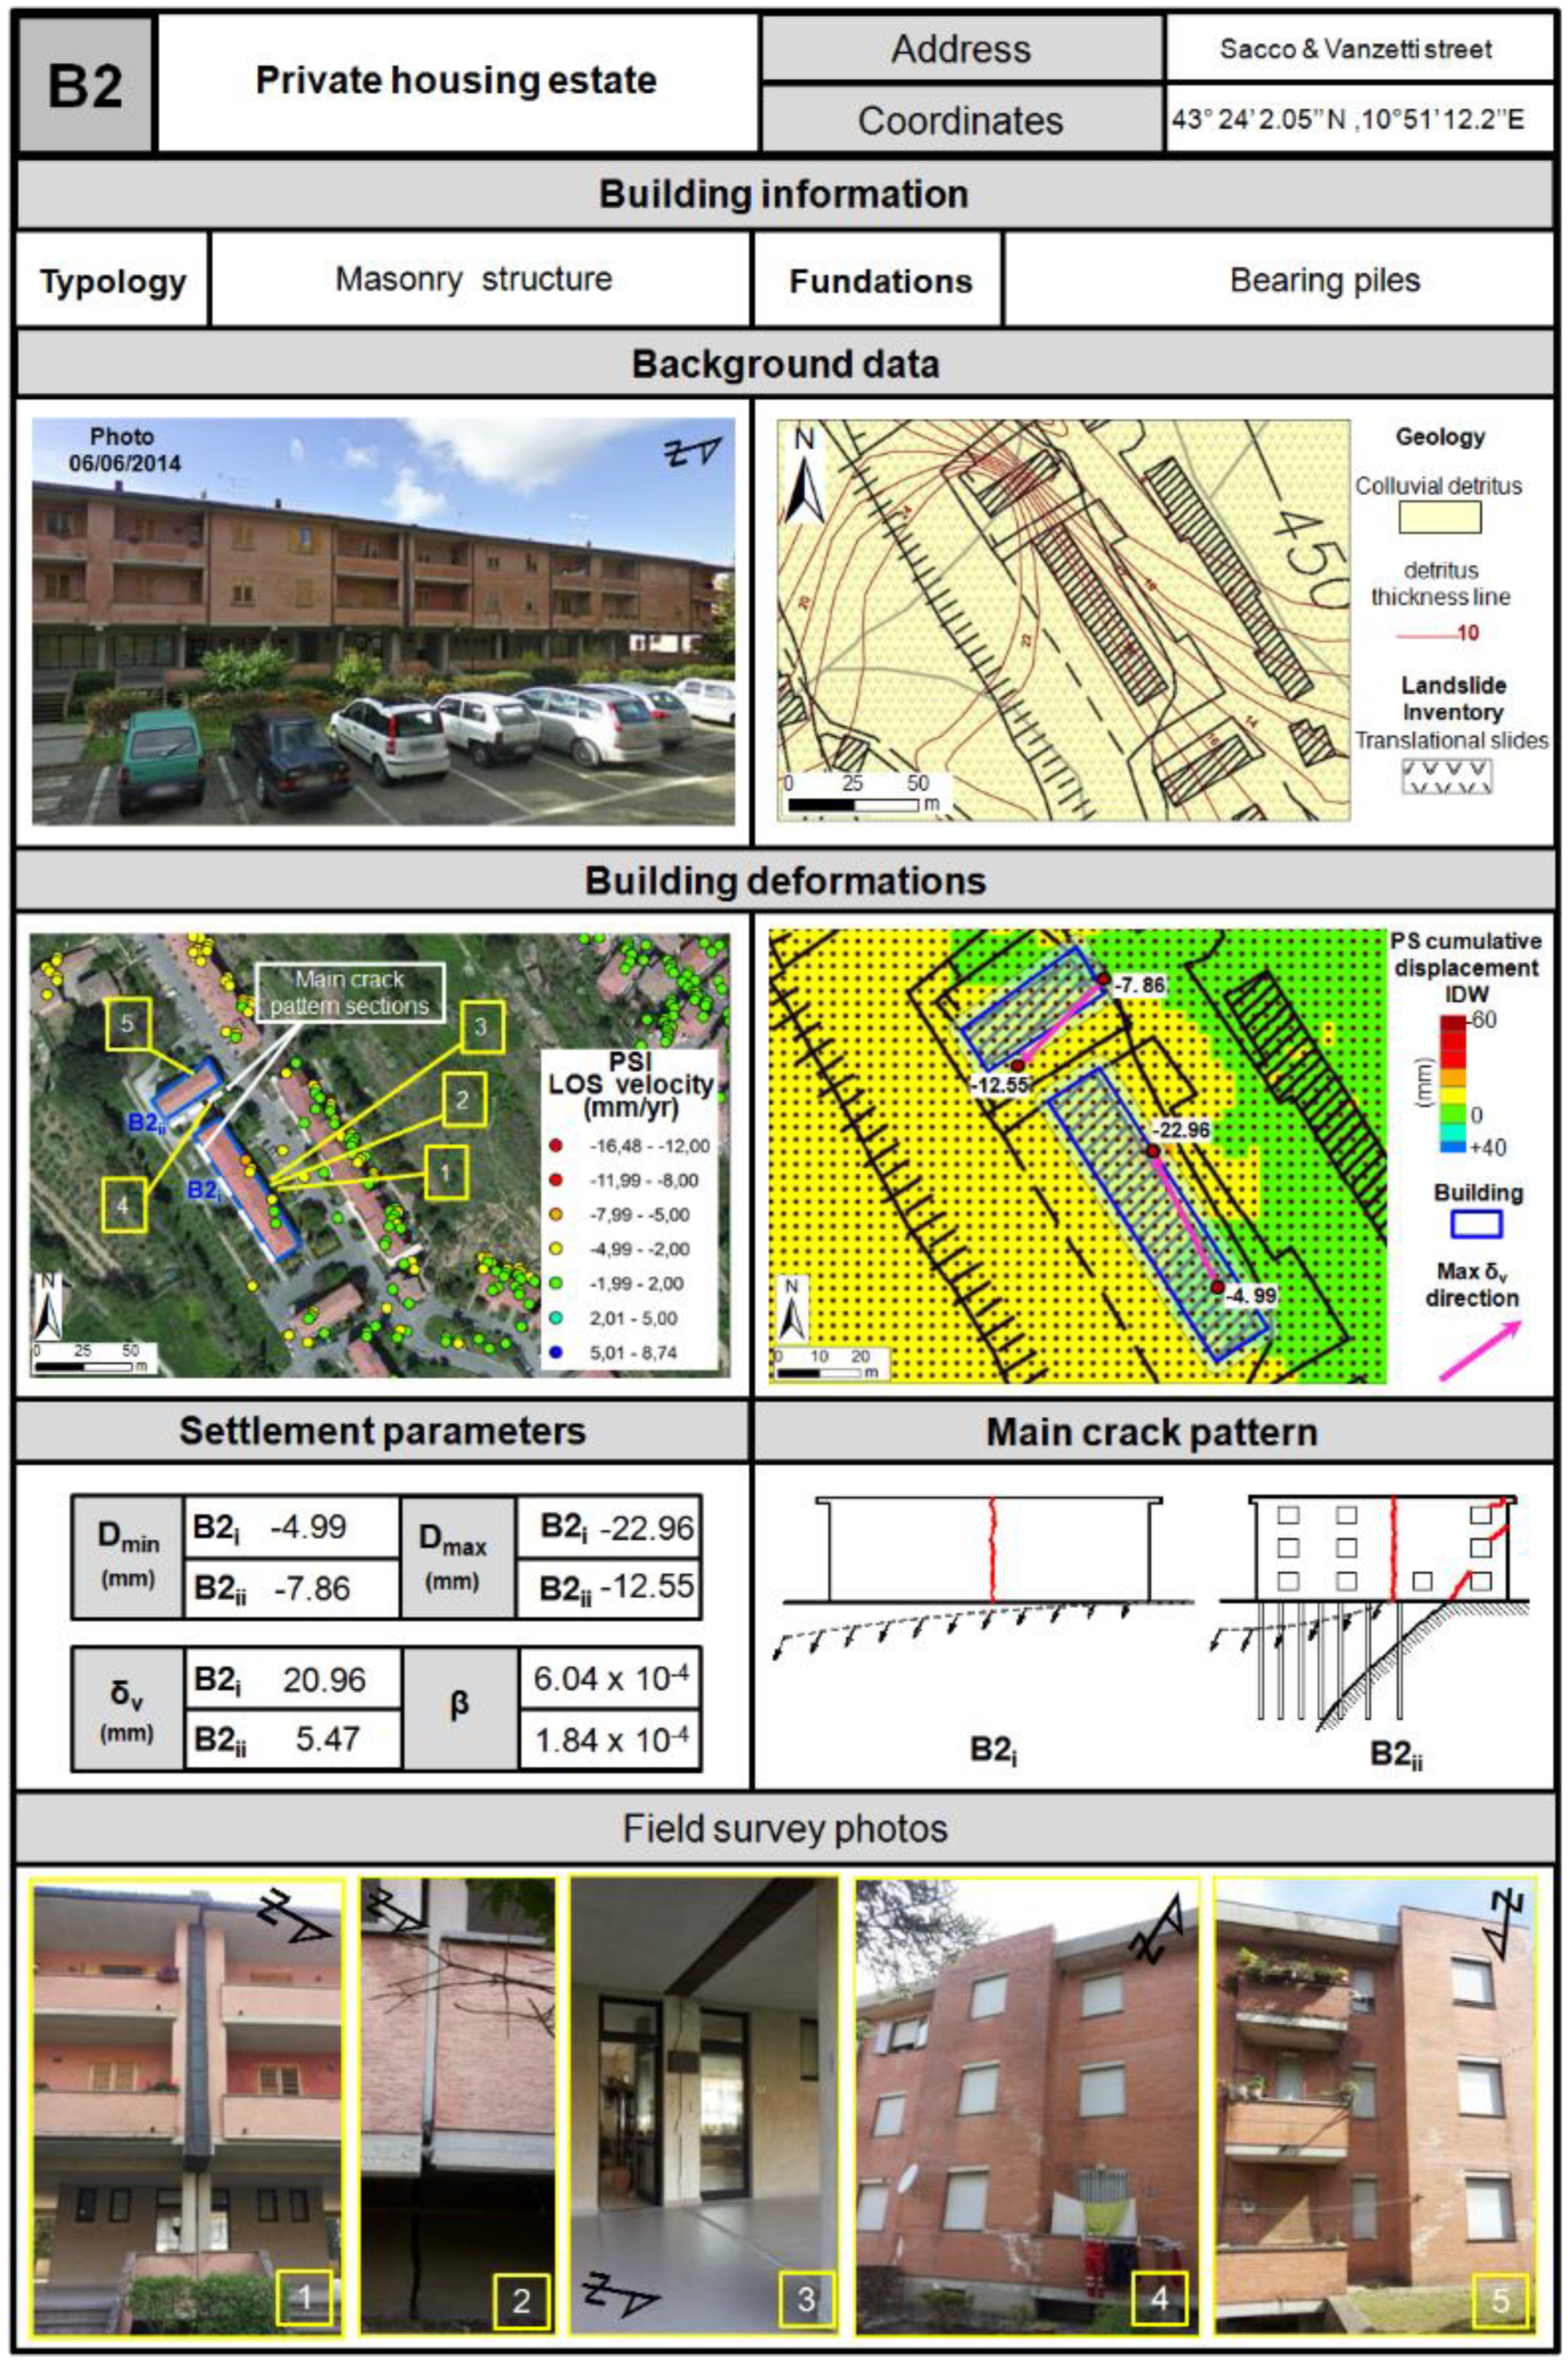
3.3.2. Building B2
Building B2 is a private housing estate that includes two reinforced concrete structures (
Figure 7). Both edifices (B2
i and B2
ii) are built on a clayey morphological sub-vertical scarp 30 meters high completely covered by colluvial deposits and only recently detected [
40]. The colluvial detritus derives from the weathering of the clays and upper sands, and its thickness reaches up values of 25–30 meters.
The buildings, initially built with direct foundations, were partially underpinned with 11 meter-long piles in 1997, since they were affected by important settlements and suffered consequent damages. These remedial actions did not effectively strengthen the foundations, and further settlements occurred because the bearing micropiles were not sufficiently long with respect to the detritus thickness; thus, they did not reach the bedrock, but were within the thick colluvial layer.
In particular, the uphill portion of the building B2
ii is directly built on the bedrock, since the bearing piles reach it, while the downhill portion of the building is completely pinned within the soft colluvial deposits (
Figure 7). The same occurs on the southwestern and northeastern portions of B2
i, the first being underpinned in the bedrock of the edge scarp and the second in the colluvial detritus above the scarp. As a result, the scarp influences the deformations of the buildings of the area, as also confirmed by the edifices uphill that appear to be stable.
Validation
Field checks confirmed and validated the critical instability conditions revealed by deformation parameters and background data. In fact, both buildings are affected by intense damages resulting in centimetric cracks on the external facades (
Figure 7). In particular, building B2
ii shows 45° fissures with a centimetric width on the facades, mainly coinciding with weaker wall areas, e.g., window corners. Building B2
i is cracked into two portions, as confirmed by vertical centimetric fissures at mid-length.
These crack patterns are clear effects of differential settlements, and their directions are consistent with δv orientation, as well as with the direction of the morphological scarp. The recorded motions are potentially due to the building loading on the colluvial layer on the scarp and also to the downslope creep of the shallowest portion of this layer.
Figure 7.
Analysis results of building B3: building information, background data, building deformations, settlement parameters, main crack pattern and photos of field survey.
Figure 7.
Analysis results of building B3: building information, background data, building deformations, settlement parameters, main crack pattern and photos of field survey.
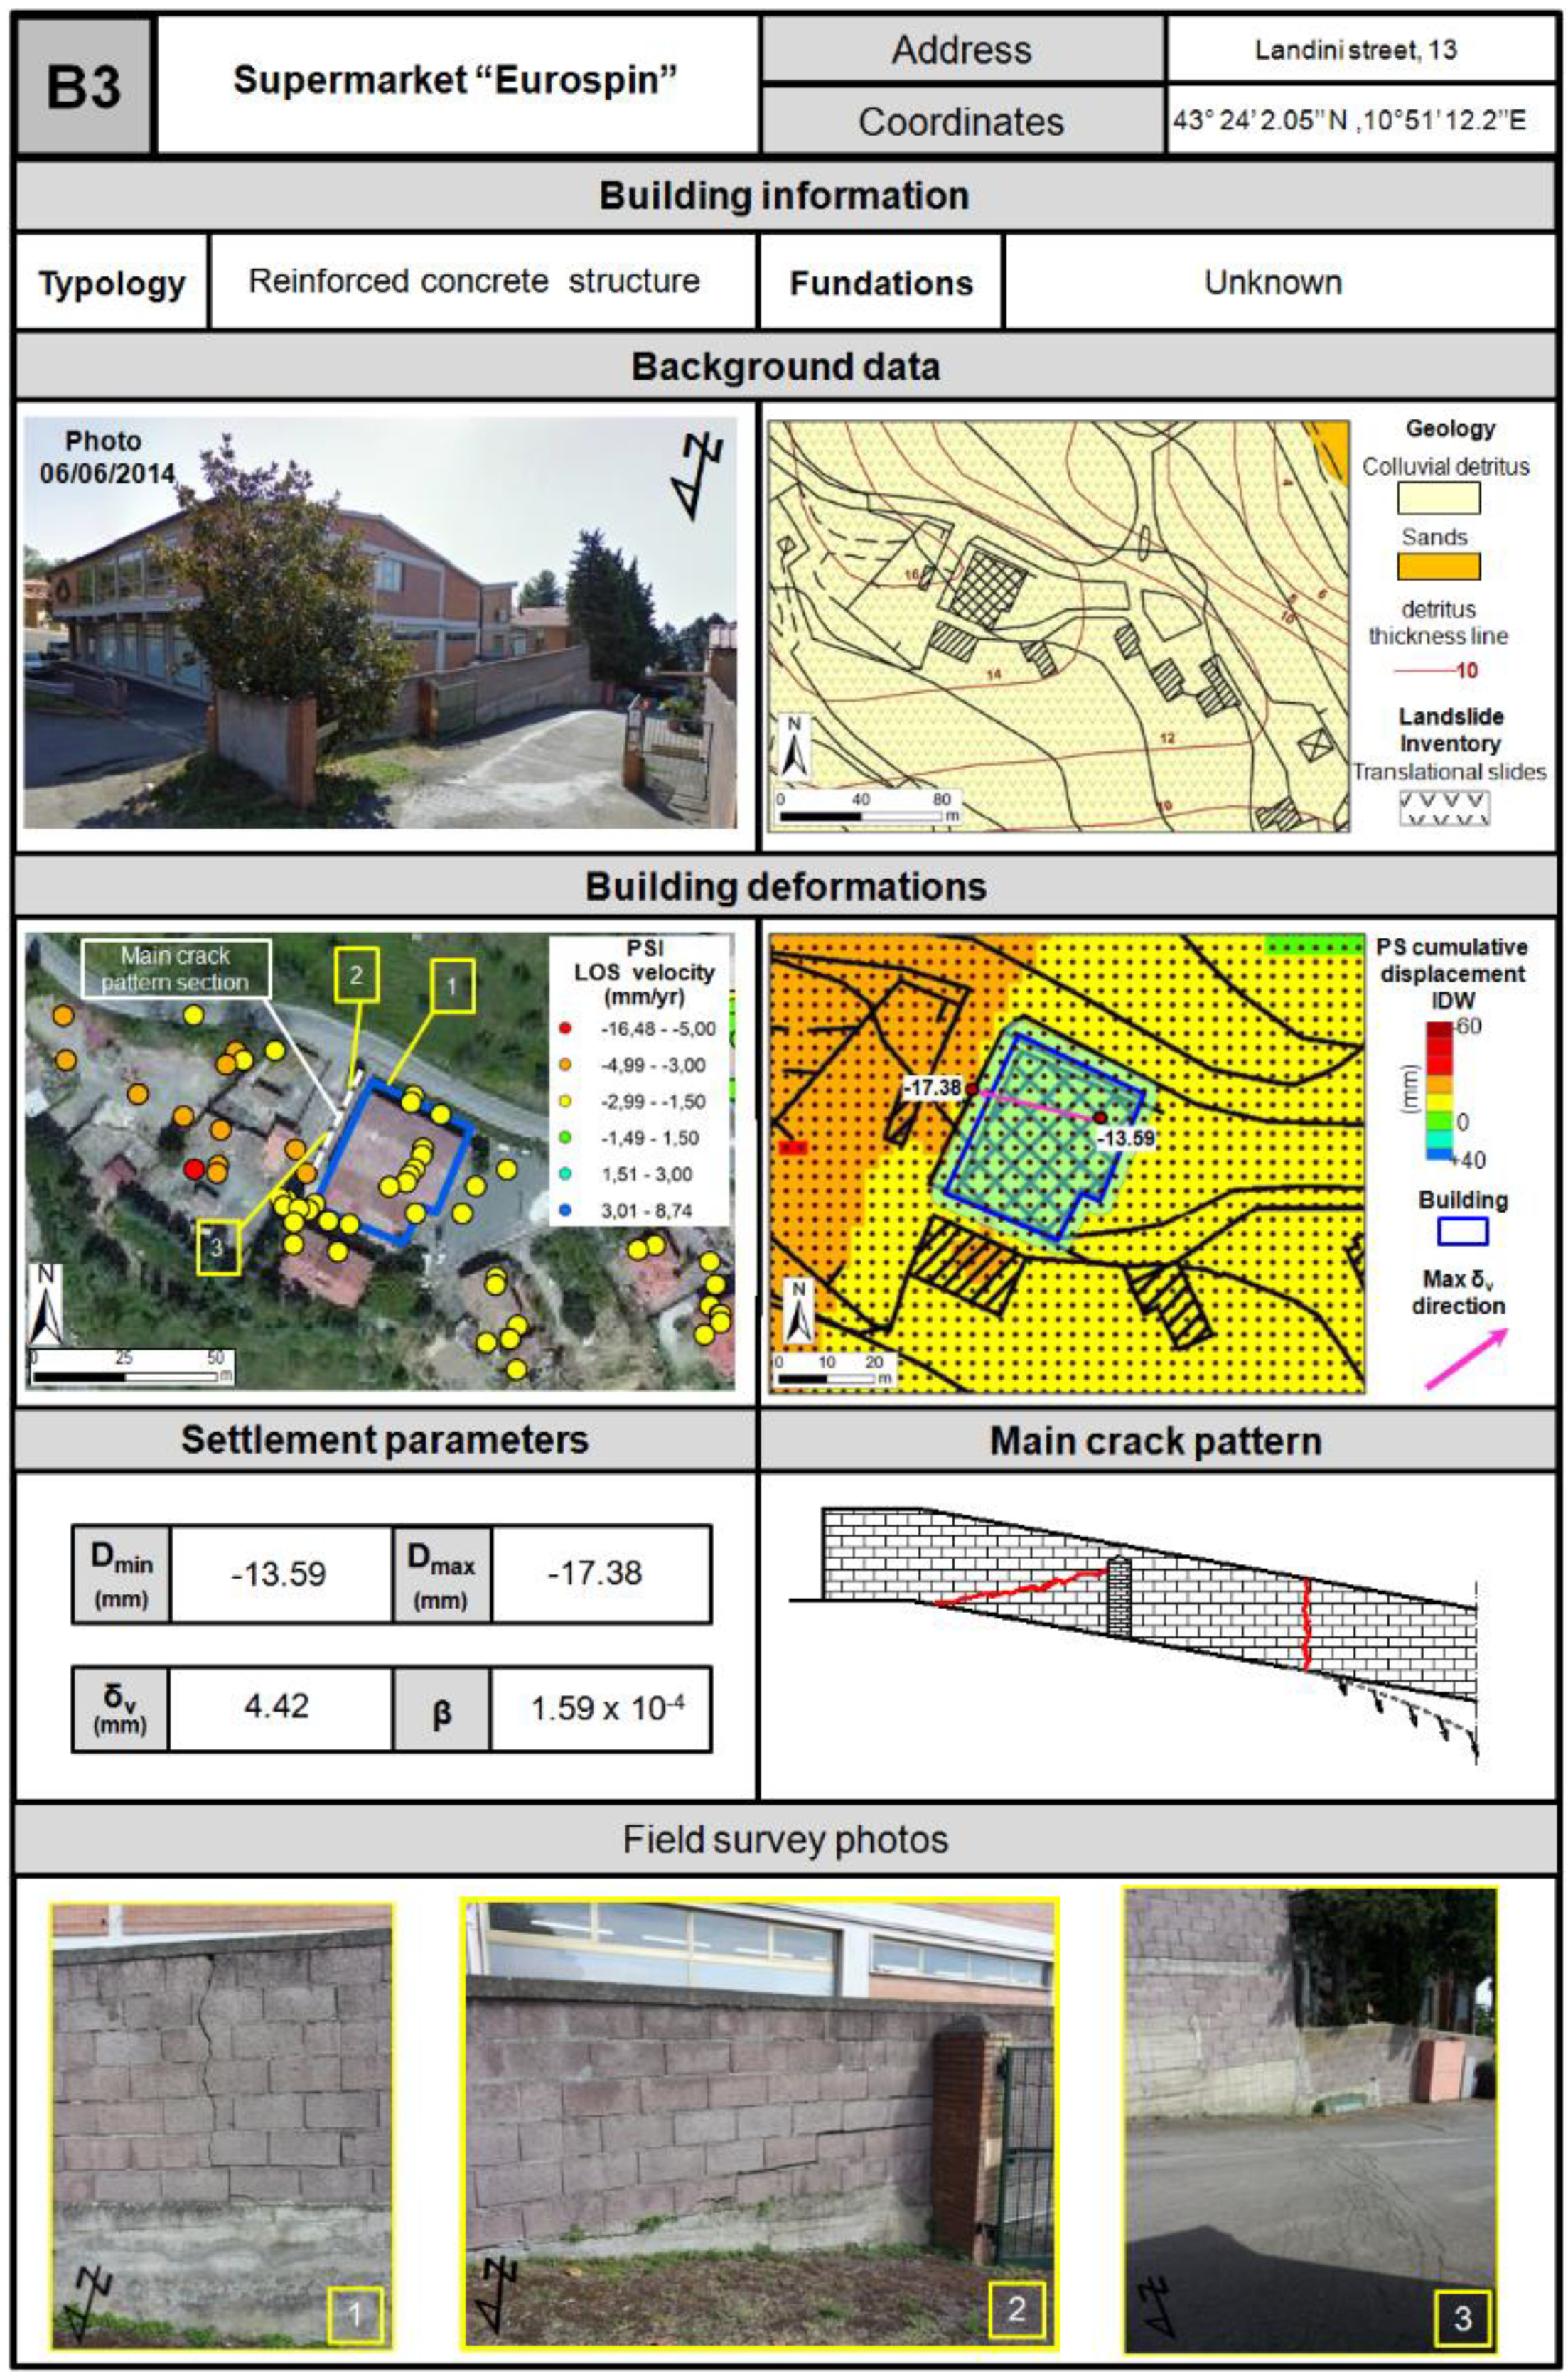
3.3.3. Building B3
Building B3 is a reinforced concrete structure that houses a supermarket (
Figure 8). It is located at an altitude of about 430 m a.s.l., on a 16–14 m-thick colluvial layer that lays on the clayey unit. The area is affected by a dormant translational landslide, which is extended uphill to an altitude of 440 m a.s.l.
Figure 8.
Analysis results of building B3: building information, background data, building deformations, settlement parameters, main crack pattern and photos of field survey.
Figure 8.
Analysis results of building B3: building information, background data, building deformations, settlement parameters, main crack pattern and photos of field survey.
Validation
Field campaign results reveal no evident damages on the supermarket structure. Conversely, on the passageway, scarps and cracks on the road pavement, as well as significant centimetric fissures on the walls show clear landslide evidence and are in agreement with the SW downslope movement.
As a result, PSI data, differential settlement parameters and field checks confirm that the whole area is unstable and landsliding, and the higher movements detected towards W-NW of the building B3 within the landslide body could be determined by the higher thickness of the colluvial deposits, which increases the creeping and slope instability.
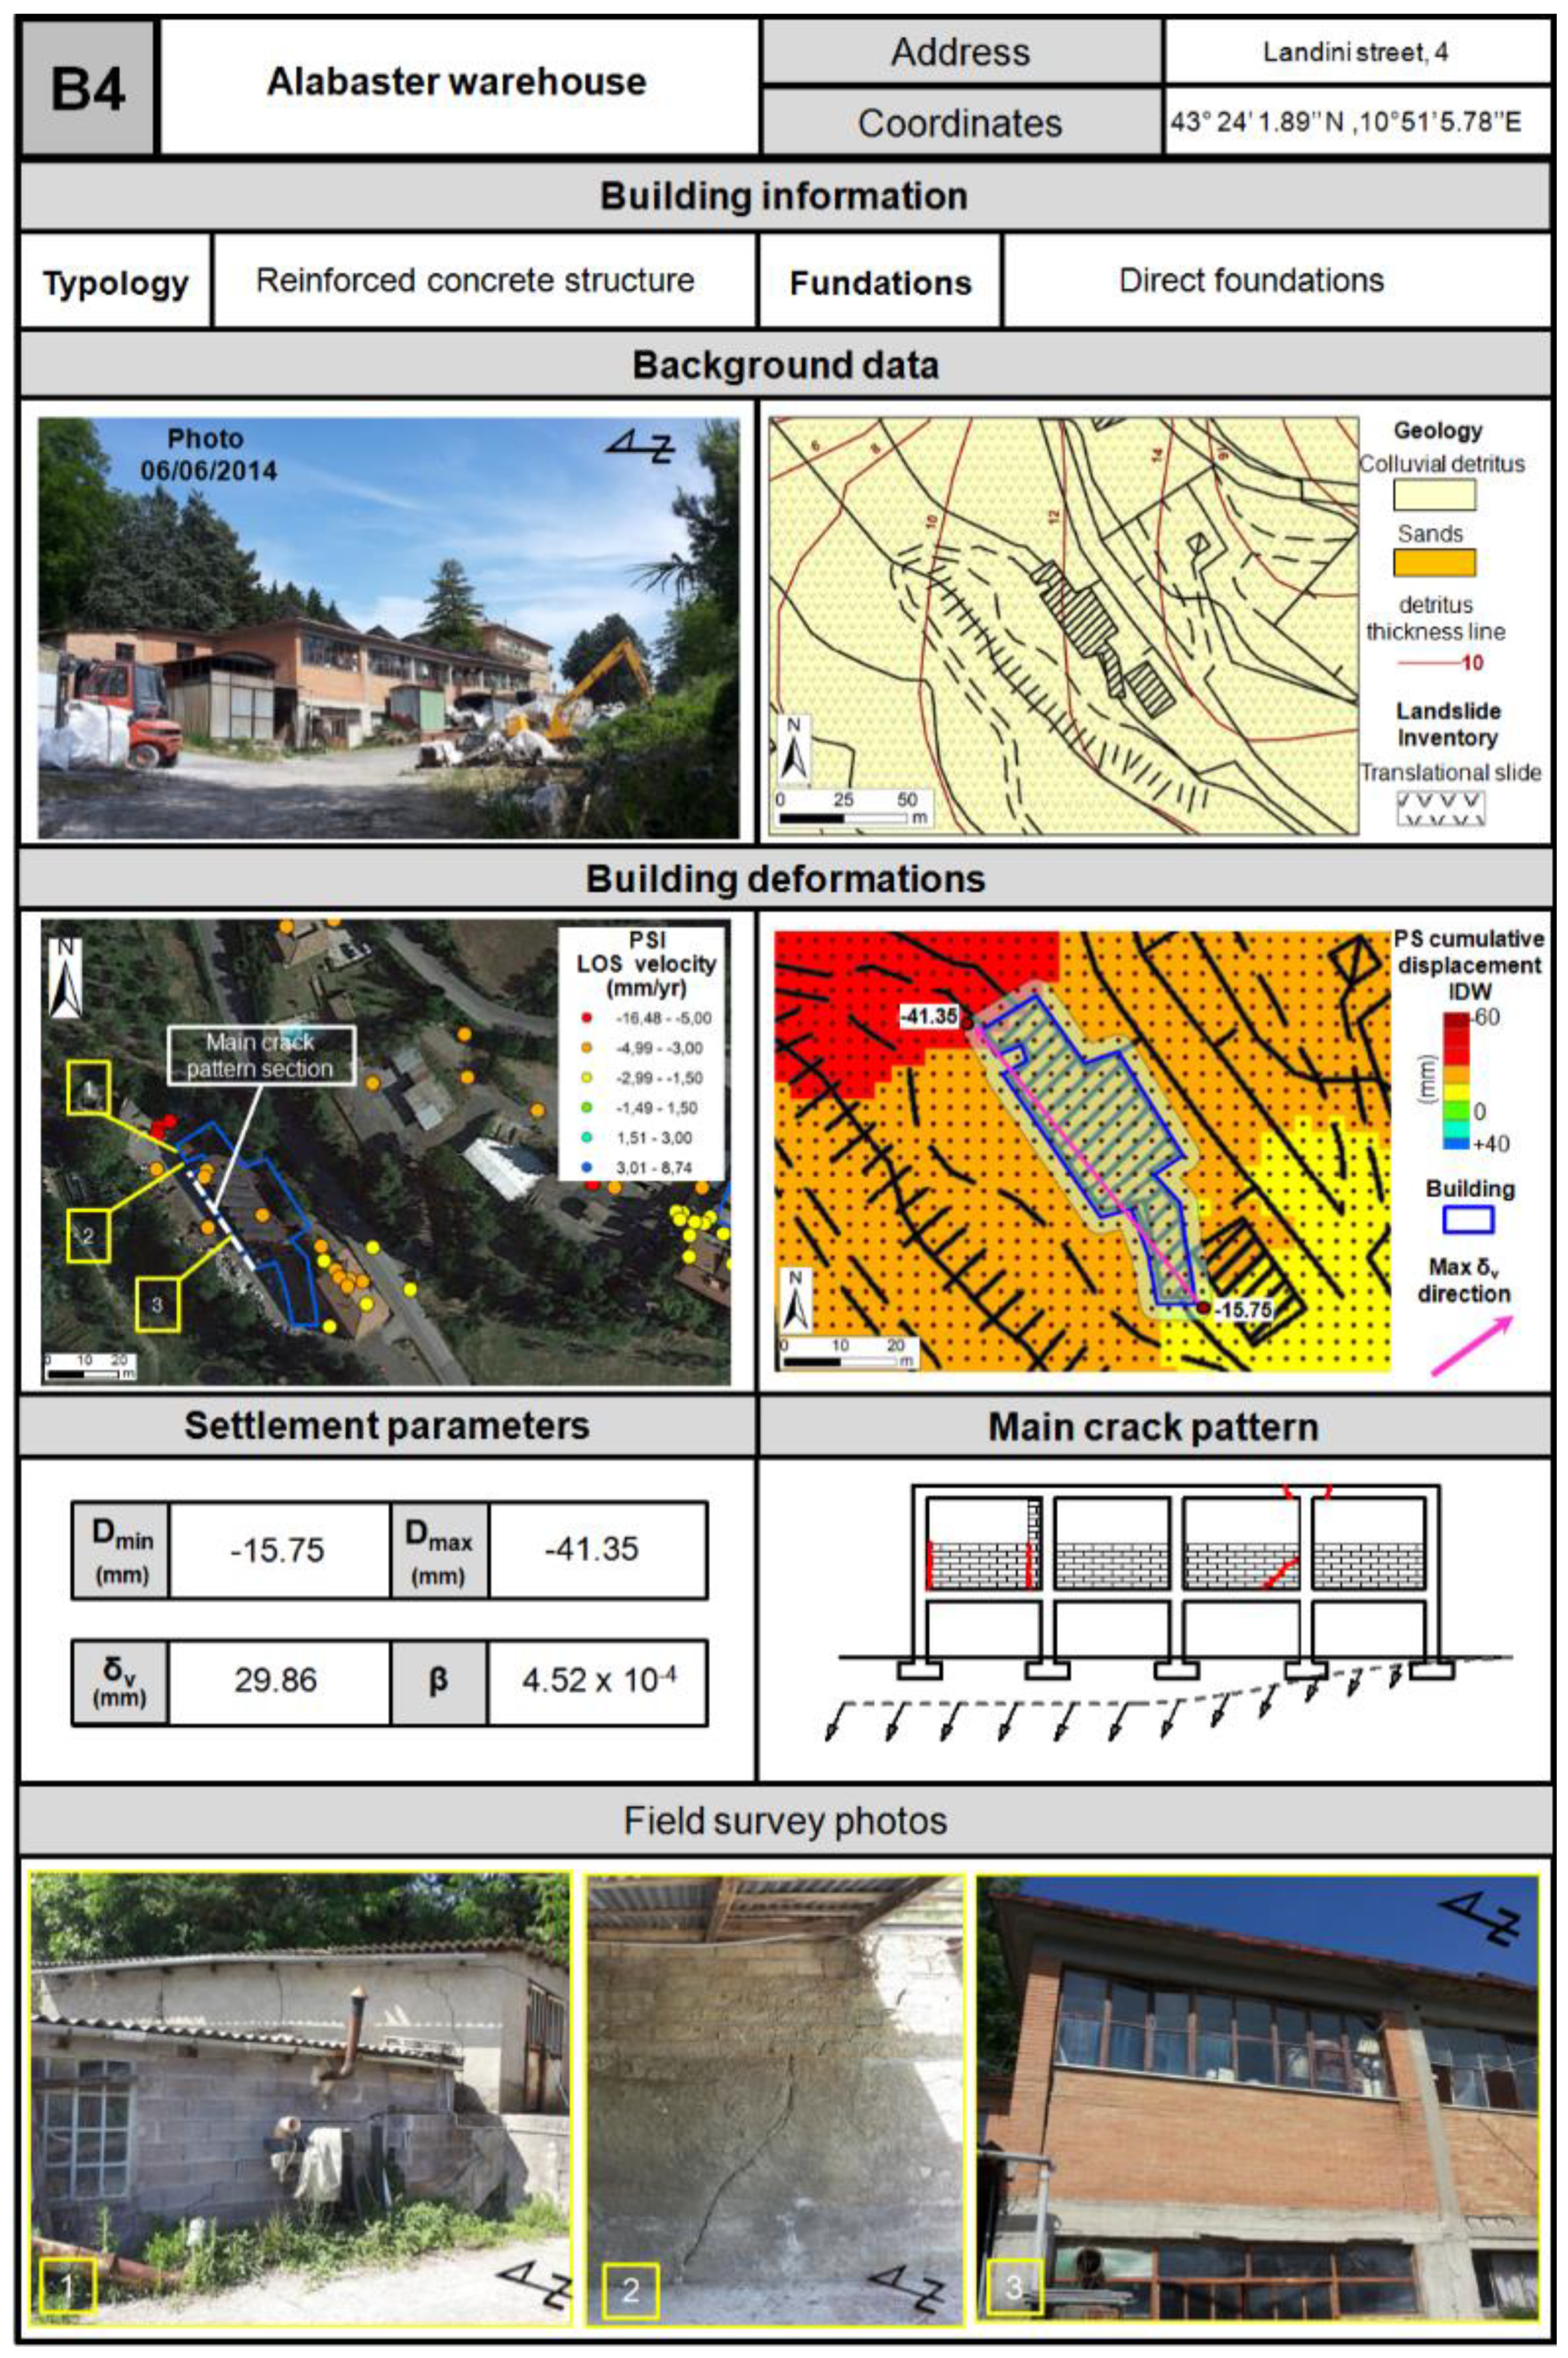
3.3.4. Building B4
Building B4 is an alabaster warehouse that consists of a reinforced concrete structure located at an altitude of 410 m a.s.l. The area is characterized by a 12 m-thick colluvial layer that lays on the clayey unit, and it is affected by the dormant translational landslide that also includes building B3. The landslide slip surface is at an 18-m depth between upper geotechnically poor clays characterized by low shear strength and lower clays with better geotechnical properties,
i.e., a higher shear strength [
39]. The structure has direct foundations consisting of a grade beam placed directly on the ground (
Figure 9).
Validation
The PS data spatial pattern, as well as δ
v and β directions were compared and validated with
in situ observations. Intense damages were surveyed on the building, resulting in millimetric–centimetric cracks on external walls, as shown in
Figure 9.
The location and pattern of damages, normal to tension stresses, resulted in agreement with the orientation of the δv vector.
Figure 9.
Analysis results of building B4: building information, background data, building deformations, settlement parameters, main crack pattern and photos of the field survey.
Figure 9.
Analysis results of building B4: building information, background data, building deformations, settlement parameters, main crack pattern and photos of the field survey.
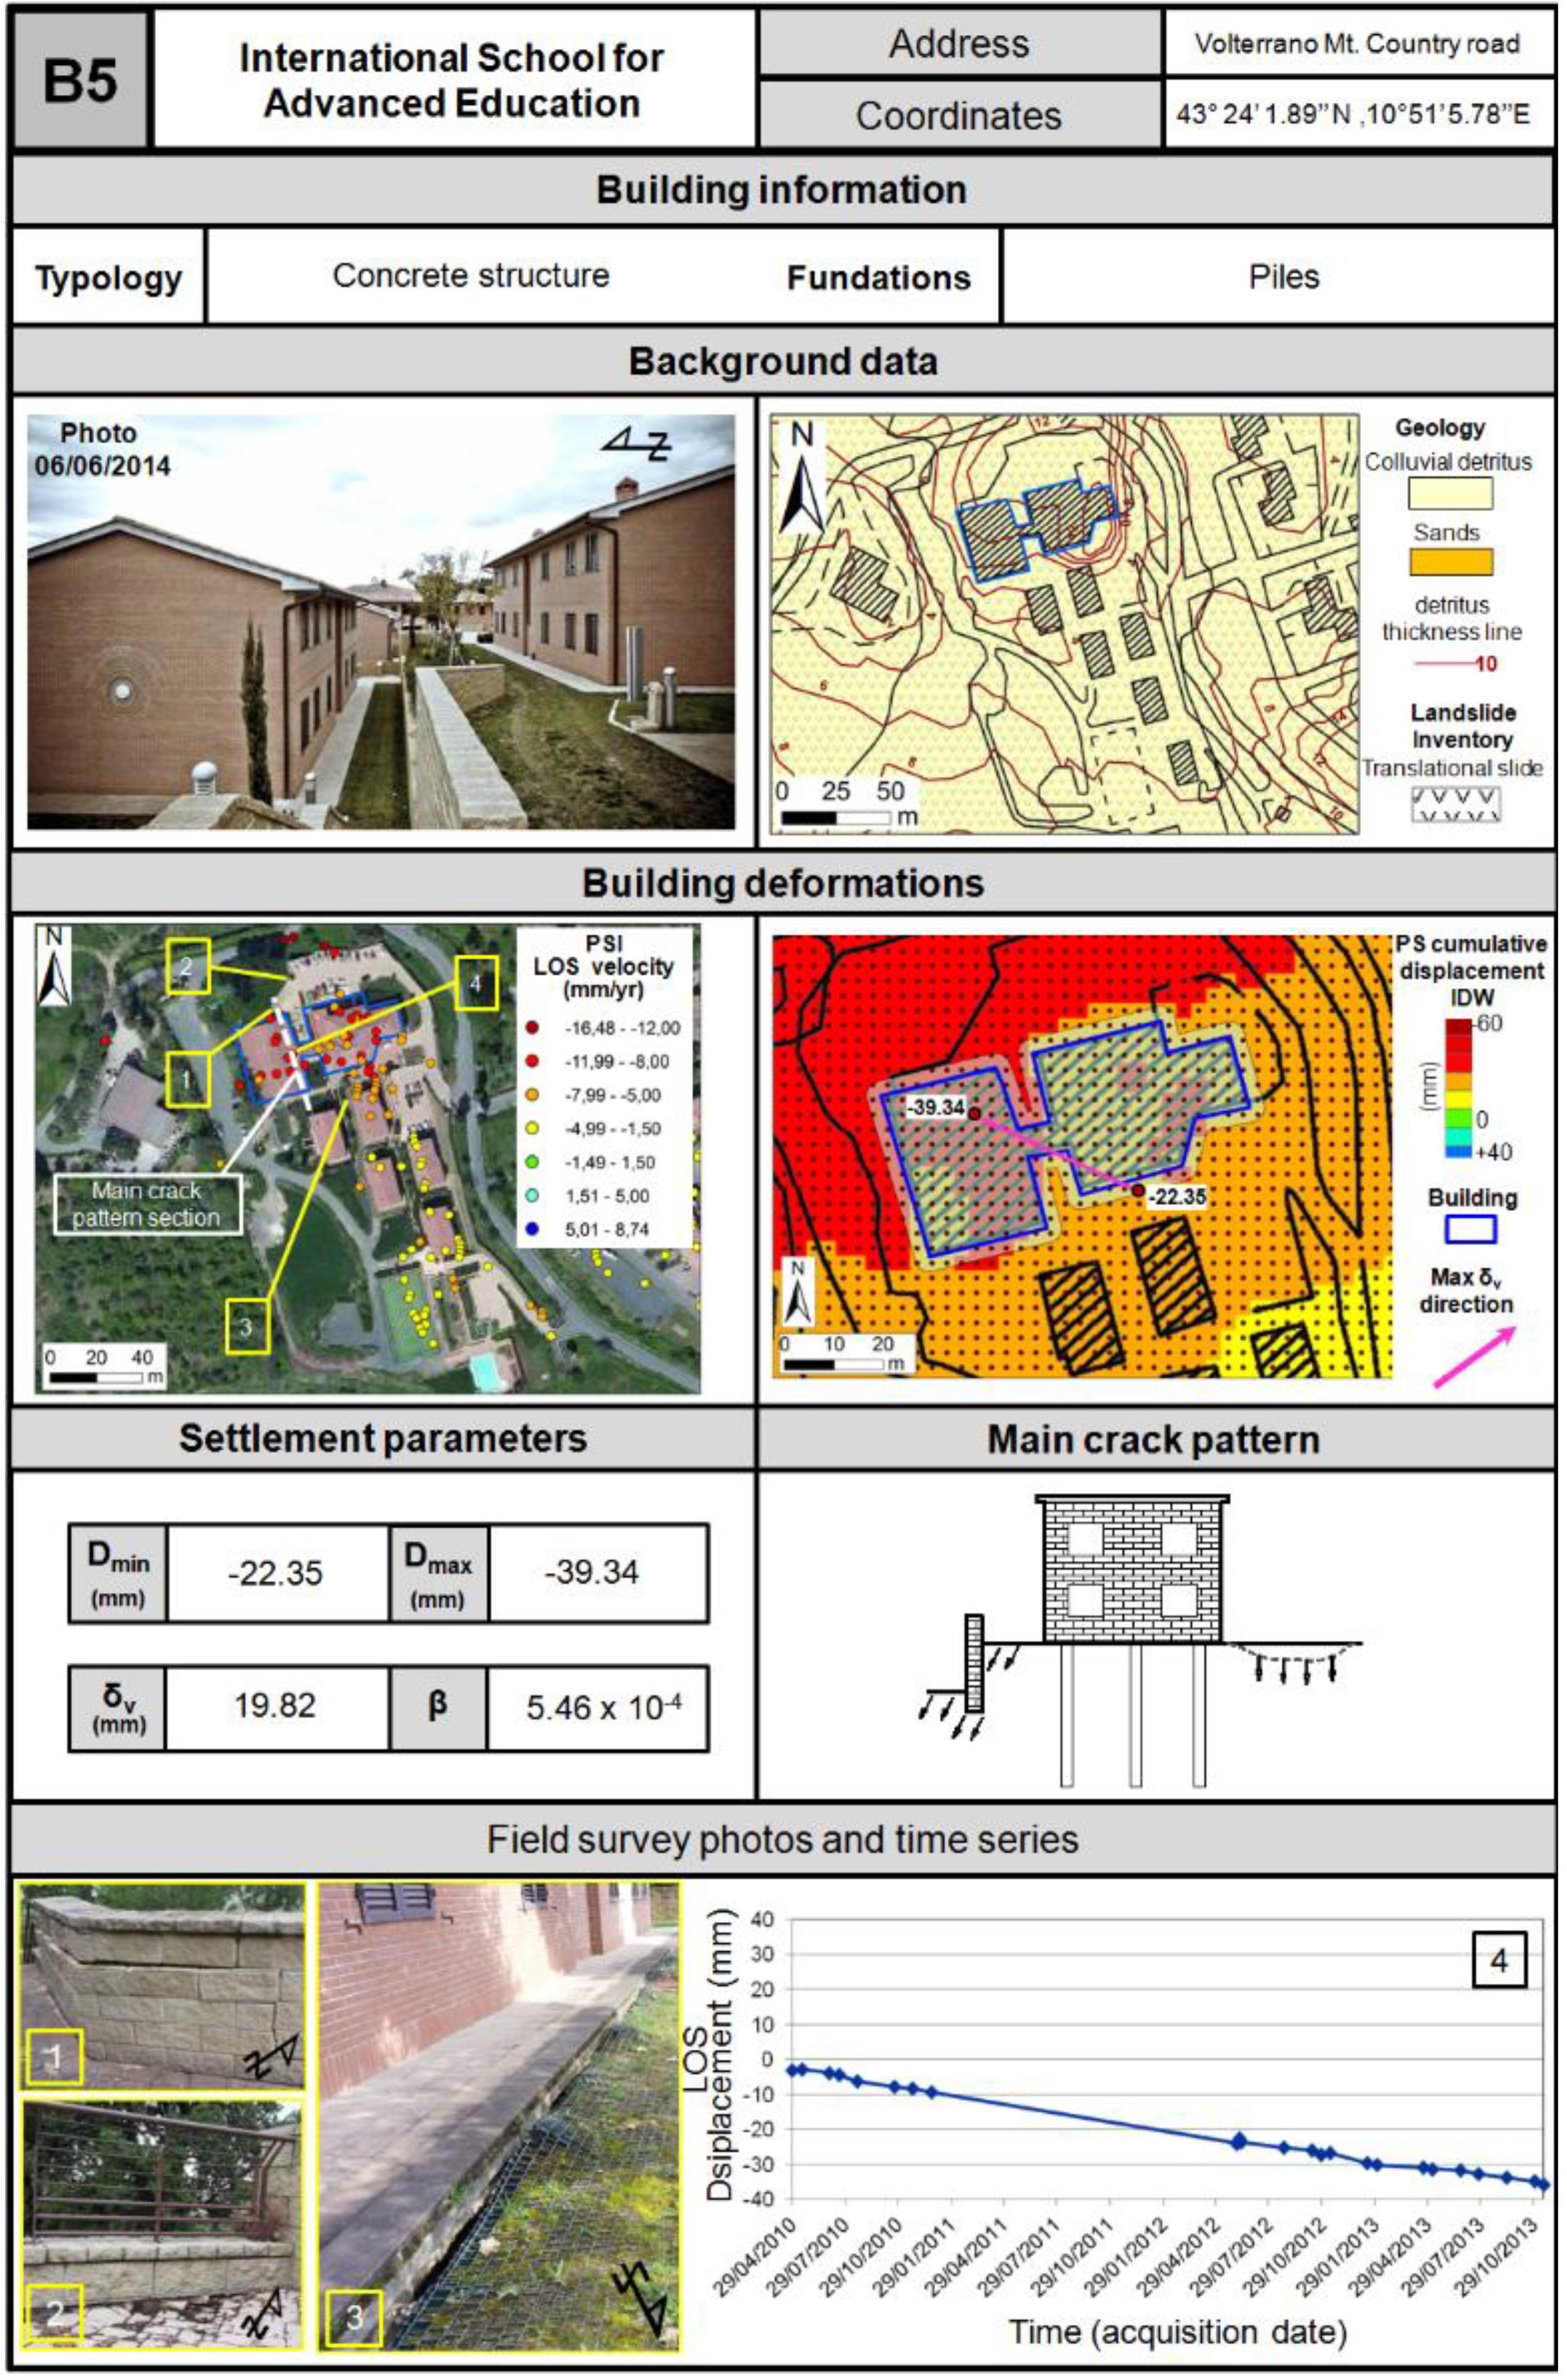
3.3.5. Building B5
Building B5 is the main structure of the modern residential campus owned by the International School for Advanced Education funded by St. Anna School of Advanced Studies of Pisa. The reinforced concrete structure was realized in 2003 using bearing piles for the foundations. It is located at an altitude of about 330–340 m a.s.l. on colluvial layer, whose thickness is very variable in this area, from 4 m up to 12 m (
Figure 10).
Figure 10.
Analysis results of building B5: building information, background data, building deformations, settlement parameters, main crack pattern, some photos of the field survey and a PS time series (the gap during year 2011 is due to missing acquisitions).
Figure 10.
Analysis results of building B5: building information, background data, building deformations, settlement parameters, main crack pattern, some photos of the field survey and a PS time series (the gap during year 2011 is due to missing acquisitions).
Validation
The estimated maximum δ
v is 19.82 mm, and its orientation traces the PSI spatial pattern.
In situ observations revealed that ground movements mainly correspond to compaction of the soil fill (
Figure 9), rather than to structural damages. The more damaged areas are the northward ones, coincident with PS showing highest velocities and maximum cumulative displacements.
4. Discussion
We performed a PSI-based methodology exploiting the IDW interpolation to calculate differential settlement parameters of buildings in the southwestern portion of Volterra (Tuscany region, Italy). The analysis of magnitude and direction of movements combined with on-field surveys and observed damages, as well as with background data (i.e., structural typologies, geological setting and landslide inventory) allowed us to better detect and interpret the ground instabilities of the investigated area and how they influence building deformations.
The use of COSMO-SkyMed X-band data significantly improved the level of detail of the analysis on built-up areas and man-made infrastructure, since many targets show up on roofs and facades [
11,
41,
42]. IDW interpolation was confirmed to be a step forward in the PSI data radar interpretation procedure, firstly introduced by [
43] and then widely used by the scientific community, extending the point-like information stored in the PS benchmarks.
The five example buildings described in this paper (B1 to B5) are representative of the whole southwestern area of Volterra and characterized by different geological conditions and structural typologies (
Table 2).
Within the Volterra sedimentary sequence, the upper calcarenites and sands, which outcrop at altitudes higher than 450 m in the study area, are stable with respect to lower clays and to the colluvial layer that covers the sequence. This was confirmed by the results obtained for the public school (building B1) that is built on a stable sandy formation through direct foundations and shows low values of differential settlement (δv = 4.94 mm and β = 9.03 × 10⁻⁵), which is consistent with the overall good conditions revealed by on-site surveys.
Conversely, slow-moving landslide phenomena involving clays and colluvial detritus can cause intense damages and differential settlement on buildings. Moreover, the choice of a suitable type of foundation combined with the terrain morphology can play an important role in the occurrence of movements and consequent damages on buildings.
This clearly emerged during the analysis of building B2, which is a private housing estate consisting of two edifices, B2i and B2ii. Both edifices show high values of angular distortion (β = 6.04 × 10⁻⁴ and 1.84 × 10⁻⁴) and B2i also a high δv value of 20.96 mm, in accordance with the extensive cracks on the facades of building B2ii and the vertical split at the mid-length of B2i. The structural failures are mainly due to the very thick colluvial layer that overlaps the clayey basement, covering a morphological scarp, where bearing piles are not effective.
Building B3 and building B4, respectively the supermarket and the alabaster warehouse, are located within a landslide area. This downslope translational ground movement is confirmed by the high mean PSI velocities that reach up to rates of about 6–8 mm/year. In particular, building B4 shows the highest δv (29.86 mm) and high β value (4.52 × 10⁻⁴) due to the significant spatial trend of the movement. On the other hand, building B3 shows the lowest δv value (4.42 mm), since the highest motion rates are located westwards of the “building area”. The cross-comparison of PSI data, δv and β values and directions and in situ observations revealed that the crack patterns surveyed on both buildings are compatible with ground motion rates due to the slow-moving landslide phenomenon.
Movements detected on the surface by PSI data can also be related to unstable fill soil or embankments allocated for building construction. This is the case of building B5, which is a recently built structure that houses the International School for Advanced Education. PSI data show the highest motion rates of the whole study area, reaching up to mean velocity values of 10–12 mm/year and cumulative displacements of about 35–40 mm at the last acquisition date (15 November 2013). In situ checks performed in April–May, 2014, have shown that damages occurred only on the external areas of the structure and clearly evidenced problems with the sediment earthwork.
These examples illustrate well that PSI-based deformation assessment performed at the desk, prior to in situ investigations, need to be validated by background data and field survey, in order to better assess the causes of movements and whether the detected motions correspond to visible and effective damages on buildings.
A wide number of limiting criteria for maximum settlement and angular distortion values are available in the geotechnical literature [
29,
30,
31] and technical standards [
28,
32]. The maximum allowable settlement and angular distortion can be defined in relation to the type of structure (
i.e., stiffness and use), foundation soil and foundation type (piles or direct foundations). For instance, a maximum angular distortion value of 3 × 10
−4 can be broadly defined for civil buildings on sandy and clayey terrain [
24,
29]. As a future outlook for the proposed methodological procedure, a rating system for the admissibility of differential settlement values could be tackled more specifically, according to the criterion of the serviceability limit states and to the temporal coverage of input radar datasets.


