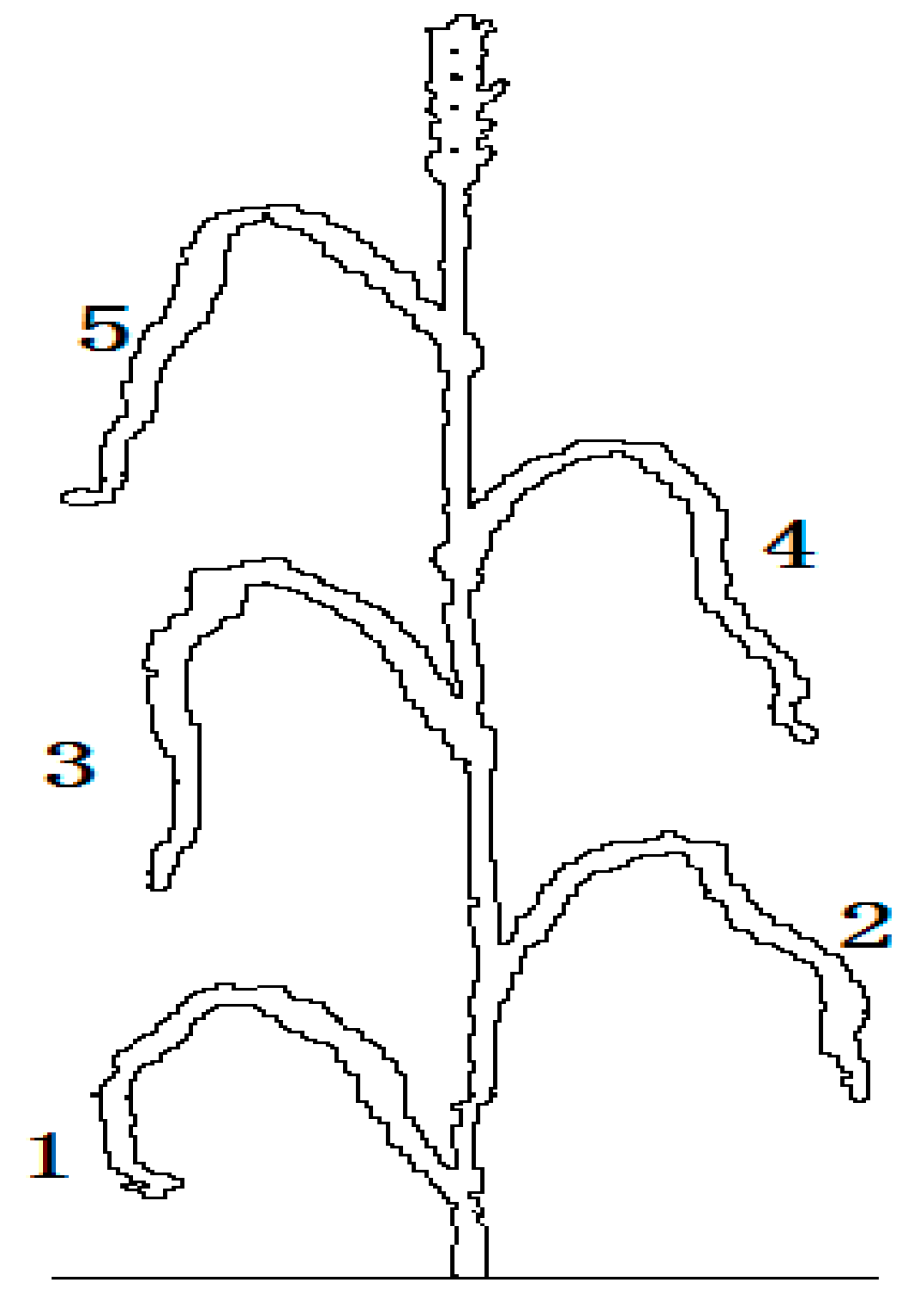
4.1. The Vertical Distribution of Water Content within a Winter Wheat Canopy
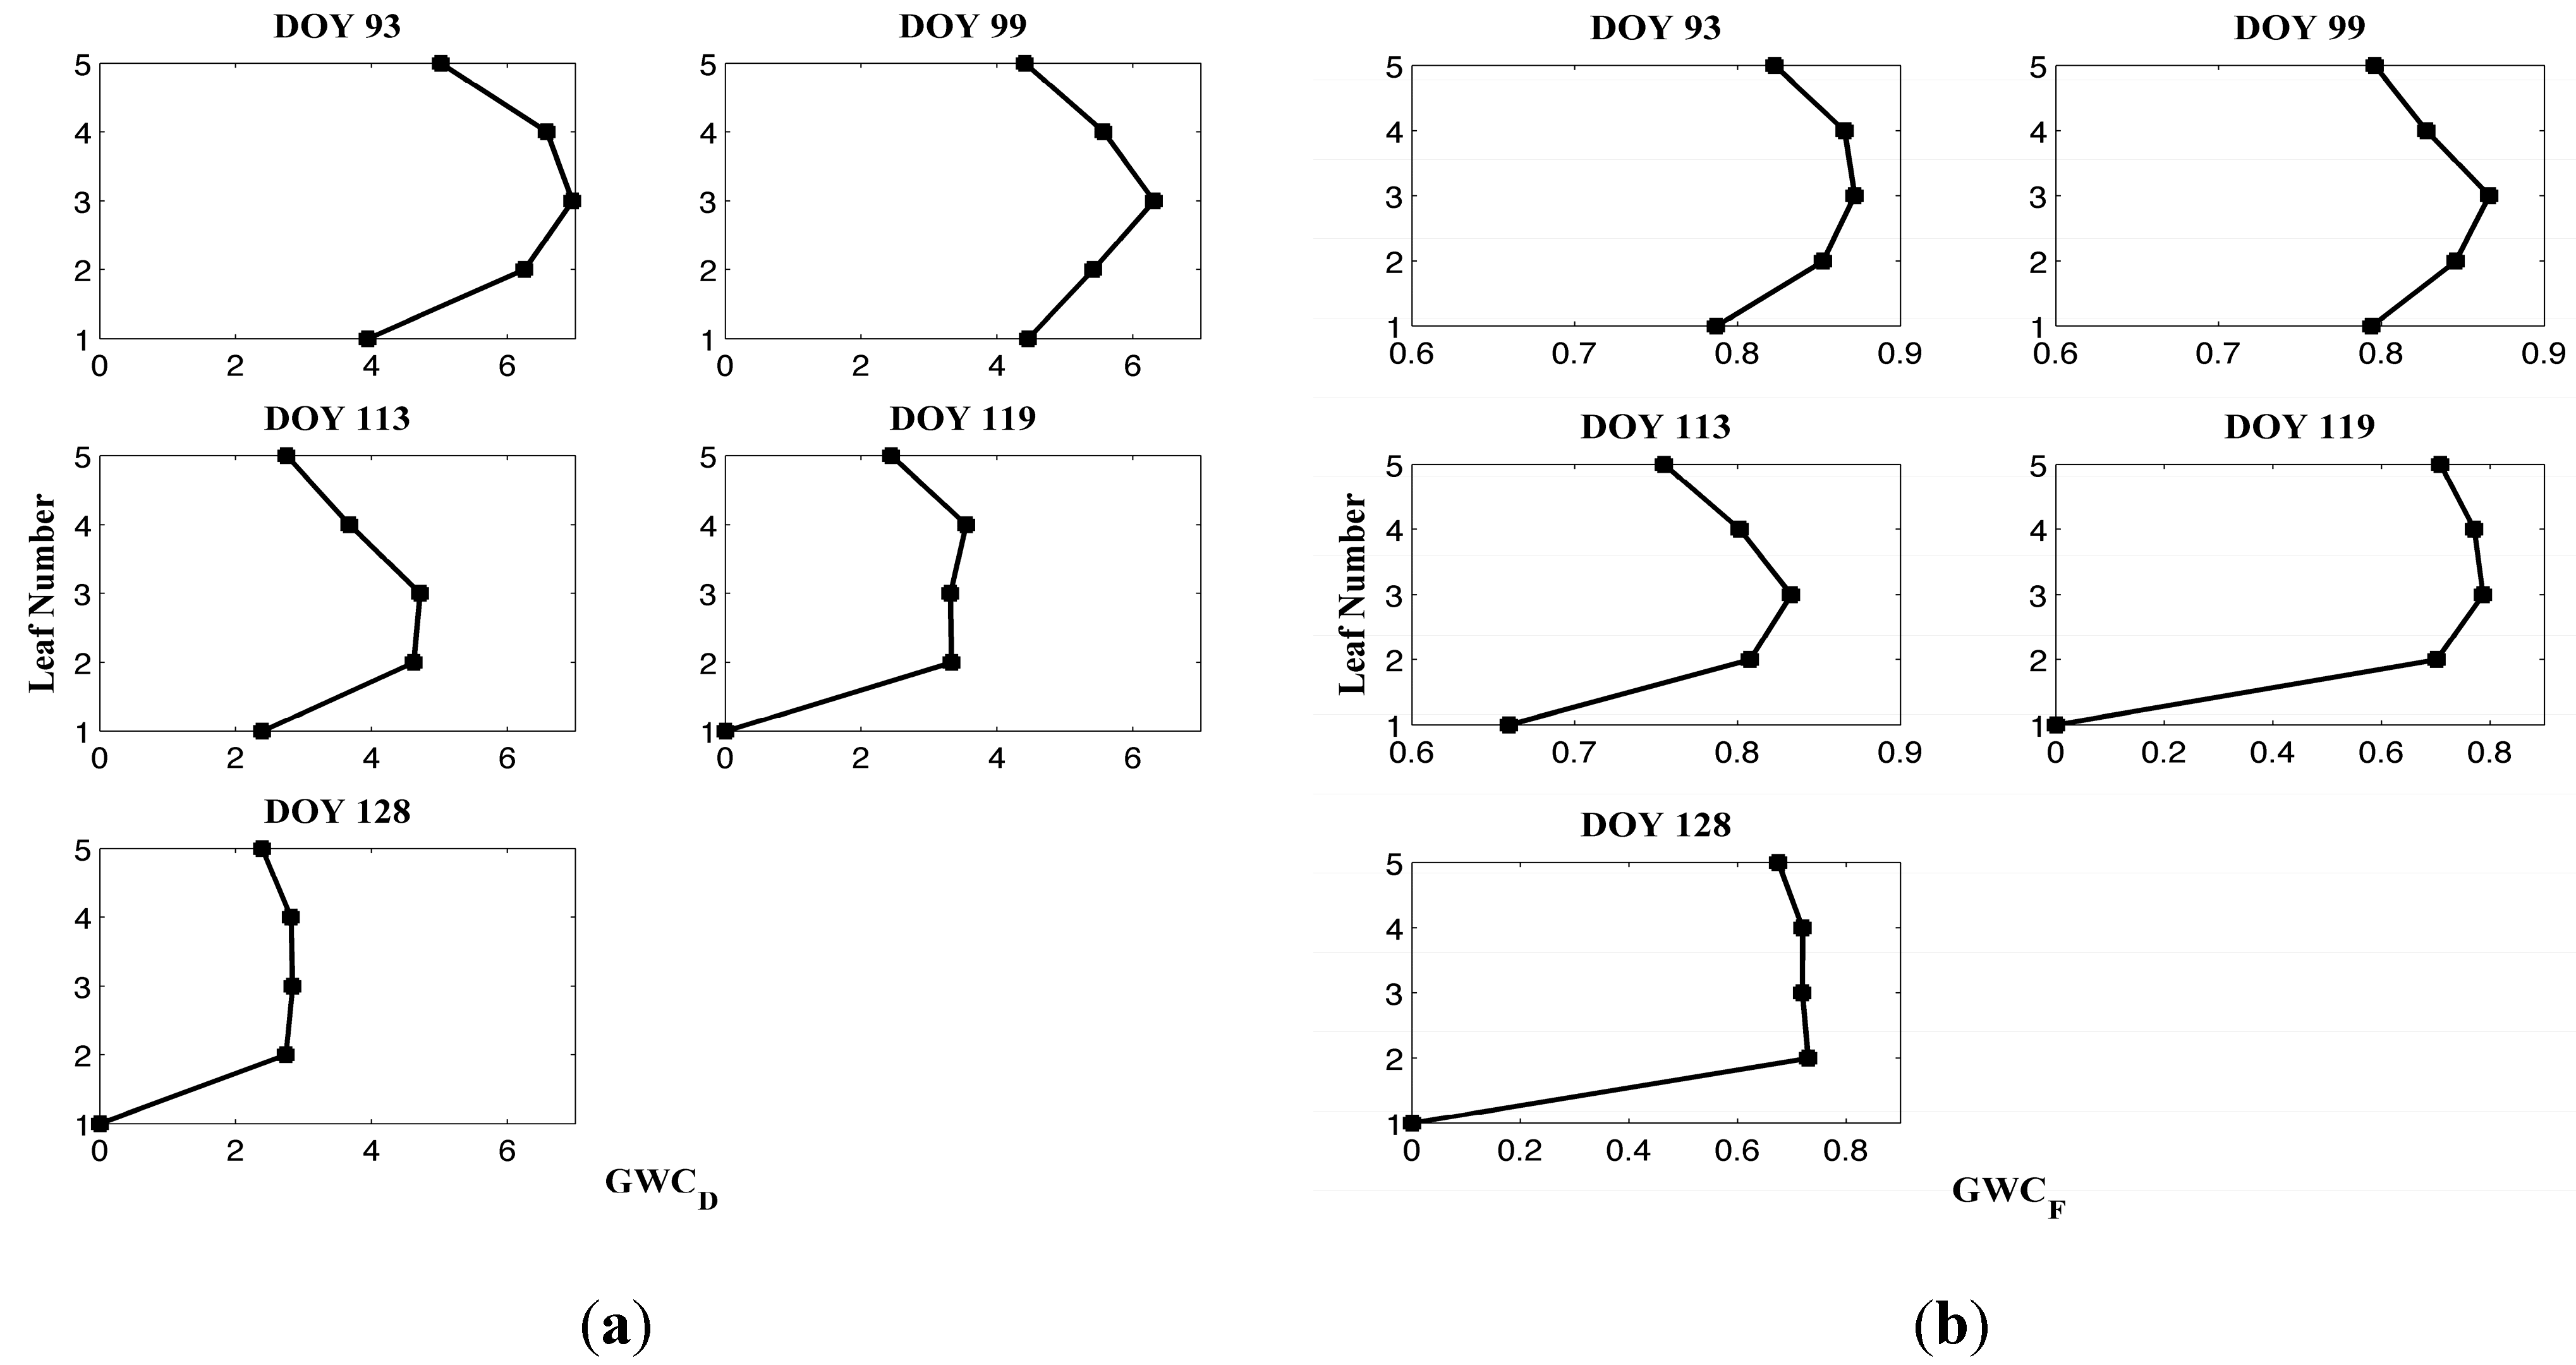
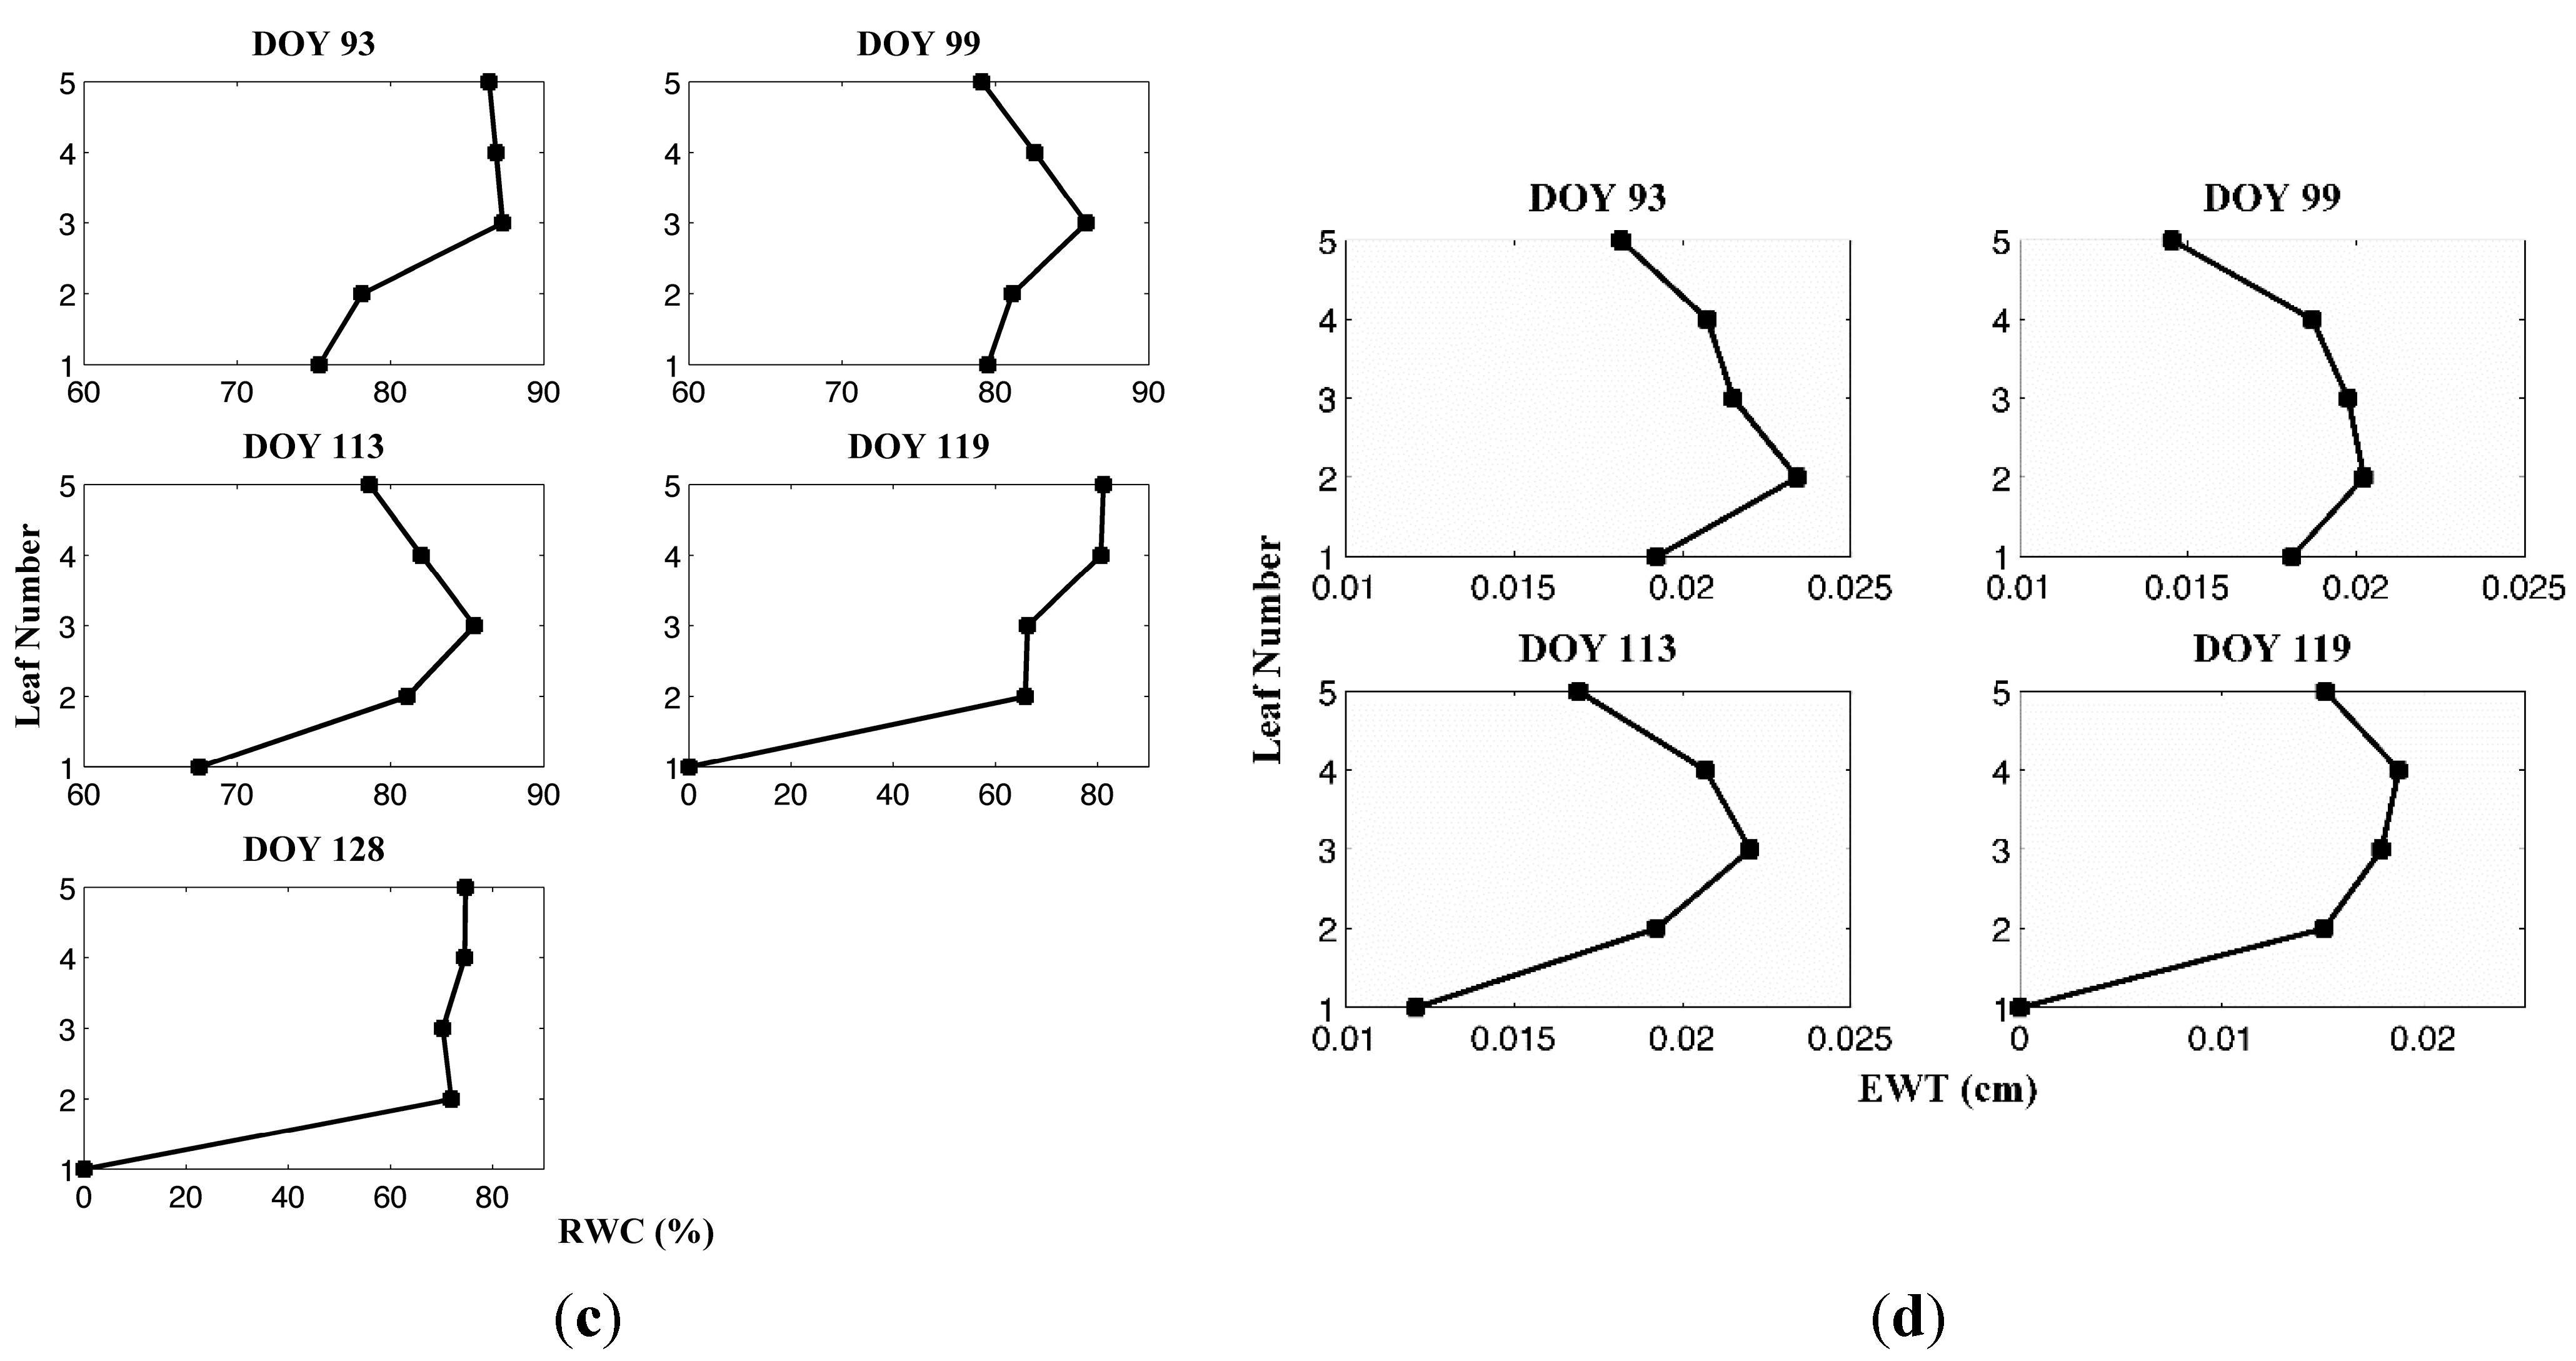
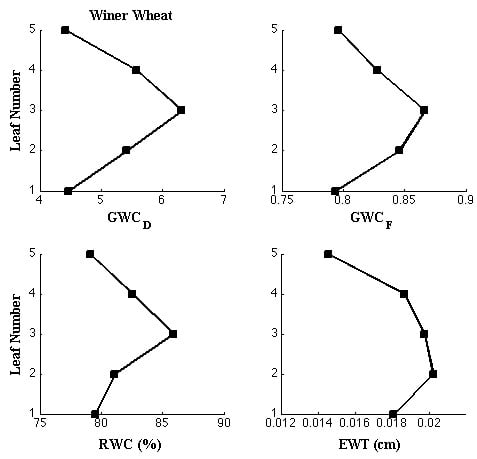
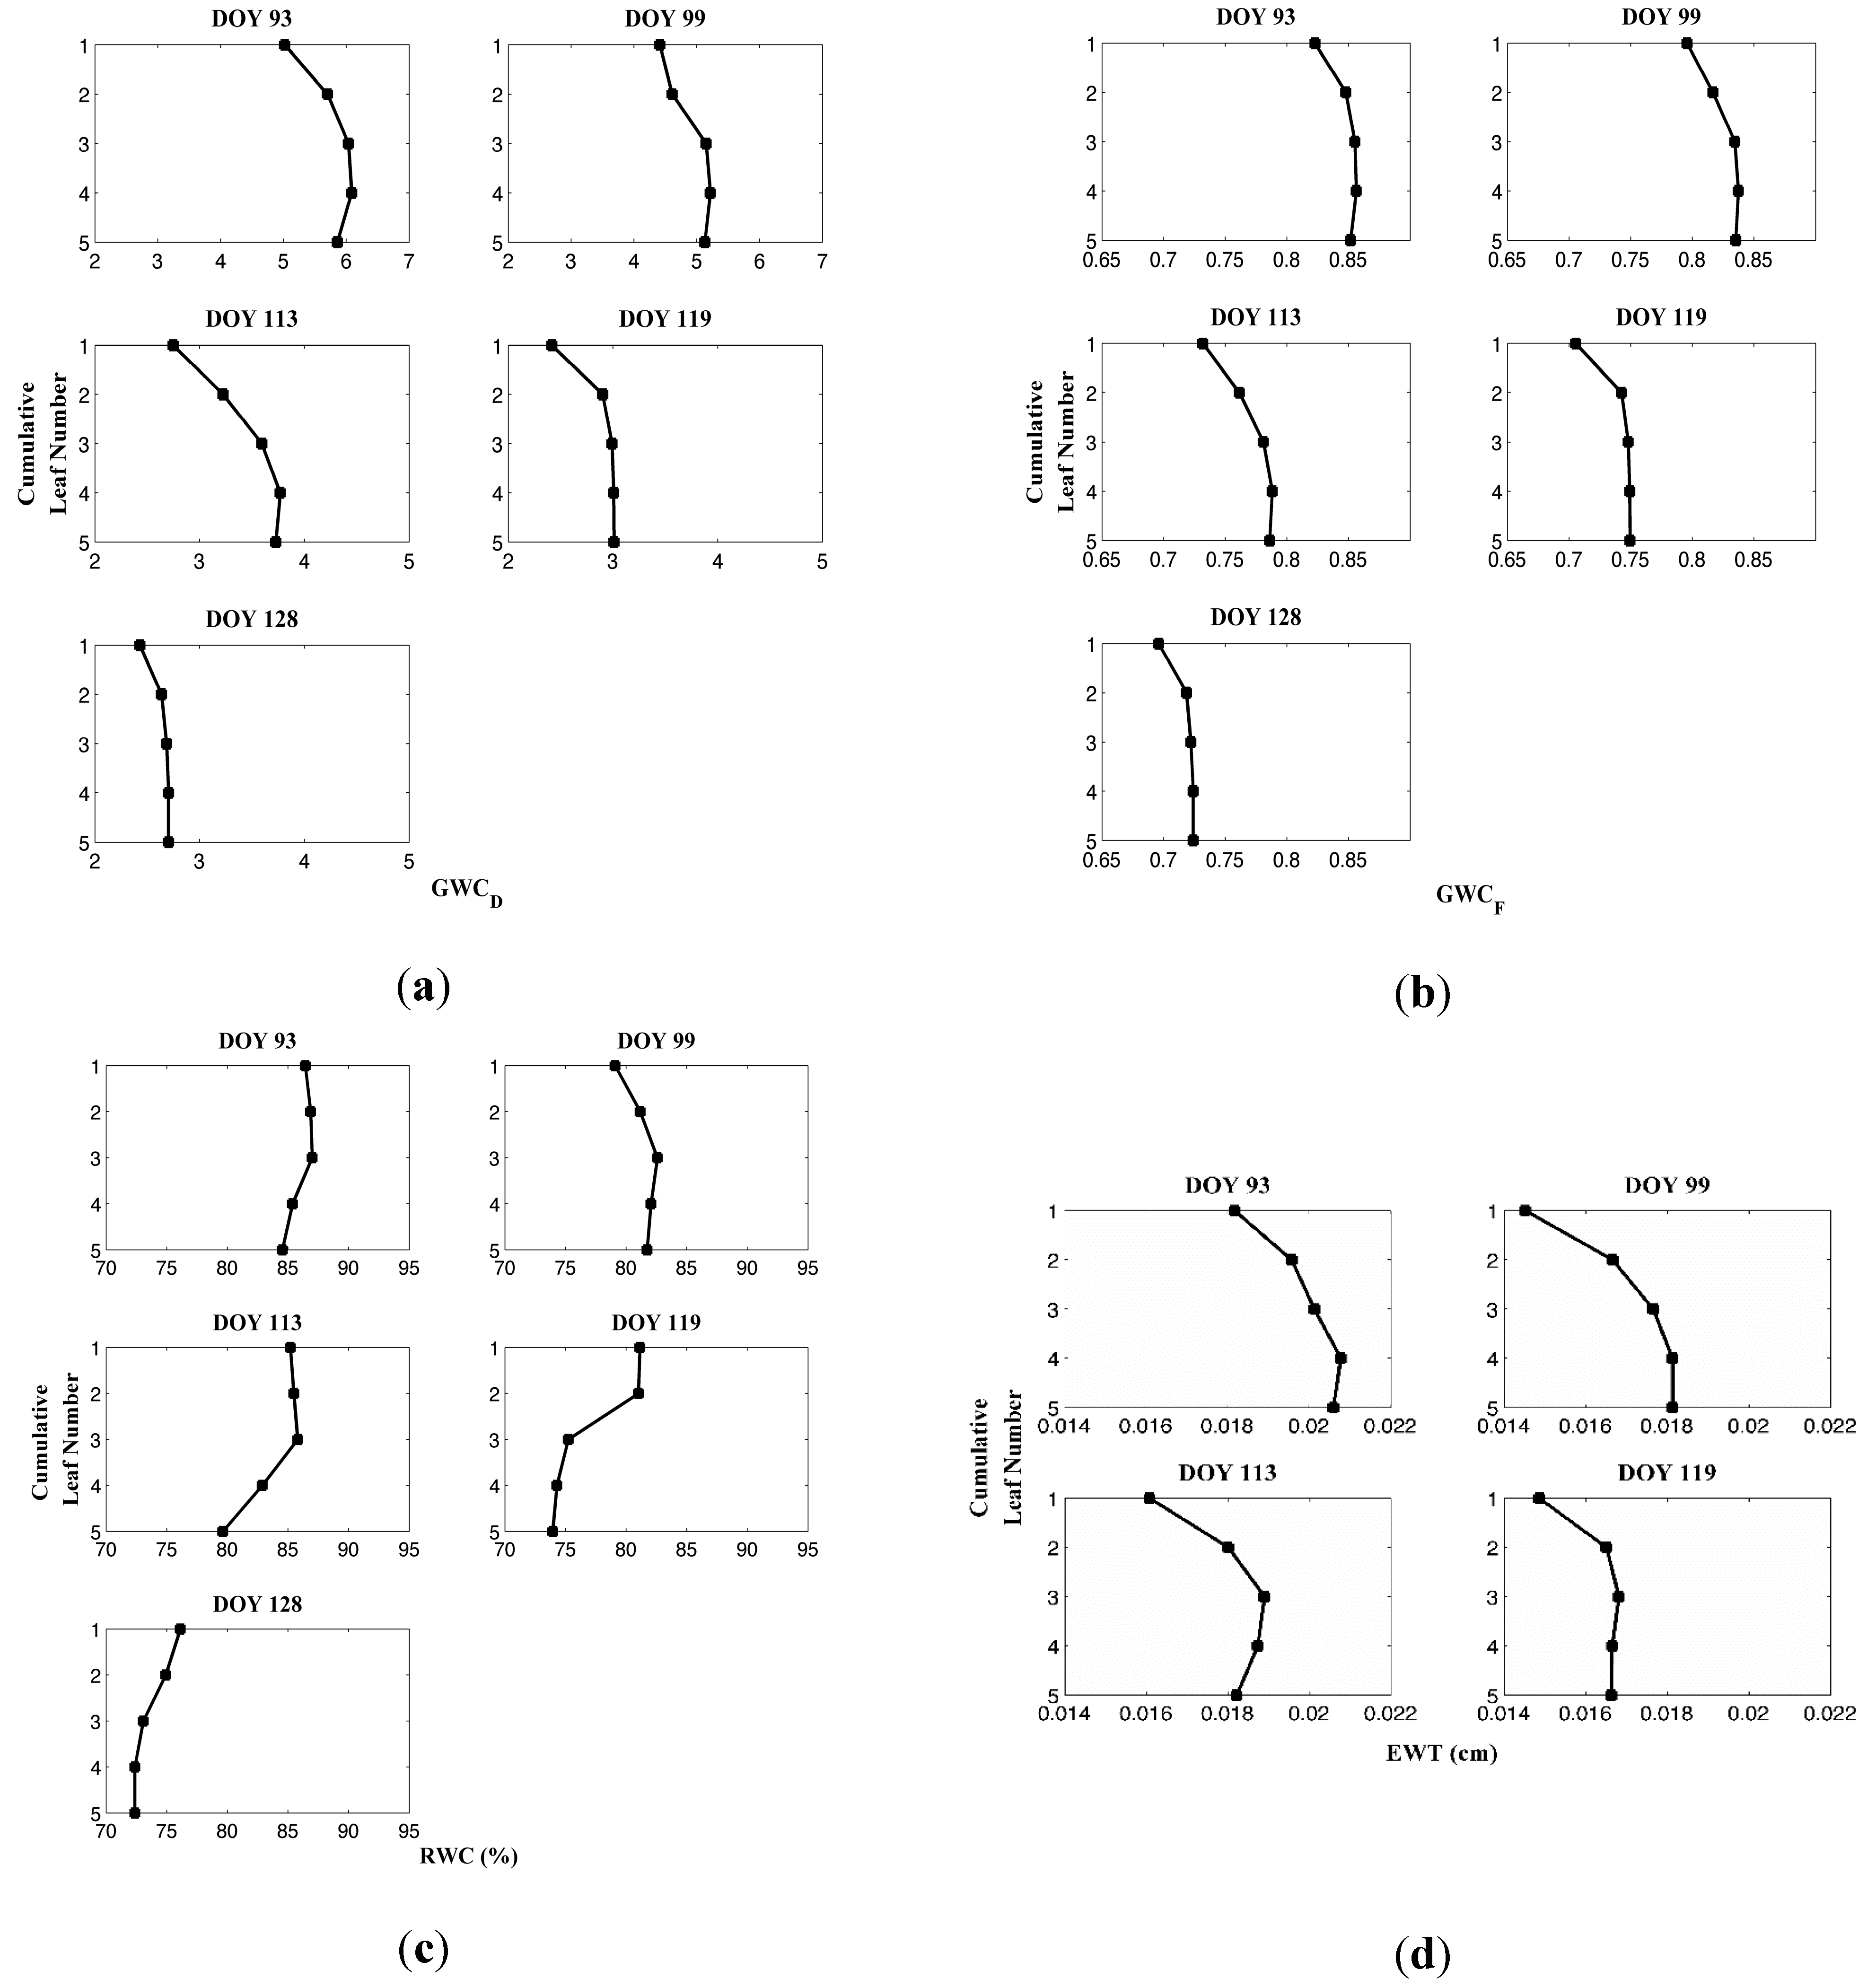
In this study, we evaluated the vertical distribution of four water-related properties (GWCD , GWCF, RWC, and EWT) within a winter wheat canopy during heading and early ripening stages. Our analysis showed that the vertical distribution of GWCD , GWCF, RWC, and EWT followed a near-bell-shaped curve with the highest values at the intermediate leaf position and the lowest value at the bottom leaf. After the emergence of the flag leaf (the top leaf), it contributes to the major part of photosynthesis and transpiration of wheat canopy. Since the flag leaf may consume more water through evapotranspiration, it contained less water than the intermediate leaves.
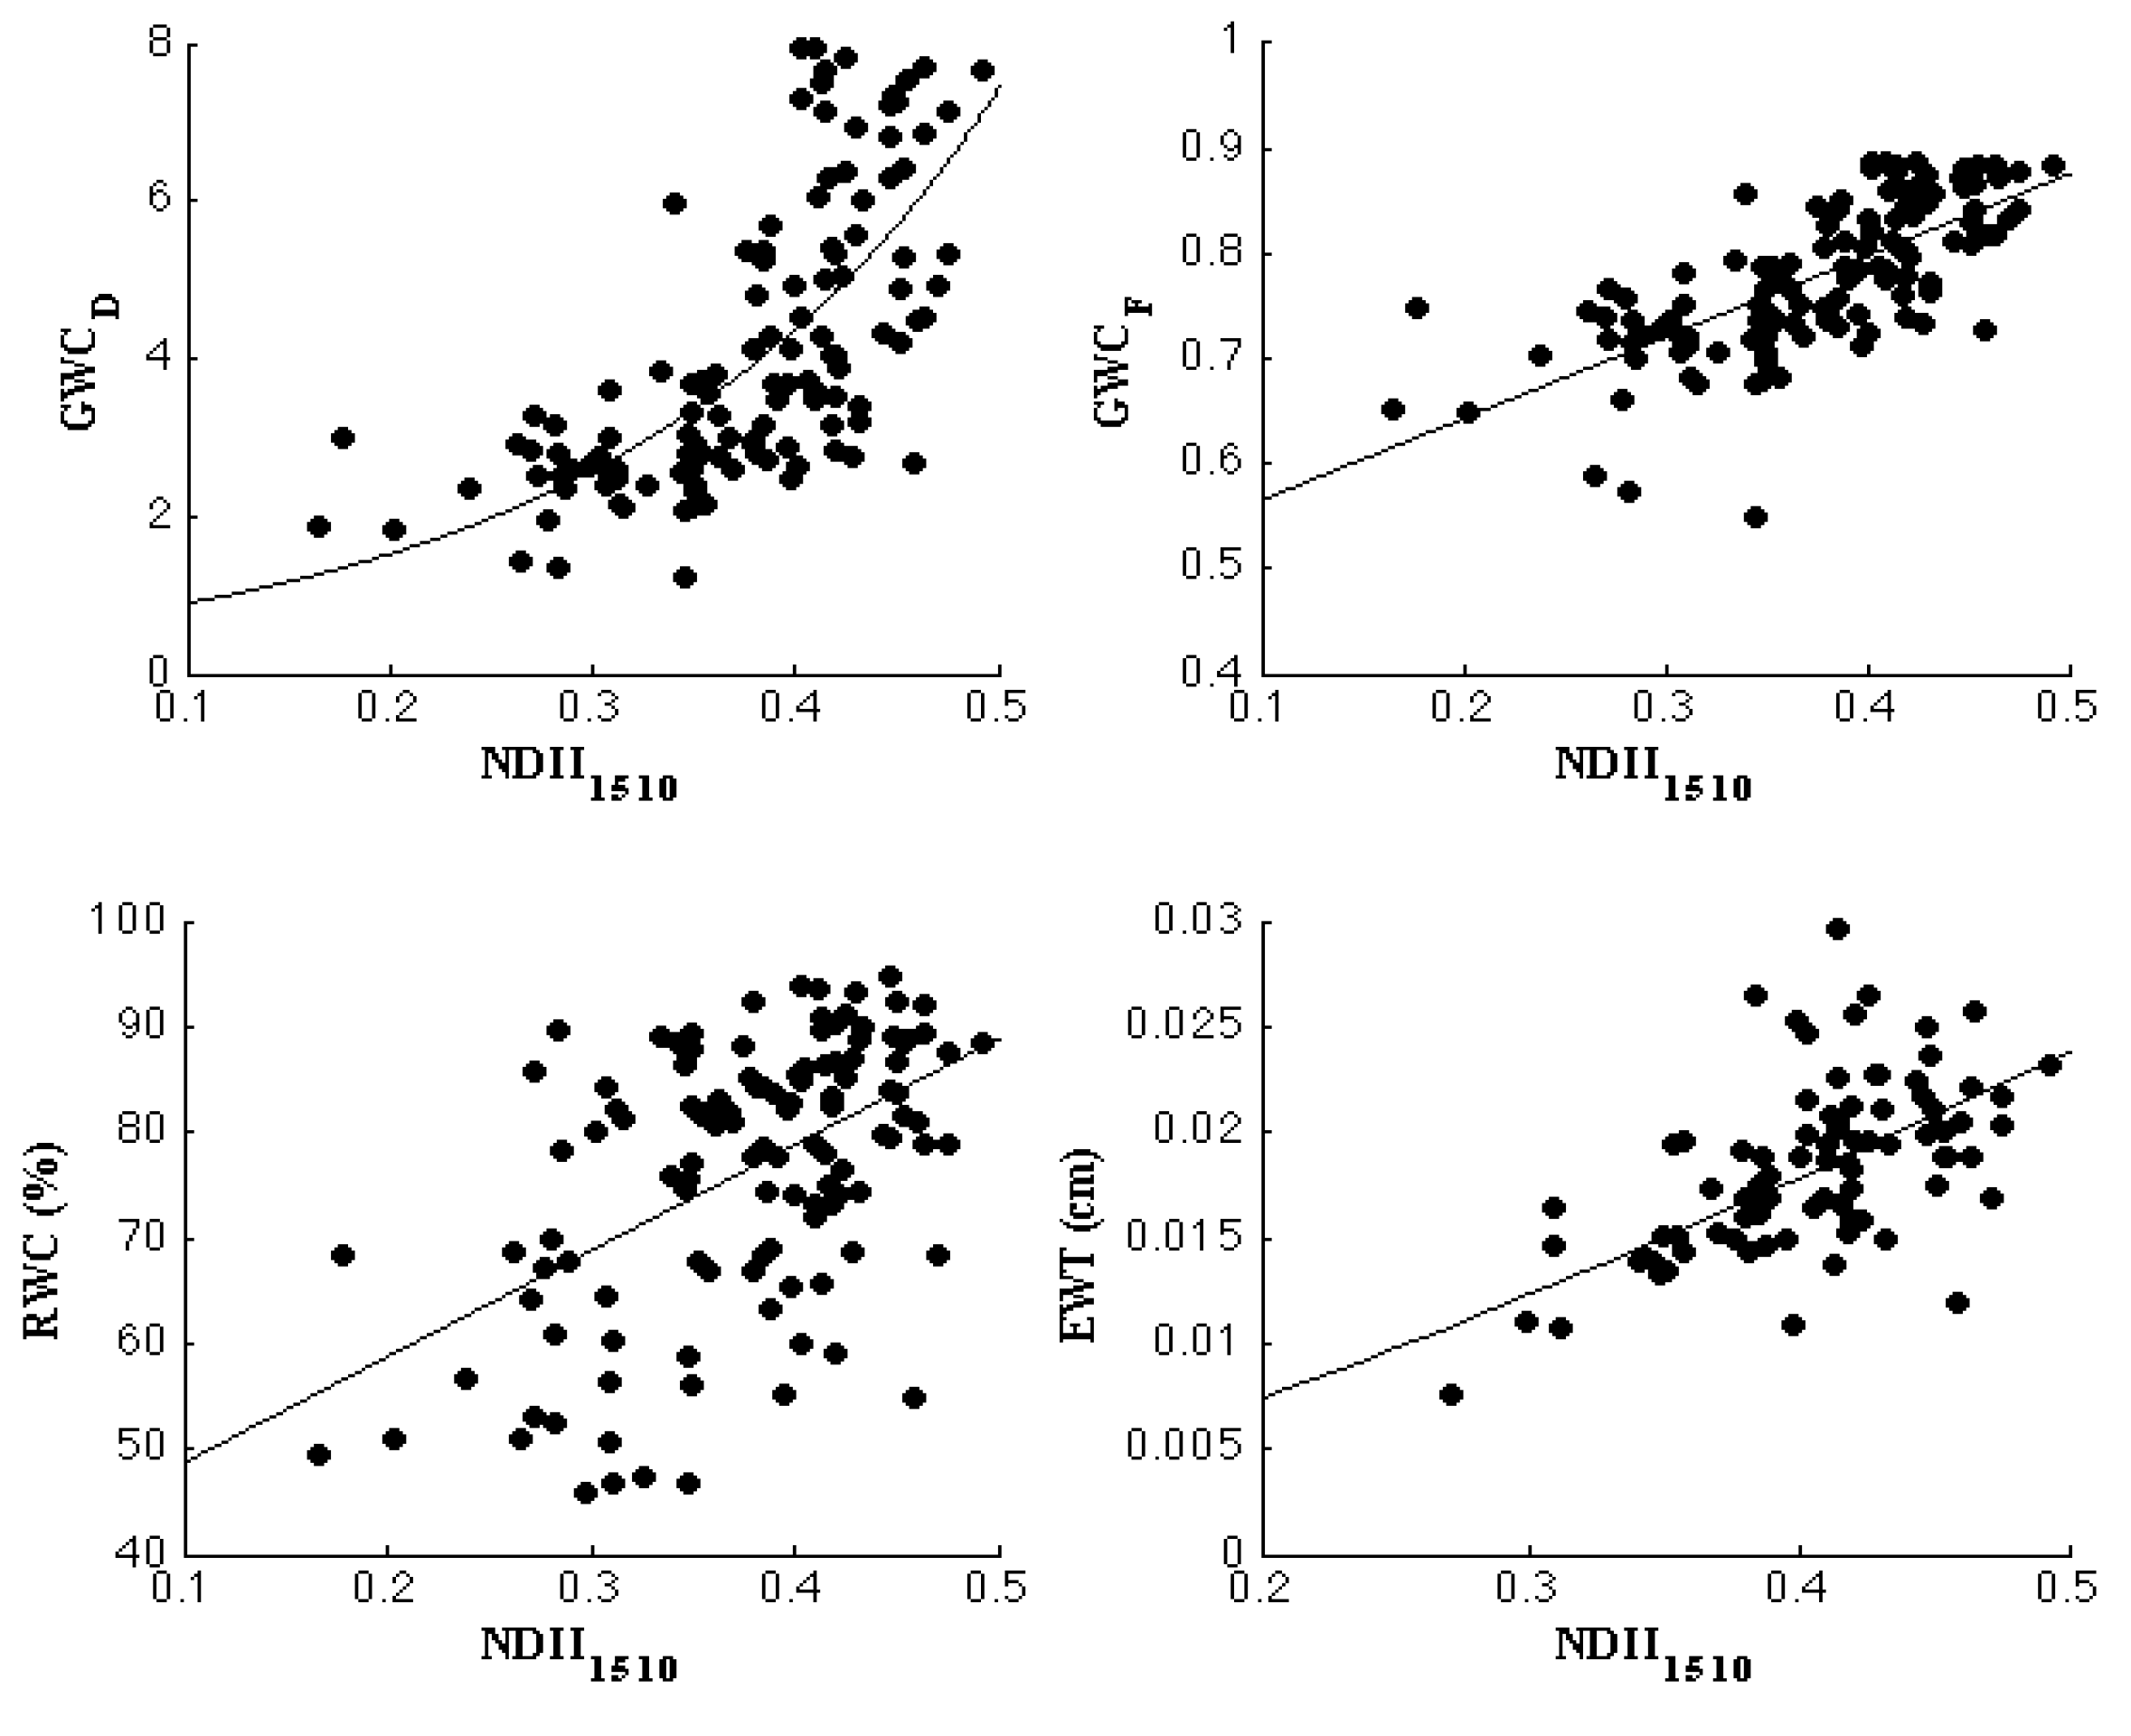
The vertical profile directly affected water-related properties for the cumulative leaf number within the winter wheat canopy. Our analysis demonstrated that water-related properties for the cumulative leaf number progressively increased, reaching maximum values at the intermediate leaf position, and then remained stable (such as GWCD and GWCF) or slightly decreased (such as RWC and EWT). Results implied that for GWCD and GWCF, the values of the top three or four leaves and the values of the top two or three leaves can represent GWC of the whole canopy during the heading stage and the early ripening stage, respectively. As for RWC and EWT, since they were more variable along the vertical profile than GWCD and GWCF, RWC and EWT of the whole canopy should be calculated based on the top four leaves or all leaves.
4.2. Estimations of Leaf and Canopy Water Content with Consideration of Vertical Distributions of Water-Related Properties
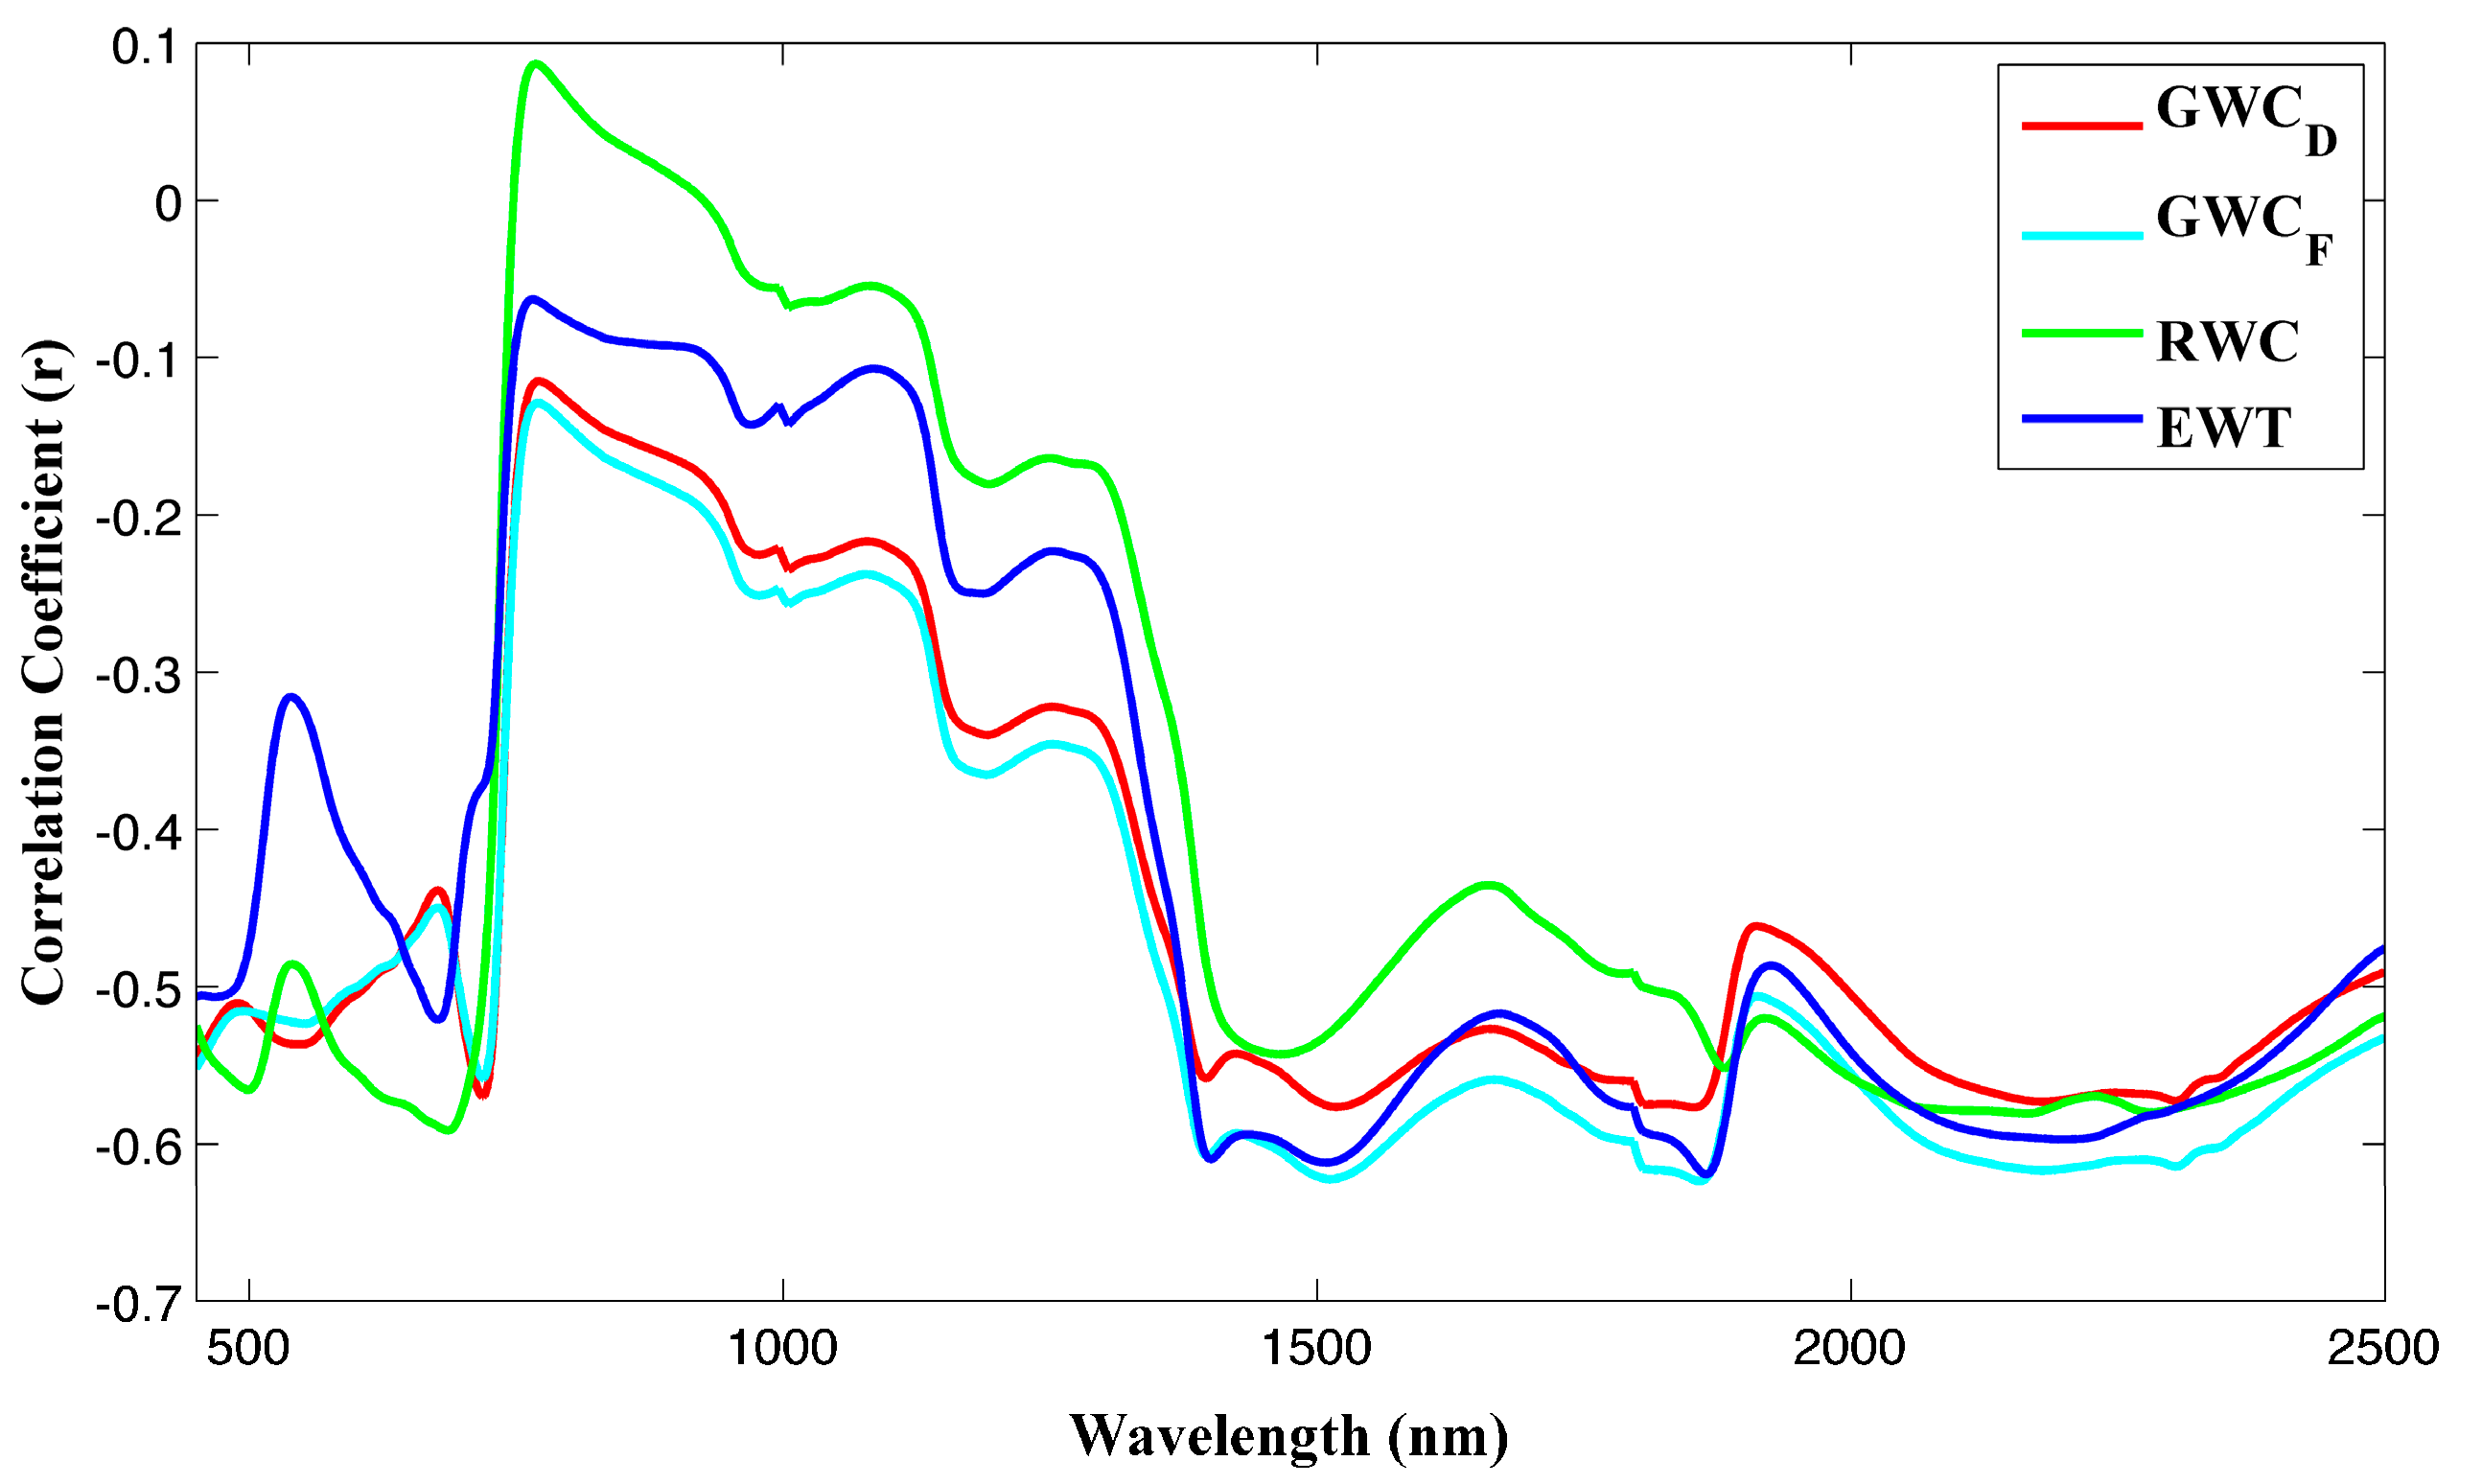
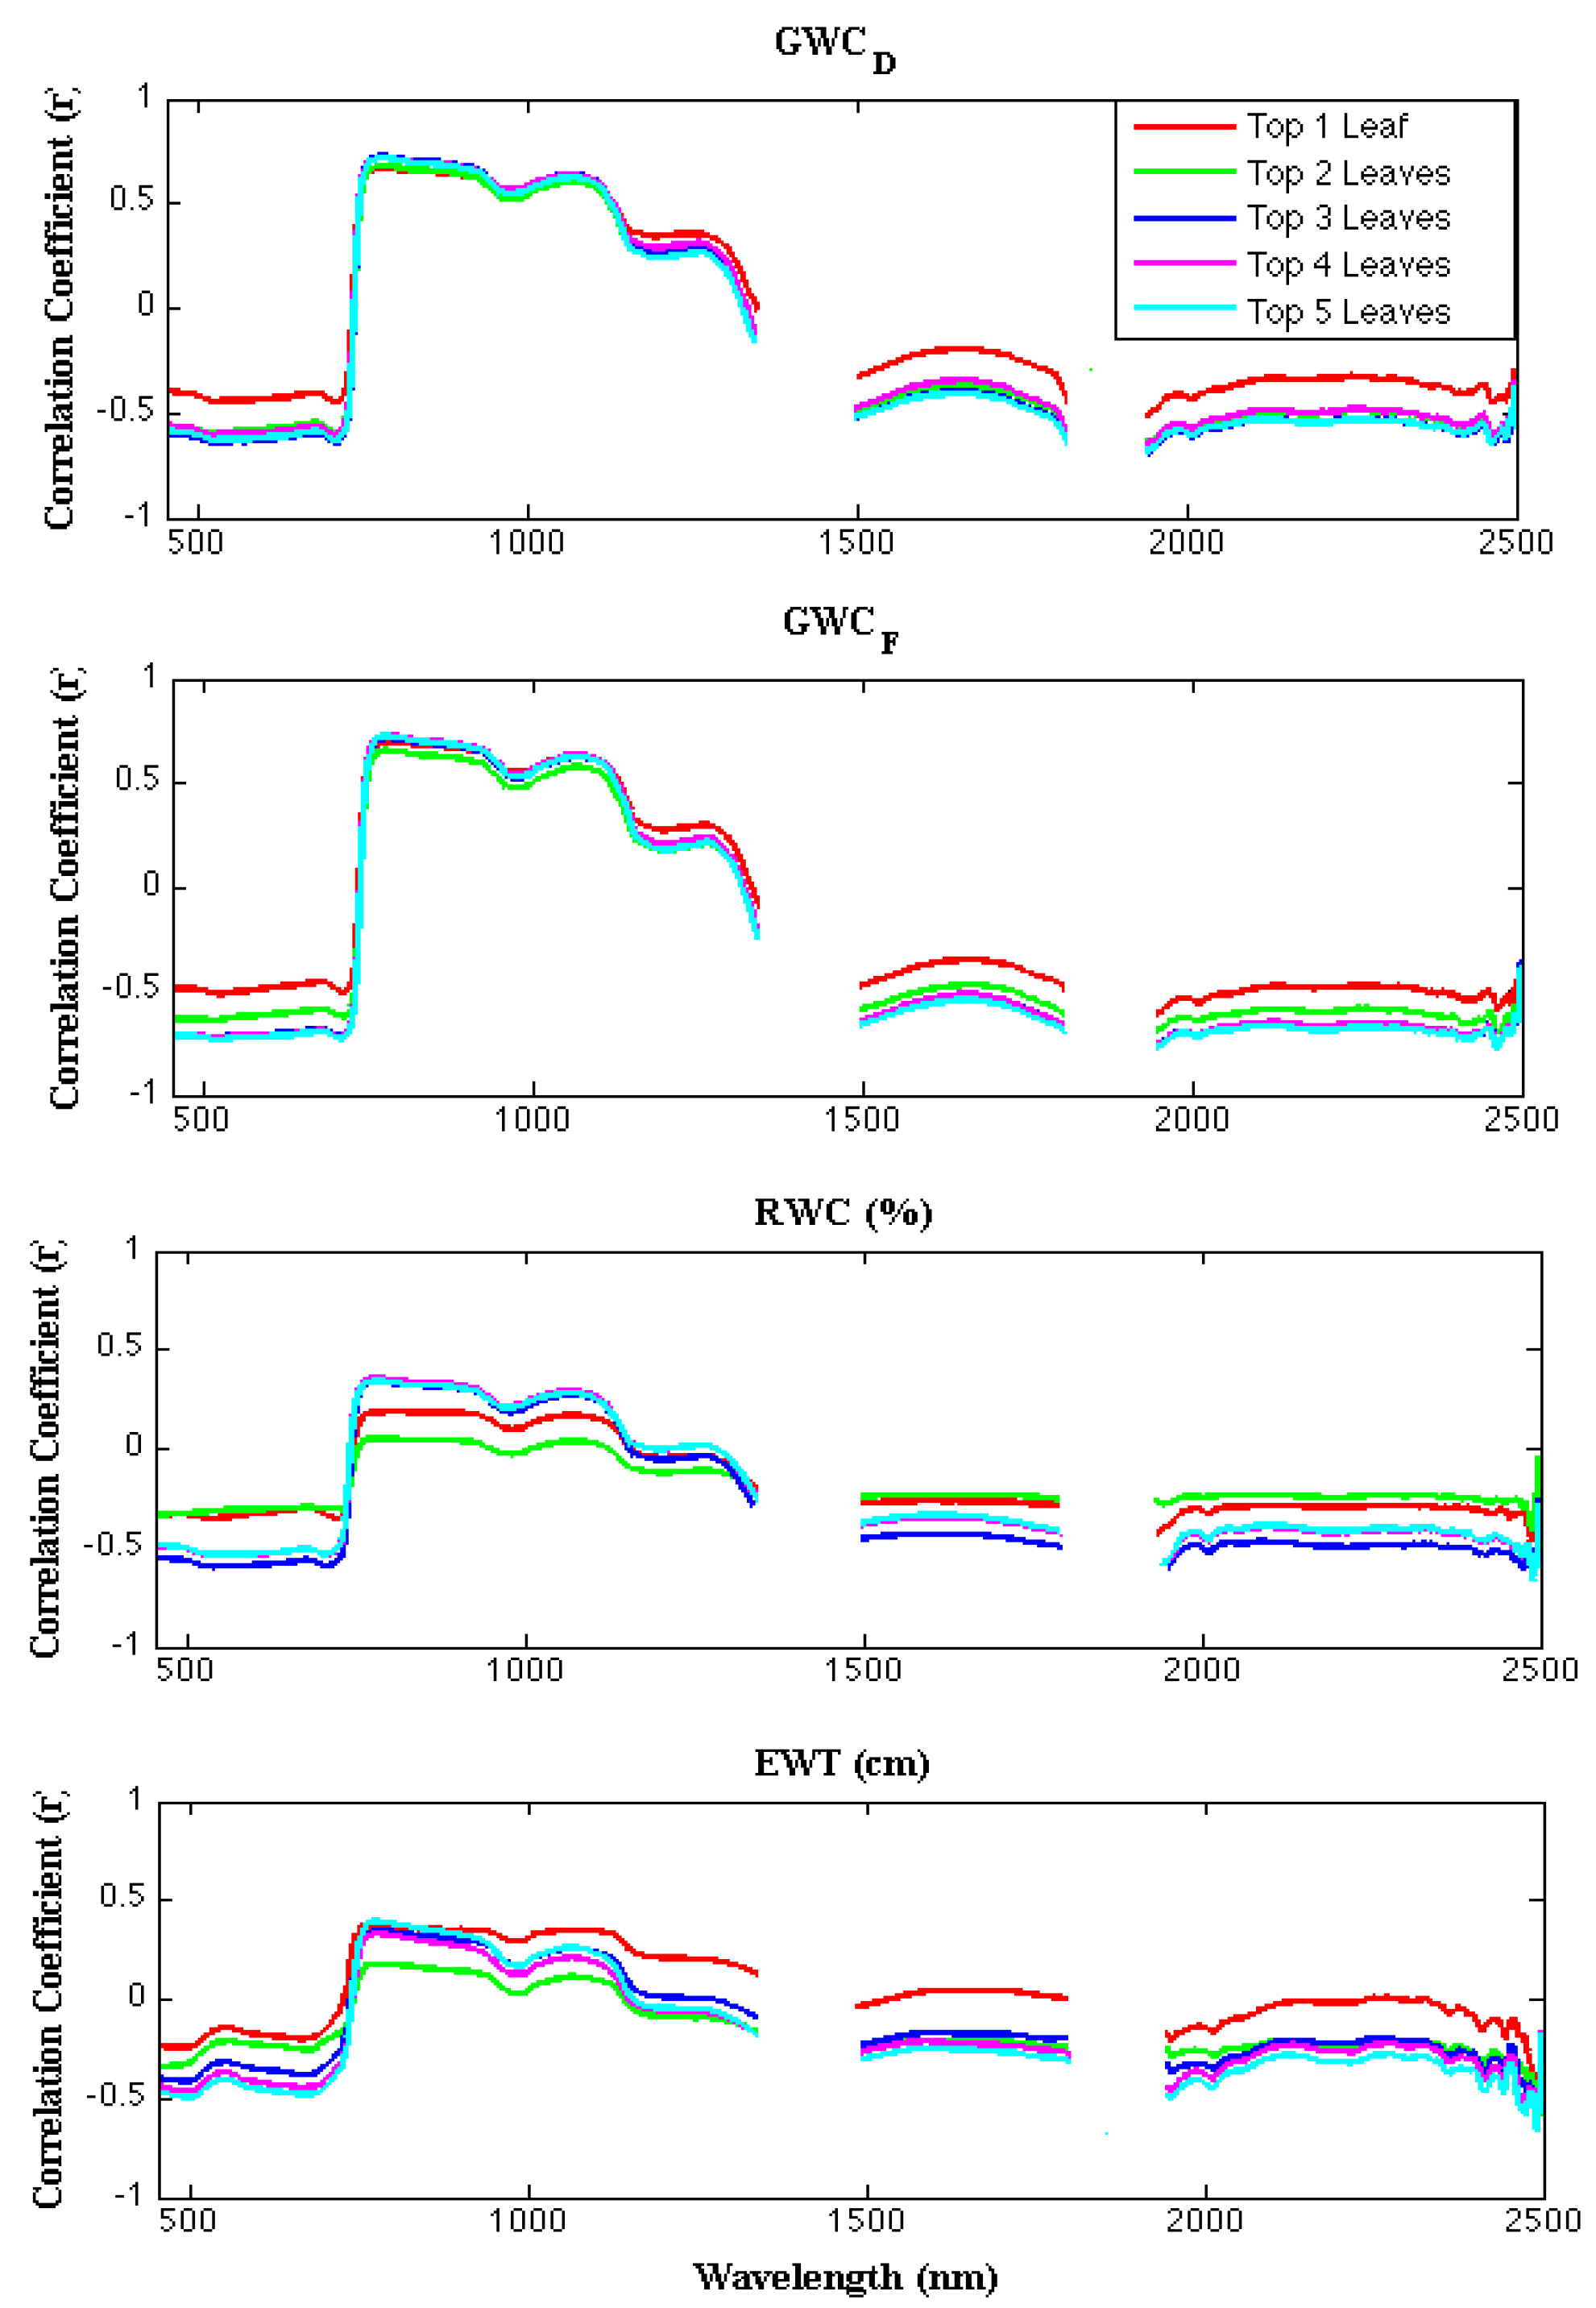
At leaf level, the analysis demonstrated strong relationships between EWT and VIs for the top leaf layer, with R
2 values ranging from 0.60–0.76 for water-related VIs, similar to the results shown in some other studies [
8,
43]. On the other hand, for GWC
D, GWC
F, and RWC, the strongest relationships with VIs were found in the intermediate leaf layers. The vertical differences in the relationships between VIs and water-related properties of winter wheat at leaf level indicated that the uniform model to estimate leaf water-related properties with remote sensing VIs might result in errors, particularly for vegetation with complex vertical architecture.
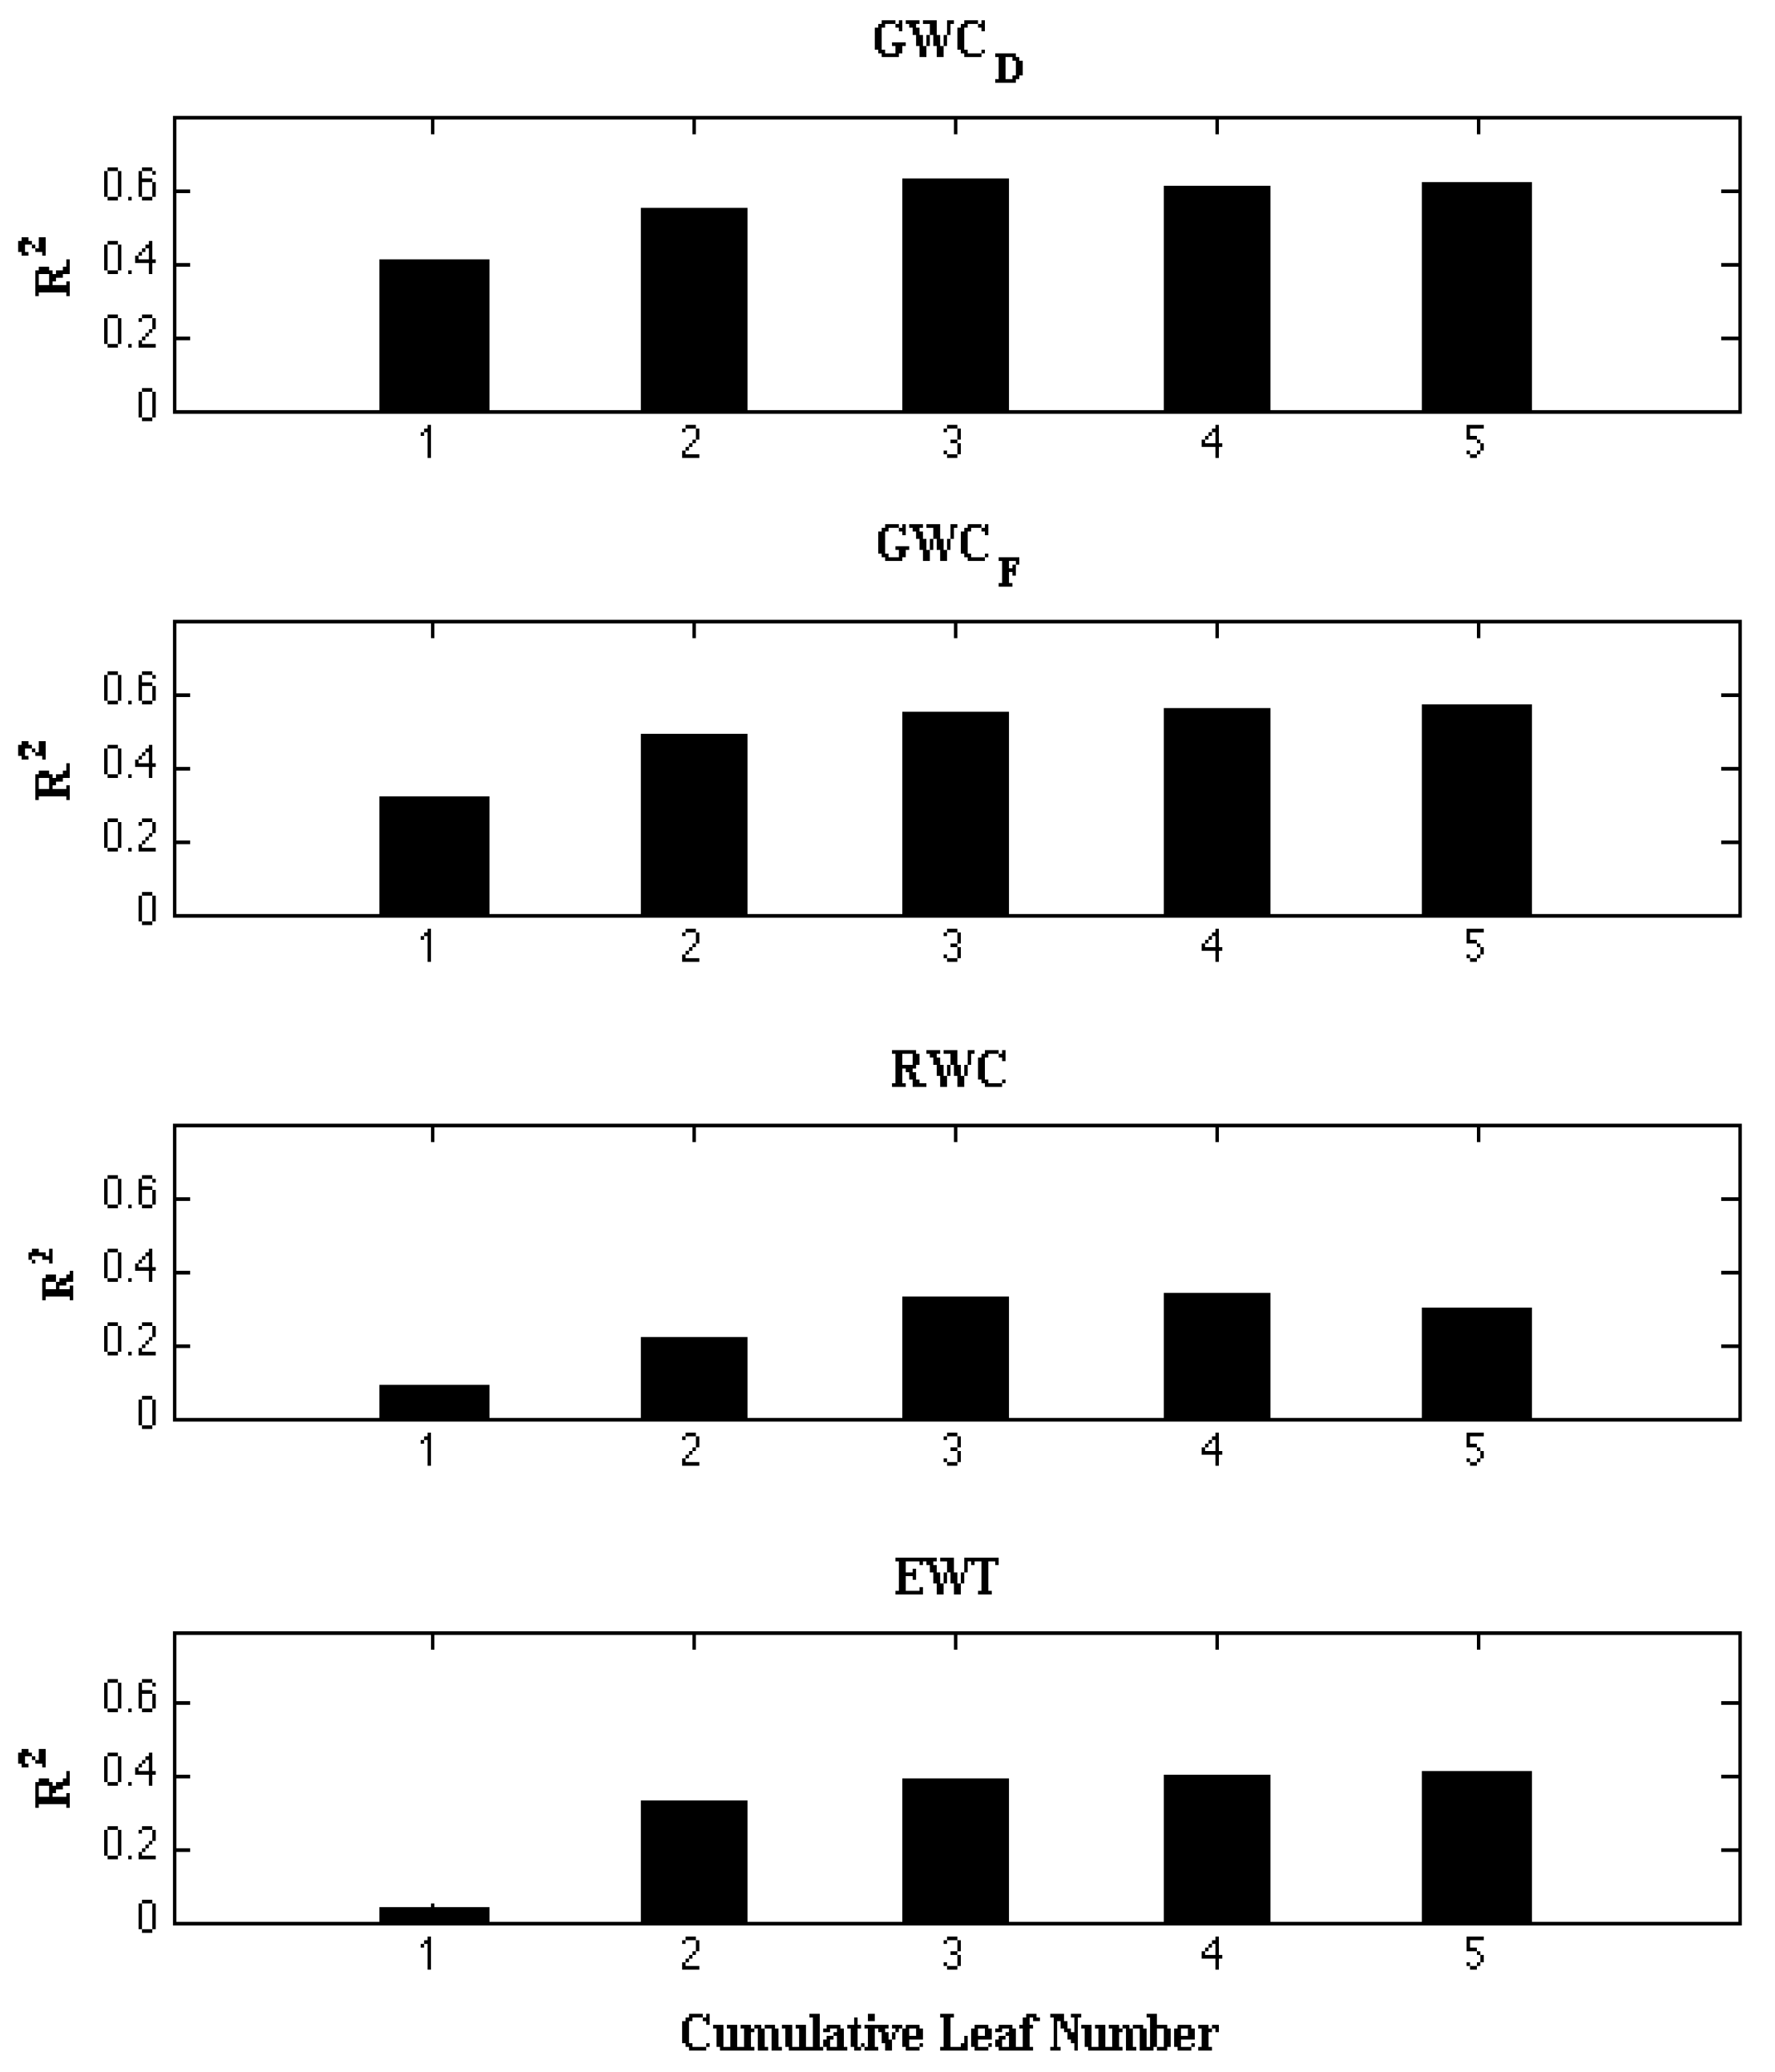
At canopy level, water absorption- and greenness-based VIs provided the most accurate estimations of GWC
D and GWC
F for the top three or four leaves (
Figure 7). As GWC
D and GWC
F of the top three or four leaves can represent GWC of the whole canopy, these water absorption- and greenness-based VIs can be used to retrieve GWC of winter wheat. It was interesting that NDVI and CI
red edge provided as accurate estimation of GWC as the water absorption-based VIs did at canopy level. These observations agreed with the findings that greenness indices were used to track seasonality of GWC in grassland and savanna because plant water status affects LAI and chlorophyll content [
6].
Based on our results, the studied VIs were not feasible to accurately estimate canopy RWC of winter wheat during heading and early ripening stages. Although the revised NDII and MSI provided the best estimation of RWC for the top four leaves (
Figure 7), the R
2 value was still quite low to indicate a convincing relationship between the revised NDII, MSI and RWC for the cumulative leaf number within the winter wheat canopy. The fact that VIs based on the reflectance of NIR and/or SWIR region were not suitable for RWC estimations has been discussed in many studies [
44,
45]. These studies suggested that it was not feasible to detect RWC within the biologically meaningful range as the relative small changes in leaf water content associated with large changes in turgor pressure.
The poor relationships between the existing VIs and EWT for the cumulative leaf number at canopy level were different from some other EWT estimation studies. We hypothesized that there might be two reasons for the poor relationships. First, EWT calculated in this study described the mean leaf EWT at canopy level. Due to the lack of LAI measurements, the EWT for the cumulative leaf number did not take into account the impact of LAI. However, studies have shown that a large variability of LAI may cancel out water-related features in reflectance [
46,
47] and thus complicates the estimation of mean leaf EWT at canopy level. Second, while the relationships between the existing VIs and EWT were weak, the revised NDII and MSI provided more accurate estimations of EWT for the cumulative leaf number. Particularly, the best estimation was achieved for EWT of the top four and five leaves (
Figure 7). These findings suggested that water absorption-based VIs were able to estimate EWT of winter wheat, but the suitable bands sensitive to water absorptions should be carefully selected for the studied species.
Figure 7.
R2 for the relationships between NDII2020 and water-related properties for the cumulative leaf number.
Figure 7.
R2 for the relationships between NDII2020 and water-related properties for the cumulative leaf number.
In order to gain a better understanding of how ‘deep’ remote sensing VIs derived from canopy spectra can ‘penetrate’ the winter wheat canopy and provide estimations of water-related properties as shown in the results of this study, we assessed if canopy spectra without the effects of varying plant geometries would show the similar results. We simulated canopy spectra using PROSPECT+SAILH model based on the cumulative measurements of chlorophyll content, EWT, leaf dry matter, and LAI for the top one to top five leaves, respectively. Leaf chlorophyll content was measured in the field using SPAD-502 chlorophyll meter (Minolta, Valencia, Spain), the SPAD values were then converted to chlorophyll content (g/cm
2) according to the equation [
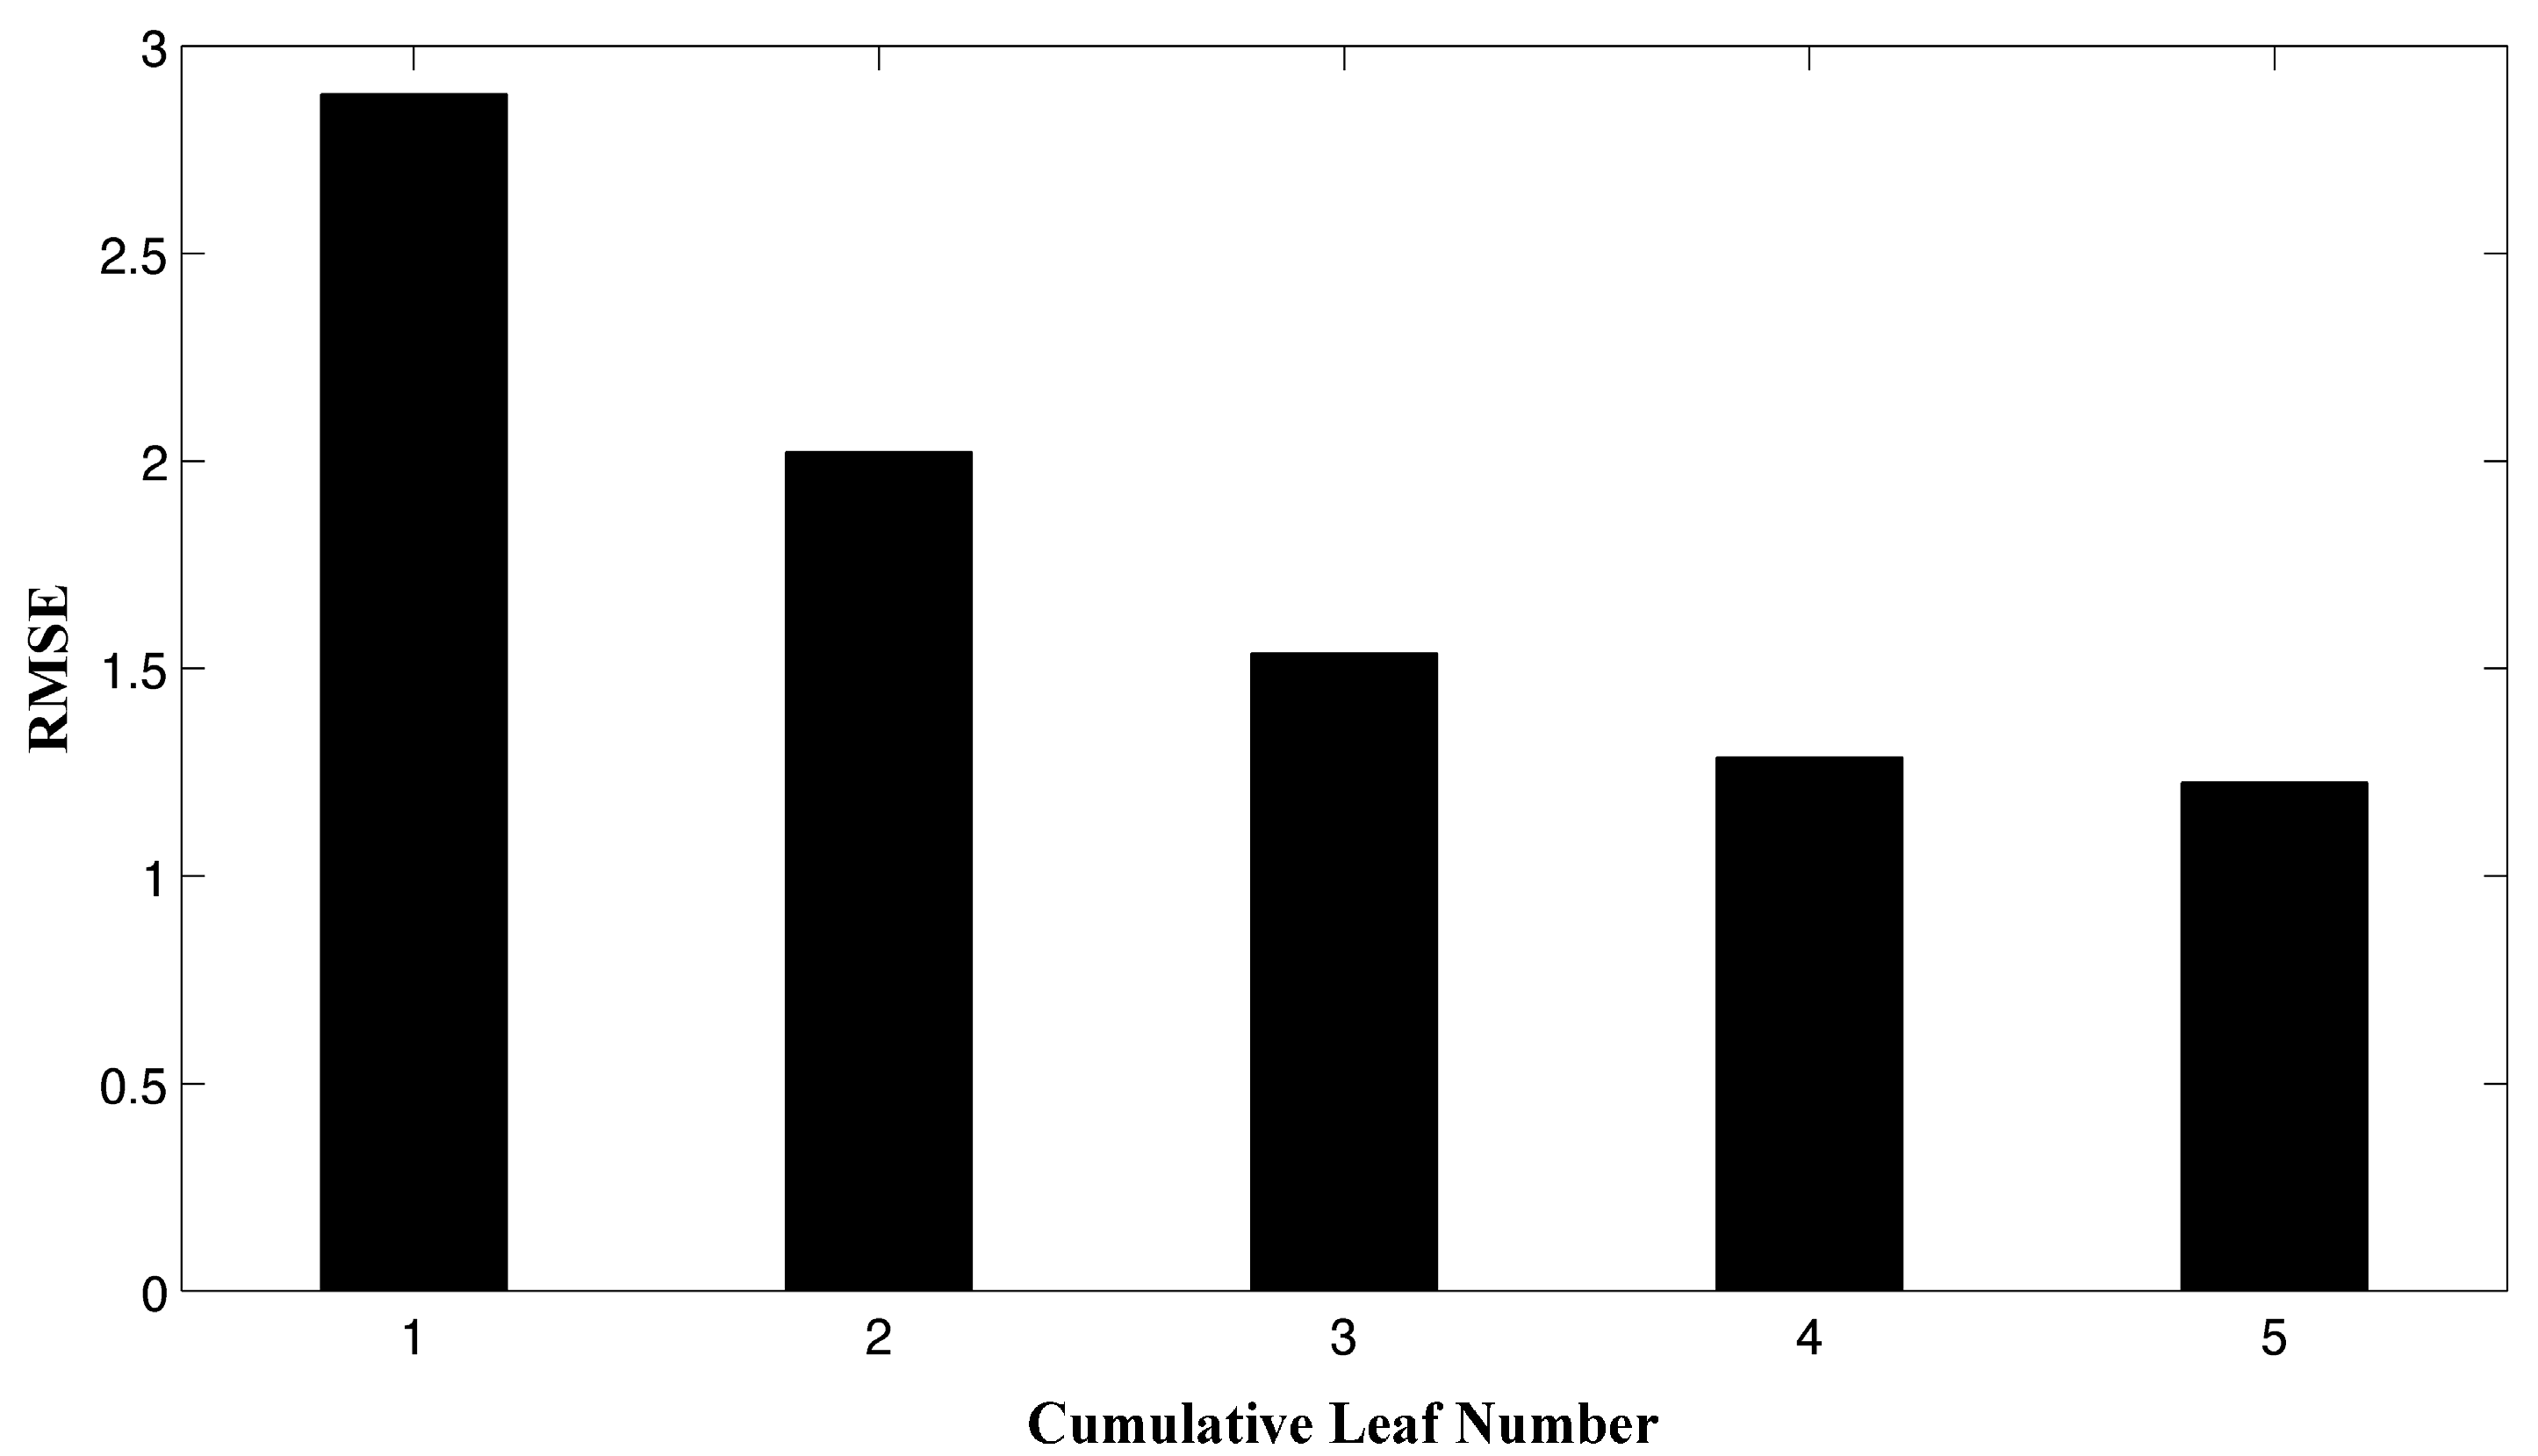
48]. Due to a lack of LAI measurements, we assumed that LAI was calculated as the cumulative leaf area along the vertical structure divided by ground area of 6 cm × 6 cm, so that LAI was kept in the reasonable range (between 3 and 5 during the heading stage with a five-leaf vertical structure). The simulations showed that canopy spectra simulated with the cumulative values of the top five leaves were closest to the canopy spectra measured in the field, with the least mean RMSE between the measured and the simulated canopy spectra (
Figure 8), while the simulated spectra for the top three and four leaves also had low RMSE values. We then evaluated the position of leaf number at which VIs can best retrieve canopy water-related properties of winter wheat by analyzing the relationships between VIs derived from the simulated spectra for the top five leaves and water-related properties for the cumulative leaf numbers. Overall, the simulated VIs showed stronger relationships with water-related properties than VIs derived from the measured canopy spectra (
Table 8), implying that the accuracy of water-related properties (EWT in particular) estimations were affected by plant geometries. The relationships between water-related properties and the simulated VIs demonstrated the similar results that the studied VIs provided the most accurate estimations of GWC
D, GWC
F, and RWC for the top three leaves, and the most accurate estimation of EWT for the top four and five leaves. Since GWC
D,GWC
F, and RWC values of the top three leaves, and EWT values of the top four and five leaves can represent water status for the whole canopy, the findings of this study suggested that water-related properties of winter wheat estimated from VIs could represent the water status of the whole canopy.
Figure 8.
Mean RMSE between the measured canopy spectra and the canopy spectra simulated with PROSPECT+SAILH model for the top one, two, three, four, and five leaves, respectively.
Figure 8.
Mean RMSE between the measured canopy spectra and the canopy spectra simulated with PROSPECT+SAILH model for the top one, two, three, four, and five leaves, respectively.
Table 8.
Statistics of relationships between VIs based on canopy reflectance and GWCD (a), GWCF (b), RWC (c), and EWT (d) for the cumulative leaf number within the winter wheat canopy. The significant relationships (p < 0.001) were indicated by R2 values greater than 0.29 (33 samples).
Table 8.
Statistics of relationships between VIs based on canopy reflectance and GWCD (a), GWCF (b), RWC (c), and EWT (d) for the cumulative leaf number within the winter wheat canopy. The significant relationships (p < 0.001) were indicated by R2 values greater than 0.29 (33 samples).
| (a) GWCD |
|---|
| Vegetation Indexes | Cumulative Leaf Number |
|---|
| Top 1 | Top 2 | Top 3 | Top 4 | Top 5 |
|---|
| R2 | RMSE | R2 | RMSE | R2 | RMSE | R2 | RMSE | R2 | RMSE |
|---|
| WI | 0.50 | 1.11 | 0.74 | 0.72 | 0.77 | 0.77 | 0.73 | 0.83 | 0.75 | 0.75 |
| NDWI | 0.46 | 1.16 | 0.69 | 0.80 | 0.73 | 0.83 | 0.70 | 0.87 | 0.71 | 0.80 |
| MSI | 0.44 | 1.18 | 0.66 | 0.83 | 0.70 | 0.88 | 0.67 | 0.92 | 0.67 | 0.85 |
| NDII | 0.47 | 1.14 | 0.69 | 0.79 | 0.73 | 0.83 | 0.70 | 0.88 | 0.71 | 0.81 |
| RMSI | 0.48 | 1.13 | 0.72 | 0.76 | 0.74 | 0.82 | 0.69 | 0.88 | 0.71 | 0.80 |
| GVMI | 0.50 | 1.12 | 0.72 | 0.75 | 0.74 | 0.81 | 0.70 | 0.87 | 0.71 | 0.80 |
| NDVI | 0.28 | 1.34 | 0.43 | 1.07 | 0.51 | 1.11 | 0.50 | 1.12 | 0.50 | 1.05 |
| CIred edge | 0.43 | 1.19 | 0.59 | 0.92 | 0.62 | 0.98 | 0.55 | 1.07 | 0.55 | 0.99 |
| NDMI | 0.20 | 1.37 | 0.24 | 1.35 | 0.29 | 1.33 | 0.29 | 1.33 | 0.29 | 1.33 |
| NDII/NDMI | 0.29 | 1.33 | 0.33 | 1.22 | 0.36 | 1.20 | 0.35 | 1.20 | 0.37 | 1.19 |
| NDII2020 | 0.32 | 1.30 | 0.50 | 1.00 | 0.57 | 1.05 | 0.56 | 1.06 | 0.55 | 1.00 |
| MSI2020 | 0.34 | 1.28 | 0.53 | 0.97 | 0.60 | 1.01 | 0.58 | 1.02 | 0.58 | 0.96 |
| (b) GWCF |
| Vegetation Indexes | Cumulative Leaf Number |
| Top 1 | Top 2 | Top 3 | Top 4 | Top 5 |
| R2 | RMSE | R2 | RMSE | R2 | RMSE | R2 | RMSE | R2 | RMSE |
| WI | 0.45 | 0.05 | 0.73 | 0.03 | 0.71 | 0.03 | 0.70 | 0.03 | 0.71 | 0.03 |
| NDWI | 0.36 | 0.05 | 0.63 | 0.03 | 0.63 | 0.04 | 0.63 | 0.04 | 0.63 | 0.03 |
| MSI | 0.33 | 0.06 | 0.58 | 0.04 | 0.57 | 0.04 | 0.57 | 0.04 | 0.57 | 0.04 |
| NDII | 0.37 | 0.05 | 0.64 | 0.03 | 0.62 | 0.04 | 0.62 | 0.04 | 0.62 | 0.04 |
| RMSI | 0.44 | 0.05 | 0.69 | 0.03 | 0.67 | 0.03 | 0.66 | 0.03 | 0.67 | 0.03 |
| GVMI | 0.42 | 0.05 | 0.68 | 0.03 | 0.65 | 0.04 | 0.64 | 0.04 | 0.64 | 0.03 |
| NDVI | 0.16 | 0.06 | 0.36 | 0.04 | 0.39 | 0.05 | 0.40 | 0.05 | 0.40 | 0.04 |
| CIred edge | 0.43 | 0.05 | 0.57 | 0.04 | 0.58 | 0.04 | 0.54 | 0.04 | 0.54 | 0.04 |
| NDMI | 0.25 | 0.06 | 0.37 | 0.05 | 0.36 | 0.05 | 0.37 | 0.05 | 0.37 | 0.05 |
| NDII/NDMI | 0.23 | 0.06 | 0.36 | 0.05 | 0.36 | 0.05 | 0.33 | 0.06 | 0.34 | 0.06 |
| NDII2020 | 0.19 | 0.06 | 0.40 | 0.04 | 0.41 | 0.05 | 0.42 | 0.05 | 0.42 | 0.04 |
| MSI2020 | 0.21 | 0.06 | 0.43 | 0.04 | 0.45 | 0.04 | 0.45 | 0.04 | 0.45 | 0.04 |
| (c) RWC |
| Vegetation Indexes | Cumulative Leaf Number |
| Top 1 | Top 2 | Top 3 | Top 4 | Top 5 |
| R2 | RMSE | R2 | RMSE | R2 | RMSE | R2 | RMSE | R2 | RMSE |
| WI | 0.05 | 7.24 | 0.23 | 6.32 | 0.42 | 6.27 | 0.42 | 6.22 | 0.39 | 6.22 |
| NDWI | 0.04 | 7.30 | 0.22 | 6.35 | 0.36 | 6.58 | 0.36 | 6.56 | 0.33 | 6.53 |
| MSI | 0.04 | 7.28 | 0.25 | 6.24 | 0.39 | 6.44 | 0.38 | 6.46 | 0.35 | 6.42 |
| NDII | 0.04 | 7.27 | 0.24 | 6.26 | 0.40 | 6.38 | 0.39 | 6.37 | 0.37 | 6.35 |
| RMSI | 0.05 | 7.24 | 0.23 | 6.32 | 0.40 | 6.38 | 0.40 | 6.33 | 0.37 | 6.33 |
| GVMI | 0.05 | 7.23 | 0.25 | 6.21 | 0.44 | 6.16 | 0.44 | 6.15 | 0.41 | 6.14 |
| NDVI | 0.01 | 7.40 | 0.15 | 6.64 | 0.18 | 7.44 | 0.17 | 7.46 | 0.15 | 7.36 |
| NDMI | 0.00 | 7.42 | 0.00 | 7.17 | 0.13 | 7.68 | 0.13 | 7.62 | 0.13 | 7.45 |
| NDII/NDMI | 0.05 | 7.24 | 0.12 | 6.74 | 0.34 | 6.68 | 0.36 | 6.56 | 0.35 | 6.42 |
| NDII2020 | 0.01 | 7.38 | 0.19 | 6.47 | 0.25 | 7.12 | 0.23 | 7.16 | 0.21 | 7.07 |
| MSI2020 | 0.02 | 7.37 | 0.20 | 6.45 | 0.26 | 7.05 | 0.25 | 7.09 | 0.23 | 7.00 |
| (d) EWT |
| Vegetation Indexes | Cumulative Leaf Number |
| Top 1 | Top 2 | Top 3 | Top 4 | Top 5 |
| R2 | RMSE | R2 | RMSE | R2 | RMSE | R2 | RMSE | R2 | RMSE |
| WI | 0.29 | 0.0025 | 0.14 | 0.0039 | 0.21 | 0.0048 | 0.24 | 0.0046 | 0.25 | 0.0046 |
| NDWI | 0.32 | 0.0024 | 0.24 | 0.0037 | 0.38 | 0.0042 | 0.43 | 0.0040 | 0.43 | 0.0040 |
| MSI | 0.30 | 0.0025 | 0.17 | 0.0039 | 0.28 | 0.0046 | 0.30 | 0.0044 | 0.31 | 0.0044 |
| NDII | 0.31 | 0.0025 | 0.18 | 0.0038 | 0.29 | 0.0045 | 0.32 | 0.0044 | 0.33 | 0.0043 |
| RMSI | 0.31 | 0.0025 | 0.18 | 0.0038 | 0.26 | 0.0046 | 0.30 | 0.0044 | 0.31 | 0.0044 |
| GVMI | 0.29 | 0.0025 | 0.11 | 0.0040 | 0.17 | 0.0049 | 0.20 | 0.0048 | 0.20 | 0.0047 |
| NDVI | 0.24 | 0.0026 | 0.39 | 0.0033 | 0.42 | 0.0040 | 0.43 | 0.0040 | 0.44 | 0.0040 |
| CIred edge | 0.36 | 0.0024 | 0.33 | 0.0035 | 0.35 | 0.0044 | 0.37 | 0.0042 | 0.37 | 0.0042 |
| NDMI | 0.18 | 0.0027 | 0.15 | 0.0039 | 0.14 | 0.0050 | 0.16 | 0.0049 | 0.15 | 0.0049 |
| NDII/NDMI | 0.18 | 0.0027 | 0.02 | 0.0042 | 0.02 | 0.0053 | 0.02 | 0.0053 | 0.03 | 0.0052 |
| NDII2020 | 0.29 | 0.0025 | 0.30 | 0.0035 | 0.48 | 0.0039 | 0.49 | 0.0038 | 0.49 | 0.0038 |
| MSI2020 | 0.31 | 0.0025 | 0.32 | 0.0035 | 0.50 | 0.0038 | 0.51 | 0.0037 | 0.52 | 0.0037 |
Understanding the vertical extent of water-related properties will affect decisions based on this. For instance, GWCD can be used to evaluate fire risk. However, for vegetation with complex vertical architecture, whether GWCD estimated based on canopy reflectance represents only the top leaf layers or they can also represent intermediate and the bottom leaf layers will be unknown without analysis of the vertical distribution. If GWCD for the studied vegetation failed to represent the bottom layers, the evaluation of fire risk may not be accurate since the bottom layers might have higher or lower GWCD than the estimation due to different ages and light conditions from the top layer. In addition, since radiative transfer model is based on the assumption of homogeneous vertical profile of vegetation, a complete vertical picture will also improve studies of EWT estimation based on the radiative transfer model inversion.


