Abstract
We recruit an online labor force through Amazon.com’s Mechanical Turk platform to identify clouds and cloud shadows in Landsat satellite images. We find that a large group of workers can be mobilized quickly and relatively inexpensively. Our results indicate that workers’ accuracy is insensitive to wage, but deteriorates with the complexity of images and with time-on-task. In most instances, human interpretation of cloud impacted area using a majority rule was more accurate than an automated algorithm (Fmask) commonly used to identify clouds and cloud shadows. However, cirrus-impacted pixels were better identified by Fmask than by human interpreters. Crowd-sourced interpretation of cloud impacted pixels appears to be a promising means by which to augment or potentially validate fully automated algorithms.1. Introduction
The detection of clouds and cloud shadows (CCS) is an important initial step for many analyses based on Landsat imagery. In recent years, strides have been made towards the development of automated, computer-based methods to accomplish this task (e.g., [1–3]). While these automated algorithms have been shown to process Landsat scenes with high levels of speed and accuracy, there remains room for human CCS interpretation in various stages of the analysis.
For example, human interpreters will still be needed to prepare reference images, which can then be used as benchmarks to assess the accuracy of automated tools. Furthermore, in some cases a simple binary judgment for the presence or absence of CCS may be all that is needed. This information is readily available at the scene level (i.e., estimated percent cloud cover), but may also be valuable for smaller spatial units (i.e., one or more counties or similar administrative units) or for areas that cross multiple scenes (i.e., large watersheds). In such cases human visual inspection may actually be faster than subjecting the entire scene(s) to a computational cloud screening program (e.g., Fmask [1]). Third, in some applications, or for some cloud types, a more accurate identification of CCS beyond what can be expected from computer-based operations will be needed. In that case human post-processing of computer-screened imagery may be helpful.
However, the sheer volume of such human CCS tasks may quickly exhaust the capacity of most remote sensing work groups in public or private institutions. Enlisting a local team of permanent or even part-time CCS interpreters might raise budgetary issues, especially if new workers require new office space, locally competitive salaries, and benefits packages. Noting that screening images for clouds and cloud shadows requires relatively little technical expertise, and can be performed from any PC, laptop, tablet, or even smart phone that is connected to the internet, we instead propose to outsource the CCS interpretation task to a global workforce recruited from online labor markets, such as Amazon.com’s Mechnical Turk.
In recent years such online “crowdsourcing” has been used for remote sensing tasks such as land cover interpretation [4–6], disaster management [7,8], and detection of forest fires [9]. These efforts are based on human volunteers providing geographic input via web sites or from their mobile device. This recent trend of incorporating the public at large in remote sensing and GIS-type research is often referred to as “Volunteered Geographic Information” (VGI) (e.g., [10]). However, ours is the first study to provide insights into the suitability of a global workforce to perform CCS interpretation, with focus on the criteria of speed, cost, and accuracy. Our project is based on interdisciplinary collaboration between experts in remote sensing, information technology, and applied economics.
Our initial results are encouraging: Online interpreters can be recruited almost instantaneously, and the job acceptance rate is high enough to process a large number of images within a short time frame, at least for the relatively simple tasks we asked for in this initial effort. Furthermore, online interpreters are reasonably accurate, even with limited training. They are also affordable, with hourly-equivalent wages of $3–$5 producing a 100% job uptake rate for our targeted time frame. We find that wage primarily affects participation rates and thus project completion time, while it has little effect on accuracy. In contrast, accuracy is affected by image complexity and work load, with a measurable fatigue effect setting in after the first processed image. Our data also allow for the identification of the role of demographic characteristics on workers’ performance.
2. Methods
2.1. The Mechanical Turk Online Labor Market
Amazon’s Mechanical Turk (MT) is a “crowdsourcing” internet market place where individuals or businesses (aka “requesters”) post human intelligence tasks (aka “HITs”), which are completed by workers (aka “providers,” or, more colloquially, “turkers”). MT was launched in late 2005, with original HITs focusing primarily on soliciting feedback for web sites, tagging images, or rating products. However, in recent years the MT platform has increasingly been used by social scientists to conduct behavioral research, e.g., via surveys or economic experiments (e.g., [11–13]). The emerging consensus out of these efforts is that MT provides easy access to a large, stable, and diverse subject pool, and that this type of research can be completed at much lower cost and within a much shorter time frame than would be required for, say, mail surveys or on-campus lab experiments with locally recruited participants [12]. As discussed in [13] the main drawback of using MT for some research projects may be that the turker community is generally not representative of the targeted population of research subjects, since demographic prerequisites (e.g., certain gender or age group) cannot be reliably enforced in anonymous online markets such as MT. However, for many applications, such as ours, this is not of central importance.
2.2. The Cloud Interpretation Task
The Human Intelligence Task we presented to MT workers was implemented as an interactive web mapping application embedded in the MT interface as an “ExternalQuestion” [14]. This interactive application, written in the PHP programming language, was executed from the MT user interface when a worker previewed, and subsequently accepted the HIT. When the HIT was accepted, the MT infrastructure created an “assignment,” recording the association between the HIT ID and worker ID. The embedded application was then initialized with variables from the MT parent window to uniquely but anonymously identify the worker (for purposes of ensuring one response per worker), and to specify the ordering of the CCS interpretation tasks (see below).
Our HIT application was structured around four components, implemented as tabs within its user interface: (1) An informed consent form that introduced the research team, described the HIT in general terms, and assured participants of the anonymity of all collected data; (2) a short (about two pages) training module; (3) the actual CCS interpretation task, described below in further detail; and (4) a brief exit survey, collecting information on basic demographics, professional background, and feedback on the training module and the CCS detection task. Logic within the web application ensured that each step had to be completed before the next step could be accessed. However, participants had the option to skip questions in the exit survey. Upon completion of these four steps, the interpretation results from (3) were submitted back to MT, thus flagging the Assignment as complete and inserting it into a queue to be approved by the Requester (the VT project team) for payment. The exit survey results were submitted separately to an external survey provider and associated with the MT interpretation results after the fact based on the Assignment ID.
Based on trial runs with VT students and faculty, we estimated that the completion of these four tasks should take an average worker between 15 and 25 min, with one minute spent on reading the informed consent form, two to three minutes to read through the training module, two to three minutes to work through the exit survey, and the remaining time allocated to the actual CCS task. As is standard practice with MT HITs, workers had the opportunity to take breaks and come back to their assignment later. However, the entire HIT had to be completed by the final day of the research phase within which the HIT had been posted (see below) to receive compensation. Workers were paid promptly after completing the HIT, regardless of achieved accuracy in the CCS tasks. We decided not to link payment to achieved accuracy at this early stage of this ongoing research effort for two reasons: First, we wanted to establish a baseline for accuracy without any links to compensation. Second, in a full-fledged implementation of cloud-sourcing with many different satellite images it would be infeasible to check each submission for accuracy. We were therefore interested in finding out what levels of accuracy can be achieved without the threat of lost compensation.
2.2.1. Extending the Mechanical Turk Framework to Support Interactive Mapping Applications
In order to effectively identify CCS on remotely sensed images, it is necessary for workers to view the interpretation unit in context and at different scales. Although the identification, categorization, and interpretation of individual images are common uses for MT in other fields, none of the standard image interpretation templates available for use in MT provide this functionality. Therefore, for the actual interpretation task it was necessary for us to use MT’s capability to embed external HTML content to integrate an interactive web mapping application, built using the ESRI ArcGIS API for JavaScript, and hosted from Virginia Tech’s on-premises GIS server infrastructure. The application consumed two principal data feeds: an ESRI ArcGIS Server “ImageService” of the entire Landsat scene containing the subsets used for interpretation, and a “MapService” containing the set of polygon grids used as a visual indication of the interpretation units. The ImageService allowed us to programmatically change the band combinations chosen to render the scene, as described below in more detail. The grids were created by recursively subdividing the well-known Web-Enabled Landsat Data (WELD) tiling scheme. By standardizing on regular subdivisions of the WELD hierarchy, we introduce the possibility for others to efficiently reproduce our mapping units. The polygon geometry of the grids was transferred to a graphics layer within the client application, and dynamically symbolized in response to user interaction events, providing a visual feedback to the workers that an interpretation had been completed. Once all grid tiles in each of the three interpretation tasks were complete, the interpretation results (cloud-free, or cloud impacted) were written to an invisible HTML form object in the embedded web application, from which they were posted back to MT upon completion of the HIT. This approach allowed us to overcome the limitations of the MT user interface and include geospatial content in HITs in a manner not previously implemented on that platform.
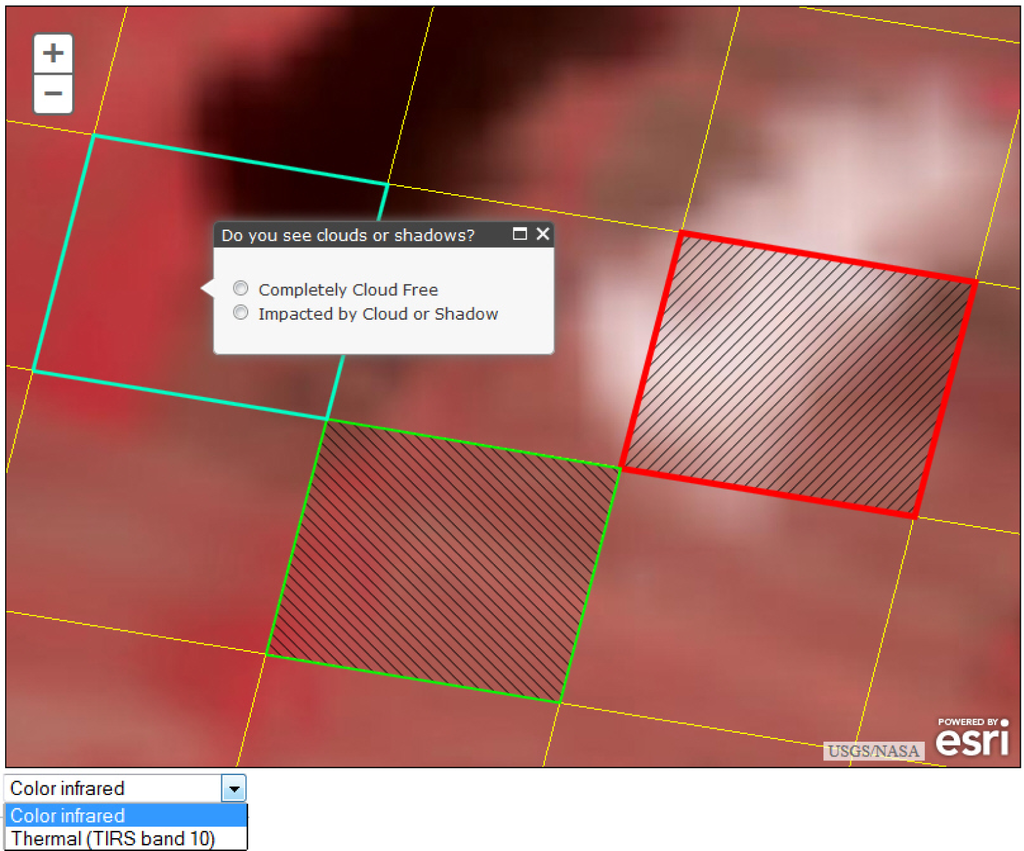
By designing our HIT as an external web application, we were able to deliver a user experience that provided more opportunity for interaction with the map than would be afforded by the unmodified MT interface. The workers’ task was to click on each individual grid tile and select “completely cloud free” or “impacted by cloud or shadow” from a pop-up menu. In addition, workers could zoom in and out using “plus” and “minus” buttons in the image viewer, or by scrolling the wheel on their mouse. The initial zoom level was set to show a closely cropped version of the entire image with all tiles visible. Users could then zoom in or out in discrete steps, each representing a doubling (halving) of the representative fraction of the previous step. Furthermore, workers could move (“pan”) through the image at any zoom level by holding down the left mouse button and dragging the image in the desired direction. They also had the choice of two types of display modes, color infrared and a grey-scale display of thermal band 10. Workers had the ability to change between the two display options at any time using a drop-down list at the bottom of the image viewer. Only one commonly used false color band combination was used to minimize confounding effects on interpreter accuracy of multiple options, and to decrease time spent switching between display modes. The thermal band was included because of its suitability for locating clouds, which are typically much cooler than the ground surface.
2.2.2. Landsat Scene Selection and Minimum Mapping Unit
We selected three Landsat scene subsets containing a range of cloud impacts from the same Landsat 8 image of WRS2, path 14, row 35, collected on 1 June 2013. The three image subsets (henceforth referred to as images) differed in the degree of cloud cover, cloud fragmentation, cloud density, and amount of surface cover that could potentially be confused with clouds or cloud shadow. Remote sensing experts at Virginia Tech (VT) classified the subsets as “easy” (E), “medium difficulty” (M), and “difficult” (D). Each subset covers approximately 5.5 square kilometers (km2) of terrain, and was overlaid with a grid of 64 equally-sized squares of 0.086 km2. This corresponds to approximately 95 Landsat pixels per grid cell. The grid size was selected to balance the trade-off between time to complete the interpretation task and a reasonable minimum mapping unit to assess interpreter accuracy.
The three images are depicted in Figure 1, arranged by row from easy to difficult. The left column shows each image in infrared mode, while the right column presents each image in thermal mode. For comparison purpose, the images are shown at different zoom levels. The adjustment buttons for magnification are shown in the upper left hand corner of each scene.
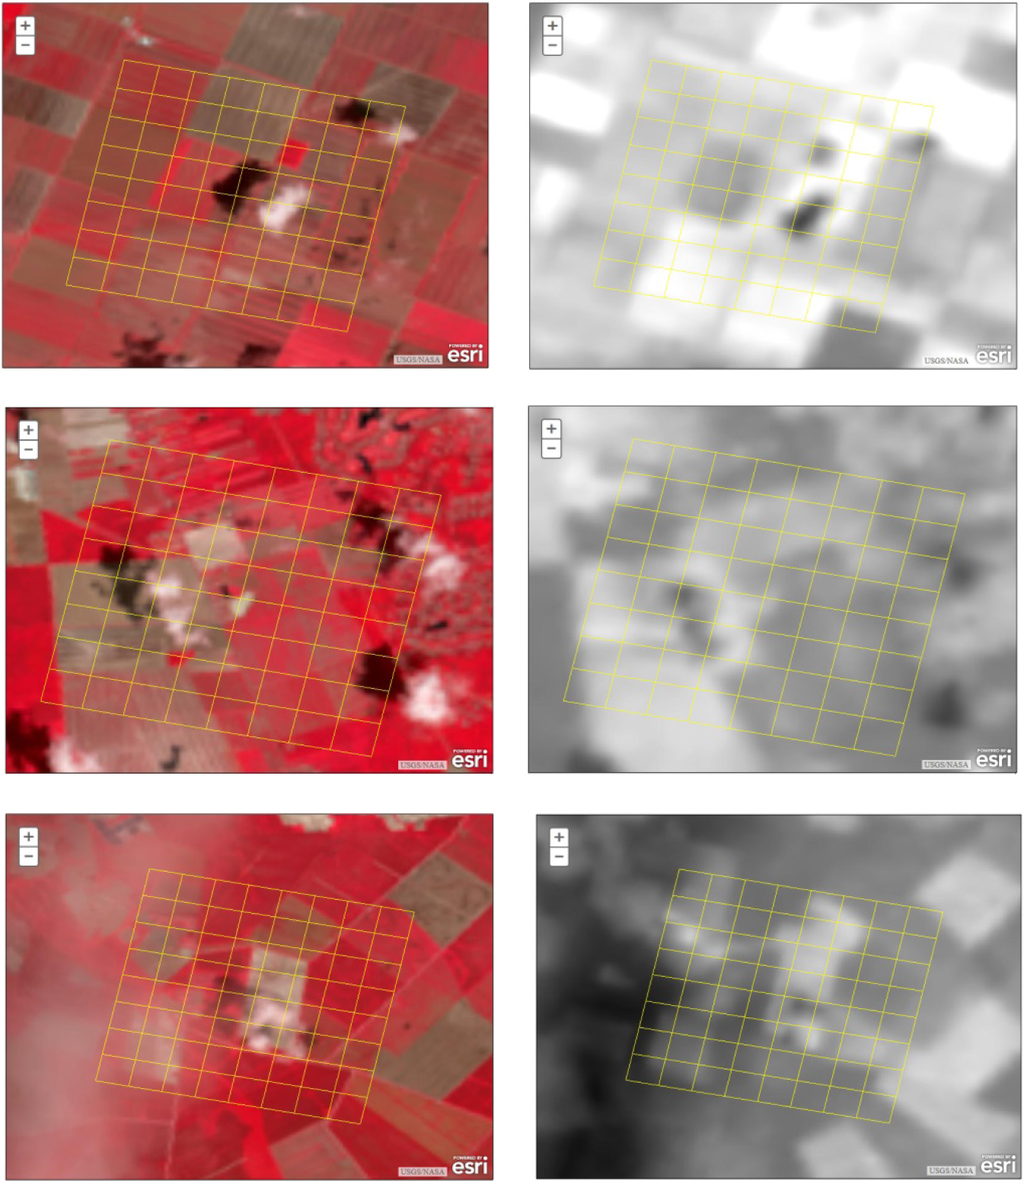
Figure 2 shows an example of a selected cell with the pop-up menu for the binary CSC-impact choice. The selection window for the infrared/thermal color selection is visible directly underneath the image.
2.3. Experimental Design
The overall design of our online experiment is given in Table 1. We implemented the project in late fall 2013 in three phases, each lasting two weeks (Monday through Sunday of the following week). For each phase, we posted six versions of our HIT (listed as six different, concurrent HITs on the MT web site), each with a different ordering of the three images, as shown in the table. For each version, in turn, we posted 120 identical copies (called “assignments” in MT jargon). Importantly, each copy of each version and phase had to be completed by a different individual to guard against any learning effects beyond the information acquired through the training module and the actual tasks. This was implemented by capturing and storing each worker’s MT identification number, and blocking any attempts to complete additional assignments of any of our HITs. Workers were informed of this policy in the brief description of the HIT that is visible at the MT web site before they decided to accept it. As can be seen from the table, the three phases had identical designs except for the wage, which we set at $0.5 in the initial phase, followed by $1 in phase II, and $1.5 in phase III.

Our design thus allows for the identification of the following four effects: (1) A wage effect, for both accuracy of CCS interpretation, and job uptake rates (and thus the actual time to reach the target sample size for each phase); (2) An image complexity effect, i.e., the effect of CCS difficulty on accuracy; (3) A learning-by-doing and/or fatigue effect, i.e., the change of accuracy over the three image tasks regardless of ordering; and (4) A sequencing effect, i.e., the effect of the ordering of images by degree of difficulty on accuracy. In addition, we kept track of total completion time for each worker.
The project was announced a few days prior to each phase at two popular blog sites for MT participants, Turker Nation [15] and Mturk Forum [16]. Workers’ feedback was collected via the exit survey, and through an e-mail account that was established specifically for this project. Given the importance of a HIT’s meaningfulness on job uptake rates and workers’ productivity discussed in [17], we announced in both the description of the HIT and the turker blogs that their input will “help us identify images that are suitable for research on forest health and forest change.”
2.4. Econometric Analysis
We estimate a linear regression model that seeks to explain variation in the outcome variable yij, the percentage of accurately interpreted cells by worker i for image j, as a function of wage (captured by the binary indicator variables “medium wage” and “high wage”), complexity (captured by the binary indicator variables “medium complexity” and “high complexity”), image sequencing (captured by the binary indicator variables “2nd image” and “3rd image”), and worker demographics. The latter group of explanatory variables includes a binary indicator for college education (“college”), a binary indicator for task-relevant professional or educational background (“background”), an indicator for “male” and an indicator for the U.S. as the current country of residence. We also take advantage of the fact that we collected three sample points from each worker. This allows us to control for unobserved effects at the individual level (for instance, ability to concentrate, resolution of computer screen, ambient noise level or distractions during the completion of the HIT, etc.) by stipulating the regression error term to include an individual-level random effect ui, in addition to an observation-specific, or idiosyncratic error term ϵij.
At the observation level our model can thus be concisely expressed as
2.5. Interpretation Comparison with Fmask
The majority-rule interpretation of each grid cell across all three phases of our study was compared with results from Fmask. Fmask is an object-based cloud and cloud shadow detection algorithm developed specifically for Landsat by [1]. It has been validated against a global reference dataset, and shown to produce an average overall cloud accuracy of 96.4% [1]. Given the proven track record of this algorithm for Landsat data we selected it for comparison with our MT results. If any pixel within a given grid cell was flagged as CCS impacted by Fmask, the entire grid cell was considered CCS impacted. The results of this comparison are given in the next section.
3. Results and Discussion
3.1. Descriptive Results
Table 2 shows valid sample counts and basic summary statistics for participating workers. As is evident from the table, we fell considerably short of our target sample size of 720 in phase I. Based on worker feedback and given the steeply increased job uptake rates for phases II and III, we presume that this is largely due to the low wage of $0.50 for what amounted to 20–22 min of work. When we doubled the wage for phase II we reached our target sample in 11 days. Phase III, with an additional 50% wage increase was completed in eight days. This observed positive relationship between job uptake rates and wages in crowdsourcing markets is consistent with similar findings reported in [12,13,18]. However, due to residual technical glitches, some workers managed to submit multiple applications. Dropping these repeat-cases reduced the effective sample size to 684 in phase II and to 500 in phase III, as shown in the table. Fortunately, though, these sample counts were evenly distributed over the six versions based on image ordering for all three phases.
Approximately 85%–90% of valid HITs also feature fully completed exit surveys, and the demographic statistics given in rows three through eight in Table 2 are based on these cases. Close to two thirds of participants were male, with little fluctuation across phases. The majority of workers gave the United States as their “country of residence.” The proportion of foreign workers was highest in phase I (30%), presumable because they perceived the $0.50 wage as relatively more attractive compared to U.S. participants. Most of these foreign workers live in India, as shown in row five of the table. Our participants were well-educated, with over 50% reporting to hold at least a college degree, and between one fifth and one fourth indicating to be currently enrolled at a university, college, or vocational school. In contrast, only 6%–10% of workers reported having an educational or professional background that involved tasks similar to those requested in our application.
As captured in rows nine and ten of the table, the average elapsed time between acceptance and submission of the HIT amounted to 20–22 min across all three phases, with the longest elapsed time recorded for phase I (close to 23 min). This is likely related to the larger contingent of foreign participants in phase I, and corresponding longer time requirements to work through the consent form, training manual, and exit survey. The bottom set of rows in Table 2 provides means and standard deviations for accuracy rates, measured as the average over all workers of the percentage of correctly coded cells for a given image, relative to a benchmark interpretation performed by a remote sensing expert at VT. As can be seen from the table, aggregate accuracy remained relatively stable for each image across the three phases. In contrast, and as expected, aggregate accuracy declines with increasing image complexity, dropping from 88% for the easiest image to 75% for the most challenging satellite scene.
In order to gain more insights on the drivers of accuracy and to dis-entangle the effects of demography, task complexity, wage, and image ordering we now turn to our full-fledged econometric analysis.
3.2. Econometric Results
We estimate two versions of our regression model shown in (1). Model M1 omits the interactions xij, while they are included in model M2. To guard against additional mis-specification of the distribution of ϵij we estimate both models with robust standard errors, clustered at the individual level. By default, the constant term refers to our omitted benchmark category of “low wage,” “easy image,” “first image in sequence,” “no college education,” “female,” and “non-USA.” The remaining coefficients thus measure the differential effect of their indicated category from this benchmark. The data set underlying our quantitative analysis is available as supplementary online material titled Data S1.
The results for both models are given in Table 3. In general, the estimation results confirm the preliminary insights gained above from our descriptive examination of the sample data: The effect of wage is insignificant, while increasing complexity has a negative and significant effect on accuracy, with error rates increasing by approximately 4% for the medium image and by 13% to 14% for the difficult image relative to the baseline (easy image). The results also indicate a duration effect, with accuracy decreasing by approximately 1% for the second image, regardless of complexity. Interestingly, accuracy does not deteriorate further for the third image. This may hint at a fatigue or possibly boredom effect for the second image, which is partially compensated by a positive learning-by-doing effect for the third satellite scene. The remaining noteworthy results flowing from our econometric analysis are a positive gender effect, with male workers producing close to 2% higher accuracy compared to female turkers, and a sizable, significant gain in accuracy for U.S. workers over foreign participants (6.5%). As is evident from the table, the interaction terms in model two add relatively little to explain variability in accuracy. This suggests that the observed main effects for complexity are not sensitive to the wage level or image sequence (first, second, or third).
Our observed insensitivity of output quality with respect to compensation is consistent with recent findings in the crowdsourcing literature. For example, [18] find no effect of wages on the quality of psychological survey data. Mason and Watts [19] observe a similar lack of compensation effects on performance for two different tasks, image ordering and word puzzles. Based on a follow-up analysis they hypothesize that this is due to an anchoring effect, where participants use the offered wage as a cue as to the value of their contribution to the employer. In [19]’s case, all workers believed they were slightly under-paid, regardless of the actual wage they received. According to the authors, this resulted in a relatively equal effort level across wage rates. A similar anchoring effect may have been at play in our application as well. In addition, the frequently observed decrease in performance in the labor market literature due to perceived unfairness in compensation relative to peers (e.g., [20–23]) did not apply in our case, as all workers received the same wage within a given phase, and wages monotonically increased over the duration of the project. Third, based on workers’ feedback on the above mentioned BLOGs and through e-mails suggests that a sizable proportion of participants actually enjoyed the task, and were thus “intrinsically motivated” to spend due effort on the assignment [24–26].
A poorer performance of non-U.S. workers was also found by [27] in the context of annotating charts and other visualizations. They suggest language barriers as a possible explanation. In the same vein, [28] find that non-U.S. workers and participants with English as a Second Language (ESL) were more likely to fail their “Instructional Manipulation Check” that was designed to assess whether or not participants were reading instructions carefully. Similarly, [29] report, in the context of a MT experiment involving content analysis of a web site and numerous incentive schemes, that MT workers from India performed significantly more poorly (in terms of the number of accurate answers) than U.S. residents. While the authors do not provide any speculations for this effect, they note that this residence effect is large enough to dwarf any of their experimental treatment effects. Indian participants are also by far the largest contingent amongst foreign workers in our case. While language issues may have played some role in their relatively less accurate CCS interpretation, perhaps due to limitations in comprehending the training module, anecdotal evidence also suggests that Indian turkers may work under more crowded and noisy conditions than their American counterparts. This would place them at a clear disadvantage for tasks that require a high degree of concentration, such as ours. Third, Indian workers may have been motivated to a lesser degree by our initial statement that their CCS identification efforts benefit research on forests health and change, perhaps assuming that these forests would be located in the United States.
3.3. Visual Analysis of Accuracy and Comparison with Fmask
Figures 3–5 present a visualization of cell-specific accuracy for the three image types. Each figure depicts the expert benchmark interpretation in the upper left panel, with impacted cells filled in black. Next to it is a “heat map” that conveys, via cell shading, the percentage of all workers across all project phases that considered a given cell as CCS-impacted. A darker shading implies a higher percentage, going from “under 10%” (completely white) to “over 90%” (completely black). The lower left panel shows, in black, only the cells that were identified as impacted by the majority of workers (>50% votes). The lower right hand panel shows the cells that were classified as impacted by Fmask. Thus, a closer resemblance of the patterns for the MT and Fmask results with the expert benchmark indicates a higher degree of accuracy.
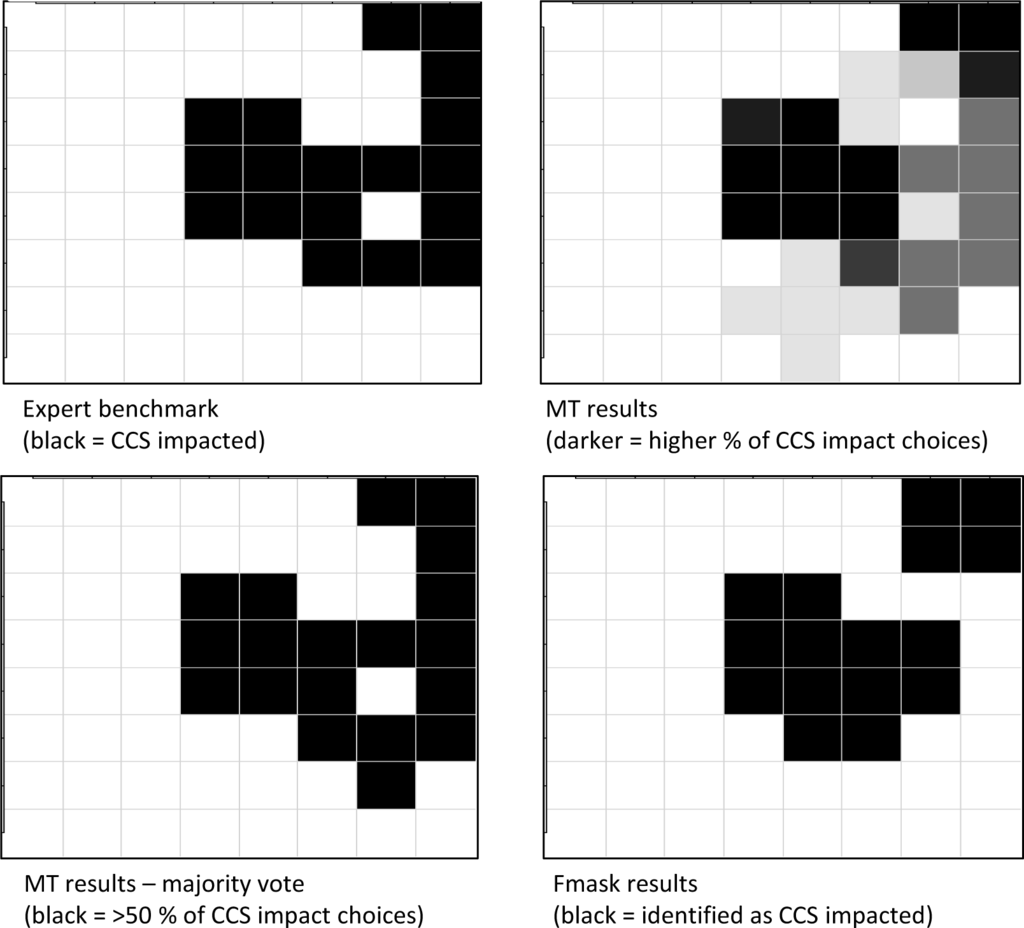
Turning first to the easy image in Figure 3, the workers’ majority interpretation only exhibits one error of commission (cell (row 7, column 7), likely a wet field), for a total error rate of 1/64 = 1.6%. In contrast, Fmask misses 5 impacted tiles along the right border of the image, and produces three errors of commission (cells (2,7), (5,7), and (6,5)), for a total error rate of 12.5%. Thus, for this relatively straightforward image, humans clearly out-perform the Fmask algorithm in terms of both omission and commission of impacted tiles when a majority rule is used. This result may highlight one of the limitations of Fmask discussed by [1]. That is, the cloud shadows produced by the small, wispy clouds beyond the right hand side of the image are difficult to detect for the algorithm because the brightness temperature of the affected pixels is dominated by the underlying land cover. This can be clearly seen in Figure 1 when comparing the infrared composite to the thermal display for the easy image. In contrast, the shadows are relatively easy to discern for humans.
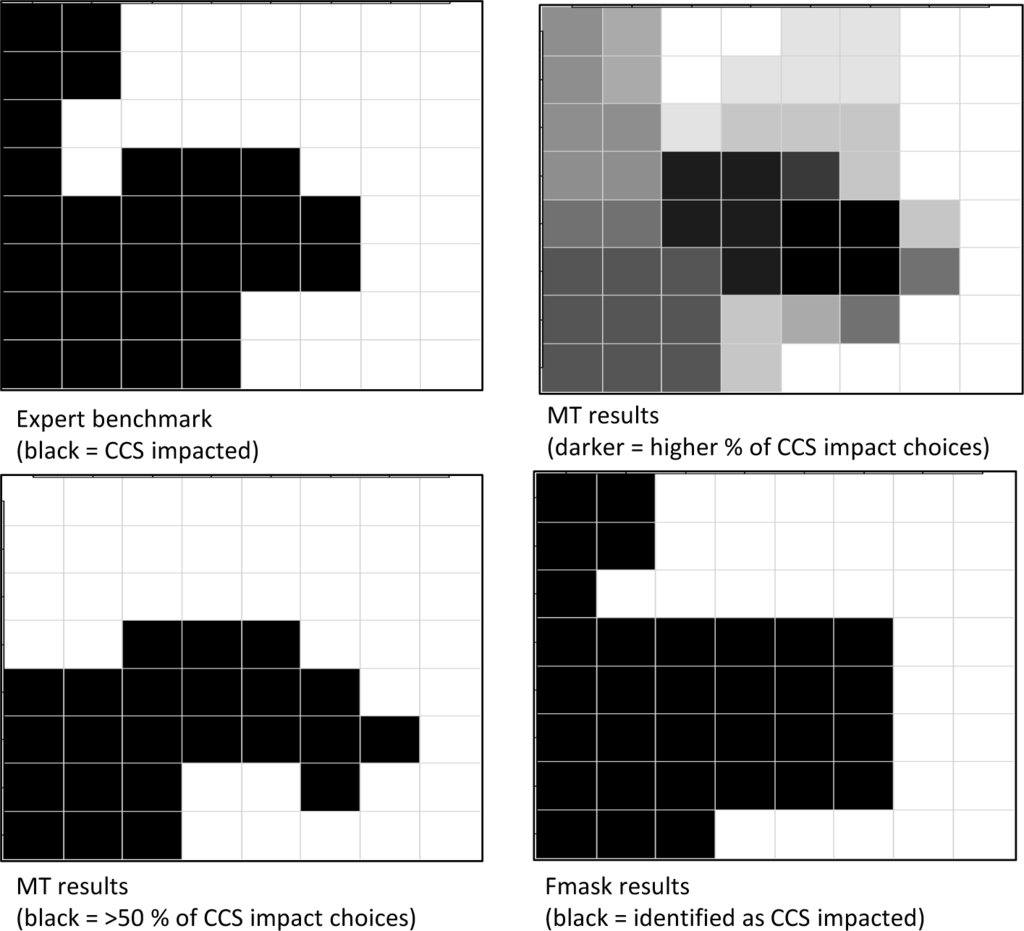
For the image of medium complexity, shown in Figure 4, the four squares at the center of the scene triggered the highest error rate amongst workers, with 70%–80% “false positives.” In this case, many workers mistook a bare field for a cloud. This leads to four errors of commission under the majority rule. However, as for the easy image, human interpretation under a majority rule did not produce any errors of omission. Fmask performs equally well in terms of omissions (zero), and has less trouble correctly interpreting the four center squares, only mis-interpreting one of them. However, Fmask additionally flags a set of fields towards the lower right hand corner of the image as CCS, plus a single cell near the upper right hand corner (cell (2,6)), for a total count of five errors of commission. The overall error rates are thus comparable for both approaches for this image, with 6.3% for workers, and 7.8% for Fmask.
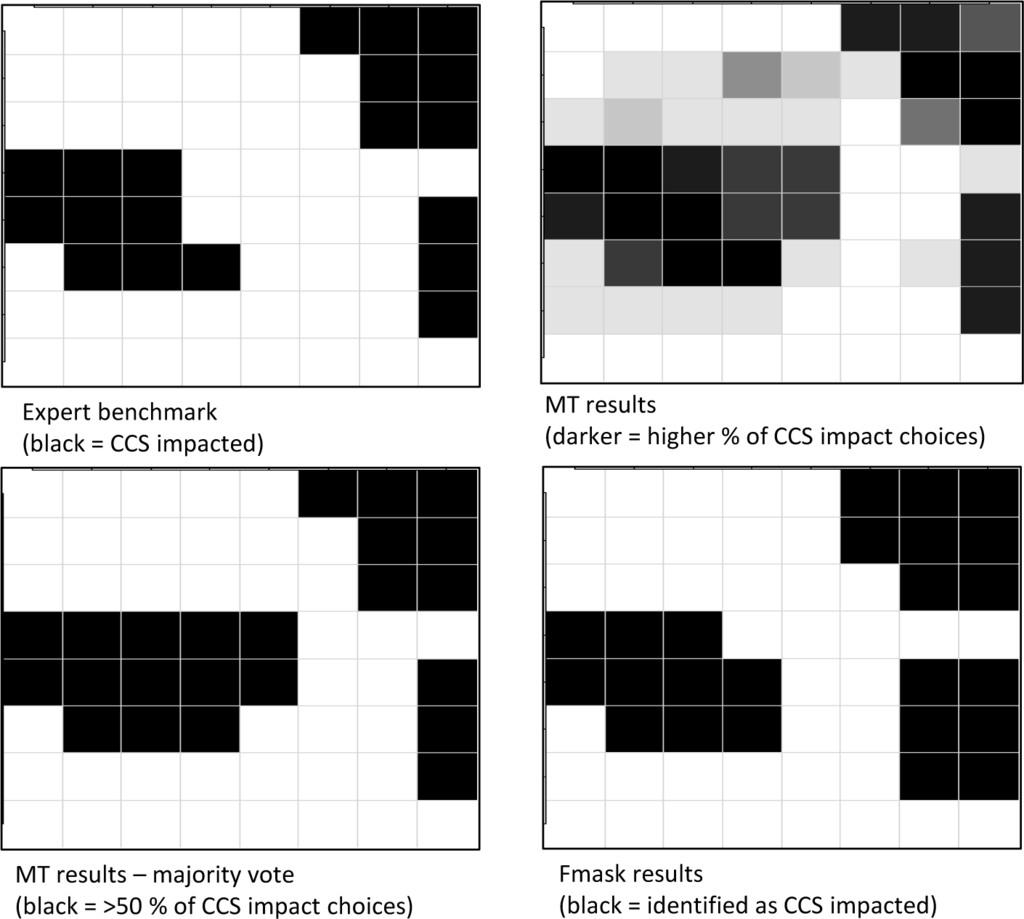
For the difficult image, given in Figure 5, human interpreters clearly struggled with the wispy, semi-transparent cirrus clouds in the left hand portion of the image, missing six tiles in that portion of the image, plus two others towards the bottom (cells (7,4) and (8,4)) based on majority vote. In contrast, there are only two errors of commission (cells (6,7) and (7,6), likely a wetter area within a forest patch and a small clearing along a forest’s edge). Fmask clearly outperforms the turkers for this image, with only one error of omission (cell (8,4)), and four errors of commission (cells (4,2), (4,6), (7,5) and (7,6)). The overall error rate is 15.6% for humans, using the majority rule, and 7.8% for Fmask.
Overall, we believe that these results give an encouraging picture of the potential role of human interpreters for CCS identification. Using a majority rule, humans closely match the expert benchmark for the easier images. While the wispy clouds in the third image posed a serious challenge to our workers, this can potentially be ameliorated with better training. Equally important, there appears to be the potential for synergies using both human interpretation and computational algorithms, given that there was relatively little overlap of erroneously classified tiles between workers and Fmask for all three images.
4. Conclusions
We implement an online experiment that recruits a human workforce to detect CCS in a set of Landsat images. We find that at hourly-equivalent wage rates of $3–$5, a relatively large number of workers can be recruited within a short (multi-day) time frame. In contrast, our chosen wage rates did not affect interpreters’ overall performance, a finding that is consistent with results reported in several other recent studies involving an online workforce. The main effects we detect in our analysis are a decrease in accuracy with an increase in image complexity, and for the second image in sequence. In addition, U.S. turkers produce significantly higher accuracy than foreign (mostly Indian) participants.
Comparing human interpretation results to an automated CCS detection via Fmask, we find some evidence that there might be cases where human interpreters can improve over Fmask’s assessment. Further study with a much larger set of images will be needed to provide additional insights on how computational algorithms and humans could form a quality-enhancing synergy for the processing of Landsat images. This will be the main focus of the next phase of this ongoing research effort.
Another insight gained from this exploratory phase of our cloud-sourcing project is that our relatively brief training module could likely benefit from additional examples of “common pitfalls and interpretation challenges” to better prepare our human interpreters for the actual task. Efforts in that direction have already been initiated. Furthermore, this improved training module will henceforth be posted as a separate item on MT, and its completion will be a pre-requisite to gaining access to any future HITs posted by our group. Since the training will only needed to be completed once by a given worker, and workers will soon be allowed to complete multiple HITs, this will greatly reduce the time requirement to complete a given assignment. Further gains in the speed of completion will be achieved by our new CCS interface, which no longer requires clicking on every single tile, but instead allows for the selection of adjacent impacted cells via a “lasso” click-and-drag technique. Jointly, these logistical and technological adjustments will further enhance the economic feasibility of human cloud interpretation. This, in turn, will allow us to expand our operation to a much larger scale, with dozens or even hundreds of Landsat subsets being processed at any point in time for a modest budget.
Finally, there exist additional economic incentives to improve performance that we have not yet tapped into, such as “random accuracy checks” and their link to compensation, special bonuses that can be earned by correctly interpreting “tricky” tiles, or the conditioning of repeat employment to task performance (for an overview of such incentive schemes see [29]). Our ultimate goal is to groom a large cohort of dependable CCS interpreters with a proven track record, and to make admission into this group a desirable and valued achievement within the turker community.
Supplementary Materials
Acknowledgments
This research was supported by the Landsat science team of the U.S. Geological Survey through grant No. G12PC00073.
Author Contributions
Ling Yu managed the implementation of the online experiment, maintained public relations with the work force, performed econometric estimation of the collected data, and participated in the preparation of this manuscript. Sheryl Ball provided input on the design of the economic experiment and guidance on data analysis and the interpretation of results. Christine Blinn developed the online training module, selected satellite images, and participated in the development of the web interface. Klaus Moeltner managed the design and budgeting of the economic experiment, guided the econometric analysis of the data, and took the lead in the preparation of this manuscript. Seth Peery oversaw all web-based components of the project, developed the framework for integrating map interpretation tasks into Amazon Mechanical Turk, implemented and launched the Mechanical Turk work assignments, and assisted in the development of the online training manual. Valerie Thomas participated in the design of the experiment, provided feedback on the web implementation, and contributed to the preparation of this manuscript. Randolph Wynne provided feedback and guidance for all project components, acted as liaison to the grantor, and contributed to the preparation of this manuscript.
Conflicts of Interest
The authors declare no conflict of interest.
References
- Zhu, Z.; Woodcock, C. Object-based cloud and cloud shadow detection in Landsat imagery. Remote Sens. Environ. 2012, 118, 83–94. [Google Scholar]
- Hughes, M.; Hayes, D. Automated detection of cloud and cloud shadow in single-date Landsat imagery using neural networks and spatial post-processing. Remote Sens. 2014, 6, 4907–4926. [Google Scholar]
- Fisher, A. Cloud and cloud-shadow detection in SPOT5 HRG imagery with automated morphological feature extraction. Remote Sens. 2014, 6, 776–800. [Google Scholar]
- Fritz, S.; McCallum, I.; Schill, C.; Perger, C.; Grillmayer, R.; Achard, F.; Kraxner, F.; Obersteiner, M. Geo-Wiki.Org: The use of crowdsourcing to improve global land cover. Remote Sens. 2009, 1, 345–354. [Google Scholar]
- See, L.; Schepaschenko, D.; Lesiv, M.; McCallum, I.; Fritz, S.; Comber, A.; Perger, C.; Schill, C.; Zhao, Y.; Maus, V.; et al. Building a hybrid land cover map with crowdsourcing and geographically weighted regression. ISPRS J. Photogramm. Remote Sens. 2015. in press. [Google Scholar]
- Fritz, S.; See, L.; McCallum, I.; You, L.; Bun, A.; Moltchanova, E.; Duerauer, M.; Albrecht, F.; Schill, C.; Perger, C.; et al. Mapping global cropland and field size. Glob. Chang. Biol. 2015. in press. [Google Scholar]
- Poser, K.; Dransch, D. Volunteered geographic information for disaster management with application to rapid flood estimation. Geomatica 2010, 64, 89–98. [Google Scholar]
- Horita, F.; Degrossi, L.; Assis, L.; Zipf, A.; de Albuquerque, J. The use of volunteered geographic information and crowdsourcing in disaster management: A systematic literature review, Proceedings of the Nineteenth Americas Conference on Information Systems, Chicago, IL, USA, 15–17 August 2013; pp. 1–10.
- Hansen, L. Global forest watch-fires: Improving remote sensing through community engagement, Proceedings of the Poster Presentation, AAAS 2015 Annual Meeting, San Jose, CA, USA, 15 February 2015.
- Goodchild, M. Citizen as sensors: The world of volunteered geography. GeoJournal 2007, 69, 211–221. [Google Scholar]
- Horton, J.; Rand, D.; Zeckhauser, R. The online laboratory: Conducting experiments in real labor markets. Exp. Econ. 2011, 14, 399–425. [Google Scholar]
- Mason, W.; Suri, S. Conducting behavioral research on Amazon’s Mechanical Turk. Behav. Res. Methods. 2012, 44, 1–23. [Google Scholar]
- Berinsky, A.; Huber, G.; Lenz, G. Evaluating online labor markets for experimental research: Amazon.com’s Mechanical Turk. Polit. Anal. 2012, 20, 351–368. [Google Scholar]
- Amazon.com. Amazon Mechanical Turk API Reference: External Question, Available online: http://docs.aws.amazon.com/AWSMechTurk/latest/AWSMturkAPI/ApiReference_ExternalQuestionArticle.html accessed on 17 February 2015.
- Turker Nation, Available online: http://turkernation.com/ accessed on 17 February 2015.
- Mturk Forum, Available online: http://mturkforum.com/forum.php accessed on 17 February 2015.
- Chandler, D.; Kapelner, A. Breaking monotony with meaning: Motivation in crowdsourcing markets. J. Econ. Behav. Organ. 2013, 90, 123–133. [Google Scholar]
- Buhrmester, M.; Kwang, T.; Gosling, S. Amazon’s Mechanical Turk: A new source of inexpensive, yet high-quality data? Perspect. Psychol. Sci. 2011, 6, 3–5. [Google Scholar]
- Mason, W.; Watts, D. Financial incentives and the “performance of the crowds”. SIGKDD Explor. 2009, 11, 1100–1108. [Google Scholar]
- Fehr, E.; Gächter, S. Fairness and retaliation: The economics of reciprocity. J. Econ. Perspect. 2000, 14, 159–181. [Google Scholar]
- Scott, P. Fairness as a source of hysteresis in employment and relative wages. J. Econ. Behav. Organ. 2005, 57, 305–331. [Google Scholar]
- Falk, A.; Fehr, E.; Zehnder, C. Fairness perception and reservation wages — the behavioral effects of minimum wage laws. Q. J. Econ. 2006, 121, 1347–1381. [Google Scholar]
- Fehr, E.; Klein, A.; Schmidt, K. Fairness and contract design. Econometrica 2007, 75, 121–154. [Google Scholar]
- Murdock, K. Motivation and optimal incentive contracts. RAND J. Econ. 2002, 33, 650–671. [Google Scholar]
- Bruno, B. Reconciling economics and psychology on intrinsic motivation. J. Neurosci. Psychol. Econ. 2013, 6, 136–149. [Google Scholar]
- Kolstad, J. Information and quality when motivation is intrinsic: Evidence from surgeon report cards. Am. Econ. Rev. 2013, 103, 2875–2910. [Google Scholar]
- Willett, W.; Heer, J.; Agrawala, M. Strategies for crowdsourcing social data analysis, Proceedings of the ACM-CHI Conference on Human Factors in Computing Systems, Austin, TX, USA, 5–10 May 2014.
- Goodman, J.; Cryder, C.; Cheema, A. Data collection in a flat world: The strength and weaknesses of Mechanical Turk samples. J. Behav. Decis. Mak. 2013, 26, 213–24. [Google Scholar]
- Shaw, A.; Horton, J.; Chen, D. Designing incentives for inexpert human raters, Proceedings of the ACM 2011 Conference on Computer-Supported Cooperative Work, Hangzhou, China, 19–23 March 2011.
© 2015 by the authors; licensee MDPI, Basel, Switzerland This article is an open access article distributed under the terms and conditions of the Creative Commons Attribution license (http://creativecommons.org/licenses/by/4.0/).