Article

A Normalized Urban Areas Composite Index (NUACI) Based on Combination of DMSP-OLS and MODIS for Mapping Impervious Surface Area

1
School of Geography and Planning, Sun Yat-sen University, 135 West Xingang Road, Guangzhou 510275, China
2
School of Marine Sciences, Sun Yat-sen University, 135 West Xingang Road, Guangzhou 510275, China
*
Authors to whom correspondence should be addressed.
Remote Sens. 2015, 7(12), 17168-17189; https://doi.org/10.3390/rs71215863
Submission received: 14 August 2015 / Revised: 29 November 2015 / Accepted: 1 December 2015 / Published: 18 December 2015

Abstract

:
Mapping Impervious Surface Area (ISA) at regional and global scales has attracted increasing interest. DMSP-OLS nighttime light (NTL) data have proven to be successful for mapping urban land in large areas. However, the well-documented issues of pixel blooming and saturation limit the ability of DMSP-OLS data to provide accurate urban information. In this paper, a multi-source composition index is proposed to overcome the limitations of extracting urban land using only the NTL data. We combined three data sources (i.e., DMSP-OLS, MODSI EVI and NDWI) to generate a new index called the Normalized Urban Areas Composite Index (NUACI). This index aims to quickly map impervious surface area at regional and global scales. Experimental results indicate that NUACI has the ability to reduce the pixel saturation of NTL and eliminate the blooming effect. With the reference data derived from Landsat TM/ETM+, regression models based on normalized DMSP-OLS, Human Settlement Index (HSI), vegetation adjusted NTL urban index (VANUI), and NUACI are then established to estimate ISA. Our assessments reveal that the NUACI-based regression model yields the highest performance. The NUACI-based regression models were then used to map ISA for China for the years 2000, 2005 and 2010 (Free download link for the ISA products can be found at the end of this paper).

Graphical Abstract

1. Introduction

Over the past 30 years, global urban population has increased from 1.5 billion in 1975 to 3.4 billion in 2010. This growth trend is predicted to continue into future decades according to the United Nations. Global urban population will increase to 6.3 billion by 2050; nearly double the current urban population [1]. The massive immigration to cities has resulted in correspondingly rapid urban expansion. Although urban settlements occupy only a small fraction of the world’s surface, they have a significant effect on climate, biogeochemical cycles, biodiversity and hydrology at local, regional and even global scales [2]. Unprecedented urban expansion has brought about a series of environmental and ecological problems such as encroachment on agricultural land, destruction of ecosystems, water shortage, air pollution and urban heat islands [3,4,5,6]. Urban land is increasingly being recognized as an important yet poorly quantified component in global change models [7]. Accurate information about urban dynamics is crucial for revealing the relationships between urbanization and its environmental consequences [8,9].
Remote sensing techniques, which can provide quick, periodic revisits and large area coverage, have proven to be a useful tool for mapping urban land [10]. Satellite images have been extensively used in monitoring urban dynamics [11,12,13]. In most previous studies, urban area mapping was often carried out for individual cities by using high or medium spatial resolution images [12]. However, it is difficult to map urban areas using high or medium spatial resolution images such as Landsat TM/ETM+ at regional or global scales. First, it requires a large amount of human and computational resources to process and interpret these images. Second, obtaining a comprehensive set of good-quality images within any given year that covers a large study area is also difficult because of frequent cloudy conditions and infrequent measurements [14]. Therefore, developing new approaches for mapping urban land over large areas using coarse resolution images is an urgent task.
The Defense Meteorological Satellite Program’s Operational Line-scan System (DMSP-OLS) nighttime light (NTL) images have proven to be reliable sources of data for mapping urban areas at regional and global scales [10,15,16,17,18,19,20,21,22]. Threshold-based approaches are the most common techniques for extracting urban areas from DMSP-OLS data because of their simplicity [10,14,23,24]. Unfortunately, previous studies indicated that the threshold-based technique posed a problem to retrieve urban areas accurately. These approaches not only omit a large number of small settlements with low light brightness but also overestimate urban extents in larger-scale cities due to the blooming effect [9,10,24,25]. The multiple thresholds method was then developed to map urban areas at regional scales by considering the development level of cities [10,26]. A disadvantage of this method is that there are no general guidelines available for selecting threshold values based on different levels of socioeconomic development [25].
Additionally, the well-documented issue of saturation in bright urban cores means that NTL is unable to accurately estimate Impervious Surface Area (ISA) or separate different types of land cover [14,27]. Thus, uncertainty cannot be avoided when extracting urban area from DMSP-OLS data at regional and global scales using these types of methods. The combination of multi-source remotely sensed data might provide more information than any individual source because each source has different characteristics. Previous studies have demonstrated that the vegetation index was closely and inversely correlated with impervious surfaces [28,29]. Recently, a number of methods have attempted to combine the vegetation index and NTL data to obtain more accurate urban areas [14,21,25]. For example, Cao et al. (2009) [25] have shown the potential of combining DMSP-OLS and SPOT-VGT data for extracting urban extents using semi-automatic Support Vector Machines (SVM). However, the semi-automatic training process for SVM is both complex and time-consuming. Furthermore, small urban areas within mixed pixels, which are usually abundant in DMSP-OLS data, are also ignored. Hence, spatial information of towns and villages is inevitably omitted using the proposed SVM method. Lu et al. (2008) [14] proposed a Human Settlement Index (HSI) by integrating DMSP-OLS NTL with Normalized Difference Vegetation Index (NDVI) data derived from MODIS for mapping regional human settlements. However, HSI overcorrects the saturation in the peri-urban areas [21]. The vegetation adjusted NTL urban index (VANUI) was also developed to correct the NTL saturation [21]. However, NDVI is limited in its ability to distinguish urban lands from other non-urban types when those show the lowest values, such as water and barren lands. It has been proven that NDWI can effectively differentiate water bodies from non-water features [30]. NDWI can make up for the limitations of the HSI and the VANUI, which only consider the contribution of NDVI.
This paper proposes a novel index, called the Normalized Urban Areas Composite Index (NUACI), to obtain accurate and timely urban dynamics in large areas based on the combination of DMSP-OLS, the vegetation index, and the Normalized Difference Water Index (NDWI). The innovation of NUACI is that it can significantly reduce the blooming and saturation effects of NTL data in urban areas by incorporating NDWI, which improves its ability to distinguish urban lands from non-urban types with the lowest vegetation densities. China, an area experiencing unprecedented urbanization with rapid economic growth over the past three decades, was selected for the case study. Landsat TM/ETM+ images were used to extract urban areas as reference data. The DMSP-OLS, MODIS EVI and NDWI data were integrated to calculate NUACI values, which were then used to estimate ISA through regression models.

2. Pixel Blooming and Saturation for the DMSP-OLS Imagery

DMSP-OLS originated in the mid-1960s with the primary purpose of observing moonlit cloud cover [31]. It has low-light-sensing capabilities for detecting artificial lighting on the Earth’s surface at night and has been widely used in urban studies such as mapping urban areas, population estimation, carbon emissions inventory and economic activities, among others [14,32,33,34,35]. However, the well-documented issues of pixel blooming and saturation limit the ability for using NTL data to estimate urban areas accurately, which led to DMSP-OLS being relegated to more of a novelty than a scientific tool in the 1980s [16].
The spurious indication of light in a location without a light source is called pixel blooming, which is a widespread phenomenon in NTL data, especially in large metropolitan areas [24]. Three main causes for the pixel blooming phenomena in NTL images were summarized by Small et al. [24]. The first cause of pixel blooming is attributable to atmospheric scattering in the blue part of the spectrum (0.4 to 0.5 mm), which is used for low-light imaging on the DMSP-OLS. The coarse spatial resolution and scattered light result in blooming at the peripheries of light sources. Second, there is a large overlap in the footprints of adjacent pixels. Finally, the accumulation of geolocation errors in the compositing process is another factor that induces pixel blooming. The overlay images of Landsat TM/ETM+ and DMSP-OLS are shown in Figure 1 illustrate that a large number of unlighted areas are affected by the blooming effect. Agricultural lands, forests and water bodies are all depicted with light. Therefore, pixel blooming is an obstacle in using NTL images to estimate urban areas accurately. Many attempts have been made to reduce the blooming effect. Early effort is to use a low light threshold of detection frequency [16]. However, no single threshold is well suited to map urban areas for various cities [24]. Vegetation index is presented to reduce the overestimated spatial extent of lighted areas [14,21,25]. However, this method cannot distinguish water bodies near cities, such as coastal areas, from urban areas.
Another primary barrier to using NTL data for urban studies is pixel saturation, which refers to the fact that data values in urban core areas tend to be truncated because of the limited radiometric range of DMSP-OLS. The saturation phenomena are illustrated using digital number (DN) profiles across a latitudinal transect in Figure 2, which indicates that NTL values are invariant in urban areas due to saturation. In reality, the corrected NTL data without saturation would have some peaks in the urban core. Several techniques have been developed to correct saturation. For example, Ziskin et al. [36] attempted to calibrate radiance by varying the gain on the sensor. However, radiance calibrated nighttime light images were produced involving a significant amount of labor and cost. Recently, some simpler methods based on using the combination of MODIS NDVI and NTL data have been presented to mitigate the saturation effects, such as HSI and VANUI [14,21].
Figure 1. Overlay images of Landsat ETM+ and DMSP-OLS for the six selected cities.
Remotesensing 07 15863 g001
Figure 2. Latitudinal transects of calibrated NTL and saturated NTL in 2010 for Shenzhen, China.
Remotesensing 07 15863 g002

3. Normalized Urban Areas Composite Index (NUACI)

Previous studies have shown that vegetation abundance is highly negatively correlated with the distribution of impervious surfaces [29,37,38]. Hence, vegetation index can be used to assist in the estimation of urban areas and has also been applied to correct the blooming effect in HSI and VANUI indices. Actually, vegetation cover often shows discriminated patterns in different seasons, such as crops and grasslands [14]. Unfortunately, it is impractical to retrieve the distribution of urban areas using only a single-date vegetation index. EVI has proven to be insensitive to background noise. It avoids saturation at places with high densities of vegetation cover and more accurately reflects the true background condition of land cover distribution. The annual maximum enhanced vegetation index (EVImax) derived from MODIS images can accurately provide information about vegetation covered areas and is certainly preferable for use as auxiliary data for mapping urban boundaries. However, the values of EVImax for non-vegetation land cover, including water bodies, bare soils and barren lands, are similar to those of urban areas, making it difficult to distinguish urban areas from non-vegetation land using only the EVImax index. NDWI can differentiate water bodies from non-water features [30]), so a combination of EVImax and NDWI might be able to discriminate urban areas from vegetation land cover and water bodies. Therefore, EVImax and NDWI are combined with NTL data in this paper to establish NUACI for extracting an urban fraction.
To validate the feasibility of integrating EVImax and NDWI, 11 scenes of TM/ETM+ images in China were selected, from which we collected 4320 sample plots involving six types of land cover: water bodies, agricultural land, barren lands, forest, grass and urban. Figure 3 illustrates the correlation between EVImax and NDWI for different land covers. The values of NDWI and EVImax for different sample plots are generally scattered within a certain coordinate space. When considering only EVImax for correcting the saturation and blooming effects in NTL images, we can find many sample plots—especially those belonging to urban lands and water bodies—that overlap along their vertical axes for the same value range of EVImax. Urban lands cannot be easily separated from water bodies, barren lands or grasslands with low densities of vegetation cover. This phenomenon is usually typical for cities surrounded by barren lands or grass lands covered with low densities of vegetation, as illustrated in Figure 4. When NDWI is incorporated into the index for deriving urban information, different types of land cover show large differences between NDWI and EVImax. Sample plots of different types are generally scattered within identifiable zones in the two-dimensional space constituted by NDWI and EVImax. The sample plots belonging to urban lands are basically centralized within the circle regions having lower NDWI and EVImax. Although the sample plots of water bodies present lower EVImax, they generally show the highest NDWI, which makes them easy to separate from urban lands. In addition, barren lands with the lowest EVImax have a lower NDWI than water bodies but a higher NDWI than other types, while farmlands have a higher EVImax but lower NDWI. This characteristic pattern of differences makes urban lands easily distinguishable from farmlands, water bodies and barren lands, even though a few sample plots of barren lands and sparse grass fall into the circle region. Therefore, most non-urban areas with comparatively higher DN values in NTL images can be excluded from urban lands by incorporating both EVImax and NDWI.
Figure 3. Relationship between NDWI and EVImax for sample plots with different land cover types.
Remotesensing 07 15863 g003
As described above, because different characteristics can be obtained from the DMSP-OLS, MODIS EVImax and NDWI datasets, it is necessary to identify the relationships among those datasets to improve the accuracy of mapping urban areas. Therefore, a new index, the NUACI, is established in this paper, as expressed in Equation (1).
NUACI = { 0 ,   d > r ,   d = ( NDWI a ) 2 + ( EVI max b ) 2 ( 1 d / r ) OLS-OLS min OLS max OLS min   ,             d r
where a and b are the average value of NDWI and EVImax for urban samples, respectively, r is the radius of the circle region aggregated with urban samples, d is the distance to the center of the circle and OLSmin and OLSmax are the minimum and maximum values in the DMSP-OLS image, respectively. The value of NUACI can be standardized within a range varying from 0 to 1. The true distribution pattern of urban lands can be reflected according to the adoption value of r. NDWI can be calculated as follows:
NDWI = ρ 857 ρ 1241 ρ 857 + ρ 1241
where ρ857 is reflectance in the near infrared band at 857 nm, and ρ1241 is reflectance in the water absorption band at 1241 nm. EVI can be expressed as follows:
EVI = ρ N * ρ R * ρ N * + C 1 ρ R * C 2 ρ B * + L
where ρ N * is reflectance in the near infrared band, ρ R * is reflectance in the red band, L is the coefficient of soil adaption and C1 and C2 are the coefficients used to correct the influence of atmospheric aerosol scattering in the blue and red bands, respectively.
Figure 4. A typical spatial pattern of land cover (e.g., grass covered with low density of vegetation around urban land) in a city.
Remotesensing 07 15863 g004

4. Materials and Data Preprocessing

The whole of China was selected for the case study. The country has experienced unprecedented urbanization since the 1978 reforms. A time series of DMSP-OLS NTL images, Terra MODIS reflectance and EVI products as well as Landsat ETM+ were used in this study. DMSP-OLS version 4 NTLs datasets with 1 km spatial resolution from 2000, 2005 and 2010 were downloaded from the National Oceanic and Atmospheric Administration (NOAA)/National Geophysical Data Center (NGDC) website. Each dataset is composed of average DN values of stable light images for an entire year. DN values for lights on NTL images range from 1 to 63, while the background and noise are all recorded as zero. The subsets of NTL images were then extracted according to Chinese administrative boundaries.
Surface reflectance products of Terra MODIS (MOD09A1) and EVI (MOD13A1) with 463 m spatial resolution were downloaded from the National Aeronautics and Space Administration (NASA) website. MOD09A1 products, which were preprocessed to include atmospheric, radiometric and geometric correction, were used to calculate the NDWI. The 16-day EVI product was processed by compositing maximum values to create a yearly maximal EVI image (EVImax). The DMSP-OLS, NDWI and EVImax images were co-registered and projected to the Albers Conical Equal Area projection. All the datasets were resampled to the same spatial resolution of 500 m.
Thirty scenes of Landsat ETM+ images covering partial regions of China with spatial resolutions of 28.5 m from the years 2000, 2005 and 2010 were also obtained from the United States Geological Survey website and used to extract actual impervious surface area, which we then used as reference data to establish regression models and validate the performance of NUACI. All the selected TM/ETM+ images were reprojected to the Albers Conical Equal Area projection. The urban areas were extracted using the maximum likelihood classifier (MLC), which has been commonly applied to the classification of medium resolution remote sensing images. Table 1 shows the confusion matrices of the urban land classifications extracted from Landsat ETM+ images. In Table 1, the overall accuracy shows high values of 91.13% (2000), 91.58% (2005), and 91.55% (2010), which indicate that the classification image is fairly accurate. Therefore, the urban information derived from the TM/ETM+ images can be used as reliable reference data. The obtained urban classification was then aggregated to calculate actual ISA with a pixel size of 500 m by 500 m, which matches the spatial resolution of MODIS EVI, NDWI, and DMSP-OLS data.
Table 1. Confusion matrices for urban land classifications (2000, 2005, 2010).
ClassificationReference
200020052010
UrbanNon-urbanUrbanNon-urbanUrbanNon-urban
Urban114116311861531239169
Nonurban447512342651094125054
Over Accuracy91.13%91.58%91.55%

5. Model Application and Results Discussion

5.1. Calculation and Validation of NUACI

Nineteen MODIS surface reflectance data and 16-day composite EVI products covering China were used to obtain NDWI and EVI
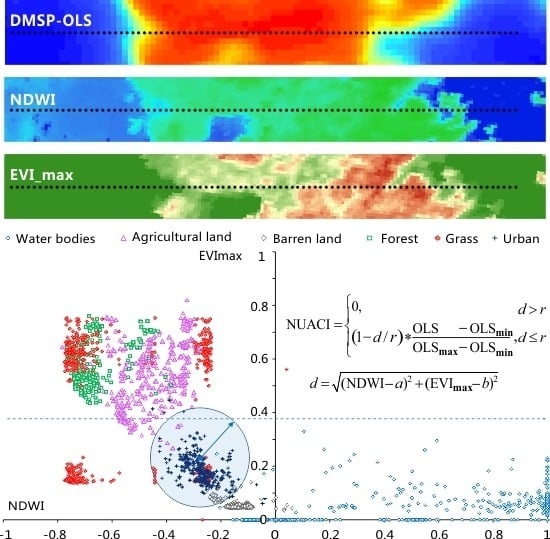
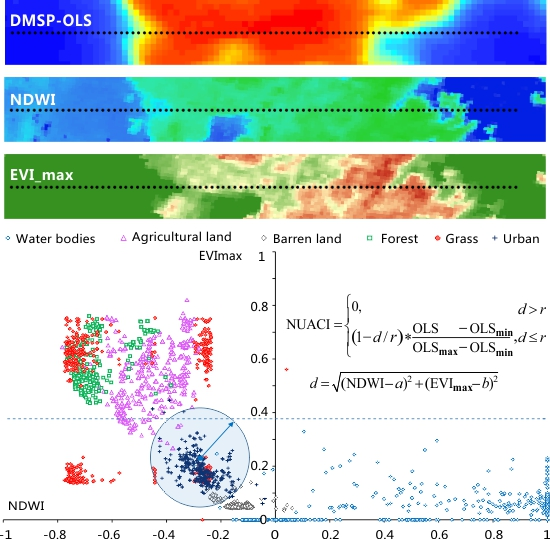
max, respectively. The NUACI for the whole of China was then calculated using the combination of DMSP-OLS, NDWI and EVImax images with ArcMap model builder, which is used to implement GIS processes by linking input data automatically. The parameters a, b and 
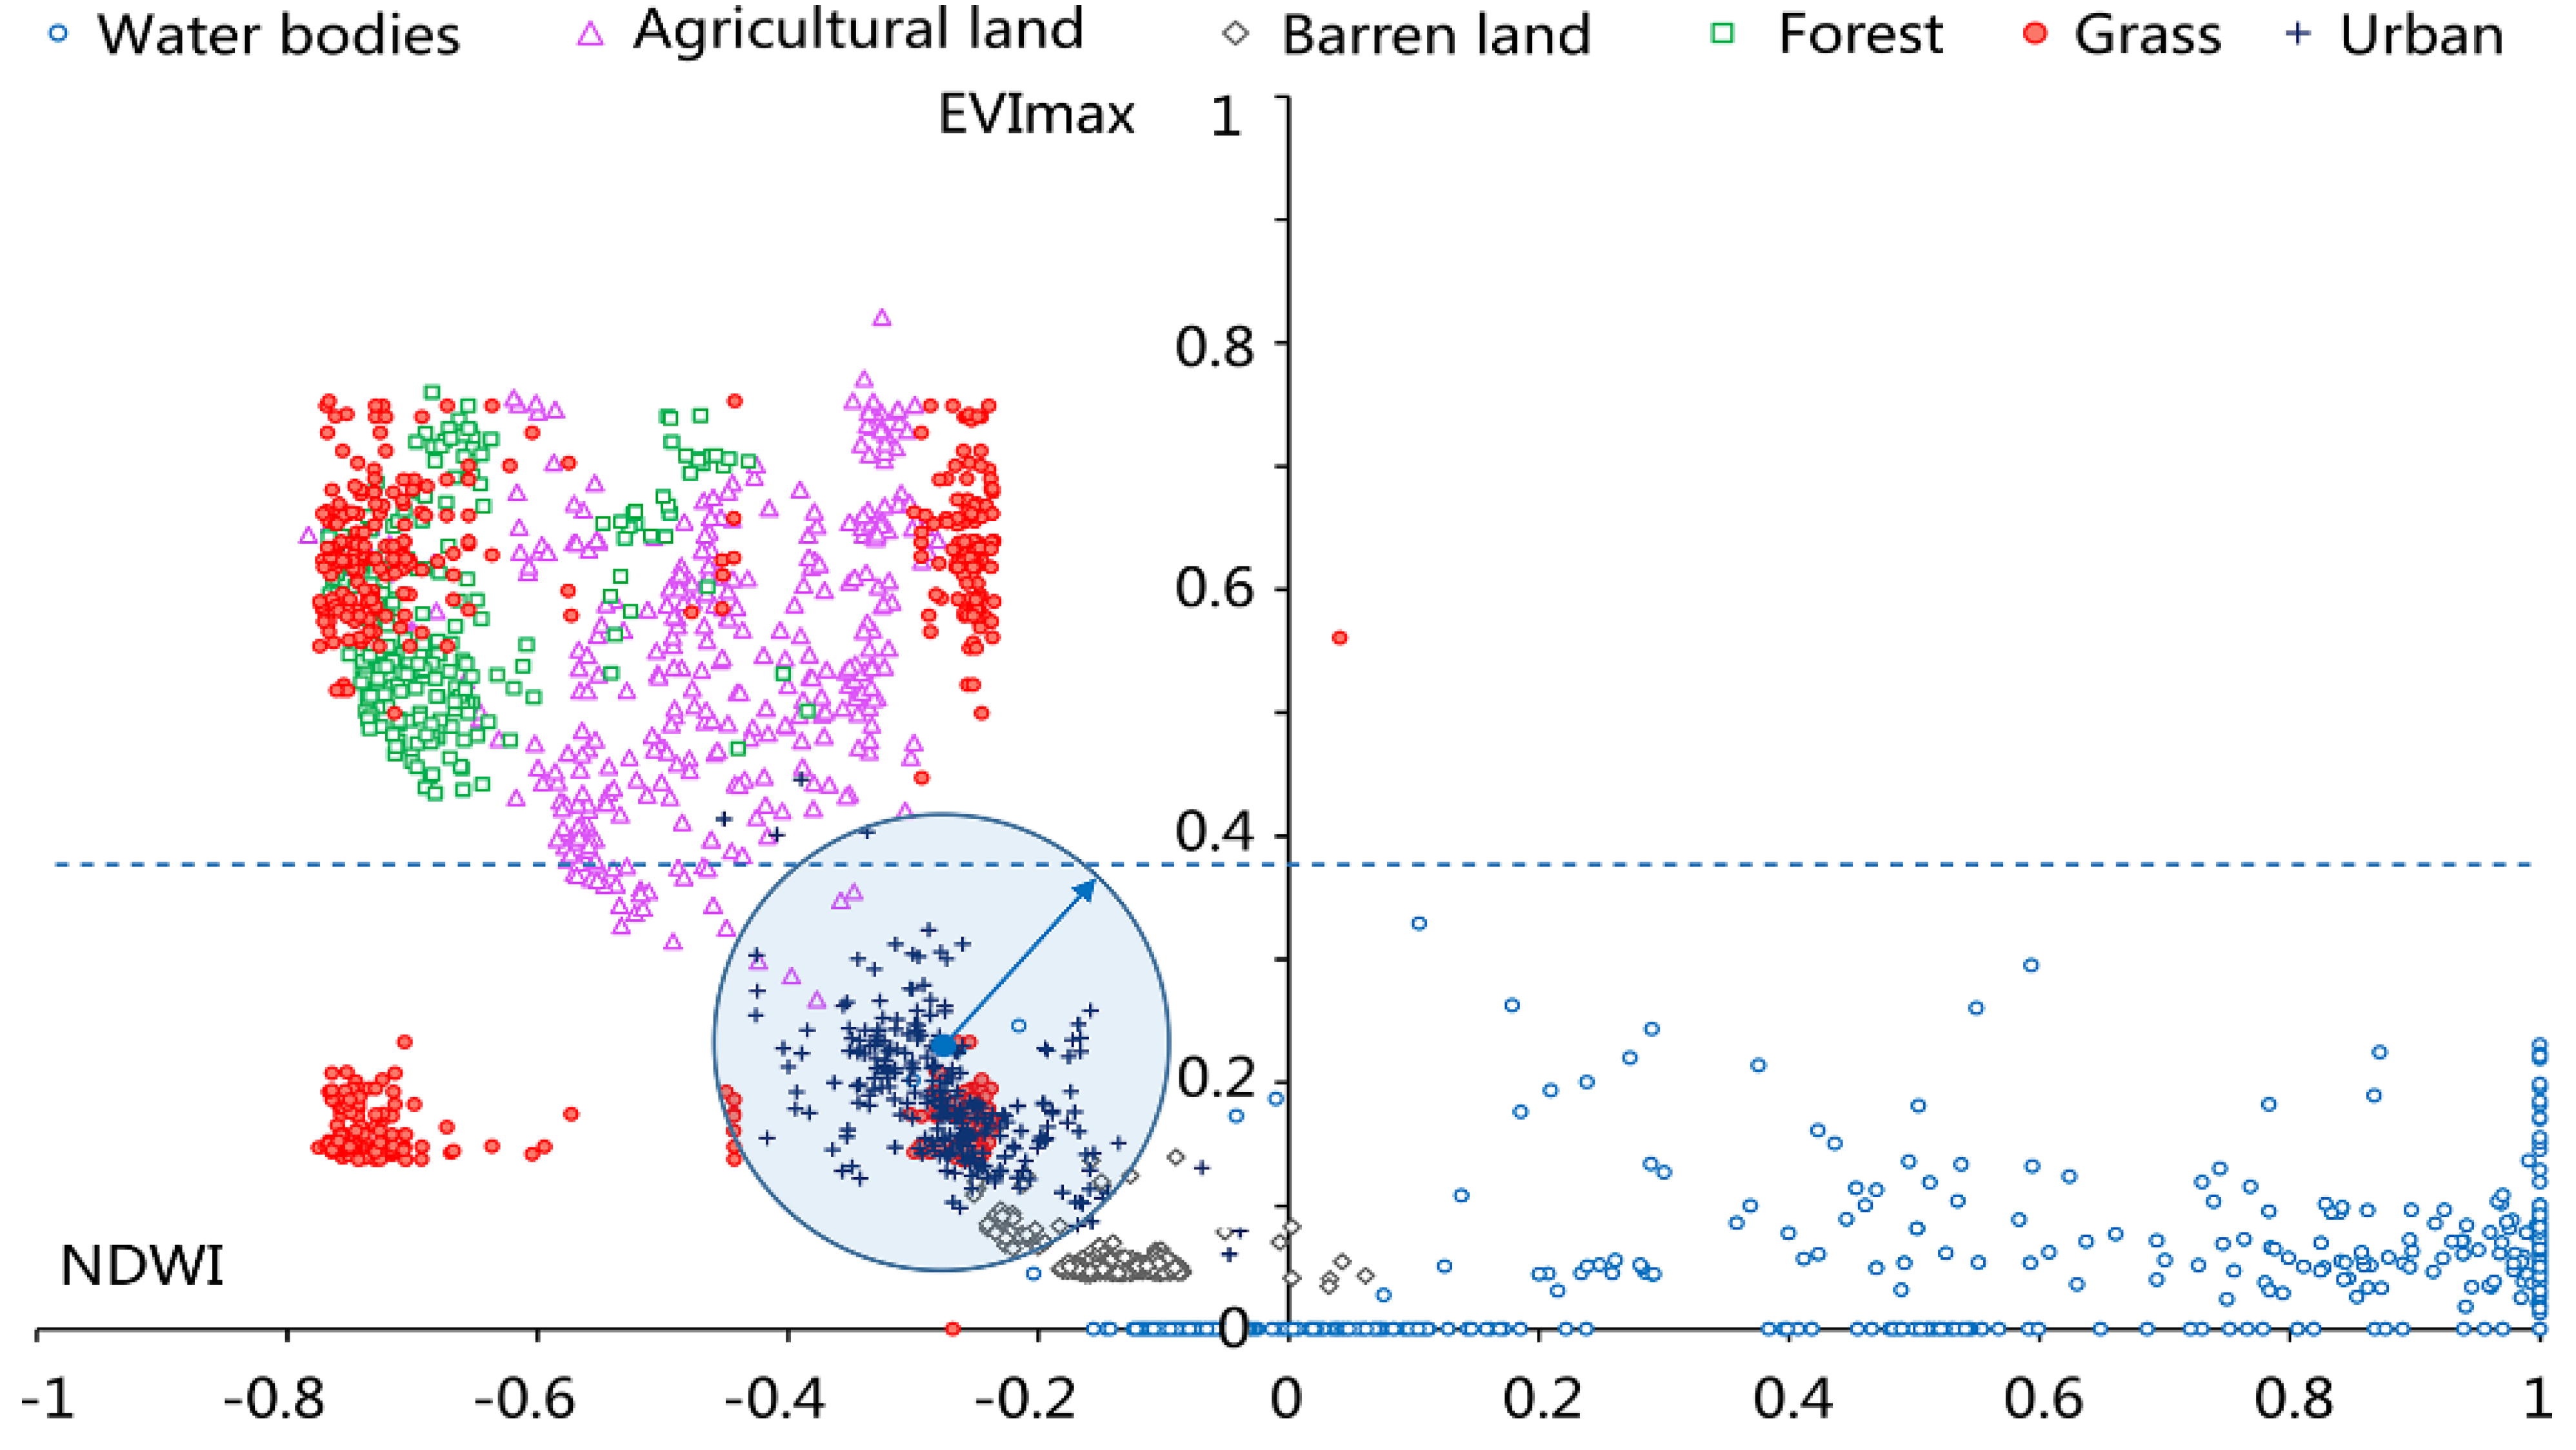
r in Equation (1) must be determined before implementing NUACI calculation for the study region. Urban samples collected from ETM+ can be used to determine the a, b and r parameters. We calculated the average values of NDWI and EVImax for urban samples to obtain the values of a and b. The parameter r can be set by calculating the distance between the farthest urban sample and the central urban sample, the position of which is given as (a, b). In this paper, the parameters a, b and 
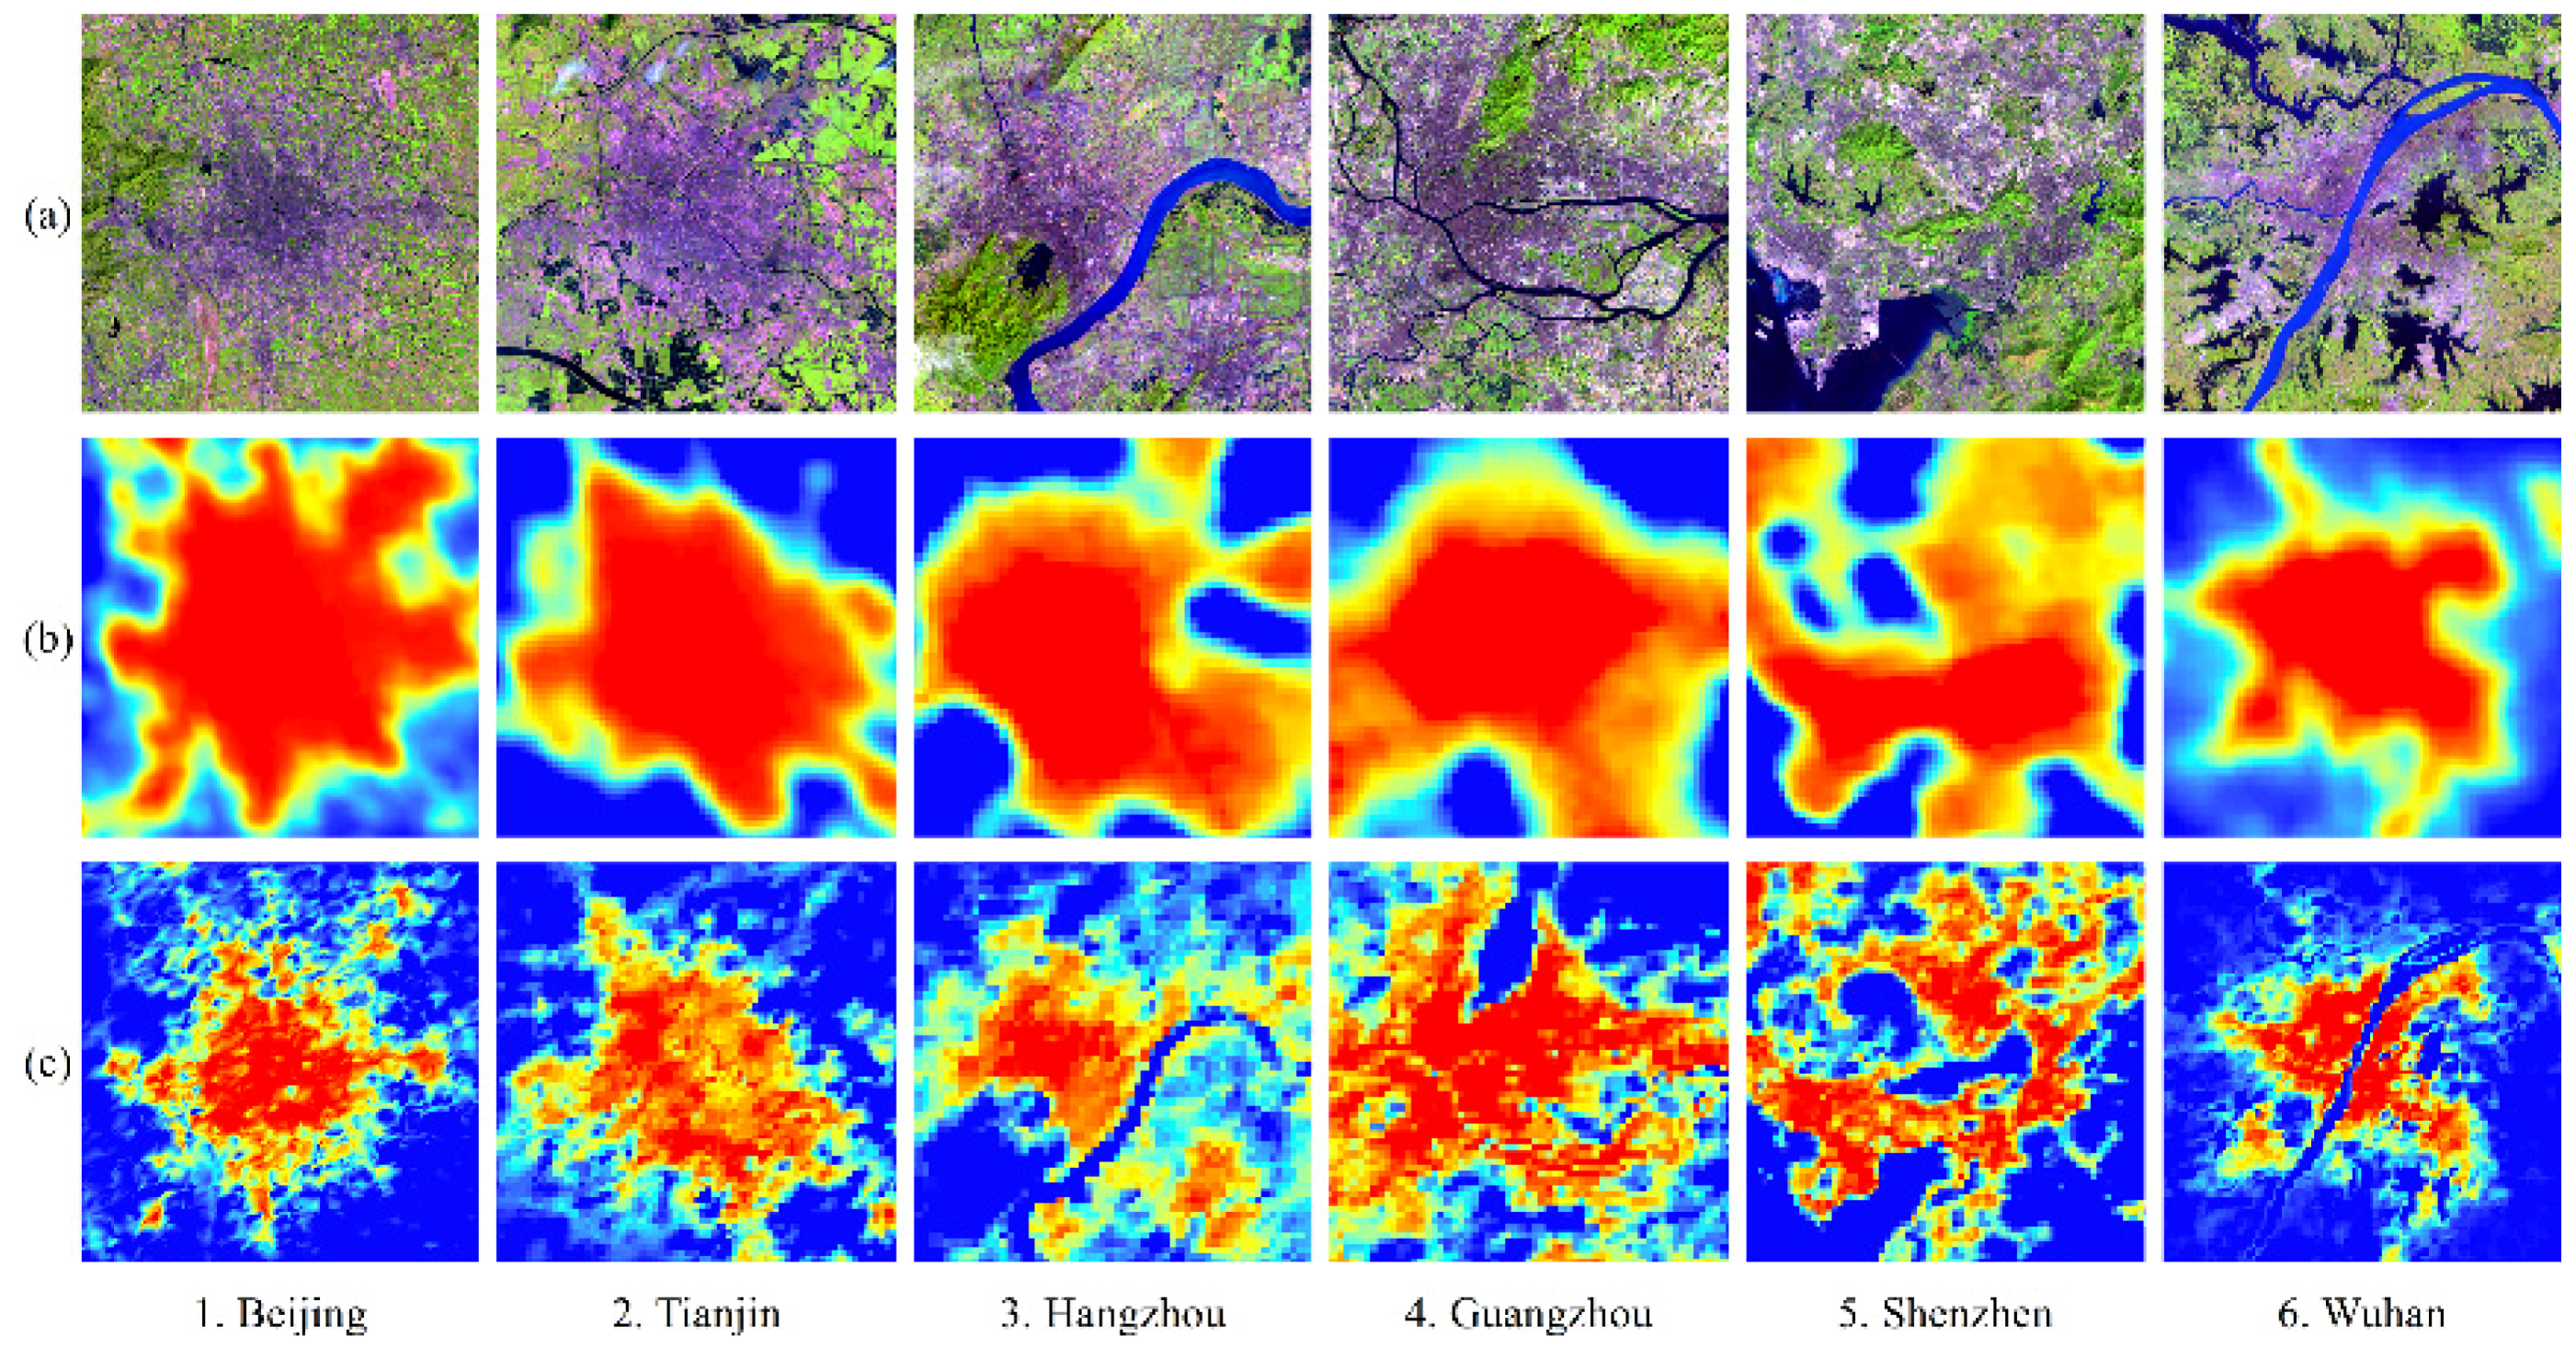
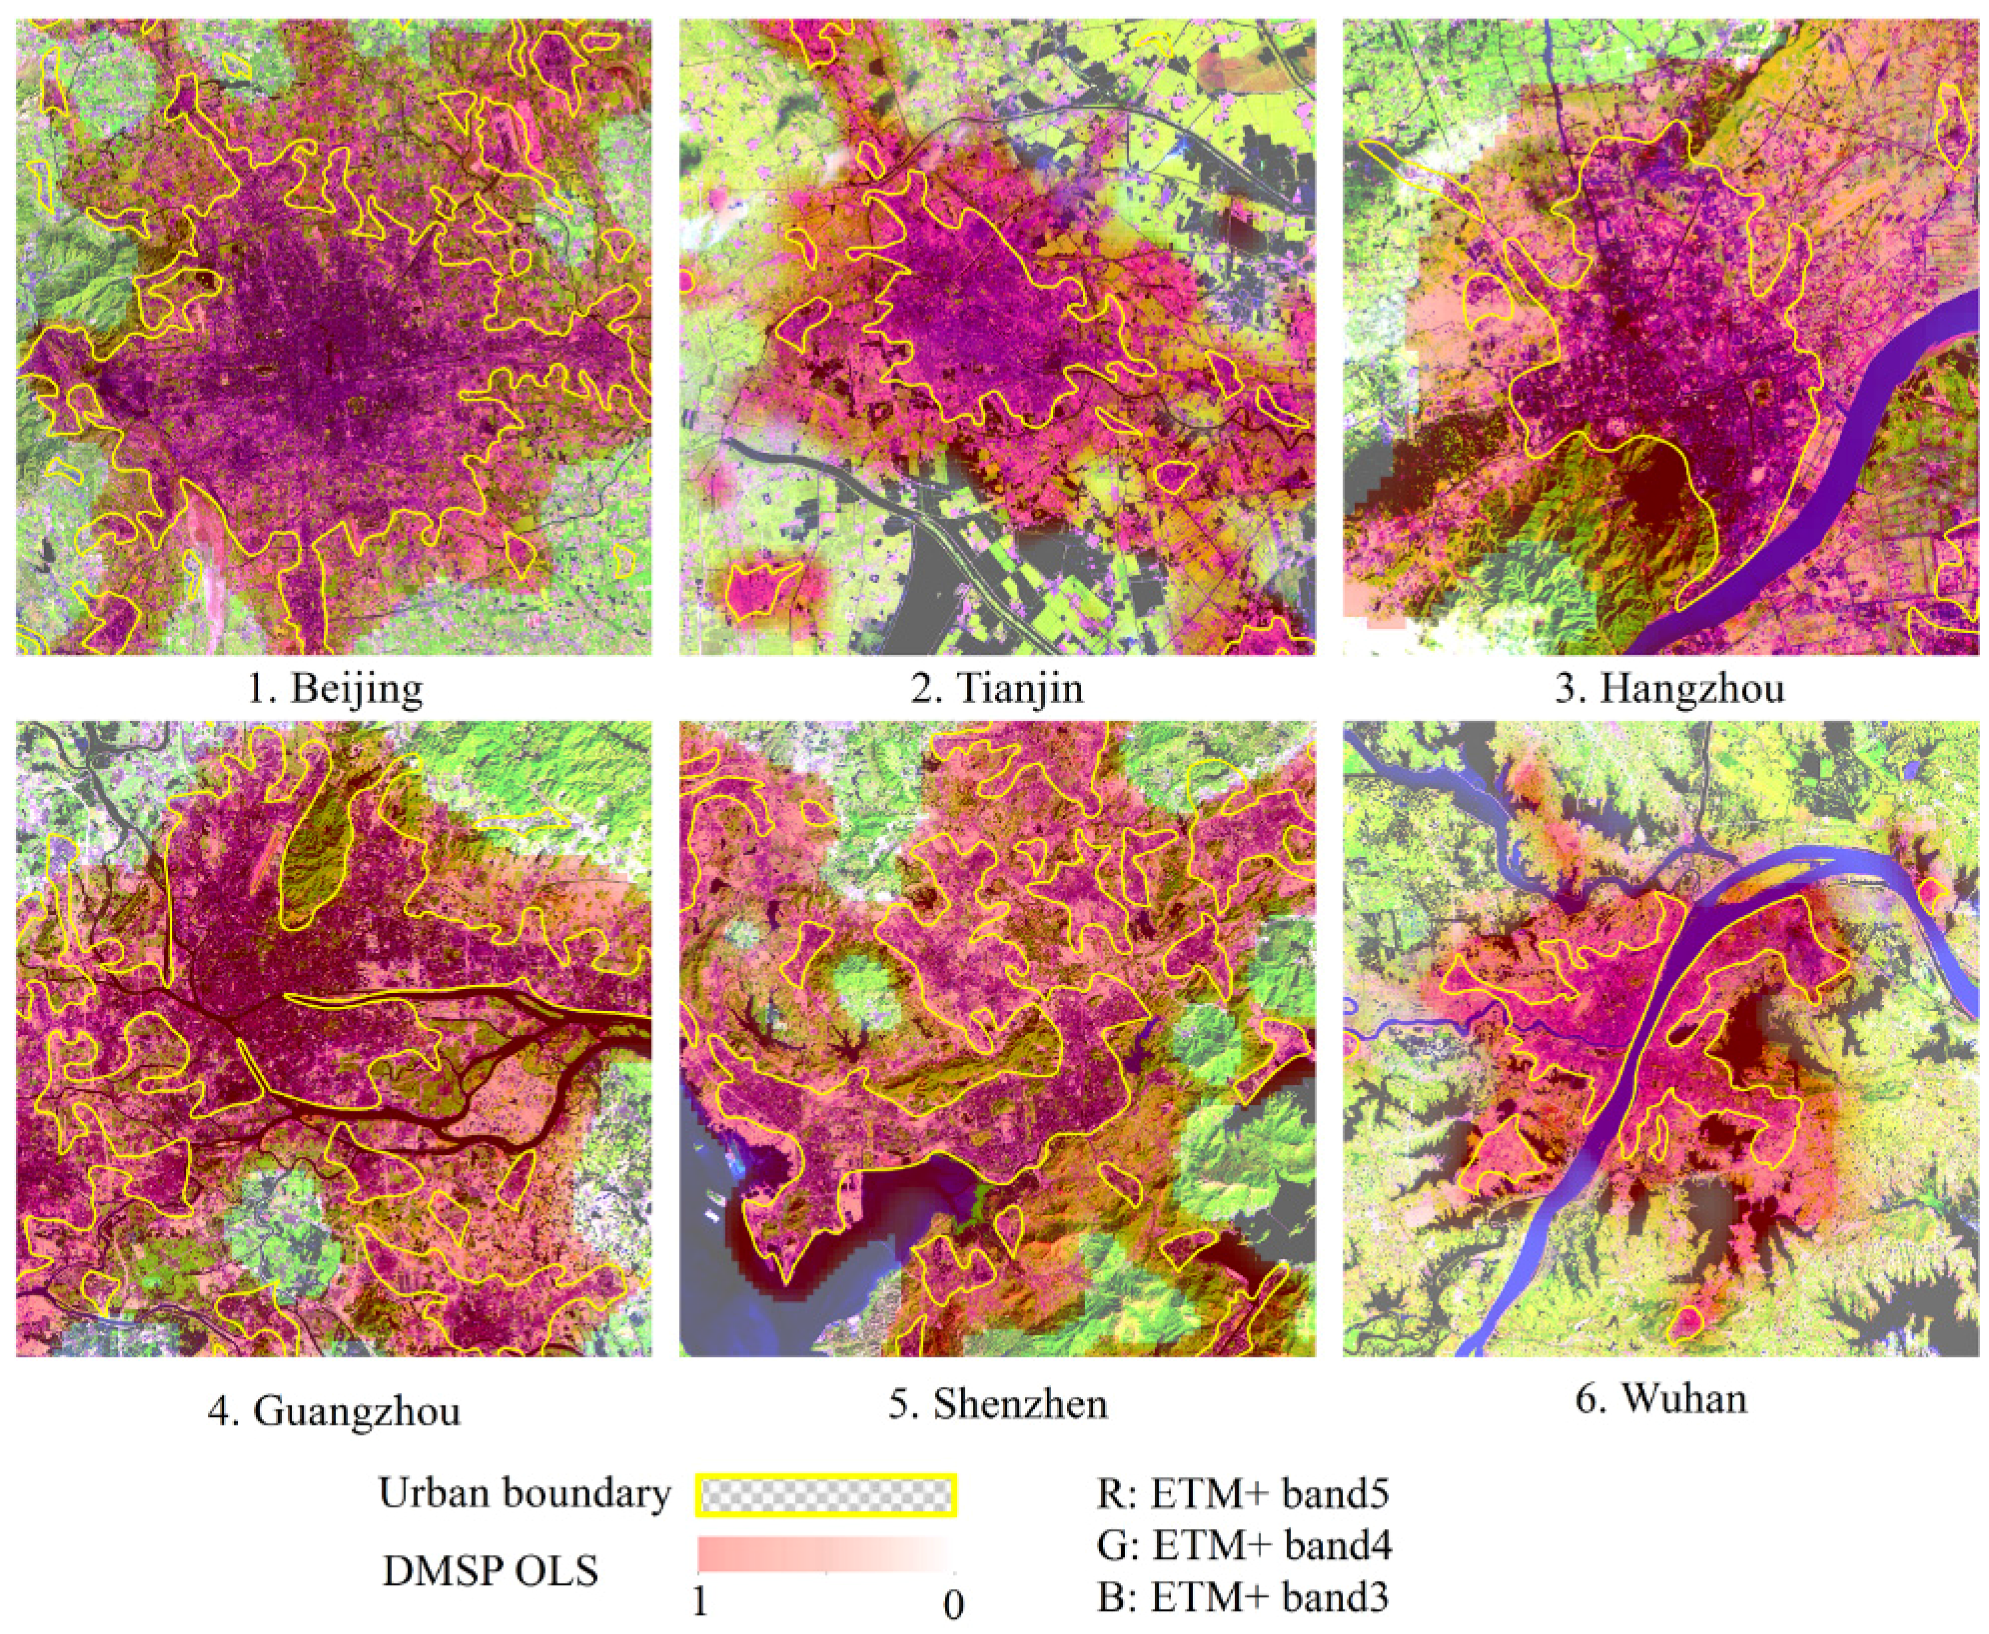
r were finally set to −0.35, 0.15 and 0.4, respectively. Six cities undergoing rapid urbanization, including Beijing, Tianjin, Hangzhou, Guangzhou, Shenzhen, and Wuhan, were selected to make the comparison between the NUACI data and the NTL images. As shown in 
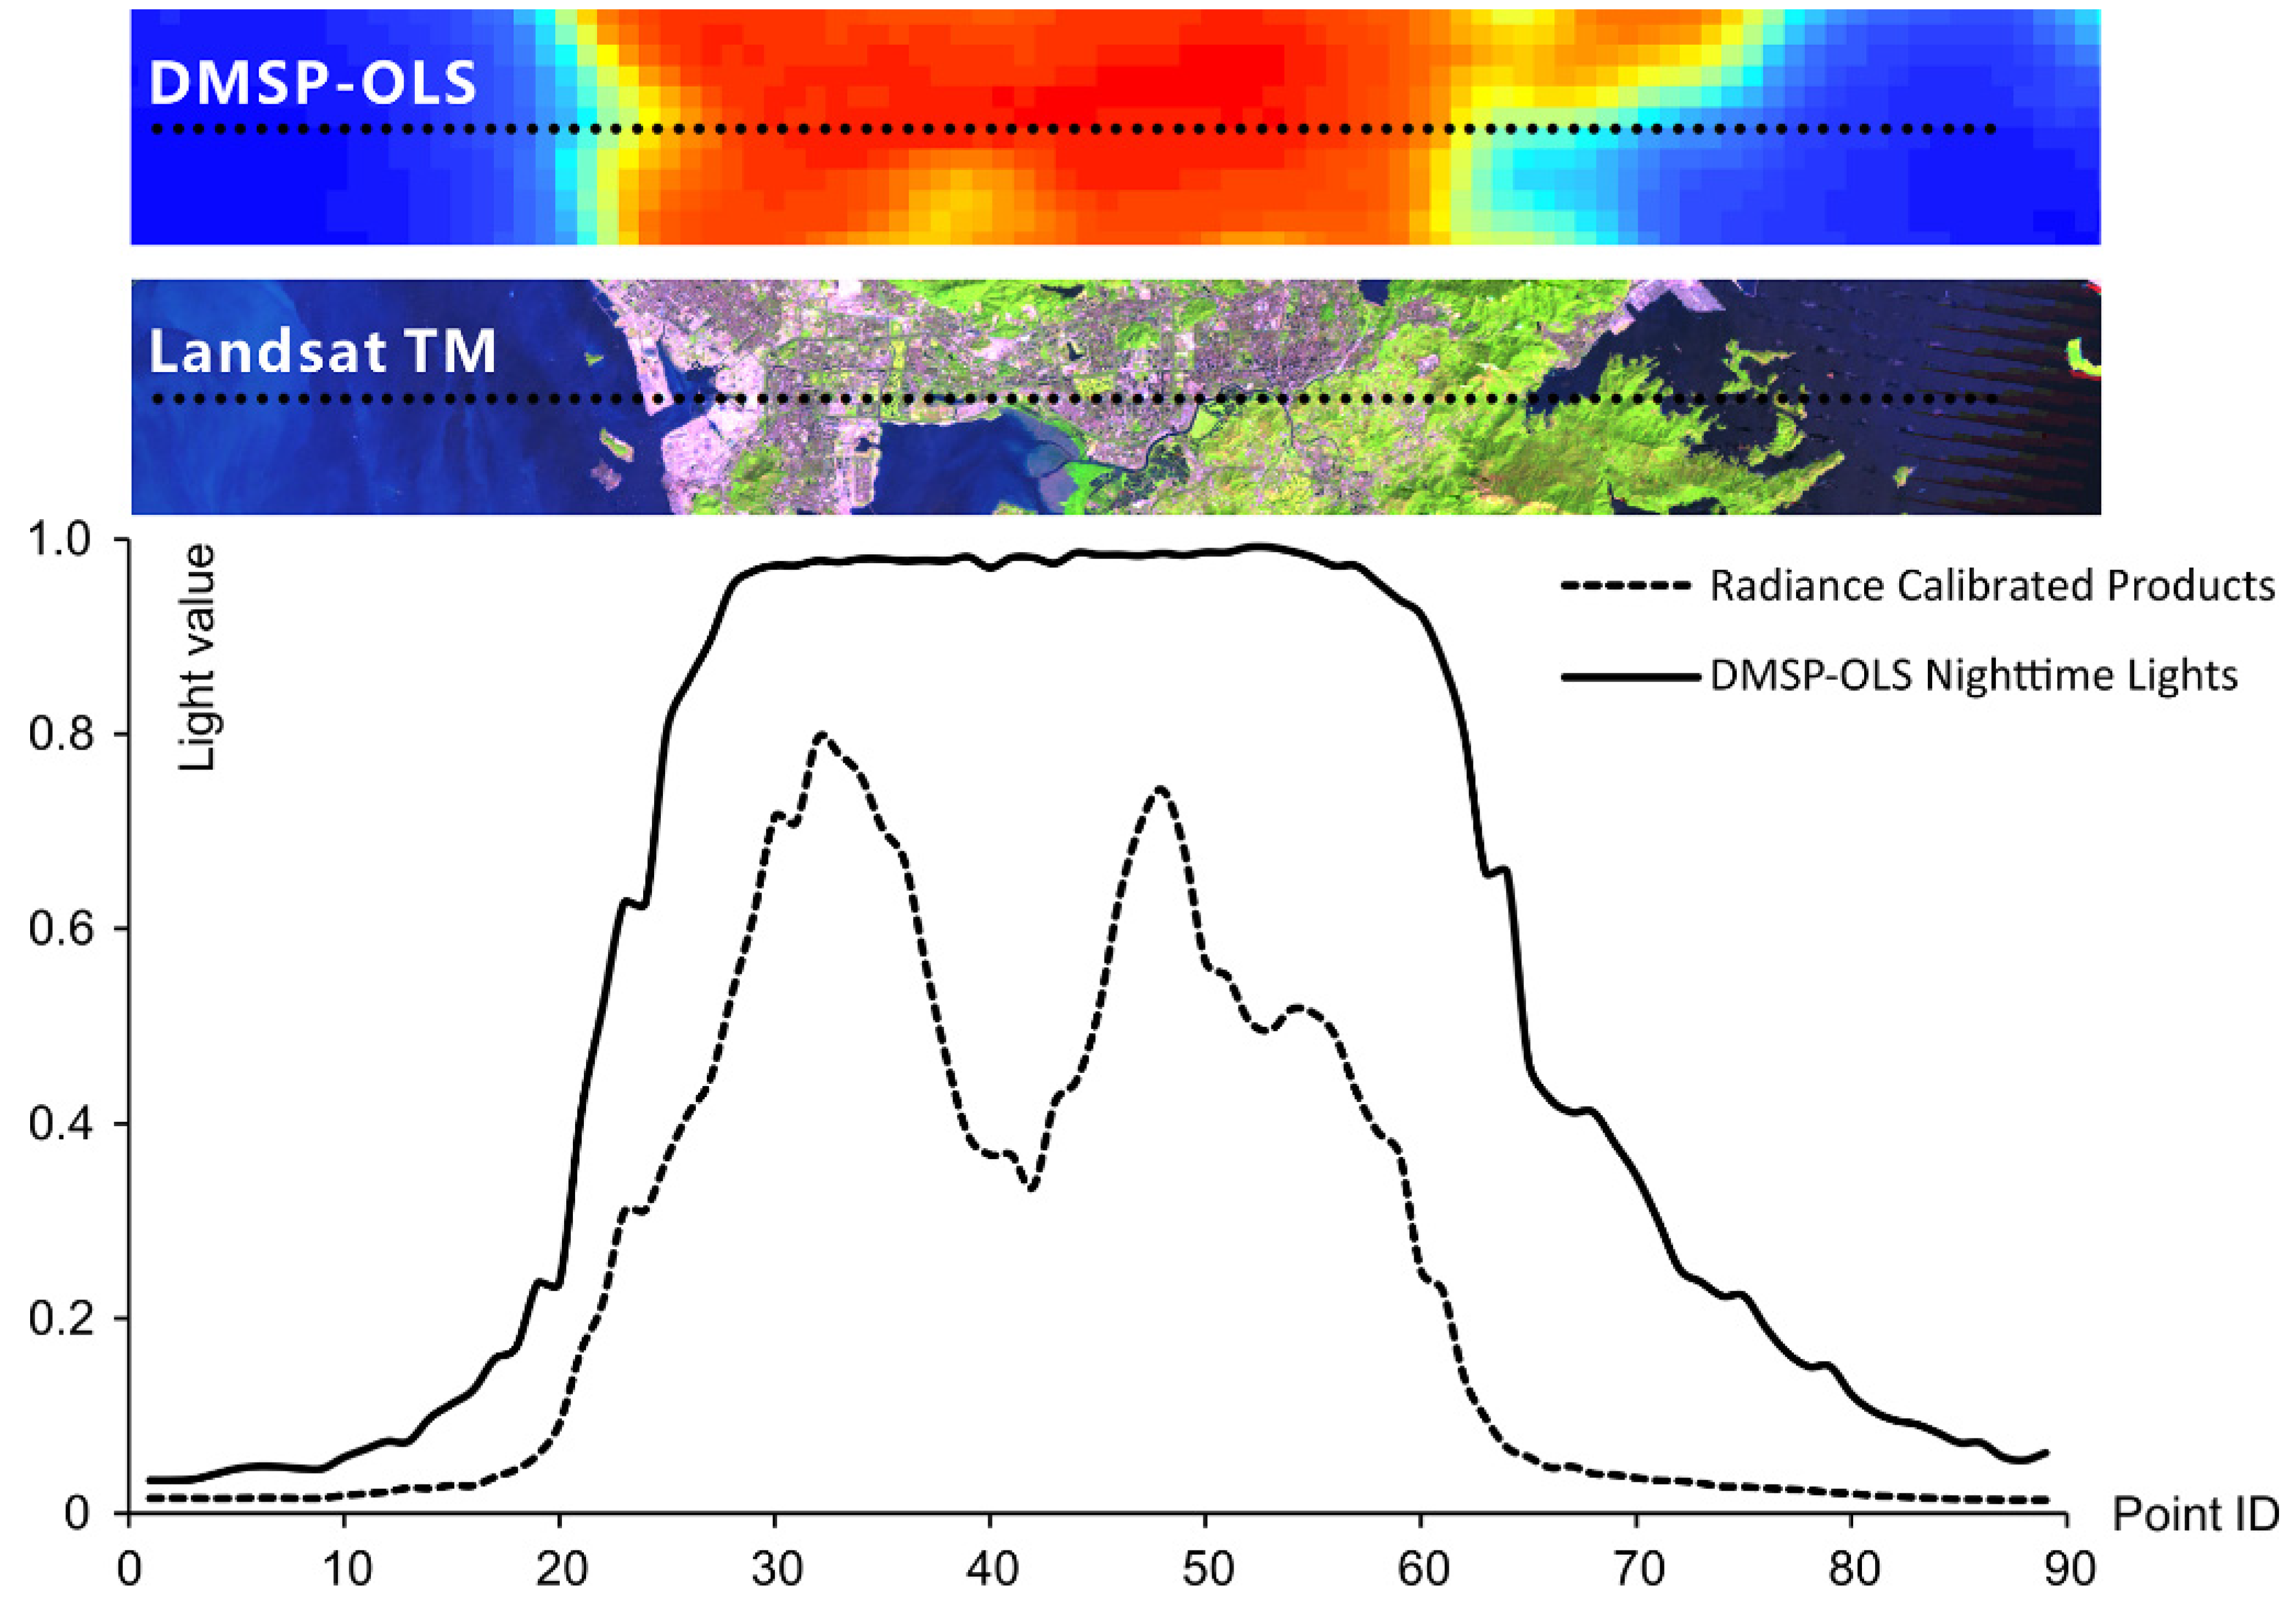
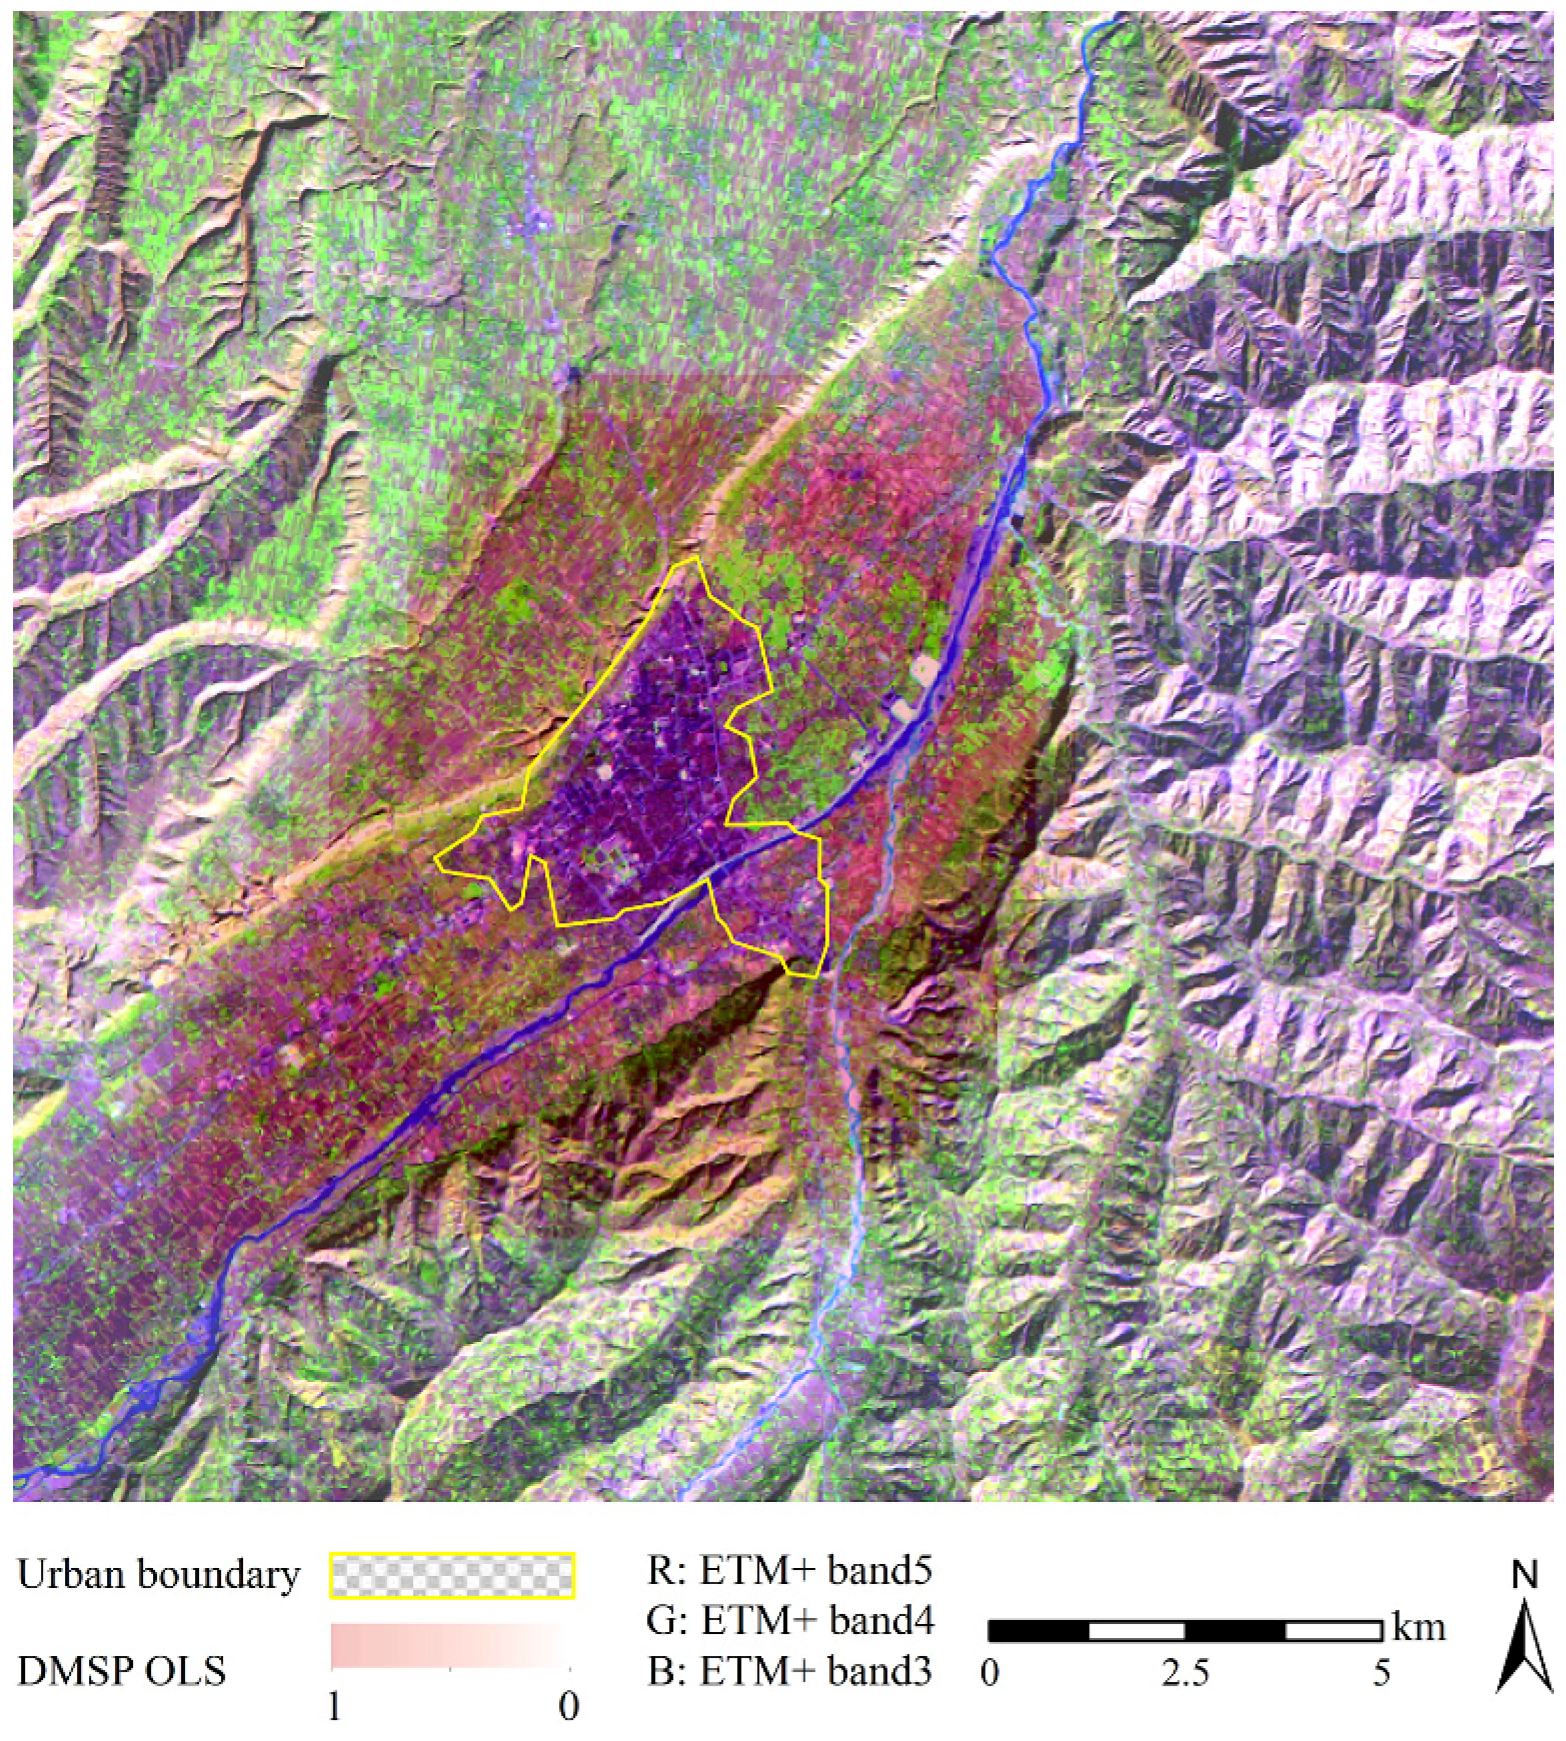
Figure 5, NTL values were kept invariant in the urban core because of pixel saturation. Furthermore, the blooming effect caused pixels scattered near urban periphery to exhibit high DN values in NTL images. Non-urban land cover within peri-urban areas can be effectively separated from urban lands by using NUACI.
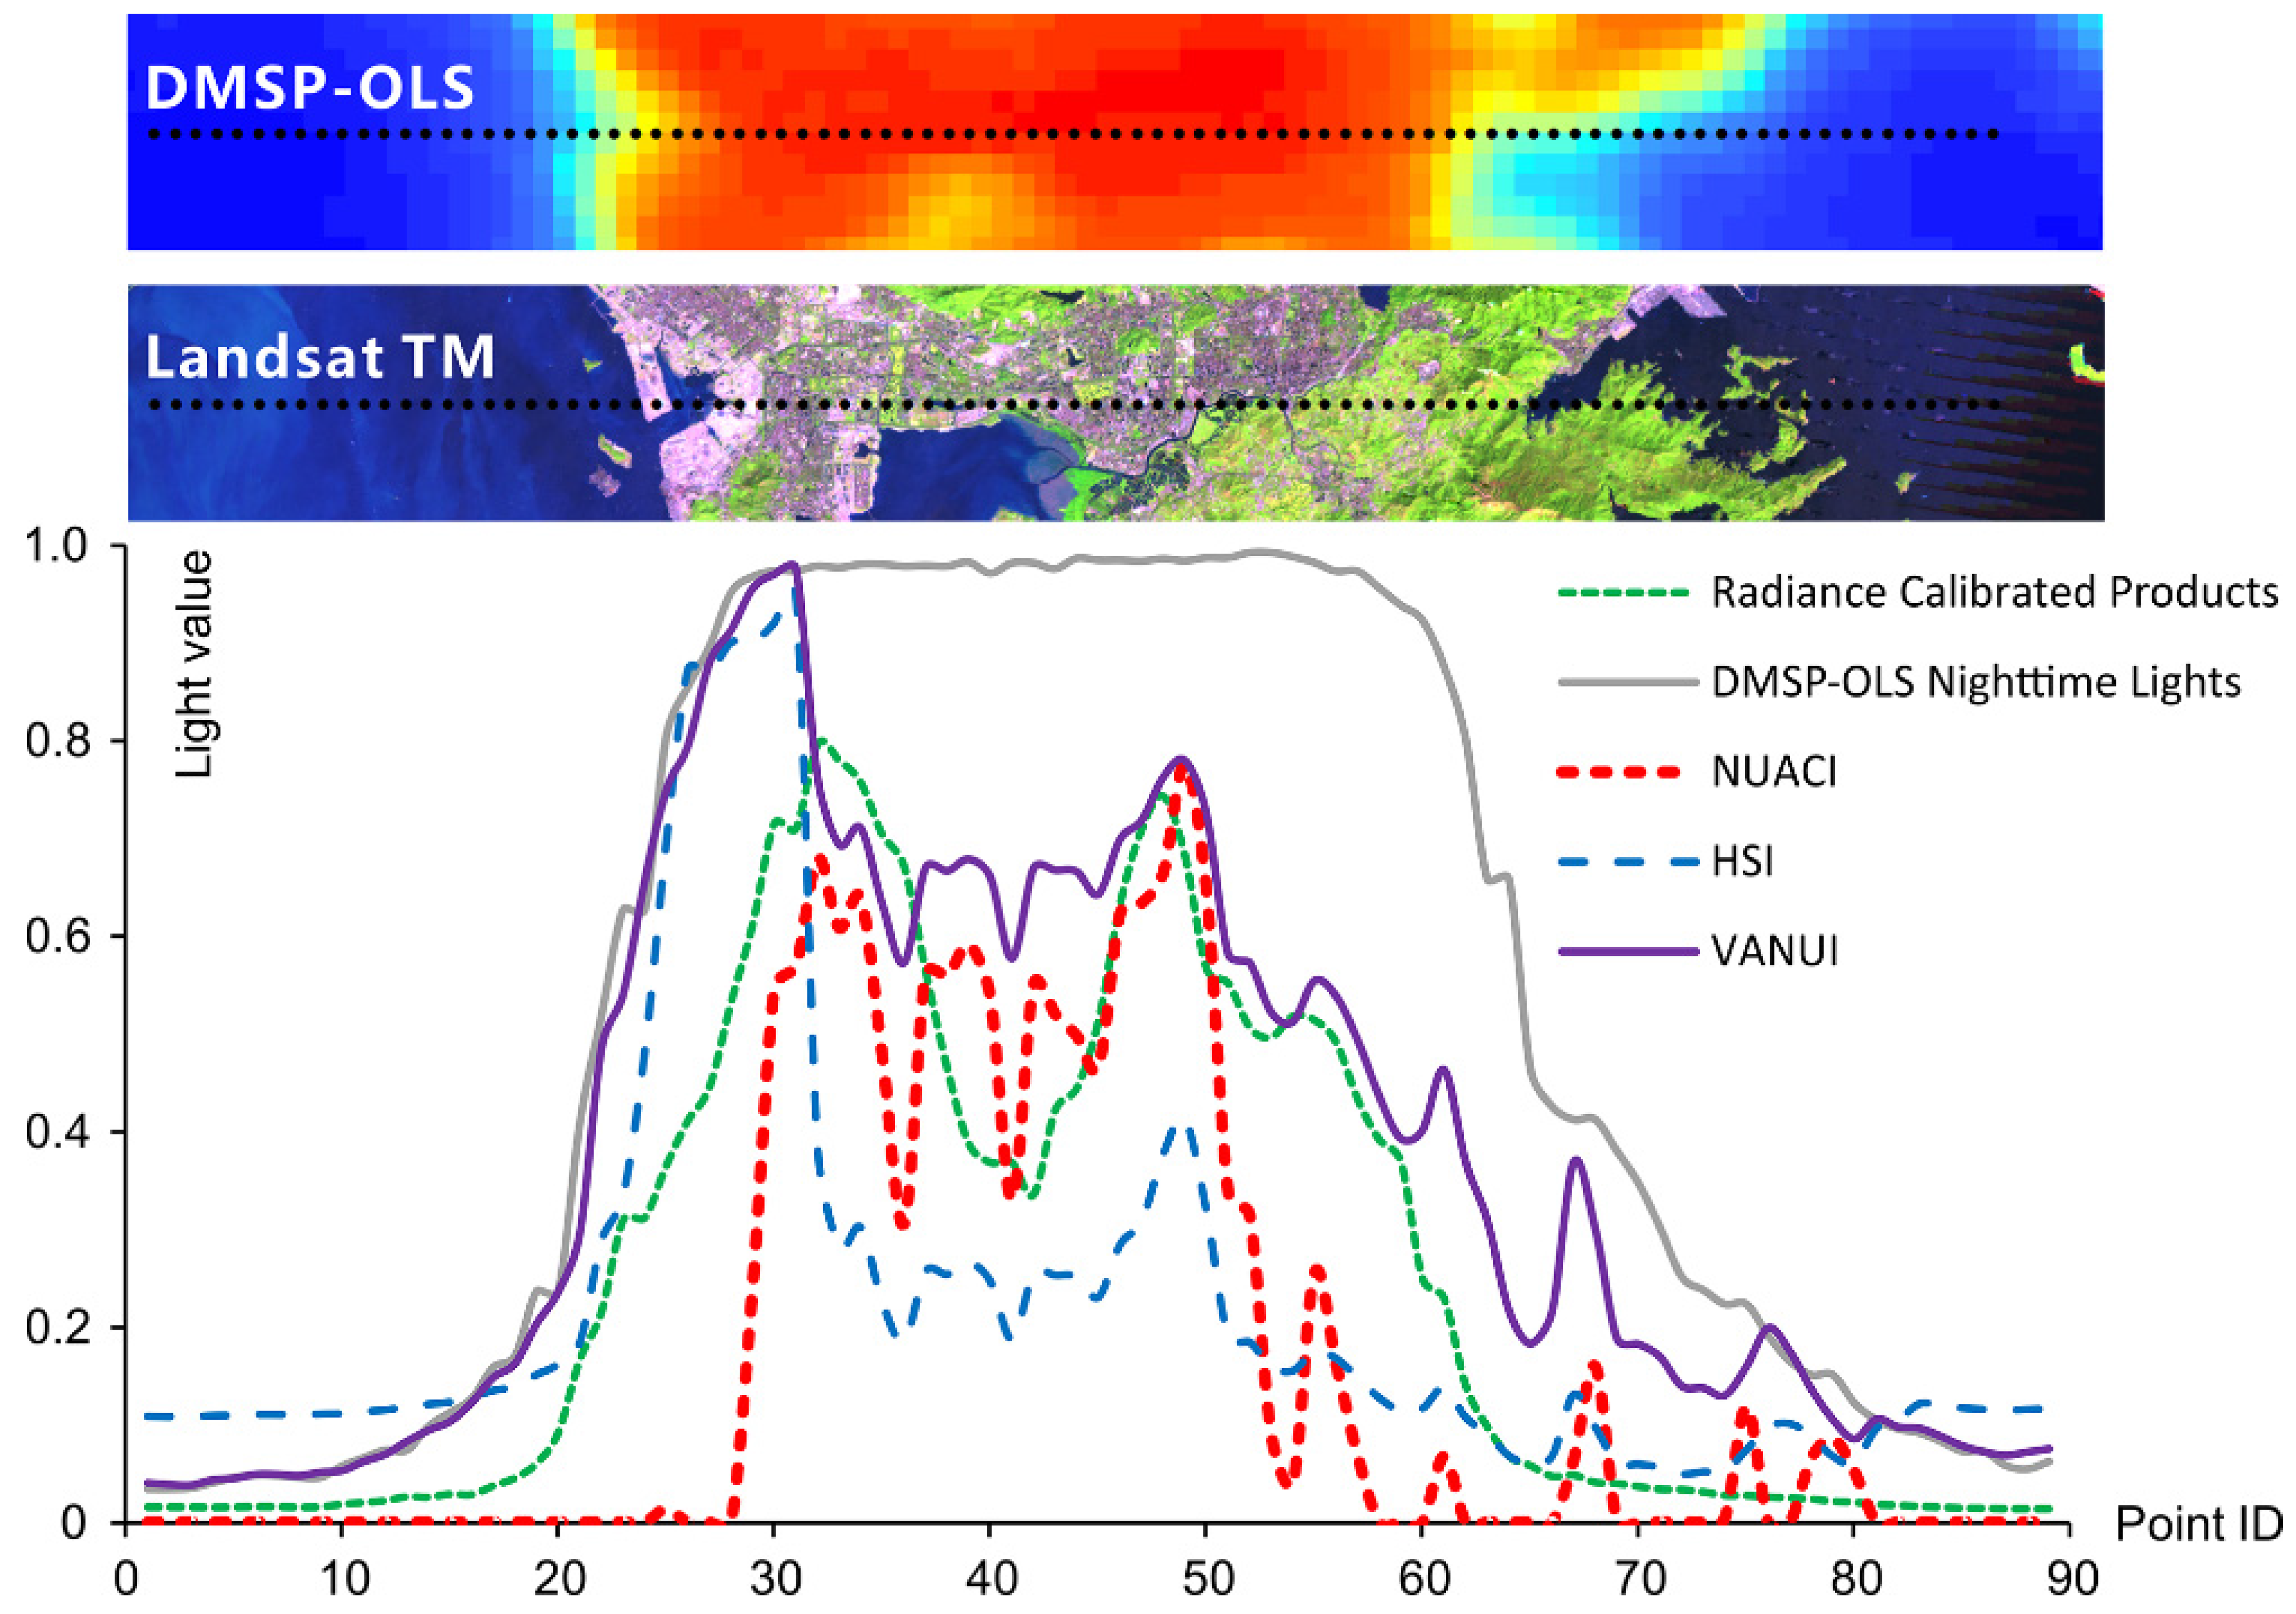
To further evaluate the ability of NUACI on reducing pixel saturation and eliminating the blooming effect, a visual comparison was performed between NUACI, NTL, calibrated NTL without saturation, VANUI and HSI for a latitudinal transect in Shenzhen (Figure 6). It was apparent that the spatial pattern of NUACI is similar to those of VANUI and HSI. However, NUACI values vary within the urban core, increase toward the urban core, and decrease away from the urban core. The comparison illustrated that although these three indices can reduce pixel saturation and increase inter-urban variability, NUACI values have more variations within urban areas. More importantly, both VANUI and HSI are incapable of reducing the blooming effect because their values for non-urban land cover around the peri-urban areas are still high. In contrast, NUACI values for those areas are very low—almost equal to zero. This result indicates that NUACI has the ability to solve the pixel blooming problem. Figure 7 and 
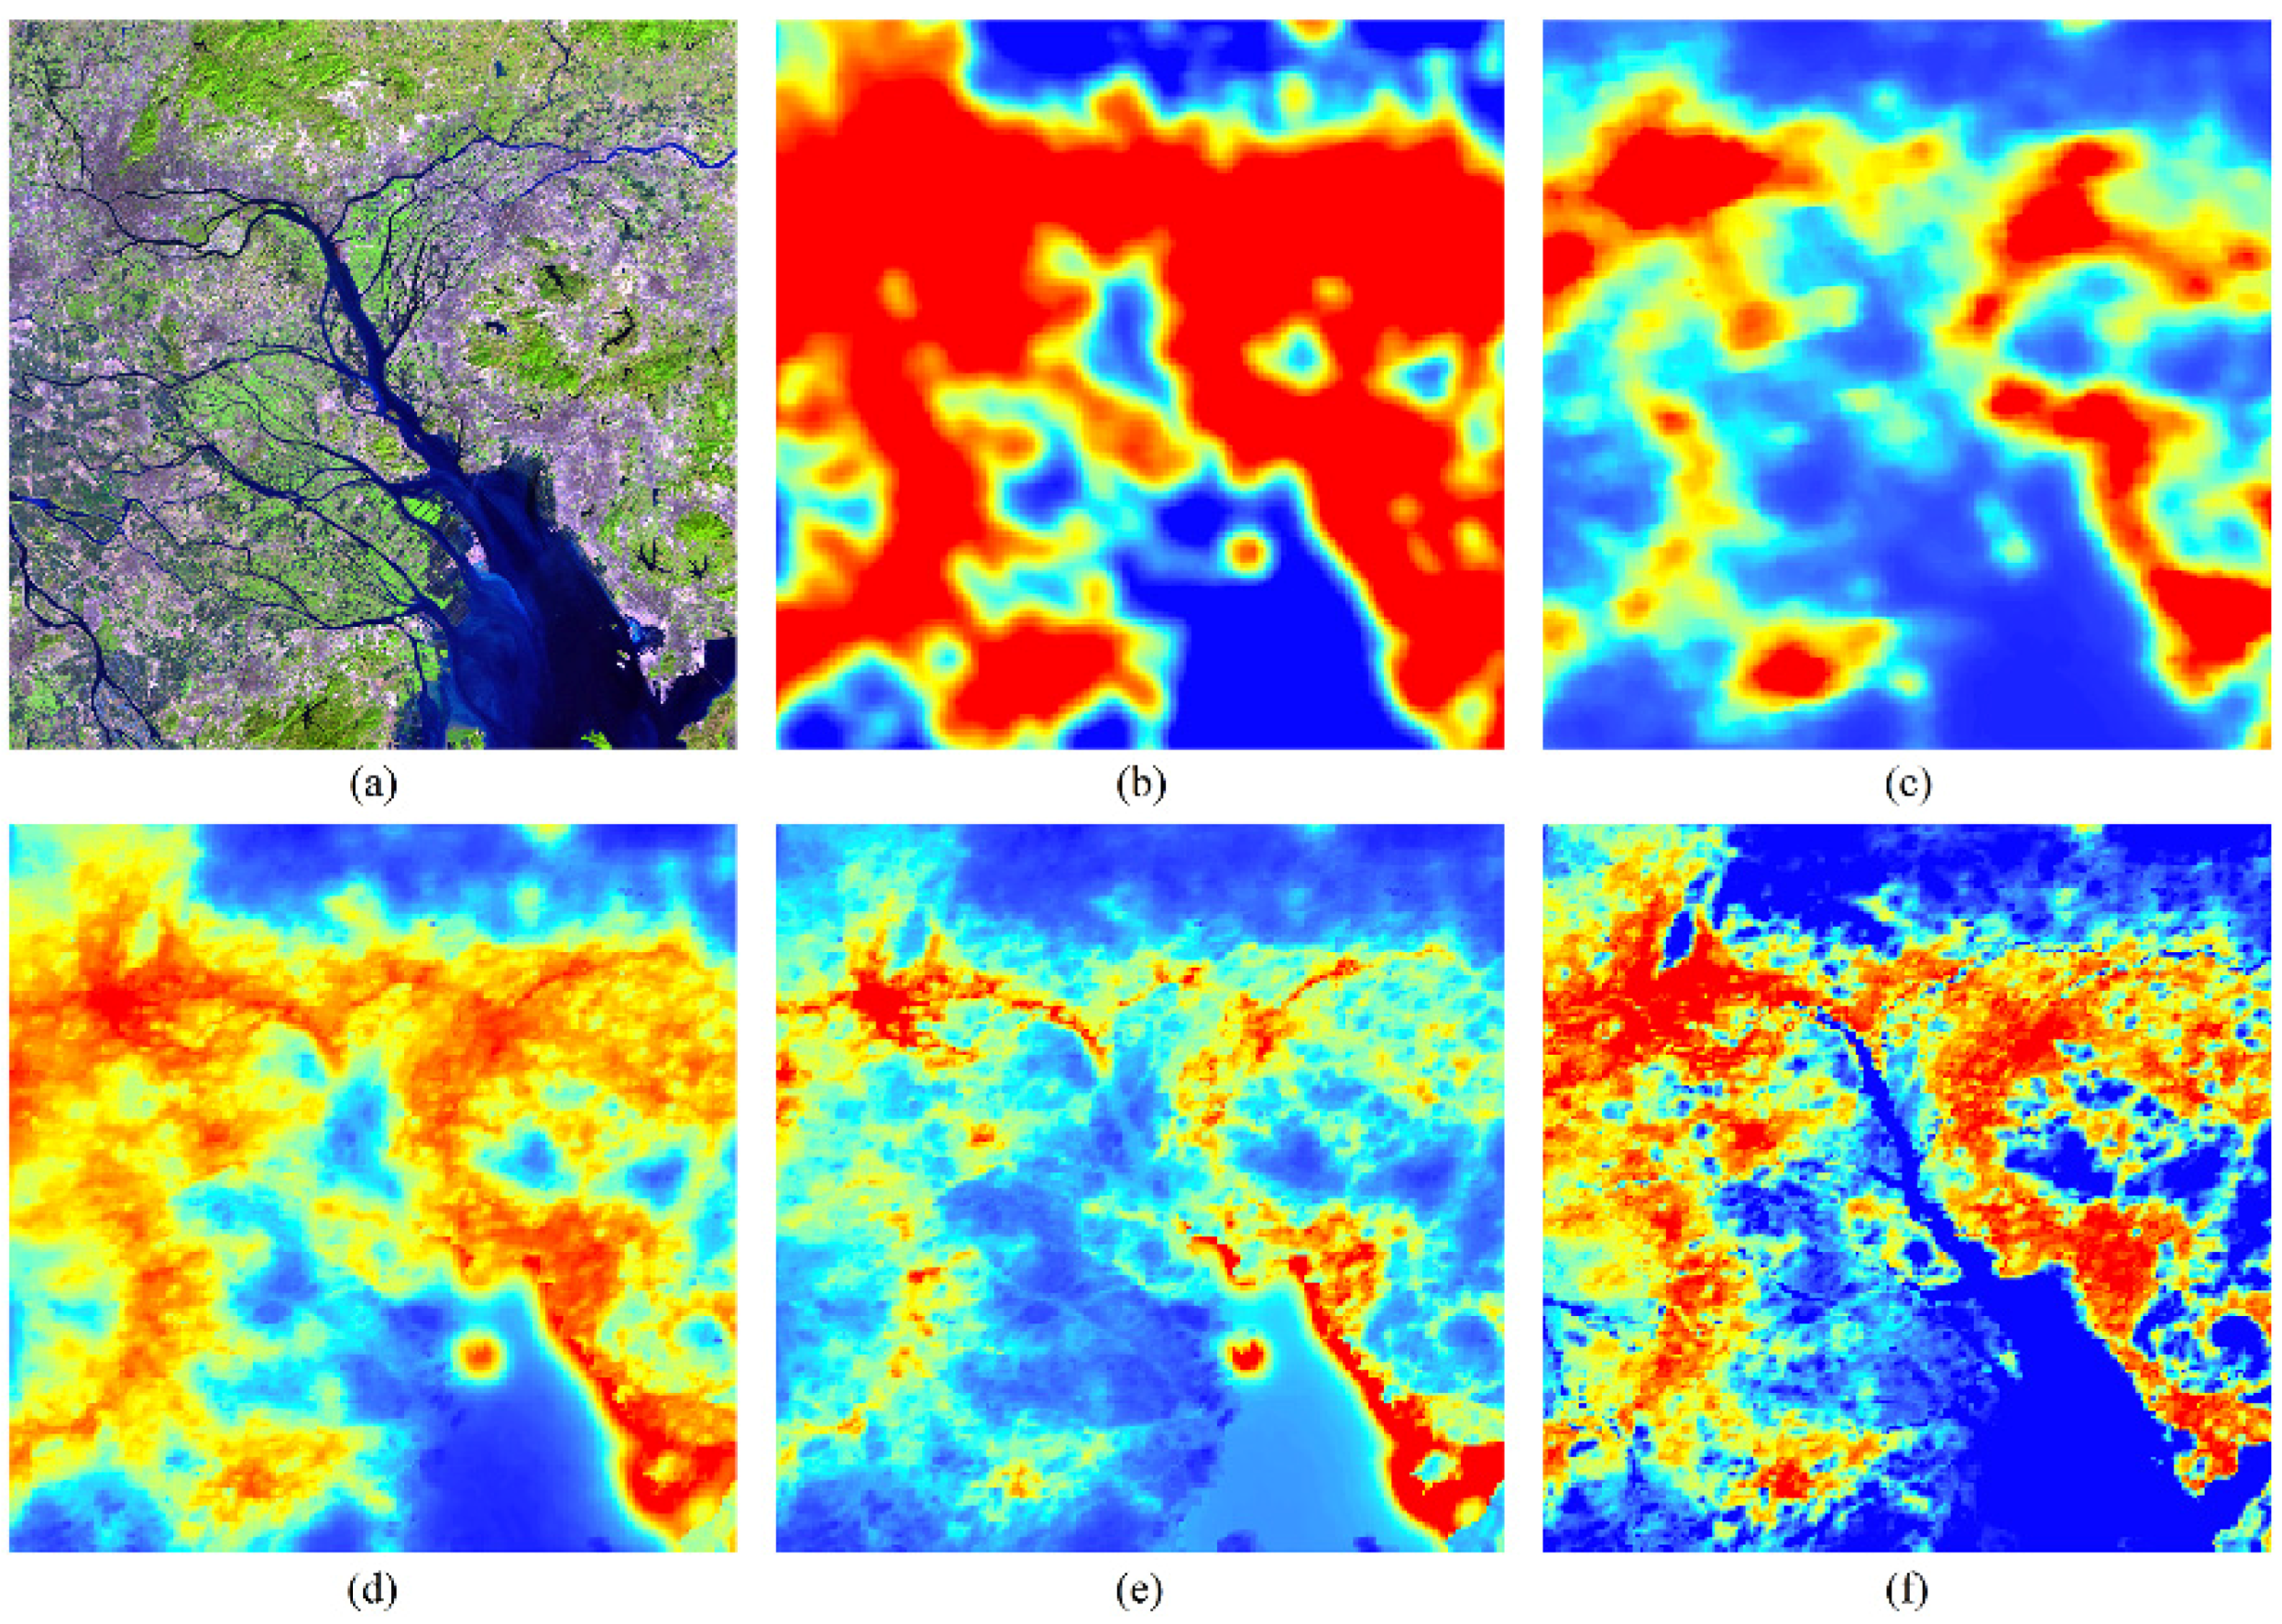
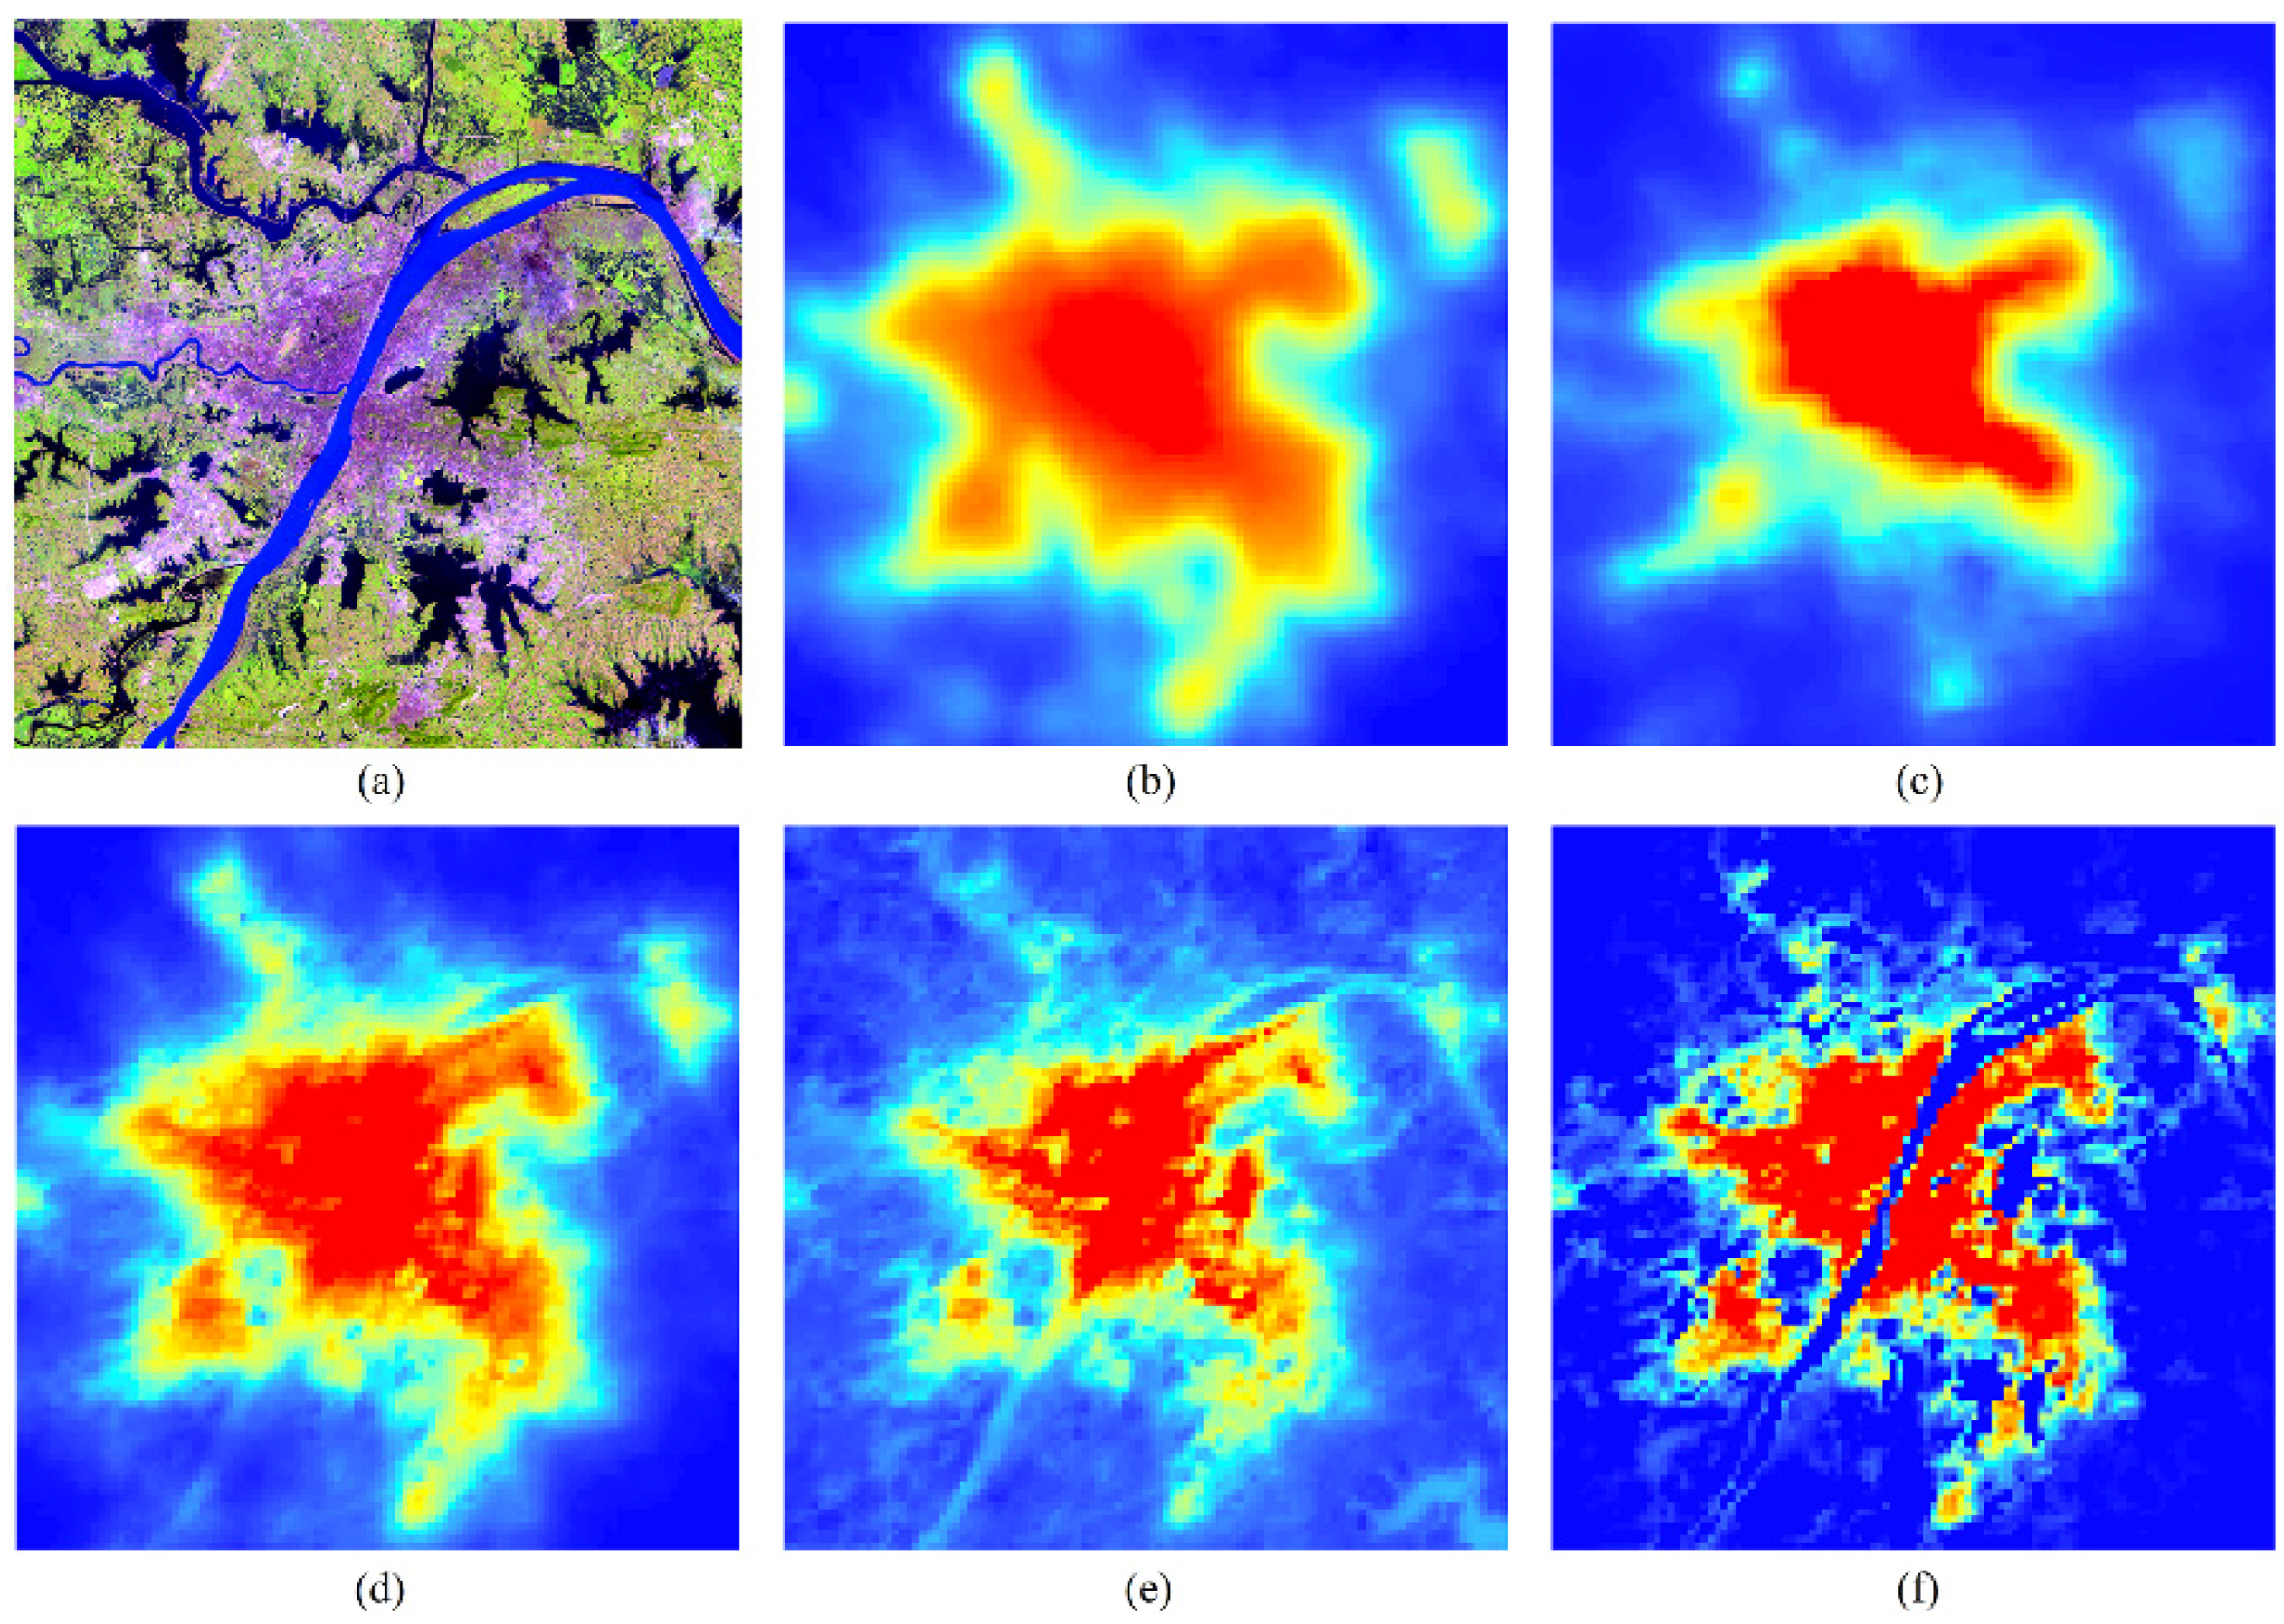
Figure 8 also display visual comparisons among corrected images selected from the Pearl Delta and from the city of Wuhan as sample areas. The shoreline or riverbank located in the cities is apparently affected by pixel blooming in the NTL data. Pixel blooming is most evident on the imagery where glints of light into adjacent water bodies can be observed. As illustrated in Figure 7 and Figure 8, both VANUI and HSI are incapable of separating water bodies from urban areas, whereas NUACI can accurately capture the spatial distribution information of urban areas.
Figure 5. Comparison of Landsat ETM+ images (a); NTL data (b); and NUACI images (c) for six cities.
Remotesensing 07 15863 g005
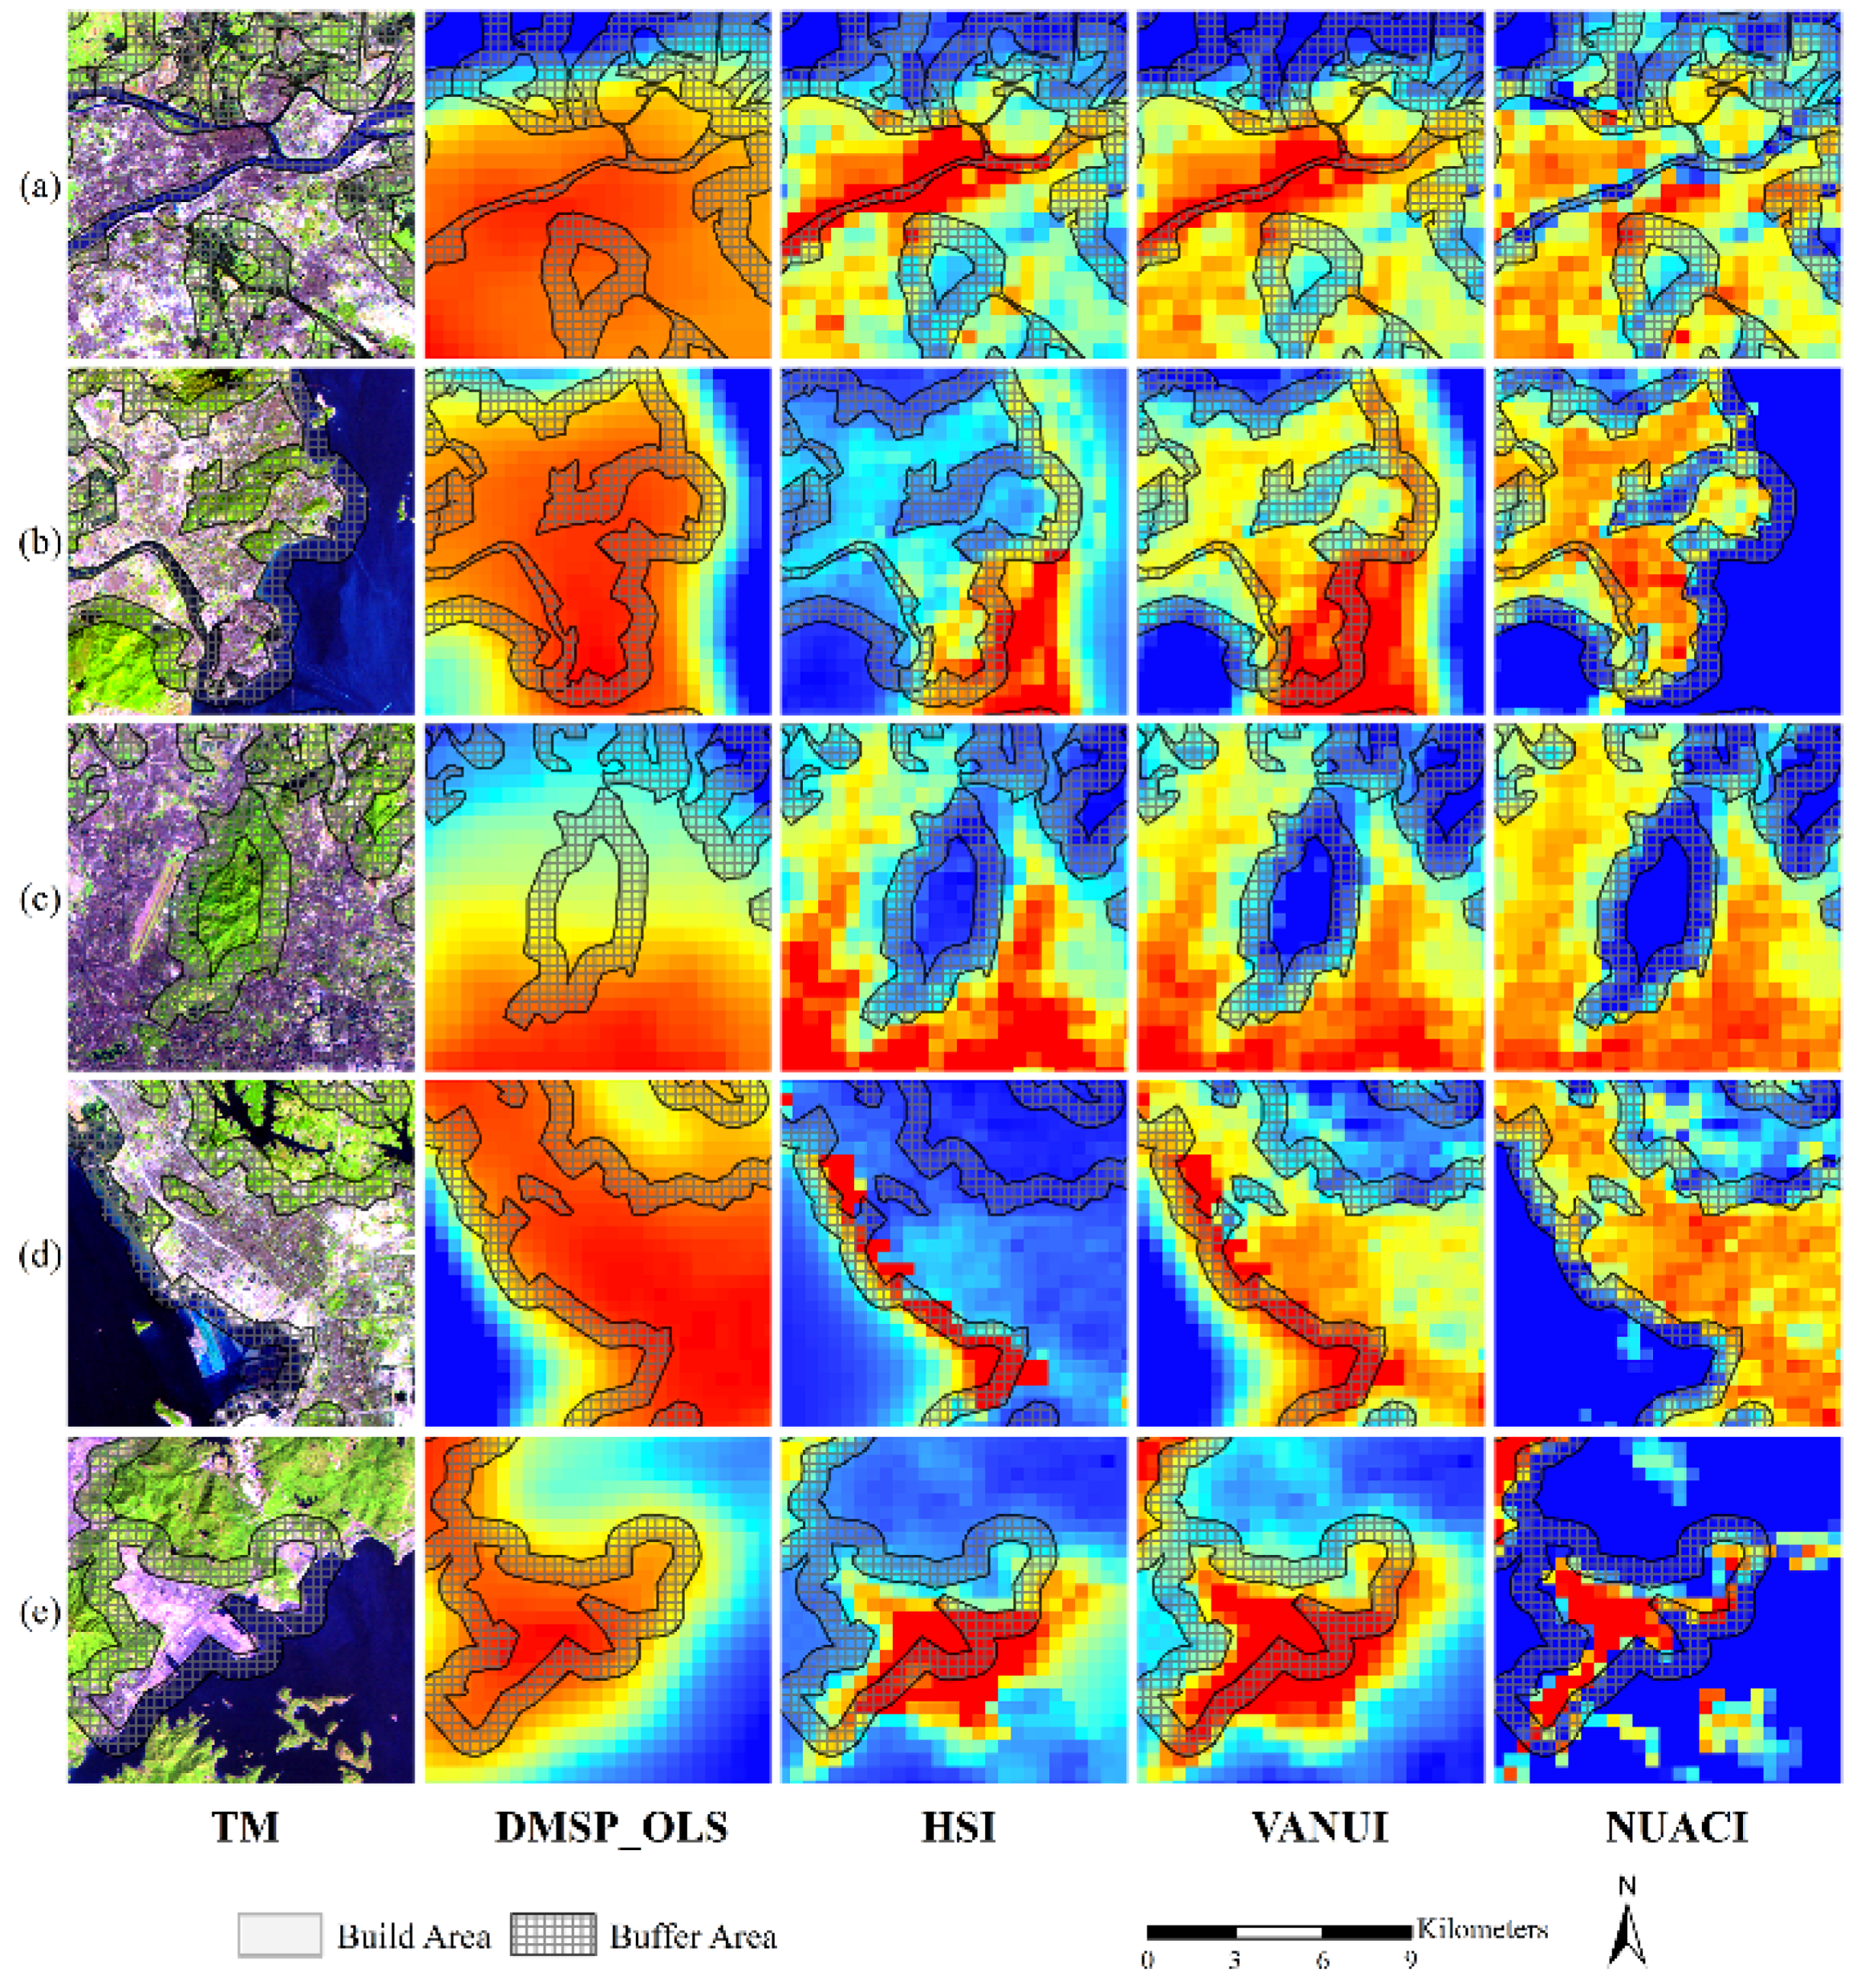
Further quantitative assessment was carried out to validate the performance of the proposed NUACI index on eliminating the blooming effect. In this experiment, the Pearl River Delta was selected as the sample area. The values of areas located within present urban lands were discussed and analyzed in detail. Urban lands were retrieved from TM/ETM+ images covering the Pearl River Delta, a total of six buffers around existing urban areas within an interval distance of 0.5 km were designated. The mean values of those buffer areas were then calculated for different urban indices. Theoretically, DN values for those non-urban areas should equal zero. However, the buffer areas may show different mean values because of the blooming effect. When lower mean values appear in the corrected images, we can consider the blooming effect extremely restrained. Table 2 shows the average values for different indices based on images within six buffers. The lowest average values were obtained from the NUACI-based images, which were less than those from DMSP-OLS, HSI, and VANUI images in all the buffer areas.
Figure 9 shows a visual comparison of value distribution pattern among the different urban indices images. The scope of blooming effects is obviously reduced and sometimes even eliminated in the NUACI images. When the buffer area contains large-scale water bodies, the values of NUACI are approximately zero, whereas pixels within the buffer areas for the other urban indices images show high values because of the remaining blooming effect.
Figure 6. Latitudinal transects of calibrated NTL, saturated NTL, NUACI, HSI, and VANUI for Shenzhen, China.
Remotesensing 07 15863 g006
Figure 7. Comparison of different indexes. (a) Landsat ETM+ images; (b) saturated NTL; (c) calibrated NTL; (d) VANUI; (e) HIS; and (f) NUACI for the Pearl River Delta, China.
Remotesensing 07 15863 g007
Figure 8. Comparison of different indexes. (a) Landsat ETM+ images; (b) saturated NTL; (c) calibrated NTL; (d) VANUI; (e) HIS; and (f) NUACI for Wuhan, China.
Remotesensing 07 15863 g008
Figure 9. Comparison of Landsat TM/ETM+ images, saturated NTL, VANUI, HSI, and NUACI for buffer areas: (a) Dongguan; (b) Zhuhai; (c) Guangzhou; (d) Shenzhen; and (e) Huizhou.
Remotesensing 07 15863 g009
Table 2. Comparison of the average values within different buffer areas.
City0.5 km1 km1.5 km
OLSHSIVANUINUACIOLSHSIVANUINUACIOLSHSIVANUINUACI
Foshan0.53261.43530.36400.26690.47711.29400.32360.22970.44241.21200.29870.2087
Guangzhou0.40420.99530.24720.13640.34420.86800.20690.10370.31010.80820.18570.0886
Huizhou0.22570.57730.12200.04310.18160.51080.09570.02900.15410.47660.08040.0223
Dongguan0.82321.95500.52330.32240.78831.84010.49340.27990.75971.77240.47300.2566
Shenzhen0.75721.90560.43850.18230.70642.04890.41040.14520.66962.21560.39770.1294
Zhongshan0.64991.36830.39450.23010.60601.27390.36510.20420.57671.21670.34600.1889
Zhuhai0.33600.92720.20520.08700.30300.94360.19030.07420.27770.96430.17910.0659
City2 km2.5 km5 km
OLSHSIVANUINUACIOLSHSIVANUINUACIOLSHSIVANUINUACI
Foshan0.42291.16710.28460.19770.40831.13150.27390.18940.35711.01270.23710.1610
Guangzhou0.28650.76730.17130.07990.26930.73530.16060.07430.21690.63670.12780.0578
Huizhou0.13600.45630.07070.01880.12200.44080.06330.01630.08860.40630.04570.0109
Dongguan0.73601.72570.45780.24230.71541.68860.44530.23210.66241.58850.41360.2091
Shenzhen0.64272.32970.38940.11660.62422.41090.38570.10830.55802.39480.36290.0877
Zhongshan0.55431.18370.33260.17920.53621.16390.32240.17220.49041.11310.29580.1521
Zhuhai0.25480.98920.16810.05860.23601.01190.15860.05320.16691.05650.11750.0333
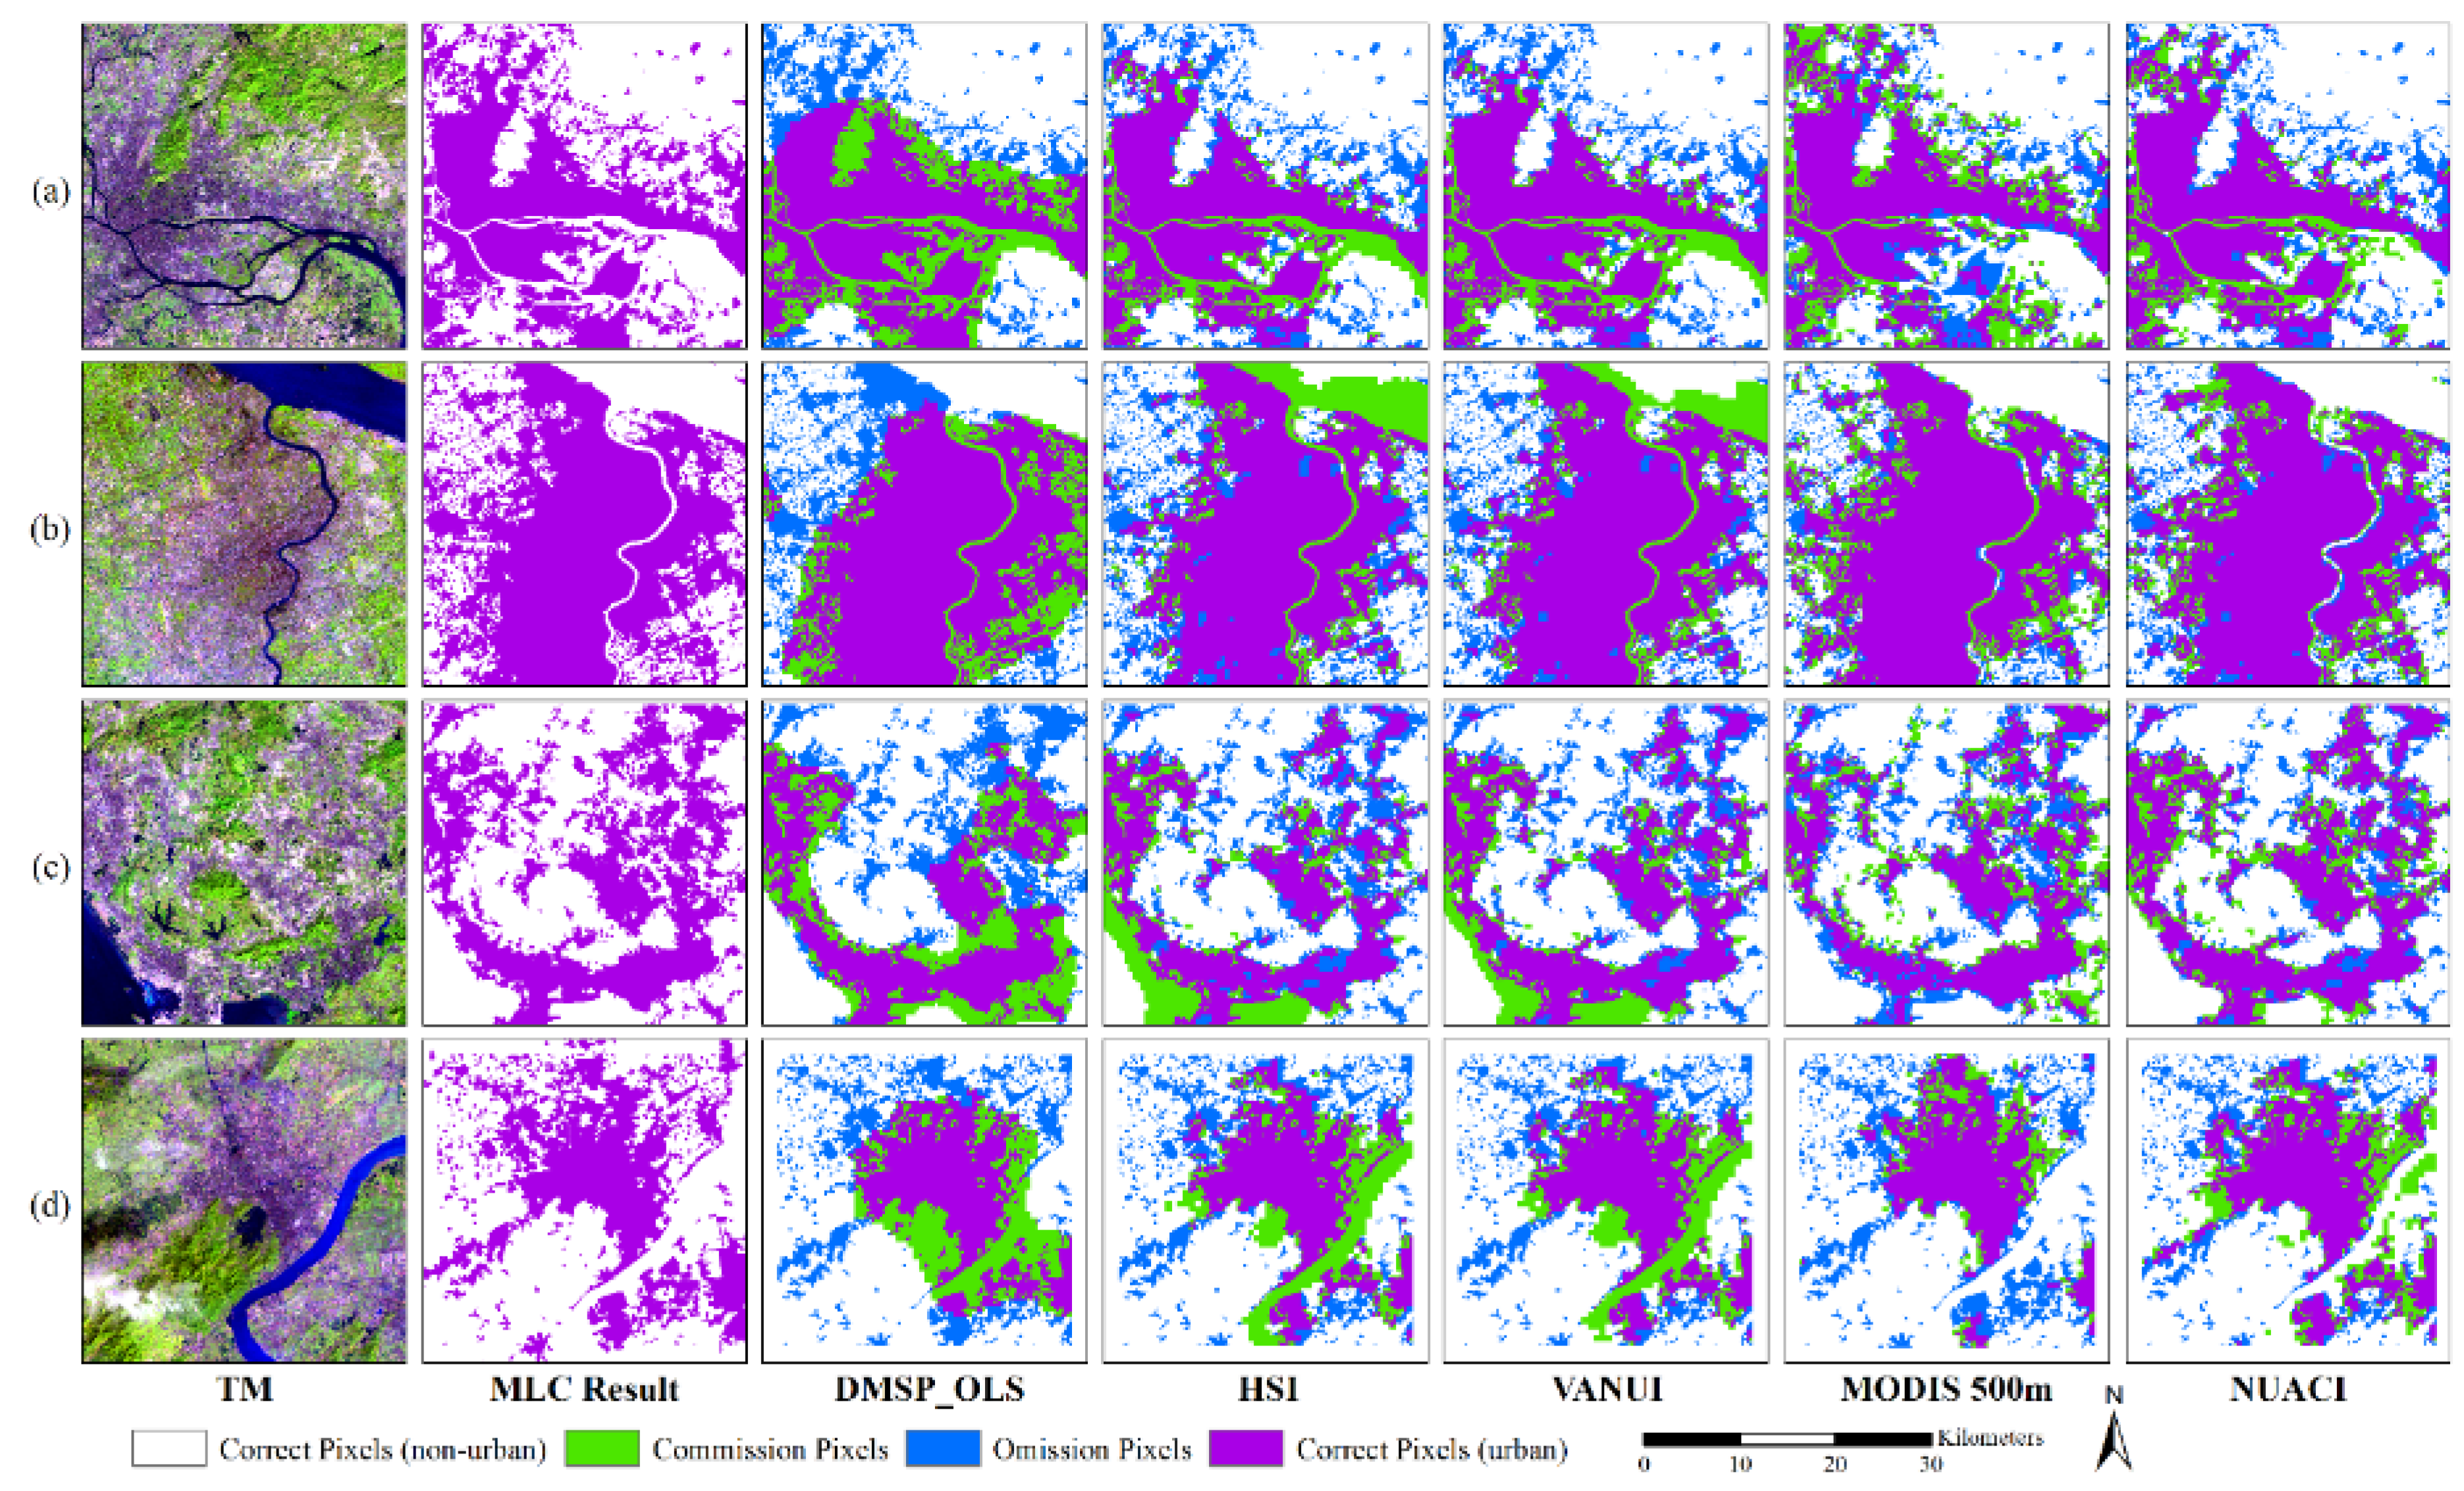
Additionally, urban indices such as HSI and VANUI have been directly applied to extract the extent of urban areas by using the threshold segmentation method. The accuracy of urban land extraction can reflect the efficiency on reducing the blooming effect. In this paper, we extracted urban areas using the proposed NUACI. We selected a total of eleven cities as samples. Urban areas obtained from normalized DMSP-OLS, HSI, and VANUI images were further evaluated to validate the efficiency of NUACI in eliminating the blooming effect. In addition, urban land extracted from the MODIS land-use products with a resolution of 500 m, which were generated using SVM methods [2], were also downloaded for comparison purposes. The total area of urban lands was derived from Landsat TM/ETM+ images using the MLC method and used as actual reference data. Corresponding equal areas of urban land for each sample city were retrieved from DMSP-OLS NTL data, MODIS land-use data, HSI image, VANUI image, and NUACI image, respectively. Quantitative indices including Kappa coefficient and overall accuracy were calculated by means of point-to-point comparison. The results were applied to measure the performance of deriving urban areas with these different combinations.
Figure 10, Figure 11 and 
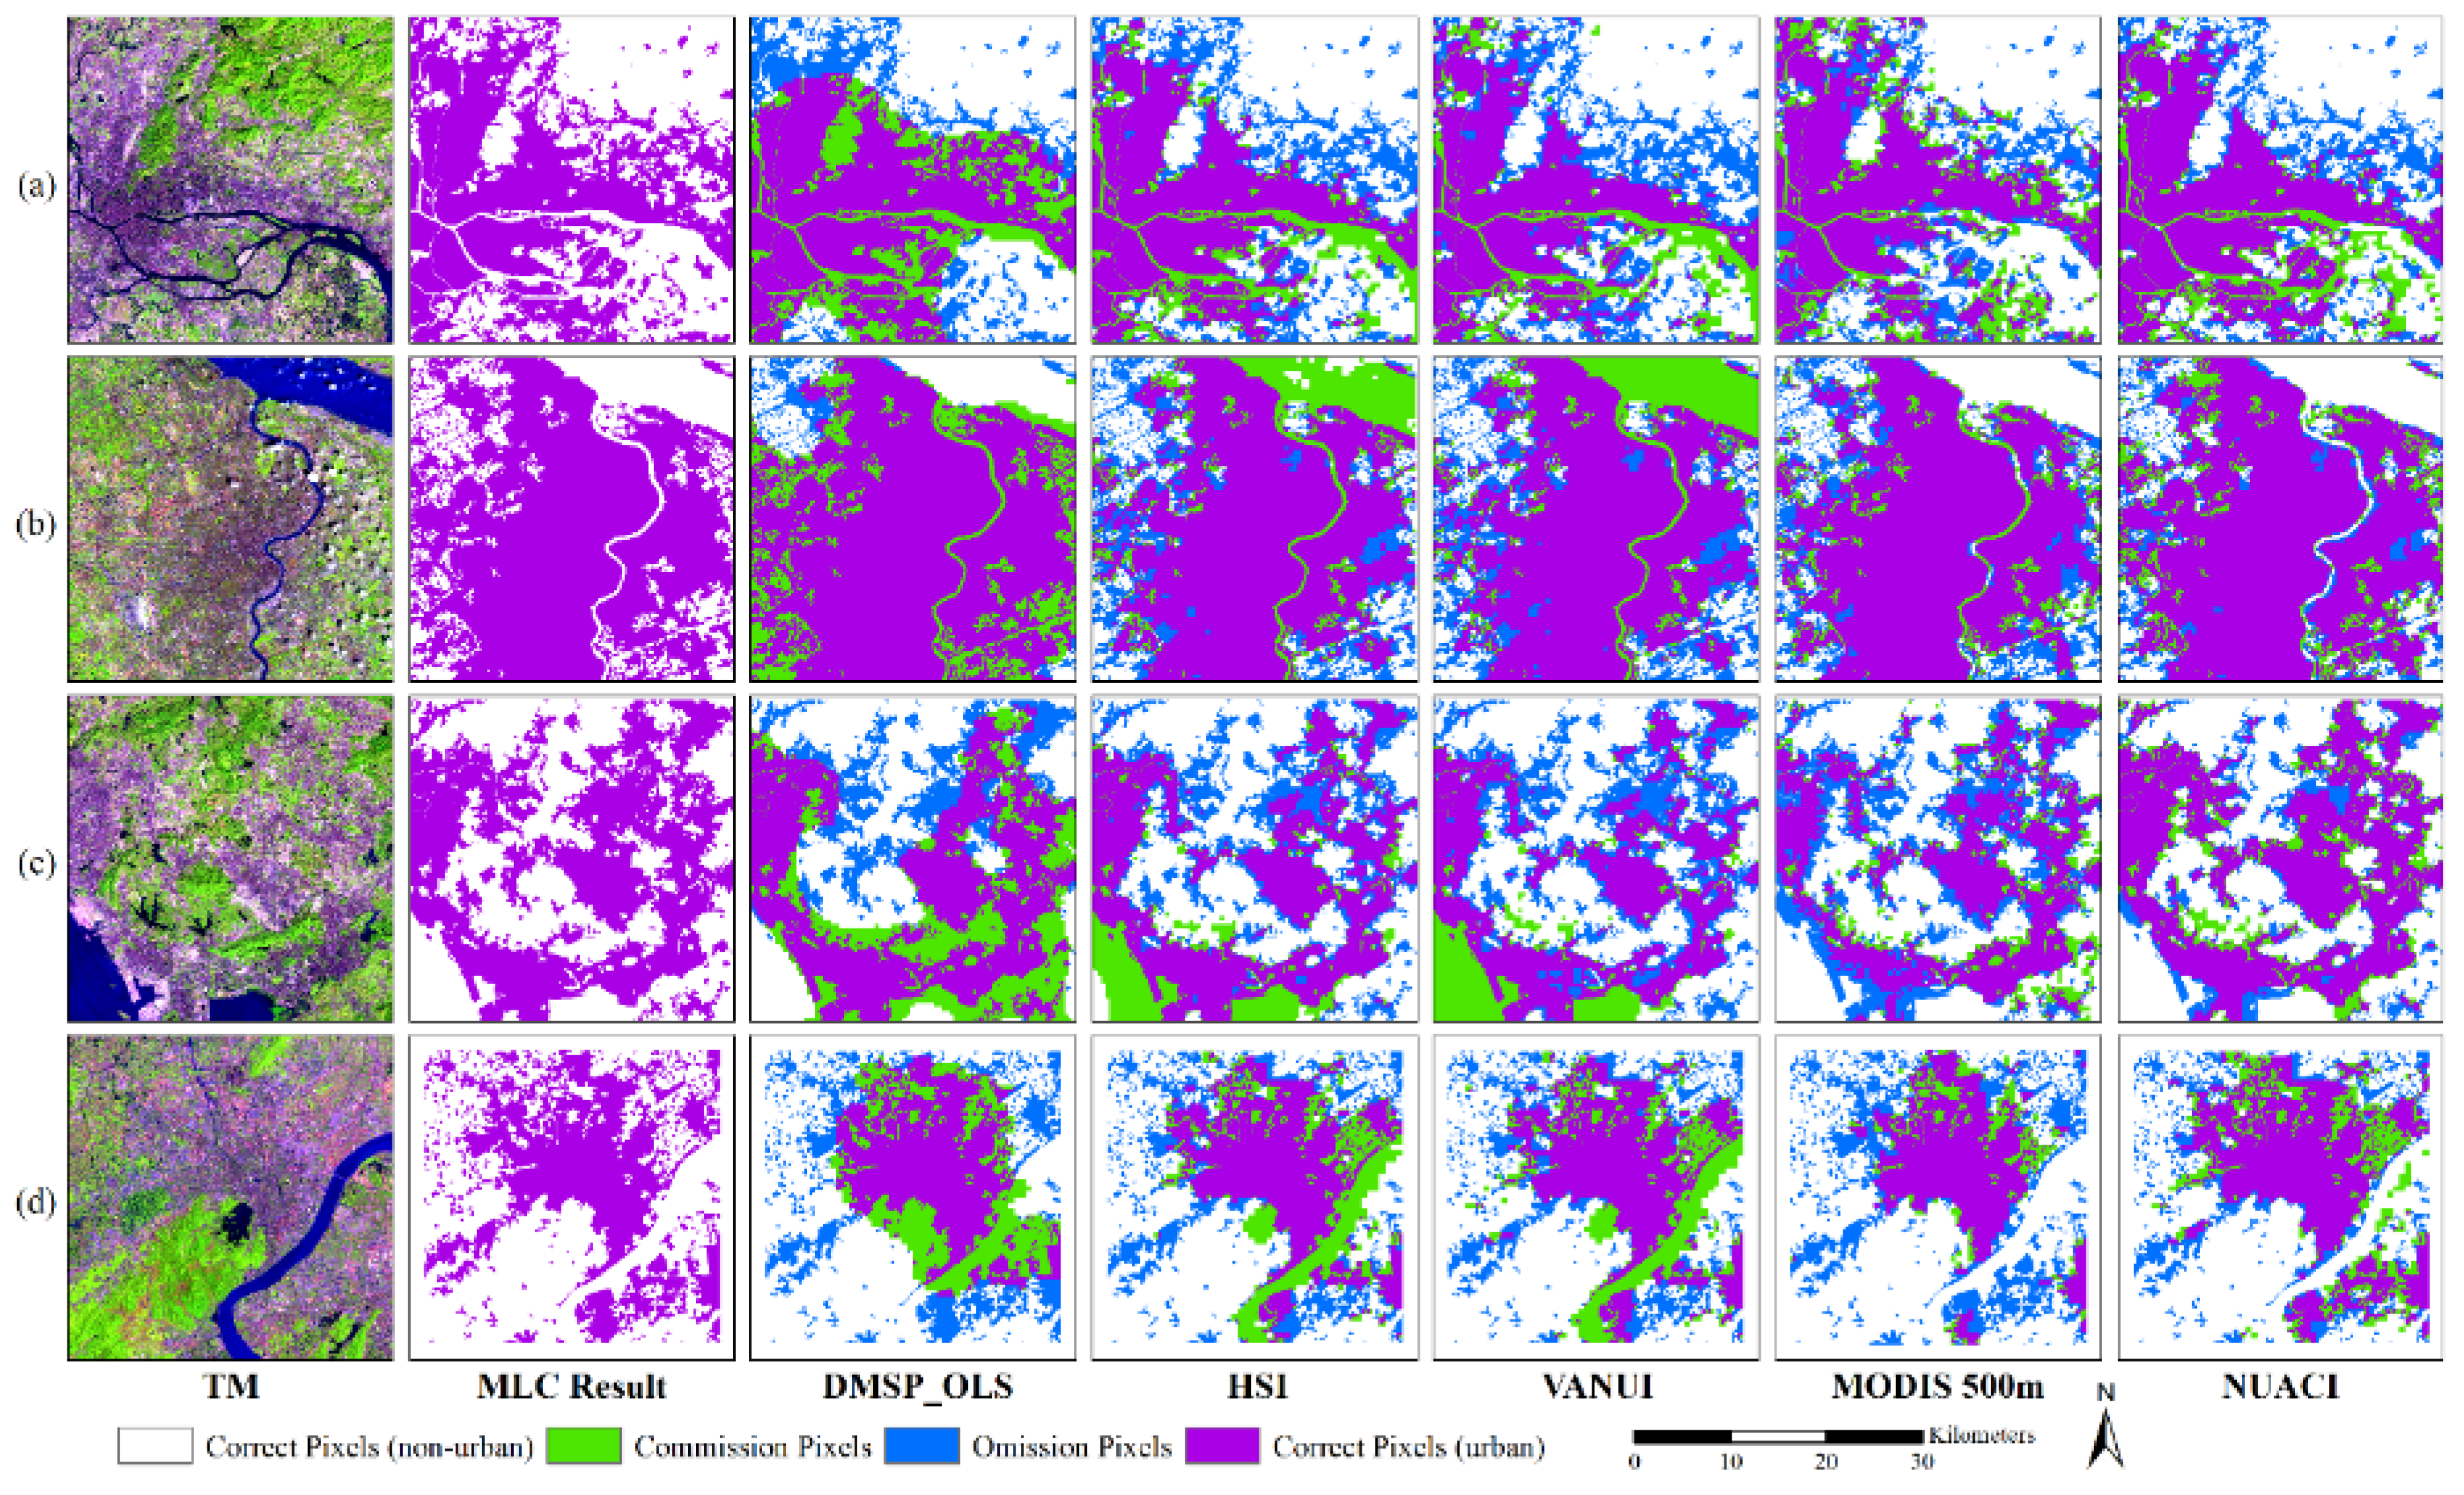
Figure 12 show the spatial distribution of classification accuracy, commission errors, and omission errors on urban areas derived from the different images from 2000, 2005, and 2010. All the results derived from NUACI exhibit lower commission and omission errors in all the sample areas. The spatial patterns are generally similar to those derived from MODIS land-use data. Within the time variation, the spatial patterns of urban lands obtained with NUACI method for the selected cities are more rational than those from MODIS land-use data. Higher commission errors (in green) generally presented in the urban areas extracted from DMSP-OLS NTL because of the blooming effect on the coastal area, rivers, vegetation covered lands, barren lands and water bodies. The results derived from HSI and VANUI can reduce the blooming effect on vegetation covered areas, which also reduces commission errors on vegetation covered lands. In addition, the blooming effect on coastal areas, rivers and large-scale water bodies are further efficiently reduced by using NUACI, although a few commission errors were distributed along small-scale rivers. The densities of omission pixels also decreased in the extracted urban areas when using the NUACI method. In addition, results derived from MODIS land-use data presented higher omission errors than those from NUACI in regions with low urban land densities. As shown in Table 3, Table 4 and Table 5, almost all the cities show the highest Kappa coefficients and overall accuracy of urban areas when extracted from NUACI compared with those from DMSP-OLS, HSI, VANUI, and the MODIS data.
Figure 10. Comparison of the results of extracting urban lands by the Threshold Segmentation Method in the year 2000: (a) Guangzhou; (b) Shanghai; (c) Shenzhen; and (d) Hangzhou.
Remotesensing 07 15863 g010
Figure 11. Comparison of the results of extracting urban lands by the Threshold Segmentation Method in the year 2005: (a) Guangzhou; (b) Shanghai; (c) Shenzhen; and (d) Hangzhou.
Remotesensing 07 15863 g011
Figure 12. Comparison of the results of extracting urban lands by the Threshold Segmentation Method in the year 2010: (a) Guangzhou; (b) Shanghai; (c) Shenzhen; and (d) Hangzhou.
Remotesensing 07 15863 g012
Table 3. Kappa and overall accuracy of extracting urban land in 2000.
NameUrban Area (KM2)KappaOverall Accuracy
DMSPHSIVANUIMODIS 500 mNUACIDMSPHSIVANUIMODIS 500 mNUACI
Beijing10470.55500.63290.62240.55670.63930.77950.81810.81290.78170.8213
Shanghai7600.54320.53760.44960.55490.62790.77200.76920.72530.78010.8143
Guangzhou5460.49350.46670.37860.44590.49160.80130.78510.73840.75170.8023
Shenzhen6060.44040.47630.29460.52450.59310.73670.76820.67090.79660.8344
Wuhan3230.50780.51890.35640.62020.60090.83830.84190.74880.86360.8689
Nanjing2570.46600.47780.39230.43690.55660.73960.74540.70370.73990.7838
Chongqing2040.54170.57010.51930.51880.57390.83960.84950.83180.82620.8508
Dalian2810.57120.46510.00810.62930.69390.88580.84910.40290.89860.9186
Hangzhou1740.36060.37280.35870.51040.45480.74270.74810.74230.80440.7808
Changsha1290.42290.43690.37820.46770.43980.77140.77690.75370.77860.7781
Xiamen1070.28080.1655−0.00900.30120.40700.83700.69670.39130.76690.8660
Table 4. Kappa and overall accuracy of extracting urban land in 2005.
NameUrban Area (km2)KappaOverall Accuracy
DMSPHSIVANUIMODIS 500 mNUACIDMSPHSIVANUIMODIS 500 mNUACI
Beijing12360.56100.59890.59940.50200.60580.79930.81680.81680.76250.8198
Shanghai8820.48160.45640.51030.59090.60310.75230.73990.76570.80800.8101
Guangzhou7990.45660.51340.52440.49340.54200.74210.76910.77430.75930.7828
Shenzhen8130.41500.42760.48410.46940.59790.72380.73000.75660.75590.8103
Wuhan4170.50300.51070.52710.59910.57910.80520.80830.81470.84440.8351
Nanjing3370.45010.41920.45320.28610.50010.72820.71300.72980.62320.7529
Chongqing2500.48170.53950.53420.49400.56090.79210.81510.81320.80420.8238
Dalian2960.56940.38490.50950.62900.65340.88040.82930.86390.89640.9039
Hangzhou2380.33690.39150.40030.46650.49030.68710.71270.71690.76180.7594
Changsha1700.41650.44060.44100.43170.45700.73180.74280.74300.74580.7503
Xiamen1660.32610.01880.14690.40070.48410.78350.68510.72600.78100.8345
Table 5. Kappa and overall accuracy of extracting urban land in 2010.
NameUrban Area (km2)KappaOverall Accuracy
DMSPHSIVANUIMODIS 500 mNUACIDMSPHSIVANUIMODIS 500 mNUACI
Beijing16750.47180.45870.39000.19440.48610.88520.88240.86740.64480.8717
Shanghai10170.44600.34540.28560.54480.58360.79460.72320.69800.79890.8241
Guangzhou9250.45300.41400.28790.47410.48200.72960.71030.64790.74320.7438
Shenzhen9690.42250.43190.28880.46900.65840.71020.71830.64730.74270.8306
Wuhan5810.44540.39180.26320.54540.49760.74070.71570.64680.80060.7651
Nanjing4070.32550.42400.36690.19180.56510.70110.74480.71950.52730.8073
Chongqing3350.46490.53140.54500.43540.55600.75010.78110.78750.75480.7926
Dalian3680.61690.45050.03660.62030.69140.86580.78430.41270.88370.8987
Hangzhou2560.33620.39040.38740.44460.50610.67780.70480.70330.74460.7608
Changsha2630.43350.44300.40260.32810.48850.72020.72500.70490.65110.7474
Xiamen2310.30150.0730-0.06360.43480.59640.71820.52200.37870.77350.8373

5.2. Estimation of ISA with NUACI

The quantitative and visual comparison validated incorporating EVI and NDWI to efficiently reduce the blooming effect and saturation limitation. NUACI has the ability to retrieve accurate urban information using the coarse resolution NTL data. In actuality, mapping the national urban fraction is more attractive and has increased interest in using the coarse resolution images. ISA has been considered as an important indicator for measuring the degree of urbanization. Numerous studies have shown that NTL data were positively correlated with ISA data [14,21,39]. A regression model was thus established with the NUACI for estimating the density of ISA for the whole of China. In the linear regression model, the aggregated ISA data derived from the retrieved thirty scenes of Landsat TM/ETM+ classification results were used as reference data (dependent variable), while NUACI was used as a single independent variable. ISA extracted from regression models based on normalized DMSP-OLS, VANUI and HSI were used in the comparison to evaluate the ability of NUACI to extract urban fractions. Correlation coefficients between the estimated ISA and the reference data were used to examine the performance of the regression models. In addition, the root-mean square error (RMSE), which is a quadratic scoring rule available to measure the average magnitude of the error, was used to perform an accuracy assessment. RMSE can be calculated as follows:
R M S E = ( 1 / N ) i = 1 N ( p i t i ) 2
where N is the number of samples, and pi and ti are the measured and estimated values, respectively.
Five thousand sample plots were randomly selected from the reference data. From those, 3000 samples were used as the training data to establish regression models corresponding to normalized DMSP-OLS, NUACI, VANUI and HSI, respectively. The remaining 2000 samples were used to calculate quantitative indices including the coefficient of determination (R2), the correlation coefficient (R) and RMSE for validating the regression models. The estimation and validation were performed using Matlab, a programming language developed by MathWorks [40]. Table 6 lists the regression models and the calculated evaluation indices. It shows that the R2 value of regression models based on DMSP-OLS, HSI, VANUI, and NUACI are 0.4459, 0.6888, 0.7822, and 0.8079, respectively. The regression models using VANUI or NUACI as the independent variable provide comparatively higher R2 values than those based on normalized DMSP-OLS or HSI. The NUACI-based regression model has the highest R2 value of 0.8079. This result implies that NUACI could be the most suitable method for estimating ISA. In contrast, the DMSP-OLS-based regression model has the lowest R2 value of 0.4459. The results for correlation coefficients (R) were similar to the R2 values. The NUACI-based regression model has the highest R value (0.8908), while the DMSP-OLS, HSI and VANUI based regression models had R values of 0.6680, 0.8241 and 0.8695, respectively. This implies that the NUACI-based regression model has the best performance for testing samples. Moreover, the RMSE of the NUACI-based regression model shows the lowest value of 0.1176. The scatterplots (
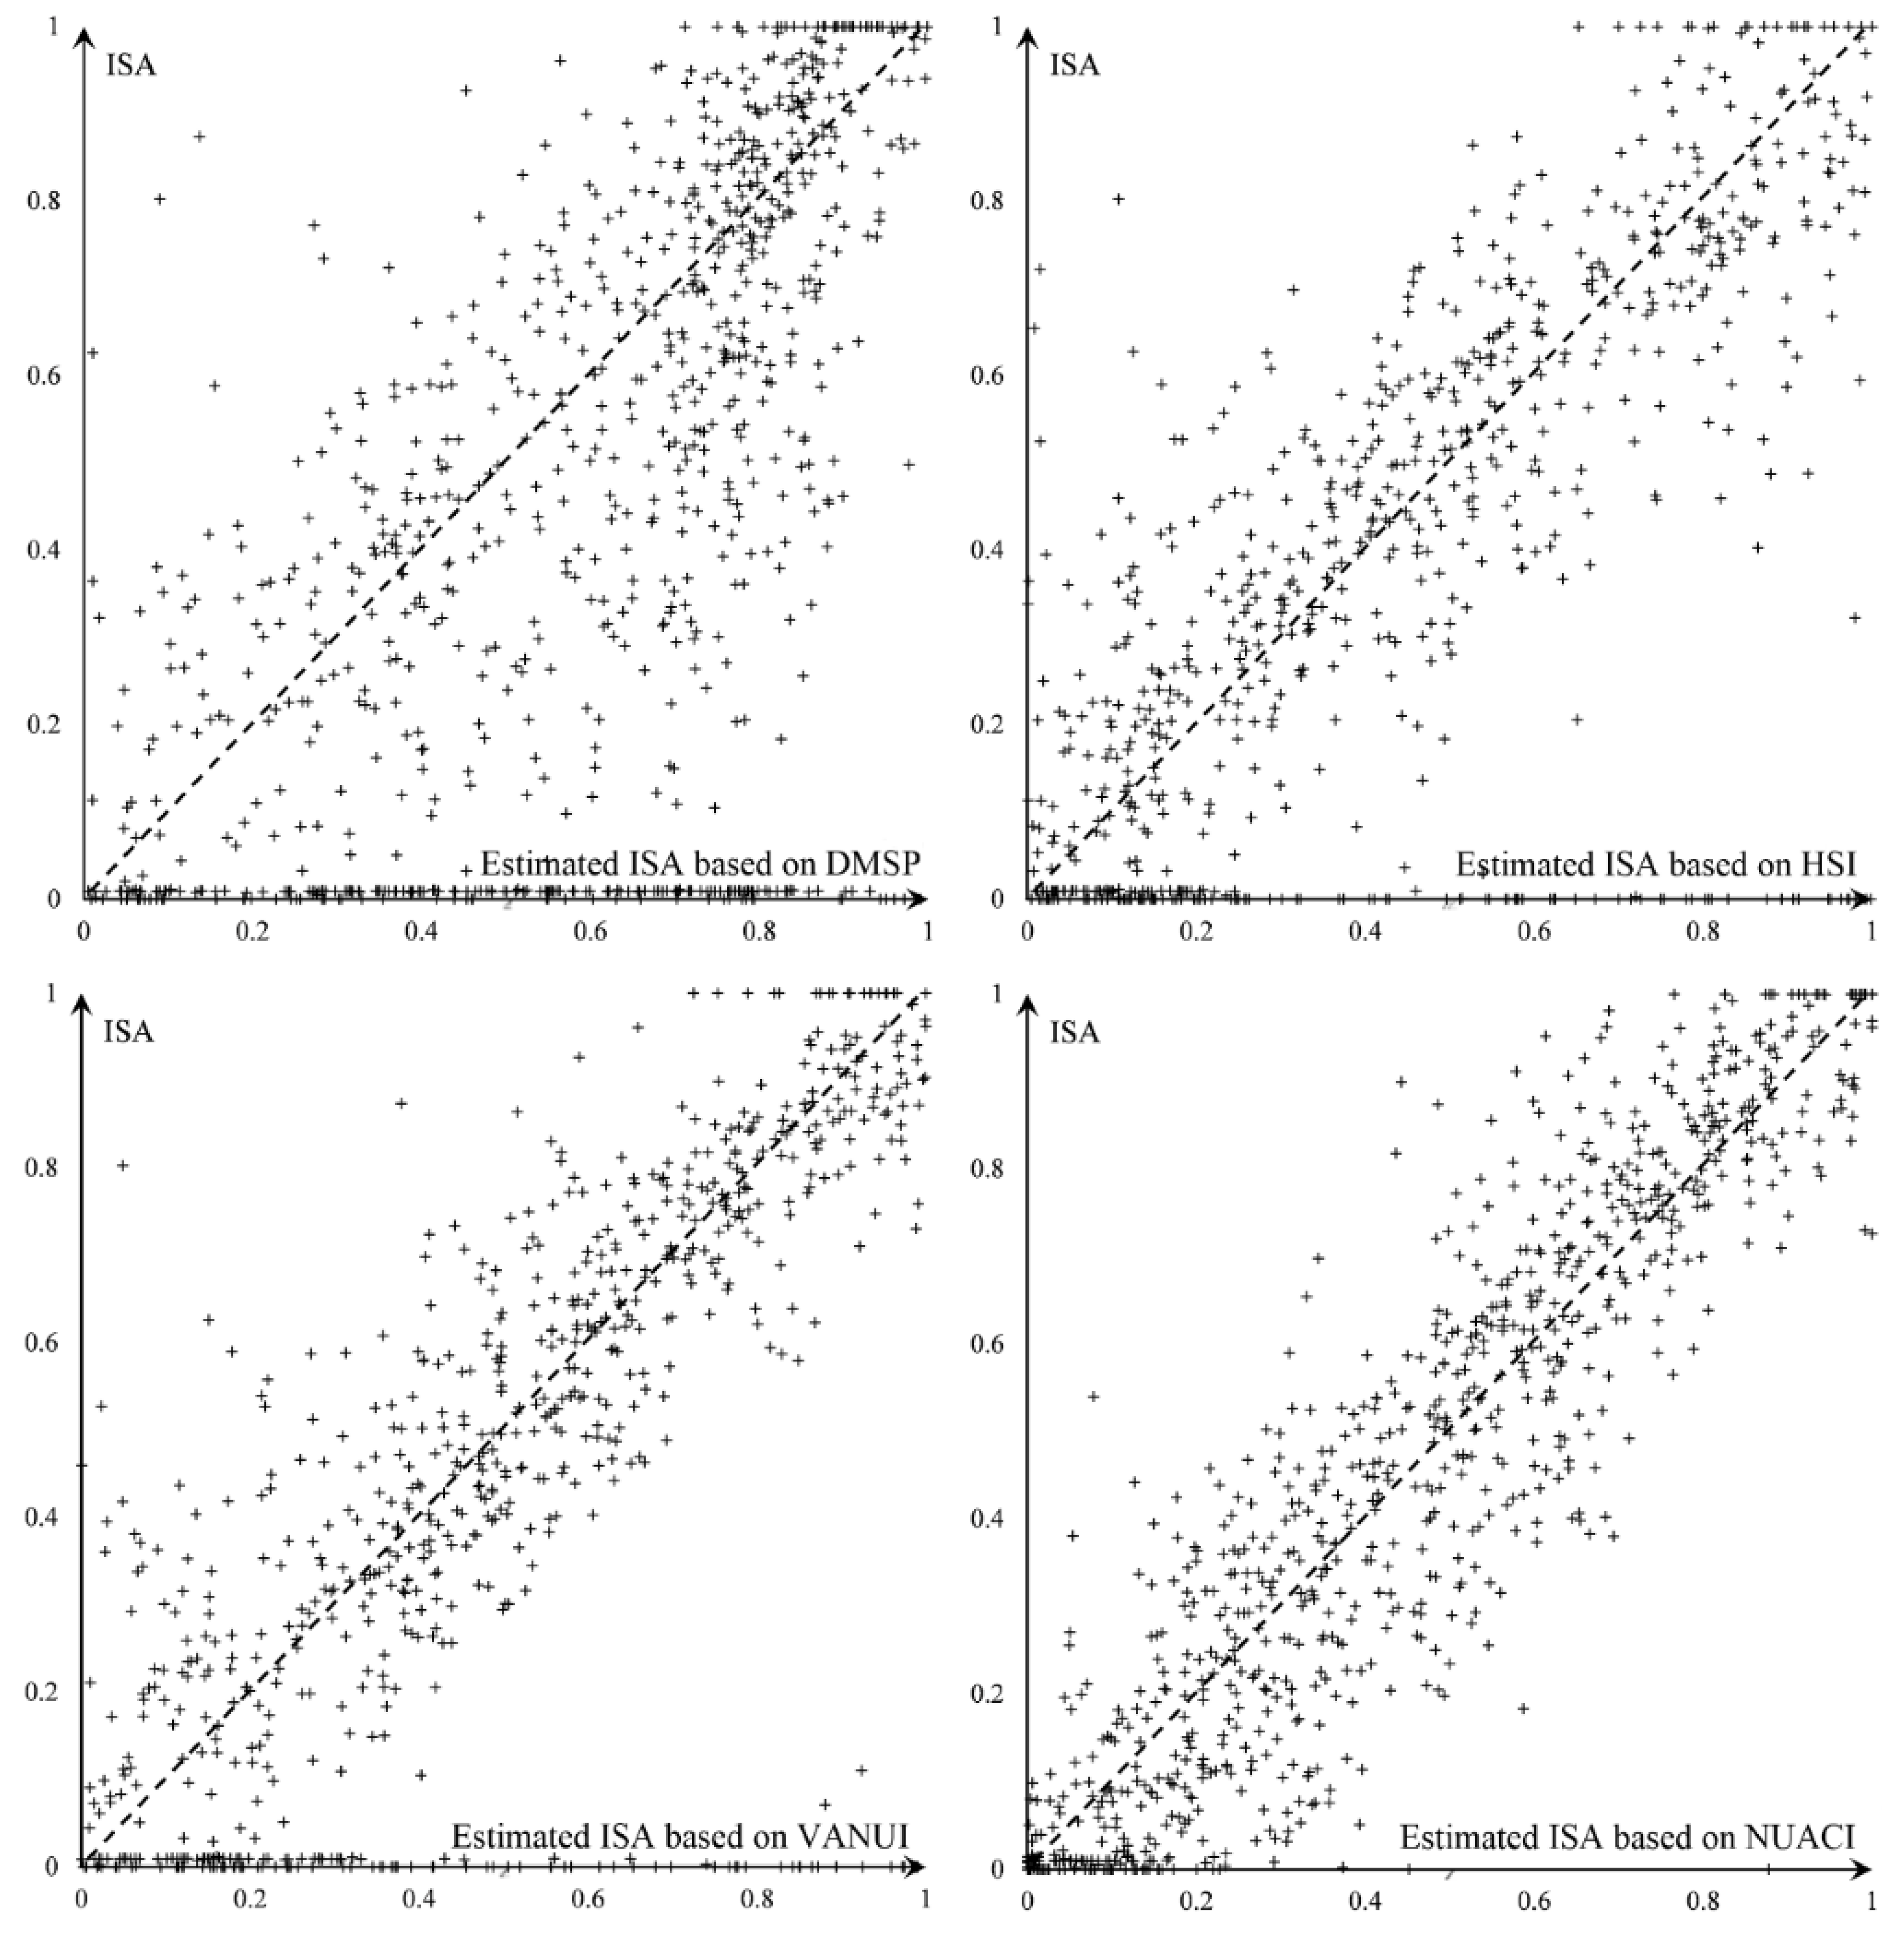
Figure 13) generated using the estimations and the reference data also demonstrate that there is higher correlation between ISA and NUACI or VANUI than between ISA and other urban indices. In addition, the three regression models other than the NUACI model are inclined to overestimate the fraction values for some pixels that have zero value (horizontal axis). This indicates that the NUACI-based regression model can successfully reduce the blooming effect and achieve better estimation accuracy of ISA than other models.
Table 6. Regression models based on different variables for estimating ISA.
Variable UsedRegression Model (y = ax + b)R2RRMSE
DMSPISA = 2.589DMSP − 0.1590.44590.66800.1667
HSIISA = 0.669HSI − 0.8250.68880.82410.1541
VANUIISA = 3.222VANUI − 1.3070.78220.86950.1458
NUACIISA = 1.701NUACI − 0.2610.80790.89080.1176
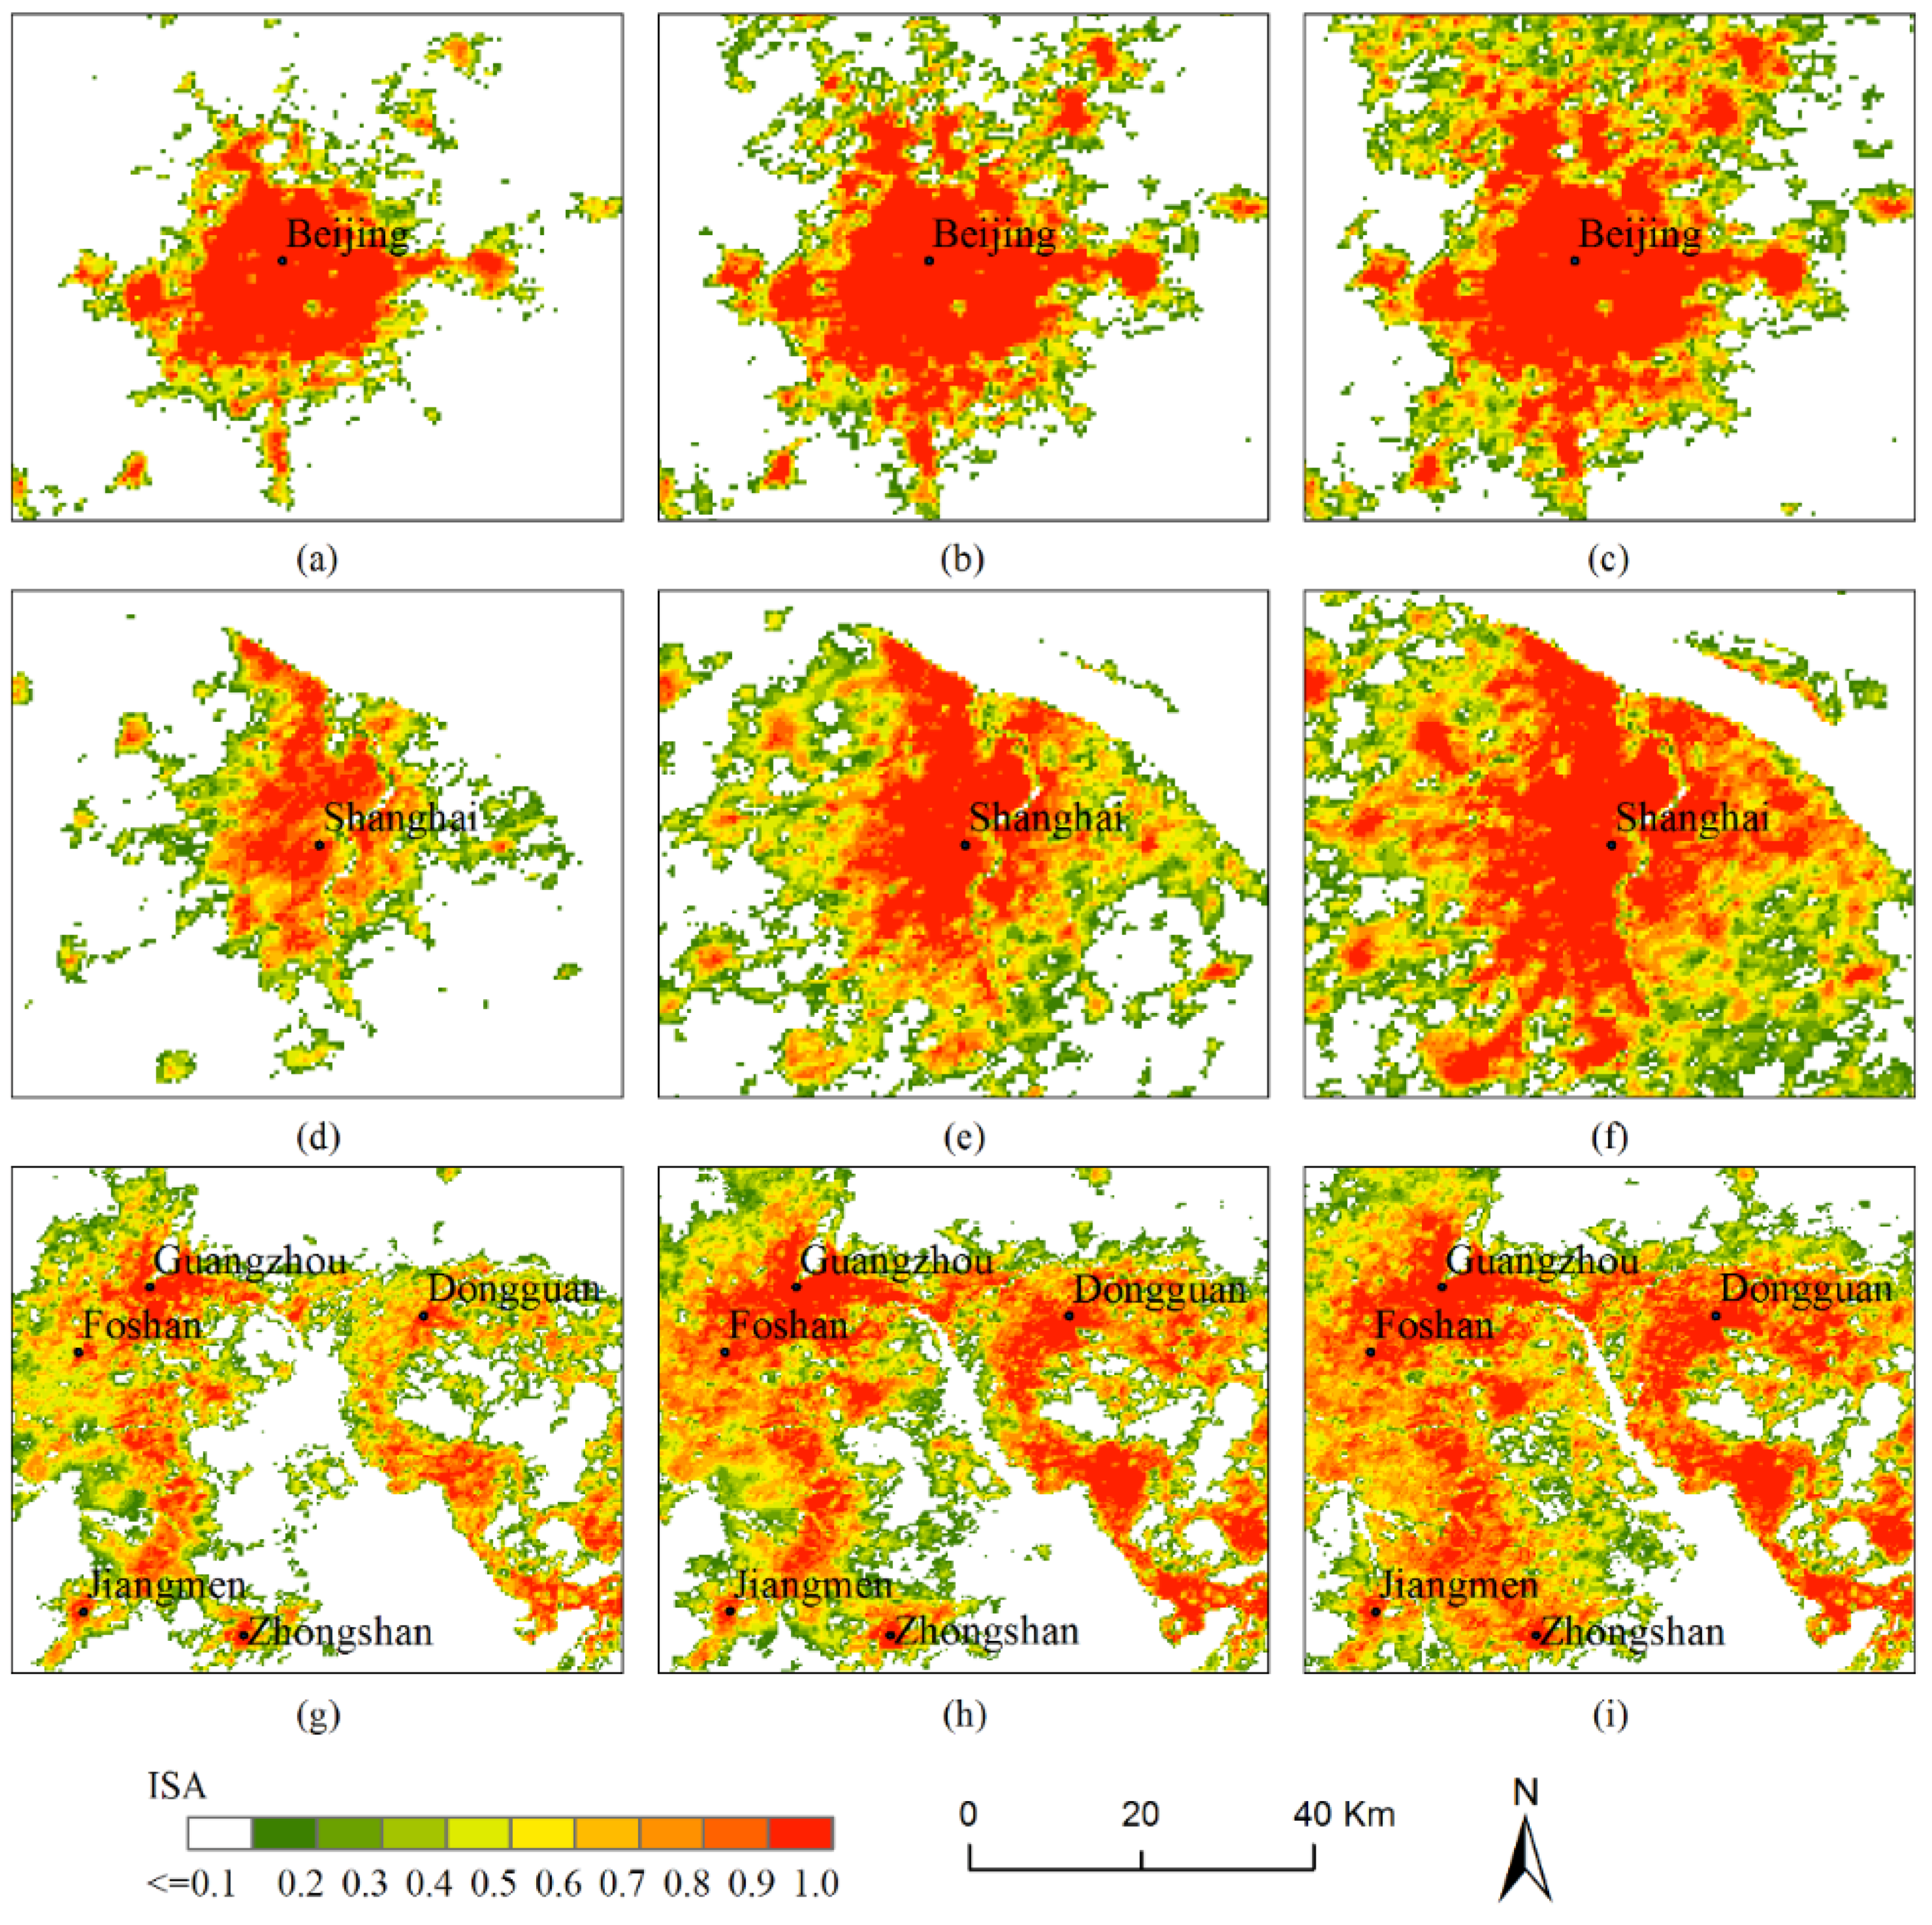
According to the comparison above, NUACI can perform efficiently for retrieving the ISA distribution in the sample area. Therefore, the NUACI-based regression models were applied to the estimation of ISA in 2000, 2005 and 2010 for the whole of China. As shown in Table 7, there are some variations in the parameters of regression models for different years. The regression model in 2005 has the highest estimation accuracy. Overall, a large proportion of ISA are distributed in the eastern regions, especially in the Pearl River Delta, Yangtze River Delta and Beijing-Tianjin-Tangshan metropolitan areas as shown in 
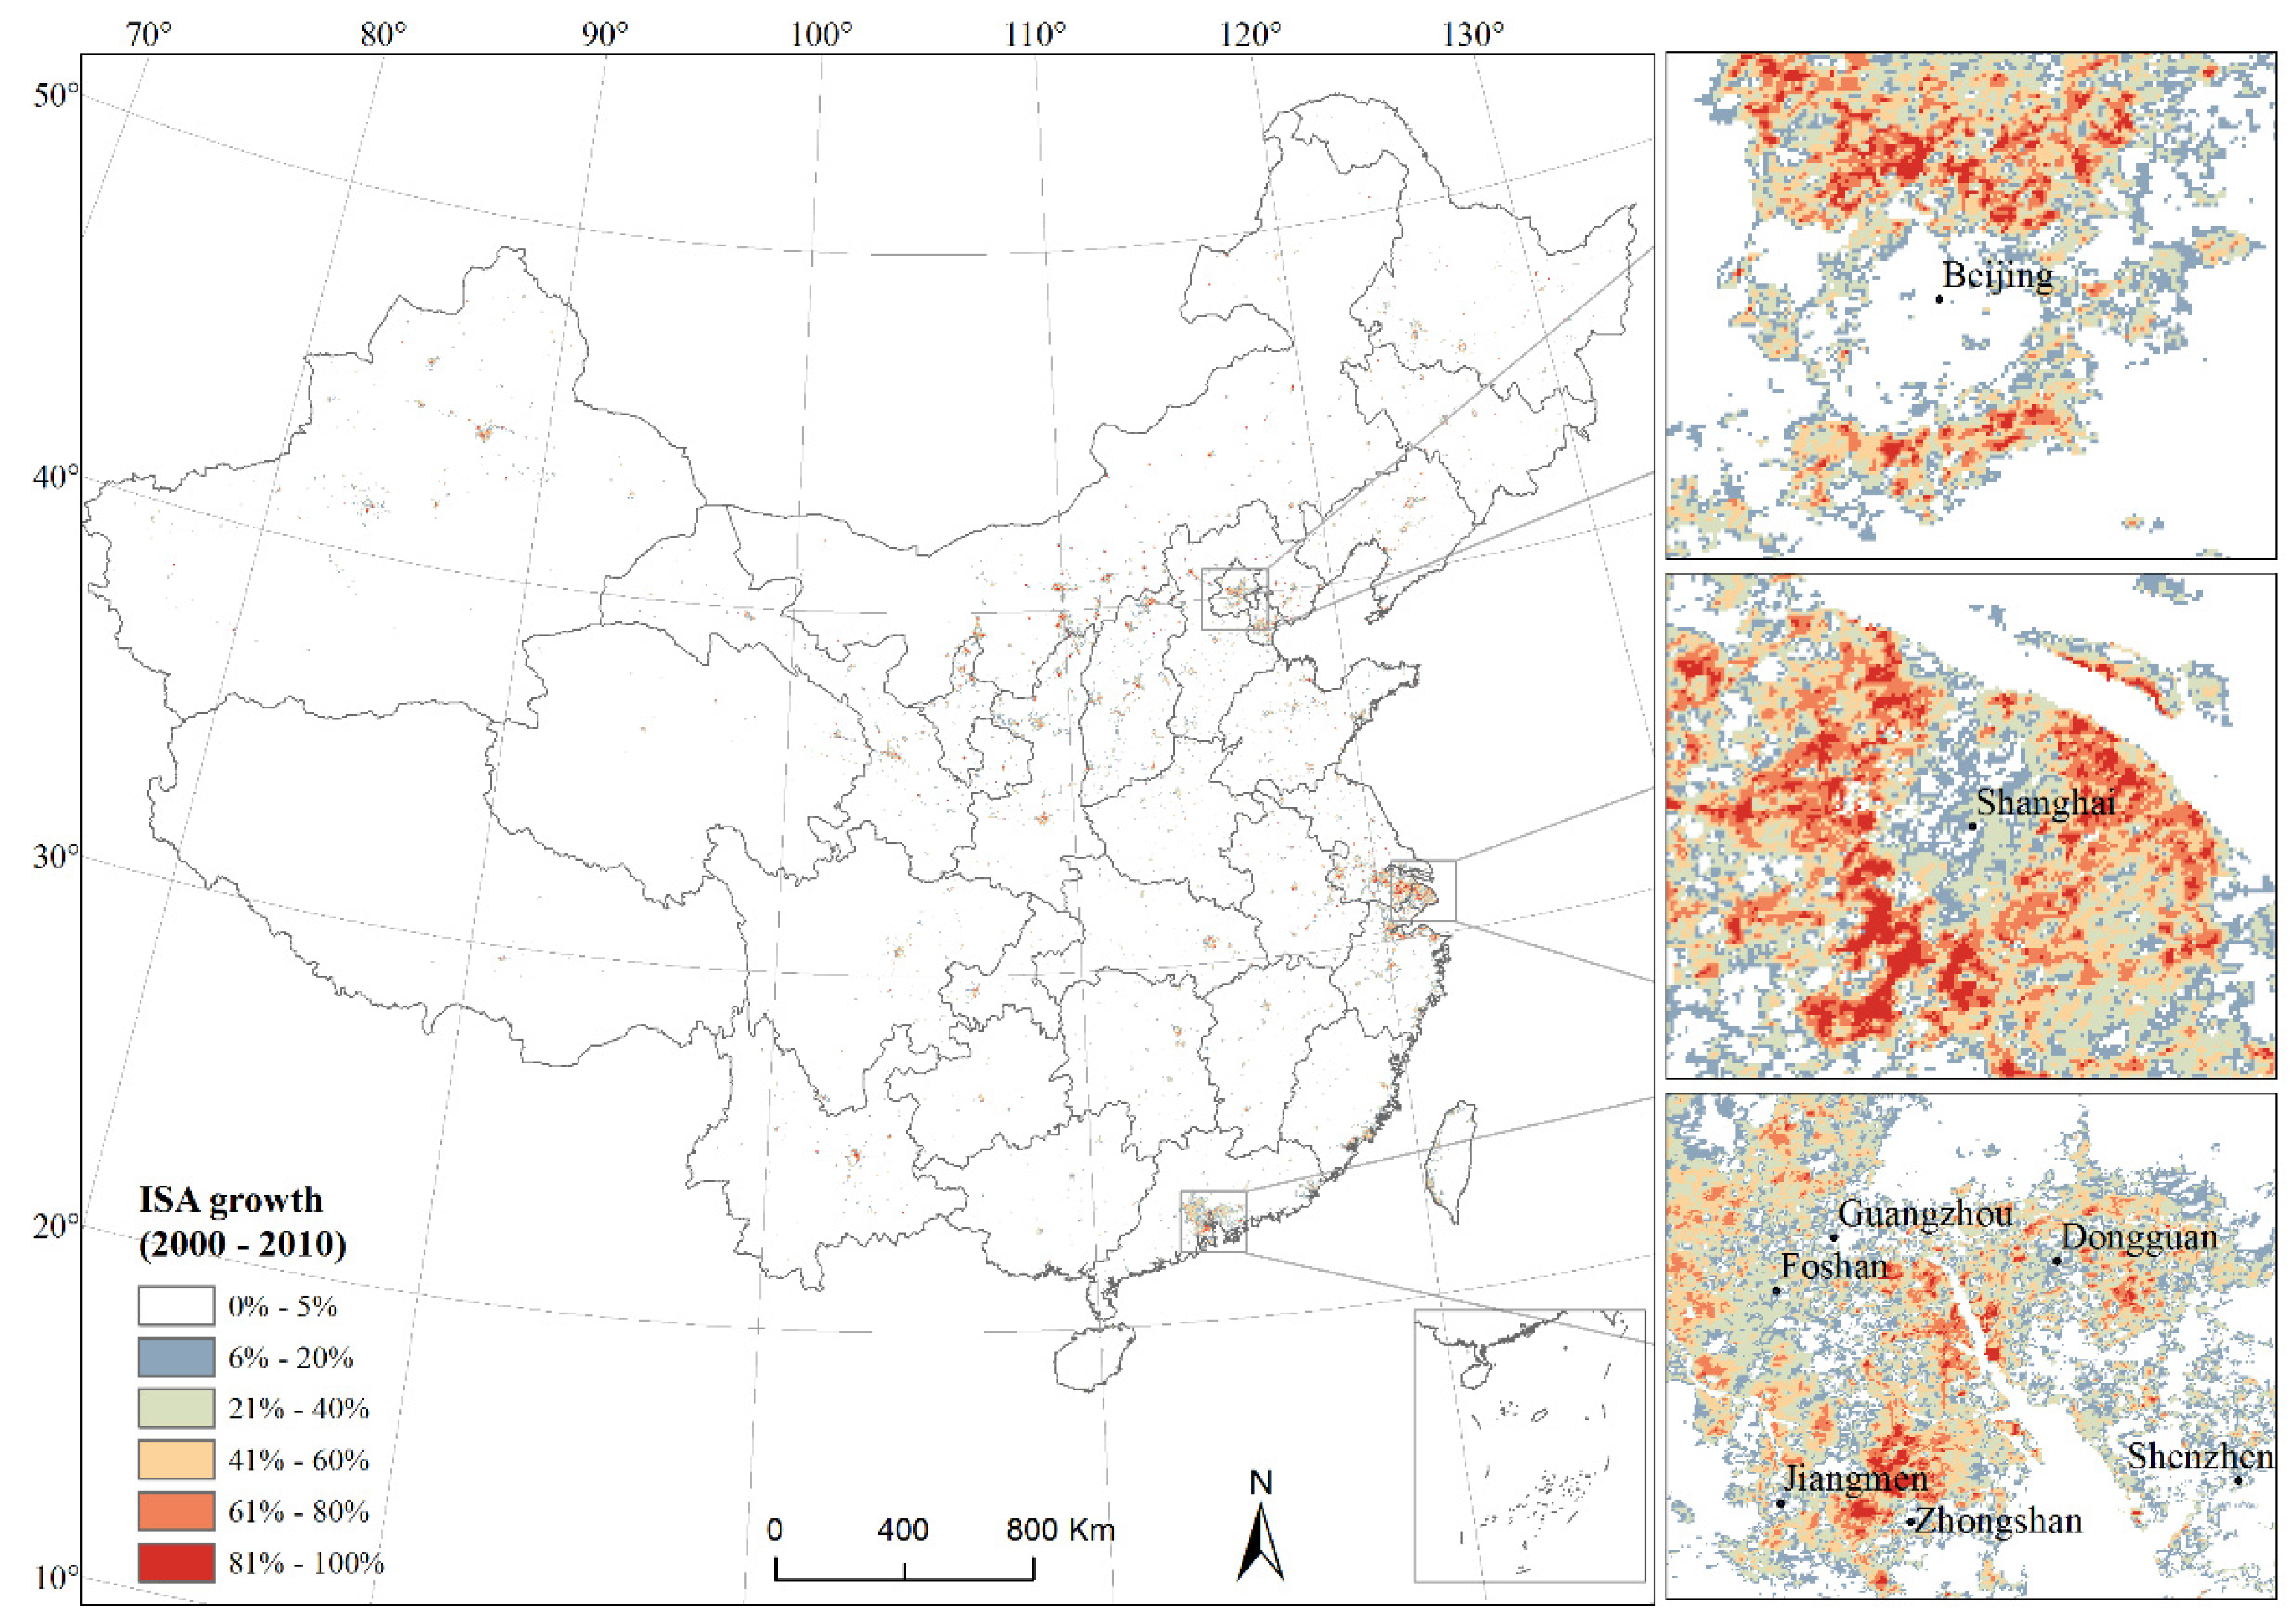
Figure 14. The ISA growth distributions from 2000 to 2010 are shown in Figure 15, which illustrates that the Pearl River Delta, Yangtze River Delta and Beijing-Tianjin-Tangshan metropolitan areas are the three major regions with high ISA growth rates. In particular, the highest ISA expansion rates occur in the Yangtze River Delta. Figure 15 also demonstrates that medium and small cities surrounding megacities have rapid ISA growth rates because of the radiation effect.
Figure 13. Comparison of the scatterplots between the estimated ISA and the reference data.
Remotesensing 07 15863 g013
Table 7. Regression models for estimating ISA based on NUACI in 2000, 2005 and 2010.
YearRegression Model (y = ax + b)R2RRMSE
2000ISA = 1.750*NUACI − 0.4300.79140.84130.1400
2005ISA = 1.701*NUACI − 0.2610.80790.89080.1176
2010ISA = 1.669*NUACI − 0.1210.78340.73820.1393
Figure 14. Estimated ISA of the three metropolitan areas in the years 2000, 2005 and 2010 using the NUACI-based regression model: (ac) ISA estimated for the Beijing-Tianjin-Tangshan metropolitan areas in 2000, 2005, and 2010; (df) ISA estimated for the Yangtze River Delta in 2000, 2005, and 2010; and (gi) ISA estimated for the Pearl River Delta in 2000, 2005, and 2010.
Remotesensing 07 15863 g014
Figure 15. The growth pattern of ISA from 2000 to 2010 in China.
Remotesensing 07 15863 g015

6. Conclusions

Variation in urban areas at large scales has been regarded as a major interface between socio-economic and environmental processes. Gathering accurate and timely information about urban dynamics at national and global scales is especially important for discussing environmental and ecological issues. This paper proposed a new index called NUACI for depicting urban characteristics. It is calculated by integrating DMSP-OLS, MODIS EVI, and NDWI. EVI and NDWI were incorporated into the DMSP-OLS data to extract urban dynamics because of their complementary characteristics among different land covers. DMSP-OLS, VANUI, HSI and NUACI were carried out by means of not only latitudinal transects sampling but also typical cities sampling analysis. The results indicated that NUACI yields the highest performance for reducing pixel saturation and eliminating the blooming effect. Accurate urban information with the highest Kappa coefficient values and best overall accuracy can also be retrieved from the NUACI images by selecting the same sample points across different years.
The NUACI-based regression model was then established to map ISA using the urban fraction derived from TM/ETM+ as reference data. The validation indicated that the NUACI-based regression model has the highest R2 value (0.8079), the highest R value (0.8908), and the lowest RMSE value (0.1176). The scatterplots generated with the estimations and the reference data also demonstrated that there is a higher correlation between ISA and NUACI than between ISA and other urban indices. Although there are some variations in the parameters of regression models for different years, the NUACI-based regression models in 2000, 2005, and 2010 also presented higher values for R2 and R as well as lower values for RMSE. The ISA results extracted from the NUACI-based regression models indicate that a large proportion of ISA are distributed in the eastern regions, especially in the Pearl River Delta, the Yangtze River Delta, and the Beijing-Tianjin-Tangshan metropolitan areas. The three metropolitan areas show the highest ISA expansion rates during the period from 2000 to 2010.
In summary, the NUACI index proposed in this paper, combining information from multi-source remotely sensed data, can obtain more detailed urban characteristics than single source data can do individually. Our assessments confirm that NUACI has the ability to reduce pixel saturation of NTL, eliminate the blooming effect and provide a more accurate ISA estimation. The NUACI index is easily interpreted and is simple to implement for mapping national urban fractions from only a few samples. Furthermore, the DMSP-OLS and MODIS data used in NUACI can be freely downloaded at the global scale, thus this index is capable of mapping ISA for any large area with limited effort and at low cost in a reasonable amount of time. Furthermore, NPP VIIRS images with newer-version NTL data, with a higher spatial resolution and a wider radiometric detection range will soon become an even more attractive data source for mapping urban areas. We expect that the proposed NUACI will be implemented with NPP VIIRS data to retrieve accurate and timely urban information of even higher resolution at the national and global scales.
We have published the ISA results for China for the years 2000, 2005 and 2010 on the Internet [41], which are available for download and free to use.

Acknowledgments

This study was financially supported by the National Science Fund for Excellent Young Scholars (Grant No. 41322009), and the National Natural Science Foundation of China (Grant No. 41171308 and 41531176).

Author Contributions

Xiaoping Liu proposed the idea of NUACI methods for mapping impervious surface area products and designed the structure of this manuscript. Guohua Hu carried out the experimental design and remote sensing data analyses. Bin Ai guided the research work related to show the characteristic of NUACI and wrote a substantial part of the manuscript. Xia Li provided suggestions on the precision evaluation in this study. Qian Shi helped revise the manuscript.

Conflicts of Interest

The authors declare no conflict of interest.

References

  1. United Nations. World Urbanization Prospects: The 2009 Revision; Population Division of the Department of Economic and Social Affairs of the United Nations Secretariat: New York, NY, USA, 2010. [Google Scholar]
  2. Schneider, A.; Friedl, M.A.; Potere, D. A new map of global urban extent from MODIS satellite data. Environ. Res. Lett. 2009, 4, 44003. [Google Scholar] [CrossRef]
  3. Shepherd, J.M.; Pierce, H.; Negri, A.J. Rainfall modification by major urban areas: Observations from spaceborne rain radar on the TRMM satellite. J. Appl. Meteorol. 2002, 41, 689–701. [Google Scholar] [CrossRef]
  4. Seto, K.C.; Woodcock, C.E.; Song, C.; Huang, X.; Lu, J.; Kaufmann, R.K. Monitoring land-use change in the Pearl River Delta using Landsat TM. Int. J. Remote Sens. 2002, 23, 1985–2004. [Google Scholar] [CrossRef]
  5. Liu, X.; Li, X.; Tan, Z.; Chen, Y. Zoning farmland protection under spatial constraints by integrating remote sensing, GIS and artificial immune systems. Int. J. Geogr. Inf. Sci. 2011, 25, 1829–1848. [Google Scholar] [CrossRef]
  6. Liu, X.; Lao, C.; Li, X.; Liu, Y.; Chen, Y. An integrated approach of remote sensing, GIS and swarm intelligence for zoning protected ecological areas. Landsc. Ecol. 2012, 27, 447–463. [Google Scholar] [CrossRef]
  7. Oleson, K.W.; Vertenstein, M.; Grimmond, C.; Bonan, G.B.; Feddema, J. An urban parameterization for a global climate model. Part I: Formulation and evaluation for two cities. J. Appl. Meteorol. Climatol. 2008, 47, 1038–1060. [Google Scholar] [CrossRef]
  8. Liu, Z.; He, C.; Zhang, Q.; Huang, Q.; Yang, Y. Extracting the dynamics of urban expansion in China using DMSP-OLS nighttime light data from 1992 to 2008. Landsc. Urban Plan. 2012, 106, 62–72. [Google Scholar]
  9. Yang, Y.; He, C.; Zhang, Q.; Han, L.; Du, S. Timely and accurate national-scale mapping of urban land in China using Defense Meteorological Satellite Programʼs Operational Linescan System nighttime stable light data. J. Appl. Remote Sens. 2013, 7, 073535. [Google Scholar] [CrossRef]
  10. Henderson, M.; Yeh, E.T.; Gong, P.; Elvidge, C.; Baugh, K. Validation of urban boundaries derived from global night-time satellite imagery. Int. J. Remote Sens. 2003, 24, 595–609. [Google Scholar] [CrossRef]
  11. Li, X.; Yeh, A. Principal component analysis of stacked multi-temporal images for the monitoring of rapid urban expansion in the Pearl River Delta. Int. J. Remote Sens. 1998, 19, 1501–1518. [Google Scholar] [CrossRef]
  12. Lu, D.; Weng, Q. Use of impervious surface in urban land-use classification. Remote Sens. Environ. 2006, 102, 146–160. [Google Scholar] [CrossRef]
  13. Ma, T.; Zhou, C.; Pei, T.; Haynie, S.; Fan, J. Quantitative estimation of urbanization dynamics using time series of DMSP/OLS nighttime light data: A comparative case study from Chinaʼs cities. Remote Sens. Environ. 2012, 124, 99–107. [Google Scholar] [CrossRef]
  14. Lu, D.; Tian, H.; Zhou, G.; Ge, H. Regional mapping of human settlements in southeastern China with multisensor remotely sensed data. Remote Sens. Environ. 2008, 112, 3668–3679. [Google Scholar] [CrossRef]
  15. Elvidge, C.D.; Imhoff, M.L.; Baugh, K.E.; Hobson, V.R.; Nelson, I.; Safran, J.; Dietz, J.B.; Tuttle, B.T. Night-time lights of the world: 1994–1995. ISPRS J. Photogram. Remote Sens. 2001, 56, 81–99. [Google Scholar] [CrossRef]
  16. Imhoff, M.L.; Lawrence, W.T.; Stutzer, D.C.; Elvidge, C.D. A technique for using composite DMSP/OLS “city lights” satellite data to map urban area. Remote Sens. Environ. 1997, 61, 361–370. [Google Scholar] [CrossRef]
  17. Lo, C.P. Urban indicators of China from radiance-calibrated digital DMSP-OLS nighttime images. Ann. Assoc. Am. Geogr. 2002, 92, 225–240. [Google Scholar] [CrossRef]
  18. Milesi, C.; Elvidge, C.D.; Nemani, R.R.; Running, S.W. Assessing the environmental impacts of human settlements using satellite data. Manag. Environ. Qual. An Int. J. 2003, 14, 99–107. [Google Scholar] [CrossRef]
  19. Gallo, K.P.; Elvidge, C.D.; Yang, L.; Reed, B.C. Trends in night-time city lights and vegetation indices associated with urbanization within the conterminous USA. Int. J. Remote Sens. 2004, 25, 2003–2007. [Google Scholar] [CrossRef]
  20. Zhang, Q.; Seto, K.C. Mapping urbanization dynamics at regional and global scales using multi-temporal DMSP/OLS nighttime light data. Remote Sens. Environ. 2011, 115, 2320–2329. [Google Scholar] [CrossRef]
  21. Zhang, Q.; Schaaf, C.; Seto, K.C. The Vegetation Adjusted NTL Urban Index: A new approach to reduce saturation and increase variation in nighttime luminosity. Remote Sens. Environ. 2013, 129, 32–41. [Google Scholar] [CrossRef]
  22. Pandey, B.; Joshi, P.K.; Seto, K.C. Monitoring urbanization dynamics in India using DMSP/OLS night time lights and SPOT-VGT data. Int. J. Appl. Earth Observ. Geoinf. 2013, 23, 49–61. [Google Scholar] [CrossRef]
  23. Elvidge, C.D.; Baugh, K.E.; Dietz, J.B.; Bland, T.; Sutton, P.C.; Kroehl, H.W. Radiance calibration of DMSP-OLS low-light imaging data of human settlements. Remote Sens. Environ. 1999, 68, 77–88. [Google Scholar] [CrossRef]
  24. Small, C.; Pozzi, F.; Elvidge, C.D. Spatial analysis of global urban extent from DMSP-OLS night lights. Remote Sens. Environ. 2005, 96, 277–291. [Google Scholar] [CrossRef]
  25. Cao, X.; Chen, J.; Imura, H.; Higashi, O. A SVM-based method to extract urban areas from DMSP-OLS and SPOT VGT data. Remote Sens. Environ. 2009, 113, 2205–2209. [Google Scholar] [CrossRef]
  26. Lawrence, W.T.; Imhoff, M.L.; Kerle, N.; Stutzer, D. Quantifying urban land use and impact on soils in Egypt using diurnal satellite imagery of the Earth surface. Int. J. Remote Sens. 2002, 23, 3921–3937. [Google Scholar] [CrossRef]
  27. Elvidge, C.D.; Tuttle, B.T.; Sutton, P.C.; Baugh, K.E.; Howard, A.T.; Milesi, C.; Bhaduri, B.L.; Nemani, R. Global distribution and density of constructed impervious surfaces. Sensors 2007, 7, 1962–1979. [Google Scholar] [CrossRef]
  28. Pozzi, F.; Small, C. Analysis of urban land cover and population density in the United States. Photogram. Eng. Remote Sens. 2005, 71, 719–726. [Google Scholar] [CrossRef]
  29. Weng, Q.; Lu, D.; Schubring, J. Estimation of land surface temperature—Vegetation abundance relationship for urban heat island studies. Remote Sens. Environ. 2004, 89, 467–483. [Google Scholar] [CrossRef]
  30. McFeeters, S.K. The use of the Normalized Difference Water Index (NDWI) in the delineation of open water features. Int. J. Remote Sens. 1996, 17, 1425–1432. [Google Scholar] [CrossRef]
  31. Elvidge, C.D.; Baugh, K.E.; Kihn, E.A.; Kroehl, H.W.; Davis, E.R. Mapping city lights with nighttime data from the DMSP Operational Linescan System. Photogram. Eng. Remote Sens. 1997, 63, 727–734. [Google Scholar]
  32. Lo, C.P. Modeling the population of China using DMSP operational linescan system nighttime data. Photogram. Eng. Remote Sens. 2001, 67, 1037–1047. [Google Scholar]
  33. Sutton, P.C.; Elvidge, C.D.; Ghosh, T. Estimation of gross domestic product at sub-national scales using nighttime satellite imagery. Int. J. Ecol. Econ. Stat. 2007, 8, 5–21. [Google Scholar]
  34. Oda, T.; Maksyutov, S. A very high-resolution global fossil fuel CO2 emission inventory derived using a point source database and satellite observations of nighttime lights, 1980–2007. Atmos. Chem. Phys. 2010, 10, 16307–16344. [Google Scholar] [CrossRef]
  35. Amaral, S.; Câmara, G.; Monteiro, A.M.V.; Quintanilha, J.A.; Elvidge, C.D. Estimating population and energy consumption in Brazilian Amazonia using DMSP night-time satellite data. Comput. Environ. Urban Syst. 2005, 29, 179–195. [Google Scholar] [CrossRef]
  36. Ziskin, D.; Baugh, K.; Feng, C.H.; Ghosh, T.; Elvidge, C. Methods used for the 2006 radiance lights. Proc. Asia-Pac. Adv. Netw. 2010, 30, 131–142. [Google Scholar] [CrossRef]
  37. Weng, Q.; Lu, D.; Liang, B. Urban surface biophysical descriptors and land surface temperature variations. Photogram. Eng. Remote Sens. 2006, 72, 1275–1286. [Google Scholar] [CrossRef]
  38. Bauer, M.E.; Heinert, N.J.; Doyle, J.K.; Yuan, F. Impervious surface mapping and change monitoring using Landsat remote sensing. In Proceedings of the ASPRS 2004 Annual Conference on Mountains of Data Peak Decisions, Denver, CO, USA, 23–28 May 2004.
  39. Elvidge, C.D.; Cinzano, P.; Pettit, D.R.; Arvesen, J.; Sutton, P.; Small, C.; Nemani, R.; Longcore, T.; Rich, C.; Safran, J.; et al. The Nightsat mission concept. Int. J. Remote Sens. 2007, 28, 2645–2670. [Google Scholar] [CrossRef]
  40. Chapman, S. MATLAB Programming for Engineers; Cengage Learning Inc.: Toronto, OA, Canada, 2007. [Google Scholar]
  41. ISA for China for the Years 2000, 2005 and 2010. Available online: http://www.geosimulation.cn/ISA-China.htm (accessed on 14 August 2015).

