Article

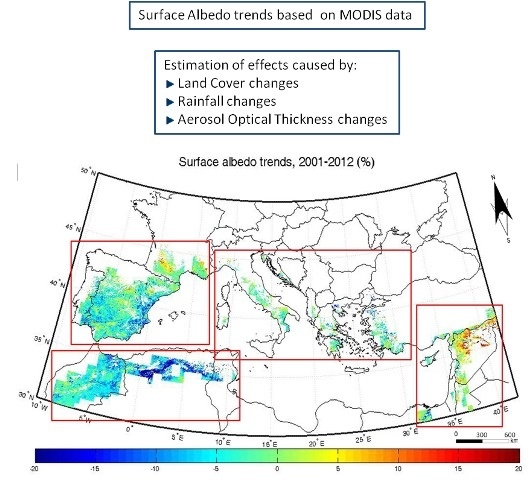
Estimation of the Land Surface Albedo Changes in the Broader Mediterranean Area, Based on 12 Years of Satellite Observations

by
Nikolaos Benas
* and
Nektarios Chrysoulakis
Foundation for Research and Technology–Hellas, Institute of Applied and Computational Mathematics, N. Plastira 100, Vassilika Vouton, 70013 Heraklion, Greece
*
Author to whom correspondence should be addressed.
Remote Sens. 2015, 7(12), 16150-16163; https://doi.org/10.3390/rs71215816
Submission received: 15 September 2015 / Revised: 17 November 2015 / Accepted: 24 November 2015 / Published: 2 December 2015

Abstract

:
The Land Surface Albedo (LSA) was estimated in the broader Mediterranean area, on an 8-day basis, for the period 2001–2012. MODIS (Moderate Resolution Imaging Spectroradiometer) albedo product parameters, at 1 km × 1 km spatial resolution, were used. LSA changes during the above study period were also estimated, based on annual average values. Results revealed increasing LSA trends dominating in the Levant region and decreasing in NW Africa, of the order of 3.3% and −6.6%, respectively, while mixed signs were observed in southern Europe. Three factors that can determine the LSA changes were investigated: land cover changes, rainfall changes and Aerosol Optical Thickness (AOT) spatio-temporal variability. The analysis made clear that land cover and rainfall changes affect LSA at local and regional scales, while the effect of AOT was not important. Land cover changes revealed deforestation hot spots, where LSA was increased by 13%–14%, while an increase in rainfall over many areas in NW Africa appears to have caused a corresponding decrease in LSA by over 5%. These findings highlight the importance of a global and continuous LSA monitoring at both regional and local scales, which is necessary for both climate monitoring and modeling studies.

Graphical Abstract

1. Introduction

The Land Surface Albedo (LSA), defined as the ratio of up-welling to down-welling radiation fluxes in a given wavelength or spectral interval [1], is a highly important environmental variable, primarily due to its effects on atmospheric radiation. By determining the amounts of radiation absorbed and reflected by the Earth’s surface, LSA controls the energy budget distribution in the Earth-atmosphere system, thus affecting significantly the global climate [2]. Hence, measuring the LSA regularly and globally is a prerequisite condition in climate monitoring and change studies. In many cases, LSA measurements are used for improving constraining conditions in climate simulations, in both global and local scales [3].
LSA variations and changes can be caused by a variety of factors, which can act either independently or in combination. These factors include both natural phenomena, which usually cause seasonal variations in LSA, e.g., through snowfall and seasonal vegetation growth patterns, and processes of human origin, leading to either seasonal or long-term LSA changes (e.g., through agricultural activities and urbanization). LSA variation factors also include abrupt changes, such as forest fires [4]. By definition, LSA is not characterized by surface properties only, depending also on the atmospheric conditions [1]. Specifically, the incident radiation at the Earth’s surface, along with its angular distribution, which determine LSA, depend on the atmospheric conditions, namely the presence and properties of atmospheric aerosols, which act as scattering agents. Hence, LSA changes could also be caused by changes in atmospheric conditions. This complexity in LSA changes and their causes highlight the importance of their continuous monitoring in both space and time, which, on a global scale, can only be achieved using satellite remote sensing approaches.
In the present study, the LSA and its changes were estimated based on satellite-derived parameters, over the broader Mediterranean area for a 12-year period (2001–2012). The study area, comprising southern Europe, the Levant and northern Africa, was selected based on both its dense human population and activities, and its climatic vulnerability. In fact, previous studies have already revealed changing patterns in key climatic variables, including precipitation and temperature extremes (decreasing and increasing trends are reported, respectively, in [5,6,7]). Furthermore, desertification trends are foreseen by future climatic scenarios [7].
Several LSA products have been created and are still being produced, based on satellite-derived data (see e.g., [3,8,9]). Among them, the albedo product of the Moderate Resolution Imaging Spectroradiometer (MODIS) sensor, on board NASA’s Terra and Aqua platforms, includes parameters (described in Section 2.1) for the computation of LSA on an 8-day temporal scale and a variety of spatial scales, which range from 0.5 km × 0.5 km to 5 km × 5 km, respectively [10]. This data set was used here for the LSA estimation and its changes over the study area at 1 km × 1 km spatial resolution. The MODIS LSA product has been thoroughly validated ([11,12,13]), while the time period covered allows the study of long-term LSA changes over specific areas of interest.
In addition to the LSA and corresponding changes estimation, three separate factors that may affect LSA changes were also examined and their effects assessed at regional scale. These factors include land cover changes which occurred during the period examined, soil moisture changes, which were examined through corresponding changes in rainfall, and Aerosol Optical Thickness (AOT) changes, which can affect LSA through their effect on the fraction of diffuse radiation in the LSA estimation (Section 2.1).
In the next section, the MODIS albedo product parameters used in this study are described, along with the methodology for the estimation of LSA and the corresponding annual average values and changes. Results, including average LSA, LSA changes and the effects of land cover, rainfall and AOT changes are presented in Section 3.

2. Data and Methodology

2.1. Surface Albedo Estimation

The evaluation of LSA was based on albedo model parameters available from the MODIS combined (from Terra and Aqua satellites) Collection 5 Bidirectional Reflectance Distribution Function (BRDF) product (product code: MCD43B1), on an 8-day and 1 km × 1 km temporal and spatial resolution, respectively. These parameters are derived from multi-angular reflectance observations, through the inversion of a BRDF model, after atmospheric correction and cloud screening, as explained in [10,14]. The algorithm makes use of a kernel-driven, linear BRDF model, whereby kernel weights are derived from a best fitting procedure to observational data. For each 1 km × 1 km pixel, these weights are included in the MCD43B1 product at seven wavelengths in the visible, near- and shortwave infrared, and three broader spectral regions. Using these weights, and after applying the corresponding quality flags (available in MCD43B2 product), the directional-hemispherical surface reflectance (black-sky albedo, BSA) and the bi-hemispherical surface reflectance (white-sky albedo, WSA) were computed in the present study on a pixel basis and for the broadband (0.25–4.0 μm) case, which encompasses the full solar range, while the LSA was estimated using a linear relationship of BSA and WSA, depending on the AOT and the fraction of diffuse radiation (S), as explained in [1,10]. For the LSA computation, AOT data came from the MODIS Level 3 product; among other parameters, this product includes AOT at 550 nm, on an 8-day average basis that temporally coincides with the LSA, and at 1° × 1° spatial resolution. This AOT product, provided separately from Terra and Aqua satellites, is based on the corresponding MODIS Level 2 product, available at 10 km × 10 km spatial resolution, which has been thoroughly validated in the past [15]. In the present study, the average AOT was computed from Terra and Aqua MODIS data, and linear interpolation was used for the estimation of AOT at the LSA spatial resolution. Since BSA and S also depend on solar zenith angle, computations (at pixel level) were first performed at four solar zenith angles spanning the day (namely at 9:00, 12:00. 15:00 and 18:00 local time), and then averaged for the estimation of the final LSA.

2.2. Estimation of the Annual Average Surface Albedo

Estimation of the annual average LSA on a pixel basis was based on the corresponding 8-day average values. While in the ideal case all 8-day values present in a year (approx. 46) will be used in the averaging process, temporal gaps are frequent in the time series. These gaps are caused by failure of the MODIS retrieval algorithm to meet specific predefined quality criteria, and in the majority of cases should be attributed to missing algorithm input data due to the presence of clouds, which is more frequent in higher latitudes of the study area and during winter months. Hence, for the creation of spatially unbiased annual average LSA maps, a procedure based on several threshold criteria was developed, which is described in detail in [16]. According to this method, for the computation of the annual average LSA in a pixel, thresholds are applied in both the total number of present 8-day values in the year and the number of daily measurements used for the estimation of each 8-day average. Furthermore, the distribution of present 8-day values throughout the year is also checked, to avoid biases towards summer, when clear sky conditions prevail and measurements are more frequent. When all the defined criteria are met, the annual average LSA is estimated using the smoothing spline technique, which is the most efficient for this purpose, in cases of datasets with seasonal variations and temporal gaps, as was shown by [17].

2.3. Estimation of Surface Albedo Changes

Annual average LSA values, calculated as described in the previous section, were used for the estimation of corresponding pixel-level LSA changes during the study period (2001–2012). A linear regression approach was used for this purpose, and LSA changes are reported in percent, estimated from the linear fit equation, namely its initial (2001) and final (2012) values. Statistical significance of LSA changes at the 95% confidence interval was also assessed, based on the slope of the linear regression equation; if this confidence interval does not include zero, the trend is considered statistically significant. In order to ensure the spatial homogeneity of the results in terms of the period of estimated changes, at least 10 annual average LSA values were required, including the first and last years of the time series [16].
For the analysis of land cover changes and the corresponding effects on LSA, the European Space Agency Climate Change Initiative (ESA CCI, [18]) land cover product was used [19,20]. Three land cover products have been released in the framework of ESA CCI, for the 2000, 2005 and 2010 epochs. The 2000 and 2010 products were used here, as the initial and final land cover states, respectively. These maps were produced at 300 m × 300 m spatial resolution, using 5-year periods data (1998–2002 for 2000 and 2008–2012 for 2010). The land cover classification comprises 22 land-cover types (including water bodies) defined by the United Nations Land Cover Classification System. The different spatial resolutions of land cover types and LSA leads to nine pixels of the former corresponding to one pixel of the latter. Hence, to upscale the 300 m × 300 m land cover data pixels to the LSA spatial resolution, the land cover type occurring in most of the nine land cover pixels was used for the corresponding LSA pixel.
Soil moisture is expected to significantly affect the LSA. Moist soil reflects less solar radiation compared to dry soil, hence an increase in soil moisture at a specific location, is expected to lead to a respective decrease in LSA. In fact, there is a consensus of an exponential relationship between LSA and soil moisture (see [21] and references therein). Satellite-derived soil moisture data is available from the ESA Soil Moisture and Ocean Salinity (SMOS) mission. However, since SMOS was launched in 2009, these data cover only a small percentage of the study period. Hence, rainfall data were used here, as a proxy to soil moisture and the corresponding effects on LSA.
Rainfall observations are derived from the Tropical Rainfall Measuring Mission (TRMM), a joint NASA and JAXA (Japan Aerospace Exploration Agency) satellite mission, designed to monitor and study tropical rainfall. A complete description of TRMM instruments and algorithms is given in [22]. Although the mission was operational during the entire study period (2001–2012), TRMM rainfall measurements span the area between 40°N and 40°S latitudes, therefore it partially covers the study area. Level 3 data of surface rain rates from the TRMM Microwave Imager (TMI) were used here, available on a monthly mean basis and at 0.5° × 0.5° spatial resolution (product code: 3A12). This product has been validated in the past, in regions included in the study area [23,24]. These rainfall data come with a quality flag which can obtain three values, 0, 1 and 2, with the zero value corresponding to the highest confidence in rain retrieval. In the present analysis, at least 90% of the pixels used for the computation of the 0.5° × 0.5° spatial resolution pixels were required to fulfilled the highest confidence criterion.
Based on these monthly mean values, and after applying the above mentioned quality criterion, annual average values of surface rain rates were computed on a pixel level, and the corresponding 12-year changes were estimated, in line with the approach that was implemented in the case of LSA. Specifically, at least 10 (out of 12) monthly values were required for the estimation of the annual average, and 10 annual average values, including the first and last years of the time series, were required for the computation of rainfall rate trends. This computation was based on a linear regression approach, and results are reported as the differences (in mm∙hr−1) between the initial (2001) and final (2002) values of the linear regression equation. For the evaluation of the effects of surface rain changes on LSA, spatial averages of 1 km × 1 km LSA changes were computed, in order to coincide with the rainfall rates spatial resolution.
Changes in AOT could influence the LSA through corresponding changes in the fraction of diffuse skylight, which is a function of AOT. For the evaluation of the AOT effect on LSA, a sensitivity analysis test was performed. Specifically, AOT trends during the study period were first estimated using the same linear regression methodology and thresholds applied in the case of LSA, and their statistical significance was assessed based on the slope of the linear regression equation. Then, the year 2012 was selected, and the LSA was recomputed on an 8-day basis, after decreasing the AOT 8-day values by 20%, which is a typical value of the AOT decreasing trend across southern Europe (Section 3.4). The calculated 8-day LSA was then used for the estimation of the 2012 annual average, which was compared against the original 2012 annual average LSA, in order to assess the effect of AOT change in LSA.

3. Results

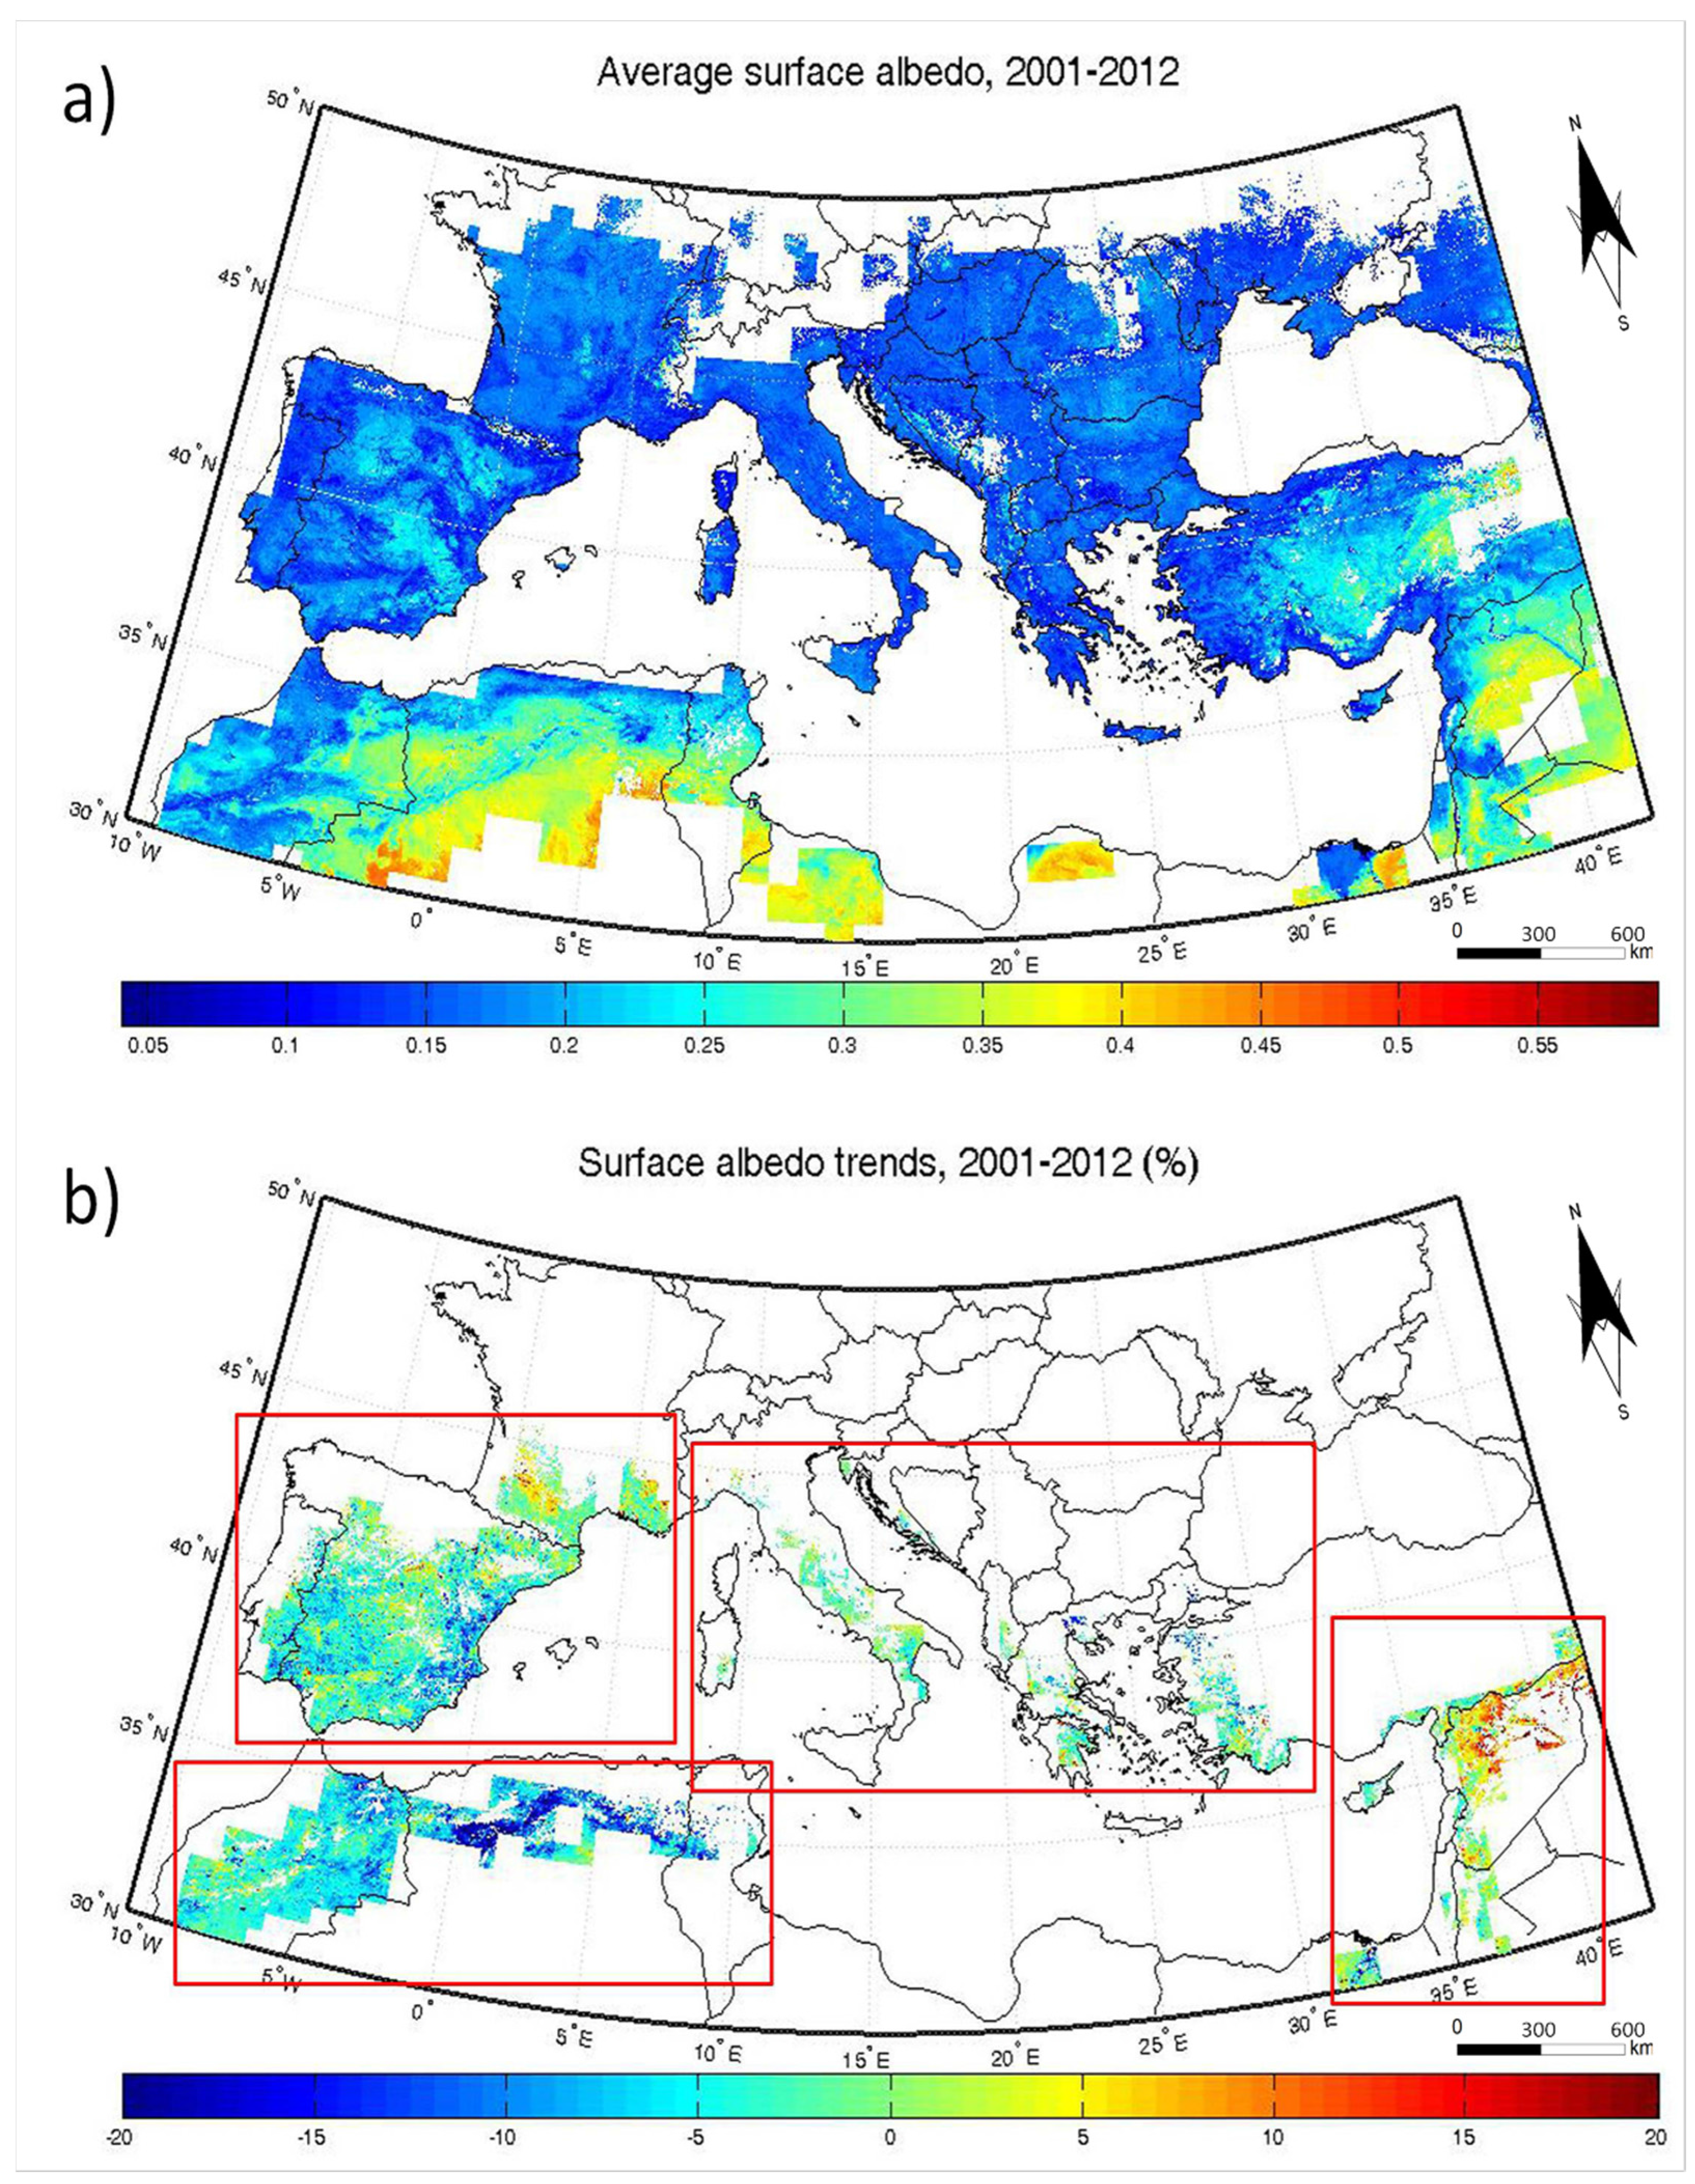
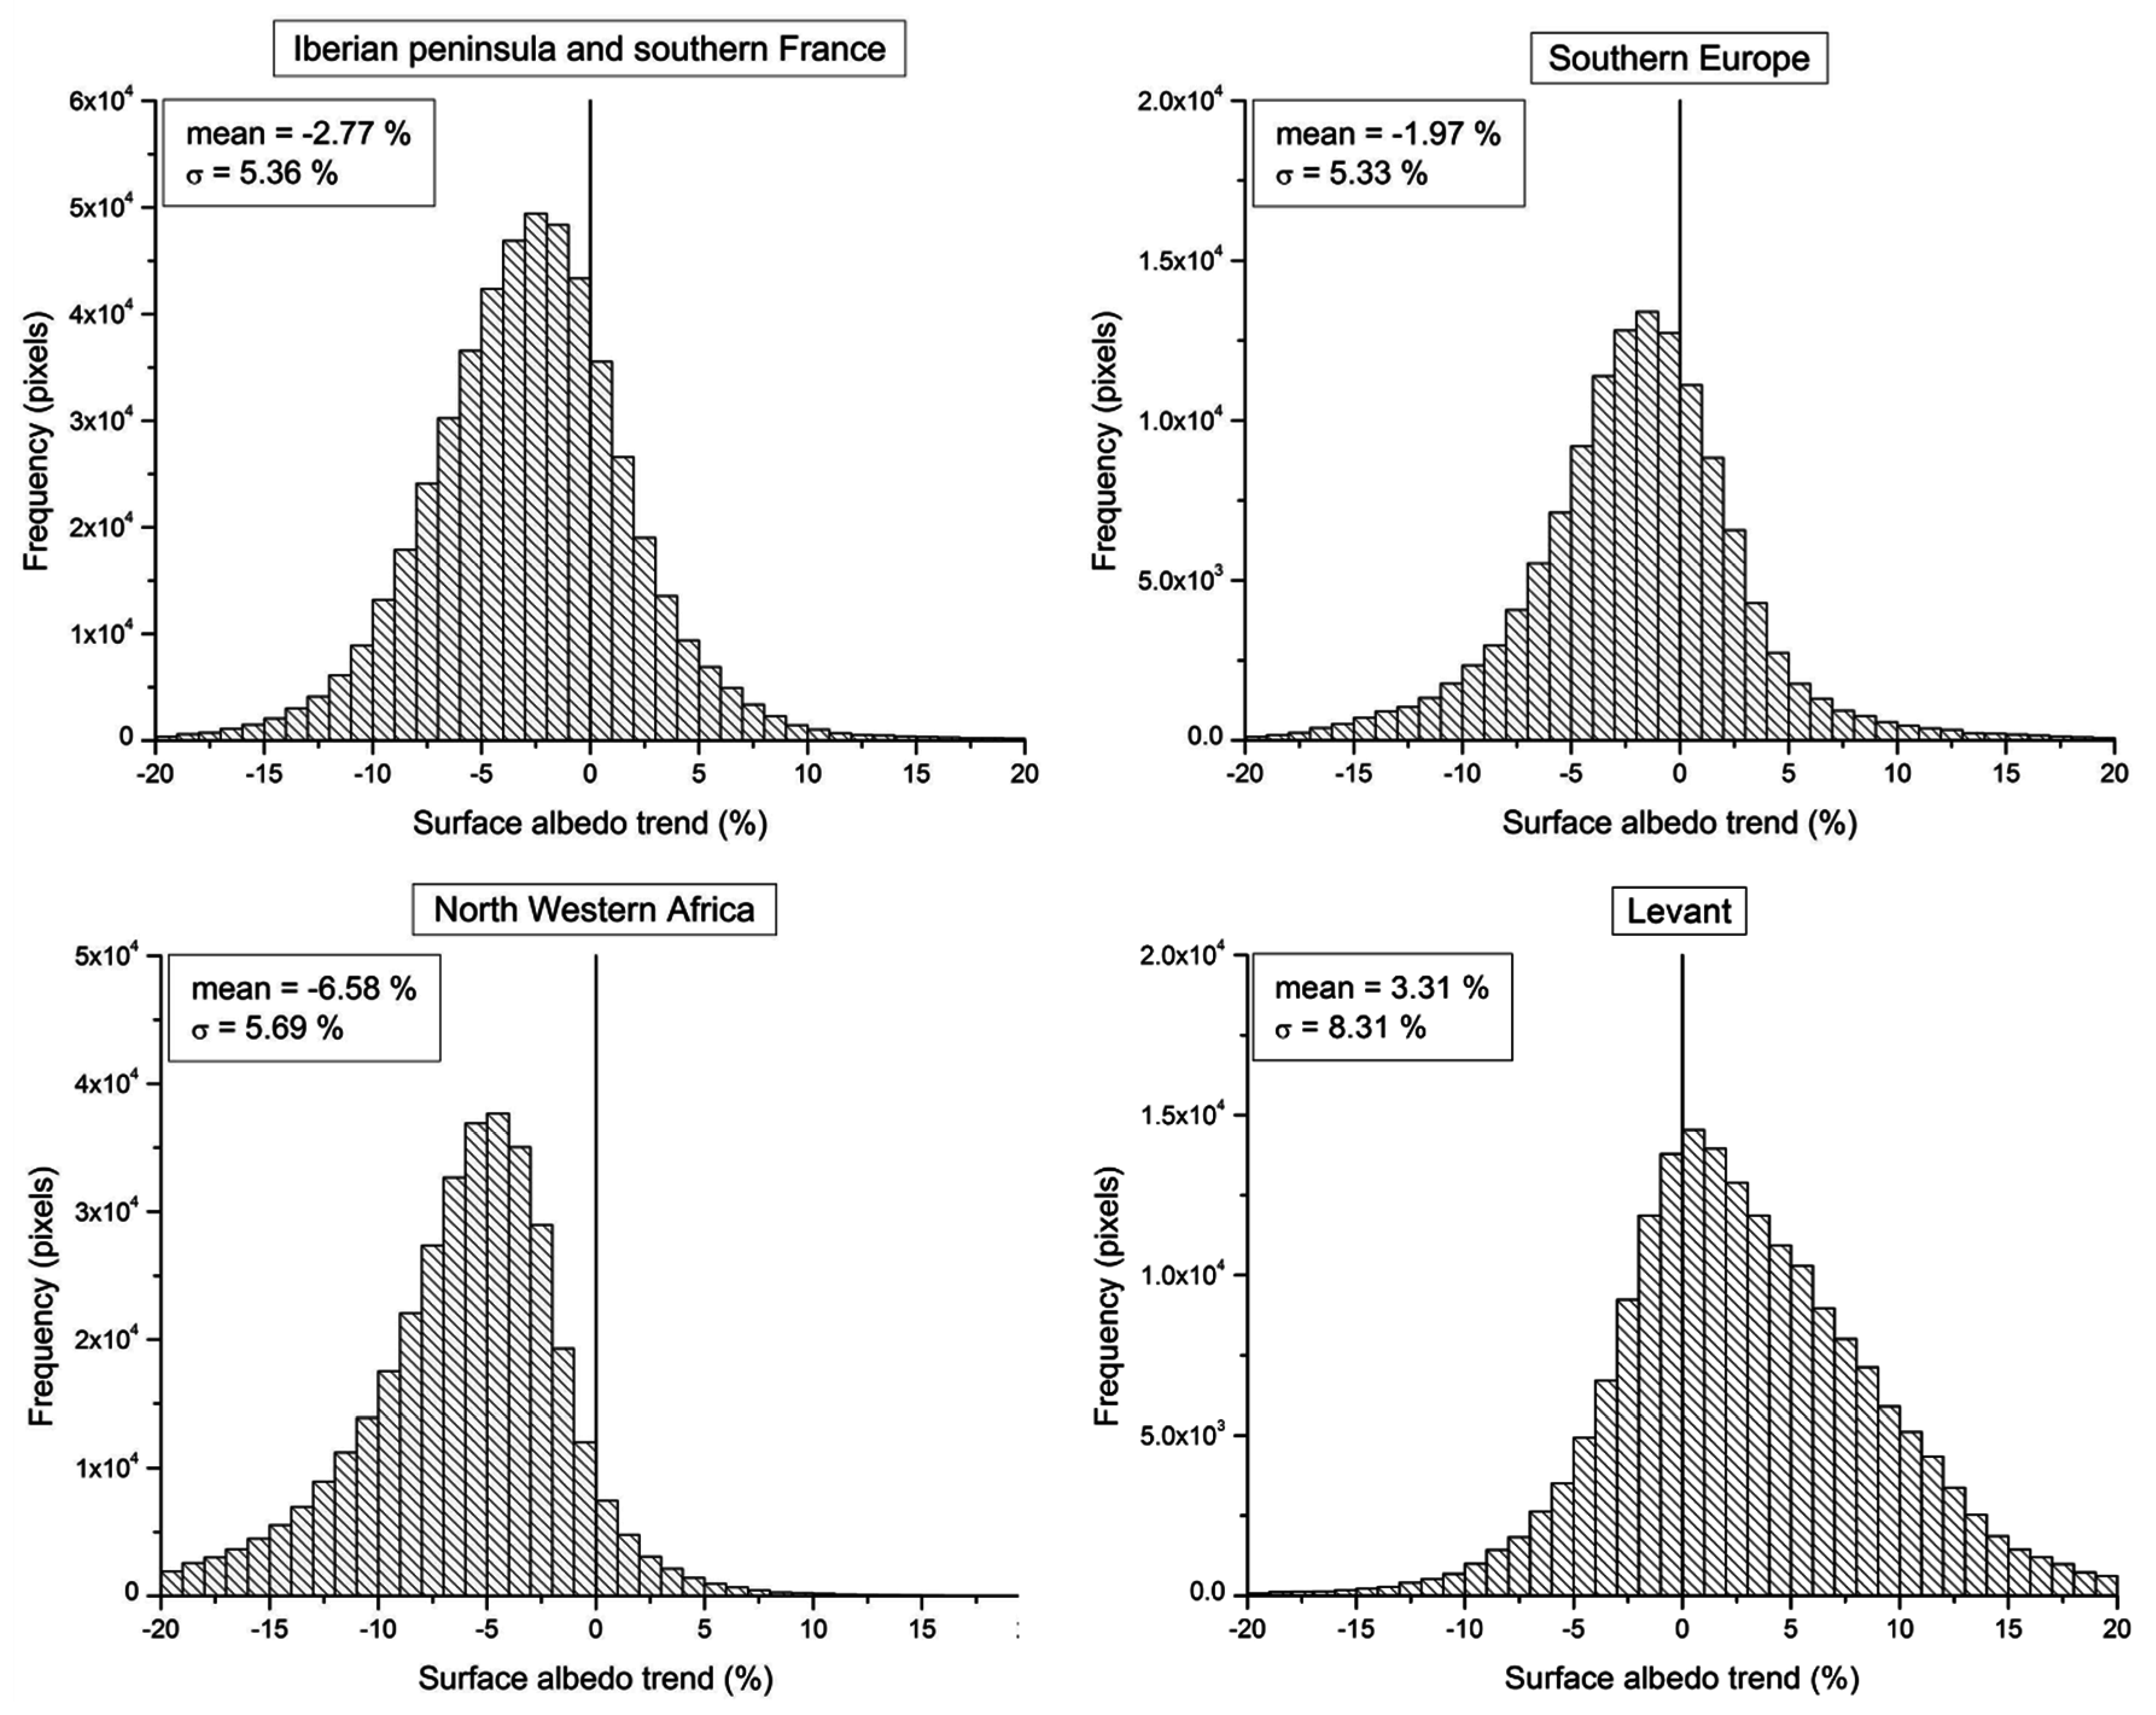
3.1. Average Surface Albedo and Changes

Figure 1a shows the aggregated LSA, computed as the mean of available annual average LSAs during the 2001–2012 period. It is apparent that northern Sahara and deserts in the Levant exhibit the highest LSA, which exceeds 0.4 or even 0.5 in these areas. Typical values of LSA in southern Europe range between 0.15 and 0.25. No-data areas in the image (shown in white) are caused either by discarded pixels due to quality flags and thresholds applied (Section 2.2), or by missing AOT data, whereby the LSA could not be computed. The Sahara desert is a typical example of such areas, due to the inability of the MODIS aerosol algorithm to retrieve AOT over bright surfaces [25].
Smaller gaps, especially in mountainous areas of southern Europe, were caused by the exclusion of snow-covered pixels from the analysis. Although snow coverage is an important factor affecting LSA, as also mentioned in the Introduction, its seasonality cannot be analyzed using the ESA CCI land cover product. While small regions surrounding mountainous areas can be contaminated by snow, even though they appear snow-free, this issue is not expected to affect significantly the results presented here.
Figure 1. (a) Spatial distribution of the Land Surface Albedo (LSA), computed as the average of the annual mean values for the period 2001–2012; (b) LSA changes (in %) during 2001–2012. The red squares delineate the four regions where these changes were examined separately.
Remotesensing 07 15816 g001
LSA changes (in percent change) and their spatial distribution during the 12-year study period are shown in Figure 1b. It should be noted that the extended areas with no data, which are added to the gaps in Figure 1a, were caused by applying the thresholds described in Section 2.3. In spite of these large gaps, some regional characteristics and patterns are apparent, such as the decreasing LSA in NW Africa and Eastern Spain and the increasing in the Levant. These characteristics justify the separation of the study area into four main regions, also shown in Figure 1b within the red squares, and the examination of the LSA changes separately in each region.
Figure 2 shows the four histograms of the LSA changes, corresponding to the four regions of Figure 1b, and the respective spatially averaged LSA changes and standard deviations. It is apparent that in NW Africa, decreasing LSA trends dominate, with an average value of −6.58%. In both the Iberian Peninsula and southern Europe (Italy, Greece and Turkey), negative trends are also more often than positive, while large variations can be observed in neighboring regions, that should apparently be attributed to local factors. Contrary to these regions, LSA tended to increase in most parts of the Levant (3.31% on average) during the period examined.
Figure 2. Histograms of the LSA changes (%) in the four separate areas of the study region shown in Figure 1b: Iberian Peninsula and southern France, southern Europe, north western Africa and the Levant. The spatially averaged LSA change and corresponding standard deviation for each region are also given.
Remotesensing 07 15816 g002
Similar results in albedo changes are reported in [26]; based on data from the Global Land Surface Satellites (GLASS) albedo product, described in [27], LSA trends were estimated for the period 2000–2010 on a global scale and seasonal basis. In all cases, decreasing LSA trends dominate in southern Europe and NW Africa, while increasing ones are reported in the Middle East. Decreasing trends were attributed primarily to spatial and temporal changes in snow cover extent, while soil moisture is also considered a driving factor, especially in semiarid areas. In fact, decreasing soil moisture trends have been reported in the Middle East and NE Africa [28], while, in the same study, mixed signs are apparent in southern Europe, with more prominent the positive ones. These findings are consistent with the ones reported here and offer possible explanations for the LSA trend characteristics shown in Figure 2.
It should be noted that the Terra MODIS Collection 5 calibration degradation, described in detail in [29], has been analyzed in past studies, for the quantification of its possible impacts on the evaluation of LSA trends. These studies focused primarily on the Greenland ice sheet albedo, and report that the Terra calibration degradation has either an insignificant impact on evaluated albedo trends ([30,31,32]), or causes discrepancies on trends only in shorter wavelength bands, and mostly below the stated accuracy of MODIS products [33]. Based on these results, this degradation issue is not expected to significantly affect the LSA changes reported here.

3.2. Land Cover Change Effects on Surface Albedo

Table 1 shows the 20 land cover types (excluding water bodies and permanent snow and ice), their percent coverage of total land in the study area in 2000 and 2010, and the spatially averaged LSA value and corresponding standard deviation per land cover type. These values were computed from the 12-year average LSA, while land cover types in 2010 were used. It should be noted that, according to Table 1, land cover changes are low compared to the extent of each land cover type. Hence, the average LSA presented here, computed based on the 2010 land cover, can be regarded as representative of each land cover type.
It is obvious from Table 1 that the study area is dominated primarily by croplands, especially across Europe and NW Africa, and secondarily by bare areas, comprising the Sahara and Levant deserts. These bare areas exhibit the highest LSA values (0.33 ± 0.06), as was also shown in Section 3.1, followed by sparse vegetation (0.24 ± 0.06). Estimation of typical LSA values for different land cover types is very important in climatological studies, since it can be used for updating corresponding input data in climate modeling simulations [34].
For the estimation of land cover change effects on LSA, all possible land cover changes (20 × 20 cases) between 2000 and 2010 were investigated. For each land cover change, the average LSA change was computed based only on statistically significant trends. As mentioned before and is apparent in Table 1, the land cover changes found were low compared to the extent of the study area, while from all possible combinations of land cover change, only changes from category 70 to categories 10, 30, 40, and 120 occurred in a sufficient number of pixels for the corresponding average LSA change value to be considered representative (several tens of pixels). These changes correspond to needleleaved, evergreen, closed to open forests, which were converted to rainfed croplands, mosaic croplands with natural vegetation, mosaic natural vegetation and shrublands. Table 2 shows the spatially averaged LSA change values (in percent) and corresponding standard deviations, computed from the pixels where these changes occurred. These changes, which correspond to deforestation from either natural or anthropogenic causes, led to a considerable increase in LSA (13%–14%). The average LSA values shown in Table 1 for the land cover types presented in Table 2 verify that an increase in LSA should be expected for these land cover changes. Specifically, needleleaved, evergreen, closed to open forests have lower LSA compared to the four categories in which they were converted, according to Table 2. The small changes in spatial coverage (Table 1) of the land cover types shown in Table 2, also verify that these changes occurred in small extents, compared to the overall study area.
As noted in [20], a precise land cover change detection requires higher spatial resolution (below 30 m), and specific processing methods, compared to the simple intercomparison of products used here. Hence, the spatial resolution of the land cover products used in this study may not be adequate for the detection of land cover changes in smaller scales, which could also contribute to the overall LSA changes. However, the latter method allows the depiction of some land cover changes over certain hot spot areas. In fact, further investigation of the spatial distribution of the above mentioned land cover changes, revealed such hot spots, including the 2007 forest fires in the Peloponnese, Greece [35], and the pine forest in Landes, France, which was destroyed by windstorm Klaus in 2009 [36].
Table 1. Land cover codes and types, percent coverage of total land in the study area in 2000 and 2010, and spatial average of LSA for each type.
LC CodeLand Cover TypeCoverage in 2000 (%)Coverage in 2010 (%)LSA (Mean ± 1σ)
10Cropland, rainfed38.3538.380.17 ± 0.03
20Cropland, irrigated or post-flooding2.462.460.19 ± 0.04
30Mosaic cropland (>50%)/natural vegetation0.850.860.16 ± 0.03
40Mosaic natural vegetation (>50%)1.921.950.16 ± 0.03
50Tree cover, broadleaved, evergreen, closed to open (>15%)0.020.020.13 ± 0.01
60Tree cover, broadleaved, deciduous, closed to open (>15%)9.349.310.15 ± 0.02
70Tree cover, needleleaved, evergreen, closed to open (>15%)4.594.540.13 ± 0.02
80Tree cover, needleleaved, deciduous, closed to open (>15%)<0.01<0.010.14 ± 0.03
90Tree cover, mixed leaf type1.911.900.13 ± 0.02
100Mosaic tree and shrub (>50%)2.542.540.14 ± 0.03
110Mosaic herbaceous cover (>50%)0.030.030.20 ± 0.07
120Shrubland2.112.110.15 ± 0.04
130Grassland4.054.060.19 ± 0.04
140Lichens and mosses0.000.00-
150Sparse vegetation6.586.580.24 ± 0.06
160Tree cover, flooded, fresh or brackish water0.000.00-
170Tree cover, flooded, saline water<0.01<0.010.18 ± 0.04
180Shrub or herbaceous cover, flooded0.290.290.14 ± 0.04
190Urban areas3.923.920.17 ± 0.03
200Bare areas20.9620.960.33 ± 0.06
Table 2. Spatially average LSA changes (%), for land cover changes detected across the study area that correspond to deforestation.
Land Cover in 2000Land Cover in 2010% LSA Change (Mean ± 1σ)
Tree cover, needleleaved, evergreen, closed to open (>15%)Cropland, rainfed14.27 ± 12.56
Mosaic cropland (>50%)/natural vegetation13.09 ± 6.55
Mosaic natural vegetation (>50%)14.10 ± 16.29
Shrubland12.62 ± 10.74

3.3. Rainfall Change Effects on Surface Albedo

Figure 3a shows the spatial distribution of surface rain rate changes (in mm∙hr−1) during 2001–2012. In most cases, surface rain rates have increased during the study period, with the highest increases occurring primarily in parts of NW Africa. Statistically significant increasing trends (not shown here) are also mainly located in this region and the Levant, while statistically significant decreasing trends are found primarily over the central Mediterranean.
Figure 3. (a) Spatial distribution of the surface rain rate changes (mm∙hr−1) during 2001–2012; (b) LSA changes (%) at regions with statistically significant (increasing) surface rain.
Remotesensing 07 15816 g003
The evaluation of the rainfall effect on LSA was based on statistically significant changes only, to ensure the validity of the results. Figure 3b shows the LSA changes (%) at pixels where the corresponding rainfall changes were statistically significant. In all these cases, there is an increase in rainfall rates during the period examined, and with the exception of a small area in the Levant, this increase is accompanied by a decrease in LSA that exceeds 5% in most cases. These results imply that in many areas of NW Africa, the decrease in LSA during 2001–2012 period, can be explained by a corresponding increase in surface rain rate, causing an increase in soil moisture and hence a decrease in LSA. Dorigo et al. [28] also report decreasing soil moisture trends in the Levant and mixed signs along the northern coast of the Mediterranean, during the period 1988–2010. These trends correlate well with changes in precipitation patterns, presented in the same study. Although the statistically significant rainfall trends reported here cover only small areas in NW Africa and the Levant, while southern Europe is totally absent from this analysis, those similar findings suggest that soil moisture changes constitute an important factor of corresponding LSA trends.

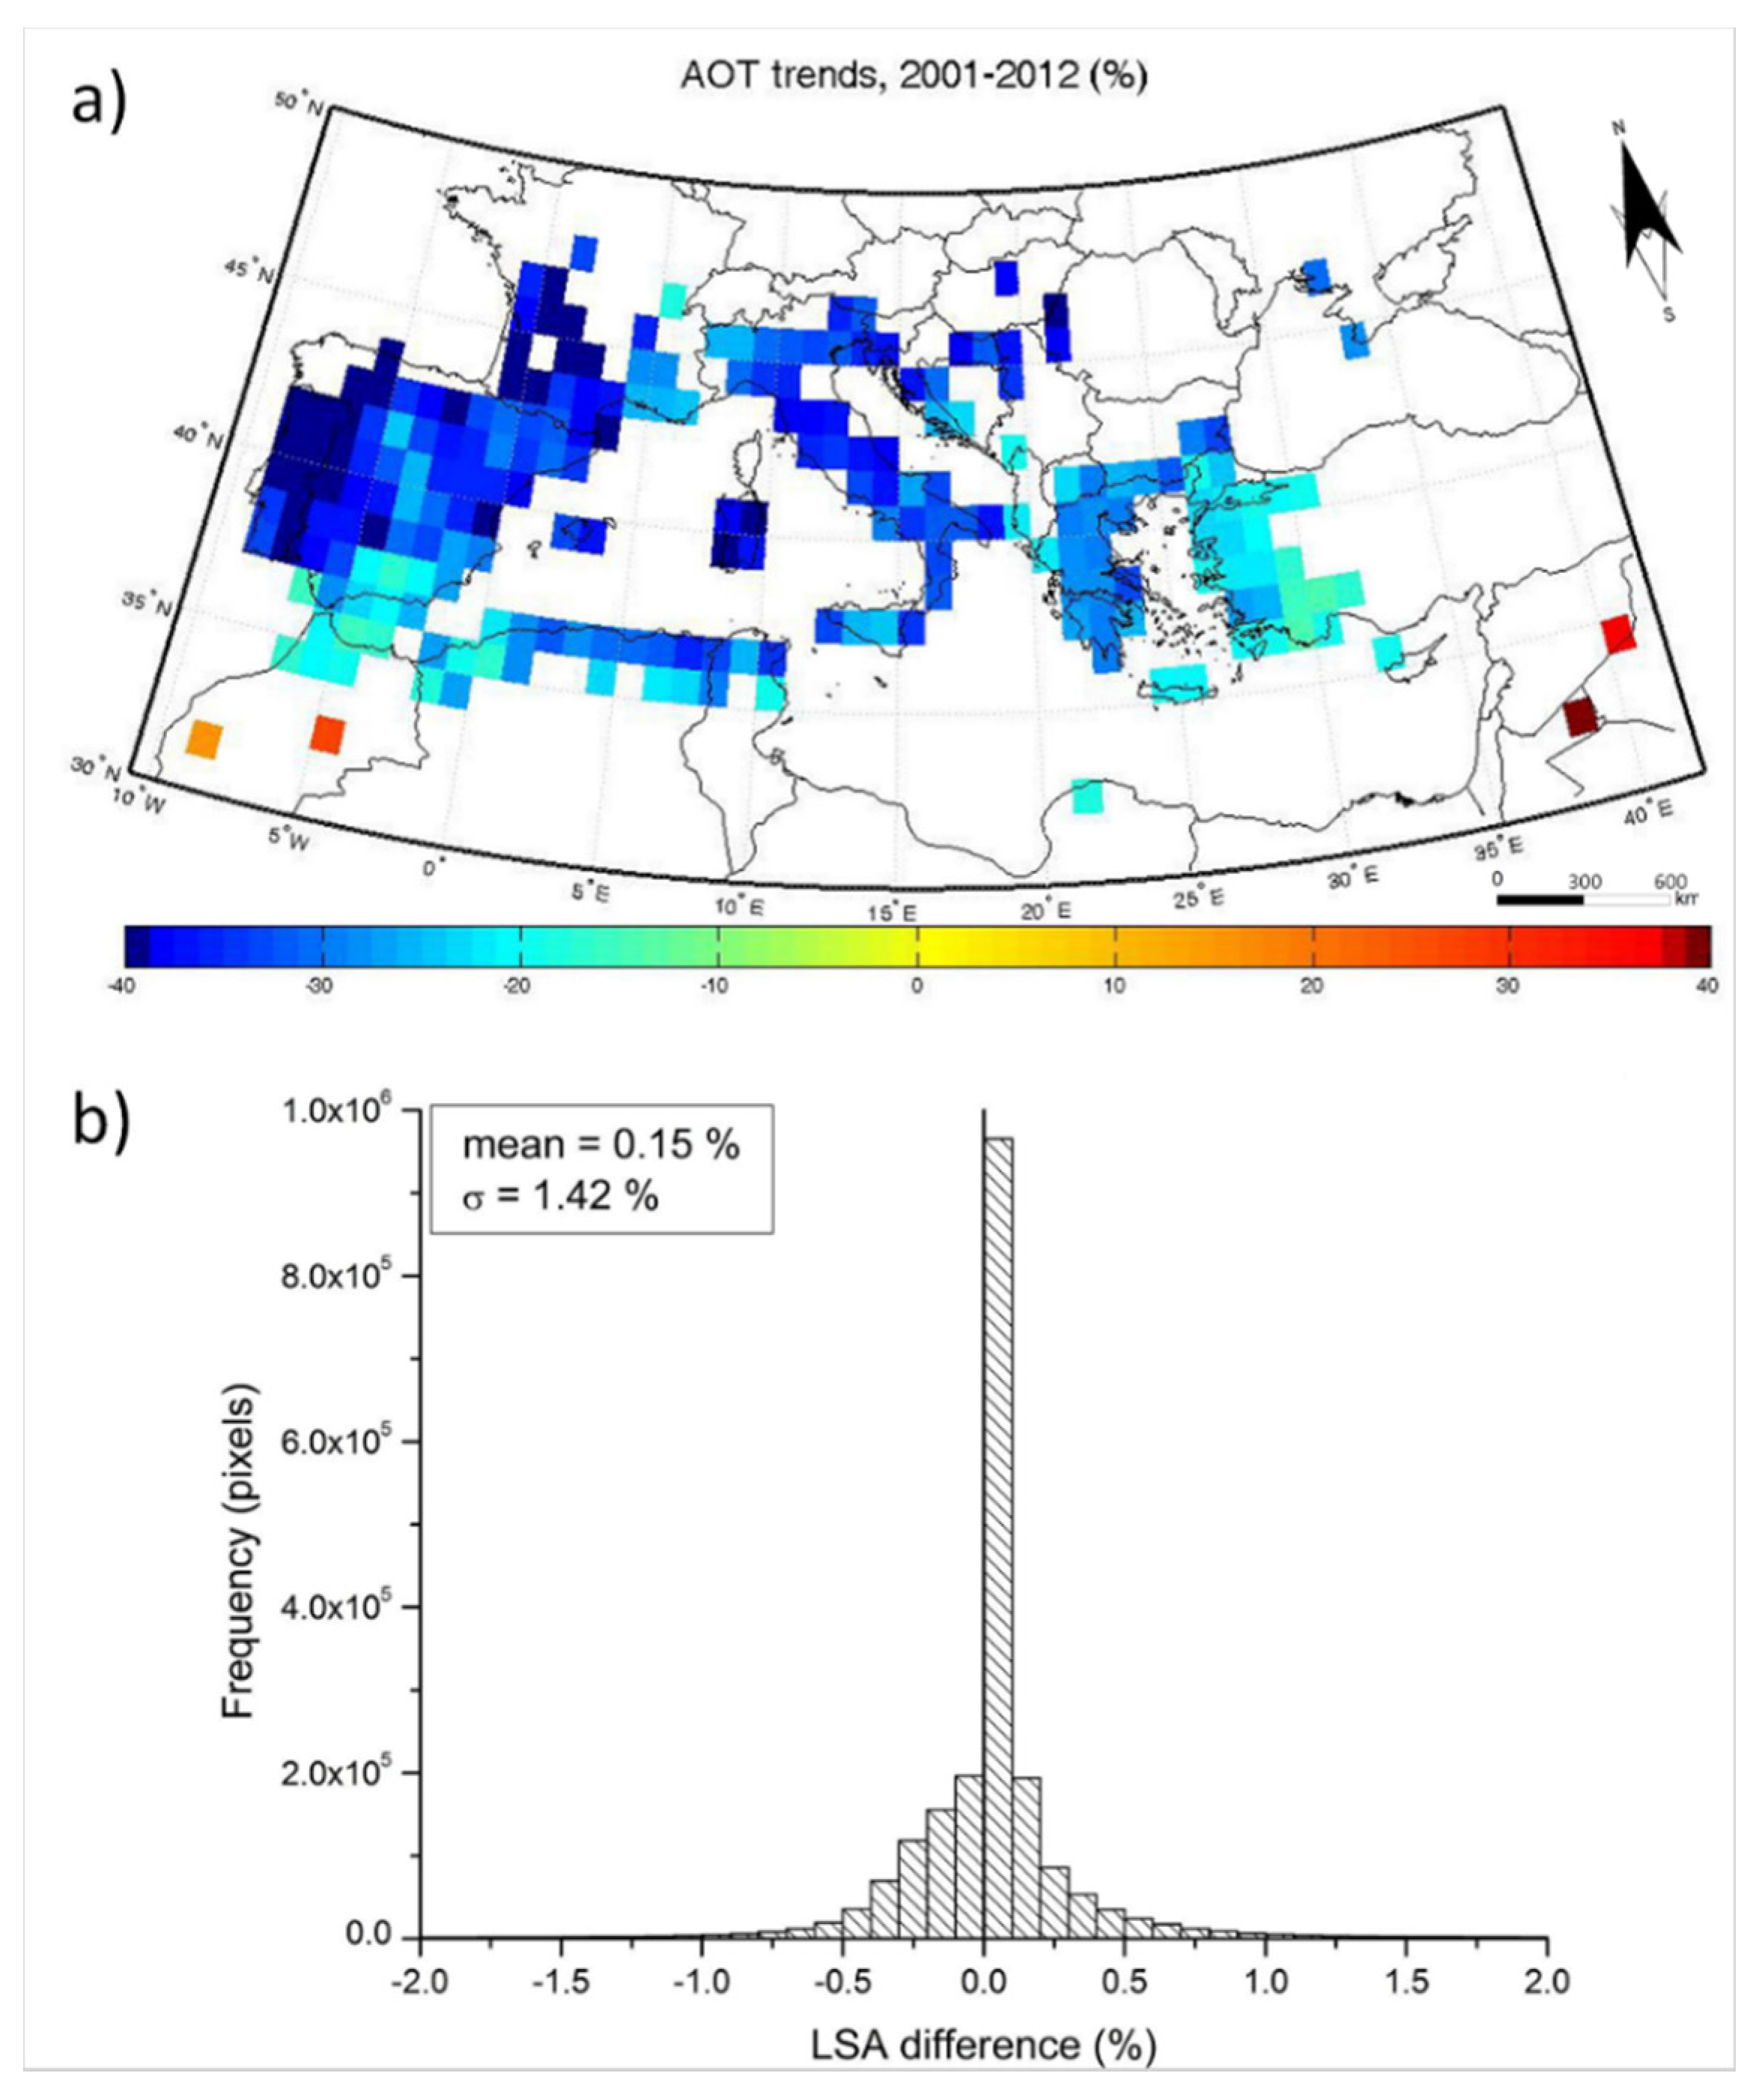
3.4. AOT Change Effects on Surface Albedo

Figure 4a shows the statistically significant trends in AOT (in percent change) over the study area, during the period examined. The analysis was based on annual average values of AOT, computed as described in Section 2.2 and linear regression fits, as per Section 2.3.
Figure 4. (a) Statistically significant Aerosol Optical Thickness (AOT) trends (in %) over the study area during the period 2001–2012; (b) Histogram of the percent differences in LSA, on a pixel basis, between the original 2012 annual average values and the corresponding, predicted based on a 20% reduction in AOT hypothesis. The average and standard deviation values of the differences are also shown.
Remotesensing 07 15816 g004
AOT appears to have decreased significantly over almost the entire study area, and particularly southern Europe and NW Africa. These decreases are of the order of 20%, reaching about 40% in parts of the Iberian Peninsula and South France. In specific locations in the Levant and Morocco these trends reverse, increasing AOT by about 30%–40%. These results are in good agreement with previous studies, which used similar data sets and study periods: [37] also found decreasing AOT trends over southern Europe, using daily mean MODIS Level 3 data, for the period 2000–2006, while the spatial distribution of the AOT trends presented here is also in very good agreement with results from [38], who used MODIS, MISR and AERONET AOT data to analyze trends on a global scale during 2000–2009. They also found decreasing trends in southern Europe and increasing in the Levant. In both these studies, the decrease in AOT over southern Europe is attributed to reductions in anthropogenic aerosols from Europe, which is the main source of air pollution in the area. It should be noted, however, that AOT trends are probably also affected by the calibration degradation issue on Terra MODIS Collection 5 products, as reported in [29]. As shown in the following analysis, however, the impact of AOT trends on corresponding LSA changes is minor.
Figure 4b shows the histogram of the differences (in %) between the original average LSA in 2012 and the corresponding LSA predicted using the decreased AOT values, on a pixel basis, as described in Section 2.3. No particular spatial pattern or differences between different regions of the study area were found, while the difference in LSA rarely exceeds ±1%, as is also apparent from Figure 4b. The effect of AOT change in LSA is not straightforward; a reduction in AOT is expected to decrease the white-sky albedo in the overall LSA estimation (see also [1]). At the same time, however, this reduction in the fraction of diffuse radiation will enhance the contribution of the direct radiation component (black-sky albedo), leading to mixed effects in the resulting LSA, as shown in Figure 4b. These results imply that the estimated AOT changes are not sufficient to cause significant changes in the LSA. This is in agreement with previous studies that have shown that LSA values do not vary significantly with aerosol loading [39], except for high to extreme aerosol loading, which, however, occurs only in a very small fraction of the measurement periods [8].

4. Conclusions

The Land Surface Albedo was evaluated at 1 km × 1 km spatial resolution and an 8-day temporal step, for the period 2001–2012, over the wider Mediterranean area, using Terra and Aqua MODIS albedo and aerosol parameters. LSA changes during the period examined were also estimated.
The effects of three major factors on LSA changes were assessed: land cover, rainfall and AOT changes. Land cover changes at the LSA spatial resolution reflect primarily hot spots of deforestation, caused by either human or natural effects. In all these cases, an LSA increase of the order of 13%–14% was observed. Combined examination of LSA and rainfall changes during the study period suggested that a possible increase in soil moisture may have caused a decrease in LSA, over regions of NW Africa. An AOT sensitivity analysis revealed that, although AOT has substantially decreased over most of the study area during the period examined, these changes were not sufficient to cause corresponding significant LSA changes.
The results presented in this study highlight the importance of the LSA estimation at both regional and local scales, as well as the complexity of the factors affecting LSA and its changes. No singular effect can be used to explain LSA changes at these scales. Instead, these changes appear to depend on a variety of factors, which may act simultaneously and range from global and regional (e.g., changes in rainfall patterns and deforestation) to local scales (e.g., human-induced land cover changes). Given this scale interdependence, the availability of satellite-based continuous monitoring provides an unprecedented opportunity for estimating and using LSA at local to regional scale. This availability, combined with new satellite AOT products, derived over bright surfaces using multi-angular retrieval algorithms (e.g., [40,41]), is expected to provide more spatially complete LSA estimations. These will further lead to more accurate estimations of surface energy budget spatio-temporal distribution, which is a key parameter in both climate monitoring and modeling studies.

Acknowledgments

This work was partially funded from the European Union’s Horizon 2020 Research and Innovation Programme under Grant Agreement No 641762 (project ECOPOTENTIAL) and partially from the KRIPIS Action of the General Secretariat for Research and Technology (project PEFYKA, funded by Greece and the European Regional Development Fund of the European Union under the NSRF and the O.P. Competitiveness and Entrepreneurship). The MODIS MCD43B1 product files were obtained from the NASA Land Processes Distributed Active Archive Center. Land Cover data were available via the ESA CCI project. MODIS aerosol data were retrieved from the NASA Goddard Space Flight Center Level 1 and Atmosphere Archive and Distribution System. The TRMM data used here are archived and distributed by the Goddard Earth Sciences (GES) Data and Information Services Center (DISC).

Author Contributions

Both authors contributed equally to this work.

Conflicts of Interest

The authors declare no conflict of interest.

References

  1. Schaepman-Strub, G.; Schaepman, M.E.; Painter, T.H.; Dangel, S.; Martonchik, J.V. Reflectance quantities in optical remote sensing-definitions and case studies. Remote Sens. Environ. 2006, 103, 27–42. [Google Scholar] [CrossRef]
  2. Vardavas, I.M.; Taylor, F.W. Radiation and Climate: Atmospheric Energy Budge from Satellite Remote Sensing; Oxford University Press: Oxford, UK, 2011. [Google Scholar]
  3. Shuai, Y.; Masek, J.G.; Gao, F.; Schaaf, C.B. An algorithm for the retrieval of 30-m snow-free albedo from Landsat surface reflectance and MODIS BRDF. Remote Sens. Environ. 2011, 115, 2204–2216. [Google Scholar] [CrossRef]
  4. Schaaf, C.B.; Martonchik, J.; Pinty, B.; Govaerts, Y.; Gao, F.; Lattanzio, A.; Liu, J.; Strahler, A.; Taberner, M. Retrieval of surface albedo from satellite sensors. In Advances in Land Remote Sensing: System, Modeling, Inversion and Application; Liang, S., Ed.; Springer: Houten, The Netherlands, 2008; pp. 219–243. [Google Scholar]
  5. Trenberth, K.E.; Jones, P.D; Ambenje, P.; Bojariu, R.; Easterling, D.; Tank, A.K.; Parker, D.; Rahimzadeh, F.; Renwick, J.A.; Rusticucci, M.; et al. Observations: Surface and atmospheric climate change. In Climate Change 2007: The Physical Science Basis. Contribution of Working Group I to the Fourth Assessment Report of the Intergovernmental Panel on Climate Change; Solomon, S., Qin, D., Manning, M., Chen, Z., Marquis, M., Averyt, K.B., Tignor, M., Miller, H.L., Eds.; Cambridge University Press: Cambridge, UK; New York, NY, USA, 2007. [Google Scholar]
  6. Trenberth, K.E. Changes in precipitation with climate change. Clim. Res. 2011, 47, 123–138. [Google Scholar] [CrossRef]
  7. IPCC. Managing the Risks of Extreme Events and Disasters to Advance Climate Change Adaptation; A Special Report of Working Groups I and II of the Intergovernmental Panel on Climate Change; Field, C.B., Barros, V., Stocker, T.F., Qin, D., Dokken, D.J., Ebi, K.L., Mastrandrea, M.D., Mach, K.J., Plattner, G.K., Allen, S.K., et al., Eds.; Cambridge University Press: Cambridge, UK; New York, NY, USA, 2012. [Google Scholar]
  8. Román, M.O.; Schaaf, C.B.; Lewis, P.; Gao, F.; Anderson, G.P.; Privette, J.L.; Strahler, A.H.; Woodcock, C.E.; Barnsley, M. Assessing the coupling between surface albedo derived from MODIS and the fraction of diffuse skylight over spatially-characterized landscapes. Remote Sens. Environ. 2010, 114, 738–760. [Google Scholar] [CrossRef]
  9. Sutterlin, M.; Schaaf, C.B.; Stockli, R.; Sun, Q.; Husler, F.; Neuhaus, C.; Wunderle, S. Albedo and reflectance anisotropy retrieval from AVHRR operated onboard NOAA and MetOp satellites: Algorithm performance and accuracy assessment for Europe. Remote Sens. Environ. 2015, 168, 163–176. [Google Scholar] [CrossRef]
  10. Schaaf, C.; Gao, F.; Strahler, A.; Lucht, W.; Li, X.; Tsung, T.; Strugnell, N.; Zhang, X.; Jin, Y.; Muller, J.P.; et al. First operational BRDF, albedo and nadir reflectance products from MODIS. Remote Sens. Environ. 2002, 83, 135–148. [Google Scholar] [CrossRef]
  11. Román, M.O.; Schaaf, C.B.; Woodcock, C.E.; Strahler, A.H.; Yang, X.; Braswell, R.H.; Curtis, P.S.; Davis, K.J.; Dragoni, D.; Goulden, M.L.; et al. The MODIS (Collection V005) BRDF/albedo product: Assessment of spatial representativeness over forested landscapes. Remote Sens. Environ. 2009, 113, 2476–2498. [Google Scholar] [CrossRef]
  12. Liu, J.; Schaaf, C.; Strahler, A.; Jiao, Z.; Shuai, Y.; Zhang, Q.; Roman, M.; Augustine, J.A.; Dutton, E.G. Validation of Moderate Resolution Imaging Spectroradiometer (MODIS) albedo retrieval algorithm: Dependence of albedo on solar zenith angle. J. Geophys. Res. 2009, 114, D01106. [Google Scholar] [CrossRef]
  13. Cescatti, A.; Marcolla, B.; Santhana Vannan, S.K.; Pan, J.Y.; Román, M.O.; Yang, X.; Ciais, P.; Cook, R.B.; Law, B.E.; Matteucci, G.; et al. Intercomparison of MODIS albedo retrievals and in situ measurements across the global FLUXNET network. Remote Sens. Environ. 2012, 121, 323–334. [Google Scholar] [CrossRef]
  14. Lucht, W.; Schaaf, C.B.; Strahler, A.H. An algorithm for the retrieval of albedo from space using semi empirical BRDF models. IEEE Trans. Geosci. Remote Sens. 2000, 38, 977–998. [Google Scholar] [CrossRef]
  15. Levy, R.C.; Remer, L.A.; Kleidman, R.G.; Mattoo, S.; Ichoku, C.; Kahn, R.; Eck, T.F. Global evaluation of the Collection 5 MODIS dark-target aerosol products over land. Atmos. Chem. Phys. 2010, 10, 10399–10420. [Google Scholar] [CrossRef] [Green Version]
  16. Benas, N.; Chrysoulakis, N. Estimation of land surface albedo time series and trends based on MODIS data. In Proceedings of the SPIE 9239, Remote Sensing for Agriculture, Ecosystems, and Hydrology XVI, 92390Q, Amsterdam, The Netherlands, 22 September 2014.
  17. Musial, J.P.; Verstraete, M.M.; Gobron, N. Technical Note: Comparing the effectiveness of recent algorithms to fill and smooth incomplete and noisy time series. Atmos. Chem. Phys. 2011, 11, 7905–7923. [Google Scholar] [CrossRef] [Green Version]
  18. Hollmann, R.; Merchant, C.; Saunders, R.; Downy, C.; Buchwitz, M.; Cazenave, A.; Chuvieco, E.; Defourny, P.; de Leeuw, G.; Forsberg, R.; et al. The ESA climate change initiative: Satellite data records for essential climate variables. B. Am. Meteorol. Soc. 2013, 94, 1541–1552. [Google Scholar] [CrossRef]
  19. Bontemps, S.; Defourny, P.; Brockmann, C.; Herold, M.; Kalogirou, V.; Arino, O. New global land cover mapping exercise in the framework of the ESA Climate Change Initiative. In Proceedings of the IEEE International Geoscience and Remote Sensing Symposium (IGARSS), Munich, Germany, 22–27 July 2012; pp. 44–47.
  20. Bontemps, S.; Herold, M.; Kooistra, L.; van Groenestijn, A.; Hartley, A.; Arino, O.; Moreau, I.; Defourny, P. Revisiting land cover observation to address the needs of the climate modeling community. Biogeosciences 2012, 9, 2145–2157. [Google Scholar] [CrossRef] [Green Version]
  21. Liu, S.; Roujean, J.L.; Tchuente, A.T.K.; Ceamanos, X.; Calvet, J.C. A parameterization of SEVIRI and MODIS daily surface albedo with soil moisture: Calibration and validation over southwestern France. Remote Sens. Environ. 2014, 144, 137–151. [Google Scholar] [CrossRef]
  22. Kummerow, C.; Simpson, J.; Thiele, O.; Barnes, W.; Chang, A.T.C.; Stocker, E.; Adler, R.F.; Hou, A.; Kakar, R.; Wentz, F.; et al. The status of the tropical rainfall measuring mission (TRMM) after two years in Orbit. J. Appl. Meteorol. 2000, 39, 1965–1982. [Google Scholar] [CrossRef]
  23. Feidas, H. Validation of satellite rainfall products over Greece. Theor. Appl. Climatol. 2010, 99, 193–216. [Google Scholar] [CrossRef]
  24. Gabella, M.; Michaelides, S.; Constantinides, P.; Perona, G. Climatological validation of TRMM precipitation radar monthly rain products over Cyprus during the first 5 years. Meteorol. Z. 2006, 15, 559–564. [Google Scholar] [CrossRef]
  25. Levy, R.; Remer, L.; Tanré, D.; Mattoo, S.; Kaufman, Y. Algorithm for Remote Sensing of Tropospheric Aerosol over Dark Targets from MODIS: Collections 005 and 051: Revision 2; Feb 2009; NASA/GSFC: Greenbelt, MD, USA, 2009. [Google Scholar]
  26. He, T.; Liang, S.; Song, D.X. Analysis of global land surface albedo climatology and spatial-temporal variation during 1981–2010 from multiple satellite products. J. Geophys. Res. Atmos. 2014, 119, 10281–10298. [Google Scholar] [CrossRef]
  27. Liang, S.; Zhao, X.; Liu, S.; Yuan, W.; Cheng, X.; Xiao, Z.; Zhang, X.; Liu, Q.; Cheng, J.; Tang, H.; et al. A long term Global Land Surface Satellite (GLASS) data-set for environmental studies. Int. J. Digital Earth 2013, 6, 5–33. [Google Scholar] [CrossRef]
  28. Dorigo, W.; de Jeu, R.; Chung, D.; Parinussa, R.; Liu, Y.; Wagner, W.; Fernandez-Prieto, D. Evaluating global trends (1988–2010) in harmonized multi-satellite surface soil moisture. Geophys. Res. Lett. 2012, 39, L18405. [Google Scholar] [CrossRef]
  29. Lyapustin, A.; Wang, Y.; Xiong, X.; Meister, G.; Platnick, S.; Levy, R.; Franz, B.; Korkin, S.; Hilker, T.; Tucker, J.; et al. Scientific impact of MODIS C5 calibration degradation and C6+ improvements. Atmos. Meas. Tech. 2014, 7, 4353–4365. [Google Scholar] [CrossRef]
  30. Dummont, M.; Brun, E.; Picard, G.; Michou, M.; Libois, Q.; Petit, J.R.; Geyer, M.; Morin, S.; Josse, B. Contribution of light-absorbing impurities in snow to Greenland’s darkening since 2009. Nat. Geosci. 2014, 7, 509–512. [Google Scholar] [CrossRef]
  31. Stroeve, J.; Box, J.E.; Wang, Z.; Schaaf, C.; Barrett, A. Re-evaluation of MODIS MCD43 Greenland albedo accuracy and trends. Remote Sens. Environ. 2013, 138, 199–214. [Google Scholar] [CrossRef]
  32. Box, J.E.; Fettweis, X.; Stroeve, J.; Tedesco, M.; Hall, D.K.; Steffen, K. Greenland ice sheet albedo feedback: Thermodynamics and atmospheric drivers. Cryosphere 2012, 6, 821–839. [Google Scholar] [CrossRef]
  33. Polashenski, C.M.; Dibb, J.E.; Flanner, M.G.; Chen, J.Y.; Courville, Z.R.; Lai, A.M.; Schauer, J.J.; Shafer, M.M.; Bergin, M. Neither dust nor black carbon causing apparent albedo decline in Greenland’s dry snow zone: Implications for MODIS C5 surface reflectance. Geophys. Res. Lett. 2015, 42. [Google Scholar] [CrossRef]
  34. Benas, N.; Chrysoulakis, N.; Christakis, N.; Kossioris, G.; Plexousakis, M. WRF input parameter updates based on recent and long-term satellite observations. In Proceedings of the 12th International Conference of Meteorology, Climatology and Physics of the Atmosphere (COMECAP 2014), 28–31 May 2014; pp. 127–131.
  35. Boschetti, L.; Roy, D.; Barbosa, P.; Boca, R.; Justice, C. A MODIS assessment of the summer 2007 extent burned in Greece. Int. J. Remote Sens. 2008, 29, 2433–2436. [Google Scholar] [CrossRef]
  36. Liberato, M.R.L.; Pinto, J.G.; Trigo, I.F.; Trigo, R.M. Klaus—An exceptional winter storm over northern Iberia and southern France. Weather 2011, 66, 330–334. [Google Scholar] [CrossRef]
  37. Papadimas, C.D.; Hatzianastassiou, N.; Mihalopoulos, N.; Querol, X.; Vardavas, I. Spatial and temporal variability in aerosol properties over the Mediterranean basin based on 6-year (2000–2006) MODIS data. J. Geophys. Res. 2008, 113, D11205. [Google Scholar] [CrossRef]
  38. De Meij, A.; Pozzer, A.; Lelieveld, J. Trend analysis in aerosol optical depths and pollutant emission estimates between 2000 and 2009. Atmos. Environ. 2012, 51, 75–85. [Google Scholar] [CrossRef]
  39. Lewis, P.; Barnsley, M.J. Influence of the sky radiance distribution on various formulations of the earth surface albedo. In Proceedings of the Conf. Physics Measures and Signals, Val d’Isere, France, 17–21 January 1994; pp. 707–715.
  40. Lyapustin, A.; Wang, Y.; Laszlo, I.; Kahn, R.; Korkin, S.; Remer, L.; Levy, R.; Reid, J.S. Multiangle implementation of atmospheric correction (MAIAC): 2. Aerosol algorithm. J. Geophys. Res. 2011, 116, D03211. [Google Scholar] [CrossRef]
  41. Benas, N.; Chrysoulakis, N.; Giannakopoulou, G. Validation of MERIS/AATSR synergy algorithm for aerosol retrieval against globally distributed AERONET observations and comparison with MODIS aerosol product. Atmos. Res. 2013, 132, 102–113. [Google Scholar] [CrossRef]

