Article

Downscaling Surface Water Inundation from Coarse Data to Fine-Scale Resolution: Methodology and Accuracy Assessment

1
Key Laboratory of Watershed Geographic Sciences, Nanjing Institute of Geography and Limnology, Chinese Academy of Sciences, Nanjing 21008, China
2
State Key Laboratory of Lake Science and Environment, Nanjing Institute of Geography and Limnology, Chinese Academy of Sciences, Nanjing 21008, China
*
Author to whom correspondence should be addressed.
Remote Sens. 2015, 7(12), 15989-16003; https://doi.org/10.3390/rs71215813
Submission received: 18 August 2015 / Revised: 11 October 2015 / Accepted: 18 November 2015 / Published: 30 November 2015

Abstract

:
The availability of water surface inundation with high spatial resolution is of fundamental importance in several applications such as hydrology, meteorology and ecology. Medium spatial resolution sensors, like MODerate-resolution Imaging Spectroradiometer (MODIS), exhibit a significant potential to study inundation dynamics over large areas because of their high temporal resolution. However, the low spatial resolution provided by MODIS is not appropriate to accurately delineate inundation over small scale. Successful downscaling of water inundation from coarse to fine resolution would be crucial for improving our understanding of complex inundation characteristics over the regional scale. Therefore, in this study, we propose an innovative downscaling method based on the normalized difference water index (NDWI) statistical regression algorithm towards generating small-scale resolution inundation maps from MODIS data. The method was then applied to the Poyang Lake of China. To evaluate the performance of the proposed downscaling method, qualitative and quantitative comparisons were conducted between the inundation extent of MODIS (250 m), Landsat (30 m) and downscaled MODIS (30 m). The results indicated that the downscaled MODIS (30 m) inundation showed significant improvement over the original MODIS observations when compared with simultaneous Landsat (30 m) inundation. The edges of the lakes become smoother than the results from original MODIS image and some undetected water bodies were delineated with clearer shapes in the downscaled MODIS (30 m) inundation map. With respect to high-resolution Landsat TM/ETM+ derived inundation, the downscaling procedure has significantly increased the R2 and reduced RMSE and MAE both for the inundation area and for the value of landscape metrics. The main conclusion of this study is that the downscaling algorithm is promising and quite feasible for the inundation mapping over small-scale lakes.

Graphical Abstract

1. Introduction

Terrestrial surface water, as a fundamental component of the global water cycle, is key to hydrology, ecology and meteorology [1,2,3]. It is also crucial for terrestrial life and the human environment as a resource for water consumption, agriculture, and industry [4]. Therefore, accurate spatio-temporal representation of terrestrial surface water is of significant importance for management and conservation of water resource and other hydrology services associated with freshwater [5,6,7]. Traditionally, the detection of terrestrial water surface relies on in situ gauge measurements and hydrological models. These methods, however, cannot provide an overall distribution pattern on a regional scale since their low efficiency or sometimes absence in inaccessible regions [8].
In recent years, the development of remote sensing has presented us with new methods of surface water inundation observation. These include multispectral, synthetic aperture radar (SAR), and passive-microwave observations [9,10,11]. In particular, some of the high spatial resolution multispectralimagery (e.g., Landsat TM/ETM+, SPOT, ASTER and ALOS) make it possible to accurately detect and delineate the water body information [12,13,14,15]. However, the routine inundation monitoring with high spatial resolution multispectral data is difficult due to narrow scanning coverage and the long return period between successive satellites overpasses [10,16]. High temporal resolution multispectral data including MODIS and AVHRR have therefore been widely used to conduct routine inundation monitoring in mesoscale [17,18,19,20], but when focusing on regional scale, their coarse spatial resolution is a common drawback [21,22]. The overall uncertainty of these measurements is ~6%–13% for small lakes [23], which identified coarse spatial resolution imagery’s inability to detect small inundated regions. Hence, the trade-off between spatial and temporal resolution of satellite data presents a dilemma for us to capture the inundation changes at small scales. With the development of remote sensing technique, downscaling becomes an attractive option to overcome this limitation [24].
Downscaling is defined as an increase in spatial resolution following disaggregation of the original dataset [25]. Recently, several researchers have begun to investigate the downscaling method to disaggregate the inundation information using coarse remote sensing data [7,26,27]. Two main methods have been used so far for the downscaling of surface water inundation. The first general method uses digital elevation model (DEM) information to distribute the inundation extent at a finer scale [21,28,29]. The second method utilizes probability statistical and image-processing technique. The probability statistical methodology first derives the inundation probability at a low resolution dataset. Then, a seeded region growing segmentation process is used to redistribute the inundated area at the finer resolution [7]. However, most of these methods have some technical limitations. For one thing, extra independent measurements of hydrological information are required, making the approach less ideal for extensive and real-time monitoring. For another, most of these methods mainly applied in global or large scale, which have not been applied locally. Likewise, these methods are maladapted to the fine scale hydrological processes, because many hydrological activities particularly occur at a finer spatial/temporal scale over a period of a couple of days. Likewise, the coarse resolution imagery (e.g., MODIS) is far from meeting the needs of operational flood/drought detection and assessment [21]. Therefore, it is of great importance to develop a method to downscale the satellite-based inundation at small spatial/temporal scales.
In addition, effectiveness evaluation of downscaling method is of importance for the practical applications. How well a downscaling method fits the observed data usually is determined by comparisons of downscaled values with observations [30]. Currently, several evaluation criteria (e.g., root-mean-squared error, standard deviation, commission error, omission error, and overall accuracy) are available to assess the performance of downscaling results [7,31]. These criteria are simple to calculate and almost always discussed in basic statistics [32]. Unfortunately, they suffer from limitations that make them poor measures of model performance since they ignore the spatial pattern characteristics of downscaled results [33]. Up to present, there is no study available to address the evaluation of robustness or performance of spatial pattern for a downscaling method.
Given this background, the goal of this study is to propose and test an innovative downscaling algorithm with pixel-based inundation. This goal will be addressed through the following primary objectives: (1) to develop a downscaling algorithm using a statistical regression algorithm scheme for generating small resolution inundation map from MODIS (250 m resolution) data; (2) to evaluate the efficiency of this approach based on quantitative and landscape-level comparison with coincident high resolution data. The study is organized as follows. Section 2 details the downscaling methodology and evaluation. Section 3 describes the study materials and data processing. Section 4 states and evaluates the downscaled results. Section 5 concludes and discusses the study.

2. Methodology

This chapter describes the methodology, including water body delineation, downscaling procedures and how we evaluate the proposed downscaling method. The detailed descriptions are as follows.

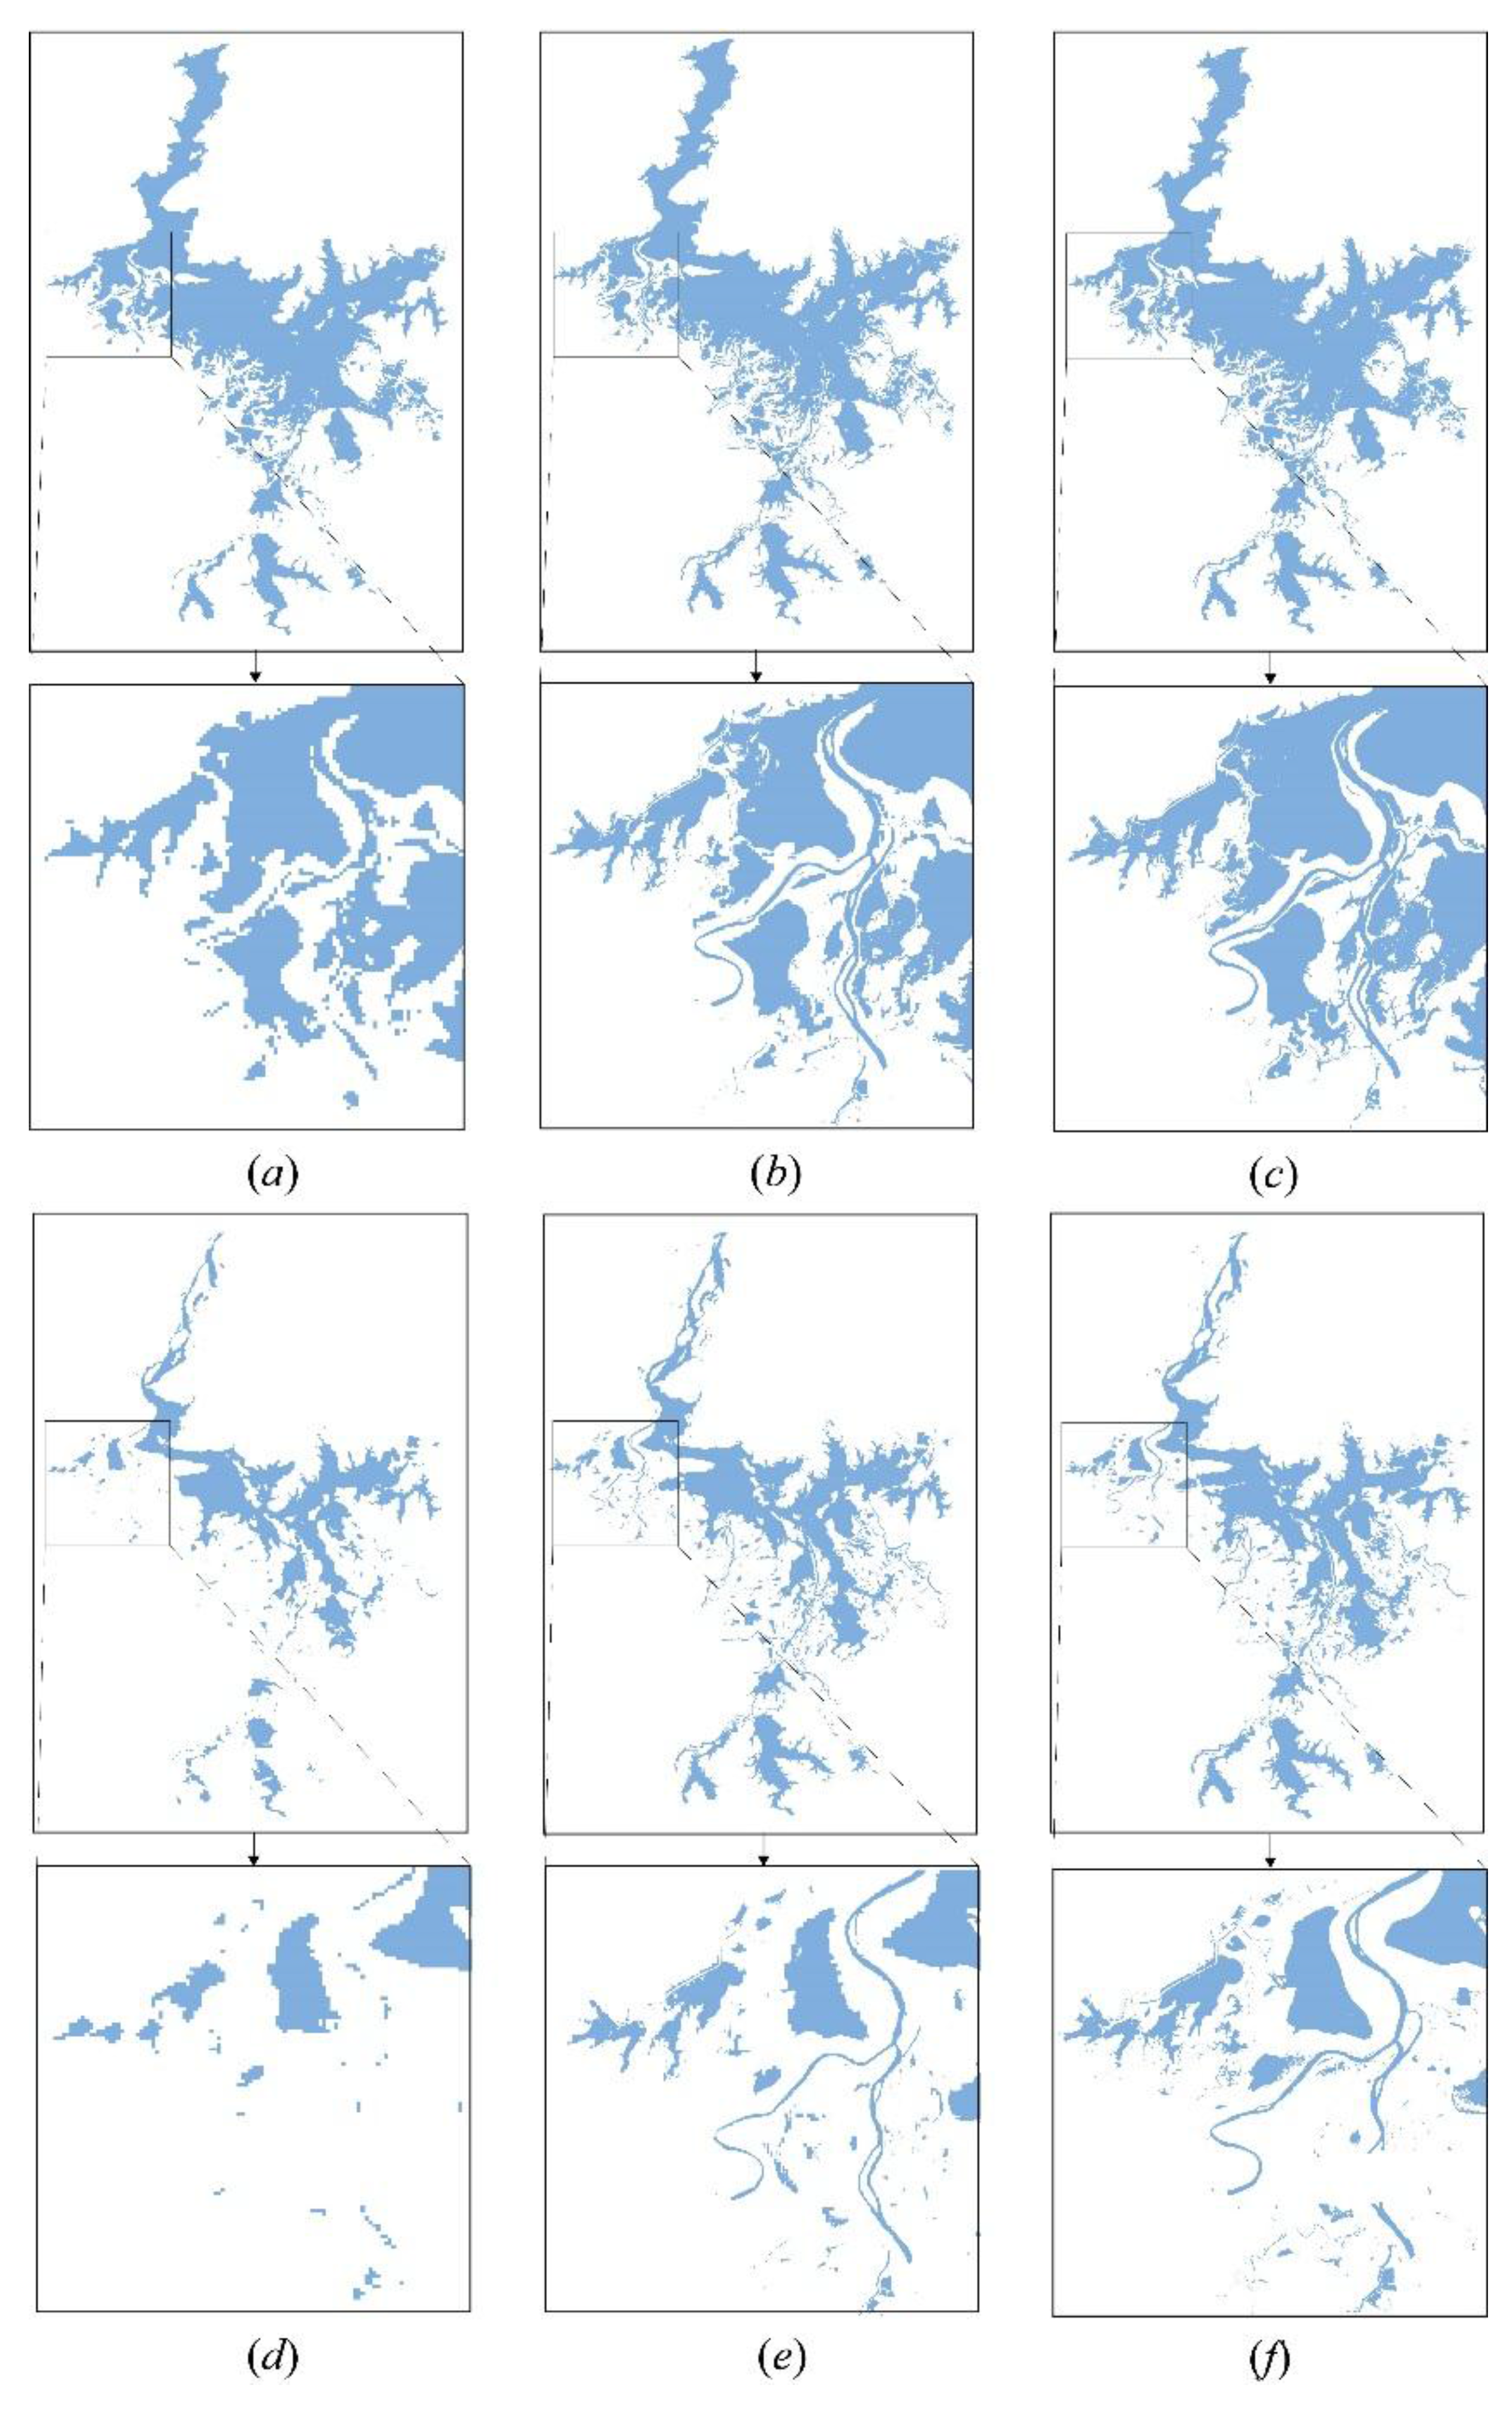
2.1. Water Delineation Method

Water surfaces are some of the most discernible targets in remote sensing due to their special spectral characteristics [34]. Electromagnetic energy is strongly absorbed by water, and this absorption is even stronger for near infrared (NIR) bands [35]. The combination of the green and NIR bands can differentiate water surface from most terrestrial features. McFeeters (1996) transformed thedigital number (DN) values of the two bands into a normalized difference water index (NDWI):
N D W I = D N G r e e n D N N I R D N G r e e n + D N N I R
where DNNIR and DNGreen indicate the DN value in the NIR and green bands of remote sensing imagery, respectively. In general, the acquired NDWI ranges from −1 to 1. Water features have positive values, whereas soil and terrestrial vegetation features have zero or negative values [35]. In this study, we selected NDWI to delineate water inundation, because this index has been demonstrated to be more efficient in the detection of water surfaces comparing to other algorithms [15]. Generally, the computed NDWI images present relatively homogeneous regions for water or non-water features, and NDWI histogram exhibits two different peaks with a valley in-between. According to the NDWI histogram, an optimum threshold value could be selected as the valley point. Then, surface water inundation extent can be delineated through segmentation algorithm based on selected optimal NDWI threshold [34].

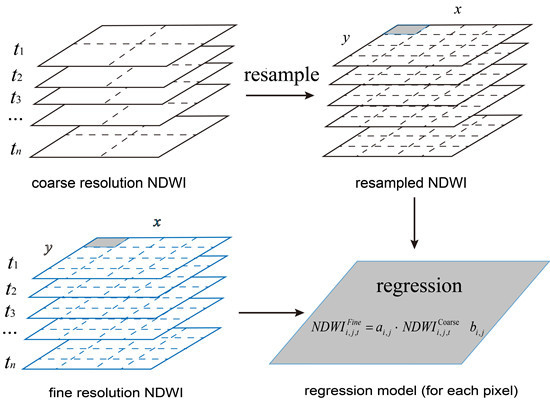
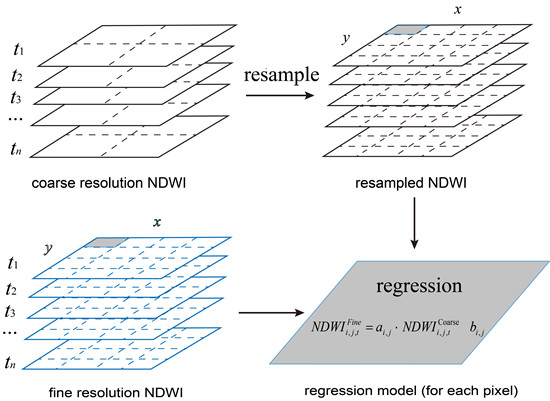
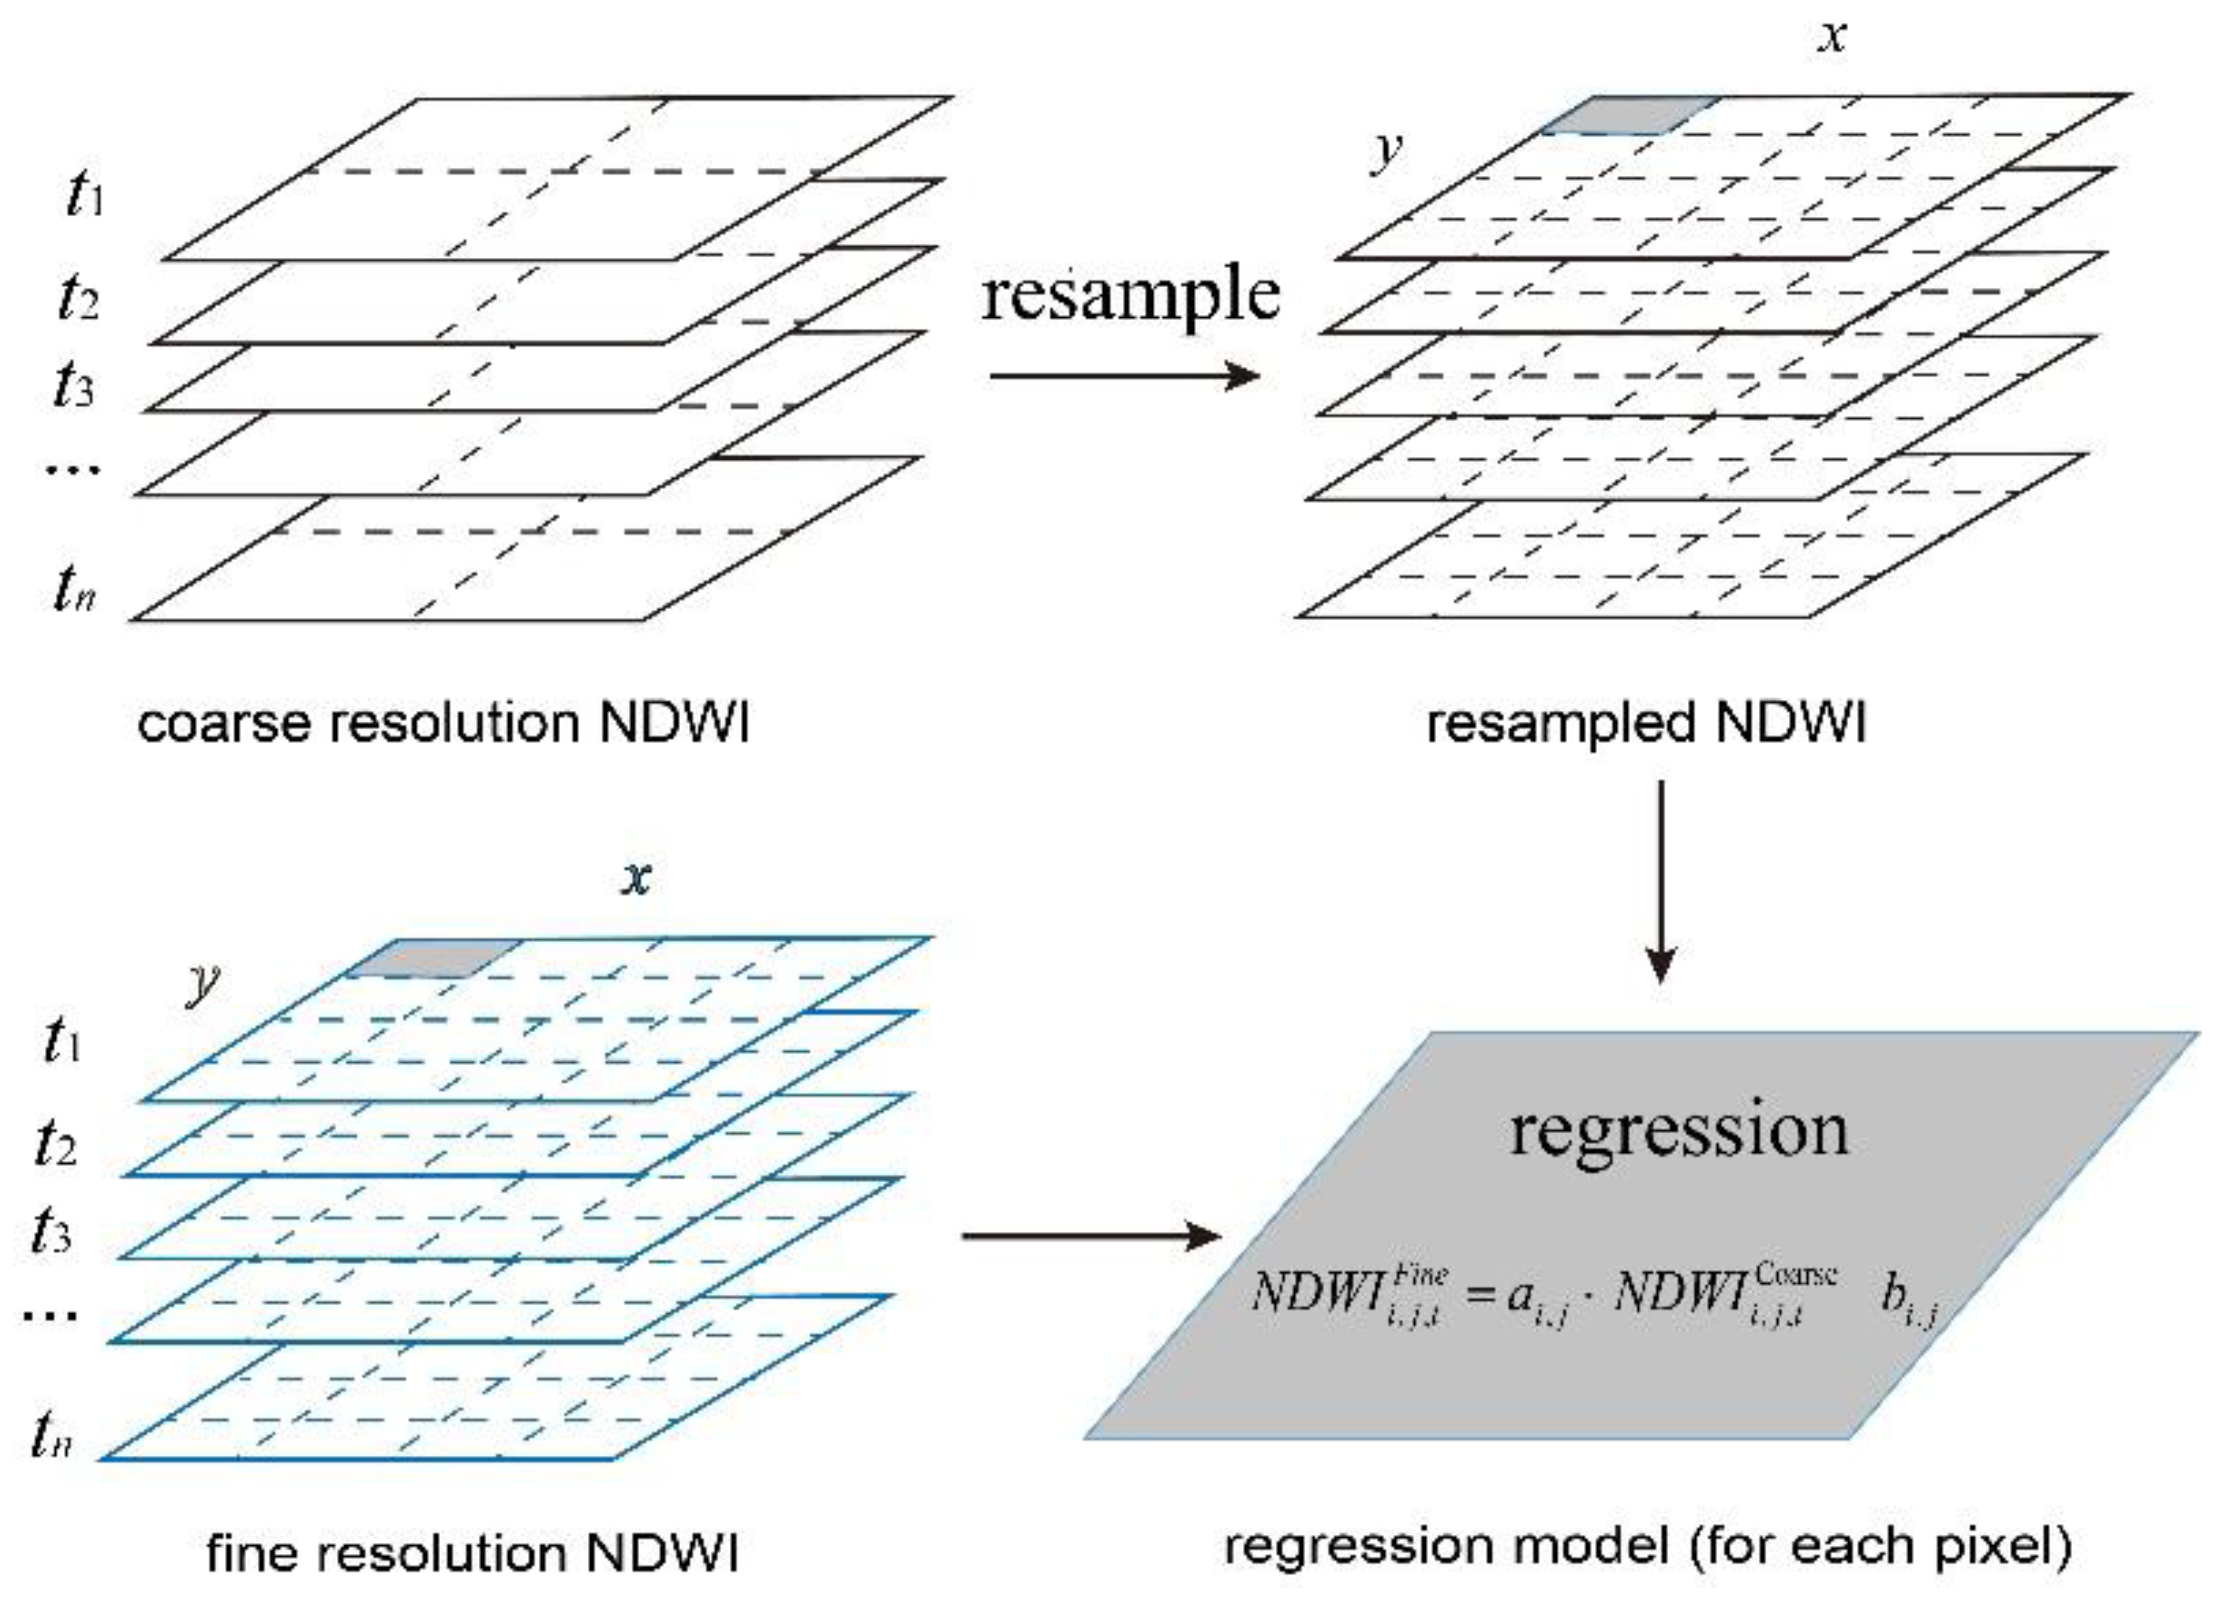
2.2. Downscaling Method: ALinear Calibration of the Coarse Resolution NDWI towards Fine Resolution NDWI

In this study, the downscaling method was generated by the NDWI-based statistical regression between coincident data from high-resolution data and low-resolution imagery. The method is based on the assumption that the relationships between fine resolution (e.g., Landsat TM/ETM+) and coarse resolution (e.g., MODIS) are linear and constant over time. The relations were then used at a coarse scale to generate more detail in the NDWI grids. Mathematically, the NDWI-based statistical regression method can be described as
N D W I i , j , t F i n e = a i , j N D W I i , j , t Coarse + b i , j
where N D W I i , j , t F i n e and N D W I i , j , t Coarse are the fine and coarse resolution NDWI, respectively, at time t and location (x, y), and ai,j and bi,j are the corresponding regression coefficients. The procedure consisted of three steps (Figure 1): Firstly, the data set of coarse resolution NDWI ( N D W I i , j , t Coarse ) is resampled to match the resolution of N D W I i , j , t F i n e . Secondly, the aggregated N D W I i , j , t Coarse are plotted against the N D W I i , j , t F i n e , and a linear regression model is established for each grid. After that, other coarse NDWI data are taken as the independent variable and are downscaled using the constructed regression models.
Figure 1. Schematic of downscaling algorithm used in this study.
Remotesensing 07 15813 g001

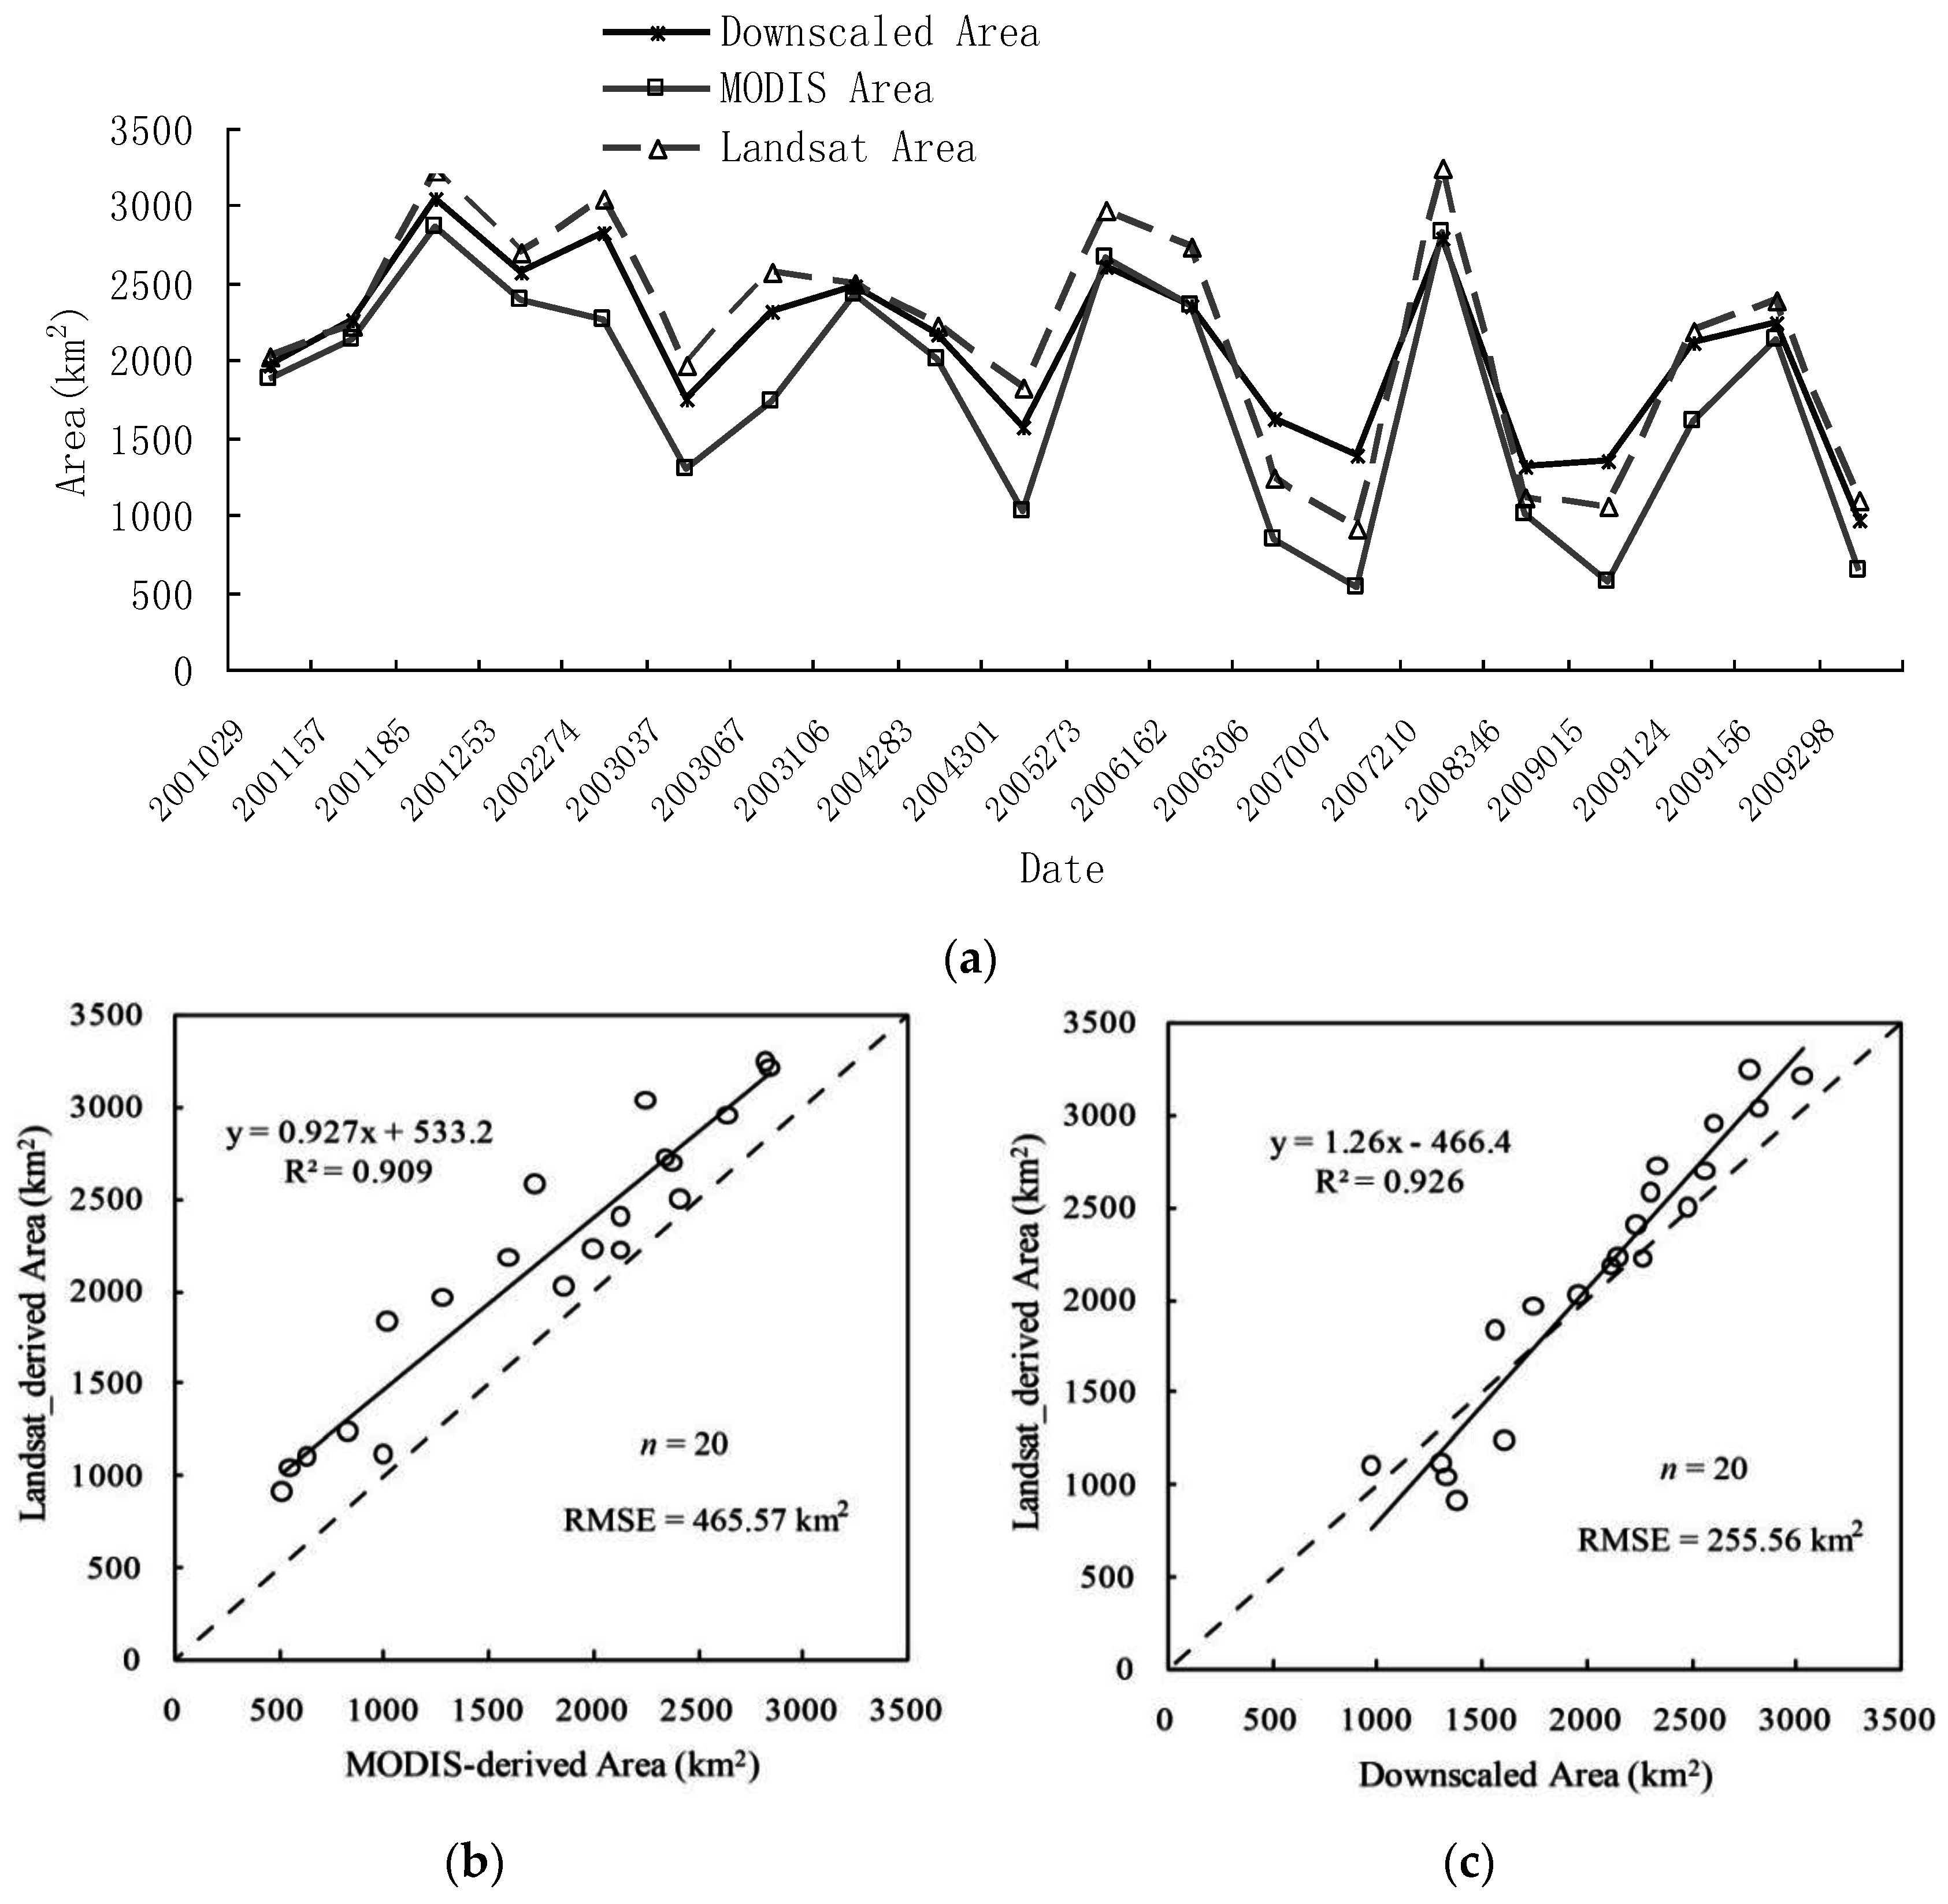
2.3. Evaluation Criteria

Currently, theevaluation criteria of the performance of a downscaling method are based on Root-Mean-Squared Error (RMSE), standard deviation, overall accuracy and so on [7,31]. These criteria are used to qualitatively evaluate the performance of downscaling method, which cannot depict the robustness or performance of spatial pattern for the water inundation extent. To comprehensivelye valuate the reliability of the presented downscaling method, we introduce the landscape metrics evaluation criterion of landscape-level comparison in addition to the traditional evaluation criterion of quantity-level comparison.

2.3.1. Quantity-Level Comparison

To evaluate the performance of the proposed downscaling method, the downscaled inundation results were compared to quasi-simultaneously acquired Landsat TM/ETM+ data. These evaluation statistics were quantified by coefficient of determination (R2), Mean Absolute Error (MAE), and Root-Mean-Squared Error (RMSE). The coefficient of determination ranges from 0 to 1, with higher values indicating better agreement.In addition, the agreement between the downscaled inundation maps and original MODIS (250 m) derived inundation maps was also captured through a confusion matrix from which omission error, commission error and overall accuracy were calculated [30,31]. The values for these evaluation criteria range from 0% to 100%, and the higher the overall accuracy the more perfect the delineation is for the water surface inundation [7].

2.3.2. Landscape-Level Comparison

Landscape metrics can be used as indicators for describing, characterizing and quantifying the pattern and configuration of landscape structures on various spatial scales [36,37,38]. Many landscape metrics are correlated and exhibit statistical interactions with each other [39]. It has been a challenge to choose the proper landscape metrics that would reflect the landscape properties. To further validate the spatial pattern efficiency of the downscaled inundation results, we selected a subset of metrics comprising a minimum set to adequately describe landscape pattern. In this study, the selection of optimal metrics was based on the conceptual basis of a key element in pattern measures [40]. Robert and Trani demonstrated that six main factors (i.e., area, classes, proportion of dominant class, polygons, polygon size variance, edge length and elevation range) encompass most of the landscape pattern [41]. In our case, there is only a sole water body landscape to investigate. Therefore, the above properties may be described by patch number, edge metrics, shape metrics and aggregation index. These metrics have also been proven useful for describing and comparing the spatial pattern of water body [42,43]. Number of patches (NP) could serve as a good spatial subdivision index of the entire landscape [44]. The water body with greater patches would have more spatial subdivision. Edge density (ED) metrics usually are the best considered as representing landscape configuration [40]. Mean patch fractal dimension index (FRAC_MN) and shape metrics (PARA_MN) could reflect the complexity of the shape of patches [44]. To increase the reliability of the measure of heterogeneity, aggregation index (AI) was also chosen to measure the connectivity of water body. Table 1 provides a brief description of the landscape metrics used in this study.
Table 1. A summary of the landscape metrics that were used to evaluate the proposed downscaling algorithm in this study.
Landscape MetricsMetric DescriptionUnitsEquation
Number of Patches (NP)number of patches in the water bodyNA N P = n
Edge Density (ED)the sum of the lengths (m) of all edge segments in the landscape, divided by the total inundation area(ha)m/ha E D = k = 1 m e k A (10,000)
ek: total length of edge
A: total landscape area
Fractal Mean Number (FRAC_MN)an area-weighted mean of the fractal dimension index for each patch in the inundation classNA F R A C _ M N = 2 ln ( 0.25 p i ) ln a i
Pi: perimeter of patch i;
ai: area of patch i.
Mean Perimeter-to-Area (PARA_MN)the mean ratio of the patch perimeter (m) to area (m2)NA P A R A _ M N = p i a i
Aggregation Index (AI)number of like adjacencies involving the corresponding class, divided by the maximum possible number of that.Percentage A I = [ g max g ] ( 100 )
g: number of like adjacencies between pixels of water patch;
max g : maximum number of like adjacencies between pixels of water patch.

3. Materials and Data Processing
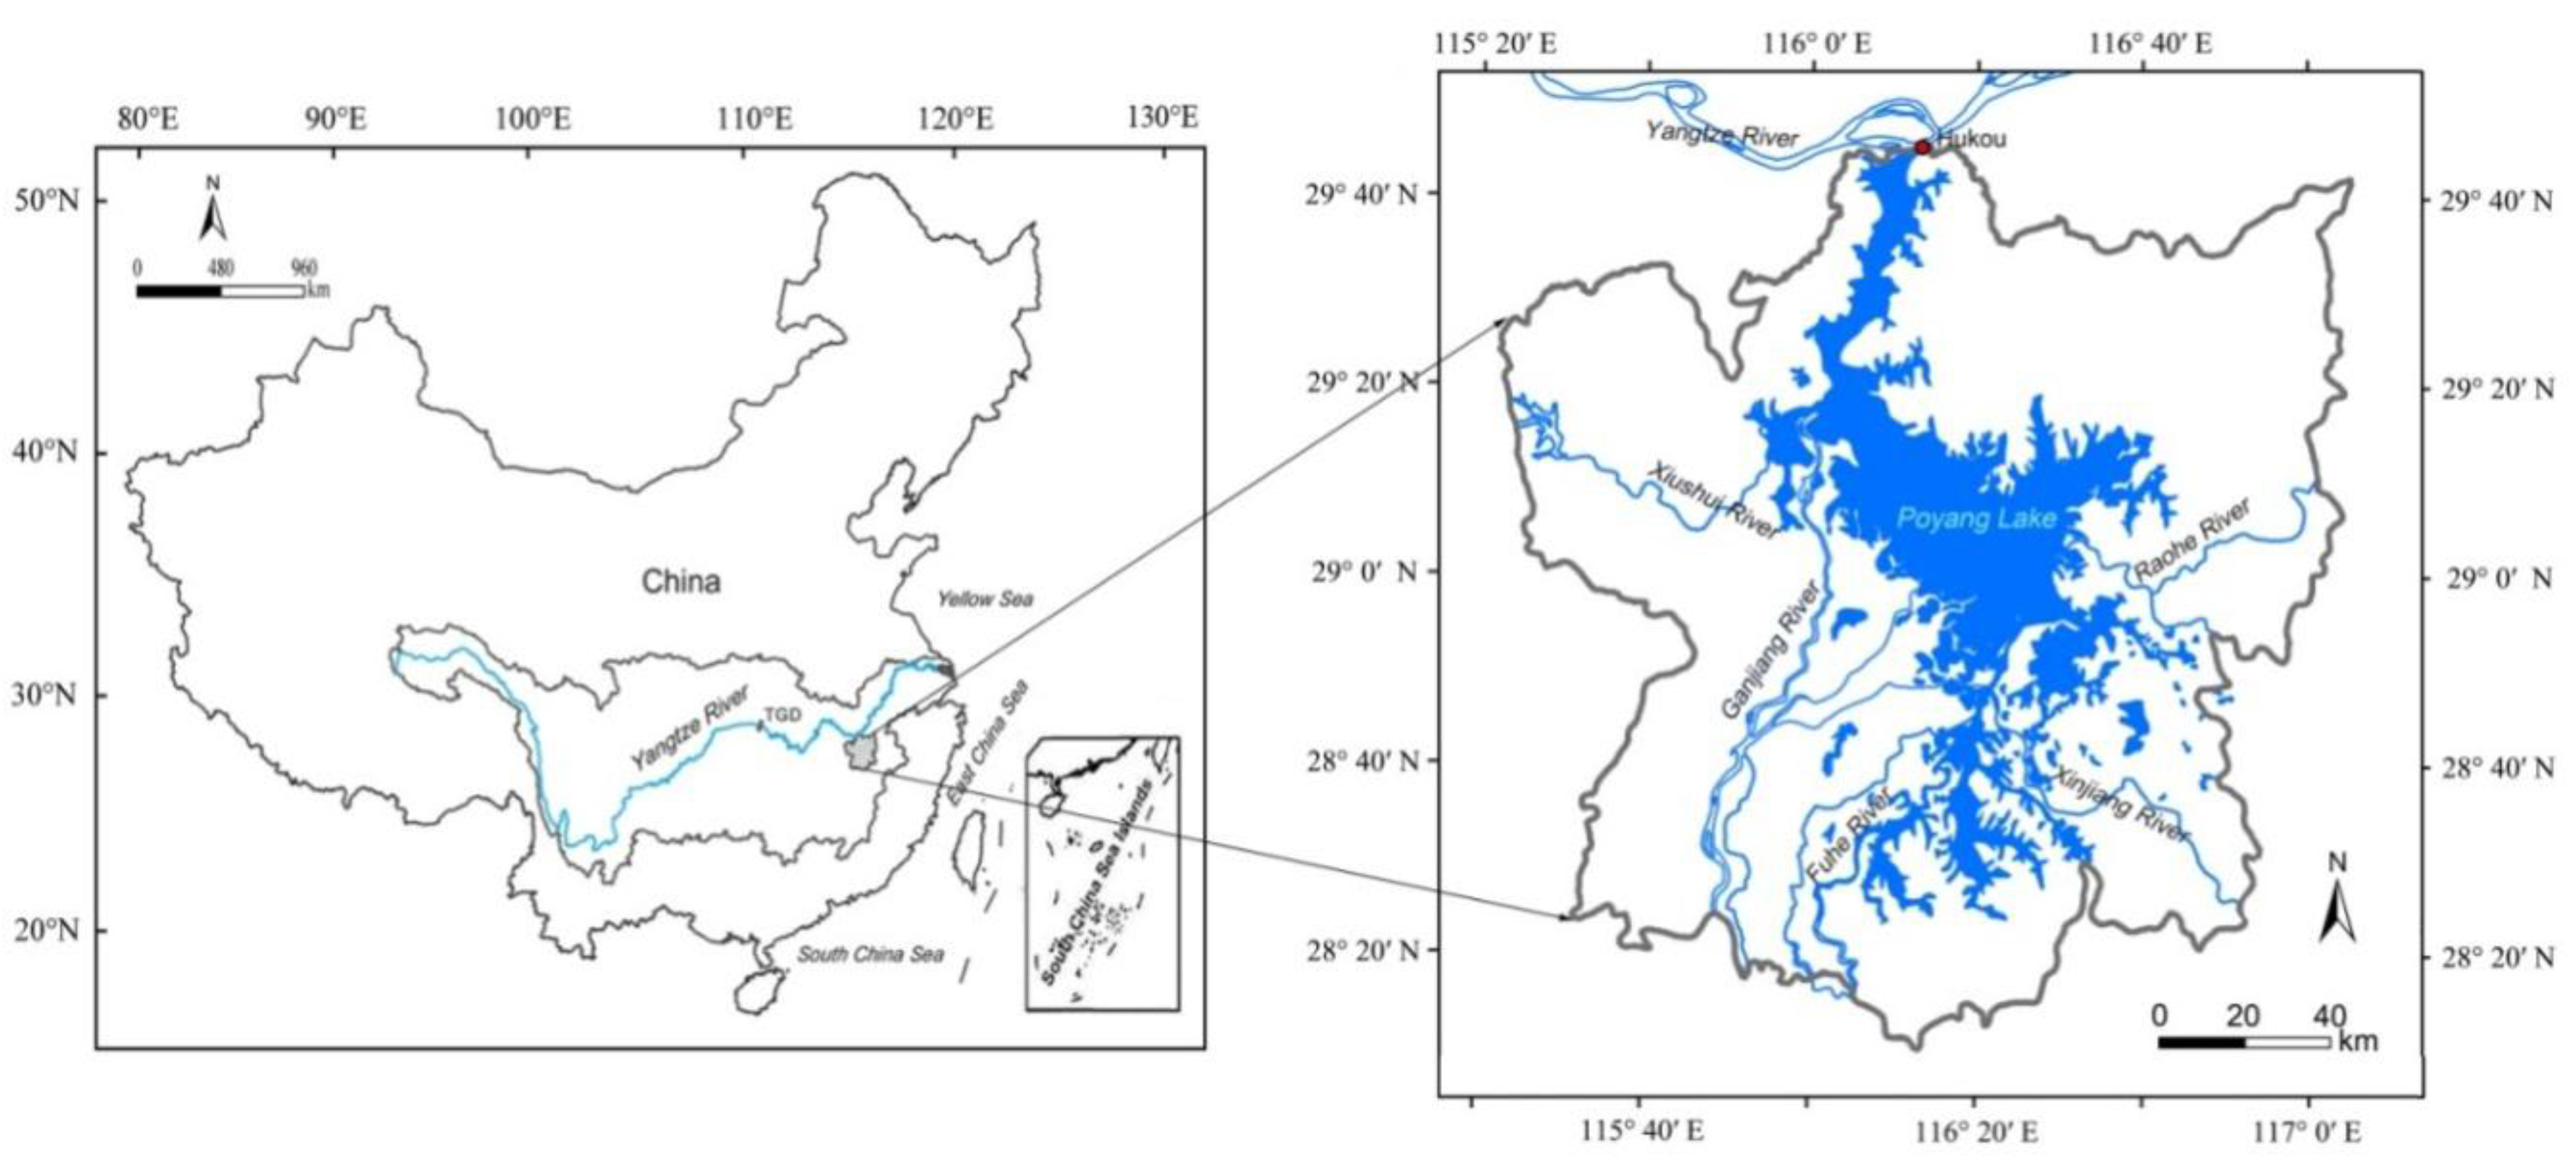
3.1. Study Area

We selected the Poyang Lake as the application region. The lake is located within the Poyang Lake Basin, which is a tributary of the Yangtze River in China (Figure 2). It is the primary component of the Poyang Lake wetland, which was included in the first batch of the Ramsar Convention List of Wetlands of International Importance [45]. Poyang Lake is 173 km long from north to south, with a lakeshore of 1200 km and an average water depth of 8.4 m [46]. As shown in Figure 2, water from the XiuheRiver, GanjiangRiver, FuheRiver, XinjiangRiver and RaoheRiver flows into the Yangtze River through this lake. PoyangLake has a seasonal, reverse-flow system from the Yangtze River which greatly contributes to the complexity of its yearly inundation variation [47]. In high-water period (April--September), the five tributaries are flooded due to concentrated rainfall, resulting in a maximum lake surface of over 3000 km2 [48]. While in low-water period (October--March), the lake forms a remarkably scattered distribution of water body. At that time, the lake loses as much as 90% of its water, and water surface shrinks to less than 1000 km2 [46]. These complex water characteristics provide a more thorough test for the downscaling method.
Figure 2. Location of the study area (Poyang Lake) in this paper. The lake locates in the Hunan Province of China with the area of 3903 km2.
Remotesensing 07 15813 g002

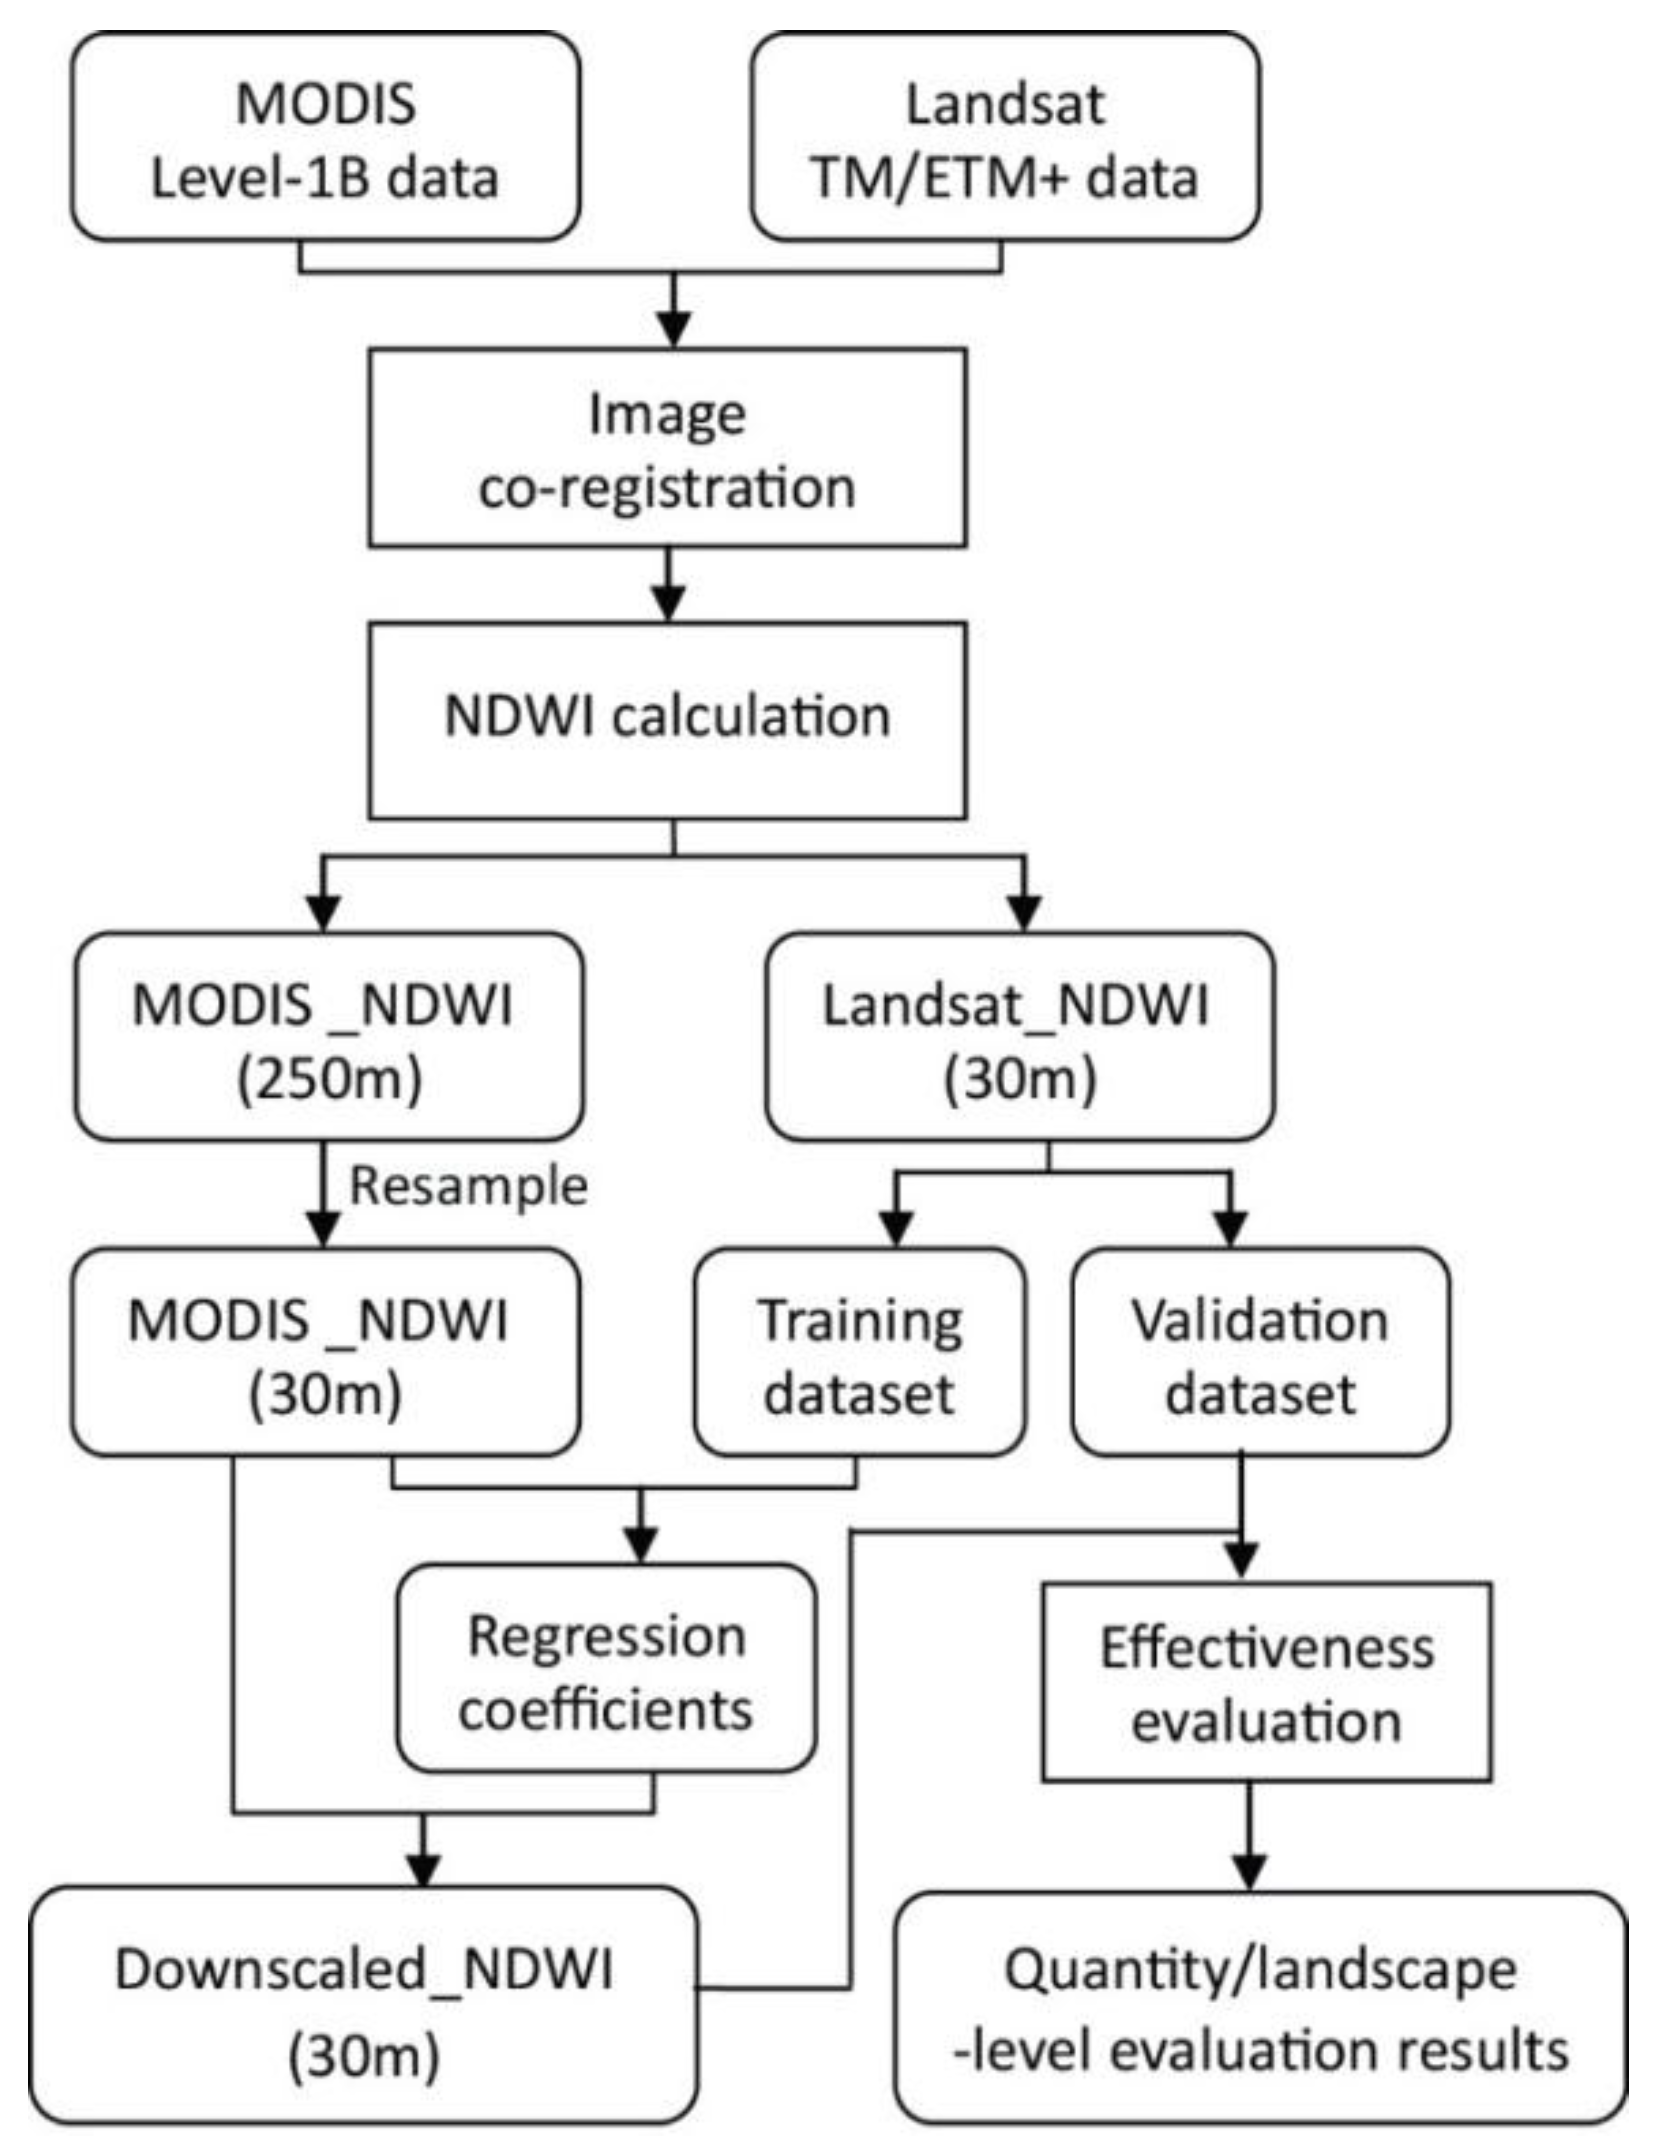
3.2. Data Acquisition and Processing

MODIS Level-1B data (MOD02_QKM and MOD02_HKM) of the PoyangLake from 2000 to 2012 were acquired from NASA Goddard Space Flight Center (GSFC) (http://ladsweb.nascom.nasa.gov). A total of 466 cloud-free images were used in this study (Table 2). MOD02_QKM and MOD02_HKM datasets contain Level-1B calibrated and geo-located radiances for visible and near infrared (NIR) band. MOD02_HKM was extracted for digital number (DN)values in green band (0.54–0.57 μm) at 500 m resolution, and MOD02_QKM was extracted for DN values in NIR band (0.84–0.88 μm) at 250 m resolution. MODIS green band was resampled into 250 m to match the resolution of MODIS NIR band. All the acquired MODIS images were projected onto the Universal Transverse Mercator (UTM) with a World Geodetic System (WGS-84) datum.
In addition, 55 scenes (high-water period: 24; low-water period: 31) of cloud-free Landsat TM/ETM+ images with same overpass time as MODIS data were selected for downscaling the lower-resolution (250 m) MODIS observations. The Landsat series data were acquired from the Global Land Cover Facility (GLCF) (http://glcf.umd.edu/data/landsat/), and have a finer spatial resolution of 30 m. It should be noted that the Scan Line Corrector (SLC) compensating for the forward motion of the satellite in the ETM+ sensor failed on 31 May 2003. In this study, we used an available gap-filling extension toolbox (landsat-gapfill.sav) in the ENVI software to remove stripe noises for SLC-off images [49]. TM/ETM+ band 2 (green band) and band 4 (NIR band) were used to delineate the relative accurate lake surface. To ensure spatially matched dataset, all images were co-registrated to each other with a root mean square error (RMSE) within 0.5 pixels.
Table 2. Terra MODIS and Landsat MSS/TM/ETM+ images used in this study.
Satellite ImagerySpatial Resolution (m)Spectral Resolution (μm)BandTemporal CoverageScene
EOS-TerraMOD02_HKM500Green: 0.54–0.5742000–2012466
MOD02_QKM250NIR: 0.84–0.882
Landsat TM/ETM+30Green: 0.52–0.60255
NIR: 0.76–0.904
Figure 3 shows the detailed data processing flow. In each grid of the acquired MODIS and Landsat TM/ETM+ imagery, the NDWI was first calculated using Equation (1). Secondly, MODIS NDWI was resampled to match the resolution of Landsat TM/ETM+ NDWI using a nearest neighbor method. For the calculated 55 scenes of Landsat NDWI data, 35 of which combined with quasi-simultaneously acquired MODIS NDWI were then selected randomly (high-water period: 16 scenes; low-water period: 19 scenes) for constructing the regression function at each 30 m grid according to Equation (2). From these regression functions, the coefficients ai,j and bi,j were obtained, and the MODIS NDWI was downscaled over the entire study period. Finally, the remaining 20 scenes were used for efficiency assessment of the proposed method. The specific processing program consists of three steps, described in the follow sections: (1) Delineate the water surface inundation using threshold segmentation algorithm for original Landsat_NDWI (30 m), simultaneous MODIS_NDWI (250 m) and downscaled Landsat_NDWI (30 m); (2) According to delineated inundation, calculate the five landscape metrics (NP, ED, FRAC_MN, PARA_MN and AI) at the class-level through the Fragstats 4.2 software (McGarigal and Marks, 2002); (3) Qualitatively and quantitatively (by R2, MAE, RMSE and landscape metrics) compare downscaled inundation results with the original Landsat and MODIS inundation results.
Figure 3. Processing scheme in this study. Boxes with rounded corners represent inputs/outputs, and rectangles show methodological steps.
Remotesensing 07 15813 g003

4. Results and Discussion

To comprehensively evaluate the accuracy of the proposed downscaling method and its reliability, qualitatively and visually interpret was first performed for inundation results. For this purpose, two different inundation scenarios are compared in this study (Figure 4). One is the high-water period of 30 September 2005 (top images in Figure 4). The other is the low-water period of 6 February 2003 (bottom images in Figure 4). Three columns in Figure 4 are inundation observations from the original Landsat (30 m), MODIS (250 m) and downscaled MODIS (30 m), respectively. Compared with original Landsat (30 m) inundation results (Figure 4c,f), MODIS (250 m) inundation results (Figure 4a,d) show the deficiency of inundation observations. Especially in the low-water period (Figure 4d), some rivers and sub-lakes in PLNNR show bad consistency in shapes and sizes, and some inundated water bodies cannot be observed. While through downscaling, the spatial visual pattern of the inundation results of downscaled MODIS (30 m) (Figure 4b,e) and original Landsat (30 m) are highly matched to each other, although there is a slight difference. All downscaled MODIS inundation extents are improved compared to the original MODIS results in terms of inundation spatial distribution. Some undetected water bodies in Figure 4a,d can also be clearly observed. It indicated that the downscaling technique can effectively capture the sub-grid’s spatial distribution of water inundation within the MODIS pixel. Apart from visual interpretation, several pixel-based spatial accuracy metrics were also calculated to measure their agreement or disagreement. In general, MODIS (250 m) derived results underestimate the extent of water surface inundation compared to that of Landsat (30 m). Taking the high-water period (30 September 2005) as an example, omission error is significantly reduced from 8.52% at 250 m to 2.47% at 30 m. Commission error is reduced slightly from 1.24% to 0.91%. Likewise, overall accuracy increases from 92.12% to 95.37%, indicating a satisfactory result.
Figure 4. Qualitative comparisons of the delineated inundation extent among the images from, MODIS (250 m) (left column), downscaled-MODIS (30 m)(middle column) and Landsat (30 m) (right column) in Poyang Lake. Subfigure indicates the enlarged inundation condition in Poyang Lake National Nature Reserve (PLNNR). The top images (ac) are acquired from the high-water period of 30 September 2005. The bottom images (df) are acquired from the low-water period of 6 February 2003.
Remotesensing 07 15813 g004
Figure 5a is the line chart among the MODIS_NDWI derived inundation area, Landsat_NDWI derived inundation area and downscaled_NDWI derived inundation area from 2000 to 2012. In general, the downscaled results show good agreement with the original Landsat TM/ETM+ and MODIS derived results. That is to say, the downscaled results could effectively capture the similar inundation area with the high resolution remote sensing data. Judging from the magnitude of inundation, downscaled inundation area overall appears to be lower than the original Landsat derived area, but higher than the MODIS derived inundation area. However, it should be noted that the downscaled area appears to be higher than the Landsat derived area during some extreme low-water periods (e.g., 2007007 and 200915). This uncertainty may stem from several possible sources associated with the proposed downscaling method, including the co-registration between MODIS and Landsat images and the different thresholding processes for original and downscaled NDWI.
Figure 5. Quantity-level comparison results of the delineated inundation area. The top figure (a) shows time series for the MODIS-derived, Landsat-derived and MODIS downscaled inundation area from 2000 to 2009. The bottom figures show the performance of the downscaling methods: the vertical axes show the Landsat_NDWI derived inundation area. The horizontal axes show (b) the MODIS_NDWI derived inundation area, and (c) the downscaled MODIS_NDWI derived inundation area. The perfect agreement line (1:1) and linear regression lines are also plotted.
Remotesensing 07 15813 g005
Figure 5b,c show the scatter plots of Landsat TM/ETM+ derived inundation area versus those from MODIS derived and downscaled MODIS derived inundation area. It clearly shows that a strong correlation between the downscaled MODIS derived area and the original Landsat TM/ETM+ derived area. The downscaling procedure has increased the R2 (from 0.909 to 0.926) and reduced RMSE (from 465.57 km2 to 255.56 km2) and MAE (from 406.08 km2 to 216.88 km2). In addition, the scatter points between Landsat-derived and downscaled MODIS-derived inundation area better concentrate along the line of 1:1, indicating that the downscaled MODIS inundation is of higher accuracy than that the original MODIS inundation and the downscaling approach is very promising.
To further quantitatively evaluate the spatial reliability of the downscaled high-resolution inundation map, the selected five landscape metrics were calculated for different resolution images. The corresponding evaluation results are given in Table 3, whereas scatter plots of different landscape metrics between Landsat (30 m) inundation and MODIS (250 m/30 m) inundation are illustrated in Figure 6. As shown in Table 3, there is notably considerable lower R2, high RMSE and MAE between original Landsat (30 m) inundation and MODIS (250 m) inundation for all selected five landscape metrics. However, these statistical values between Landsat (30 m) and downscaled MODIS (30 m) inundation are changed. Specific changes include: increase in R2 (NP: 0.144 to 0.914; ED: 0.147 to 0.556; FRAC_MN: 0.180 to 0.673; PARA_MN: 0.069 to 0.323; AI: 0.279 to 0.515), while there is a great reduction in RMSE and MAE (see in Table 3). This is also supported by the scatter plot diagrams of Figure 6. It indicated that the downscaled inundationmap can reproduce the spatial pattern of the original Landsat (30 m) inundation to a greater degree than the MODIS (250 m) inundation.
Figure 6. Landscape-level comparison results of the delineated inundation area (each of the points in the scatter represents a time snapshot of the validation dataset). (ae) show the comparison results of analysis for NP, ED, FRAC_MN, PARA_MN and AI, respectively.
Remotesensing 07 15813 g006
Furthermore, we examine the downscaling behavior of landscape metrics in an attempt to better evaluate the proposed downscaling method. Firstly, NP is the number of patches in the water inundation, which could quantify information regarding patch size and distribution. Through downscaling, the results showed that the mean NP increased from 238 to 3856. To some extent, a landscape with more patches would have greater spatial fragmentation. Therefore, this change indicates that the water body landscape becomes more spatially segregated when the MODIS (250 m) downscaled to 30 m. Likewise, the change in mean NP can be attributed more to the overall decrease in pixel size.
Secondly, edge density (ED) metric is total length of edge per unit area, which serves as a good spatial configuration index of the entire landscape. Correspondingly, ED metrics quantify length and distribution of the amount of edge between patches. Whendownscalingis applied, average edge density grew from 1.72 m/ha to 6.08 m/ha. This variation indicates that the water body landscape becomes more spatially heterogeneous after downscaling from 250 m to 30 m, similar to that demonstrated by patch number.
Thirdly, FRAC_MN metric is the mean patch fractal dimension of water body patches within the landscape. FRAC_MN is a shape complexity measure, which approaches 1 for shapes with simple perimeters and 2 for complex shapes. According to the results, there was a slight increase from 1.03 to 1.06 in average FRAC_MN. The mean shape index values for the patches in downscaled inundation are greater than original MODIS inundation, indicating that many water patches are irregularly shaped through downscaling. This is also supported by the mean PARA_MN metric (the mean ratio of the patch perimeter to area). It provides a measure of shape irregularity. Whendownscalingis applied, average PARA_MN value also greatly increased from 110.14 to 853.61. The change in PARA_MN metric suggested the significant impacts on inundation spatial pattern, which could effectively depict the detailed inundation information.
Table 3. Statistical measures of spatial reliability evaluation for the downscaling method.
Landscape MetricsAverage ValueLandsat (30 m) versus MODIS (250 m)Landsat (30 m) versus Downscaled-MODIS (30 m)
MODIS (250 m)MODIS (30 m)Landsat (30 m)R2RMSEMAER2RMSEMAE
Number of Patches (NP)238385640140.1443724.743618.580.914318.89270.68
Edge Density (ED)1.726.087.450.1474.424.360.5561.541.38
Fractal Mean Number (FRAC_MN)1.031.061.050.1800.0230.0220.6730.0050.004
Mean perimeter-to-area (PARA_MN)110.14853.61867.290.069743.81743.470.32323.2119.34
Aggregation index (AI)89.5396.5797.230.2797.647.030.5151.161.02
Similar results were found for the aggregation index (AI). Aggregation index is the percentage of neighboring pixel, being the same land class, based on single-count method. There was an increase in average AI from 89.53% to 96.57% due to the downscaling process. This change in average aggregation from low value to high value suggests that the water body landscape became more connective after downscaling, because the downscaling process changed the factors of landscape pattern.
In conclusion, the above results reveal that downscaling processes had significant effects on all landscape metrics. The five landscape metrics (NP, ED, FRAC_MN, PARA_MN and AI) for original MODIS-derived inundation were less obvious than those from downscaled inundation. The change direction of the water body landscape has been towards the spatial pattern of Landsat (30 m). The investigation showed that the original MODIS could only show general inundation information in landscape pattern. However, the inundation extent from downscaled results could get details and precise information for landscape analysis.

5. Conclusions

Terrestrial surface water is essential to terrestrial ecosystems and human civilization. Inundation maps with accurate, high spatial resolution are crucial for improving our understanding of regional-scale hydrology. In this study, we presented a novel downscaling method based on the NDWI statistical regression algorithm to generate small-scale resolution inundation map from coarse data. The downscaling is a linear calibration of the NDWI index from MODIS imagery to Landsat imagery, which is based on the assumption that the relationships between fine resolution and coarse resolution are invariable. The relationships were then used at a coarse scale to generate more detail in the NDWI grids. The proposed method was tested over the Poyang Lake of China. To evaluate the efficiency of the proposed algorithm, we make the qualitative (visual) and quantitative (through statistical and landscape metrics) comparison between the delineated inundation at original MODIS (250 m), Landsat (30 m) and downscaled MODIS (30 m). The results indicated that the downscaled MODIS (30 m) inundation showed significant improvement over the original MODIS observations when compared with coincident Landsat (30 m) inundation observations. Thus, a number of conclusions can be drawn based on this work: (1) The downscaling algorithm developed in this study is quite easily implemented and feasible. It can effectively capture the spatial details of the inundation in Poyang Lake; (2) Landscape metrics provide valuable information for the interpretation of landscape patterns, which can be used as novel measurements for evaluating the downscaling method for water inundation. To the best of our knowledge, this is the first time landscape metrics have been introduced into accuracy assessment of downscaled results. In addition, the presented downscaling algorithm is generic in nature and is applicable to other small-scale lakes. Since two MODIS instruments provided two daytime measurements per day. Even though, after removing the cloud and vegetation contaminated scenes, there was many MODIS data available during a month. Therefore, it is possible to obtain near-real-time and high-spatial-resolution inundation maps over small-scale lake with the proposed method, which is highly significant in regional flood/drought dynamic monitoring and water resource assessments for decision-makers.

Acknowledgments

This work was supported by the State Key Program of National Natural Science of China (41430855), National Natural Science Foundation of China (41401506), 973 Program of the National Basic Research Program of China (2012CB417003), and Key Program of Nanjing Institute of Geography and Limnology of the Chinese Academy of Sciences (NIGLAS2012135001). We thank Miss H Ji for pre-processing of satellite data, and Dr H Feng for providing the excellent technical assistance.

Author Contributions

GuipingWu carried out data processing, data analysis and wrote the paper. Yuanbo Liu proposed the main idea, offered guidance to complete the work and made revisions to the manuscript.

Conflicts of Interest

The authors declare no conflicts of interest.

References

  1. Yu, G.E.; Harrison, S.P. Holocene changes in atmospheric circulation patterns as shown by lake status changes in northern Europe. Boreas 1995, 24, 260–268. [Google Scholar] [CrossRef]
  2. Beeton, A.M. Large freshwater lakes: Present state, trends, and future. Environ. Conserv. 2002, 29, 21–38. [Google Scholar] [CrossRef]
  3. Williamson, C.E.; Saros, J.E.; Vincent, W.F.; Smol, J.P. Lakes and reservoirs as sentinels, integrators, and regulators of climate change. Limnol. Oceanogr. 2009, 54, 2273–2282. [Google Scholar] [CrossRef]
  4. Finlayson, M.; Cruz, R.D.; Davidson, N. Ecosystems and Human Well-Being: Welands and Water; World Resources Institute: Washington, DC, USA, 2005; Chapter 20. [Google Scholar]
  5. Nel, J.L.; Roux, D.J.; Abell, R.; Ashton, P.J.; Cowling, R.M.; Higgins, J.V. Progress and challenges in freshwater conservation planning. Aquat. Conserv. 2009, 19, 474–485. [Google Scholar] [CrossRef]
  6. Li, W.B.; Du, Z.Q.; Ling, F.; Zhou, D.B.; Wang, H.L.; Gui, Y.M.; Sun, B.Y.; Zhang, X.M. A comparison of land surface water mapping using the normalized difference water index from TM, ETM+ and ALI. Remote Sens. 2013, 5, 5530–5549. [Google Scholar] [CrossRef]
  7. Fluet-Chouinard, E.; Lehner, B.; Rebelo, L-M.; Papa, F.; Hamilton, S.K. Development of a global inundation map at high spatial resolution from topographic downscaling of coarse-scale remote sensing data. Remote Sens. Environ. 2015, 158, 348–361. [Google Scholar] [CrossRef]
  8. Alsdorf, D.E.; Rodriguez, E.; Letternmaier, D.P. Measuring surface water from space. Rev. Geophys. 2007, 45, RG2002. [Google Scholar] [CrossRef]
  9. Birkett, C.M. Synergistic remote sensing of Lake Chad: variability of basin inundation. Remote Sens. Environ. 2000, 72, 218–236. [Google Scholar] [CrossRef]
  10. Alsdorf, D.E.; Lettenmaier, D.P. Tracking fresh water from space. Science 2003, 301, 1492–1494. [Google Scholar] [CrossRef] [PubMed]
  11. Cazenave, A.; Milly, P.C.D.; Douville, H.; Benveniste, J.; Kosuth, P.; Lettenmaier, D. Space techniques used to measure change in terrestrial waters. EOS Trans. 2004, 85. [Google Scholar] [CrossRef]
  12. Du, Z.; Li, W.; Zhou, D.; Tian, L.; Liang, F.; Wang, H.; Gui, Y.; Sun, B. Analysis of Landsat-8 OLI imagery for land surface water mapping. Remote Sens. Lett. 2014, 5, 672–681. [Google Scholar] [CrossRef]
  13. Smith, L.C. Satellite remote sensing of river inundation area, stage, and discharge: A review. Hydrol. Process. 1997, 11, 1427–1439. [Google Scholar] [CrossRef]
  14. Frazier, P.S.; Page, K.J. Water body detection and delineation with Landsat TM data. Photogramm. Eng. Remote Sens. 2000, 66, 1461–1467. [Google Scholar]
  15. Jain, S.K.; Singh, R.D.; Jain, M.K.; Lohani, A.K. Delineation of flood-prone areas using remote sensing techniques. Water Resour. Manag. 2005, 19, 333–347. [Google Scholar] [CrossRef]
  16. Huang, C.; Chen, Y.; Wu, J.; Li, L.; Liu, R. An evaluation of Suomi NPP-VIIRS data for surface water detection. Remote Sens. Lett. 2015, 6, 155–164. [Google Scholar] [CrossRef]
  17. Hang, C.; Chen, Y.; Wu, J. Mapping spatio-temporal flood inundation dynamics at large river basin scale using time-series flow data and MODIS imagery. Int. J. Appl. Earth Obs. Geoinform. 2014, 26, 350–362. [Google Scholar] [CrossRef]
  18. Brakenridge, G.R.; Anderson, E. MODIS-based flood detection, mapping and measurement: The potential for operational hydrological applications. Transbound. Floods: Reduc. Risks Flood Manag. 2006, 72, 1–12. [Google Scholar]
  19. Huang, S.F.; Li, J.G.; Xu, M. Water surface variations monitoring and flood hazard analysis in Dongting Lake area using long-term Terra/MODIS data time series. Nat. Hazards 2012, 62, 93–100. [Google Scholar] [CrossRef]
  20. Feng, L.; Hu, C.M.; Chen, X.L.; Cai, X.B.; Tian, L.Q.; Gan, W.X. Assessment of inundation changes of Poyang Lake using MODIS observations between 2000 and 2010. Remote Sens. Environ. 2012, 121, 80–92. [Google Scholar] [CrossRef]
  21. Li, S.; Sun, D.; Glodberg, M.; Stefanidis, A. Derivation of 30-m-resolution water maps from TERRA/MODIS and SRTM. Remote Sens. Environ. 2013, 134, 417–430. [Google Scholar] [CrossRef]
  22. Lyons, E.A.; Sheng, Y.W.; Smith, L.C.; Li, J.L.; Hinkel, K.M.; Lenters, J.D.; Wang, J.D. Quantifying sources of error in multitemporal multisensor lake mapping. Int. J. Remote Sens. 2013, 34, 7887–7905. [Google Scholar] [CrossRef]
  23. Bryant, R.G.; Rainey, M.P. Investigation of flood inundation on playas within the Zone of Chotts, using a time-series of AVHRR. Remote Sens. Environ. 2002, 82, 360–375. [Google Scholar] [CrossRef]
  24. Atkinson, P.M. Downscaling in remote sensing. Int. J. Appl. Earth Obs. Geoinform. 2013, 22, 106–114. [Google Scholar] [CrossRef]
  25. Bierkens, M.F.P.; Finke, P.A.; Willigen, D.E. Upscaling and Downscaling Methods for Environmental Research; Kluwer Academic: Dordrech, The Netherlands, 2000. [Google Scholar]
  26. Galantowicz, J. High-resolution flood mapping from low-resolution passive microwave satellite observations. In Proceedings of the IEEE International Geoscience and Remote Sensing Symposium, Toronto, ON, Canada, 2002; pp. 1499–1502.
  27. Aires, F.; Papa, F.; Prigent, C. A long-term, high-resolution wetland dataset over the AmazonBasin, downscaled from a multi-wavelength retrieval using SAR data. J. Hydrometeorol. 2013, 14, 594–607. [Google Scholar] [CrossRef]
  28. Ling, F.; Xiao, F.; Du, Y.; Xue, H.P.; Ren, X.Y. Waterline mapping at the subpixel scale from remote sensing imagery with high-resolution digital elevation models. Int. J. Remote Sens. 2008, 29, 1809–1815. [Google Scholar] [CrossRef]
  29. Huang, C.; Chen, Y.; Wu, J.P. DEM-based modification of pixel-swapping algorithm for enhancing floodplain inundation mapping. Int. J. Remote Sens. 2014, 35, 365–381. [Google Scholar] [CrossRef]
  30. Aires, F.; Papa, F.; Prigent, C. Characterization and space-time downscaling of the inundation extent over the Inner Niger Delta using GIEMS and MODIS data. J. Hydrometeorol. 2014, 15, 171–192. [Google Scholar] [CrossRef]
  31. Pontius, J.R.G.; Millones, M. Death to Kappa: Birthof quantity disagreement and allocation disagreement for accuracy assessment. Int. J. Remote Sens. 2011, 32, 4407–4429. [Google Scholar] [CrossRef]
  32. Chen, H.; Xu, C.Y.; Guo, S.L. Comparison and evaluation of multiple GCMs, statistical downscaling and hydrological models in the study of climate change impacts on runoff. J. Hydrol. 2012, 434, 36–45. [Google Scholar] [CrossRef]
  33. Maraun, D.; Wetterhall, F.; Ireson, A.M.; Chandler, R.E.; Kendon, E.J.; Widmann, M.; Brienen, S.; Rust, H.W.; Sauter, T.; Themeßl, M.; et al. Precipitation downscaling under climate change: Recent developments to bridge the gap between dynamical models and the end user. Rev. Geophys. 2010, 48, 1–38. [Google Scholar] [CrossRef]
  34. Liu, Y.B.; Song, P.; Peng, J.; Ye, C. A physical explanation of the variation in threshold for delineating terrestrial water surface from multi-temporal images: Effects of radiometric correction. Int. J. Remote Sens. 2012, 33, 5862–5875. [Google Scholar] [CrossRef]
  35. McFeeters, S.K. The use of the normalized difference water index (NDWI) in the delineation of open water features. Int. J. Remote Sens. 1996, 17, 1425–1432. [Google Scholar] [CrossRef]
  36. Turner, M.G. Spatial and temporal analysis of landscape patterns. Landscape. Ecol. 1990, 4, 21–30. [Google Scholar] [CrossRef]
  37. Wu, J. Effects of changing scale on landscape patterns analysis: Scaling relations. Landsc. Ecol. 2004, 19, 125–138. [Google Scholar] [CrossRef]
  38. Walz, U. Monitoring of landscape change and functions in Saxony (Eastern Germany)-Methods and indicators. Ecol. Indic. 2008, 8, 807–817. [Google Scholar] [CrossRef]
  39. Gustafson, E.J. Quantifying landscape spatial pattern: What is the state of the art? Ecosystem 1998, 1, 143–156. [Google Scholar] [CrossRef]
  40. Liu, Y.B.; Nishiyama, S.; Kusaka, T. Examining Landscape dynamics at a watershed scale using landsat TM imagery for detection of wintering hooded crane decline in Yashiro, Japan. Environ. Manag. 2003, 31, 365–376. [Google Scholar] [CrossRef] [PubMed]
  41. Robert, H.G.J.; Trani, M.K. Key elements of landscape pattern measures. Environ. Manag. 1999, 23, 477–481. [Google Scholar]
  42. De Beer, Y.; van Aarde, R.J. Do landscape heterogeneity and water distribution explain aspects of elephant home range in southern Africa’s arid savannas? J. Arid Environ. 2008, 72, 2017–2025. [Google Scholar] [CrossRef]
  43. Cao, X.; Ding, S. Landscape pattern dynamics of water body in Kaifeng city in the 20th century. J. Geogr. Sci. 2005, 15, 106–114. [Google Scholar] [CrossRef]
  44. McGarigal, K.; Marks, B. Spatial Pattern Analysis Program for Categorical Maps: Computer Software; University of Massachusetts: Amherst, MA, USA, 2002. [Google Scholar]
  45. Finlayson, M.; Harris, J.; McCartney, M.; Lew, Y.; Zhang, C. Report on Ramsar Visit to Poyang Lake Ramsar Site, PR China. Available online: http://archive.ramsar.org/pdf/Poyang_lake_report_v8.pdf (accessed on 12 April 2010).
  46. Wu, G.P.; Liu, Y.B. Capturing variations in inundation with satellite remote sensing in a morphologically complex, large lake. J. Hydrol. 2015, 523, 14–23. [Google Scholar] [CrossRef]
  47. Hui, F.; Xu, B.; Huang, H.; Yu, Q.; Gong, P. Modelling spatial-temporal change of Poyang Lake using multitemporal Landsat imagery. Int. J. Remote Sens. 2008, 29, 5767–5784. [Google Scholar] [CrossRef]
  48. Shankman, D.; Keim, B.D.; Song, J. Flood frequency in China’s Poyang Lake region: Trends and teleconnections. Int. J. Climatol. 2006, 26, 1255–1266. [Google Scholar] [CrossRef]
  49. USGS. What Is Landsat 7 ETM+ SLC-off Data? Available online: http://landsat.usgs.gov/Landsat_7_ETM_SLC_off_data.php (accessed on 8 November 2013).

