Article

Retrieval of Soil Water Content in Saline Soils from Emitted Thermal Infrared Spectra Using Partial Linear Squares Regression

1
Xinjiang Institute of Ecology and Geography, CAS, Urumqi 830011, China
2
University of Chinese Academy of Sciences, Beijing 100049, China
3
Faculty of Agriculture, Shizuoka University, Shizuoka 422-8529, Japan
*
Author to whom correspondence should be addressed.
Remote Sens. 2015, 7(11), 14646-14662; https://doi.org/10.3390/rs71114646
Submission received: 15 August 2015 / Revised: 21 October 2015 / Accepted: 27 October 2015 / Published: 4 November 2015

Abstract

:
Timely information of soil water content is urgently required for monitoring ecosystem processes and functions at various scales. Although remote sensing has already provided many practical applications of retrieving soil moisture, it is largely limited to visible/near infrared or microwave domains and few studies have ever been conducted on the thermal infrared. In addition, soil salinization in arid land further complicates the situation when retrieving soil moisture from emitted spectra. In this study, we attempt to fill the knowledge gap by retrieving the soil moisture of saline soils with various salt contents. This was based on lab-controlled experiments for spectroscopy using a Fourier Transform Spectrometer (2–16 µm). Partial least squares regression (PLSR) has been applied in analyses based on either original measured or first-order derivative spectra. The results revealed that the PLSR model using first-order derivative spectra, which had a determination coefficient (R2) of 0.71 and a root mean square error (RMSE) of 3.3%, should be recommended for soil moisture estimation, judged from several statistical criteria. As thermal infrared wavelengths identified in this study are contained in several current available satellite sensors, the PLSR models should have great potential for large-scale application despite extensive validations are needed in future studies.

Graphical Abstract

1. Introduction

Soil moisture is a key parameter for exchanging mass and energy between the atmosphere and the terrestrial surface, monitoring ecosystem function [1] or scheduling irrigation [2]. It has also been publicly recognized as an important variable in enabling vegetation growth [3], especially in arid regions [4]. For this reason, timely and promptly monitoring the soil moisture content is highly desirable.
Compared to traditional approaches, which are generally time consuming, laborious and only able to provide point data, remote sensing provides a novel path of estimating soil moisture [5,6]. Numerous studies have already been conducted to estimate soil moisture using various remote sensing data at regional and global scales [7,8,9,10,11,12]. Among them, most studies have attempted to investigate soil moisture using spectral data from optical to microwave domains at various spatial scales [11,13,14,15,16,17,18].
However, although soil moisture being widely studied at visible-near infrared [19,20,21] or microwave bands [4,22,23,24], few researchers have ever set eyes on the thermal infrared domain [25,26]. This is mainly because of the sophisticated technology, complicated design [27] and difficult-to-operate equipment that is required in this domain [28]. Even so, a few previous studies, either laboratory or field-measured, have revealed that soil moisture content had a significant effect on the land surface emissivity, especially in the 8–9.5 μm range [29,30], which indicates a promising possibility to retrieve soil moisture inversely. With the rapid progress of thermal infrared spectroscopy, emitted spectra are growing to be an alternative data source for retrieving soil moisture.
Salt-affected soil is a common existence in arid land, where soil-salt and water jointly affected spectra and caused huge anomalies in estimating soil salinity or moisture content [31]. Despite fairly satisfactory results from Wang et al. [20], who acquired various level of soil salt content based on hyperspectral reflectance, Farifteh [32] emphasized the difficulty of estimating soil moisture from complex soil, especially mixed with soil salt. Compared with visible-near infrared bands expressing reflective characteristics of an object, thermal infrared shows more emission properties, which are affected mainly by temperature [33,34]. Soil water exercises a great influence on soil surface temperature [35], thus, in turn, the thermal infrared band should have the potential to retrieve the soil water content.
On the other hand, Fourier Transform Infrared (FTIR) spectroscopy is commonly used to distinguish chemical components in many fields through the vibrational characteristics of their structural chemical bonds [36]. Haberhauer et al. [37] used FTIR data to determine quantitatively the composition of soil organic matter, and Tatzber et al. [38] quantified carbonate in soil samples using FTIR spectroscopy. Thus, thermal infrared spectra might have great potential for measuring soil water content due to the distinctive vibrational characteristics of water molecules. However, to the best of our knowledge, only a few studies on soil water content have been performed in the thermal infrared domain based on spectral emissivity [25,39]; thus, there are still challenges related to retrieving soil moisture content for saline soils in arid land based on the thermal infrared domain.
Many data-mining approaches have been applied for spectral-based analysis, e.g., principal component regression (PCR), artificial neural networks (ANN), or partial least squares regression (PLSR) [40,41,42,43,44]. Among these methods, PLSR is an effective statistical method for mining the intricate, frequently-used data in chemometrics, owing to its ability to analyze data with many noisy, collinear and even incomplete variables [42]. Existing research claimed that PLSR had the capability to model linear relationships between spectra and soil properties, and has been used successfully for mapping soil properties [45,46]. Furthermore, Huang et al. [14] found it helpful to deal with high-correlated datasets to avoid the potential overfitting problem that commonly occurred with multiple linear regressions. Spectra data, which generally hold hundreds of bands, were extremely likely to contain correlated data; thus, PLSR was applied to estimate soil moisture content in this study.
In addition, deriving information from spectral data generally involves various spectral processing, such as spectral unmixing [47,48], band ratio [49], absorption feature analysis [50] and derivative spectra [20]. As first-order derivative spectra can highlight the signal effectively [20], they will hence also be employed in this study.
The main target of this study is therefore to develop an effective model for predicting soil moisture from complex soil mixtures by explicitly exploring the response of thermal infrared spectra with different soil moisture conditions for typical saline soils in arid land. Specific aims of the study include: (1) evaluating the potentiality of applying thermal infrared bands for estimating the soil moisture content; (2) developing a predictive model based on thermal infrared bands using the PLSR model; and (3) exploring the possibilities of monitoring and mapping soil moisture over arid land at large scales.

2. Materials and Methods

2.1. Experimental Designs

Two sets of soil were collected from field for lab-controlled experiments. One set was saline desert soil collected from a typical inland river basin on the western edge of China (44.29°N, 87.94°E), where the mean annual precipitation is 184 mm and the temperature is 6.6°C [51], and estimated evapotranspiration is ca. 1840 mm [52]. Topsoil (up to 20 cm) was collected in the field and transported to a laboratory where it was air-dried for several weeks before sifting. Two sieves, 0.2 mm and 2 mm, were used to create artificially three groups of soil samples with different particle sizes to simulate various soil surface roughnesses. Top-opened cylinder containers with 15 cm diameters were filled at different heights from 1 to 10 cm at a pace of each centimeter to resemble the diversity of soil moisture contents due to different evaporation rates of soils at different heights. Soil particle sizes and soil column heights were employed to create as many complex field conditions as possible.
The second set of soils were Aeolian sandy soils sampled from the Gurbantunggut Desert (44.43°N, 87.90°E), where the mean annual precipitation ranged from 80 to 160 mm and had a pan evaporation of 2000 mm [53]. Haloxylon ammodendron is the dominant species in this region. The soil here contained less salt, which is why it was later used as the basic soil when creating artificial samples with different soil salt contents. Similarly, the topsoil (up to 20 cm) was collected and air-dried for several weeks before being sifted through a 2 mm sieve. All debris such as dry branches and fallen leaves were removed.
Both soil sets were investigated for their physical and chemical properties before creating artificial samples with different salt contents and moisture levels (Table 1). The first set of soils was sandy loam with the clay estimated to be 12.95%, while the second set of soils contained more sands. As field-collected soils contained preferably only Na2SO4 type salts, this type of salt was applied to create different salt contents for artificial samples at seven levels (0%, 1%, 3%, 5%, 10%, 15% and 20%). Each level had three repeats. Salts were ground into powder and combined with basic soils.
Table 1. Soil chemical properties of different sets of field-collected soils.
SamplepHEC (mS/cm)Total Salt (mg/g)Cl (mg/g)SO42− (mg/g)Ca2+ (mg/g)K+ (mg/g)Mg2+ (mg/g)Na+ (mg/g)CO32− (mg/g)HCO3 (mg/g)
>2 mm8.644.8622.700.0513.081.640.200.055.110.000.18
0.2–2 mm8.705.7927.200.0315.691.650.200.056.470.000.18
0–0.2 mm8.406.2729.400.0416.402.090.200.056.960.000.14
Aeolian sandy soil9.09 0.28 1.43 0.04 0.21 0.07 0.09 0.02 0.31 0.11 0.31
Note: >2 mm, 0.2–2 mm and 0–0.2 mm represent the particle size of the saline desert soil.
The gravimetric method was applied to monitor the temporally varied soil water contents (SW) of all samples. Distilled water was added gently and evenly to all the samples using a watering can to avoid damaging the soil surface until soil water content reached 20%. Then, the natural evaporating process began, and the soil water content and soil-emitted radiance of each sample were synchronously recorded five times in chronological sequence.

2.2. Spectral Emission Recording

The Design and Prototypes (D&P) Inc. Model 102 Fourier Transform infrared (FTIR) Spectrometer [54] was used to record soil emitted radiance. This spectrometer consists of Indium Antimonide (InSb) and Mercury Cadmium Telluride and covers the wavelength domain of 2 to 16 μm, and thermal infrared bands (8–14 μm, 188 contiguous spectral bands) were addressed here [55]. The input optic is 2.54 cm in diameter with a 4.8 degree expanding field of view, which gives a 7 cm diameter spot at about 70 cm height in this study. The instrument was set up with a spectral resolution of 4 cm−1 and scans to co-add of eight. For each measurement, three types of raw data were obtained: warm blackbody (WBB), cold blackbody (CBB), and sample intensity. The sample radiance could be calculated by calibrating WBB and CBB, and the unit was W/ (m2·μm·sr). The function “Fit Planck to Radiance” in the software was used to calculate each sample temperature. Soil samples were heated to ca. 303 k using a quartz tungsten halogen lamp, which was a practical solution for accurate emissivity measuring on one hand while minimizing water loss through soil evaporation as possible on the other hand. Due to the noise of environment and instrument, the five points moving average method was used to eliminate noise signal [56].
Radiance of blackbody is governed by Planck’s Law with the sample temperature:
B ( λ , T ) = c 1 λ 5 ( e c 2 / λ T 1 )
where the unit is mW/m2·μm·sr); λ is wavelength in μm; T is the temperature of emitting surface in deg·K; c1 = 1.191044 × 10⁻⁵ (mW/(m2·sr·cm−4)); and c2 = 1.438769 (cm·deg·K).
Relative emissivity (denoted as Er in this study), which has been further normalized with the emitted radiance at 7–7.5 μm (a domain with emissivity approximated to 1), has been applied in this study in order to eliminate further measuring noises.
Based on the relative emission spectra, the first-order derivative spectra form was calculated as follows:
DE = E r ( λ + Δ λ ) E r ( λ ) Δ λ
where DE is the first-order derivative of Er.

2.3. Partial Least Squares Regression

PLSR is a mature method that is widely used in chemometrics [57,58]. Combining multiple linear regression (MLR) and principal components analysis (PCA), PLSR specifies a linear relationship between numerous dependent variables (Y) and predictor variables (X) by compressing the numerous measured collinear spectral variables to a few non-correlated principal components (PCs) [57,59]. In general, stepwise regression was applied to choose each relevant spectral wavelength, and then cross-validation was carried out to determine the number of components and calculate the spectral loading of each principal component [42]. This is because the spectra had massively redundant information, and stepwise regression could be used to select each band from a multi-linear model based on their statistical significance with the dependent variable, which calculates the P value of an F-statistic to test the model before a selection is determined.
Cross-validation is a frequent-used model diagnostic tool for assessing the result of a statistical analysis. This method was employed here to test the predictive significance of each PLSR component and determine the optimal number of components by minimizing the predicted residual sums of squares (PRESS) [60]. Based on previous literature for identifying training and test sets [61,62], 85% of all data were used for calibration; the remaining data were used for validation.
The performance of PLSR models was evaluated using the Akaike Information Criterion (AIC), which was commonly used to examine the model’s effectiveness [63,64]. Because of the small sample size [65], we applied the corrected version of the AIC (AICc) as a criterion for model selection. It was calculated as follows:
L = n / 2 ( 1 + log ( 2 P i ) + log ( ( r r ) / n ) )
A I C = 2 ( L / n ) + 2 k / n
A I C c = A I C + 2 k ( k + 1 ) / ( n k 1 )
where n is the number samples; L is the logarithmic likelihood value; r is residual vector; and k is the number of features used in the prediction. The best model should have the smallest AICc.
In addition, PLSR models are also evaluated with the determination coefficient (R2), root mean square error (RMSE), and the ratio of performance to deviation (RPD). Models have no prediction ability with RPD < 1.4 [66,67].

3. Results

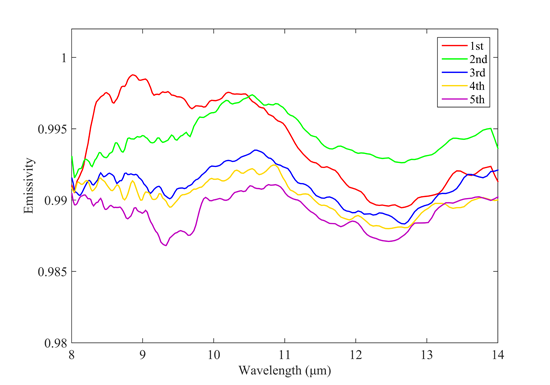
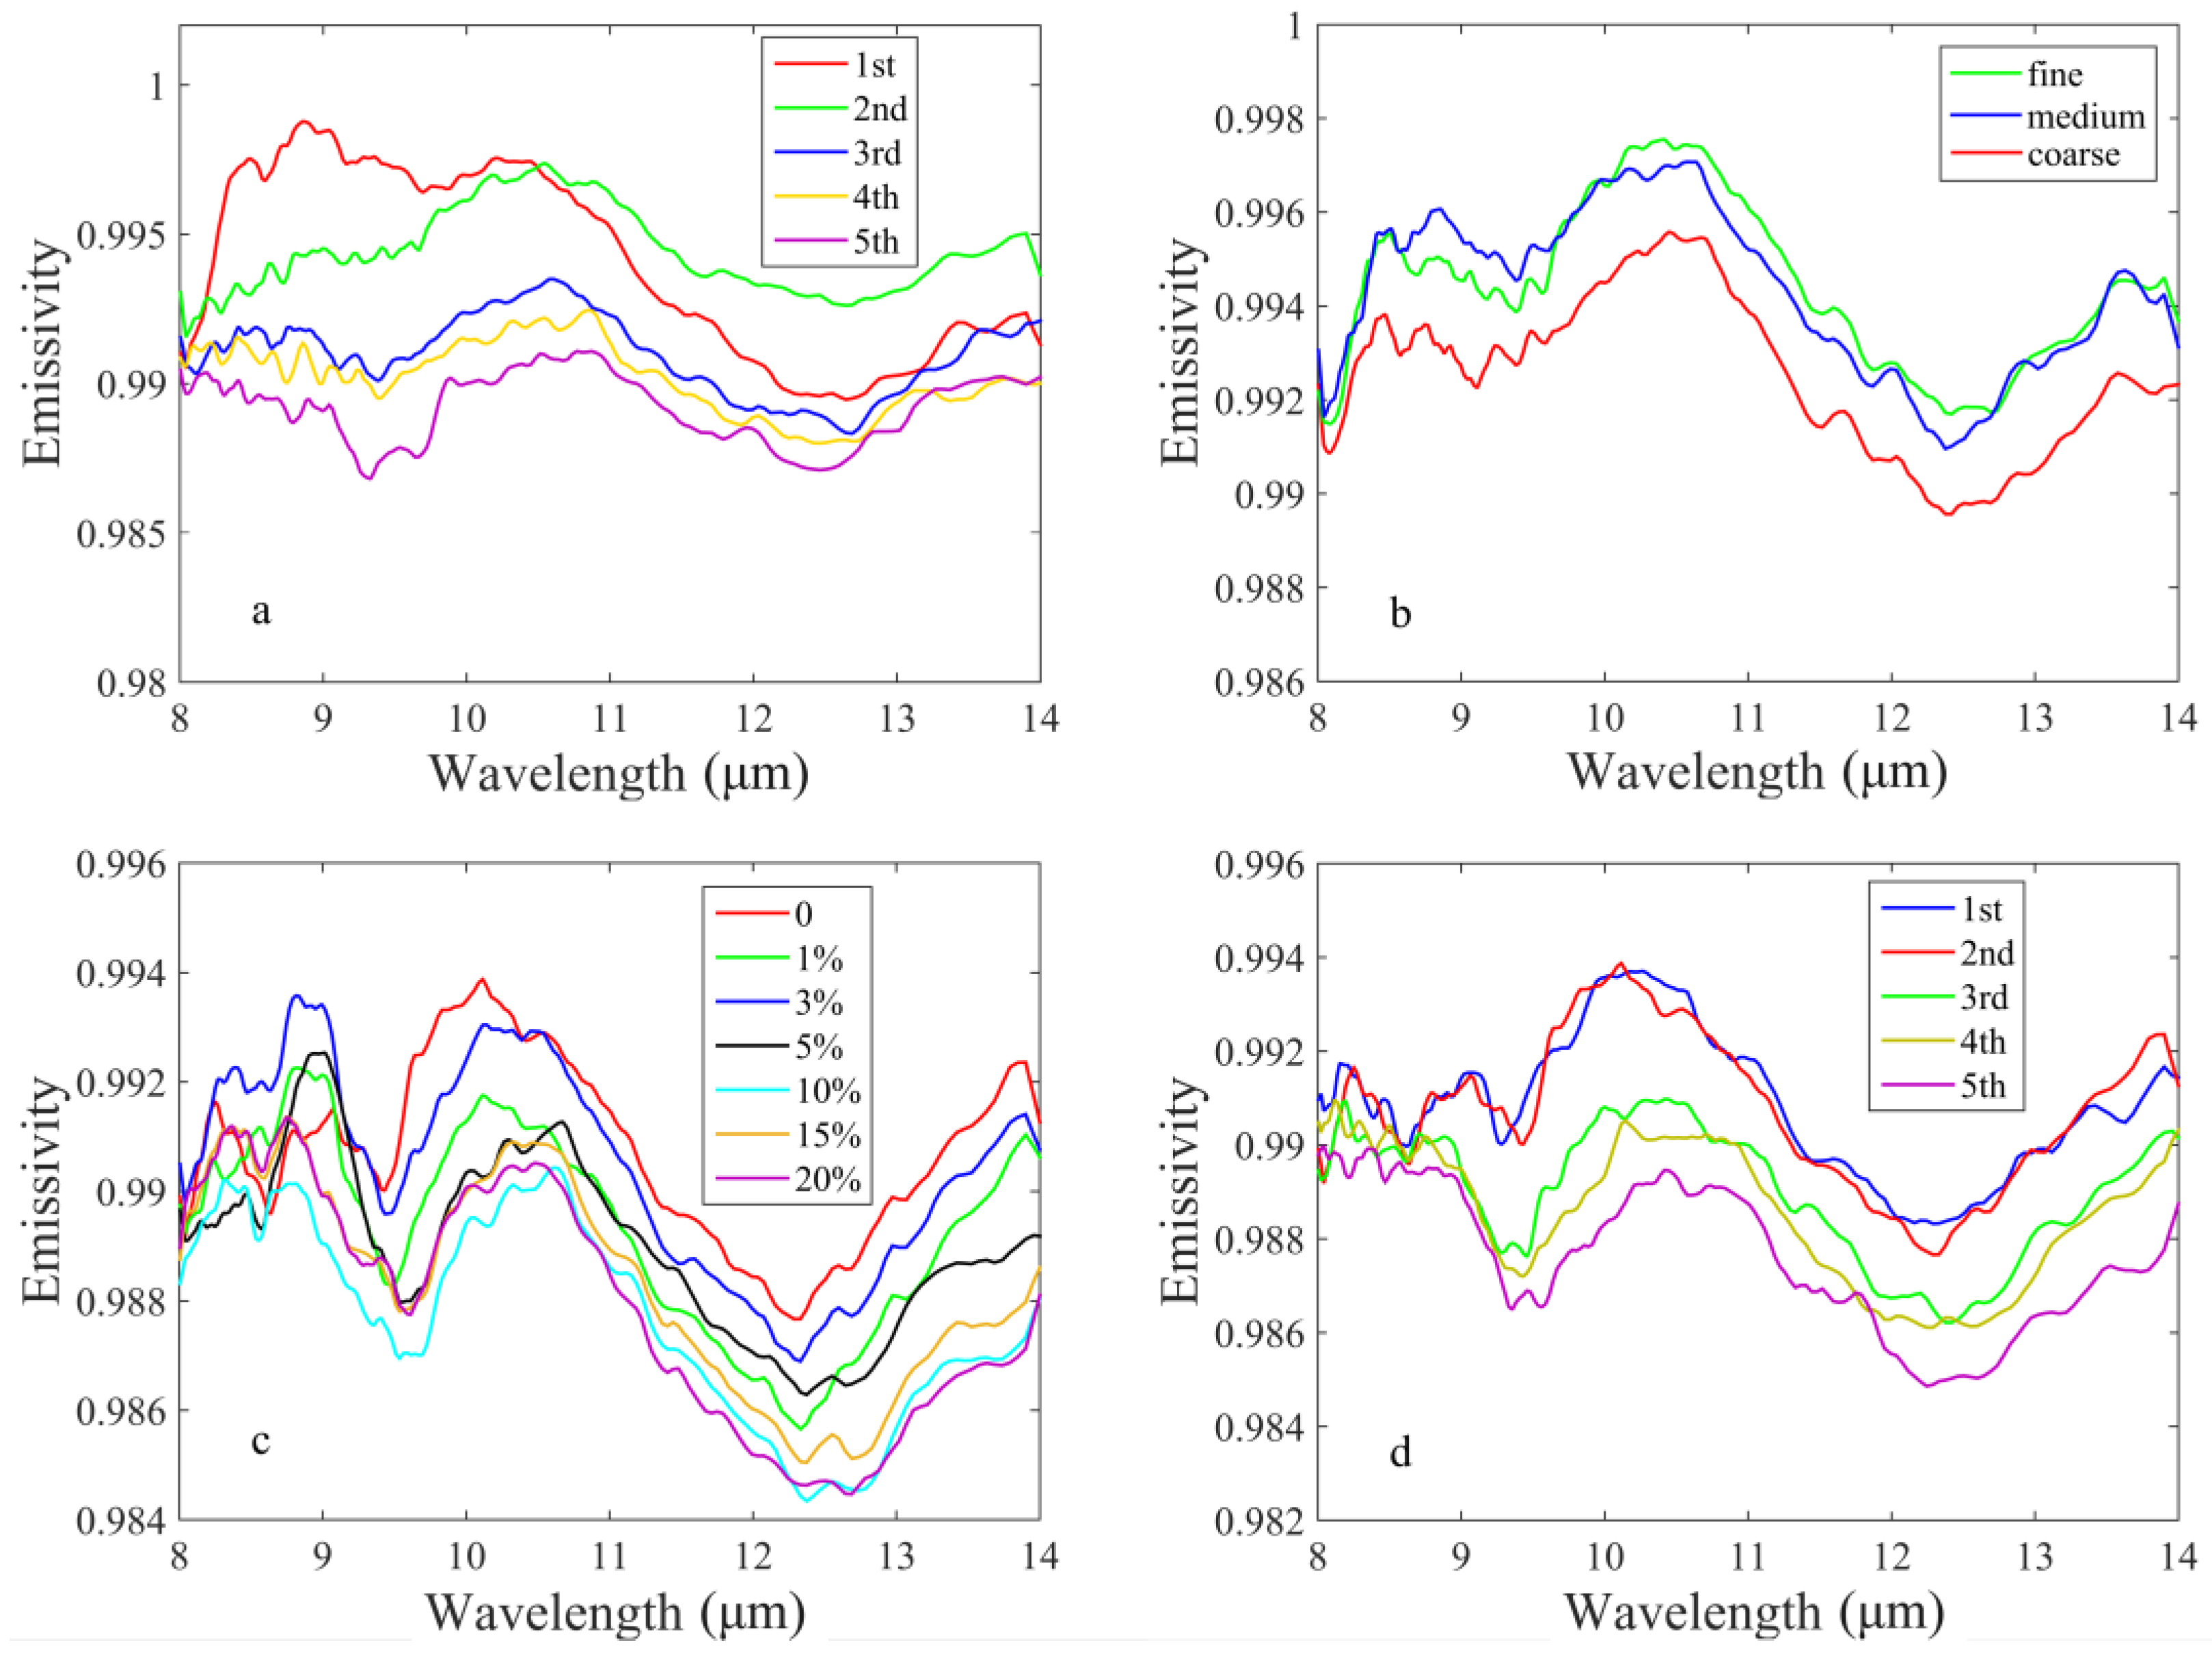
3.1. General Patterns of Emissivity at Different Salts and Water Conditions

The two groups produced diverse patterns of emissivity in various conditions, which have been applied to analyze the emissivity characteristics. Some representatives are illustrated in Figure 1. For desert saline soil, samples with medium particle size and 8 cm soil columns were chosen to analyze the effect of particle size and soil water content on soil emissivity (Figure 1a,b). The results clearly indicated that the emissivity around the domain of 8–10.5 um generally decreased along with the a decrease in soil water, although the emissivity with the highest level of soil water content decreased to a lower point than that of the second highest level in longer wavelengths, while others were generally in the order. Moreover, Figure 1b indicated that emissivity with a fine particle size had a very similar pattern with that of a medium particle size, but apparently was much higher than that of a coarse particle size. Emissivity of Aeolian sandy soil samples with various salt levels and CK (samples without salt) are illustrated in Figure 1c,d, respectively, which show that the emissivity around 9.2–14 μm was decreasing along with increasing salt content levels despite a controversial pattern in the domain of 8–9.2 μm. In addition, Figure 1d deployed decreasing emissivity along with decreasing soil water levels from 8.8–14 μm, and showed complex features from 8–8.8 μm.
Figure 1. Spectral characteristic of the various sample settings: (a) emissivity of various soil water contents for medium soil particle size (0.2–2 mm); (b) emissivity of different soil particle size for the third measurement; (c) emissivity of various soil salt levels at the second measurement; and (d) emissivity of various soil water contents for the sandy soil without salt added. Note: 1st, 2nd, 3rd, 4th and 5th represent the times measured soil water content and emission. Fine, medium and coarse means the different soil particles.
Remotesensing 07 14646 g001

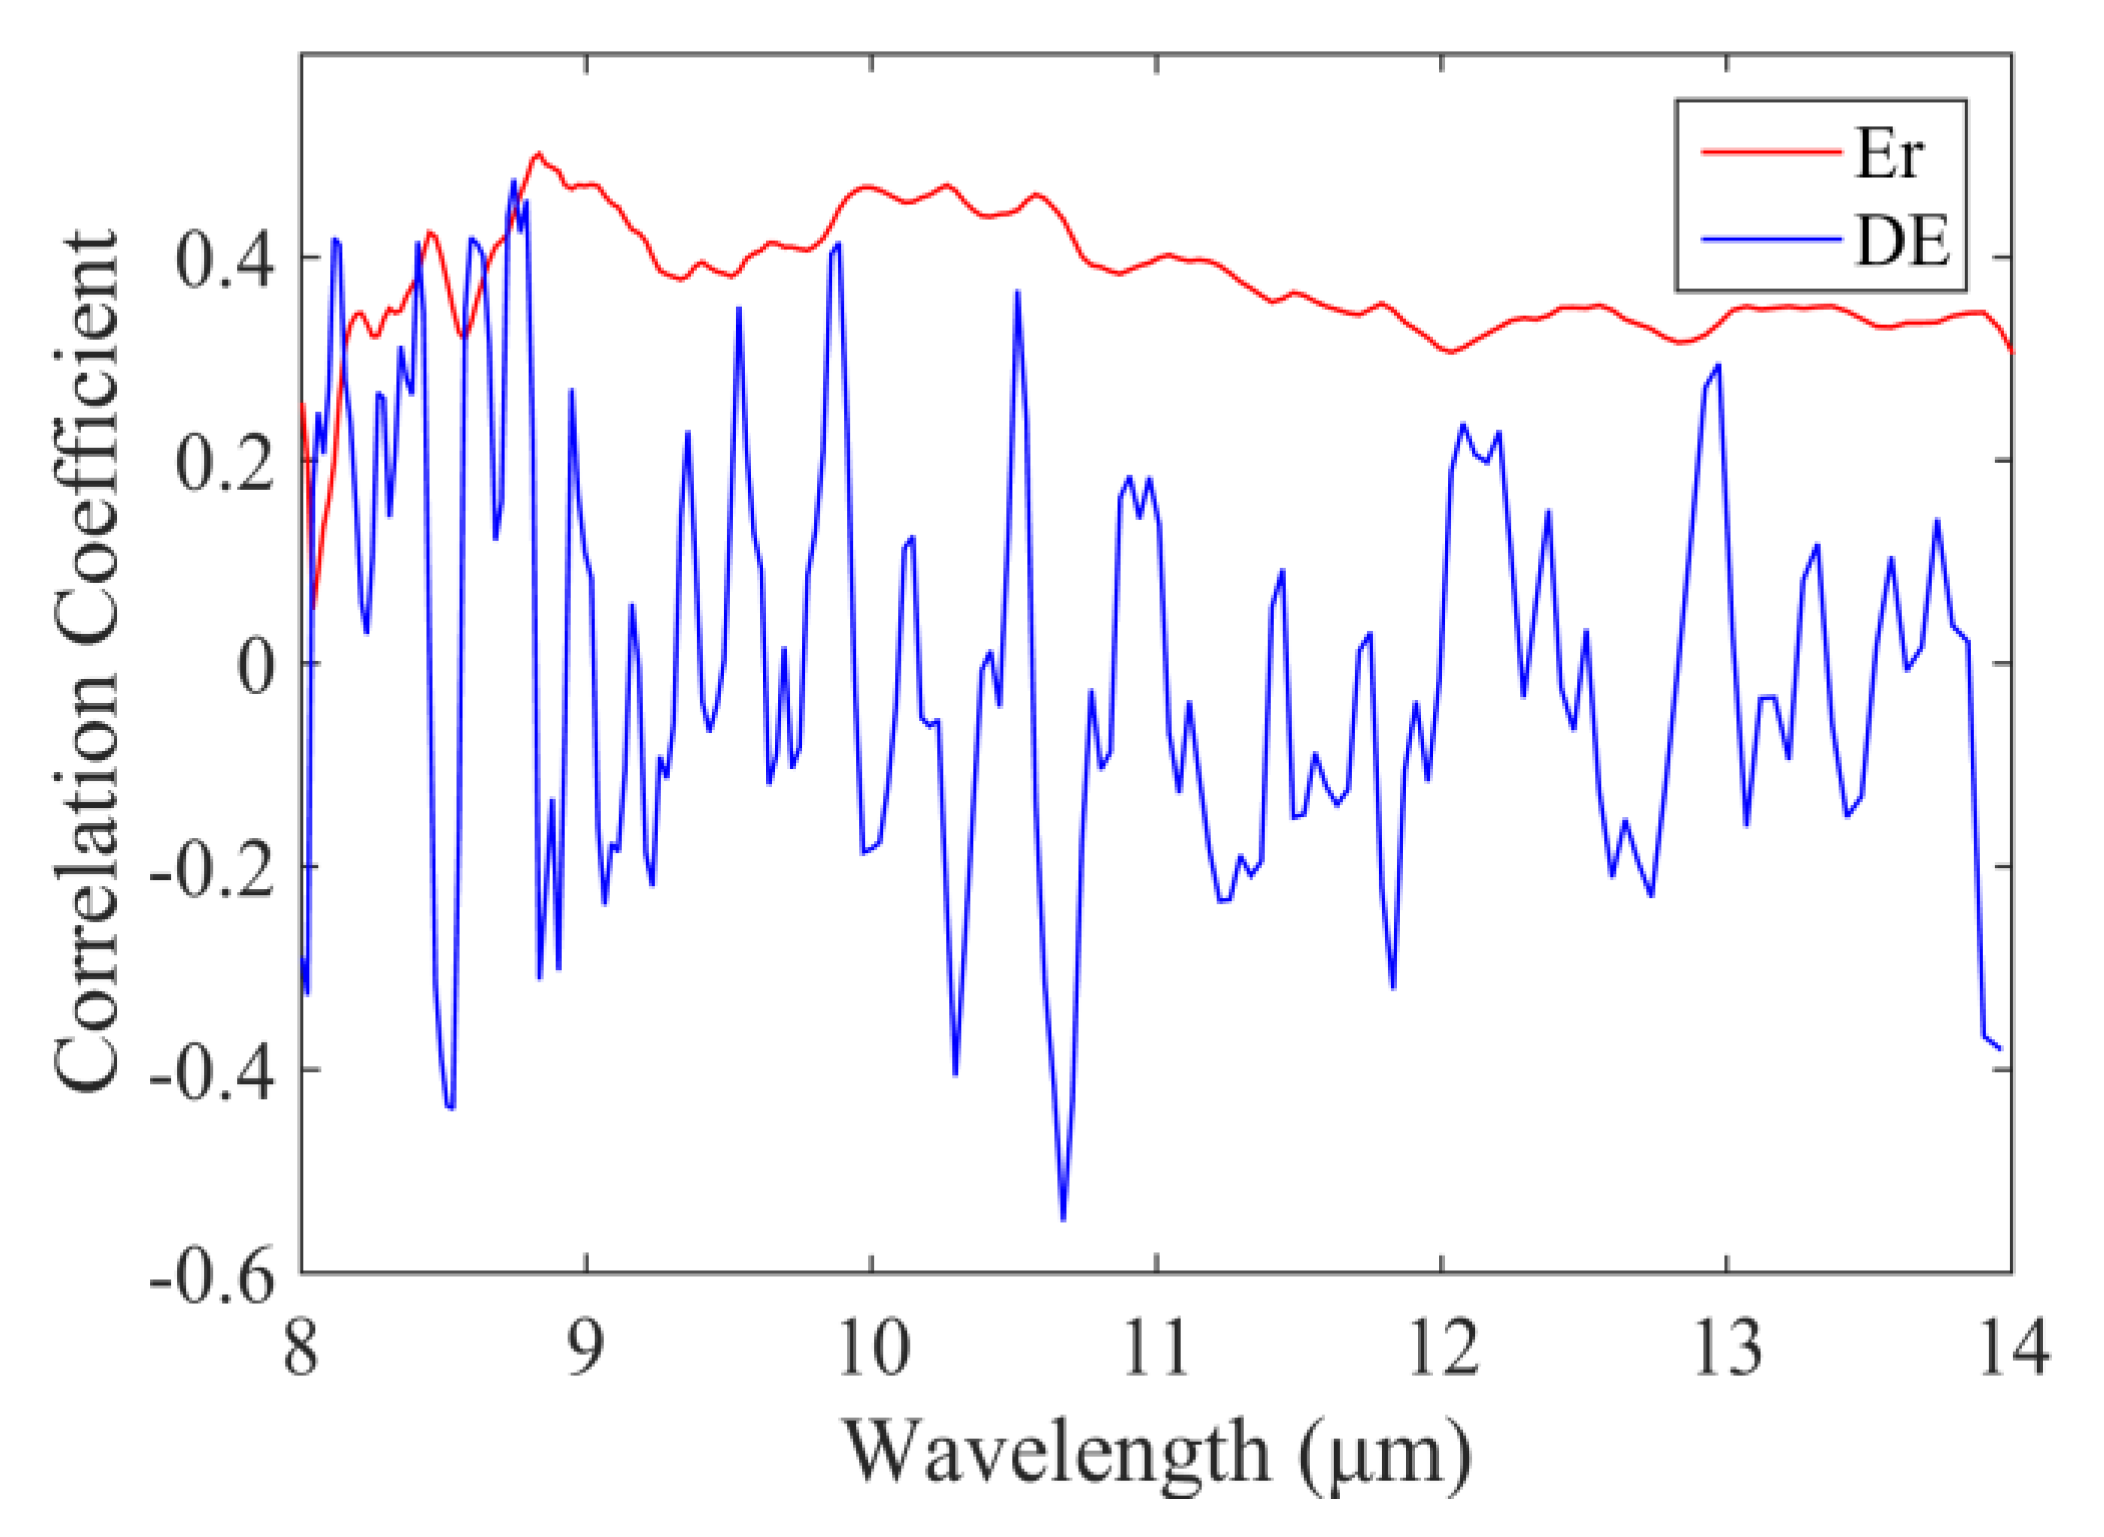
3.2. Correlations between Soil Water Contents and Original or First Derivative Spectra

Two-hundred and fifty-five paired data each for soil water contents and original emissivity or soil water contents with first derivative spectra were used for correlation analyses; the data were collected at different surface roughness conditions (150 data pairs) and had different salt types and salt contents (105 data pairs).
For original emissivity spectra, the highest correlation was found at 8.835 μm with a correlation coefficient of 0.502 (P < 0.01) for SW, while the largest correlation coefficient reached −0.549 (P < 0.01) at 10.673 μm if using the first-order derivative spectra (Figure 2). Original emissivity was only positively correlated with SW, while both positive and negative relationships were found if using the first-order derivative spectra. Although there existed many more bands that appeared to be sensitive to soil moisture content in original emissivity spectra than in first-derivate spectra, there were still many sensitive bands in the first derivative spectra, suggesting the possibility of applying both spectra to capture soil water content in many featured wavelengths.
Figure 2. Correlation between soil moisture content and two spectra forms.
Remotesensing 07 14646 g002

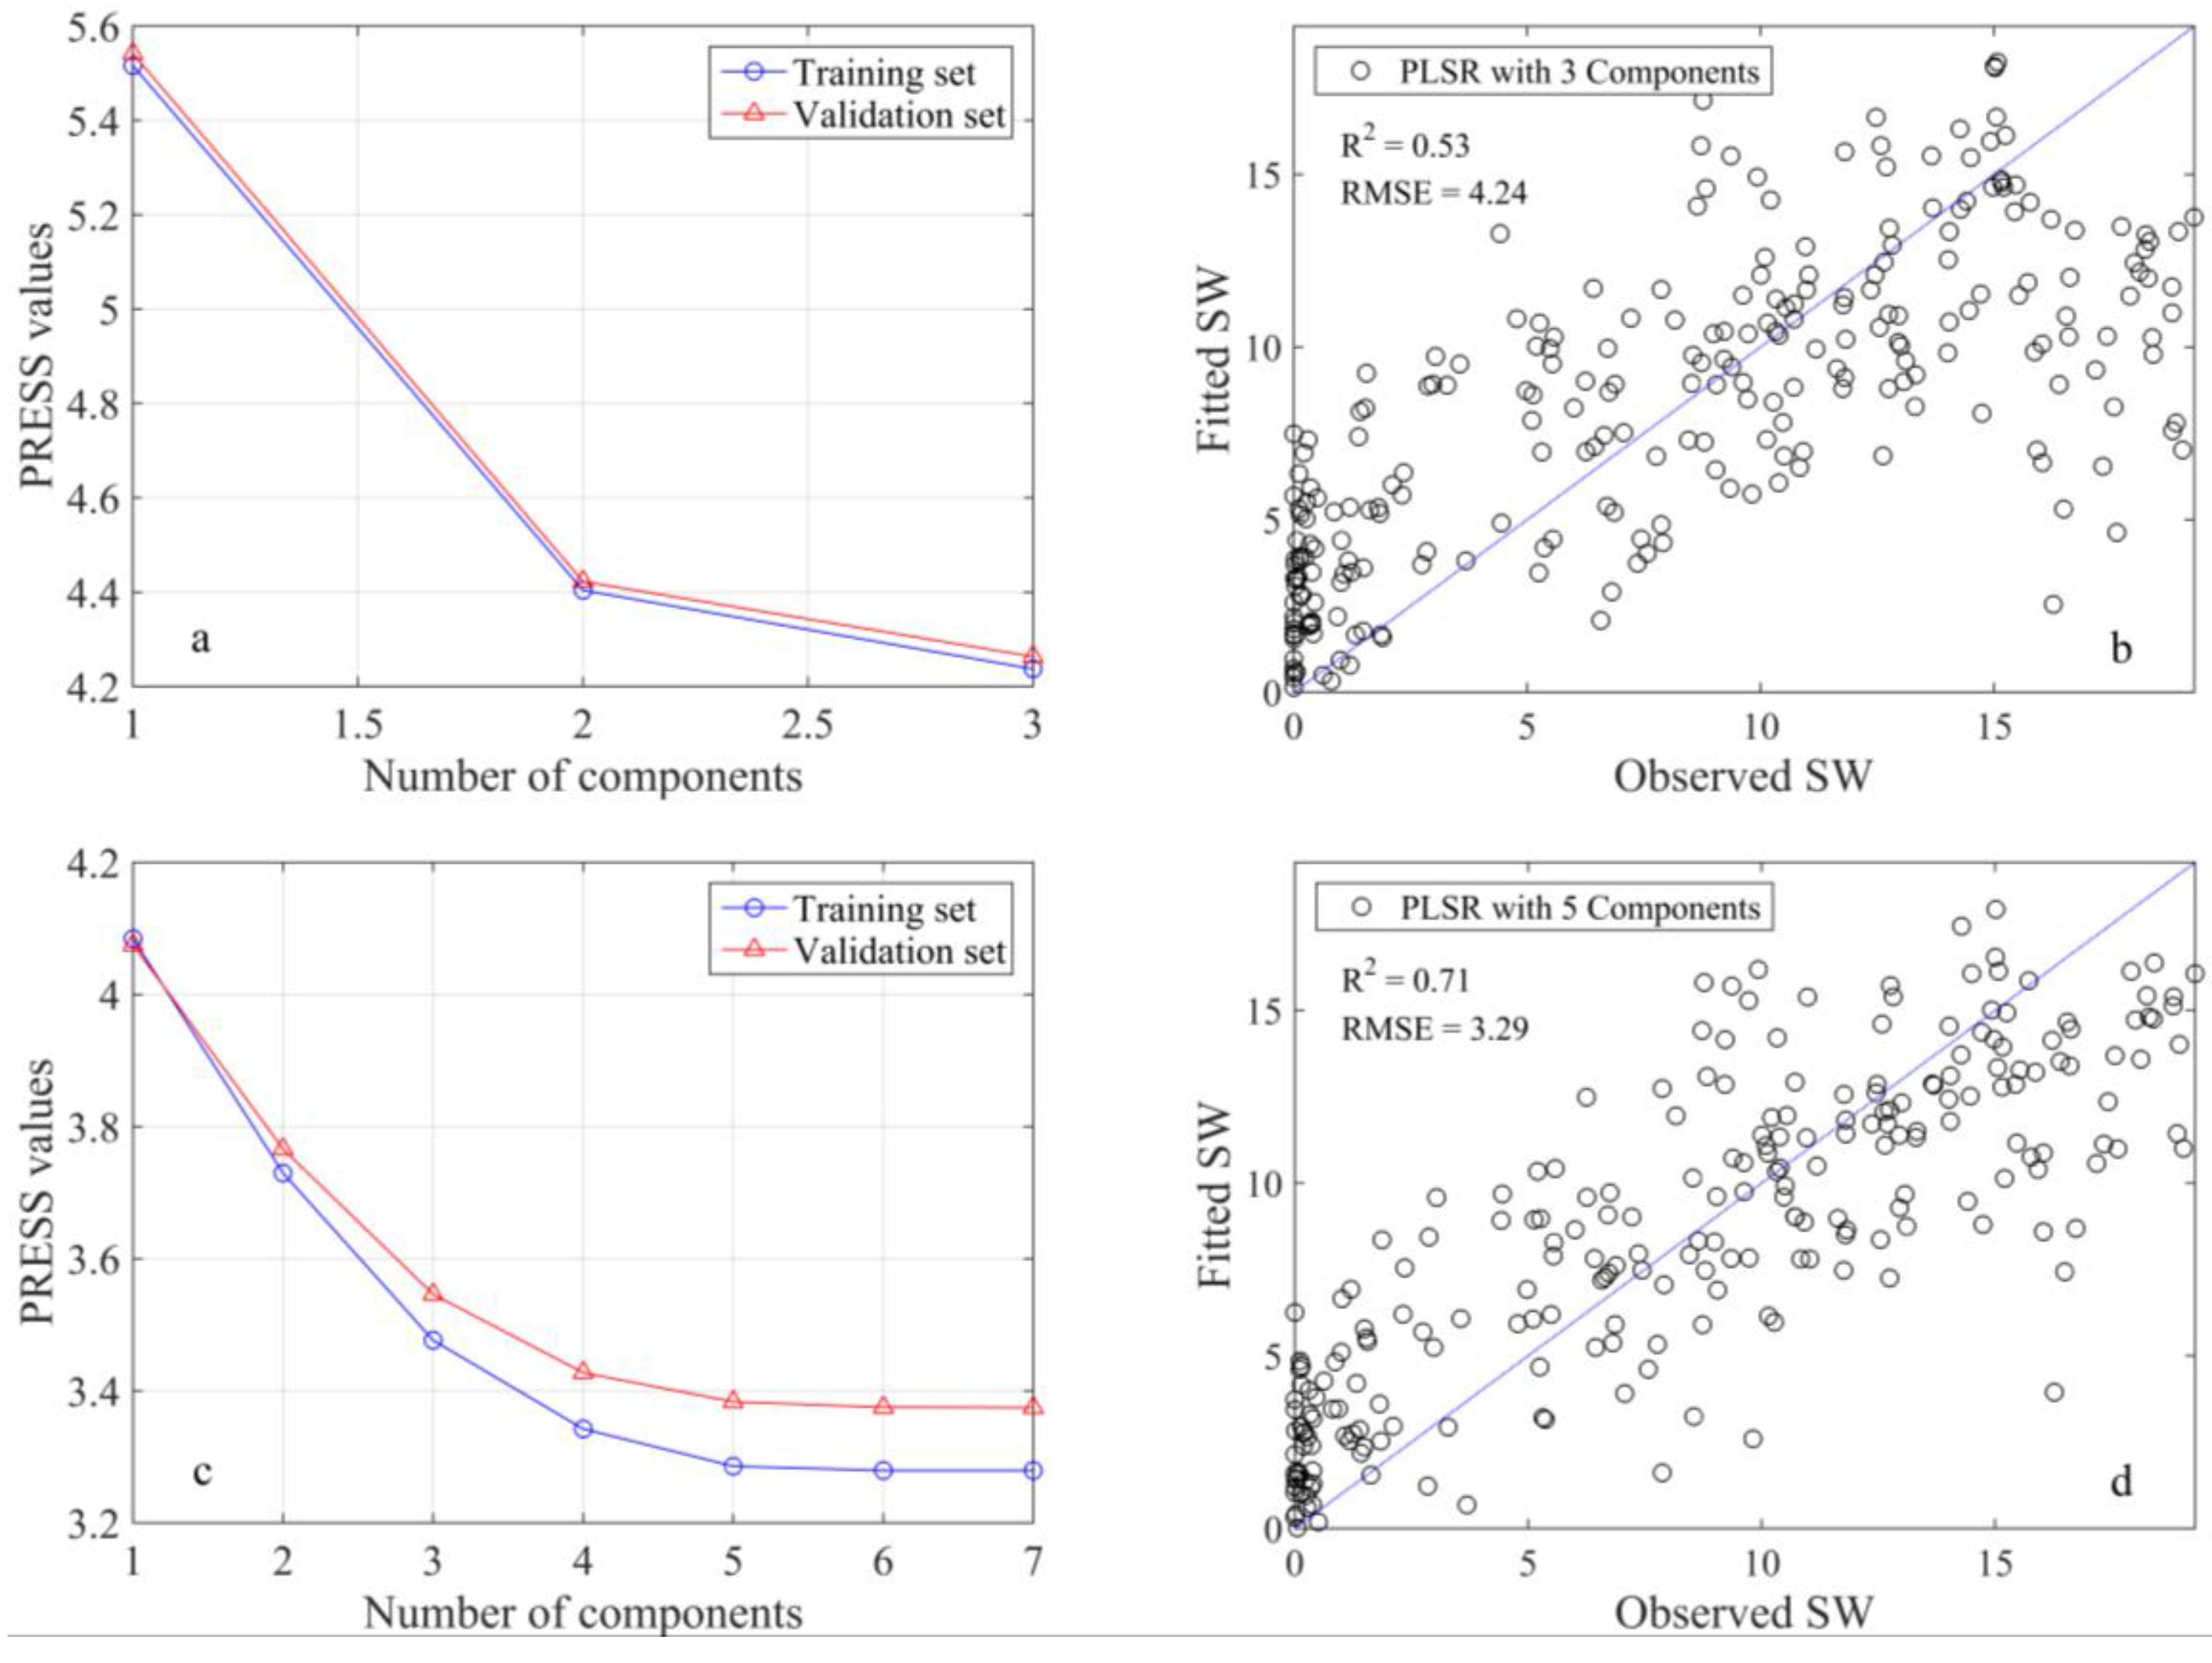
3.3. Partial Least Squares Regression Models

Three PLSR models for original spectra and six for first-order derivative spectra were set up. The final selection of best PLSR model was based on the AICc, and the results are presented in both Table 2 and Figure 3.
Table 2. Parameters for model selection. PC refers to the number of principal components.
Spectra FormBandsPCR2RMSEAICcRPD
Original30160.8652.26615.6562.53
1780.8022.7439.8662.01
330.5264.2427.4011.05
First-Order Derivate3190.8942.00516.2422.91
2280.8612.30011.6542.49
1360.8042.7288.7612.03
1170.7982.7678.3251.97
750.7143.2947.7021.58
Figure 3. The result of cross-validation for PC number determination and soil water content estimate based on PLSR model with raw spectra form ((a), (b)) and first-order derivative spectra form ((c), (d)).
Remotesensing 07 14646 g003
The coefficients and contributions of each band of the final identified PLSR were determined in order to validate the performance of each band. Table 3 shows the intercept and coefficient of each band, and Table 4 displays the respective contribution of each band to each principal component. Larger numerical values indicated a greater contribution of bands to a certain principal component [68]. All the three bands identified for the PLSR model had much larger loading weights for the three principal components, indicating they were critical for the PLSR model. Ultimately, the PLSR model had a determination coefficient (R2) of 0.53 and an RMSE of 4.24%, which, in a polynomial equation, can be represented as:
S W C = 293.80 + 3687.86 E r ( 8.813 ) 6160.49 E r ( 8.533 ) + 2774.75 E r ( 8.45 )
Table 3. Coefficients of selected bands in the PLSR model with original spectra.
ErInterceptWavelength (μm)
8.8138.5338.450
Coefficients–293.803687.86–6160.492774.75
Table 4. Loading weight matrix of each band for the PLSR model based on the Er spectra to estimate soil water content.
Band (μm)PC1PC2PC3
8.813 0.64 0.75 –0.13
8.533 0.53 –0.56 –0.64
8.450 0.55 –0.34 0.76
Table 5 and Table 6 showed the results that were obtained from the first-order derivative spectra based on identical processes. Seven bands were selected by stepwise regression analysis, and five principal components were determined for the PLSR with the method of PRESS (Figure 3c). Table 6 exhibited the importance of seven bands to each principal component. The bands with great contributions were evenly distributed from 8.097 to 8.769 μm. The PLSR model had a higher determination coefficient(R2 = 0.71) compared to that of using original spectra and a lower RMSE (3.3%), but the AICc of the model, however, was higher than the PLSR model based on original spectra. Even so, the RPD of it was above 1.4 while that of the PLSR model based on original spectra was below 1.4, indicating a much better predication ability of the model. Accordingly, the first-order derivative spectra form was deemed to model effectively the soil water content.
Table 5. Coefficients of involved bands in the PLSR model with derivative spectra.
DEInterceptWavelength (μm)
10.6408.7038.5968.09712.92411.2948.769
Coefficients1.52–569.02277.77163.14159.72540.49–441.37169.32
Table 6. Loading weight matrix (LW×100) of each band for the PLSR model based on the DE spectra to estimate soil water content.
Band (μm)PC1PC2PC3PC4PC5
10.640–2.53–2.59–1.27–2.14–0.18
8.7037.24–0.645.90–8.082.91
8.5964.095.87–1.172.75–6.43
8.09711.30–9.330.223.43–1.86
12.9240.600.421.301.281.03
11.294–0.09–1.66–0.86–1.74–0.54
8.7696.515.32–6.820.333.85

4. Discussion

4.1. Thermal Infrared vs. Visible-Near Infrared and Microwave

Bands in visible-near infrared and microwave prevailed in the field of soil moisture estimation, owing to their hyperspectral characteristics in visible-near infrared wavelengths and penetration in microwave wavebands [4,19]. Despite these, thermal infrared still had its own superiority over them. Comparing the absorption depth at 1.4 and 1.9 μm for soil moisture content [19], Lesaignoux et al. [69] found that soil moisture content had an important impact between 8–11 μm, and provided a polynomial function based on reflectance in the thermal domain. Besides, Mira et al. [70] also found that soil moisture content could influence soil emissivity from 8.2–9.2 μm, more so than other domains, which is consistent with this study. Furthermore, previous studies also found that thermal infrared had potential to distinguish soil organic content, soil texture, clay and sand content [70,71,72,73]. Overall, thermal infrared bands with longer wavelengths have less energy than visible-near infrared bands [74], which might overlook certain detailed background information on saline soil using thermal infrared bands. Compared to previous work on hyperspectral remote sensing [20], the current study also obtained satisfactory results.
Similar to thermal infrared sensors, passive microwave remote sensing received the emissive information of subjects; however, they differed in the ability to penetrate the soil surface. Thermal infrared observations were sensitive to the top surface layer, while microwaves were sensitive to deeper layers [75]. Although microwave remote sensing has successfully predicted soil moisture content, especially in C and L bands [23,76], it did not obtain fine spatial resolution at large scales for its long wavelength. Thermal infrared sensors had the superiority of finer resolution for shorter wavelengths, and sensors would receive sufficient energy in a smaller area. Integration of multisource data was also an important solution in the time of the abundant appearance of remote sensing products and application. It has been proven that the combination of microwave and thermal infrared data also have the potential to generate high resolution, high accuracy soil moisture data [77].

4.2. Original vs. First-Order Derivative

From the above results, we conclude that the PLSR model based on the first-order derivate spectra could more accurately estimate soil moisture content than raw spectra. Coincidently, many studies reported that features and attributes of soil [20], plants [78] and other terrestrial objects could be captured more effectively by derivative spectra than raw spectra. This might be caused by the interfering factors of raw spectra, which derivative spectra had the capacity to eliminate [79]. However, it is necessary to consider simultaneously both accuracy and effectiveness to build a model with favorable performance [64]. At the band range related to soil moisture content, correlations between soil moisture content and raw spectra were generally higher than that of first-order derivative spectra (Figure 2). This might result in the model in original spectra performing more comprehensively than the model with first-order derivate spectra.
Here, we analyzed the correlation between relative wavebands and the soil moisture content to reveal the reason for both raw spectra and derivative spectra, as shown in Table 7 and Table 8. For raw spectra, the correlations between soil water and involved bands were high; for derivate spectra, the correlations were much smaller than the former. Nevertheless, the derivate spectra had seven contributive components (far more than raw spectra), which made the derivate spectra more accurately model soil moisture content. As a comparison, it was notable that the correlations between bands of raw spectra were much higher than 0.96; contrarily, that of derivative spectra were lower than 0.35. High correlations indicated information that was more similar among bands and provided redundant information for soil moisture content estimation [42]. Therefore, derivative spectra had the advantage of supplying much more information with a limited number of bands. Unfortunately, in the current study, most of the involved bands were weakly related to soil moisture content, which means that first-order derivate spectra required more bands to model accurately soil moisture content and would simultaneously reduce the model’s effectiveness, resulted in a slightly higher AICc as compared with the PLSR model with raw spectra. However, further analysis using RPD clearly revealed that the PLSR model based on derivative spectra had higher prediction ability and hence is recommended for soil moisture estimation.
Table 7. Correlation matrix between soil moisture content and raw spectra form involved in the PLSR model.
ErSW8.8138.5338.450
SW1.00
8.8130.501.00
8.5330.350.961.00
8.4500.430.960.981.00
Table 8. Correlation matrix between soil moisture content and first-order derivate spectra form involved in the PLSR model.
DESW10.6408.7038.5968.09712.92411.2948.769
SW1.00
10.640–0.411.00
8.7030.160.091.00
8.5960.42–0.18–0.281.00
8.0970.27–0.020.25–0.081.00
12.9240.27–0.08–0.010.150.181.00
11.294–0.190.13–0.070.050.060.141.00
8.7690.43–0.34–0.030.350.020.180.071.00

4.3. Potential Applications at Large Scale

Currently, thermal infrared sensors have more coarse spectral and spatial resolution such as ASTER, AVHRR, MODIS and Landsat ETM+ (Table 9). Unfortunately, we could see that most sensors did not include the band region referred to above, but there were still two sensors (ASTER and MODIS) covering several bands that provided exceptional performance of soil moisture content estimation. Considering the realistic difficulty of applying this estimation at a large scale, two problems must be considered. Firstly, the bandwidth used in lab test was not consistent with that in satellite sensors. This may be solved via weighted summation for changing narrowband emissivity to broadband emissivity in line with Cheng et al. [80] and Wang et al. [25]. According to the chosen model, the ASTER sensor has two channels corresponding to the sensitive bands for predicting soil moisture content in this study: the MODIS sensor only has one. Moreover, the spatial resolution of ASTER was much finer than that of MODIS, which indicated that ASTER had great potential for monitoring and mapping soil moisture content [30].
Secondly, water vapor and other factors in the atmosphere will affect inevitably emissivity variation and lead to errors [81]. The method of water vapor scaling was introduced to minimize atmospheric uncertainties [82]. Based on these, Wang et al. [25] studied the effect of soil moisture on thermal infrared emissivity with ASTER data. In addition, the result was also conducive to request that future thermal sensors needed to be accommodated. These findings highlight the potential to characterize the soil water content of salt-affected soil with thermal infrared band domains in arid land at various scales.
Table 9. Currently available and frequently-used satellite sensors with thermal bands.
SensorSatelliteBand (μm)Spatial Resolution (m)
ASTEREOS8.125–8.475, 8.475–8.825, 8.925–9.275, 10.25–10.95, 10.95–11.6590
AVHRRNOAA10.3–11.3, 11.5–12.51100
MODISEOS8.4–8.7, 9.58–9.88, 10.78–11.28, 11.77–12.27, 13.185–13.485, 13.485–13.785, 13.785–14.085, 14.085–14.3851000
ETM+Landsat10–12.960
TM6Landsat10.4–12.5120
IRSHJ-1A/B10.5–12.5300

5. Conclusions

This study is among the few to attempt the use of thermal infrared bands for estimating soil moisture content at various mixed conditions. Within the scope of this study, the empirical approach of the PLSR model is examined with two spectral forms: raw and derivate spectra. The PLSR model built with first-order derivative spectra is recommended for soil moisture estimation. Compared to the channels of existing sensors, the result of this study showed the potential of thermal infrared data in providing access to the soil moisture content estimate. The laboratory experimental result should be evaluated in the field, with airborne and space-borne data, where additional confounding factors are present: in particular, the atmosphere effect and spectral resolution problems. This study also acts as a reference material and specific request for wavebands of thermal sensors designed in the future.

Acknowledgments

This study was supported by the NSFC project (Grant No. 41101249) and the NSFC project (Grant No. 41201373).

Author Contributions

Lu Xu designed and performed the experiments and analyzed data. Quan Wang conceived and designed the experiments and analyzed data jointly. Lu Xu and Quan Wang wrote the paper.

Conflicts of Interest

The authors declare no conflict of interest.

References

  1. Mganga, K.Z.; Musimba, N.K.R.; Nyangito, M.M.; Nyariki, D.M.; Mwangombe, A.W.; Ekaya, W.N.; Muiru, W.M.; Clavel, D.; Francis, J.; von Kaufmann, R. The role of moisture in the successful rehabilitation of denuded patches of a semi-arid environment in Kenya. J. Environ. Sci. Technol. 2010, 3, 195–207. [Google Scholar] [CrossRef]
  2. Dehaan, R.L.; Taylor, G.R. Field-derived spectra of salinized soils and vegetation as indicators of irrigation-induced soil salinization. Remote Sens. Environ. 2002, 80, 406–417. [Google Scholar] [CrossRef]
  3. Kerr, Y.H. Soil moisture from space: Where are we? Hydrogeol. J. 2007, 15, 117–120. [Google Scholar] [CrossRef]
  4. Kaleita, A.L.; Tian, L.F.; Hirschi, M.C. Relationship between soil moisture content and soil surface reflectance. T Asae. 2005, 48, 1979–1986. [Google Scholar] [CrossRef]
  5. Dante, E.M.; Dhruba, P.S. The use of hyperspectral data in identifying ‘desert-like’ soil surface features in Tabernas area, southeast Spain. In 22nd Asian conference on Remote Sensing, Singapore, 5–9 November 2001; p. 5.
  6. Zhang, D.J.; Tang, R.L.; Tang, B.H.; Wu, H.; Li, Z.L. A simple method for soil moisture determination from LST-VI feature space using nonlinear interpolation based on thermal infrared remotely sensed data. IEEE J.-Stars 2015, 8, 638–648. [Google Scholar] [CrossRef]
  7. Norouzi, H.; Temimi, M.; Khanbilvardi, R. Using global land surface emissivity as soil moisture indicator. Iahs.-Aish P 2012, 352, 46–49. [Google Scholar]
  8. Rahimzadeh-Bajgiran, P.; Berg, A.A.; Champagne, C.; Omasa, K. Estimation of soil moisture using optical/thermal infrared remote sensing in the Canadian Prairies. ISPRS J. Photogramm. Remote Sens. 2013, 83, 94–103. [Google Scholar] [CrossRef]
  9. Sobrino, J.A.; Franch, B.; Mattar, C.; Jiménez-Muñoz, J.C.; Corbari, C. A method to estimate soil moisture from Airborne Hyperspectral Scanner (AHS) and ASTER data: Application to SEN2FLEX and SEN3EXP campaigns. Remote Sens. Environ. 2012, 117, 415–428. [Google Scholar] [CrossRef]
  10. Williams, M.S.; Kvien, C.; Allam, G.K.; Luna, R.; Kincaid, R.; Sullivan, D.G.; Yamamoto, K.; Giraldo, M.; Bosch, D.D.; Lewis, M.; et al. Remote sensing of soil moisture using airborne hyperspectral data. GISci. Remote Sens. 2011, 48, 522–540. [Google Scholar]
  11. Champagne, C.; Davidson, A.; Cherneski, P.; L’Heureux, J.; Hadwen, T. Monitoring agricultural risk in Canada using l-band passive microwave soil moisture from SMOS. J. Hydrometeorol. 2015, 16, 5–18. [Google Scholar] [CrossRef]
  12. Shafian, S.; Maas, S. Index of soil moisture using raw Landsat image digital count data in Texas high plains. Remote Sens. 2015, 7, 2352–2372. [Google Scholar] [CrossRef]
  13. Romshoo, S.A. Geostatistical analysis of soil moisture measurements and remotely sensed data at different spatial scales. Environ. Geol. 2004, 45, 339–349. [Google Scholar] [CrossRef]
  14. Lakhankar, T.; Jones, A.S.; Combs, C.L.; Sengupta, M.; Haar, T.H.V.; Khanbilvardi, R. Analysis of large scale spatial variability of soil moisture using a geostatistical method. Sensors 2010, 10, 913–932. [Google Scholar] [CrossRef] [PubMed]
  15. Huang, Q.T.; Luo, J.C.; Shi, Z.; Li, J.L. An experimental study on paddy soil moisture inversion based on emissive hyperspectra. In Proceedings of the 2012 First International Conference on Agro-Geoinformatics, Shanghai, China, 2–4 August 2012; pp. 1–5.
  16. Li, B.; Rodell, M. Spatial variability and its scale dependency of observed and modeled soil moisture over different climate regions. Hydrol. Earth Syst. Sci. 2013, 17, 1177–1188. [Google Scholar] [CrossRef]
  17. Parde, M.; Zribi, M.; Wigneron, J.P.; Dechambre, M.; Fanise, P.; Kerr, Y.; Crapeau, M.; Saleh, K.; Calvet, J.C.; Albergel, C.; et al. Soil moisture estimations based on airborne carols l-band microwave data. Remote Sens. 2011, 3, 2591–2604. [Google Scholar] [CrossRef] [Green Version]
  18. Shen, X.Y.; Hong, Y.; Qin, Q.M.; Basara, J.B.; Mao, K.B.; Wang, D. A semiphysical microwave surface emission model for soil moisture retrieval. IEEE Trans. Geosci. Remote Sens. 2015, 53, 4079–4090. [Google Scholar] [CrossRef]
  19. Liu, W.D.; Baret, F.; Gu, X.F.; Tong, Q.X.; Zheng, L.F.; Zhang, B. Relating soil surface moisture to reflectance. Remote Sens. Environ. 2002, 81, 238–246. [Google Scholar] [CrossRef]
  20. Wang, Q.; Li, P.; Pu, Z.; Chen, X. Calibration and validation of salt-resistant hyperspectral indices for estimating soil moisture in arid land. J. Hydrol. 2011, 408, 276–285. [Google Scholar] [CrossRef]
  21. Oltra-Carrió, R.; Baup, F.; Fabre, S.; Fieuzal, R.; Briottet, X. Improvement of soil moisture retrieval from hyperspectral VNIR-SWIR data using clay content information: From laboratory to field experiments. Remote Sens. 2015, 7, 3184–3205. [Google Scholar] [CrossRef]
  22. Jackson, T.J.; Le Vine, D.M.; Hsu, A.Y.; Oldak, A.; Starks, P.J.; Swift, C.T.; Isham, J.D.; Haken, M. Soil moisture mapping at regional scales using microwave radiometry: The southern great plains hydrology experiment. IEEE Trans. Geosci. Remote Sens. 1999, 37, 2136–2151. [Google Scholar] [CrossRef]
  23. Bindlish, R.; Barros, A.P. Subpixel variability of remotely sensed soil moisture: Aninter-comparison study of SAR and ESTAR. IEEE Trans. Geosci. Remote Sens. 2002, 40, 326–337. [Google Scholar] [CrossRef]
  24. Schlenz, F.; Fallmann, J.; Marzahn, P.; Loew, A.; Mauser, W. Characterization of rape field microwave emission and implications to surface soil moisture retrievals. Remote Sens. 2012, 4, 247–270. [Google Scholar] [CrossRef] [Green Version]
  25. Wang, H.S.; Xiao, Q.; Li, H.; Du, Y.M.; Liu, Q.H. Investigating the impact of soil moisture on thermal infrared emissivity using ASTER data. IEEE Geosci. Remote Sens. Lett. 2015, 12, 294–298. [Google Scholar] [CrossRef]
  26. Yang, Y.; Guan, H.; Long, D.; Liu, B.; Qin, G.; Qin, J.; Batelaan, O. Estimation of surface soil moisture from thermal infrared remote sensing using an improved trapezoid method. Remote Sens. 2015, 7, 8250–8270. [Google Scholar] [CrossRef]
  27. Maekawa, T.; Nishihara, O.; Aoki, Y.; Tsubosaka, K.; Kitamura, S. Design challenges of ASTER in thermal infrared spectral region. In Proceedings of the Sensor Systems for the Early Earth Observing System Platforms, Orlando, Florida, 25 August 1993; pp. 176–186.
  28. Hook, S.J.; Kahle, A.B. The micro fourier transform interferometer (FTIR)—A new field spectrometer for acquisition of infrared data of natural surfaces. Remote Sens. Environ. 1996, 56, 172–181. [Google Scholar] [CrossRef]
  29. Salisbury, J.W.; Daria, D.M. Infrared (8–14 µm) remote-sensing of soil particle-size. Remote Sens. Environ. 1992, 42, 157–165. [Google Scholar] [CrossRef]
  30. Xiao, Q.; Liu, Q.H.; Li, X.W.; Chen, L.F.; Liu, Q.; Xin, X.Z. A field measurement method of spectral emissivity and research on the feature of soil thermal infrared emissivity. J. Infrared Millim. Waves 2003, 22, 373–378. [Google Scholar]
  31. Csillag, F.; Pasztor, L.; Biehl, L.L. Spectral band selection for the characterization of salinity status of soils. Remote Sens. Environ. 1993, 43, 231–242. [Google Scholar] [CrossRef]
  32. Farifteh, J. Interference of salt and moisture on soil reflectance spectra. Int. J. Remote Sens. 2011, 32, 8711–8724. [Google Scholar] [CrossRef]
  33. Mccabe, M.F.; Balick, L.K.; Theiler, J.; Gillespie, A.R.; Mushkin, A. Linear mixing in thermal infrared temperature retrieval. Int. J. Remote Sens. 2008, 29, 5047–5061. [Google Scholar] [CrossRef]
  34. Salisbury, J.W.; Daria, D.M. Emissivity of terrestrial materials in the 8–14 µm atmospheric window. Remote Sens. Environ. 1992, 42, 83–106. [Google Scholar] [CrossRef]
  35. Bittelli, M.; Ventura, F.; Campbell, G.S.; Snyder, R.L.; Gallegati, F.; Pisa, P.R. Coupling of heat, water vapor, and liquid water fluxes to compute evaporation in bare soils. J. Hydrol. 2008, 362, 191–205. [Google Scholar] [CrossRef]
  36. Artz, R.R.E.; Chapman, S.J.; Jean Robertson, A.H.; Potts, J.M.; Laggoun-Défarge, F.; Gogo, S.; Comont, L.; Disnar, J.-R.; Francez, A.-J. FTIR spectroscopy can be used as a screening tool for organic matter quality in regenerating cutover peatlands. Soil Biol. Biochem. 2008, 40, 515–527. [Google Scholar] [CrossRef]
  37. Haberhauer, G.; Feigl, B.; Gerzabek, M.H.; Cerri, C. FT-IR spectroscopy of organic matter in tropical soils: Changes induced through deforestation. Appl. Spectrosc. 2000, 54, 221–224. [Google Scholar] [CrossRef]
  38. Tatzber, M.; Stemmer, M.; Spiegel, H.; Katzlberger, C.; Haberhauer, G.; Gerzabek, M.H. An alternative method to measure carbonate in soils by FT-IR spectroscopy. Environ. Chem. Lett. 2007, 5, 9–12. [Google Scholar] [CrossRef]
  39. Mira, M.; Valor, E.; Caselles, V.; Rubio, E.; Coll, C.; Galve, J.M.; Niclos, R.; Sanchez, J.M.; Boluda, R. Soil moisture effect on thermal infrared (8–13-µm) emissivity. IEEE Trans. Geosci. Remote Sens. 2010, 48, 2251–2260. [Google Scholar] [CrossRef]
  40. Luoto, M.; Hjort, J. Evaluation of current statistical approaches for predictive geomorphological mapping. Geomorphology 2005, 67, 299–315. [Google Scholar] [CrossRef]
  41. Mahesh, S.; Jayas, D.S.; Paliwal, J.; White, N.D.G. Comparison of partial least squares regression (PLSR) and principal components regression (PCR) methods for protein and hardness predictions using the near-infrared (NIR) hyperspectral images of bulk samples of Canadian wheat. Food Bioprocess. Tech. 2015, 8, 31–40. [Google Scholar] [CrossRef]
  42. Wold, S.; Sjostrom, M.; Eriksson, L. PLS-regression: A basic tool of chemometrics. Chemometr. Intell. Lab. 2001, 58, 109–130. [Google Scholar] [CrossRef]
  43. Ergon, R. Finding y-relevant part of x by use of PCR and PLSR model reduction methods. J. Chemometr. 2007, 21, 537–546. [Google Scholar] [CrossRef]
  44. Hassan-Esfahani, L.; Torres-Rua, A.; Jensen, A.; McKee, M. Assessment of surface soil moisture using high-resolution multi-spectral imagery and artificial neural networks. Remote Sens. 2015, 7, 2627–2646. [Google Scholar] [CrossRef]
  45. Weng, Y.L.; Gong, P.; Zhu, Z.L. Soil salt content estimation in the Yellow River delta with satellite hyperspectral data. Can. J. Remote Sens. 2008, 34, 259–270. [Google Scholar]
  46. Sidike, A.; Zhao, S.; Wen, Y. Estimating soil salinity in pingluo county of china using quickbird data and soil reflectance spectra. Int. J. Appl. Earth Observ. Geoinform. 2014, 26, 156–175. [Google Scholar] [CrossRef]
  47. Keshava, N.; Mustard, J.F. Spectral unmixing. IEEE Signal. Proc. Mag. 2002, 19, 44–57. [Google Scholar] [CrossRef]
  48. Van der Meer, F. Iterative spectral unmixing (ISU). Int. J. Remote Sens. 1999, 20, 3431–3436. [Google Scholar] [CrossRef]
  49. Singh, D. Polarization discrimination ratio approach to retrieve bare soil moisture at X-band. In Proceedings of the IEEE International Geoscience and Remote Sensing, Seoul, Korea, 25–29 July 2005.
  50. Dematte, J.A.M.; Sousa, A.A.; Alves, M.C.; Nanni, M.R.; Fiorio, P.R.; Campos, R.C. Determining soil water status and other soil characteristics by spectral proximal sensing. Geoderma 2006, 135, 179–195. [Google Scholar] [CrossRef]
  51. Zheng, C.; Wang, Q. Seasonal and annual variation in transpiration of a dominant desert species, Haloxylon ammodendron, in Central Asia up-scaled from sap flow measurement. Ecohydrology 2015, 8, 948–960. [Google Scholar] [CrossRef]
  52. Luo, G.P.; Chen, X.; Zhou, K.F.; Ye, M.Q. Temporal and spatial variation and stability of the oasis in the Sangong River watershed, Xinjiang, China. Sci. China Ser. D 2003, 46, 62–73. [Google Scholar] [CrossRef]
  53. Li, P.H.; Wang, Q. Retrieval of chlorophyll for assimilating branches of a typical desert plant through inversed radiative transfer models. Int. J. Remote Sens. 2013, 34, 2402–2416. [Google Scholar] [CrossRef]
  54. D&P instruments. Available online: http://www.dpinstruments.com (accessed on 29 October 2015).
  55. Labed, J.; Stoll, M.P. Spatial variability of land surface emissivity in the thermal infrared band: Spectral signature and effective surface temperature. Remote Sens. Environ. 1991, 38, 1–17. [Google Scholar] [CrossRef]
  56. Wu, C.-Y.; Jacobson, A.R.; Laba, M.; Baveye, P.C. Accounting for surface roughness effects in the near-infrared reflectance sensing of soils. Geoderma 2009, 152, 171–180. [Google Scholar] [CrossRef]
  57. Hubert, M.; Vanden Branden, K. Robust methods for partial least squares regression. J. Chemometr. 2003, 17, 537–549. [Google Scholar] [CrossRef]
  58. Lied, T.T.; Geladi, P.; Esbensen, K.H. Multivariate image regression (MIR): Implementation of image PLSR-first forays. J. Chemometr. 2000, 14, 585–598. [Google Scholar] [CrossRef]
  59. Haaland, D.M.; Thomas, E.V. Partial least-squares methods for spectral analyses .1. Relation to other quantitative calibration methods and the extraction of qualitative information. Anal. Chem. 1988, 60, 1193–1202. [Google Scholar] [CrossRef]
  60. Chen, S.; Hong, X.; Harris, C.J.; Sharkey, P.M. Sparse mzodeling using orthogonal forward regression with PRESS statistic and regularization. IEEE Trans. Syst. Man Cybern. B 2004, 34, 898–911. [Google Scholar] [CrossRef]
  61. Sinan, Z.; Quan, W. Inverse retrieval of chlorophyll from reflected spectra for assimilating branches of drought-tolerant tamarix ramosissima. IEEE J. Sel. Top. Appl. Earth Observ. Remote Sens. 2015, 8, 1498–1505. [Google Scholar] [CrossRef]
  62. Antonucci, F.; Pallottino, F.; Costa, C.; Rimatori, V.; Giorgi, S.; Papetti, P.; Menesatti, P. Development of a rapid soil water content detection technique using active infrared thermal methods for in-field applications. Sensors 2011, 11, 10114–10128. [Google Scholar] [CrossRef] [PubMed]
  63. Akaike, H. Information theory and an extension of the maximum likelihood principle. In Breakthroughs in Statistics; Kotz, S., Johnson, N., Eds.; Springer New York: New York, NY, USA, 1992; pp. 610–624. [Google Scholar]
  64. Rossel, R.A.V.; Behrens, T. Using data mining to model and interpret soil diffuse reflectance spectra. Geoderma 2010, 158, 46–54. [Google Scholar] [CrossRef]
  65. Hurvich, C.M.; Tsai, C.L. Regression and time-series model selection in small samples. Biometrika 1989, 76, 297–307. [Google Scholar] [CrossRef]
  66. Chang, C.W.; Laird, D.A.; Mausbach, M.J.; Hurburgh, C.R. Near-infrared reflectance spectroscopy-principal components regression analyses of soil properties. Soil Sci. Soc. Am. J. 2001, 65, 480–490. [Google Scholar] [CrossRef]
  67. Nawar, S.; Buddenbaum, H.; Hill, J. Digital mapping of soil properties using multivariate statistical analysis and ASTER data in an arid region. Remote Sens. 2015, 7, 1181–1205. [Google Scholar] [CrossRef]
  68. Hansen, P.M.; Schjoerring, J.K. Reflectance measurement of canopy biomass and nitrogen status in wheat crops using normalized difference vegetation indices and partial least squares regression. Remote Sens. Environ. 2003, 86, 542–553. [Google Scholar] [CrossRef]
  69. Lesaignoux, A.; Fabre, S.; Briottet, X. Influence of soil moisture content on spectral reflectance of bare soils in the 0.4–14 μm domain. Int. J. Remote Sens. 2012, 34, 2268–2285. [Google Scholar] [CrossRef]
  70. Mira, M.; Valor, E.; Boluda, R.; Caselles, V.; Coll, C. Influence of soil water content on the thermal infrared emissivity of bare soils: Implication for land surface temperature determination. J. Geophys. Res. Earth Surf. 2007, 112, F4. [Google Scholar] [CrossRef]
  71. Eisele, A.; Lau, I.; Hewson, R.; Carter, D.; Wheaton, B.; Ong, C.; Cudahy, T.J.; Chabrillat, S.; Kaufmann, H. Applicability of the thermal infrared spectral region for the prediction of soil properties across semi-arid agricultural landscapes. Remote Sens. 2012, 4, 3265–3286. [Google Scholar] [CrossRef]
  72. Hewson, R.D.; Cudahy, T.J.; Jones, M.; Thomas, M. Investigations into soil composition and texture using infrared spectroscopy (2–14 μm). Appl. Environ. Soil Sci. 2012, 2012, 1–12. [Google Scholar] [CrossRef]
  73. Eisele, A.; Chabrillat, S.; Hecker, C.; Hewson, R.; Lau, I.C.; Rogass, C.; Segl, K.; Cudahy, T.J.; Udelhoven, T.; Hostert, P.; et al. Advantages using the thermal infrared (TIR) to detect and quantify semi-arid soil properties. Remote Sens. Environ. 2015, 163, 296–311. [Google Scholar] [CrossRef]
  74. Mooney, J.; Kambhampati, P. Get the basics right: Jacobian conversion of wavelength and energy scales for quantitative analysis of emission spectra. J. Phys. Chem. Lett. 2013, 4, 3316–3318. [Google Scholar] [CrossRef]
  75. Hulley, G.C.; Hook, S.J.; Baldridge, A.M. Investigating the effects of soil moisture on thermal infrared land surface temperature and emissivity using satellite retrievals and laboratory measurements. Remote Sens. Environ. 2010, 114, 1480–1493. [Google Scholar] [CrossRef]
  76. Sahoo, A.K.; Pan, M.; Wood, E.F. Soil moisture retrieval using multi-channel passive microwave measurements through improved radiative transfer modelling. IAHS-AISH Publ. 2012, 352, 7–10. [Google Scholar]
  77. Zhan, X.W.; Anderson, M.; Liu, J.C. Merging thermal and microwave satellite observations for a high-resolution soil moisture data product. In Proceedings of the 2010 IEEE International Geoscience and Remote Sensing, Honolulu, HI, USA, 25–30 July 2010; pp. 4440–4441.
  78. Kochubey, S.M.; Kazantsev, T.A. Changes in the first derivatives of leaf reflectance spectra of various plants induced by variations of chlorophyll content. J. Plant Physiol. 2007, 164, 1648–1655. [Google Scholar] [CrossRef] [PubMed]
  79. Demetriades-Shah, T.H.; Steven, M.D.; Clark, J.A. High resolution derivative spectra in remote sensing. Remote Sens. Environ. 1990, 33, 55–64. [Google Scholar] [CrossRef]
  80. Cheng, J.; Liang, S.L.; Yao, Y.J.; Zhang, X.T. Estimating the optimal broadband emissivity spectral range for calculating surface longwave net radiation. IEEE Geosci. Remote Sens. Lett. 2013, 10, 401–405. [Google Scholar] [CrossRef]
  81. Coll, C.; Caselles, V.; Valor, E.; Niclos, R.; Sanchez, J.M.; Galve, J.M.; Mira, M. Temperature and emissivity separation from aster data for low spectral contrast surfaces. Remote Sens. Environ. 2007, 110, 162–175. [Google Scholar] [CrossRef]
  82. Tonooka, H. Accurate atmospheric correction of ASTER thermal infrared imagery using the WVS method. IEEE Trans. Geosci. Remote Sens. 2005, 43, 2778–2792. [Google Scholar] [CrossRef]

