Article

Meteosat Land Surface Temperature Climate Data Record: Achievable Accuracy and Potential Uncertainties

by
Anke Duguay-Tetzlaff
1,*,
Virgílio A. Bento
2,†,
Frank M. Göttsche
3,†,
Reto Stöckli
1,†,
João P. A. Martins
2,4,†,
Isabel Trigo
2,4,†,
Folke Olesen
3,†,
Jędrzej S. Bojanowski
1,†,
Carlos Da Camara
4,† and
Heike Kunz
1
1
Federal Office of Meteorology and Climatology MeteoSwiss, Operation Center 1, CH-8058 Zurich-Airport, Switzerland
2
Instituto Dom Luiz, University of Lisbon, IDL, Campo Grande, Ed C1, 1749-016 Lisbon, Portugal
3
Karlsruhe Institute of Technology, KIT, Hermann-von-Helmholtz-Platz 1, D-76344 Eggenstein-Leopoldshafen, Germany
4
Instituto Português do Mar e da Atmosfera, I.P., Rua C do Aeroporto, 1749-077 Lisbon, Portugal
*
Author to whom correspondence should be addressed.
These authors contributed equally to this work.
Remote Sens. 2015, 7(10), 13139-13156; https://doi.org/10.3390/rs71013139
Submission received: 29 July 2015 / Revised: 15 September 2015 / Accepted: 25 September 2015 / Published: 2 October 2015

Abstract

:
The European Organization for the Exploitation of Meteorological Satellites’ (EUMETSAT) Meteosat satellites provide the unique opportunity to compile a 30+ year land surface temperature (LST) climate data record. Since the Meteosat instrument on-board Meteosat 2–7 is equipped with a single thermal channel, single-channel LST retrieval algorithms are used to ensure consistency across Meteosat satellites. The present study compares the performance of two single-channel LST retrieval algorithms: (1) A physical radiative transfer-based mono-window (PMW); and (2) a statistical mono-window model (SMW). The performance of the single-channel algorithms is assessed using a database of synthetic radiances for a wide range of atmospheric profiles and surface variables. The two single-channel algorithms are evaluated against the commonly-used generalized split-window (GSW) model. The three algorithms are verified against more than 60,000 LST ground observations with dry to very moist atmospheres (total column water vapor (TCWV) 1–56 mm). Except for very moist atmospheres (TCWV > 45 mm), results show that Meteosat single-channel retrievals match those of the GSW algorithm by 0.1–0.5 K. This study also outlines that it is possible to put realistic uncertainties on Meteosat single-channel LSTs, except for very moist atmospheres: simulated theoretical uncertainties are within 0.3–1.0 K of the in situ root mean square differences for TCWV < 45 mm.

Graphical Abstract

1. Introduction

Land surface temperature (LST) is an important climate state variable. Precise estimates of the radiative surface skin temperature are essential to compute the surface radiative and sensible heat balance [1]. Moreover, LST is a key variable for a wide range of applications related to land surface processes, such as drought [2] and evaporation monitoring [3]. Satellite-based LSTs are important for the evaluation of surface-emitting temperatures in climate models at various time scales [1]. Ideally, they can also be assimilated into land surface models [4,5,6] to improve numerical weather and climate model predictions.
This wide range of applications makes a long-term homogeneous LST climate data record (CDR) highly desirable [7]. Large-scale LST can only be measured by satellite instruments [8] and is best represented by measurements of geostationary satellite sensors, as it is subject to strong diurnal variation [9,10]. Geostationary LST climate data records (CDRs) are available from the International Satellite Cloud Climatology Project (ISCCP) [11] and the Pathfinder Atmospheres-Extended dataset (PATMOS-x) [8]. The global ISCCP LST CDR has several limitations, as the primary goal of the ISCCP analysis was the retrieval of cloud properties and not LST. The strongest limitation is the very coarse 30 km spatial resolution and, to a lesser extent, the 3-h temporal resolution [11]. Moreover, the original ISCCP retrieval assumes that all surfaces behave like a black body with unit emissivity, which can lead to significant LST retrieval errors, particularly in dry regions (e.g. [12]). The PATMOS-x geostationary LST CDR is only available for the Geostationary Operational Environmental Satellite (GOES) field of view (North and South America).
Starting in 1983, the European’s Organization for the Exploitation of Meteorological Satellites (EUMETSAT) Meteosat First (MFG) and Second Generation (MSG) satellites have provided the unique opportunity to compile a 30+ year LST CDR with a 30-min temporal and 5-km spatial resolution over Africa and Europe. Since the Meteosat Visible and Infra-Red Imager (MVIRI) on-board Meteosat 2–7 is equipped with a single thermal infrared channel, single-channel LST retrieval models can ensure consistency across all Meteosat satellites. A consistent approach maximizes long-term and inter-satellite consistency [8].
Most state-of-the-art satellite-based LST retrieval models, such as the Meteosat LST model from the Satellite Application Facility on Land Surface Analysis (LSA SAF), employ the generalized split-window model (GSW) [13,14,15], where atmospheric absorption is estimated through a two-channel regression of top-of-atmosphere (TOA) brightness temperatures. This atmospheric correction is less dependent on atmospheric ancillary data than single-channel LST models, which depend completely on ancillary data from numerical weather prediction (NWP) models to estimate the atmospheric state. They range from statistical mono-window models (SMW), which use the observed 11 μm radiance, the total column water vapor (TCWV) from NWP models and a priori fitted LST model parameters [16,17] to physical mono-window models (PMW), which are based on radiative transfer modelling [8,18,19]. PMWs require significantly more processing time than SMWs, as PMW algorithms run radiative transfer models for each satellite acquisition, while SMW algorithms estimate the correction term using a pre-computed statistical relationship. Reported accuracies are 1–2 K for GSW [12,20,21], 2.5 K or less for PMW [8,19] and 2–4 K for SMW [22]. Those performance metrics from the literature cannot be compared, since they refer to different satellite sensors with distinct viewing geometries, with variations in instrument calibration and different validation data for a physical parameter (LST), which is highly variable in time and space [8,10,23]. In order to investigate the achievable accuracy of Meteosat single-channel LST models, the models have to be exercised in a comparable setting. This study tries to answer the following questions: To what extent can a single-channel LST model achieve the accuracy of a two-channel LST model? Does a PMW outperform an SMW? Can we characterize uncertainties for single-channel Meteosat LSTs?
To address those questions, we compare SMW, PMW and GSW using identical satellite observations from MSG. The evaluation is based on more than 60,000 in situ LST measurements from four dedicated LST validation stations operated by the Karlsruhe Institute of Technology (KIT). The stations are located in different climate zones and include dry to very moist atmospheres. Furthermore, we perform a series of sensitivity analyses to test the robustness of single-channel LST models to input uncertainties. The characterization of input uncertainty and its propagation towards the final LST retrievals is important for the estimation of product uncertainties, which can ultimately be used as quality indicators by users. This study is unique in that it compares PMW, SMW and GSW LST retrievals from identical satellite acquisitions with a large number of in situ measurements across different climate zones.

2. Data and Methods

2.1. Satellite Data

We used data from the EUMETSAT MSG satellite. The MSG satellite carries the Spinning Enhanced Visible and Infrared Imager (SEVIRI), a radiometer that measures the Earth every 15 min with a footprint of about 3 km at nadir. MSG is positioned at 0° longitude over the equator and views KIT’s four validation stations at low (25°, Dahra site) to moderate satellite viewing angles (45°, Evora site). LST was estimated in this study from TOA radiances of SEVIRI’s 10.8 μm channel. The standard calibration provided by EUMETSAT is applied in the study to generate TOA radiances and brightness temperatures.
The LSA SAF team provided MSG 2 TOA 10.8 μm brightness temperatures, the LSA SAF cloud mask, the LSA SAF surface emissivity and the LSA SAF generalized split-window (GSW) LST retrieval on a 3 × 3 pixel window centered on the ground stations for the year 2010. The extracted time series had a temporal resolution of 15 minutes. We collocated satellite data and available KIT in situ measurements from the year 2010 and ran a PMW and an SMW model using the TOA 10.8-μm brightness temperature together with the LSA SAF surface emissivity. We only considered satellite data that were classified as cloud free in the entire 3 × 3 pixel window by the cloud masking. Overall, this analysis included about 60,000 collocated in situ and satellite observations. The in situ data, as well as the different LST models are described in detail in the following sections.

2.2. Generalized Split-Window Model

The LSA SAF applies the GSW model with a formulation similar to that proposed by Wan and Dozier [13,14] and adapted by Trigo et al. [15] and Freitas et al. [12] to the SEVIRI split-window channels. LST is obtained through a semi-empirical regression of SEVIRI 10.8- and 12.0-μm TOA brightness temperatures, where the correction of atmospheric influences is based on the different absorption of two adjacent infra-red bands [12]. The LST is estimated through a linear regression of the split-window TOA brightness temperatures. The regression coefficients depend explicitly on the land surface emissivity and implicitly on the TCWV obtained from the European Centre for Medium-Range Weather Forecasts (ECMWF) operational forecasts and the satellite view zenith angles (VZA) [15]. The surface emissivity is provided for the split-window channels using a method based on the fraction of vegetation cover (FVC), also estimated by the LSA SAF from seviri visible and near-infrared channels [12,24]. Thus, the emissivity computation is driven by the vegetation state and takes into account daily FVC estimates from SEVIRI measurements and a global land cover classification [12,24].
Reported uncertainties for the LSA SAF LST dataset are in the range of 1–2 K [12], except for very moist atmospheres. A detailed description of the LSA SAF model can be found in the corresponding Algorithm Technical Base Document [15]; see also [12]. We used LST data from the LSA SAF archive for model inter-comparisons, which we label “GSW” LST in the following.

2.3. Physical Mono-Window Model

We applied a PMW model to the Meteosat time series described in Section 2.1. The PMW model used here is based on radiative transfer runs. Radiative transfer models can be used to estimate the upward and downward atmospheric path radiance ( L , L ) and the atmospheric transmittance ( τ ) in the thermal infrared for a specific atmospheric profile [18]. The downward atmospheric path radiance ( L ) is the hemispherically-averaged downward radiance. Approximating the Earth’s surface as a Lambertian emitter-reflector and neglecting atmospheric scattering, the radiance L c ( θ ) , recorded in channel c of a sensor onboard a satellite observing the Earth’s surface under view zenith angle θ may be written as (e.g., [25]):
L c ( θ ) = ε c B c ( T s ) τ c ( θ ) + L c ( θ ) + L c ( 1 ε c ) τ c ( θ )
where ε c and T s denote land surface emissivity and LST, respectively. The calibrated Planck function B c ( T s ) provides the radiance emitted by a blackbody at temperature T s in channel c. The parameters τ c , L c ( θ ) and L c in Equation (1) are the corresponding surface to top of the atmosphere (TOA) transmittance and the atmospheric upward and downward radiances, respectively. These three parameters can be estimated based on the atmospheric humidity and temperature profiles. For a channel of finite spectral band width, the calibrated Planck function in the frequency domain may be approximated as:
B c ( T s ) c 1 ν c 3 exp ( c 2 ν c αT s + β ) 1
where c1, c2 are constants and α, β and νc depend on the spectral characteristics of the channel to be used.
Inverting Equations (1) and (2) (e.g., [21,25]), the thermal radiance L c ( θ ) measured at the sensor level can then be used to estimate LST:
T s ( c 2 ν c  ln ( c 1 ν c 3 τ c ( θ ) ε c L c ( θ ) L c ( θ ) L c ( 1 ε c ) τ c ( θ ) + 1 ) β ) /  α
The PMW LST in this study was calculated with Equation (3) for SEVIRI 10.8-μm clear-sky TOA brightness temperatures described in Section 2.1, together with surface emissivities ( ε c ) taken from the operational LSA SAF dataset [26]. Values of L c ( θ ) , L c and τ c ( θ ) were obtained via the Radiative Transfer for the Television Infrared Observation Satellite Operational Vertical Sounder code (RTTOV, Version 11.2), which is a fast radiative transfer model used operationally at the ECMWF [27]. RTTOV is significantly faster than the commonly-used Moderate Resolution Atmospheric Transmission (MODTRAN) line-by-line radiative transfer code [28]. It uses pre-computed transmittance look-up-tables (LUTs) calculated from a spectroscopic database [29]. PMWs require radiative transfer runs during the satellite data processing. For large data processing, it is hence crucial to run a fast radiative transfer model. Bento [30] has recently compared simulated MODTRAN and RTTOV TOA brightness temperatures and reports an overall bias of about 0.2 K in the SEVIRI spectral range, which is close to the SEVIRI instrumental noise.
RTTOV runs performed in this study used atmospheric profiles (temperature and specific humidity) from the ECMWF ERA-Interim reanalysis dataset as input [31], which are available 6-hourly at a spatial resolution of about 75 km. RTTOV simulations for model atmospheres with 21 pressure levels (1000–1 hPa) were performed using the ERA-Interim profiles closest in time and space to each satellite observation.

2.4. Statistical Mono-Window Model

The third LST model we tested is an SMW model. SMWs consist of empirical approaches that relate TOA brightness temperatures of a single atmospheric window channel to LST [16,22,25], generally via a simple linear regression. Here, we linearized the radiative transfer equation, while at the same time maintaining an explicit dependency on surface emissivity:
T s = T b ( θ ) ε c + B 1 ε c + C
where T b is the TOA brightness temperature in channel c and ε c stands for the corresponding spectral surface emissivity.
We estimated the regression coefficients A, B and C for different classes of TCWV and VZA. Following Freitas et al. [12] for the operational LSA SAF GSW model and Freitas et al. [22] for a single-channel LST model for the GOES satellite series, the calibration/validation of Equation (4) made use of synthetic radiances obtained with the radiative transfer model MODTRAN 4.0. We selected MODTRAN and not RTTOV to tune the SMW model, as we assume the line-by-line MODTRAN model to be slightly more accurate than the “broad band” RTTOV model. In contrast to the PMW model, the processing speed of the radiative transfer model is more or less irrelevant for SMW, as the radiative transfer simulations are only computed once to establish the model coefficients.
MODTRAN simulations were performed for a range of clear sky atmospheric profiles and surface variables representative for global conditions [32]. The synthetic radiances were split into two subsets: (1) A training dataset for determining the statistical mono-window coefficients (Equation 4); and (2) an independent dataset for model verifications. The training dataset comprises 116 carefully-chosen profiles to encompass the bivariate distribution of TCWV and LST. A total of over 845,000 simulations was obtained by varying the viewing geometry and surface conditions for each profile over the following ranges: (1) VZA from 0° to 75°; (2) surface emissivity between 0.926 and 0.998; and (3) surface temperatures ranging from near surface air temperature minus 15 K to near surface air temperature plus 15 K. Following the approach of Freitas et al. [22], coefficients A, B and C in Equation (4) were then determined for 8 different TCWV classes (0 cm–6 cm in steps of 7.5 mm) and 15 VZA classes (0°–75° in steps of 5°).
We applied the above described SMW model to the extracted SEVIRI 10.8-μm clear-sky TOA brightness temperature time series. As for the PMW and GSW model, surface emissivities ( ε c ) for the SMW are taken from the operational LSA SAF dataset [26].

2.5. Theoretical Uncertainty Characterization

Potential LST retrieval errors were assessed through the use of the synthetic validation database described in Section 2.4, which contained over 15,500 independent simulations. For the uncertainty analysis presented in this study, we followed the approach of Freitas et al. [12]. We provided TOA brightness temperatures, surface and atmospheric information from the database as input to the SMW and PMW model; the calculated LST output was then compared with the corresponding (“true”) surface temperature from the database. In addition to the model error, we assessed the sensitivity of the SMW and PMW to radiometric noise, uncertainty in surface emissivity and NWP by superimposing artificial errors to PMW and SMW inputs.
The value used for SEVIRI 10.8-μm radiometric noise is based on radiometric performances for SEVIRI IR 10.8 μm compared to the Infrared Atmospheric Sounding Interferometer (IASI) (bias < 0.2 K) [33]. Values for noise in brightness temperature were generated from a uniform random distribution within the conservative interval (−0.3 K, 0.3 K).
For the estimation of the surface emissivity error, we took into account that bare ground and semi-arid surfaces (generally with lower emissivities) present higher variability and, therefore, higher uncertainty than areas covered by vegetation. As such, emissivity uncertainties used in this study were obtained from random uniform distributions within the intervals (−0.04, 0.04) for εc < 0.95, (−0.02, 0.04) for 0.95 ≤ εc < 0.98 and (−0.01, 0.01) for εc ≥ 0.98 The rationale for this choice is based on emissivity variability for bare ground surfaces (εc < 0.95), sparsely- (0.95 ≤ εc < 0.98) and densely- (εc ≥ 0.98) vegetated areas [12].
The PMW model requires a characterization of the errors associated with the atmospheric profiles. Since these are obtained from ERA-Interim nearest in space and time to the satellite observation, we assume that the uncertainty in collocation may be used as a measure of the profile uncertainty. Thus, the impact of profile errors on retrieved LST values was estimated by replacing the profiles at hour h by the corresponding ones at hour h + 6. A similar procedure was used to determine the impact of TCWV errors on LST estimates from the SMW. It is worth recalling that TCWV is an implicit input to the SMW: This variable is used to determine the regression coefficients (Equation (4)). Therefore, and as explained in detail in Freitas et al. [12], studies of the impact of TCWV uncertainties on LST need to combine: (i) The effect on the LST estimate due to the choice of the wrong set of coefficients; and (ii) the probability of that event.

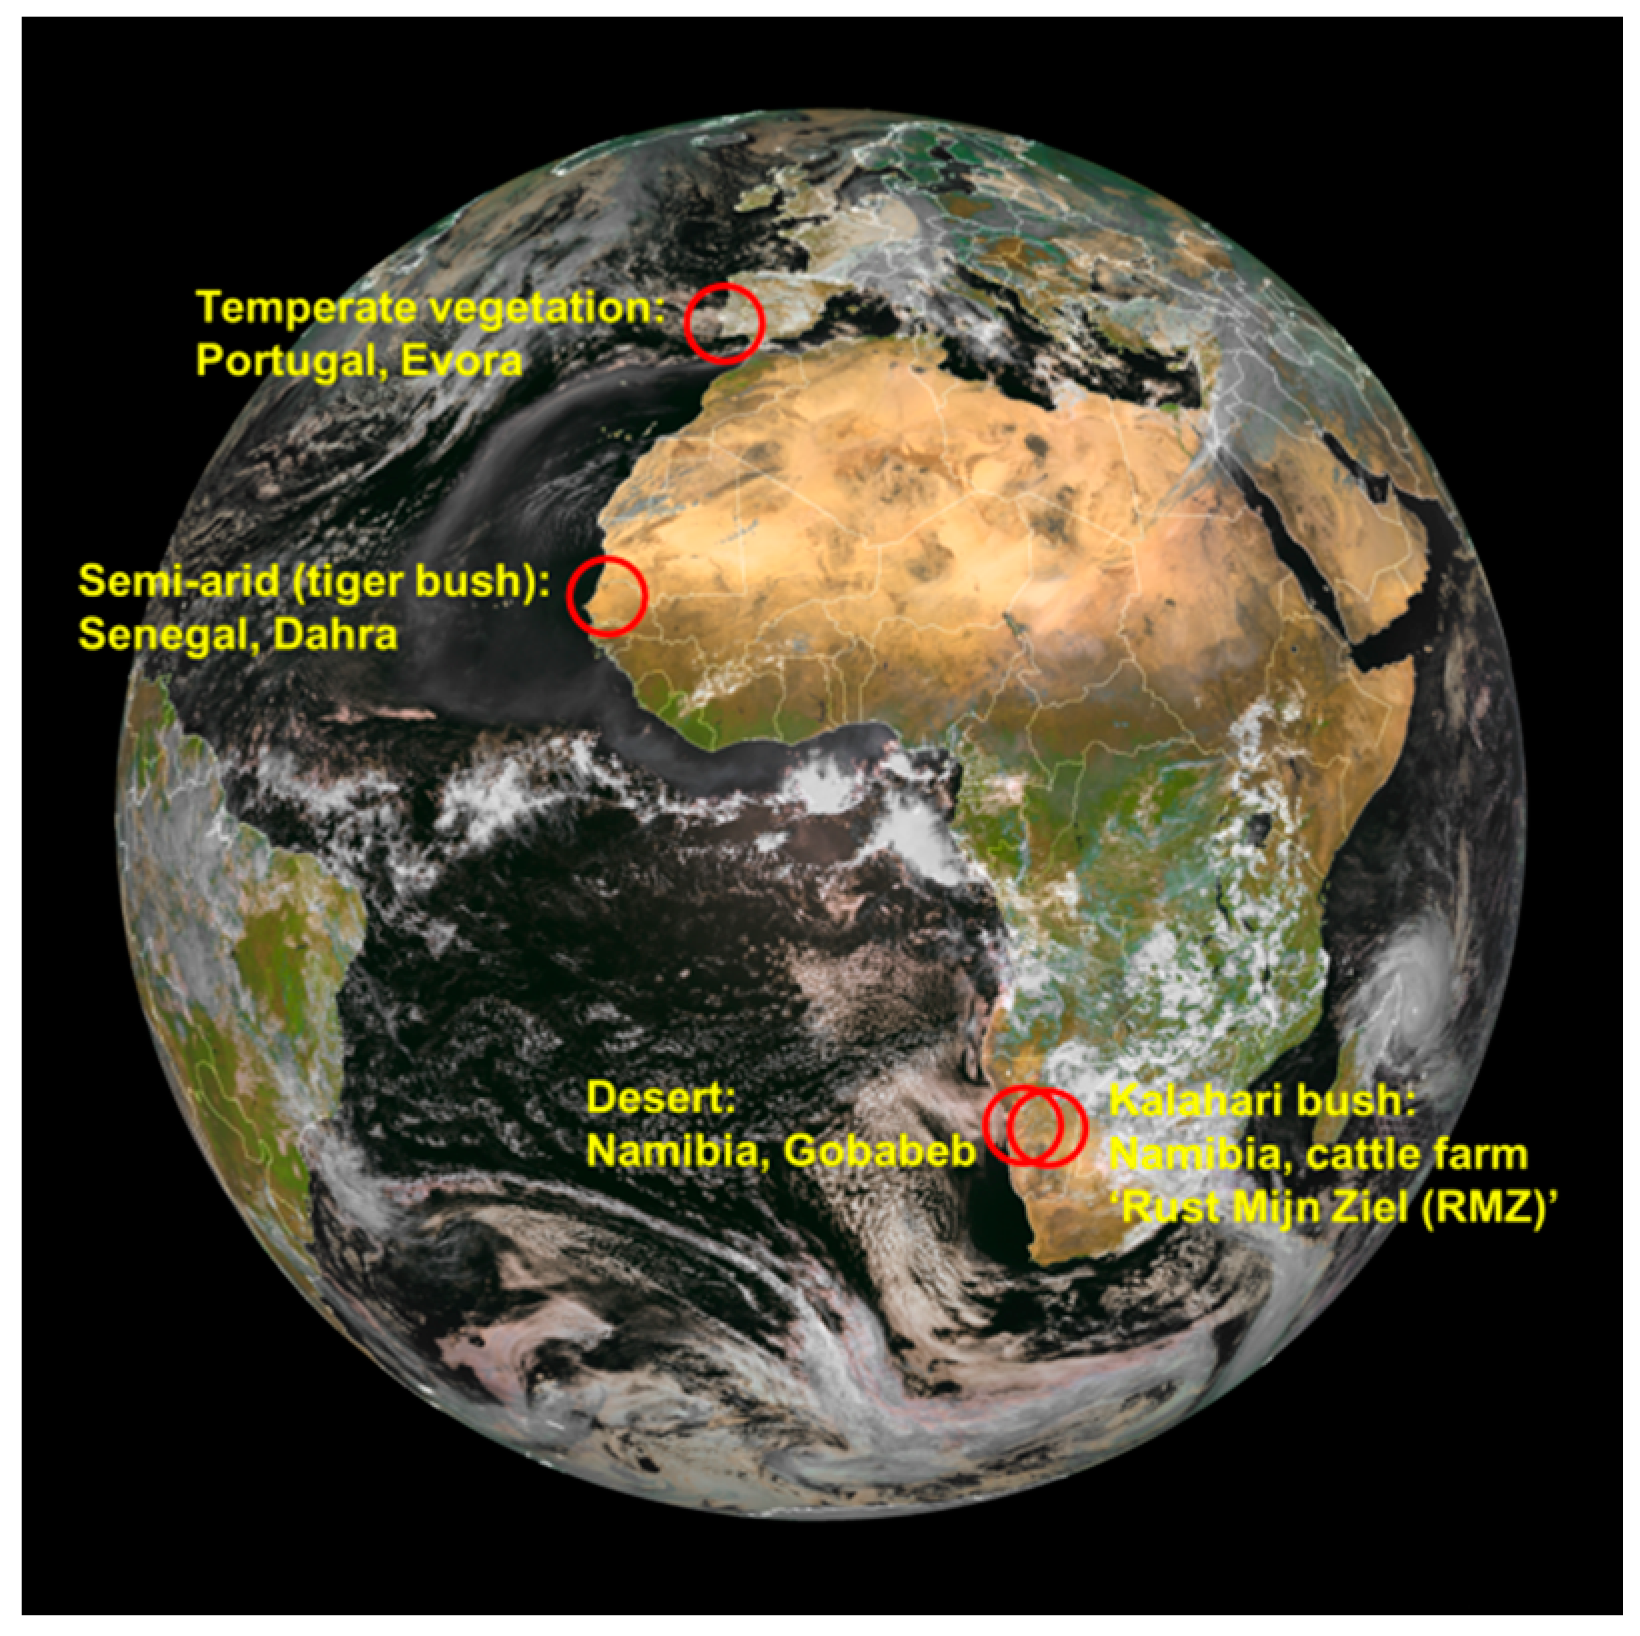
2.6. Ground-Based LST Measurements

The KIT operates four permanent validation stations for satellite-based LST retrieval. The stations, being part of LSA-SAF’s validation effort and supported by EUMETSAT, were specifically chosen and designed to validate LST derived from MSG/SEVIRI. They are located in large homogenous areas within the field of view of the METEOSAT satellites and lie in different climate zones, which provides a broad range of atmospheric conditions for product validation [34]. The locations of the four validation stations on the SEVIRI Earth disk are indicated in Figure 1. An overview of the KITs validation sites is provided in Table 1.
Figure 1. Locations of the Karlsruhe Institute of Technology’s (KIT) validation stations on the Meteosat Second Generation (MSG)/Spinning Enhanced Visible and Infrared Imager (SEVIRI) disk.
Remotesensing 07 13139 g001
In principle, LST datasets can readily be validated with ground-truth radiometric measurements. However, this so-called ‘temperature-based validation’ is largely complicated by the spatial scale mismatch between satellite- and ground-based sensors: areas observed by ground radiometers usually cover about 10 m2, whereas satellite measurements in the thermal infrared typically cover between 1 km2 and 100 km2 [34]. Furthermore, natural land covers and the corresponding land surface temperatures are spatially quite heterogeneous: therefore, for validation measurements to be representative for satellite-derived LST, they have to be performed in areas that are homogenous at the satellite pixel scale. The size of the area that needs to be viewed by the validation instrument at the ground depends on the within-pixel variability of the surface and on how well measurements of several “end members” can be mixed in order to obtain a representative value for the satellite pixel. This so-called end-member-cover method is based on a linear spectral mixing approach and assumes that the total IR radiance emitted by the land surface within a satellite pixel can be reasonably well approximated by a linear mixture of the IR radiance emitted by the relevant surface cover types within that area [35]. The mixing of measurements obtained for different end-members requires information on their respective fractions within the sensor’s field of view and also on scene emissivity [26,36,37]. At KIT’s validation sites, the relevant spectral end-members (e.g., trees, grassland and background soil) were determined from an independent component analysis of high-resolution satellite data (visible and near-infrared). The fractional coverages of the determined end-members were then obtained by land cover classification [35].
Table 1. Overview of KITs validation stations. TCWV, total column water vapor.
DahraRMZGobabebEvora
LocationSenegalNamibiaNamibiaPortugal
Lat.: 15.402336
Lon.: −15.432744
Lat.: −23.010532
Lon.:18.352897
Lat.: −23.550956
Lon.: 15.05138
Lat.: 38.540244
Lon.: −8.003368
Elevation90 m1450 m406 m230 m
Climate ZoneTropical Wet-DrySteppeDesertMediterranean
TCWV 201017 to 56 mm2 to 28 mm1 to 38 mm2 to 43 mm
VegetationGrassland; 96% grass,4% treeSavanna; 85% grass/soil, 15% treeBaren; 32% tree, 68% grassWoody savanna with isolated groups of evergreen oak trees
The main instrument for the in situ determination of LST at KIT’s validation stations is the precision radiometer “KT15.85 IIP” produced by Heitronics GmbH, Wiesbaden, Germany. KT15.85 IIP radiometers measure thermal infra-red radiance between 9.6 µm and 11.5 µm, have a temperature resolution of 0.03 K and an accuracy of ±0.3 K over the relevant temperature range [38]. The KT15.85 IIP has a drift of less than 0.01% per month: The high stability is achieved by linking the radiance measurements via beam-chopping (a differential method) to internal reference temperature measurements and was confirmed by a long-term parallel run with the self-calibrating radiometer “RotRad” from Commonwealth Scientific and Industrial Research Organisation (CSIRO), which is continuously stabilized with 2 blackbodies [37]. The parallel run at the Evora site started in April 2005; a year later, the agreement between the instruments was still excellent (correlation 0.99). Due to the KT-15.85 IIP’s narrow spectral response function and the small distance between the radiometers and the surface atmospheric attenuation of the surface-leaving, thermal infrared radiation is negligible. However, the measurements of the surface-observing KT-15.85 IIPs contain radiance emitted by the surface (i.e., the target signal), as well as reflected downward IR radiance from the atmosphere, which needs to be corrected for [34]. Therefore, at each station, an additional KT-15.85 IIP measures downward longwave IR radiance from the atmosphere at 53° VZA: measurements under that specific zenith angle are directly related to downward hemispherical radiance [39], so that no ancillary data for deriving ground truth LST are needed.
Accurate estimations of land surface emissivity (LSE) are essential for obtaining satellite LST products, but also for limiting the uncertainty of ground-based LST estimates. Especially sites with larger fractions of bare ground are prone to be misrepresented in satellite-retrieved LSEs: Comparisons with in situ LSE revealed that over arid regions, satellite-retrieved LSEs differ by more than 3% [36]. Since for vegetated sites, LSE is a dynamic quantity, we use LSA-SAF’s daily LSE to derive in situ LST from the in situ radiance measurements at Dahra (Senegal, tiger bush, 45 m a.s.l.), Rust Mijn Ziel (RMZ) (Namibia, Kalahari bush, 1450 m a.s.l.) and Evora (Portugal, cork-oak tree forest, 230 m a.s.l.). In situ LST at the desert site Gobabeb (Namibia, gravel plains, 450 m a.s.l.) is derived using a static emissivity obtained from in situ measurements [36].

3. Results and Discussions

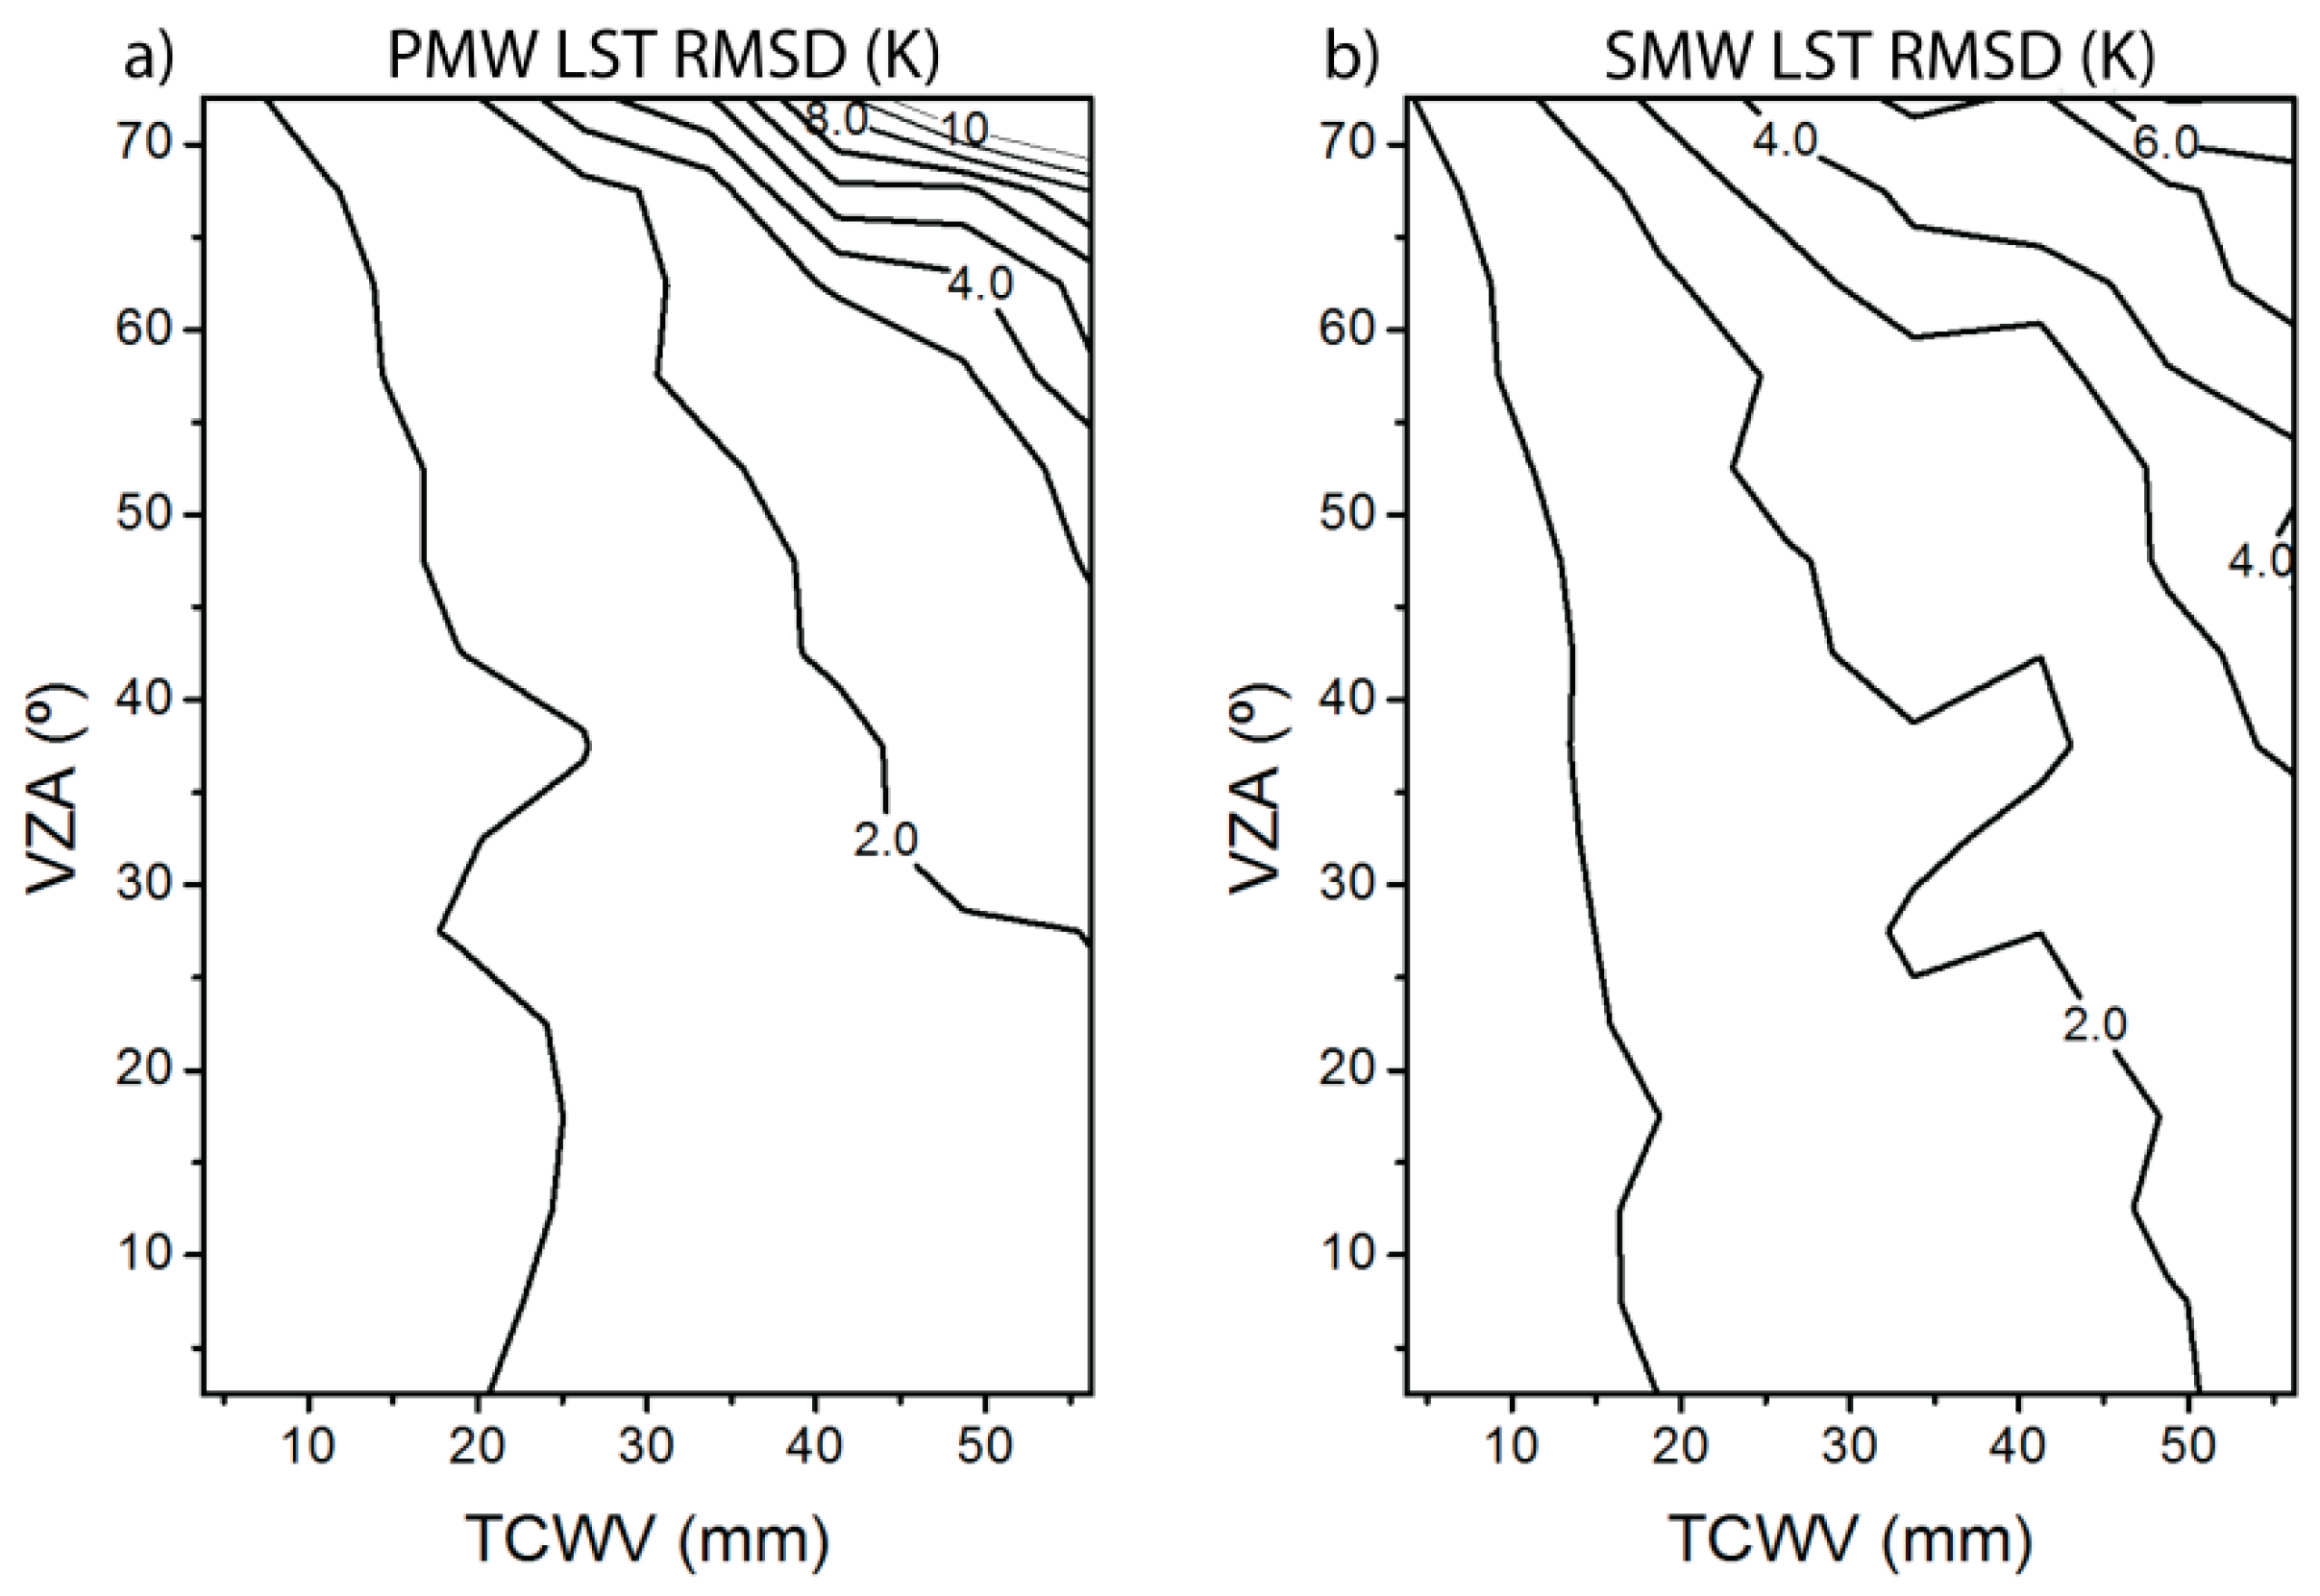
3.1. Theoretical Uncertainty Analysis

The total impact of model and input uncertainties, including uncertainties in surface emissivity, NWP and sensor calibration, measured as the root mean square difference (RMSD) of retrieved LST versus the “true” surface temperature in the database, is presented in Figure 2 for different values of VZA and TCWV. RMSD and bias obtained for the validation database are shown in Table 2.
Figure 2. Theoretical uncertainty for MSG/SEVIRI LST estimates. (a) Physical radiative transfer-based mono-window model (PMW); (b) statistical mono-window model (SMW). The values are the root mean square differences, assuming model and input uncertainties. VZA, satellite viewing angle.
Remotesensing 07 13139 g002
The 2 K target accuracy (RMSD) of the LSA SAF LST dataset is reached for the majority of angles and TCWV classes for PMW and SMW, degrading into larger errors for very moist atmospheres with high angles, i.e., for very large optical paths. The slopes of the lines in Figure 2 suggest that TCWV errors are most relevant for low-to-moderate view angles. For very moist atmospheres (TCWV > 50 mm) and high viewing angles (VZA > 55 mm), the SMW performed slightly better than the PMW. We hypothesize that this reflects the implicit sensitivity of the PMW to the NWP input: Freitas et al. [12] showed that uncertainties in atmospheric profiles can have a strong impact on LST retrievals. While SMWs only require TCWV as input, PMWs require atmospheric temperature and water vapor profiles, which can introduce additional uncertainties, especially for very moist atmospheres. We found that LST errors associated with emissivity uncertainties are expected to be within 1.0 K and 2.8 K in 90% of the estimates obtained with the SWM and PWM model, respectively. However, the impact of emissivity in both models is much smaller under moist atmospheres.
Table 2. Theoretical uncertainty for MSG/SEVIRI LST estimates for the PMW and SMW. RMSD and bias associated with both model and input uncertainty.
PMWSMW
RMSD (K)BIAS (K)RMSD (K)BIAS (K)
TCWV ≤ 45 mm1.6−0.21.6−0.1
TCWV > 45 mm3.3−1.13.4−0.6
The PMW and SMW uncertainties we simulated for TCWVs ≤ 45 mm (RMSD of 1.6 K) more or less correspond to the uncertainties reported by Freitas et al. [12] for GSW. For moister atmospheres (TCWVs > 45 mm) the PMW and SMW uncertainties (RMSD of up to 10 K and 6 K, respectively) significantly exceed the simulated GSW uncertainties (max. error about 4.5 K; Freitas et al. [12]), particularly for high VZAs. This very likely demonstrates the different sensitivity of the single-channel and GSW models to uncertainties related to inaccurate NWP input. Single-channel models rely entirely on NWP data to estimate the atmospheric state, while the two split-window channels provide additional information about the atmospheric absorption for the GSW model [8].

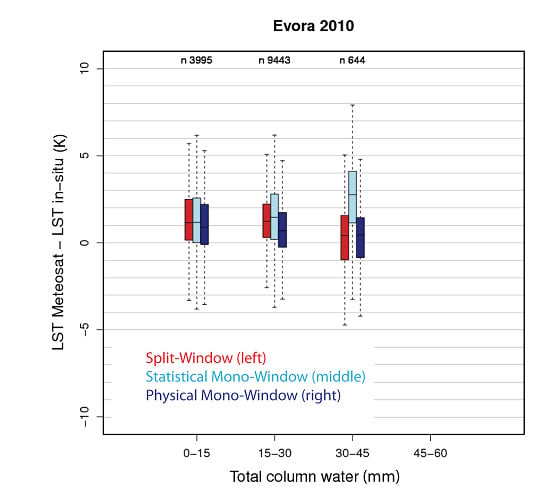
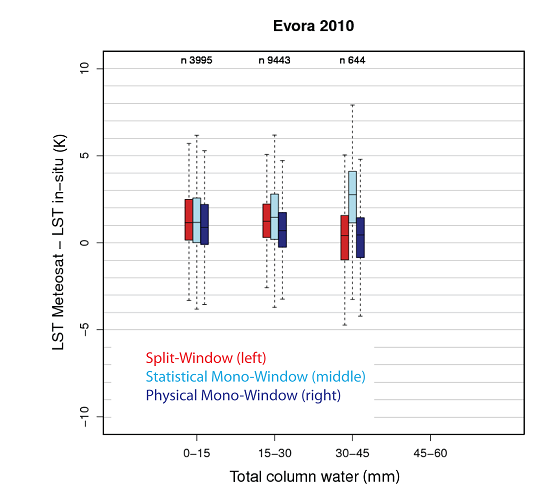
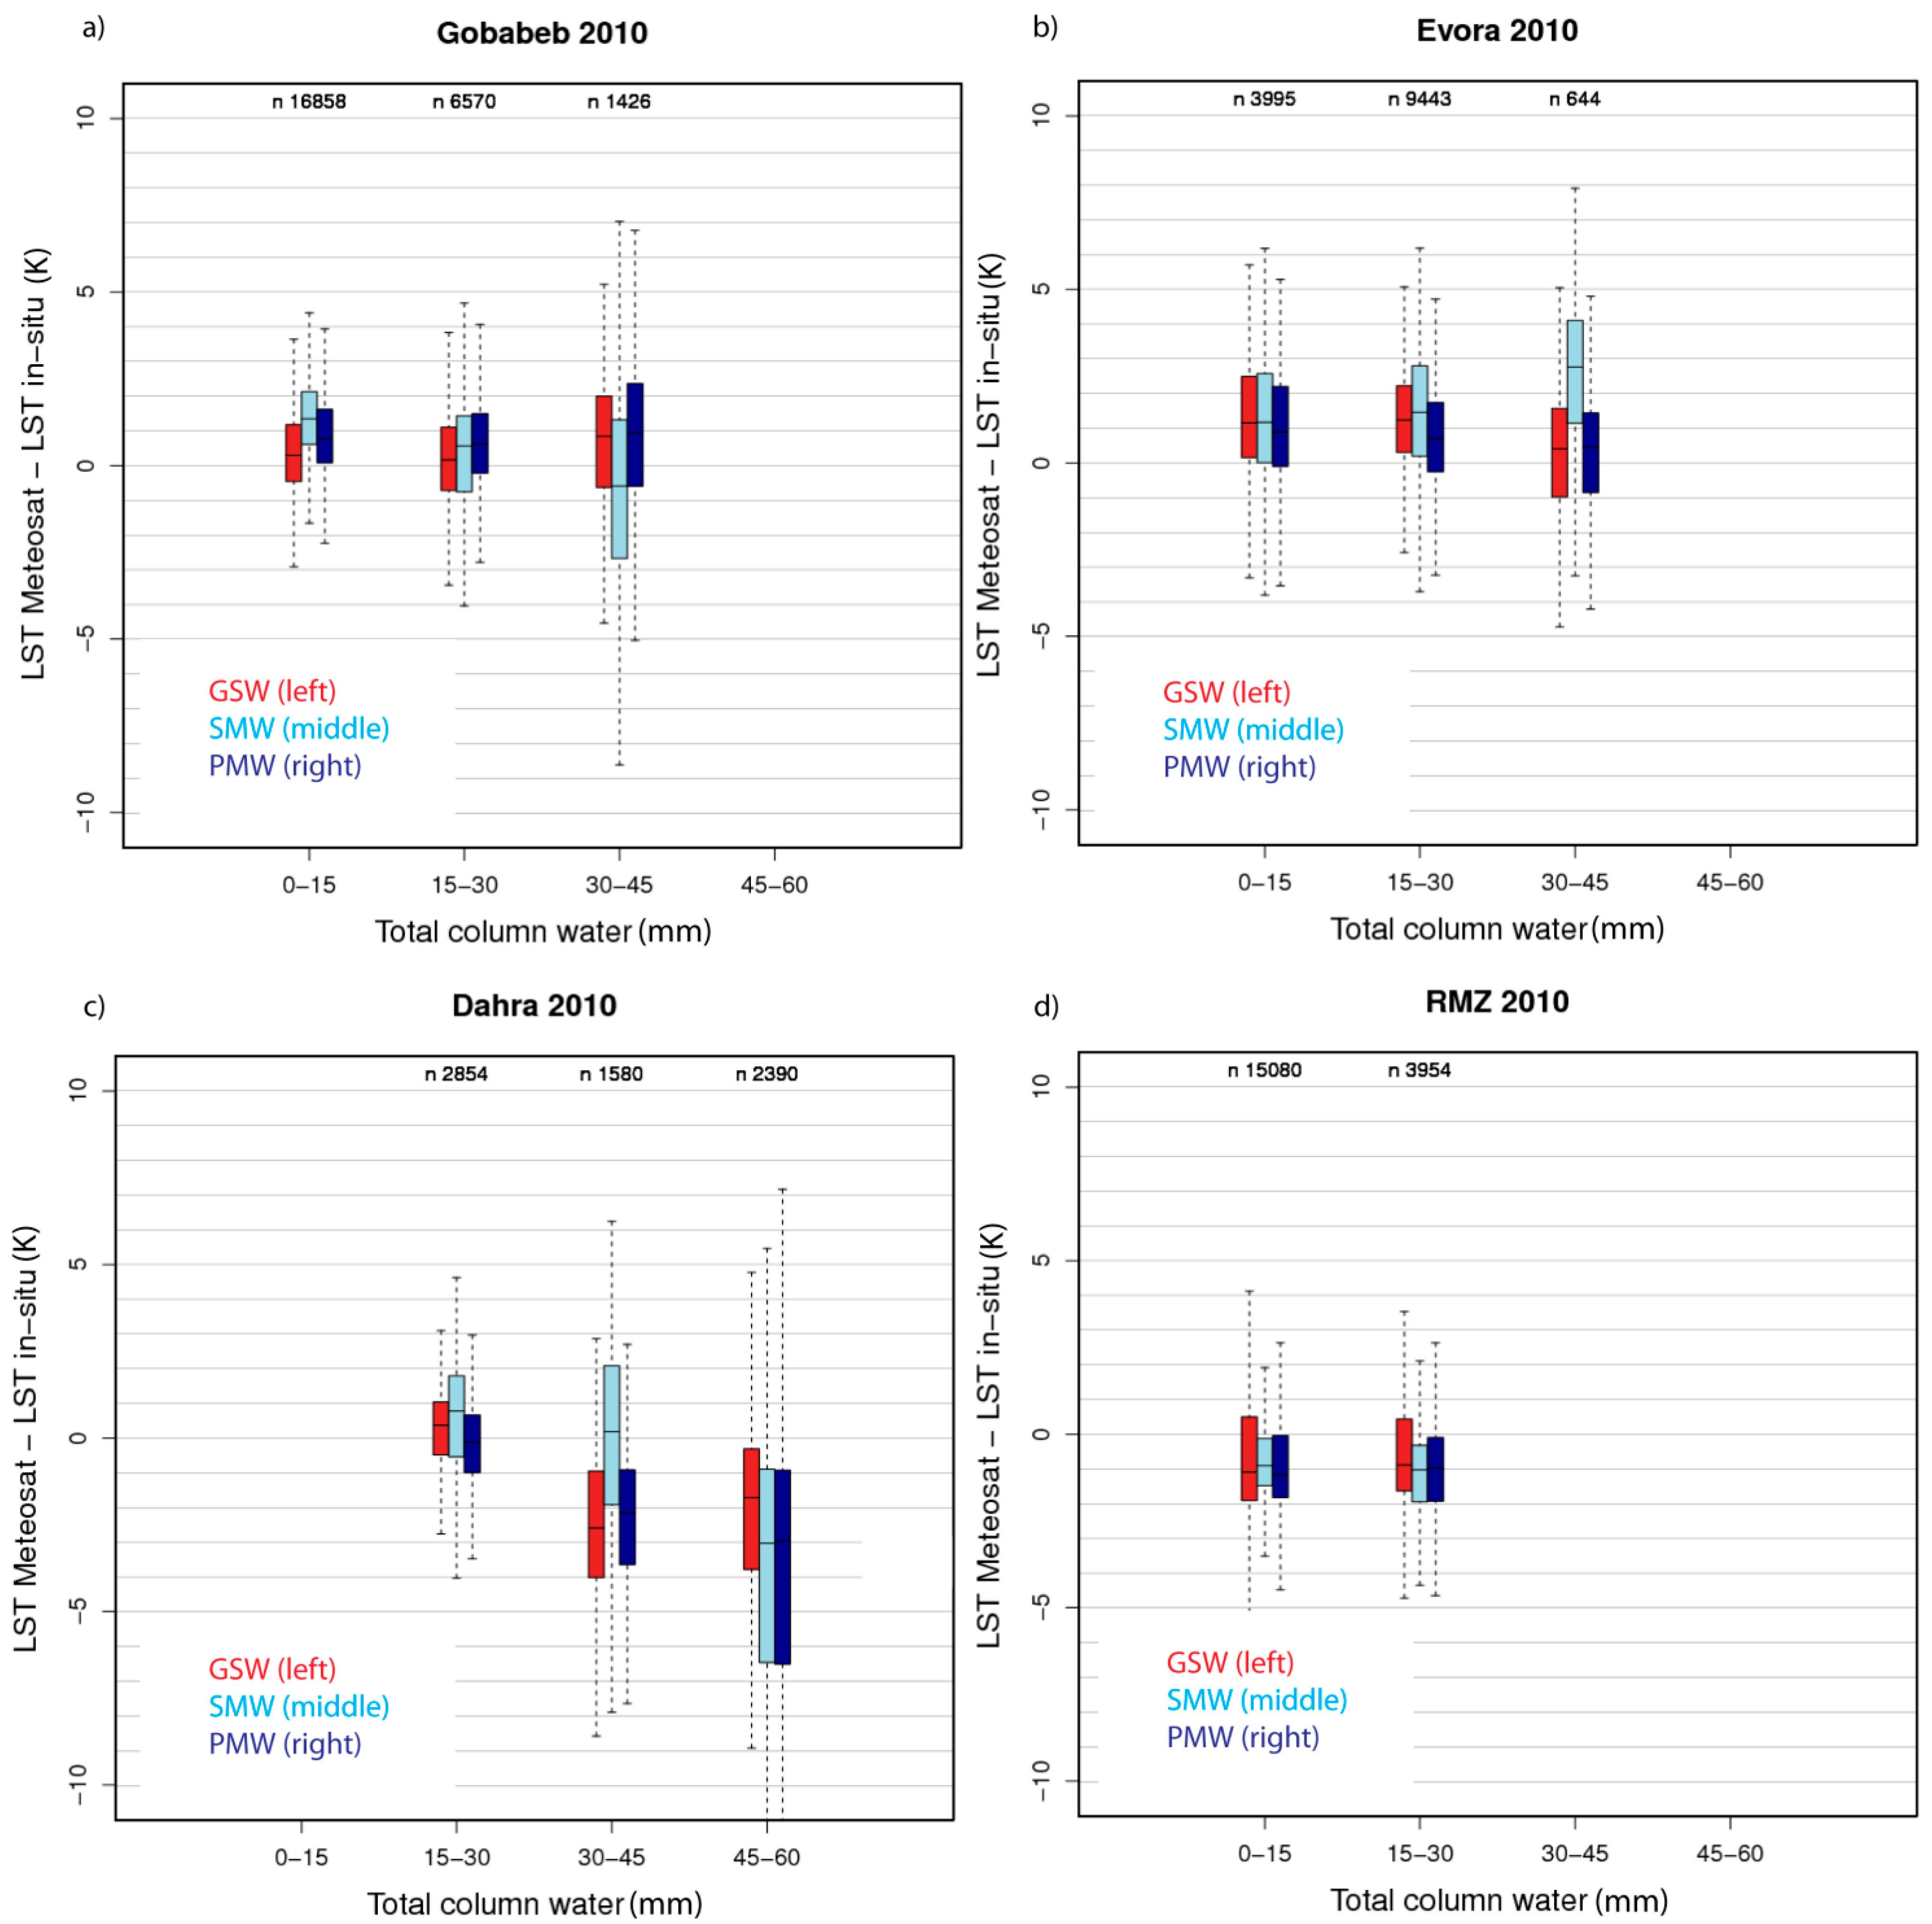
3.2. Ground-Based Validation

For a range of atmospheric conditions, the two investigated single-channel LST models match the accuracy of the GSW model (Figure 3). A summary of the bias and the RMSD associated with the different LST models is provided in Table 3 and Table 4.
For dry to medium-moist atmospheres (TCWV up to 45 mm), RMSDs of the PMW and the SMW model ranged between 1.8 K and 2.6 K (Table 3). This is close to the 2 K target accuracy of the GSW-based LSA SAF dataset. For the Evora and RMZ sites, the PMW model matched the accuracy of the GSW with RMSDs of 1.9 K (PMW) and 1.9–2.0 K (GSW) and had an absolute bias < 1 K. For the sites Gobabeb and Dahra, the PMW (RMSD 1.8 K and 2.6 K) was slightly less accurate than the GSW (RMSD 1.5 K and 2.3 K), while the SMW’s RMSD was up to 0.5 K larger (TCWV up to 45 mm; Table 3). Yu et al. [21] have recently compared PMW and GSW LSTs from the Landsat satellite against 41 ground observations from the Surface Radiation (SURFRAD) Budget Network in moderate climate zones. They have reported the highest accuracy for the PMW with a difference in RMSD of only 0.1 K compared to the GSW: Our analysis does not confirm this finding. We show that PMW agrees with GSW to within 0.1–0.5 K for most atmospheric conditions tested here.
In Gobabeb, RMZ and Dahra, the PMW and SMW performed very similarly (ΔRMSD 0.2 K) for TCWV < 45 mm. In Evora, the PMW had a 0.6 K lower RMSD and 0.7 K lower bias compared to the SMW. At very high TCWVs (>45 mm), we observe a 1 K higher RMSD for the PMW compared to the SMW at Dahra. Hence, the computationally-expensive PMW model outperforms the SMW only at one out of four investigated stations.
Observed RMSD matches the theoretical uncertainties (Section 3.1) to within 0.3–1 K for dry to medium-moist atmospheres (Table 2 and Table 3). Slightly larger RMSDs can reflect uncertainty and scaling differences of the ground measurements not included in the theoretical uncertainty analysis.
Figure 3. Comparison of LST between in situ measurements from the KIT sites and Meteosat-based retrievals for different TCWV classes. The boxplots show the median, the first and third quartile with whiskers at the 95th and fifth percentiles. GSW: the Satellite Application Facility on Land Surface Analysis’s (LSA SAF) operational GSW. (a) KIT Gobabeb station; (b) KIT Evora station; (c) KIT Dahra station; (d) KIT RMZ station.
Remotesensing 07 13139 g003
For very moist atmospheres, which are only encountered at the Dahra station, we observed a distinctly higher RMSD (Δ2.9 K–Δ1.9 K) and bias (Δ2.1–Δ0.8 K) for the two single-channel models compared to the GSW (Table 4) and a higher RMSD (>3 K) compared to the theoretical error analysis (Figure 2). In addition, we observed different model performances for selected TCWV classes and sites (Figure 3). We investigated those differences and provide possible explanations in the following sections.
Table 3. Statistics for the comparison of LST between in situ measurements and the operational LSA SAF dataset for dry to medium-moist atmospheres (TCWV ≤ 45 mm).
TCWV ≤ 45 mmGSWPMWSMW
RMSD (K)BIAS (K)RMSD (K)BIAS (K)RMSD (K)BIAS (K)
Gobabeb1.50.41.80.82.00.9
Evora2.01.21.90.72.51.4
Dahra2.3−0.82.6−1.22.40.4
RMZ1.9−0.51.9−0.81.7−0.8
Table 4. Statistics for the comparison of LST between in situ measurements and the operational LSA SAF dataset for very moist atmospheres (TCWV > 45 mm) experienced at the KIT ‘Dahra’ station.
TCWV > 45 mmGSW PMWSMW
RMSD (K)BIAS (K)RMSD (K)BIAS (K)RMSD (K)BIAS (K)
Dahra3.4−2.26.3−4.35.3−3.0

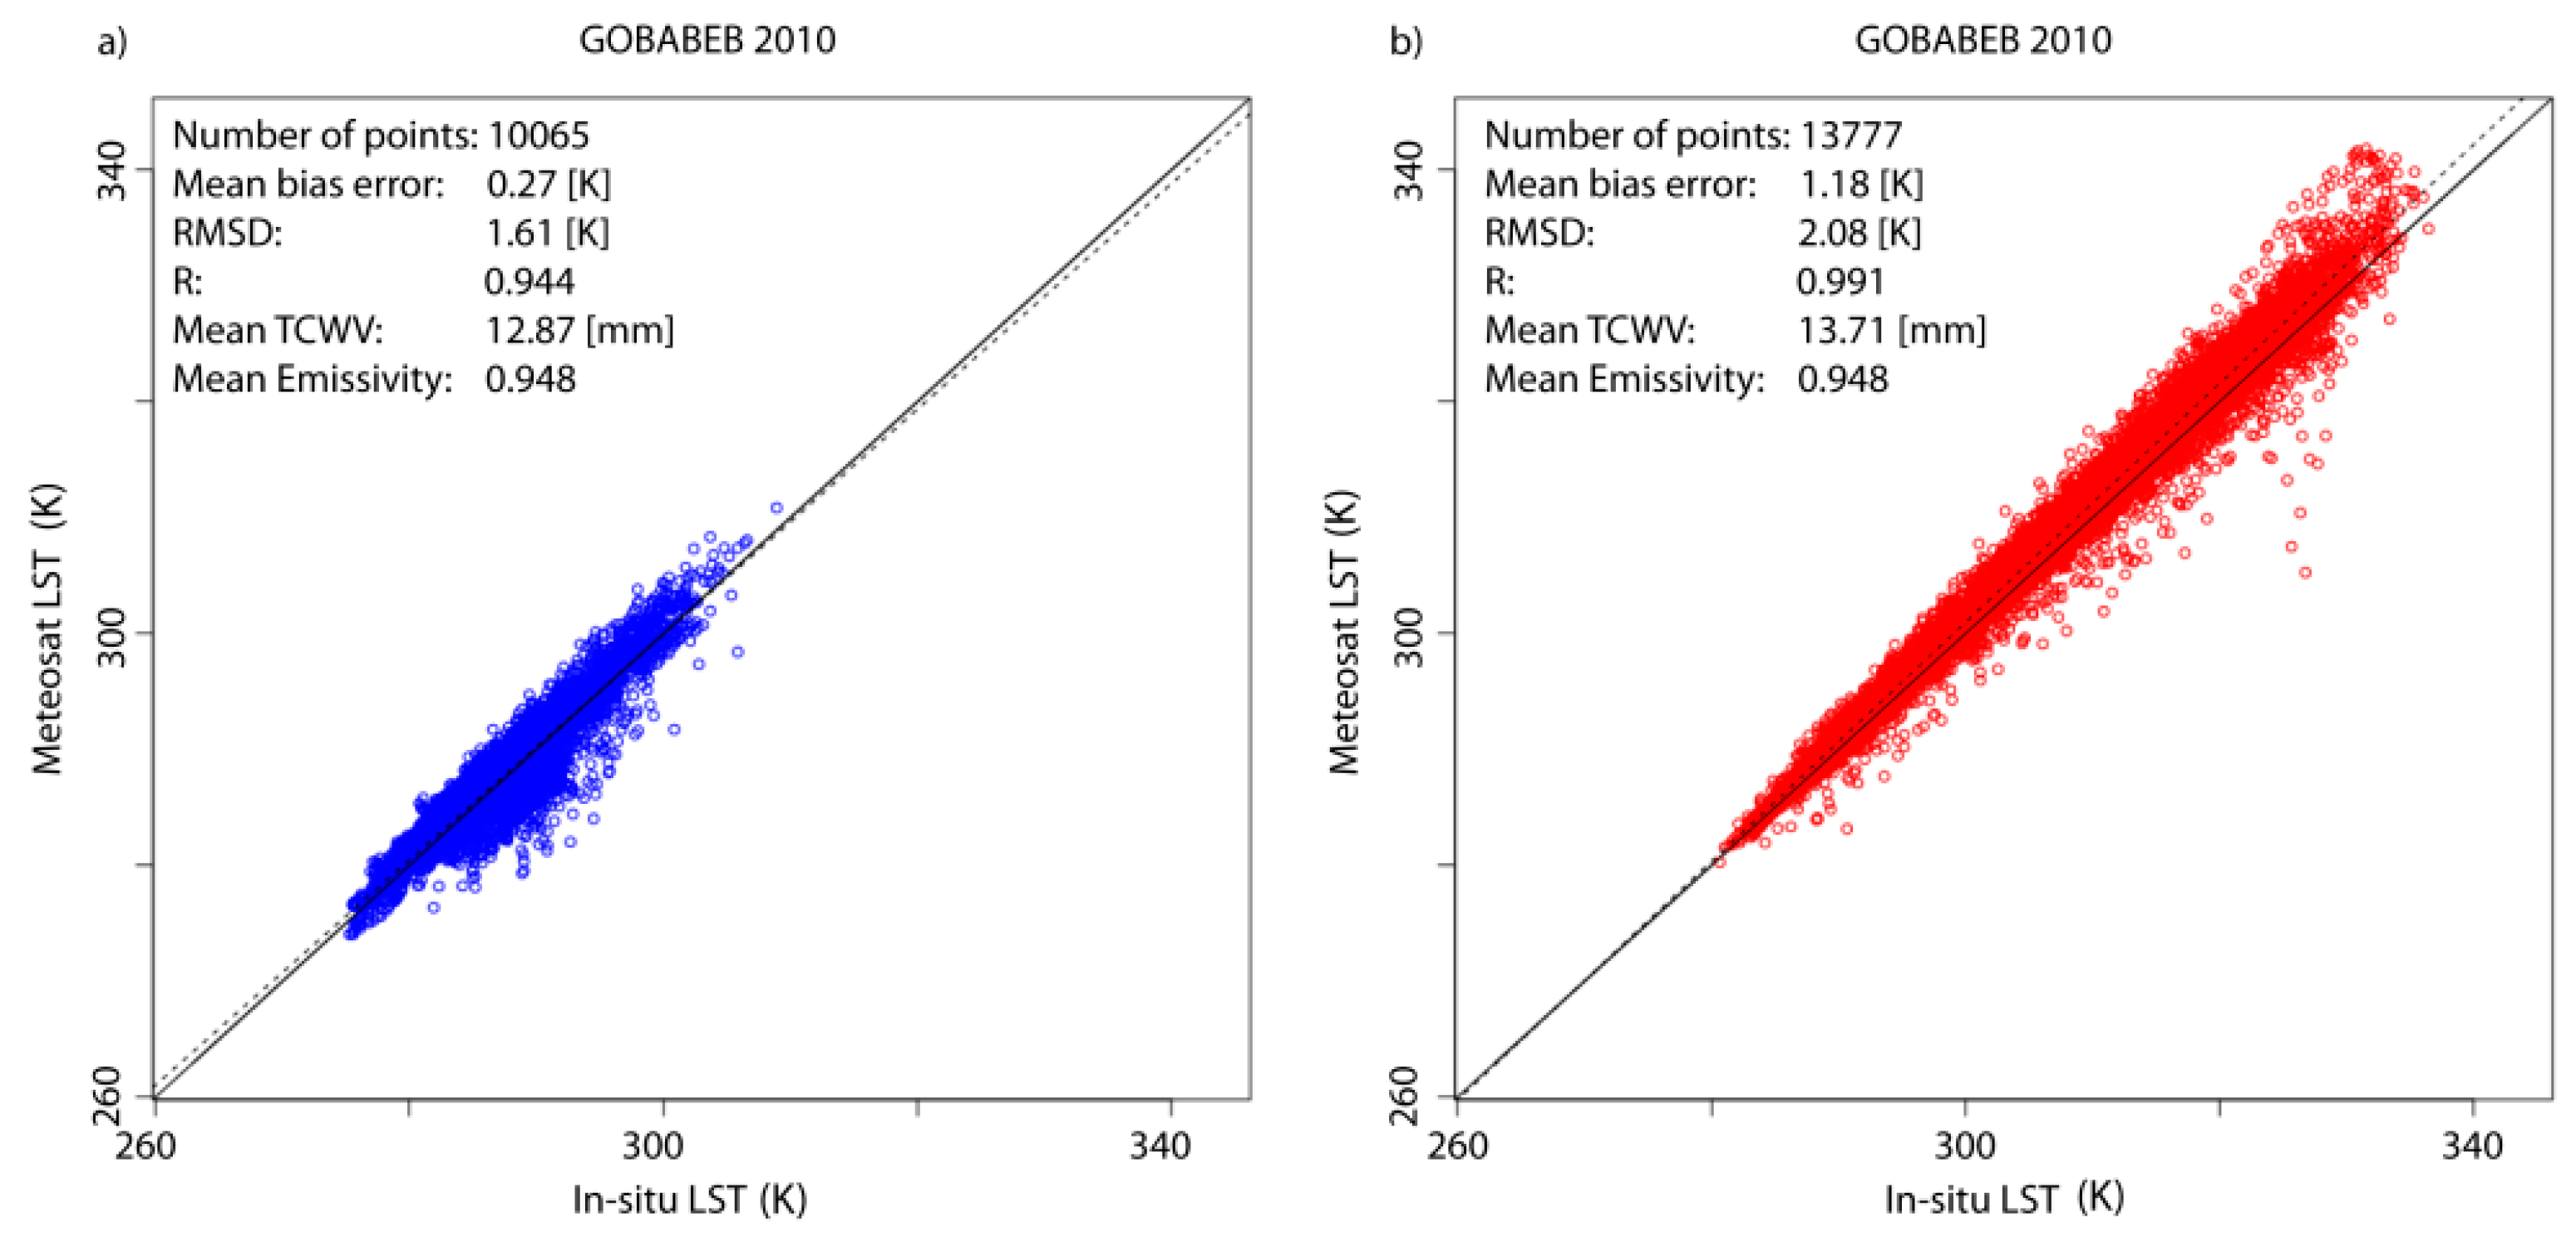
3.2.1. Gobabeb Station

For the desert station Gobabeb mono-window LSTs met the LSA SAF target accuracy requirement (RMSD ≥ 2 K and bias < 1 K; Table 3 and Figure 3a and Figure 4).
Figure 4. Comparison between in situ LST (KIT Gobabeb station, 2010) and Meteosat LST from the PMW for TCWVs < 35 mm: (a) Nighttime; (b) daytime.
Remotesensing 07 13139 g004
Due to the exceptionally wet January/February and October/November 2010, the presented analysis included a large number of observations for a wide range of atmospheric conditions, including also rather moist atmospheres (Figure 3a). Despite the overall good model performances, the two single-channel models had a distinct positive bias for dry atmospheres compared to the LSA SAF dataset (0.8–1.2 K versus 0.1–0.2 K, respectively; Figure 3a). This single-channel bias is close to zero during nighttime, but is greater than 1 K during daytime (Figure 4). Other studies (e.g., [8]) also report that the largest single-channel biases occur at LST values greater than 310 K, which is in line with our observations. The observed daytime LST bias likely demonstrates the implicit sensitivity of the mono-channel models on NWP errors. The GSW model, which is less dependent on accurate NWP input, does not show a significant daytime bias in Gobabeb.

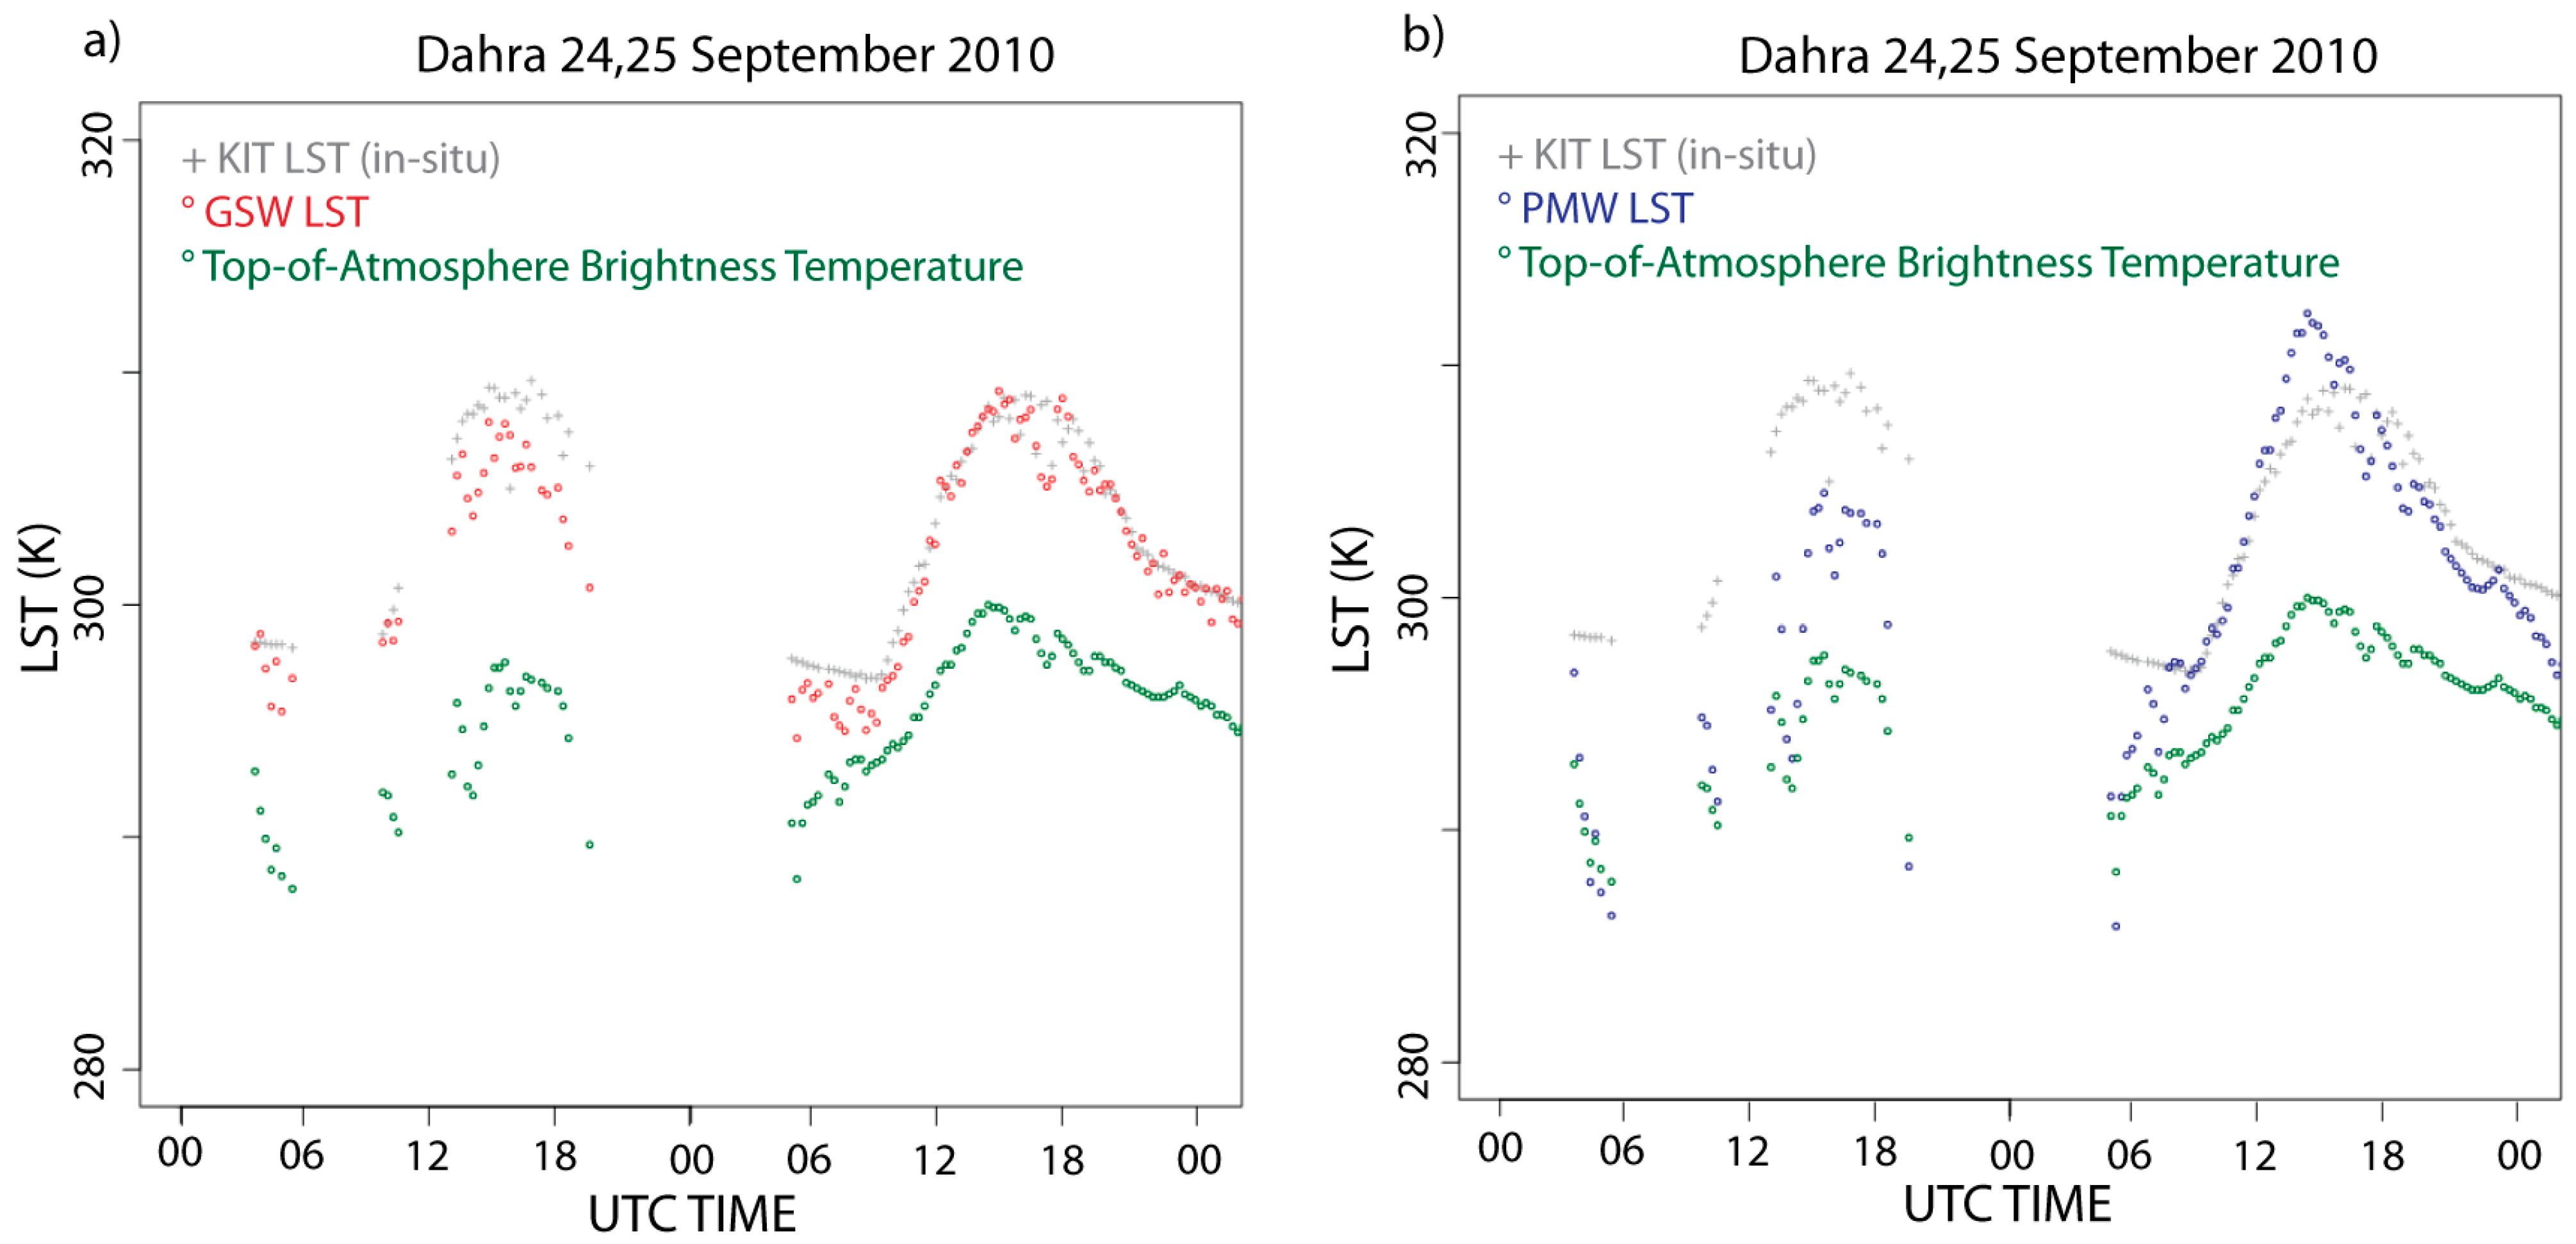
3.2.2. Dahra Station

In Dahra, single-channel LSTs reached the LSA SAF target accuracy for TCWV up to 30 mm (RMSD < 2 K, bias < 0.5 K; Figure 3c). For higher TCWVs, the PMW, SMW and GSW models had a high negative Meteosat LST minus in situ LST bias (−4.3 K, −3.0 K and −2.2 K, respectively; Table 4, Figure 5). RMSD are significantly higher for PMW and SMW compared to GSW (Δ 2.9 and 1.9 K, respectively; Table 4) and the theoretically-expected error (Δ 3–4 K; Table 4 and Figure 2).
Figure 5. (a) LSA SAF’s operational GSW; (b) PMW.
Remotesensing 07 13139 g005
Cloud contaminations and/or uncertainties in NWP (ECMWF), together with the limitations of the mono-channel methods under analysis, might explain the difference between the observed RMSD and the theoretical uncertainties.
Errors due to cloud contamination are not accounted for in the theoretical uncertainty analysis. Clouds are usually significantly colder than the land surface, and cloud contamination should hence result in negative LST biases [8]. This hypothesis is supported by the high temporal scatter of the TOA-brightness temperature (example: Figure 5, 24 September 2010). Clear sky TOA brightness temperature is mainly driven by solar heating and follows a continuous diurnal cycle [10]. This is clearly not the case on 24 September 2010.
In addition, uncertainties in TCWV fields might be higher in Dahra than the NWP uncertainties accounted for in the sensitivity study (Section 2.5). This second hypothesis is supported by the observed 1–2 K lower GSW bias compared to PMW and SMW (Table 4). As detailed in Section 3.1, GSWs perform atmospheric correction rather independently from the NWP model input, while PMW and SMW are quite sensitive to errors in NWP models. For a given (measured) TOA brightness temperature and a very dry atmospheric profile, which is wrongly assumed to be more moist by the NWP model, this can lead to a considerable underestimation of LST retrieved by single-channel models: As the true atmosphere becomes dryer, it also becomes more transparent, and the retrieved LST decreases [8]. We have characterized the NWP error in the sensitivity study by replacing the profiles at hour h by the corresponding ones at hour h + 6. This approach might not be valid for tropical conditions. Moreover, differences in viewing geometry between the ground and satellite radiometer can introduce uncertainties related to inaccurate emissivity in Dahra, where the surface emissivities varies strongly over the seasons [20].

3.2.3. RMZ and Evora Stations

The radiative transfer-based single-channel approach (PMW) met LSA SAF target accuracy at the Evora and RMZ sites (RMSD around 2.0 K, bias < 1.0 K; Table 3 and Figure 3b,d).
For Evora, all models, including GSW, had a significant positive bias, while we observed a negative bias for all models at the RMZ station (0.7–1.2 K and −0.5–−0.9 K, respectively; Table 3 and Figure 3b,d). The biases are known from previous validation studies of the operational LSA SAF LST dataset and are given [20] as 0.8 K and −0.4 K for Evora and RMZ, respectively. These biases partially reflect the achievable accuracy with in situ LST. These have to represent large-scale satellite footprints covering several square kilometers: although the land cover at the Evora and RMZ validation sites is spatially quite homogeneous [35], they represent a mixture of grass, background soil and trees, which cause shadows and complicate the ground-based LST determination [40]. The negative biases observed for RMZ are thought to be related to the site’s high elevation (1360 m a.s.l.), which may not be correctly accounted for by the LST retrieval algorithms. The PMW and SMW do not perform an orographic correction, i.e., we use atmospheric profiles as the model input, which corresponds to the ECMWF grid cell height and not to the elevation at the station.

4. Conclusions

Long-term LST climate data records with a high temporal and spatial resolution are useful for climate monitoring and climate applications [7]. This requirement can be met by extending LST data records from geostationary satellites into the past. Since heritage sensors provide only one thermal infrared band, multi-channel LST retrieval approaches cannot be used. This study thus evaluated the performance of single-channel retrieval models developed for the geostationary Meteosat satellite against in situ LST and the GSW-based LSA SAF dataset. The key question that we investigated is to what extent a single-channel LST model can achieve the accuracy of a two channel GSW model.
This comprehensive validation study, which included more than 60,000 in situ LST measurements for very different atmospheric conditions, demonstrates that Meteosat-based single-channel LSTs agree with those from GSW to within 0.1–0.5 K and are within or very close to the 2 K target accuracy of the LSA SAF Meteosat LST data, except for very moist atmospheres (TCWV > 45 mm), but with the added benefit that they can be applied across satellite generations. TCWVs above 45 mm primarily occur in tropical and subtropical regions, which are regularly cloud covered and correspond to less than 5% of the MSG disk. We can hence expect the overall majority of MSG single-channel LSTs to meet the 2–3 K “currently achievable performance” defined by the Global Climate Observing System (GCOS) [7].
However, this study also reveals a significant negative bias (−4.3 K) for the PMW for very moist atmospheres (TCWV > 45 mm) at Dahra station, Senegal. We found some indications that cloud contamination and/or inaccurate NWP input contributes to this strong negative bias. This issue needs to be investigated before generating a CDR.
This study also demonstrates that it is possible to characterize retrieval uncertainties for Meteosat single-channel LST, except for very moist atmospheres, which will simplify, for instance, the assimilation of those data into land surface models. RMSDs estimated from a theoretical, radiative transfer-based sensitivity study matched RMSDs from the ground-based comparison within 0.3–1 K for TCWVs ≤ 45 mm. For very moist atmospheres with TCWV > 45 mm, we observe a distinct higher RMSD (>3 K) compared to the theoretical uncertainties. We found indications that this is partly due to cloud contamination, which is not accounted for in the theoretical error analysis. Moreover, the adapted approach to characterize NWP uncertainties by simply replacing NWP profiles might not be realistic for tropic conditions. More advanced TCWV error characterizations, such as, e.g., an error characterization based on the NWP background error covariance matrix, as proposed by Peres and Camara [41], should be tested. The authors propose to put a “low quality” flag on Meteosat single-channel LST retrievals for TCWV > 45 mm and to inform users that associated LST uncertainties might not be realistic for very moist atmospheres. Additional LST validation stations in very moist climate zones will be highly valuable to find realistic LST model uncertainty for those conditions.
The results of this study suggest that computationally more expensive PMWs do not necessarily outperform SMWs. We observed a distinct higher accuracy (ΔRMSD > 0.2 K) for the PMW compared to SMW only at one at of four validation stations.
Possible improvements of the current PMW and SMW model should be addressed in future studies. The presented single-channel models might be improved by including an orographic correction for the atmospheric profiles and by an improved cloud screening in tropical regions.
The results presented here are strictly only valid for MSG, since the MFG thermal sensor has a slightly different spectral response function, a lower digital quantification and a less accurate absolute radiometric accuracy. Accordingly, the LST retrieval errors may be greater than the errors presented in this study. Inaccuracies arising from emissivity retrieval and satellite calibration were not considered here, despite their relevance for the quality of a Meteosat LST CDR. Therefore, future work needs to investigate these error sources. Although it might be difficult to remove inter-Meteosat calibration errors completely, the present work demonstrates that, for the investigated ground stations, LST retrievals from well-calibrated MFG data can reach the accuracy of LSA SAF’s operational GSW.

Acknowledgments

This study was carried out as part of the EUMETSAT Satellite Application Facility on Climate Monitoring (CM SAF) and on Land Surface Analysis (LSA SAF). The Swiss National Supercomputing Centre (CSCS) is acknowledged for providing computing and archiving resources for this project. We want to thank the Karlsruhe Institute of Technology (KIT) for maintaining the LST in situ stations and for kindly providing the validation data. Research by Virgílio Bento was funded by the Portuguese Foundation for Science and Technology (SFRH/BD/52559/2014).

Author Contributions

All authors contributed equally to this work. Virgílio A. Bento, Isabel F. Trigo and Carlos da Camara designed the SMW model and the methodology for the sensitivity analysis and error budget estimation. João P.A. Martins performed MODTRAN simulations and designed the calibration database for the SMW model. Folke Olesen and Frank-M. Göttsche derived and provided the KIT validation stations’ data. Frank-M. Göttsche is responsible for Section 2.6 and contributed to the interpretation of the results. Jedrzej S. Bojanowski supported the software development and the ground-based validation. Reto Stöckli and Heike Kunz initiated the project and reviewed the paper. Reto Stöckli programmed the Meteosat processing system (pre-processing). Anke Duguay-Tetzlaff established the PMW model, implemented the single-channel LST retrieval models, performed the ground-based validation and compiled the manuscript.

Conflicts of Interest

The authors declare no conflict of interest.

References

  1. Bodas-Salcedo, A.; Ringer, M.; Jones, A. Evaluation of the surface radiation budget in the atmospheric component of the Hadley Centre Global Environmental Model (HADGEM1). J. Clim. 2008, 21, 4723–4748. [Google Scholar] [CrossRef]
  2. Wan, Z.; Wang, P.; Li, X. Using MODIS land surface temperature and normalized difference vegetation index products for monitoring drought in the southern Great Plains, USA. Int. J. Remote Sens. 2004, 25, 61–72. [Google Scholar] [CrossRef]
  3. Kustas, W.; Norman, J. Use of remote sensing for evapotranspiration monitoring over land surfaces. Hydrol. Sci. J. 1996, 41, 495–516. [Google Scholar] [CrossRef]
  4. Bosilovich, M.; Radakovich, J.; da Silva, A.; Todling, R.; Verter, F. Skin temperature analysis and bias correction in a coupled land-atmosphere data assimilation system. J. Meteorol. Soc. Japan 2007, 85, 205–228. [Google Scholar] [CrossRef]
  5. Reichle, R.; Kumar, S.; Mahanama, S.; Koster, R.; Liu, Q. Assimilation of satellite-derived skin temperature observations into land surface models. J. Hydrometeorol. 2010, 11, 1103–1122. [Google Scholar] [CrossRef]
  6. Ghent, D.; Kaduk, J.; Remedios, J.; Ardo, J.; Balzter, H. Assimilation of land surface temperature into the land surface model JULES with an ensemble Kalman filter. J. Geophys. Res.-Atmos. 2010, 115, 19. [Google Scholar] [CrossRef]
  7. GCOS 2011 Report: Systematic Observation Requirements for Satellite-Based Datasets for Climate 2011 Update. Available online: https://www.wmo.int/pages/prog/gcos/Publications/gcos-154.pdf (accessed on 21 May 2015).
  8. Heidinger, A.; Laszlo, I.; Molling, C.; Tarpley, D. Using SURFRAD to verify the NOAA single-channel land surface temperature algorithm. J. Atmos. Ocean. Technol. 2013, 30, 2868–2884. [Google Scholar] [CrossRef]
  9. Garand, L. Toward an integrated land-ocean surface skin temperature analysis from the variational assimilation of infrared radiances. J. Appl. Meteorol. 2003, 42, 570–583. [Google Scholar] [CrossRef]
  10. Göttsche, F.; Olesen, F. Modelling the effect of optical thickness on diurnal cycles of land surface temperature. Remote Sens. Environ. 2009, 113, 2306–2316. [Google Scholar] [CrossRef]
  11. Rossow, W.; Schiffer, R. Advances in understanding clouds from ISCCP. Bull. Am. Meteorol. Soc. 1999, 80, 2261–2287. [Google Scholar] [CrossRef]
  12. Freitas, S.; Trigo, I.; Bioucas-Dias, J.; Göttsche, F. Quantifying the uncertainty of land surface temperature retrievals from Seviri/Meteosat. IEEE Trans. Geos. Remote Sens. 2010, 48, 523–534. [Google Scholar] [CrossRef]
  13. Wan, Z.; Dozier, J. A generalized split-window algorithm for retrieving land-surface temperature from space. IEEE Trans. Geos. Remote Sens. 1996, 34, 892–905. [Google Scholar]
  14. Trigo, I.; Monteiro, I.; Olesen, F.; Kabsch, E. An assessment of remotely sensed land surface temperature. J. Geophys. Res.-Atmos. 2008, 113, D17. [Google Scholar] [CrossRef]
  15. Trigo, I.; Freitas, S.C.; Bioucas-Dias, J.; Barroso, C.; Monteiro, I.T.; Viterbo, P. Algorithm Theoretical Basis Document for Land Surface Temperature (LST), LSA-4 (MLST); Land Surface Analysis Satellite Application Facility: Darmstadt, Germany, 2009. [Google Scholar]
  16. Sun, D.; Pinker, R.; Basara, J. Land surface temperature estimation from the next generation of geostationary operational environmental satellites: GOES M-Q. J. Appl. Meteorol. 2004, 43, 363–372. [Google Scholar] [CrossRef]
  17. Jimenez-Munoz, J.; Sobrino, J. A generalized single-channel method for retrieving land surface temperature from remote sensing data. J. Geophys. Res.-Atmos. 2004, 109, D22. [Google Scholar] [CrossRef]
  18. Reutter, H.; Olesen, F.; Fischer, H. Distribution of the brightness temperature of land surfaces determined from AVHRR data. Int. J. Remote Sens. 1994, 15, 95–104. [Google Scholar] [CrossRef]
  19. Scarino, B.; Minnis, P.; Palikonda, R.; Reichle, R.; Morstad, D.; Yost, C.; Shan, B.; Liu, Q. Retrieving clear-sky surface skin temperature for numerical weather prediction applications from geostationary satellite data. Remote Sens. 2013, 5, 342–366. [Google Scholar] [CrossRef]
  20. Göttsche, F.; Olesen, F.; Bork-Unkelbach, A. Validation of operational land surface temperature products with three years of continuous in-situ measurements. In Proceedings of the EUMETSAT Meteorological Satellite Conference, Oslo, Norway, 5–9 September 2011.
  21. Yu, X.; Guo, X.; Wu, Z. Land surface temperature retrieval from LANDSAT 8 TIRS-comparison between radiative transfer equation-based method, split window algorithm and single channel method. Remote Sens. 2014, 6, 9829–9852. [Google Scholar] [CrossRef]
  22. Freitas, S.; Trigo, I.; Macedo, J.; Barroso, C.; Silva, R.; Perdigao, R. Land surface temperature from multiple geostationary satellites. Int. J. Remote Sens. 2013, 34, 3051–3068. [Google Scholar] [CrossRef]
  23. Göttsche, F.; Olesen, F. Modelling of diurnal cycles of brightness temperature extracted from METEOSAT data. Remote Sens. Environ. 2001, 76, 337–348. [Google Scholar] [CrossRef]
  24. Peres, L.F.; da Camara, C.C. Emissivity maps to retrieve land-surface temperature from MSG/SEVIRI. IEEE Trans. Geos. Remote Sens. 2005, 43, 1834–1844. [Google Scholar] [CrossRef]
  25. Li, Z.-L.; Tang, B.-H.; Wu, H.; Ren, H.; Yan, G.; Wan, Z.; Trigo, I.F.; Sobrino, J.A. Satellite-derived land surface temperature: Current status and perspectives. Remote Sens. Environ. 2013, 131, 14–37. [Google Scholar] [CrossRef]
  26. Trigo, I.; Peres, L.; da Carnara, C.; Freitas, S. Thermal land surface emissivity retrieved from SEVIRI/METEOSAT. IEEE Trans. Geos. Remote Sens. 2008, 46, 307–315. [Google Scholar] [CrossRef]
  27. Saunders, R.; Matricardi, M.; Brunel, P. An improved fast radiative transfer model for assimilation of satellite radiance observations. Q. J. Royal Meteorol. Soc. 1999, 125, 1407–1425. [Google Scholar] [CrossRef]
  28. Berk, A.; Anderson, G.; Acharya, P.; Ghetwynd, J.; Bernstein, L.; Shettle, E.; Matthew, M.; Adler-Golden, S. MODTRAN4 User’s Manual; Air Force Research Laboratory: Hanscom, MA, USA, 1999. [Google Scholar]
  29. Hocking, J.; Rayer, P.J.; Rundle, D.; Saunders, R.W.; Matricardi, M.; Geer, A.; Brunel, P.; Vidot, J. RTTOV v11 Users Guide; Nowcasting Satellite Application Facility (NWC-SAF): Darmstadt, Germany, 2014. [Google Scholar]
  30. Bento, V. Exploring RTTOV to Retrieve Land Surface Temperature from a Geostationary Satellite Constellation. Master’s Thesis, University Lisbon, Lisbon, Portugal, 2013. [Google Scholar]
  31. Dee, D.; Uppala, S.; Simmons, A.; Berrisford, P.; Poli, P.; Kobayashi, S.; Andrae, U.; Balmaseda, M.; Balsamo, G.; Bauer, P.; et al. The ERA-Interim reanalysis: Configuration and performance of the data assimilation system. Q. J. Royal Meteorol. Soc. 2011, 137, 553–597. [Google Scholar] [CrossRef]
  32. Borbas, E.E.; Wetzel, S.S.; Huang, H.L.; Li, J. Global profile training database for satellite regression retrievals with estimates of skin temperature and emissivity. In Proceedings of the XIV International ATOVS Study Conference, Beijing, China, 25–31 May 2005; pp. 763–770.
  33. Hewison, T.J.; König, M. Inter-calibration of Meteosat imagers and IASI. In Proceedings of the EUMETSAT Meteorological Satellite Conference, Darmstadt, Germany, 8–12 September 2008.
  34. Göttsche, F.; Olesen, F.; Bork-Unkelbach, A. Validation of land surface temperature derived from MSG/SEVIRI with in situ measurements at Gobabeb, Namibia. Int. J. Remote Sens. 2013, 34, 3069–3083. [Google Scholar] [CrossRef]
  35. Bork-Unkelbach, A. Extrapolation von in-situ Landoberflächentemperaturen auf Satellitenpixel. Ph.D. Thesis, Karlsruhe Institute of Technology, Karlsruhe, Germany, 2012. [Google Scholar]
  36. Göttsche, F.; Hulley, G. Validation of six satellite-retrieved land surface emissivity products over two land cover types in a hyper-arid region. Remote Sens. Environ. 2012, 124, 149–158. [Google Scholar] [CrossRef]
  37. Kabsch, E.; Olesen, F.; Prata, F. Initial results of the land surface temperature (LST) validation with the Evora, Portugal ground-truth station measurements. Int. J. Remote Sens. 2008, 29, 5329–5345. [Google Scholar] [CrossRef]
  38. Theocharous, E.; Usadi, E.; Fox, N.P. CEOS Comparison of IR Brightness Temperature Measurements in Support of Satellite Validation. Part. I: Laboratory and Ocean Surface Temperature Comparison of Radiation Thermometers; National Physical Laboratory: Teddington, UK, 2010. [Google Scholar]
  39. Kondratyev, K.Y. Radiation in the Atmosphere; Academic Press: New York, NY, USA, 1969. [Google Scholar]
  40. Guillevic, P.C.; Bork-Unkelbach, A.; Göttsche, F.M.; Hulley, G.; Gastellu-Etchegorry, J.-P.; Olesen, F.S.; Privette, J.L. Directional viewing effects on satellite land surface temperature products over sparse vegetation canopies—A multisensor analysis. IEEE Geos. Remote Sens. Lett. 2013, 10, 1464–1468. [Google Scholar] [CrossRef]
  41. Peres, L.F.; da Camara, C.C. Land surface temperature and emissivity estimation based on the two-temperature method: Sensitivity analysis using simulated MSG/SEVIRI data. Remote Sens. Environ. 2004, 91, 377–389. [Google Scholar] [CrossRef]

