A New Equation for Deriving Vegetation Phenophase from Time Series of Leaf Area Index (LAI) Data


Abstract
:
1. Introduction
2. Materials and Methods
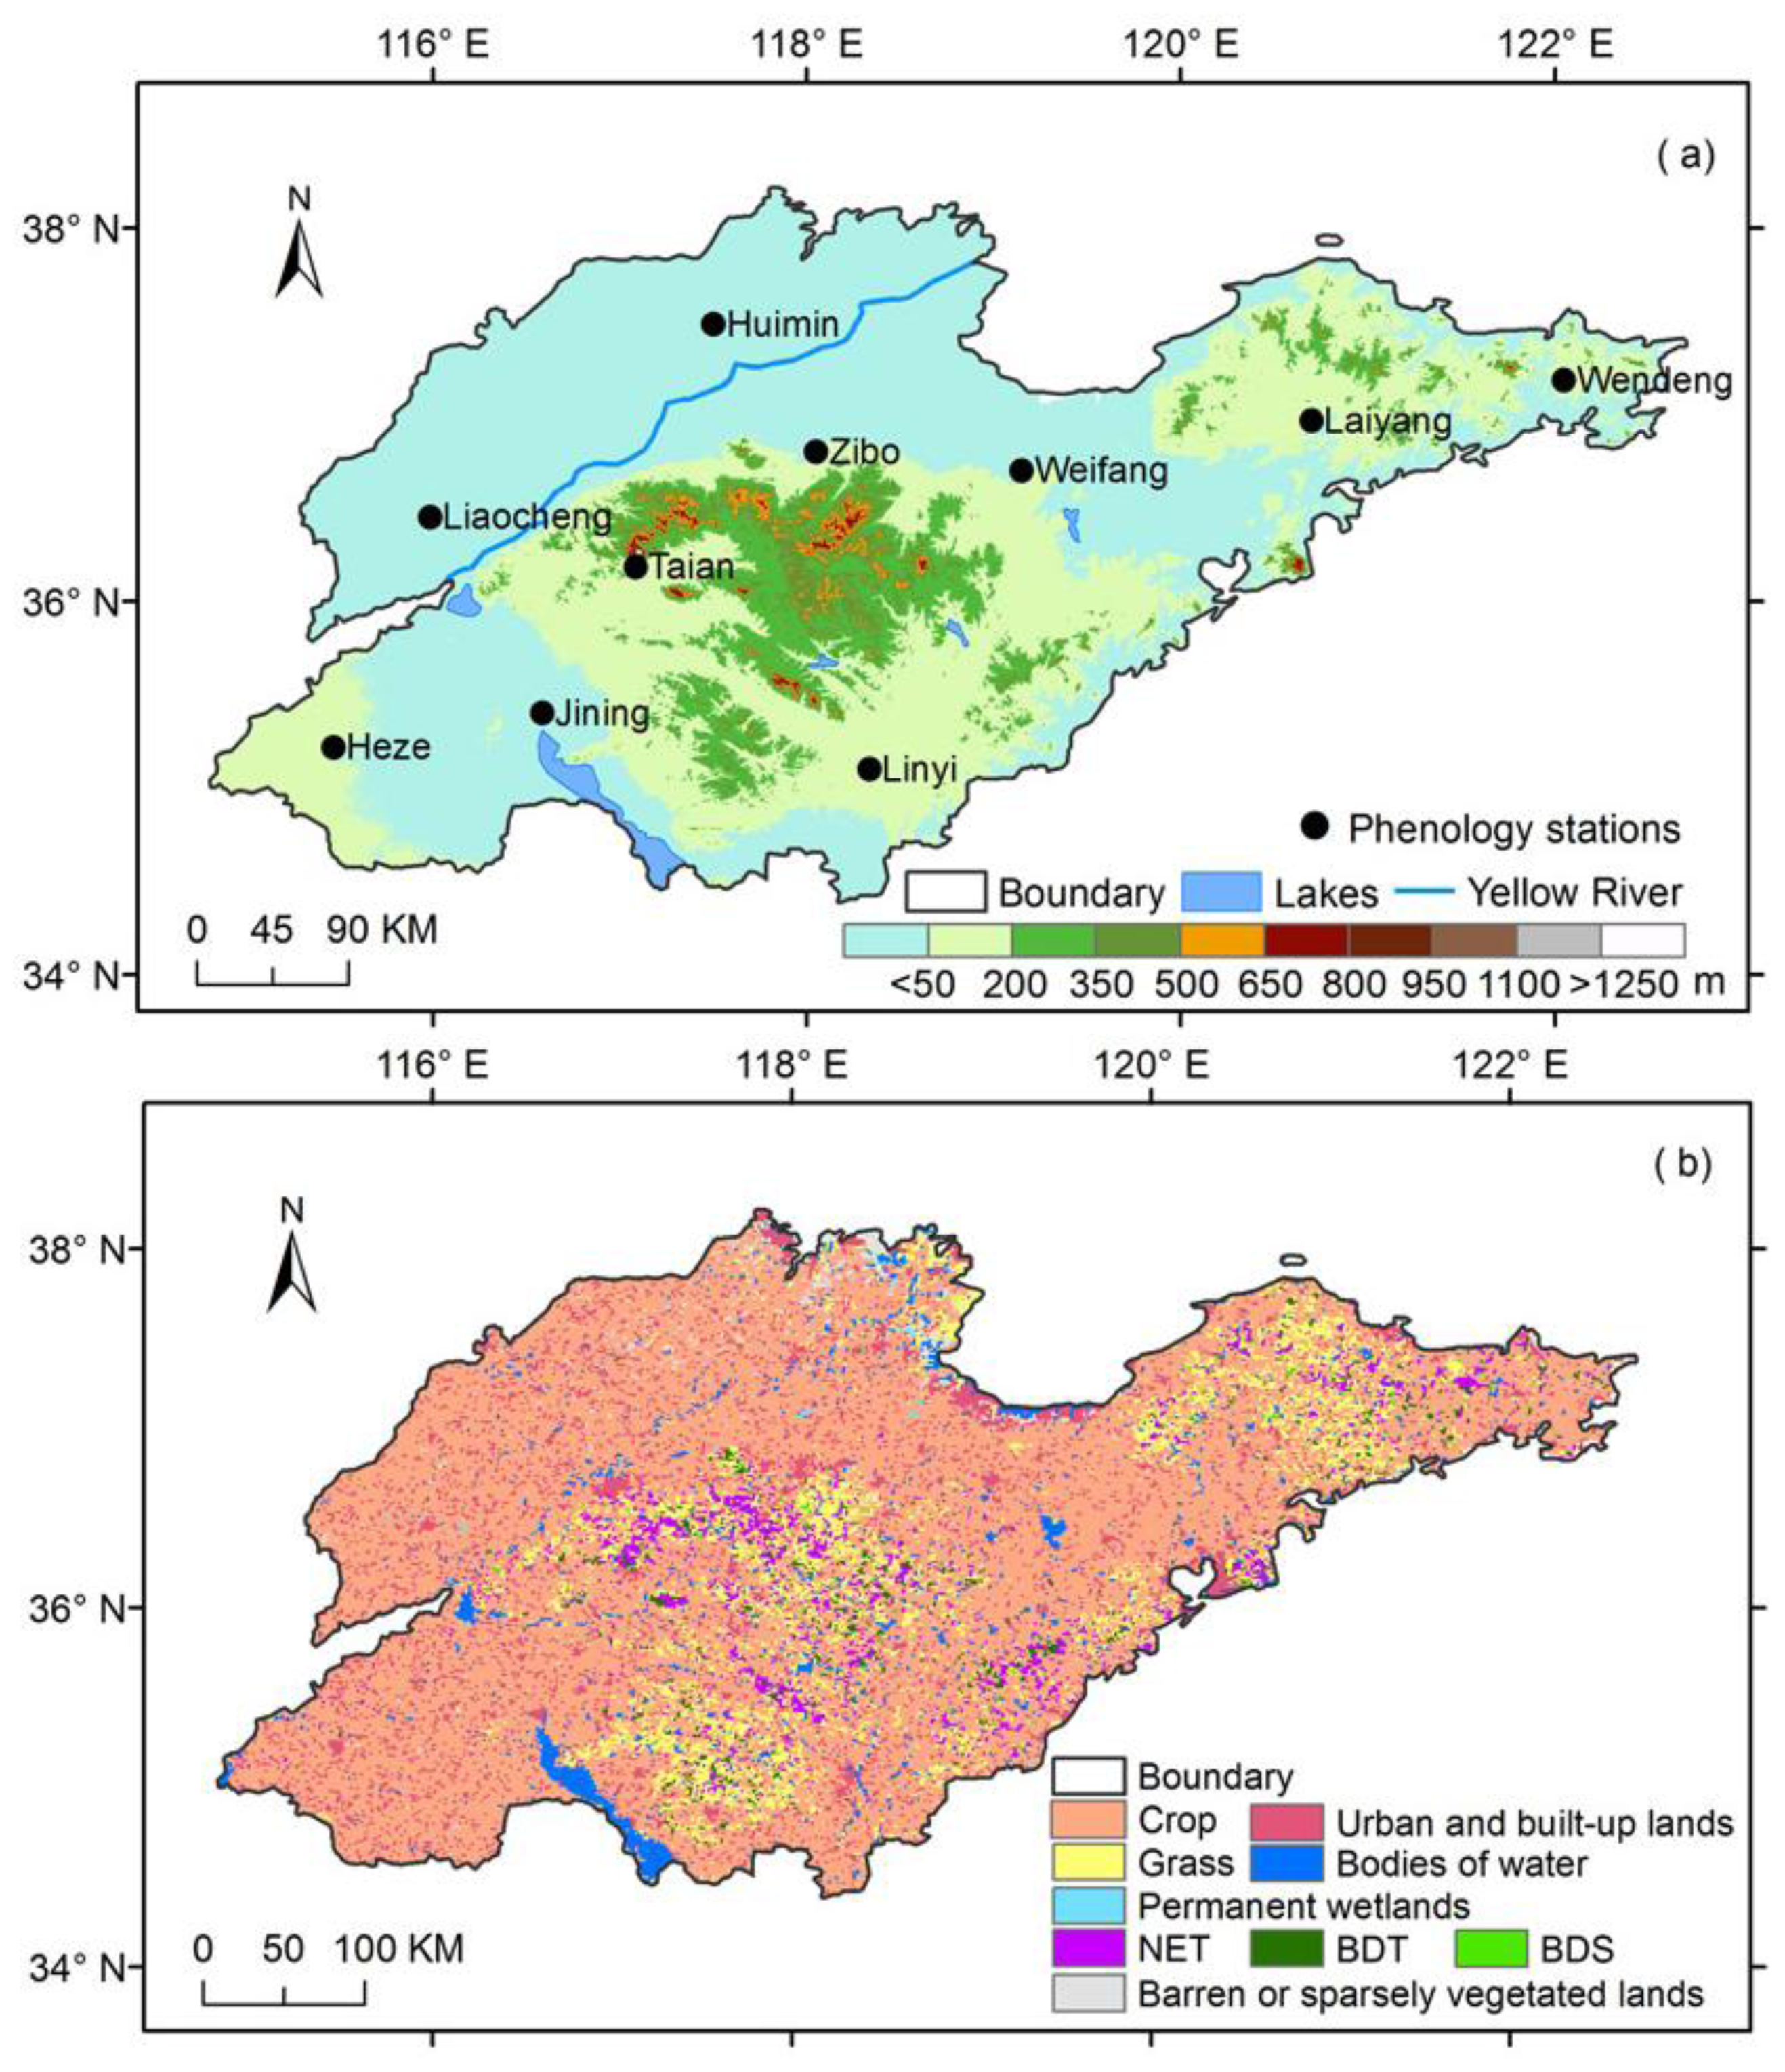
2.1. Sites and Datasets
2.1.1. Site Descriptions
2.1.2. LAI Datasets
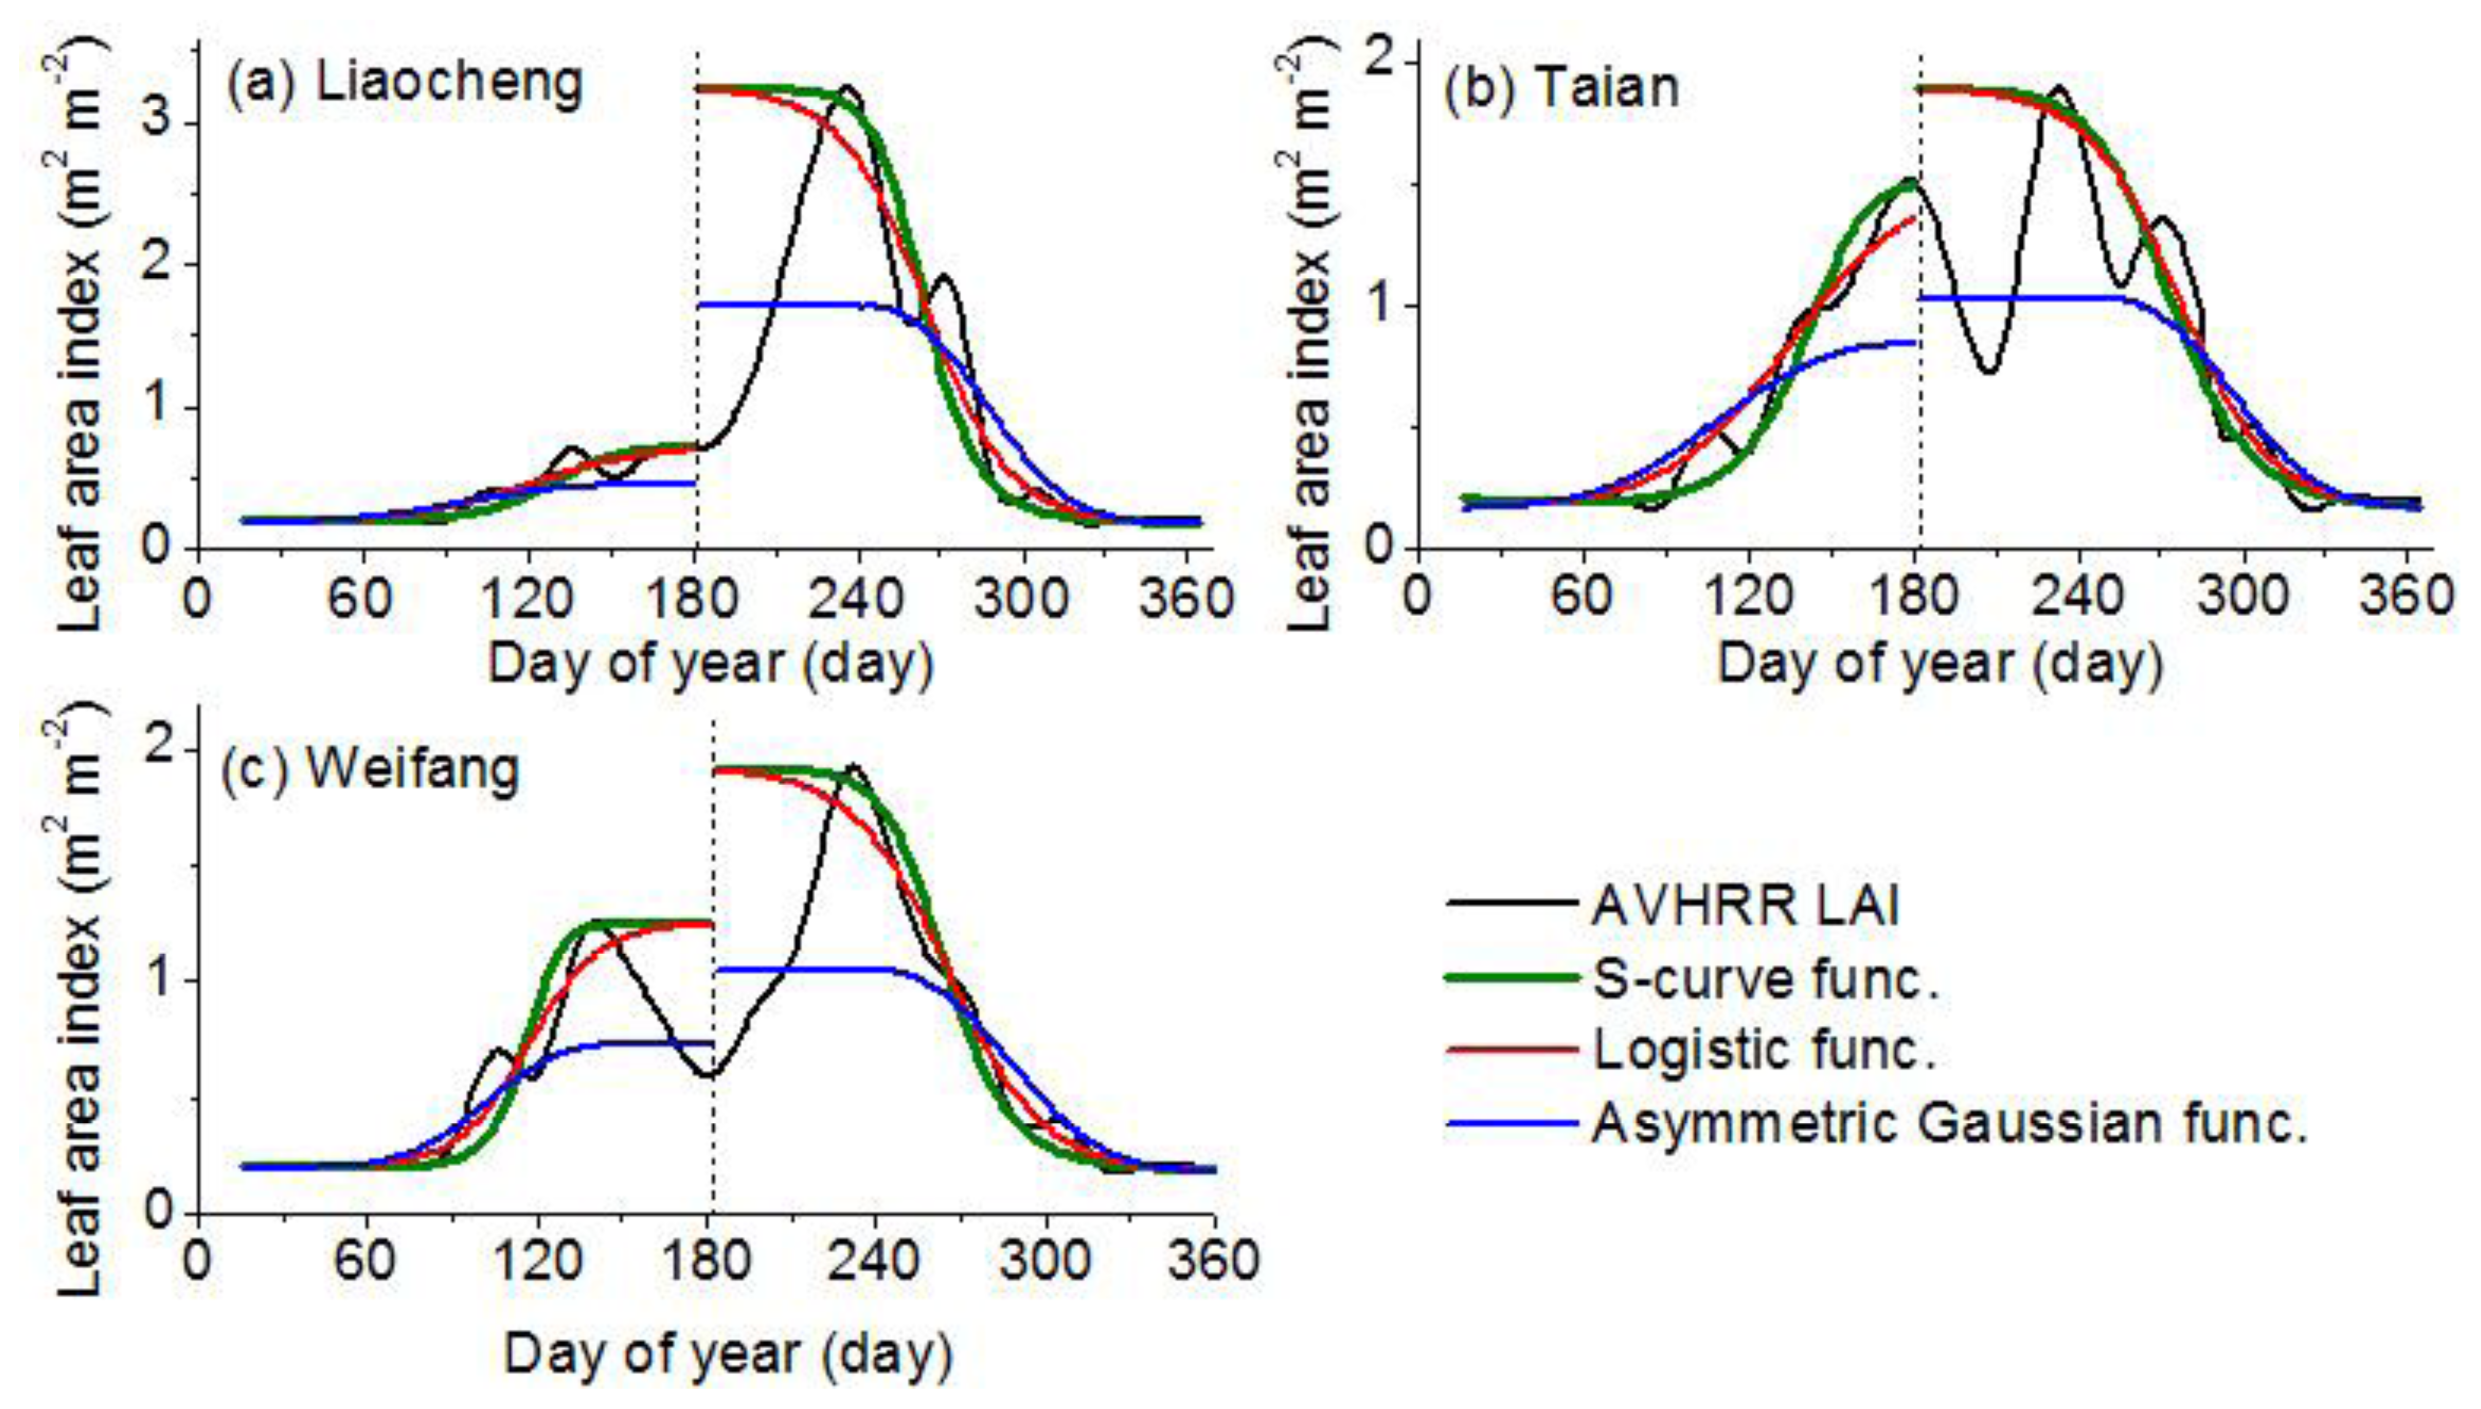
2.2. LAI Curve Fitted Model
- (1)
- Model 1: Asymmetric Gaussian functionThe left half of the asymmetric Gaussian function [33] after the equivalent-transformation is described below:where m1(t)=((a1−t) / a2 )a3 and t < a1, y is the LAI-fitted value and t is the time in days. The parameters p and q determine the amplitude and the base level, respectively; a1 determines the position of the maximum or minimum with respect to the independent time variable t. a2 and a3 determine the width and flatness (kurtosis), respectively, of the left half of the function (in most cases, a3 = 2).
- (2)
- Model 2: Logistic functionThe logistic function [13] uses the following function form:where m2(t) = b1t + b2, y is the LAI-fitted value and t is the time in days. The parameters p and q determine the amplitude and the base level, respectively; b1 and b2 are both fitted parameters.
- (3)
- Model 3: S-curve functionFrom Equations (1) and (2), the uniform function is as follows:where m(t) = at2 + bt + c; y is the LAI-fitted value; t is the time in days; q is the minimum LAI value; p + q is the maximum LAI value; and a, b and c are parameters of the curve and control the position of the inflection points as well as the slope of the curve.
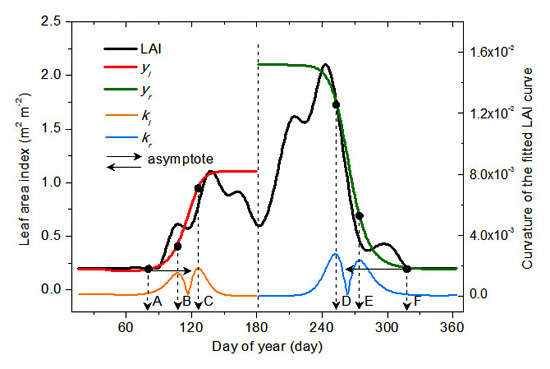
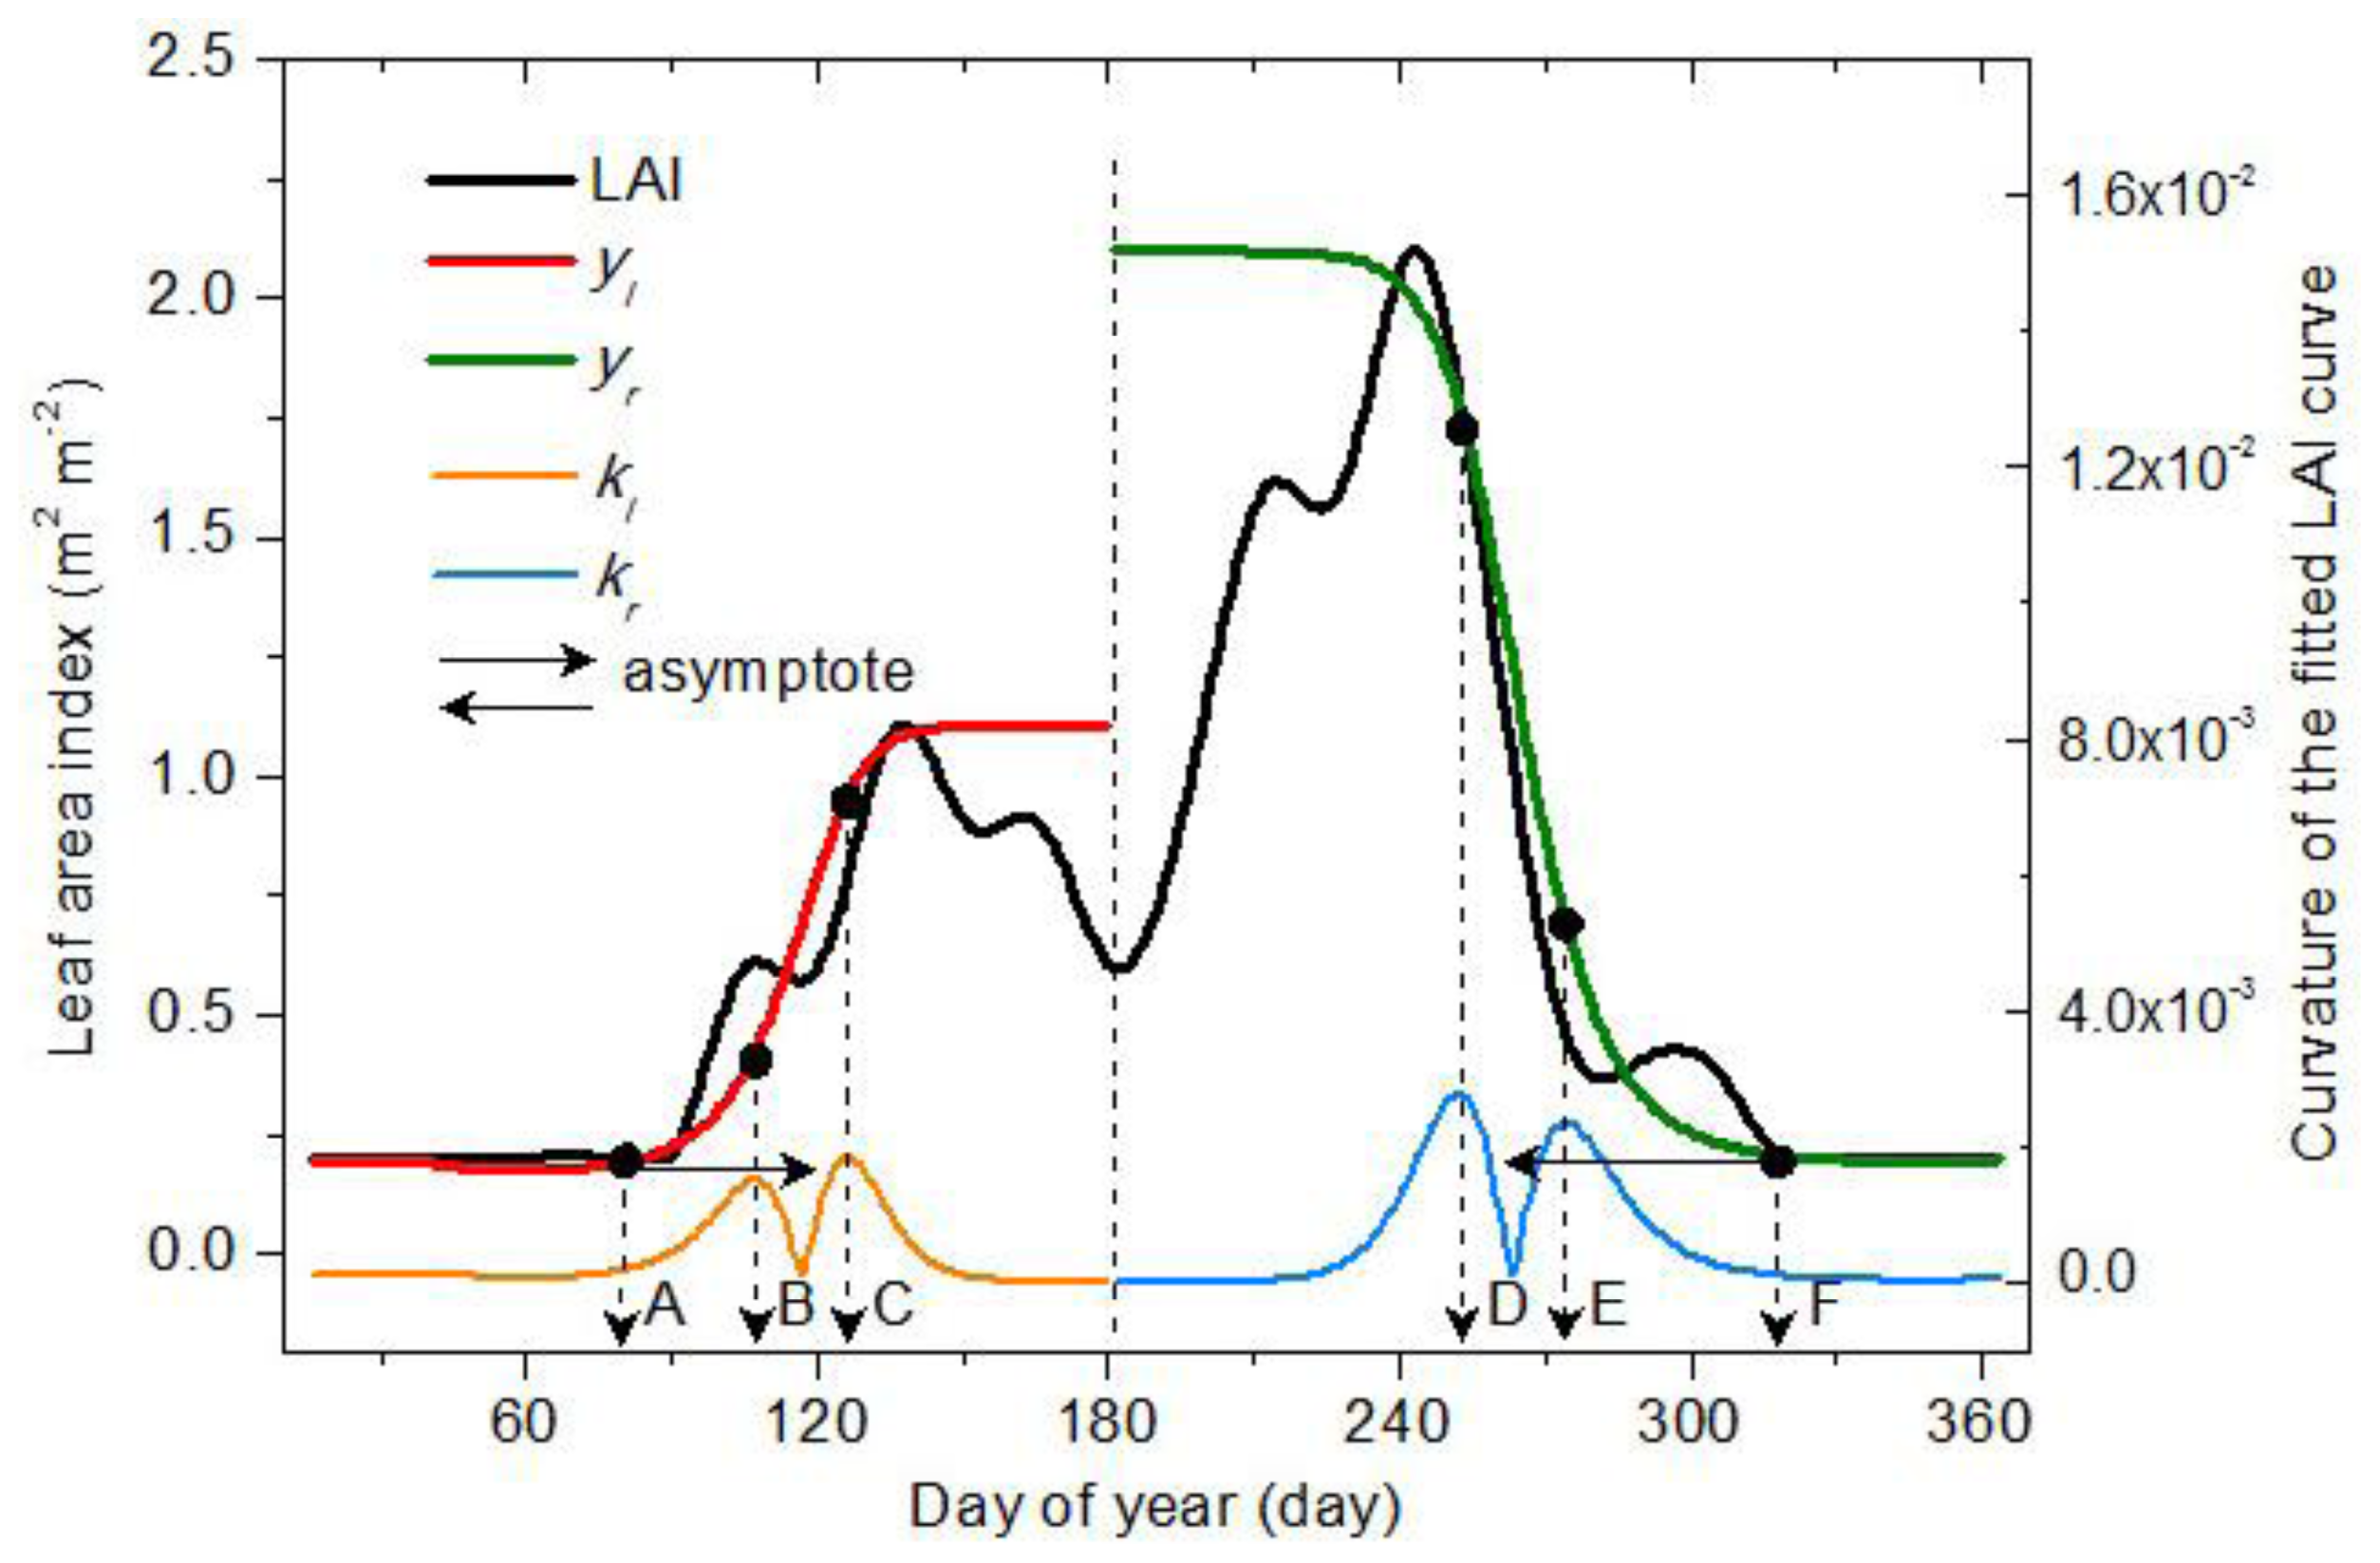
2.3. Vegetation Phenology Extraction Methodology
2.3.1. Vegetation Germination and Dormancy
2.3.2. Vegetation Green-Up, Maturation, Senescence and Defoliation
2.4. Extraction Process for Vegetation Phenology
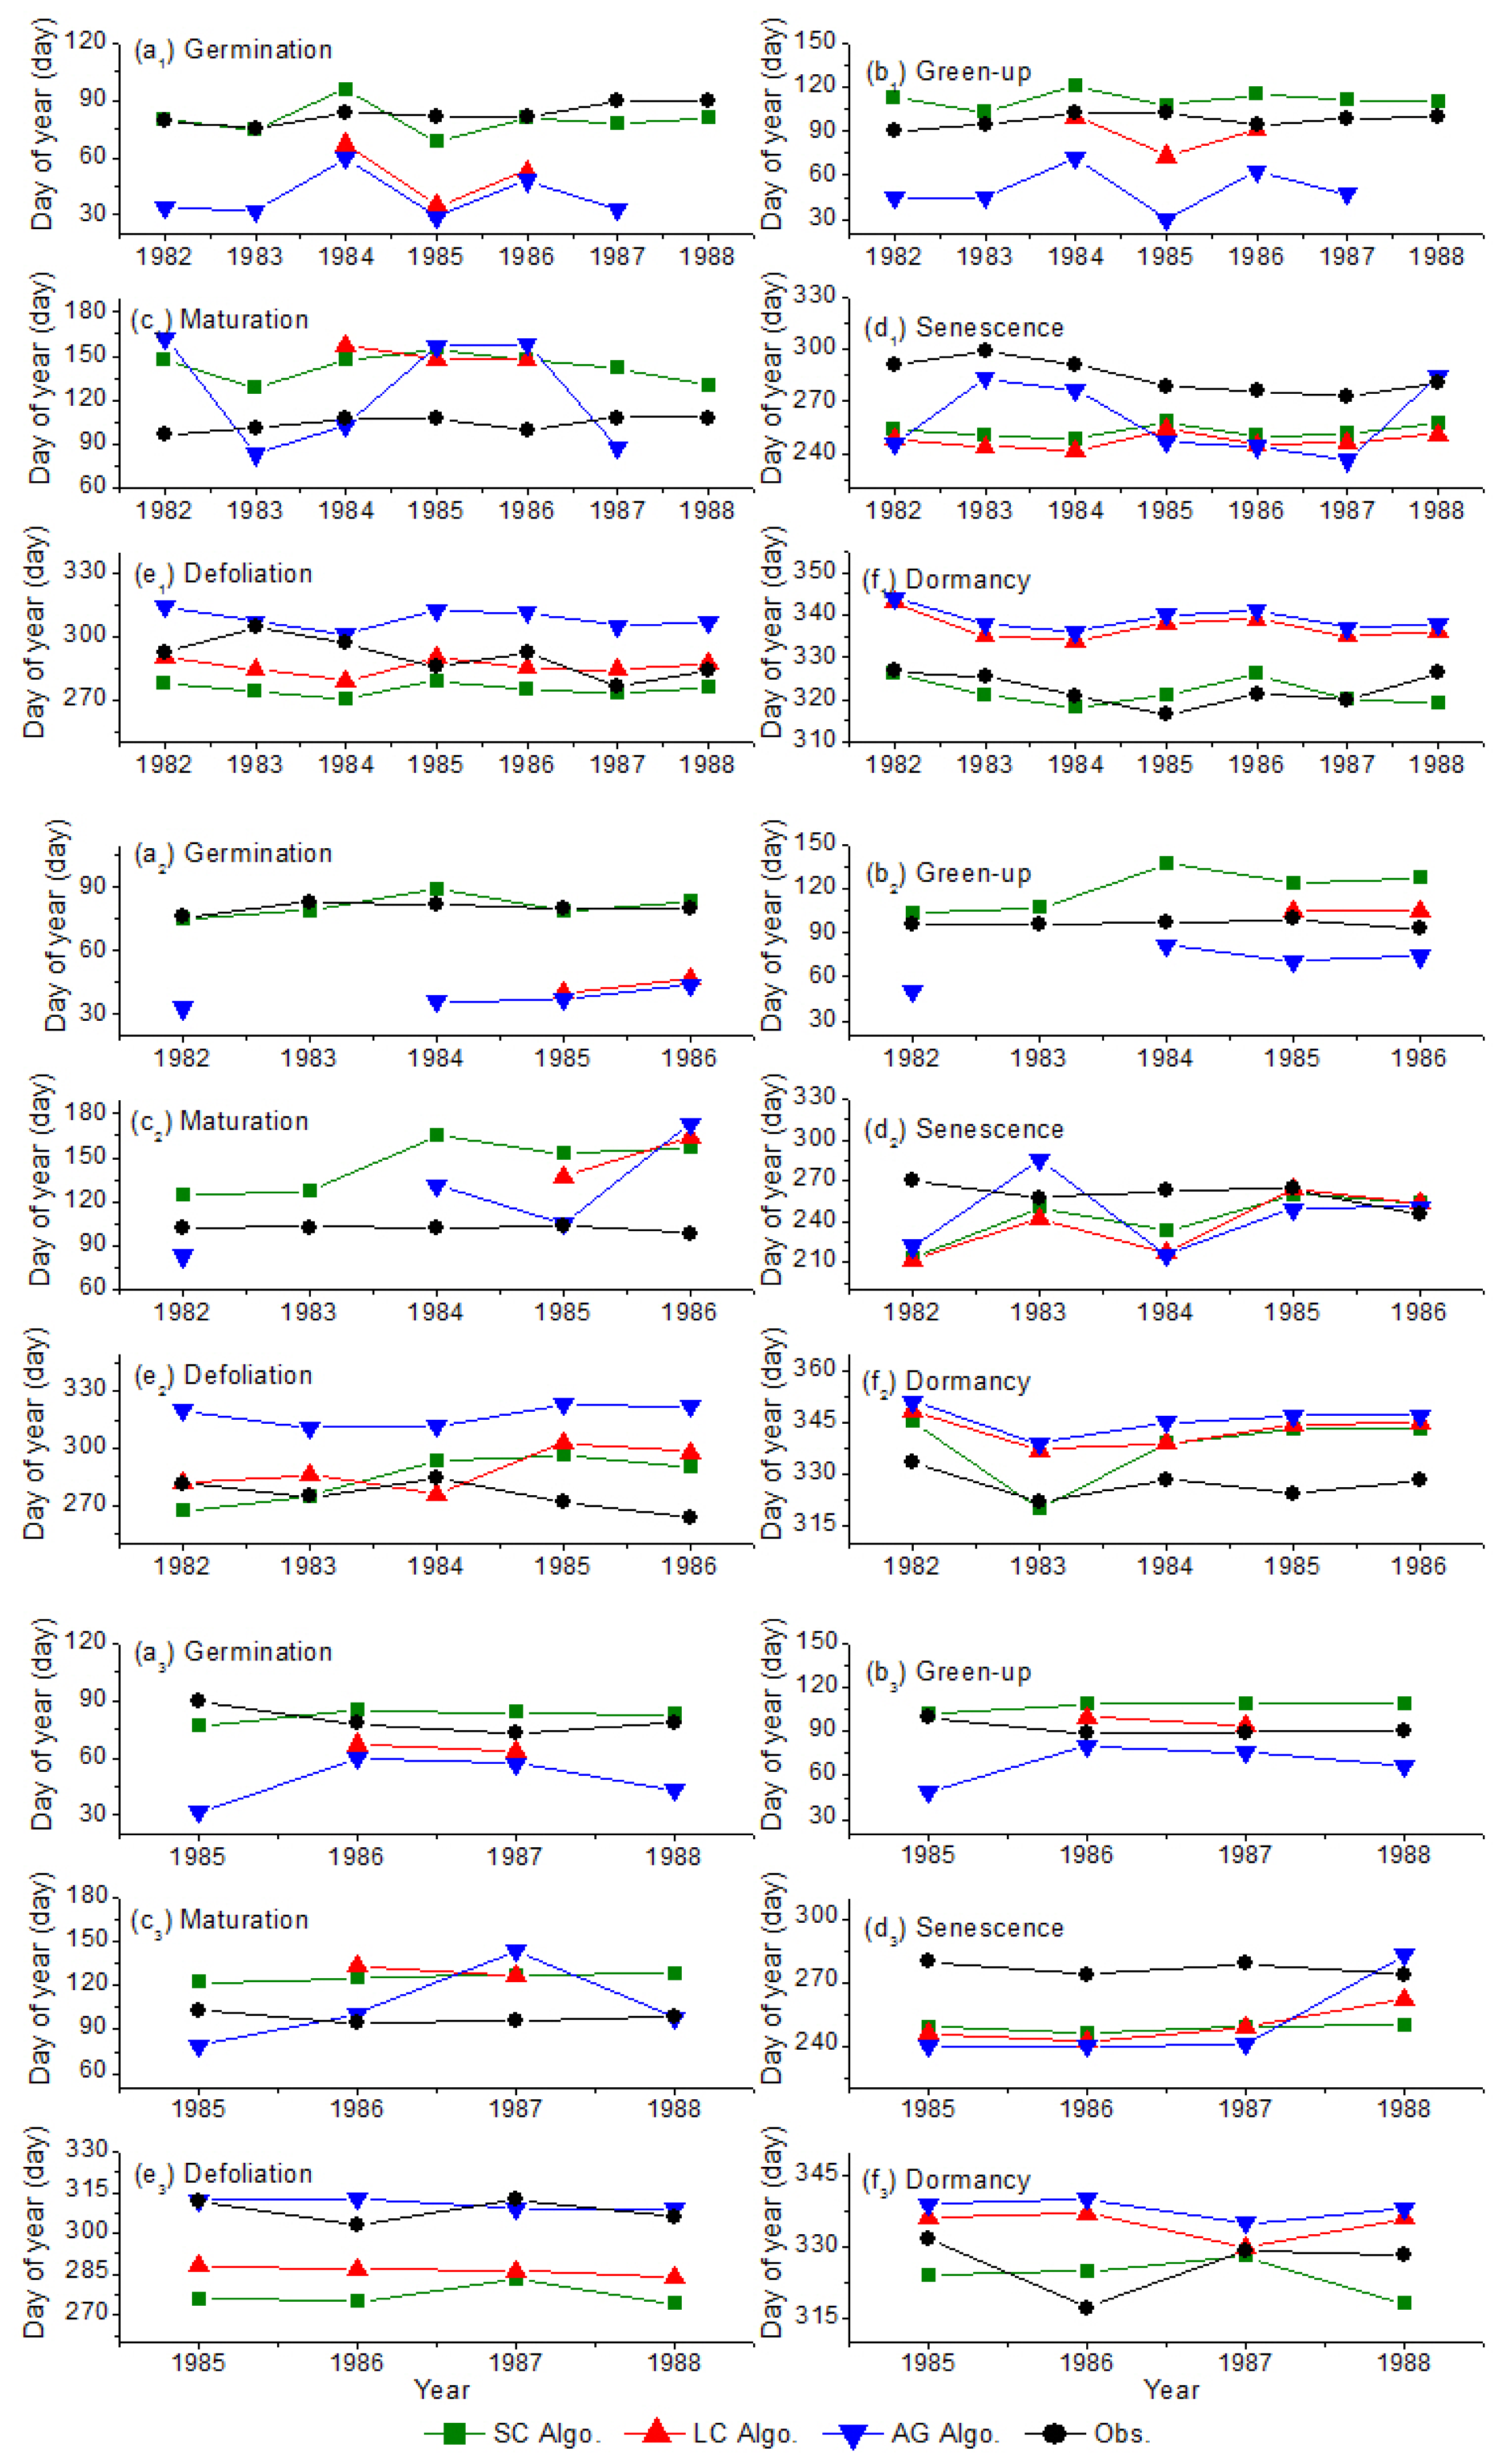
2.5. Validation Process for Vegetation Phenology
2.6. Quantitative Evaluation of Vegetation Phenology Retrieval Methodology
3. Results
4. Discussion
4.1. Complexity of Validation of Retrieval Results with Inversion Algorithms
4.2. Shortage of Validation Data
4.3. Uncertainties of the Retrieval Results
5. Conclusions
- (1)
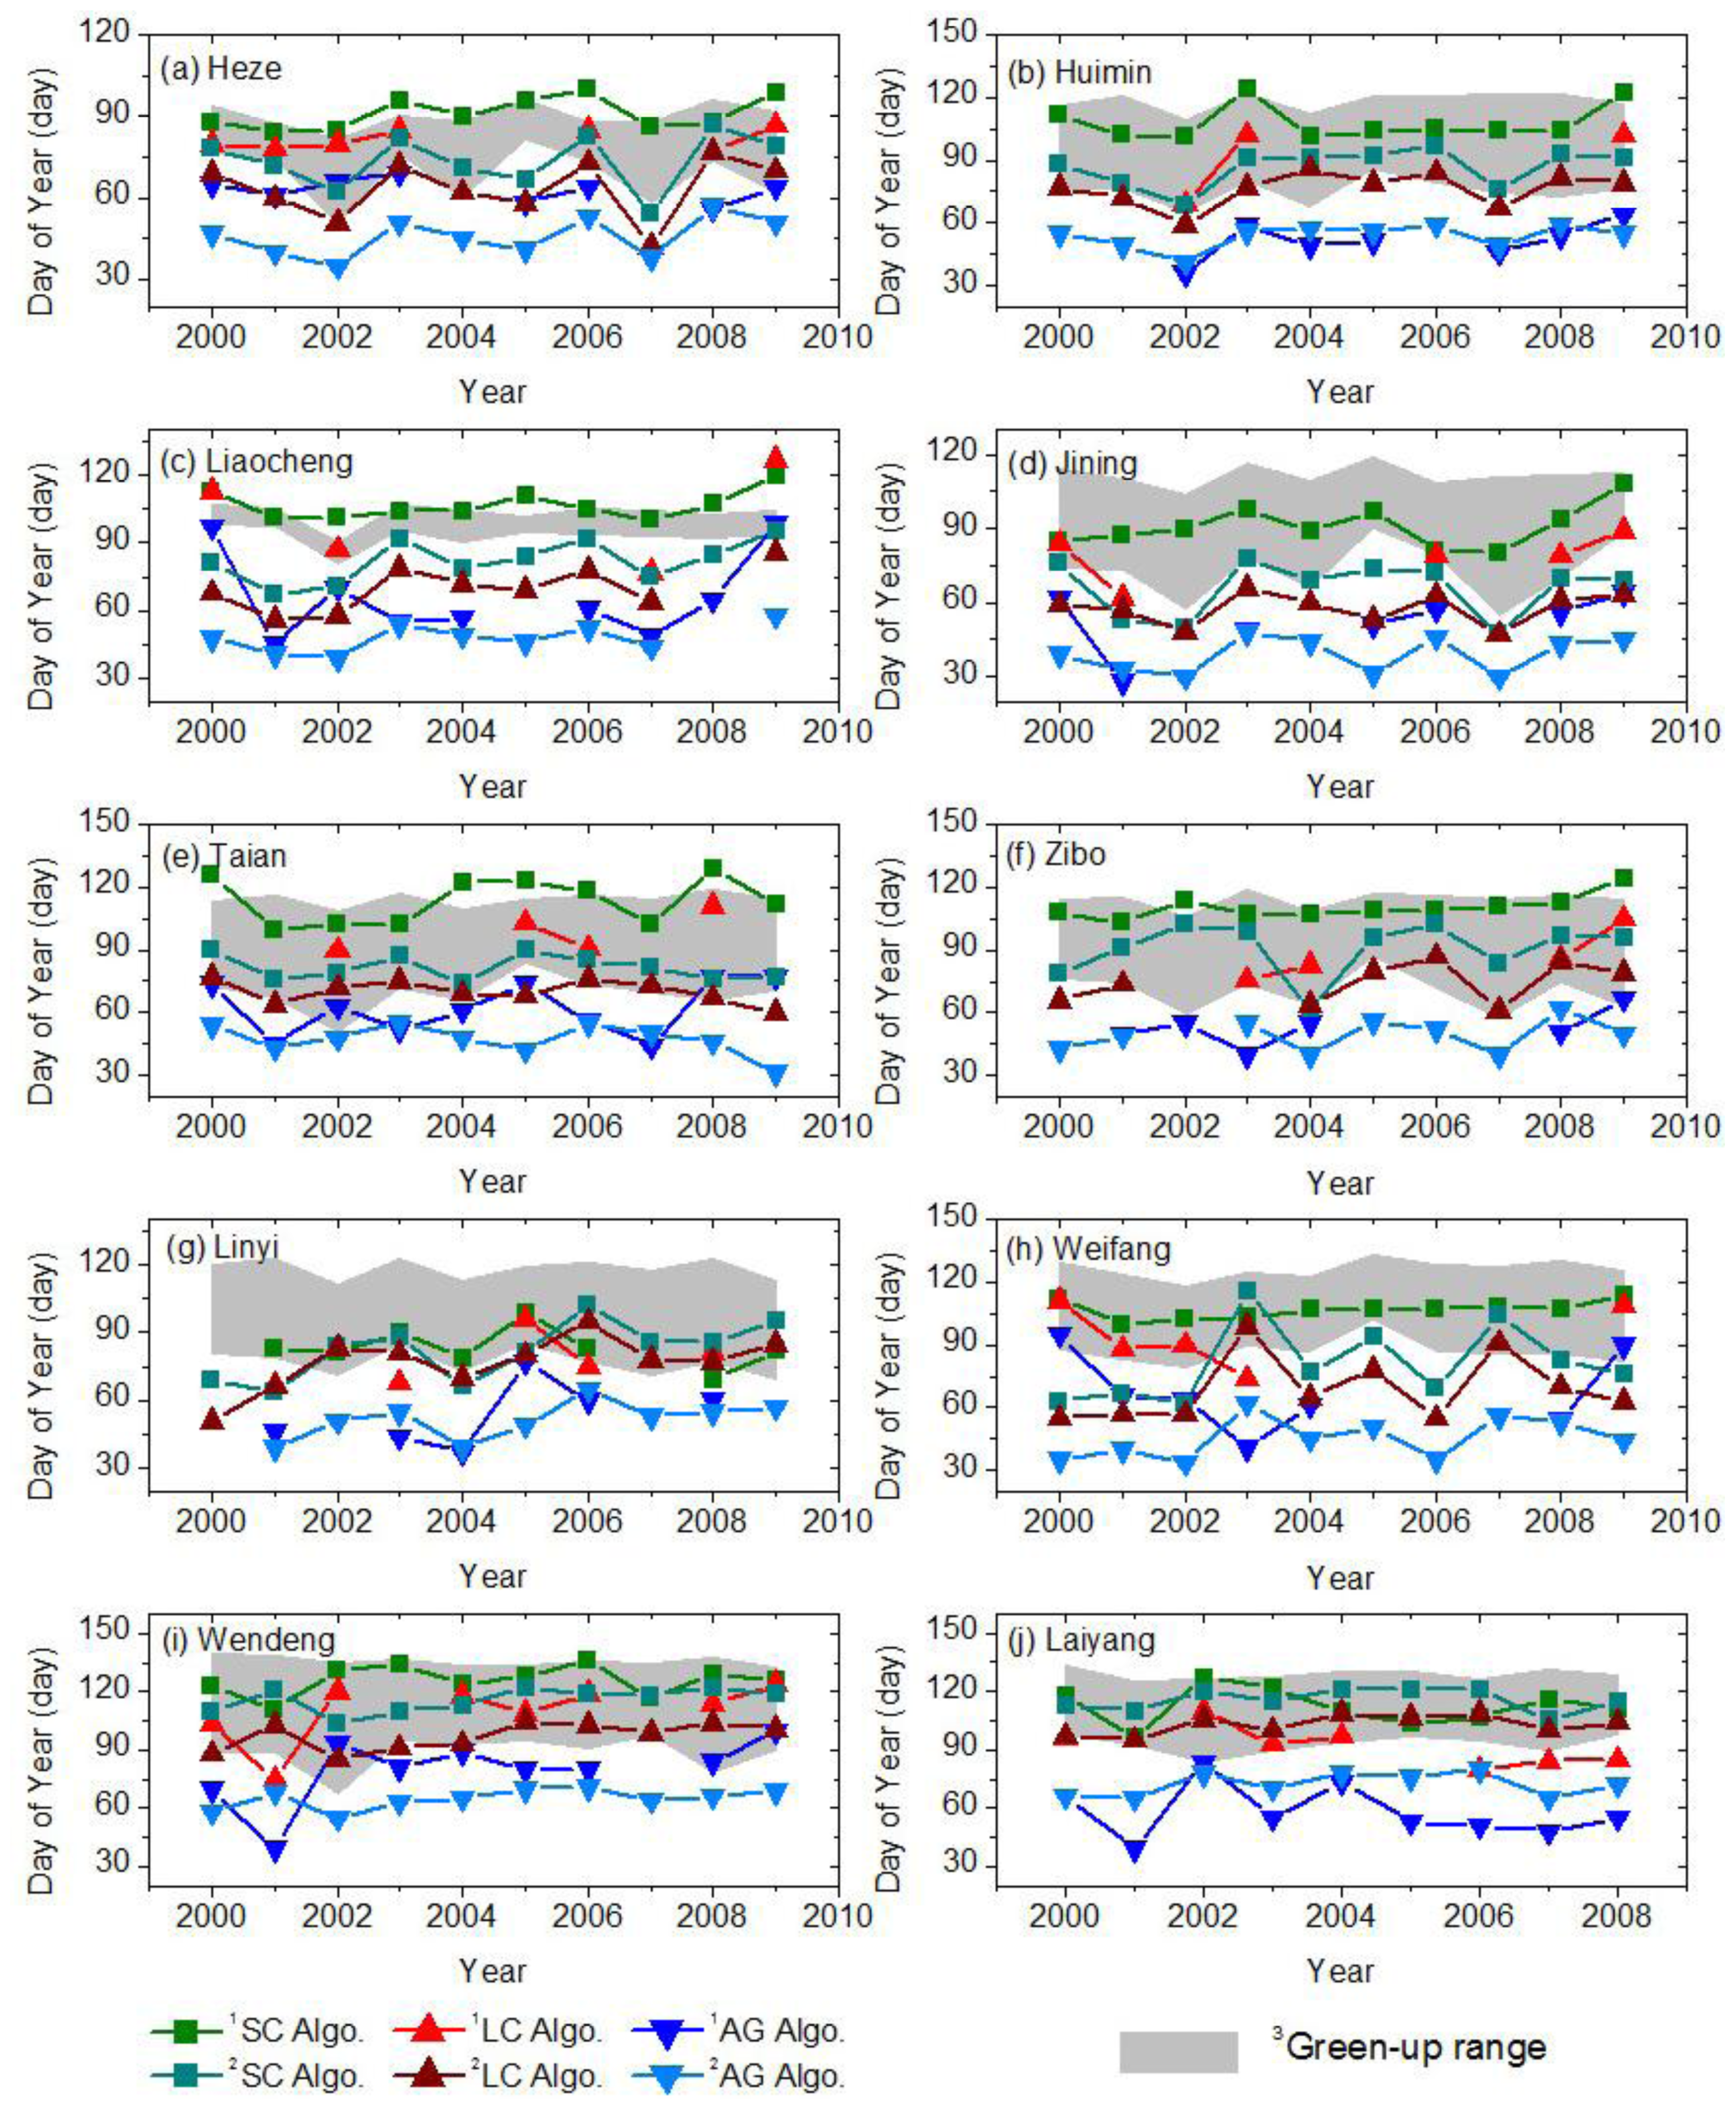
- The SC algorithm has better performance for deriving the vegetation phenophases, especially for the germination and dormancy. The averaged absolute biases of germination are 2, 28 and 39 days for the SC, LC and AG algorithms, respectively; while the averaged absolute biases of dormancy are 5, 13 and 16 days for the SC, LC and AG algorithms, respectively. The retrieval results of the SC algorithm begin later than the other two algorithms during germination and green-up but start earlier during defoliation and dormancy. The discrepancy among the retrieval results is reflected in the fitted LAI curve. The SC function fits the LAI curve better than the other two functions. The averaged RMSE values of fitting LAI are 0.116, 0.149 and 0.244 m2·m−2 for the SC, LC and AG functions, respectively. The averaged indices of agreement (IA) of fitting LAI are 0.983, 0.973, 0.892 for the SC, LC and AG functions, respectively. The phenology recognition rate (PRR) of the SC algorithm is obviously higher than the other two algorithms. The averaged PRRs are 1.00, 0.62, 0.91 for the SC, LC and AG algorithms, respectively.
- (2)
- Regardless of the LAI data used, the retrieved results using theSC algorithm are reliable and better than the other two algorithms. The averaged absolute biases of green-up using the SC algorithm are 9 and 12 days for the AVHRR LAI and improved MODIS LAI datasets, respectively. The green-up dates derived by the LC algorithm are earlier than the SC algorithm, but later than the AG algorithms. The SC and LC algorithms have the highest and lowest accuracy in the PRR (0.99 and 0.75), respectively. The SC algorithm has the advantage of deriving the vegetation phenology across time and space.
- (3)
- Besides the algorithms, the temporal–spatial resolution and quality of the LAI data used also determine the accuracy of the retrieved vegetation phenophases: low resolution/quality, higher uncertainty. For all three inversion algorithms, the retrieved results based on the AVHRR LAI data are later than those based on the improved MODIS LAI. The bias statistics analysis, i.e., the averaged absolute biases of green-up are 18 and 26 days for the AVHRR LAI and improved MODIS LAI data, respectively, shows that the retrieved results based on the AVHRR LAI data are more reasonable than those based on the improved MODIS LAI data. In addition, the mixing pixels of the LAI datasets and changes in the agricultural cultivation patterns influence the uncertainty as well.
Acknowledgments
Conflicts of Interest
- Author ContributionsAll authors contributed extensively to the work presented in this paper. Baozhang Chen and Huifang Zhang proposed the research idea. Mingliang Che and Baozhang Chen designed the algorithm, interpreted the results and wrote the paper. Huifang Zhang and Shifeng Fang analyzed the results and edited the paper. Guang Xu prepared the leaf area index (LAI) datasets. Xiaofeng Lin and Yuchen Wang prepared the phenology observed data.
References
- Schwartz, M.D. Phenology: An Integrative Environmental Science, 2nd ed; Springer: Heidelberg, Germany, 2013. [Google Scholar]
- Eastman, J.; Sangermano, F.; Machado, E.; Rogan, J.; Anyamba, A. Global trends in seasonality of Normalized Difference Vegetation Index (NDVI), 1982–2011. Remote Sens 2013, 5, 4799–4818. [Google Scholar]
- Schwartz, M.D. Green-wave phenology. Nature 1998, 394, 839–840. [Google Scholar]
- Menzel, A.; Fabian, P. Growing season extended in Europe. Nature 1999, 397, 659. [Google Scholar]
- Cong, N.; Wang, T.; Nan, H.J.; Ma, Y.C.; Wang, X.H.; Myneni, R.B.; Piao, S.L. Changes in satellite-derived spring vegetation green-up date and its linkage to climate in China from 1982 to 2010: A multimethod analysis. Glob. Chang. Biol 2012, 19, 881–891. [Google Scholar]
- Hamunyela, E.; Verbesselt, J.; Roerink, G.; Herold, M. Trends in spring phenology of western European deciduous forests. Remote Sens 2013, 5, 6159–6179. [Google Scholar]
- Badeck, F.W.; Bondeau, A.; Bottcher, K.; Doktor, D.; Lucht, W.; Schaber, J.; Sitch, S. Responses of spring phenology to climate change. New Phytol 2004, 162, 295–309. [Google Scholar]
- Høgda, K.; Tømmervik, H.; Karlsen, S. Trends in the start of the growing season in Fennoscandia 1982–2011. Remote Sens 2013, 5, 4304–4318. [Google Scholar]
- Zhao, M.; Peng, C.; Xiang, W.; Deng, X.; Tian, D.; Zhou, X.; Yu, G.; He, H.; Zhao, Z. Plant phenological modeling and its application in global climate change research: Overview and future challenges. Environ. Rev 2013, 21, 1–14. [Google Scholar]
- Menzel, A.; Estrella, N.; Fabian, P. Spatial and temporal variability of the phenological seasons in Germany from 1951 to 1996. Glob. Chang. Biol 2001, 7, 657–666. [Google Scholar]
- Atzberger, C.; Klisch, A.; Mattiuzzi, M.; Vuolo, F. Phenological metrics derived over the European continent from NDVI3g data and MODIS time series. Remote Sens 2013, 6, 257–284. [Google Scholar]
- Moulin, S.; Kergoat, L.; Viovy, N.; Dedieu, G. Global-scale assessment of vegetation phenology using NOAA/AVHRR satellite measurements. J. Clim 1997, 10, 1154–1170. [Google Scholar]
- Zhang, X.Y.; Friedl, M.A.; Schaaf, C.B.; Strahler, A.H.; Hodges, J.C.F.; Gao, F.; Reed, B.C.; Huete, A. Monitoring vegetation phenology using MODIS. Remote Sens. Environ 2003, 84, 471–475. [Google Scholar]
- Hanes, J.M.; Schwartz, M.D. Modeling land surface phenology in a mixed temperate forest using MODIS measurements of leaf area index and land surface temperature. Theor. Appl. Climatol 2010, 105, 37–50. [Google Scholar]
- You, X.; Meng, J.; Zhang, M.; Dong, T. Remote sensing based detection of crop phenology for agricultural zones in China using a new threshold method. Remote Sens 2013, 5, 3190–3211. [Google Scholar]
- Miao, L.; Luan, Y.; Luo, X.; Liu, Q.; Moore, J.; Nath, R.; He, B.; Zhu, F.; Cui, X. Analysis of the phenology in the Mongolian Plateau by inter-comparison of global vegetation datasets. Remote Sens 2013, 5, 5193–5208. [Google Scholar]
- Brandt, M.; Verger, A.; Diouf, A.; Baret, F.; Samimi, C. Local vegetation trends in the Sahel of Mali and Senegal using long time series FAPAR satellite products and field measurement (1982–2010). Remote Sens 2014, 6, 2408–2434. [Google Scholar]
- Chuine, I. A unified model for the budburst of trees. J. Theor. Biol 2000, 207, 337–347. [Google Scholar]
- Murray, M.B.; Cannell, G.R.; Smith, R.I. Date of budburst of fifteen tree species in Britain following climatic warming. J. Appl. Ecol 1989, 26, 693–700. [Google Scholar]
- Jolly, W.M.; Nemani, R.; Running, S.W. A generalized, bioclimatic index to predict foliar phenology in response to climate. Glob. Chang. Biol 2005, 11, 619–632. [Google Scholar]
- Atkinson, P.M.; Jeganathan, C.; Dash, J.; Atzberger, C. Inter-comparison of four models for smoothing satellite sensor time-series data to estimate vegetation phenology. Remote Sens. Environ 2012, 123, 400–417. [Google Scholar]
- White, M.A.; Debeurs, K.M.; Didan, K.; Inouye, D.W.; Richardson, A.D.; Jensen, O.P.; O’Keefe, J.; Zhang, G.; Nemani, R.R.; Vanleeuwen, W.J.D.; et al. Intercomparison, interpretation, and assessment of spring phenology in North America estimated from remote sensing for 1982–2006. Glob. Chang. Biol 2009, 15, 2335–2359. [Google Scholar]
- Zhong, L.; Ma, Y.M.; Salama, M.S.; Su, Z.B. Assessment of vegetation dynamics and their response to variations in precipitation and temperature in the Tibetan Plateau. Clim. Chang 2010, 103, 519–535. [Google Scholar]
- Wagenseil, H.; Samimi, C. Assessing spatio-temporal variations in plant phenology using Fourier analysis on NDVI time series: Results from a dry savannah environment in Namibia. Int. J. Remote Sens 2006, 27, 3455–3471. [Google Scholar]
- Jeong, S.J.; Ho, C.H.; Gim, H.J.; Brown, M.E. Phenology shifts at start vs. end of growing season in temperate vegetation over the Northern Hemisphere for the period 1982–2008. Glob. Chang. Biol 2011, 17, 2385–2399. [Google Scholar]
- Piao, S.L.; Cui, M.D.; Chen, A.P.; Wang, X.H.; Ciais, P.; Liu, J.; Tang, Y.H. Altitude and temperature dependence of change in the spring vegetation green-up date from 1982 to 2006 in the Qinghai-Xizang Plateau. Agric. For. Meteorol 2011, 151, 1599–1608. [Google Scholar]
- Markon, C.J.F.; Fleming, M.D.; Binnian, E.F. Characteristics of vegetation phenology over the Alaskan landscape using AVHRR time-series data. Polar Rec 1995, 31, 179–190. [Google Scholar]
- White, M.A.; Thornton, P.E.; Running, S.W. A continental phenology model for monitoring vegetation responses to interannual climatic variability. Glob. Biogeochem. Cycles 1997, 11, 217–234. [Google Scholar]
- Piao, S.L.; Fang, J.Y.; Zhou, L.M.; Ciais, P.; Zhu, B. Variations in satellite-derived phenology in China’s temperate vegetation. Glob. Chang. Biol 2006, 12, 672–685. [Google Scholar]
- White, M.A.; Nemani, R.R. Real-time monitoring and short-term forecasting of land surface phenology. Remote Sens. Environ 2006, 104, 43–49. [Google Scholar]
- Reed, B.C.; Brown, J.F.; Vanderzee, D.; Loveland, T.R.; Merchant, J.W.; Ohlen, D.O. Measuring phenological variability from satellite imagery. J. Veg. Sci 1994, 5, 703–714. [Google Scholar]
- Duchemin, B.; Goubier, J.; Courrier, G. Monitoring phenological key stages and cycle duration of temperate deciduous forest ecosystems with NOAA/AVHRR data. Remote Sens. Environ 1999, 67, 68–82. [Google Scholar]
- Jonsson, P.; Eklundh, L. Seasonality extraction by function fitting to time-series of satellite sensor data. IEEE Trans. Geosci. Remote Sens 2002, 40, 1824–1832. [Google Scholar]
- Beck, P.S.A.; Atzberger, C.; Høgda, K.A.; Johansen, B.; Skidmore, A.K. Improved monitoring of vegetation dynamics at very high latitudes: A new method using MODIS NDVI. Remote Sens. Environ 2006, 100, 321–334. [Google Scholar]
- Zhang, X.Y.; Friedl, M.A.; Schaaf, C.B. Global vegetation phenology from MODerate resolution Imaging Spectroradiometer (MODIS): Evaluation of global patterns and comparison with in situ measurements. J. Geophys. Res 2006, 111. [Google Scholar] [CrossRef]
- Ganguly, S.; Friedl, M.A.; Tan, B.; Zhang, X.Y.; Verma, M. Land surface phenology from MODIS: Characterization of the collection 5 global land cover dynamics product. Remote Sens. Environ 2010, 114, 1805–1816. [Google Scholar]
- Zhang, X.Y.; Goldberg, M.D. Monitoring fall foliage coloration dynamics using time-series satellite data. Remote Sens. Environ 2011, 115, 382–391. [Google Scholar]
- Zhang, X.Y.; Goldberg, M.D.; Yu, Y.Y. Prototype for monitoring and forecasting fall foliage coloration in real time from satellite data. Agric. For. Meteorol 2012, 158–159, 21–29. [Google Scholar]
- Richardson, A.D.; Braswell, B.H.; Hollinger, D.Y.; Jenkins, J.P.; Ollinger, S.V. Near-surface remote sensing of spatial and temporal variation in canopy phenology. Ecol. Appl 2009, 19, 1417–1428. [Google Scholar]
- Xia, C.; Li, J.; Liu, Q. Vegetation phenology monitoring method using time-series MODIS LAI data. Trans. Chin. Soc. Agric. Eng 2012, 28, 103–109, (In Chinese with English abstract). [Google Scholar]
- Yuan, H.; Dai, Y.J.; Xiao, Z.Q.; Ji, D.Y.; Shangguan, W. Reprocessing the MODIS leaf area index products for land surface and climate modelling. Remote Sens. Environ 2011, 115, 1171–1187. [Google Scholar]
- Zhu, Z.C.; Bi, J.; Pan, Y.Z.; Ganguly, S.; Anav, A.; Xu, L.; Samanta, A.; Piao, S.L.; Nemani, R.R.; Myneni, R.B. Global data sets of vegetation leaf area index (LAI)3g and fraction of photosynthetically active radiation (FPAR)3g derived from global inventory modeling and mapping studies (GIMMS) normalized difference vegetation index (NDVI3g) for the period 1981 to 2011. Remote Sens 2013, 5, 927–948. [Google Scholar]
- De Jong, R.; Verbesselt, J.; Zeileis, A.; Schaepman, M. Shifts in global vegetation activity trends. Remote Sens 2013, 5, 1117–1133. [Google Scholar]
- Chen, B.; Xu, G.; Coops, N.C.; Ciais, P.; Innes, J.L.; Wang, G.; Myneni, R.B.; Wang, T.; Krzyzanowski, J.; Li, Q.; et al. Changes in vegetation photosynthetic activity trends across the Asia-Pacific region over the last three decades. Remote Sens. Environ 2014, 144, 28–41. [Google Scholar]
- Che, M.; Chen, B.; Innes, J.L.; Wang, G.; Dou, X.; Zhou, T.; Zhang, H.; Yan, J.; Xu, G.; Zhao, H. Spatial and temporal variations in the end date of the vegetation growing season throughout the Qinghai-Tibetan Plateau from 1982 to 2011. Agric. For. Meteorol 2014, 189–190, 81–90. [Google Scholar]
- Borak, J.; Jasinski, M. Effective interpolation of incomplete satellite-derived leaf-area index time series for the continental United States. Agric. For. Meteorol 2009, 149, 320–332. [Google Scholar]
- Ran, Y.H.; Li, X.; Lu, L.; Li, Z.Y. Large-scale land cover mapping with the integration of multi-source information based on the Dempster-Shafer theory. Int. J. Geogr. Inf. Sci 2012, 26, 169–191. [Google Scholar]
- Institute of Geographical Sciences and Natural Resources Research (IGSNRR), Chinese Academy of Sciences (CAS), China’s Animal and Plant Phenology Observation Reports (1981–1982); Geological Publishing House: Beijing, China, 1983. (In Chinese)
- Institute of Geographical Sciences and Natural Resources Research (IGSNRR), Chinese Academy of Sciences (CAS), China’s Animal and Plant Phenology Observation Reports (1983–1984); Geological Publishing House: Beijing, China, 1985. (In Chinese)
- Institute of Geographical Sciences and Natural Resources Research (IGSNRR), Chinese Academy of Sciences (CAS), China’s Animal and Plant Phenology Observation Reports (1985–1986); Geological Publishing House: Beijing, China, 1987. (In Chinese)
- Institute of Geographical Sciences and Natural Resources Research (IGSNRR), Chinese Academy of Sciences (CAS), China’s Animal and Plant Phenology Observation Reports (1987–1988); Geological Publishing House: Beijing, China, 1989. (In Chinese)
- Zang, H.J.; Li, X.Y.; Li, J.; Cai, J. Responses of woody plants’ spring phenology to climate changes in Shandong. Chin. J. Agrometeorol 2011, 32, 167–173, (In Chinese with English abstract). [Google Scholar]
- Zeng, H.Q.; Jia, G.S.; Epstein, H. Recent changes in phenology over the northern high latitudes detected from multi-satellite data. Environ. Res. Lett 2011, 6, 045508. [Google Scholar]
- Ding, M.J.; Zhang, Y.L.; Sun, X.M.; Liu, L.S.; Wang, Z.F.; Bai, W.Q. Spatiotemporal variation in alpine grassland phenology in the Qinghai-Tibetan Plateau from 1999 to 2009. Chin. Sci. Bull 2012, 58, 396–405. [Google Scholar]


| ID | Site Name | Lat. (°N) | Lon. (°E) | Elev. (m) | Site Year | a Percip. (mm·yr−1) | b Temp. (°C) |
|---|---|---|---|---|---|---|---|
| 1 | Heze | 35.22 | 115.47 | 54 | 2000–2009 | 698.4 | 14.7 |
| 2 | Liaocheng | 36.45 | 115.98 | 36 | 1982–1988, 2000–2009 | 578.4 | 13.1 |
| 3 | Jining | 35.40 | 116.58 | 42 | 2000–2009 | 708.5 | 13.7 |
| 4 | Taian | 36.18 | 117.08 | 171 | 1982–1986, 2000–2009 | 675.3 | 13.0 |
| 5 | Huimin | 37.48 | 117.50 | 13 | 2000–2009 | 589.4 | 12.2 |
| 6 | Zibo | 36.80 | 118.05 | 40 | 2000–2009 | 622.1 | 13.3 |
| 7 | Linyi | 35.10 | 118.33 | 68 | 2000–2009 | 793.9 | 13.3 |
| 8 | Weifang | 36.70 | 119.15 | 28 | 1985–1988, 2000–2009 | 615.3 | 12.6 |
| 9 | Laiyang | 36.97 | 120.70 | 41 | 2000–2009 | 795.4 | 11.2 |
| 10 | Wendeng | 37.18 | 122.05 | 50 | 2000–2009 | 762.2 | 11.5 |
| Site Name | Algorithm | Germination | Greenup | Maturation | Senescence | Defoliation | Dormancy |
|---|---|---|---|---|---|---|---|
| Liaocheng | SC | −3 | 14 | 39 | −32 | −15 | −1 |
| LC | −31 | −10 | 47 | −37 | −5 | 15 | |
| AG | −44 | −47 | 21 | −24 | 18 | 17 | |
| Taian | SC | 1 | 18 | 44 | −18 | 9 | 11 |
| LC | −37 | 9 | 49 | −22 | 14 | 15 | |
| AG | −43 | −27 | 21 | −15 | 42 | 18 | |
| Weifang | SC | 2 | 11 | 27 | −28 | −31 | −3 |
| LC | −15 | 5 | 32 | −27 | −22 | 8 | |
| AG | −32 | −24 | 7 | −26 | 2 | 11 | |
| Site Name | Algorithm | PRR | RMSE | IA | |||
|---|---|---|---|---|---|---|---|
| Spring | Autumn | Spring | Autumn | Spring | Autumn | ||
| Liaocheng | SC | 1.00 | 1.00 | 0.059 | 0.235 | 0.973 | 0.982 |
| LC | 0.43 | 1.00 | 0.072 | 0.315 | 0.962 | 0.971 | |
| AG | 0.86 | 1.00 | 0.111 | 0.443 | 0.848 | 0.910 | |
| Taian | SC | 1.00 | 1.00 | 0.084 | 0.158 | 0.989 | 0.979 |
| LC | 0.40 | 0.40 | 0.094 | 0.180 | 0.988 | 0.973 | |
| AG | 0.80 | 0.80 | 0.225 | 0.277 | 0.886 | 0.897 | |
| Weifang | SC | 1.00 | 1.00 | 0.089 | 0.070 | 0.978 | 0.995 |
| LC | 0.50 | 1.00 | 0.142 | 0.094 | 0.954 | 0.992 | |
| AG | 1.00 | 1.00 | 0.158 | 0.250 | 0.901 | 0.911 | |
© 2014 by the authors; licensee MDPI, Basel, Switzerland This article is an open access article distributed under the terms and conditions of the Creative Commons Attribution license (http://creativecommons.org/licenses/by/3.0/).
Share and Cite
Che, M.; Chen, B.; Zhang, H.; Fang, S.; Xu, G.; Lin, X.; Wang, Y. A New Equation for Deriving Vegetation Phenophase from Time Series of Leaf Area Index (LAI) Data. Remote Sens. 2014, 6, 5650-5670. https://doi.org/10.3390/rs6065650
Che M, Chen B, Zhang H, Fang S, Xu G, Lin X, Wang Y. A New Equation for Deriving Vegetation Phenophase from Time Series of Leaf Area Index (LAI) Data. Remote Sensing. 2014; 6(6):5650-5670. https://doi.org/10.3390/rs6065650
Chicago/Turabian StyleChe, Mingliang, Baozhang Chen, Huifang Zhang, Shifeng Fang, Guang Xu, Xiaofeng Lin, and Yuchen Wang. 2014. "A New Equation for Deriving Vegetation Phenophase from Time Series of Leaf Area Index (LAI) Data" Remote Sensing 6, no. 6: 5650-5670. https://doi.org/10.3390/rs6065650