Article

Ontology-Based Classification of Building Types Detected from Airborne Laser Scanning Data

1
Department of Geoinformatics (Z_GIS), University of Salzburg, Schillerstrasse 30, 5020 Salzburg, Austria
2
School of Information Technology and Systems Management, Salzburg University of Applied Sciences, 5412 Puch-Salzburg, Austria
3
Institute of Geography, Chair of GIScience, University of Heidelberg, 69120 Heidelberg, Germany
*
Author to whom correspondence should be addressed.
Remote Sens. 2014, 6(2), 1347-1366; https://doi.org/10.3390/rs6021347
Submission received: 19 November 2013 / Revised: 15 January 2014 / Accepted: 5 February 2014 / Published: 12 February 2014

Abstract

:
Accurate information on urban building types plays a crucial role for urban development, planning, and management. In this paper, we apply Object-Based Image Analysis (OBIA) methods to extract buildings from Airborne Laser Scanner (ALS) data and investigate the possibility of classifying detected buildings into “Residential/Small Buildings”, “Apartment Buildings”, and “Industrial and Factory Building” classes by means of domain ontology and machine learning techniques. The buildings objects are classified using exclusively the information computed from the ALS data. To select the relevant features for predicting the classes of interest, the Random Forest classifier has been applied. The ontology-based classification yielded convincing results for the “Residential/Small Buildings” class (F-Measure 97.7%), whereas the “Apartment Buildings” and “Industrial and Factory Buildings” classes achieved less accurate results (F-Measure 60% and 51%, respectively).

Graphical Abstract

1. Introduction

Reliable information on urban building types plays an important role for a wide range of applications, such as urban planning, disaster management [1], or energy consumption modeling in urban environments [2]. Buildings extraction has been traditionally accomplished using tedious and time-intensive techniques, such as manual digitization of the aerial images. With the increasing availability of very-high resolution imagery (VHR), important research efforts have focused on developing automatic methods for buildings extraction. However, the level of automation is still low due to the increasing complexity of the urban scenes [3,4].
The emergence of Airborne Laser Scanning (ALS) marked a major breakthrough for improving the level of automation and accuracy of buildings mapping using solely laser scanning data [5,6], or by fusing ALS data with digital imagery [79]. The ALS data have the potential to overcome some of the challenges posed by VHR in providing accurate information about buildings in urban environments [10]. Such challenges include occlusions caused by trees, shadowing [11], or confusion between buildings, roads, and bare soil [12]. Furthermore, descriptive information (features) derived from ALS data might be further used to extract “higher-level geographic information” [13], including building types. Unfortunately, only few studies have focused on evaluating the potential of ALS data for classifying the buildings into various classes [10,14]. Wurm et al. [10] developed a fuzzy logic classification to assign the buildings delineated from a Digital Surface Model (DSM) into five building classes: Building Blocks, High-rise, Non-Residential/Industrial, Semi-Detached Houses and Terraced Houses. Gonzalez-Aguilera et al. [14] analyzed urban areas in the city of Avila, Spain by means of buildings density calculated using auxiliary data and geometric information (height, area, and volume) of individual buildings extracted from ALS data.
The derivation of higher-level information, such as building types, is not a trivial task. It relies primarily on the knowledge of the experts about the semantics of target real world objects and their representation in the evaluated data [15]. The expert knowledge (a priori knowledge) is seldom organized into consistent knowledge bases dedicated to increase the reusability and the objectivity of the target objects classification [15]. Furthermore, given the large number of features that can be calculated for the objects extracted from ALS data (shape features, height, or slope), the selection of the relevant features for the target classes remains mainly a trail-and-error attempt [16]. As with the image classification task, a semantic gap arises between the high-level semantics of the experts and the low-level information extracted from data [17]. To address this problem, methods are required to identify optimal features to discriminate between evaluated classes [18] and to explicitly specify the knowledge of the experts on the evaluated classes [19]. Ontologies offer considerable potential to conceptualize and formalize the a priori knowledge about evaluated domain categories [20]. In the Artificial Intelligence (AI) domain, ontology is defined as “formal, explicit specification of a shared conceptualization” [21]. It is used as solution to organize and to express the domain knowledge into a machine-readable format. Although ontologies have been successfully used to infer semantically-richer concepts, such as terraced houses from geo-databases [20], or to formalize the image interpretation knowledge for developing automated image classification procedures [19] (see Section 2.2 for a detailed discussion about ontologies and their applications in GIS and remote sensing), there is no study that uses ontology to assign the buildings delineated from ALS to various building categories.
In this paper we evaluate the use of ontology to distinguish between different building types. The developed ontology accounts for the description of the evaluated building types elicited from literature and the building features extracted from ALS data. The relevance of the ALS-based features for the followed classification goal was assessed by applying the Random Forest (RF) classifier. Relevant features refer to the smallest possible set of building characteristics that allow reliable classification results and optimize the time required to develop the classification model. We restricted our analysis to the following building classes: “Residential/Small Buildings”, “Apartment Buildings” (or Buildings Blocks), and “Industrial and Factory Buildings”. The following hypothesis was tested: evaluated building types can be modeled relying exclusively on the information extracted from the ALS data.
This paper is organized as follows: After a short introduction of the previous work dedicated to the buildings extraction from ALS data and ontology engineering methods in Section 2, the paper continues with the methodology in Section 3, results and discussion in Section 4. This study is summarized in Section 5.

2. Previous Work

2.1. Buildings Extraction from ALS Data

Approaches, which deal with the delineation and detection of buildings from ALS data, are mentioned in literature as early as the 1990s. In [22], one of the earliest descriptions of the extraction process based only on ALS data was provided. Their method employed edge detection on a Digital Elevation Model (DEM) in order to define candidate buildings objects. A predefined shape assumption (I, T, or L shape) was applied in order to extract building type objects. This procedure is one of the earliest approaches that combined image-based techniques on 3D data. Following that study, a number of additional research studies were conducted investigating the usage of ALS point cloud data in order to detect and delineate buildings boundaries. For example, Alharthy et al. [23] used a raster of the height difference between first and last return of each laser shot along with local statistical interpretations to segment the analyzed ALS data. The object extraction relies on Digital Terrain Model/Digital Surface Model (DTM/DSM) subtraction, height threshold and dominant direction determination. A method for building extraction in urban areas from high-resolution ALS data was developed in [5]. Their approach consisted of a normalized DSM calculation, the application of a height threshold, and the usage of binary morphological operators in order to isolate building candidate regions. The isolated areas were then clustered via a plane segmentation method, based on the analysis of the variations of the DSM normal vectors to define the planar patches. Such patches are later expanded with region growing algorithms. In [24], a building extraction process using only ALS data was also focused on. Their approach was based on the minimum filtering of ALS DEM, region-growing, linear least square estimation and the application of a method for wireframe extraction [25]. In [26], a knowledge-based building detection methodology, based on ALS data, was generated. Their approach applied bottom-up region merging segmentation in order to generate clusters. Their classification process was based on attribute values assigned to clustered forms (mean value and standard deviation of the aspect, slope and Laplacian image along with shape attributes). In [27], a pseudo-grid-based building extraction approach via ALS data was presented. This approach utilized pseudo-grid generation and local maxima filtering to segment the data. In order to extract buildings, they applied a grouping method based on pseudo-grid and building boundary extraction—linearization and simplification. In [28], a segmentation and object-based classification methodology for the extraction of building classes from ALS DEMs was provided. Their segmentation process was performed using the procedure described by [29] followed by the cluster-based classification. A method for the area-wide roof plane segmentation in ALS point clouds was developed in [30]. They applied region growing, constrained with a normal vector to segment the point cloud, and slope adaptive Echo-Ratio (sER), along with the minimum height criterion to detect roof areas. In other research approaches, ALS data were fused with multi-spectral imagery for automatic building detection and delineation [8]. Most of the above mentioned studies delineate the buildings from the DSM. The rasterized DMS extracted from ALS or other sources proved to be an appropriate solution to delineate accurate building footprints [31].

2.2. Ontology Approaches in GIScience and Remote Sensing
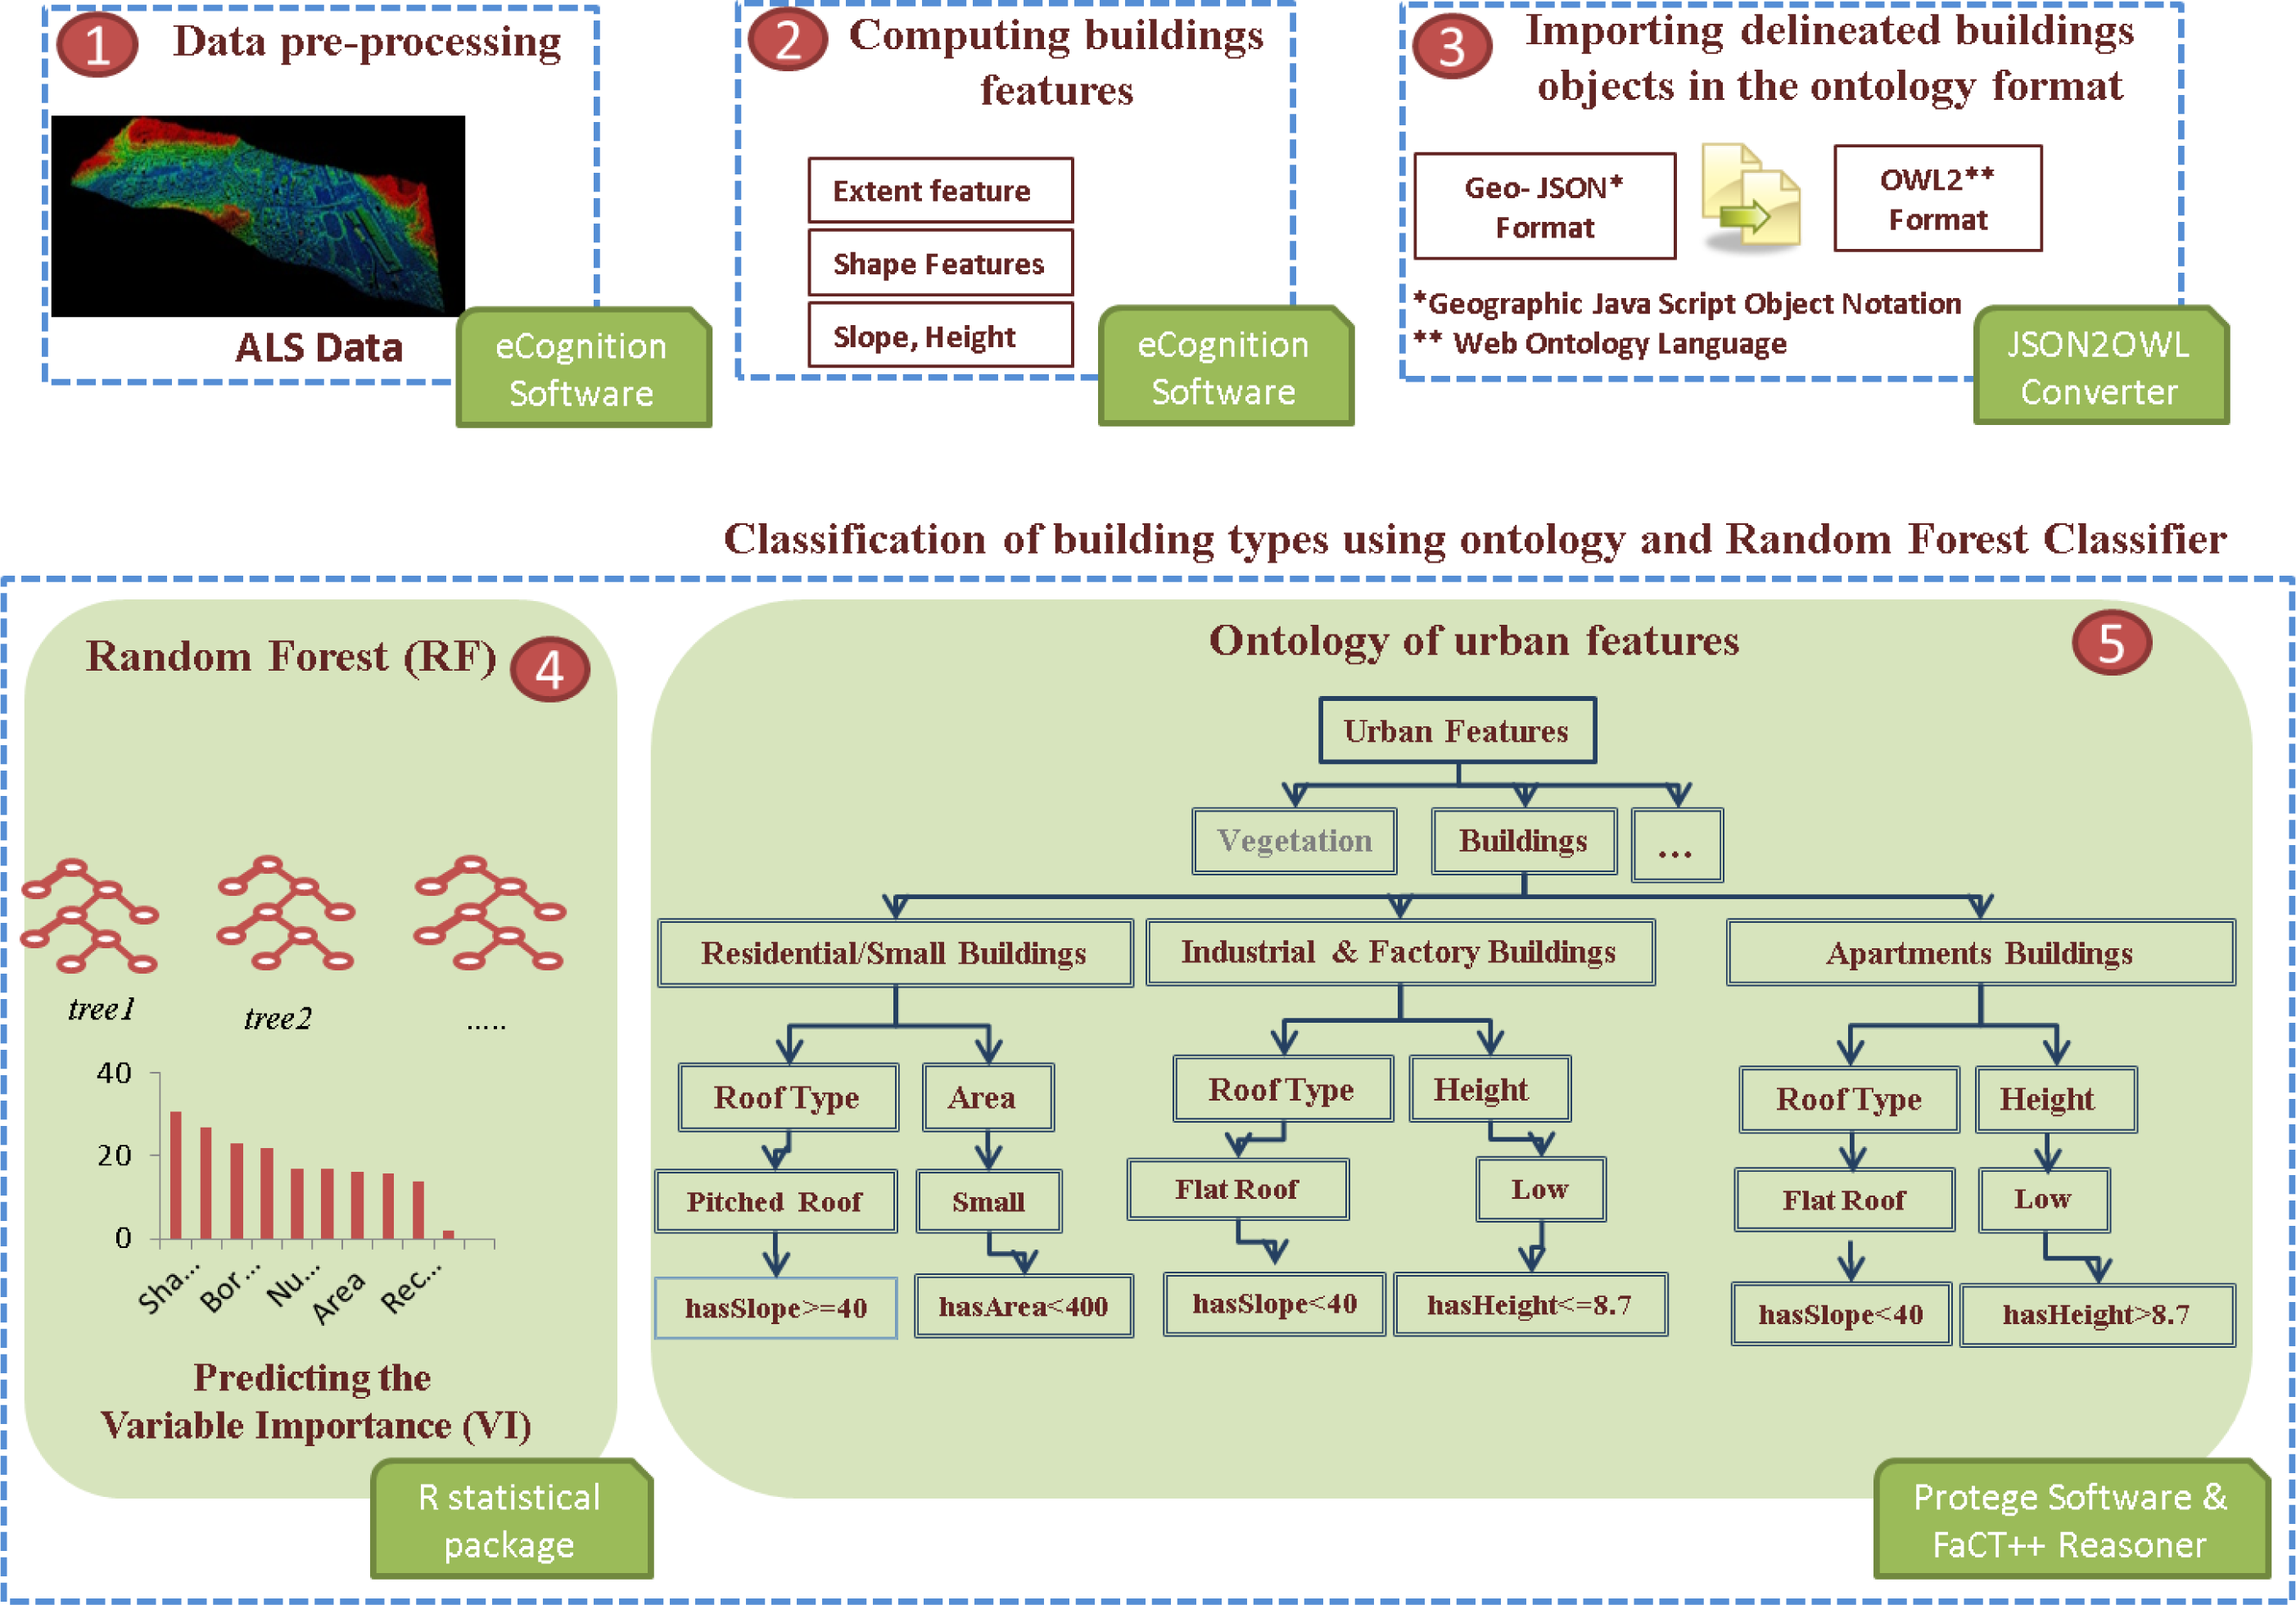
In the last decade, ontology became a widely accepted solution to deal with the semantic heterogeneity problems that prevent information discovery and integration in a distributed way [32]. The GIS community uses ontology to explicitly specify and formalise the meaning of the domain concepts into a machine-readable language that enables spatial information retrieval on a semantic level [33]. There are studies that investigate the ontologies as solution to infer new knowledge from the (geo-) databases. For example, Lüscher et al. [20] and Lüscher et al. [34] described an ontology-driven approach to infer the terraced houses category from the spatial database. The focus of this study [20] was to model explicitly the terraced house concept and to use a supervised Bayesian inference mechanism for low-level pattern recognition from data stored in the databases.
Ontologies have also been used to guide and automate the image analysis and interpretation procedures [15,35,36]. A knowledge base of urban objects was developed in [15] and used to label the image objects delineated from high-resolution satellite imagery by means of segmentation techniques. The authors developed a local and global matching algorithm to map the observations (Digital Numbers extracted from remote sensing imagery) with the domain nomenclature (linguistic notions). Hudelot et al. [37] proposed an ontology-based image classification procedure where the domain concepts, described by means of visual properties such as texture, color (e.g., red), geometry (e.g., rectangular), are matched with the quantitative information extracted from the imagery. For example, the “rectangular” qualitative information is instantiated using shape metrics, whose thresholds are empirically determined from the data at hand. A comprehensive review of the role of ontology to content-based image retrieval and classification of VHR data can be found here [19,38].
The ontology was classified into four categories [39]: top-level, domain, task, and application ontologies. The top-level ontologies, such as DOLCE [40] or Semantic Web for Earth and Environmental Terminology (SWEET) [41], formalize the generic categories such as space, process, event [42], whereas the domain ontology knowledge formalizes explicitly the domain specific knowledge. The task and application ontologies refer to the formalization of the application concepts: e.g., earthquake monitoring systems. The conceptualization of the domain ontology together with the task and application ontologies need to be aligned to the semantics of the generic categories specified on the top-level ontology [43]. The ontologies alignment assures domain ontology matching and, hence, information retrieval and exchange across different application domains.
Ontologies can be expressed using different knowledge representation languages, such as Simple Knowledge Organization System (SKOS), Resource Description Framework (RDF), or Web Ontology Language 2 (OWL2) specifications [44]. These languages differ in terms of the supported expressivity. The SKOS specification, for instance, is widely used to develop multi-lingual thesauri, embedded in the searching capabilities of the existing spatial data repositories. The OWL2 ontology language is based on the Description Logics (DL) for the species of the language called OWL-DL. DL thereby provides the formal theory on which statements in OWL are based and through which the statements can be automatically tested by a reasoner. The OWL semantics comprises three main constructs: classes, individuals and properties. Classes are sets of individuals, whereas properties define relationships between two individuals (Object Properties) or an individual and a data type (Data Properties).
Despite the fact that there are several works dedicated to ontology-based classifications of the real world entities, the ontologies developed so far are rarely integrated with the measurements data (physical data) [43]. To address this problem, Janowicz [43] emphasized the need to develop observation-driven ontologies that account for the so-called ontological primitives automatically identified in the analyzed data by means of geostatististics, machine-learning, or data mining techniques. The author gave the example of spectral signature as ontological primitives used to identify the targeted objects in the remote sensing data. Spectral signatures represented the basis for (semi-)automatic pixel-based image analysis. The signatures are organized into libraries that can be easily re-used in different image analysis applications. With VHR data, it is difficult to develop robust spectral (and/or geometric) signatures of objects to be identified in the imagery, due to the increasing complexity of the scenes and spectral responses variability. In this study, we use ALS data to extract building footprints to avoid the challenges posed by VHR imagery in extracting reliable objects. Further, we develop a domain ontology that accounts for the representation of the building categories in the ALS data.

3. Methodology

The applied workflow of buildings detection and classification is organized as follows: in the data pre-processing step, the buildings footprints are delineated from ALS data using the procedure described in Section 3.1 (Step 1, Figure 1). Subsequently, the extent, shape, height and slope features of the extracted buildings are computed (Step 2, Figure 1) and imported into the next classification procedure using a converter developed in this study (Step 3, Figure 1). In the last step, the building types are classified based on the features identified by the RF as relevant (Step 4, Figure 1) and which are formalized in the ontology (Step 5, Figure 1).

3.1. Preprocessing Step: Automatic Extraction of Buildings from ALS Data

The ALS data used in this paper was provided by Trimble Germany GmbH—Biberach Branch. The data were recorded with the Trimble Harrier 68i system. The selected dataset represents an area of 1.1 square kilometers and covers a part of the town of Biberach an der Riss, in Germany. The point cloud consists of multiple returns with recorded intensity, and a density of 4.8 points per square meters. The aircraft flew at the height of 600 m above ground, with a swath width of 693 m. The recorded data was pre-processed and corrected in terms of horizontal and absolute height shifts in relation to the reference data that was collected (GCPs and buildings’ polygons). Strips have been corrected in terms of roll, pitch and heading, and vertically aligned to each other.
Our approach for building extraction relies on the slope calculation and edge extraction with added object reshaping based on predefined thresholds. We used the Object Based Image Analysis (OBIA) method to delineate the building footprints. OBIA is based on the segmentation of the used data into homogeneous objects which are further assigned to the target classes. The ALS data processing was implemented using the Cognition Network Language (CNL), available within the eCognition software package (version 8.8—64 bit) [45]. In this study, raster data were derived from the point cloud. This approach was chosen due to the different representations of objects in remotely sensed data than e.g., in the cadaster. For example, the cadaster data represents the building walls and not the roof outlines, as it is most commonly the case in remote sensing data. Based on this observation, deriving object features from ALS data for cadaster footprints most probably leads to unsatisfactory results. As Rutzinger et al. [46] stated, the temporal shift between two building datasets is a further issue when evaluating or combining different datasets. Thus, performing building detection, feature derivation, and classification within one consistent dataset is to be preferred and, as such, has been applied in this paper. Data processing starts with the generation of DEM from the minimum values of last returns, and is followed by a slope calculation based on method proposed by [47], object refinements techniques such as pixel resizing, and the object reclassification based on the height difference between the object and its surrounding area. The final reclassification of the delineated objects is based on two distinct measures: area and recorded intensity. The first separates small objects from the rest of the group based on the initial presumption that elevated objects with an area smaller than 40 pixels represent vegetation left overs, noise, or other solid artifacts (car, truck, statue, etc.). The second measure utilizes the intensity value of the return signal in order to further refine our results and discard remaining artifacts. Based on a trial and error approach, a threshold value of 5900 digital number (DN) ([48,49]) was used to separate final building polygons (vector format) from the pre-classified, building candidates. The accuracy of the extracted buildings polygons was assessed by means of data completeness and correctness measures. The ground truth dataset was created using the DSM raster generated from the minimum values of last returns as a reference dataset. Visual inspection was performed and point features were added to each recognized building on the DSM raster. Spatial analysis of point-in-polygon was calculated, and based on this analysis the completeness and correctness indicators were derived for building object detection.
Once the building objects have been identified in the ALS data, various features can be computed and used for the classification task (Table 1).
Four groups of buildings features were extracted from ALS data: extent features, shape features, height, and the slope of the buildings’ roof (Table 1). The extent features define the size of the buildings objects, whereas the shape features describe the complexity of the buildings’ boundaries. The classification model relies exclusively on the features computed from ALS data as we wanted to assess the potential of this data to discriminate between different building types. The building objects extracted from the ALS are stored as a Geographic JavaScript Object Notation (GeoJSON) file, and automatically parsed in the OWL2 ontology language format using a developed JSON to OWL2 converter. This converter transforms the GeoJSON objects into OWL2 Individuals.

3.2. Classification of Building Types Data Using Ontology and Random Forest Classifier

To classify the buildings delineated from ALS data into different building types, we developed a hybrid classification method that combines ontology with machine learning techniques. The definitions of the building types were acquired from textual descriptions of the urban environments, whereas the relevant low-level information (data-driven information) was selected by applying ensemble learning algorithms, i.e., the RF classifier. Thus, the RF classifier is used to adapt the developed ontologies to the representation of the targeted buildings category in the ALS data. This approach aligns with the vision proposed by [43], who recommends the development of geo-ontologies from empirical data. A similar approach was presented by [50] who initially developed a conceptual model to define Central Business Districts (CBD) within large cities and then assessed the predictive power of the identified physical and morphological parameters to delineate the CBD in the considered urban landscapes: London, Paris, and Istanbul.
Ontology engineering relies on several steps: knowledge acquisition, conceptualization, ontology formalization, and the implementation of the developed ontology into computational model [39].

3.2.1. Knowledge Acquisition and Conceptualization

The first step in designing the classification model consists of acquiring a priori knowledge of the evaluated building types. This knowledge is usually held by experts [15] and/or available in various text corpora. The building definitions summarized in Table 2 are based on the existing literature about the evaluated building types [51,52].
The above-presented buildings descriptions are independent of any application [35,53] and data at hand. Yet, they comprise the characteristics of the buildings present in the considered urban environment. In the conceptualization phase, the acquired knowledge (building types concepts and their underlying semantics) is organized hierarchically in a semi-formal way (Figure 2). This phase is important for both domain experts and ontology engineers. The former can easily understand the underlying semantics of the domain concepts and, therefore, they can easily extend and/or modify the acquired knowledge. On the other hand, this hierarchical, semi-formal representation of the domain knowledge guides the ontology engineers in their attempt to model the ontology using the OWL2 specifications.
The qualitative descriptions of the buildings types are mapped to the quantitative information extracted from the ALS data. This procedure poses the following challenge: which features (i.e., buildings characteristics) are appropriate to instantiate the qualitative concepts descriptors: e.g., what metrics are relevant to identify the buildings that have complex form.

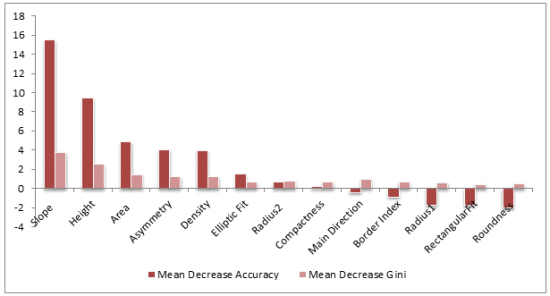
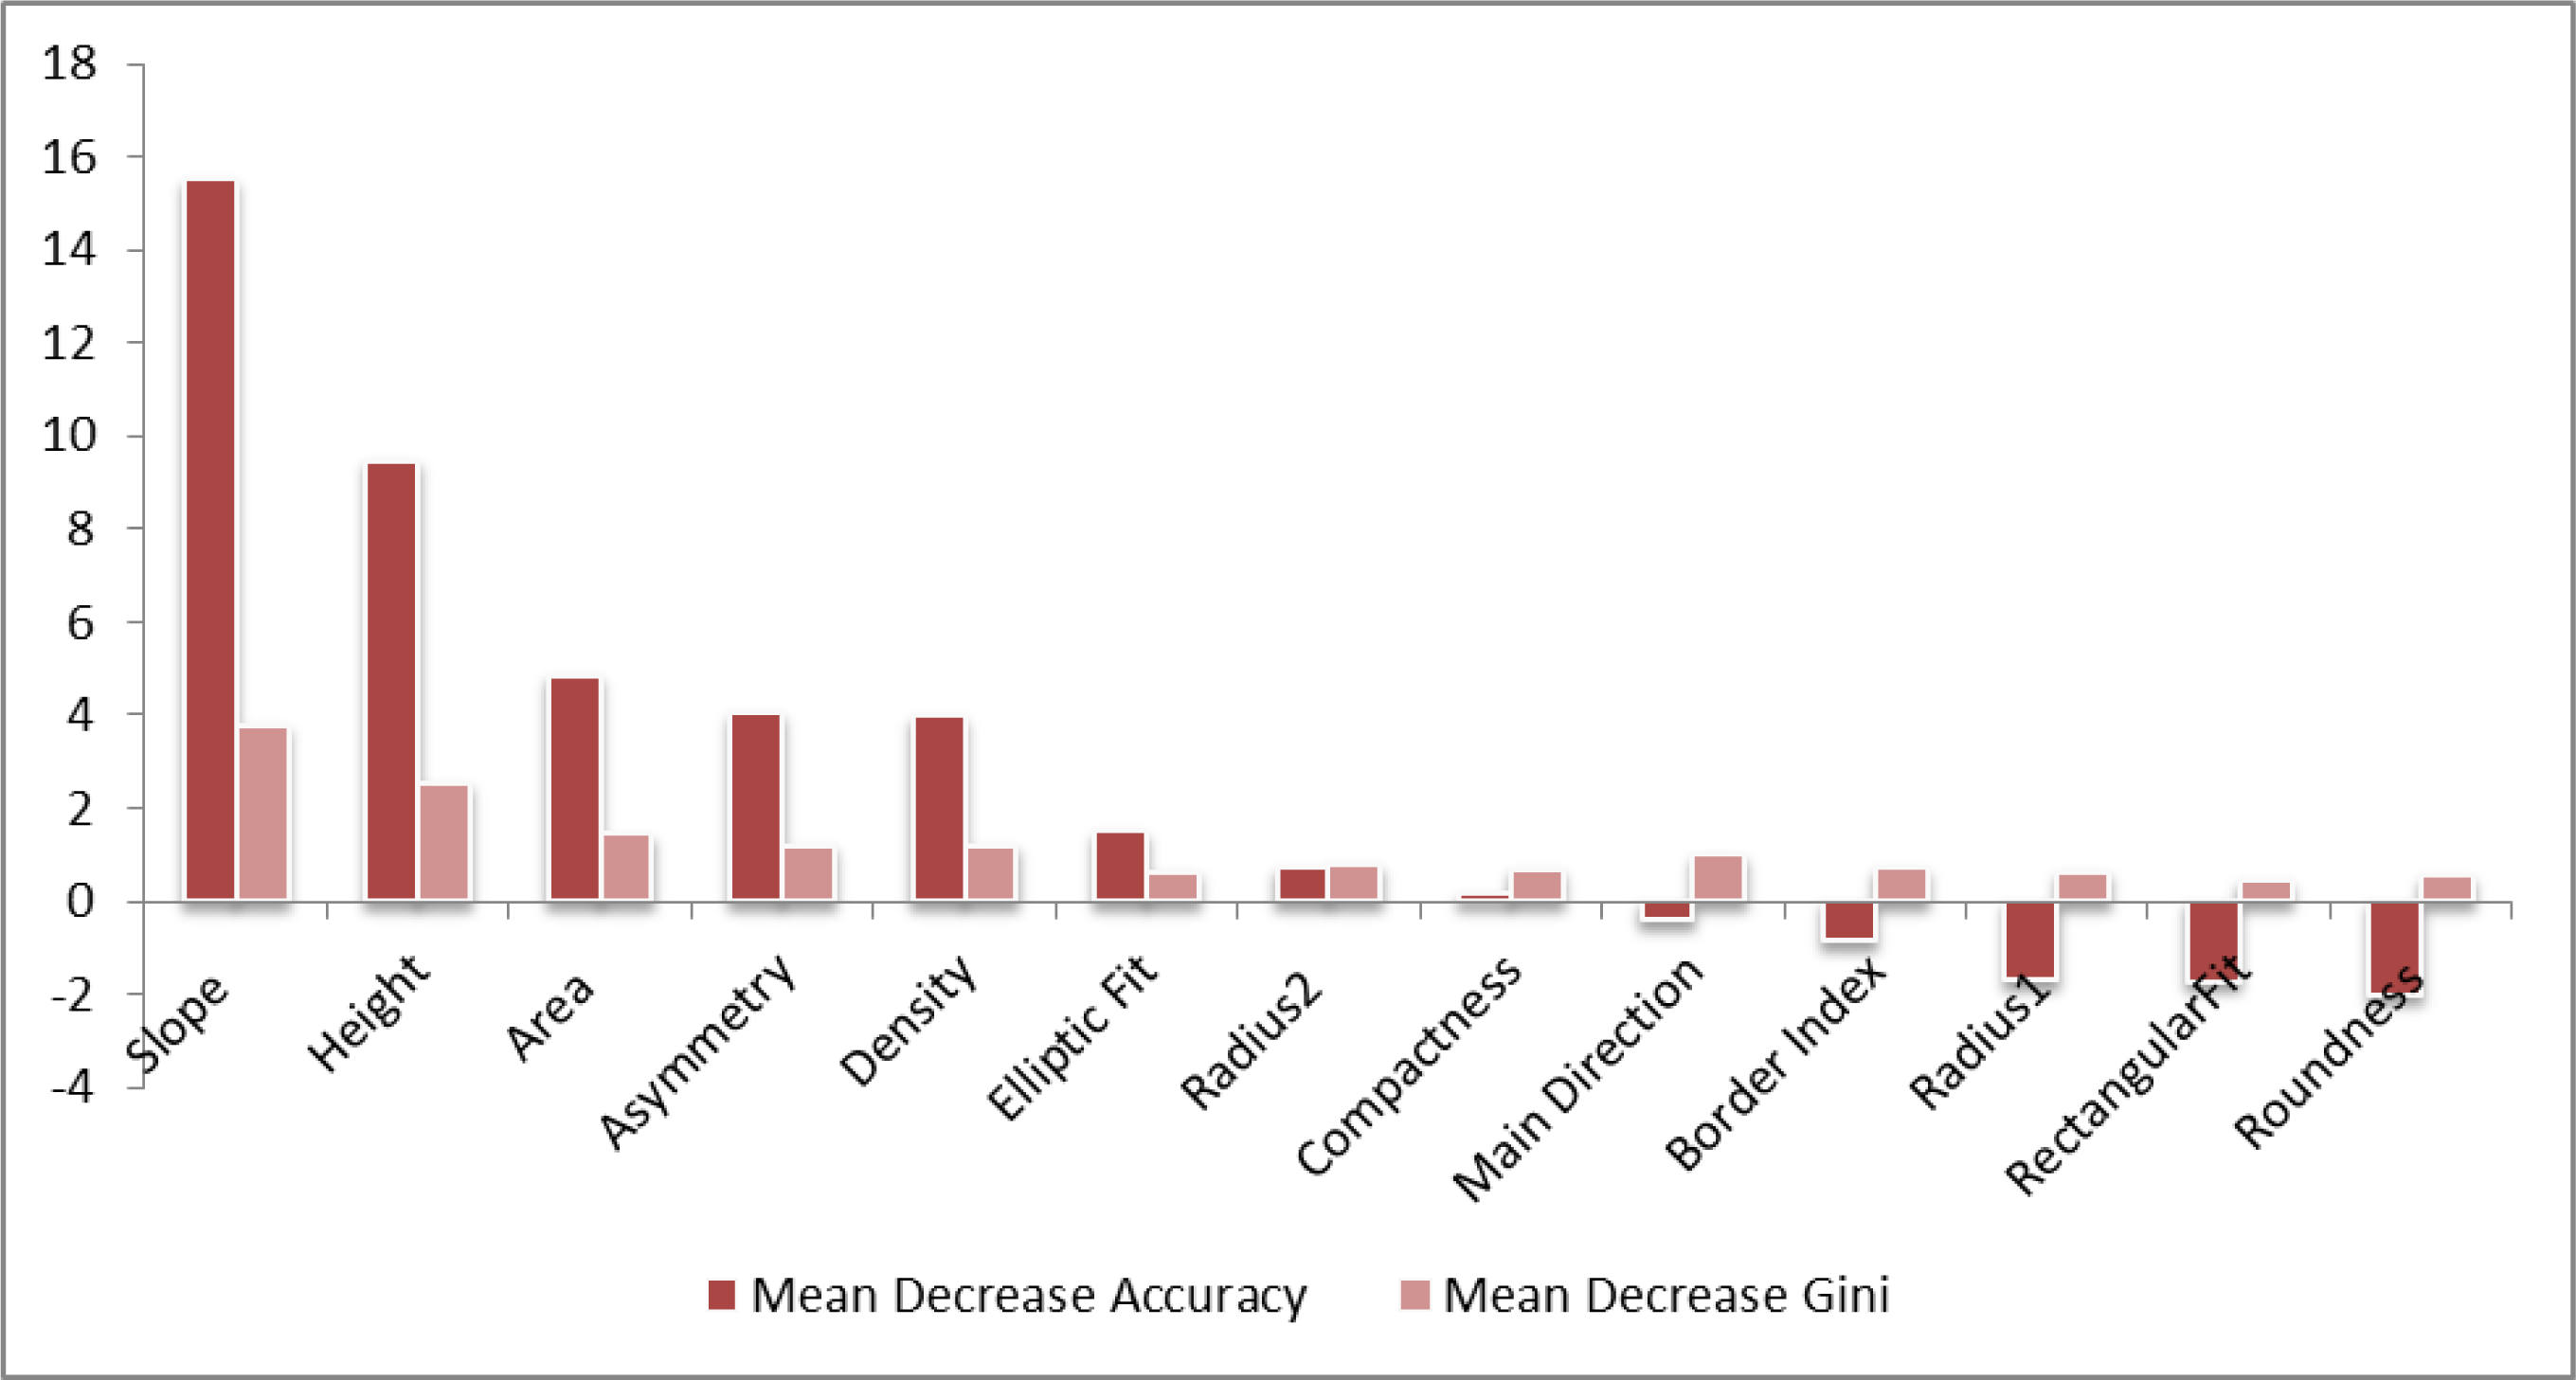
3.2.2. Feature Selection—Rejecting Irrelevant Features and Ranking the Feature Relevance

For the task of selecting relevant features for achieving optimal classification results, two main problems need to be addressed [54]: (i) “the minimal-optimal problem”, which refers to the challenge of eliminating the redundant features from a classification model, and (ii) “the all-relevant problem” that refers to the identification of all relevant features for achieving optimal classification results. To address the above-mentioned problems, we used the RF classifier [55]. RF is a non-parametric ensemble learning classifier [55], successfully implemented in different application domains, including remote sensing [5658] and data mining in life sciences [59]. For a detailed evaluation of the effectiveness of the RF classifier in the remote sensing domain, the readers might refer to [60].
RF relies on a large set of classification decision trees (ensemble of classification trees) [55]. Each of these decision trees votes for the class membership, the class being assigned according to the majority of the trees votes. To build the decision trees, bootstrapped samples (sampling training data randomly) of the original training data are created. The bootstrapped samples are separated into training sets, and out-of-bag (OOB) subset samples. Two-thirds of the samples in the original sample data are used for training and one third is used as OOB for assessing the performance of the trees [55]. A subset of features is then randomly selected at each tree node/split and tested for the best-splitting, based on the Gini impurity [55]. In this paper, the RF classifier is used to predict the explanatory power of the input variables, also known as “Variable Importance” (VI): (1) Mean Decrease in Accuracy (MDA), and (2) Mean Decrease in Gini (MDG) [55].
The RF classifier was applied on a set of 45 training samples (Step 4, Figure 1). To avoid biases caused by the underrepresentation of the “Apartment Buildings” and “Industrial and Factory Buildings” classes, a balanced training set (15 per class) was selected. The training samples for the industrial buildings and residential buildings were compiled by visual interpretation of the cadastral data published online by the Biberach an der Riß Urban Planning Agency [61], whereas the samples for the apartment buildings were created through visual interpretation of Bing Maps Aerial (©2012 Nokia, ©2013 Microsoft Corporation) and Google Maps (GeoBasis-DE/BKG ©2009, Google Map data ©2012).
The RF requires the definition of two parameters: (1) the number of classification trees, and (2) the number of input variables used at each node split. In this study we defined 500 trees and √m variables at each split, where m represents the number of input features. These are the recommended parameters for tuning the RF classifier [55]. The VI of each feature is then calculated from averaging the importance of the selected features over 500 trees. The RF classifier was applied by using the Random Forest package implemented in the R statistical programming environment [62]. The features identified as relevant by RF are used to instantiate the qualitative descriptions of buildings specified in the ontology.

3.2.3. Ontology Formalization and Classification of the Building Types Using Fact++ Reasoner

The ontology has been formalized using the OWL2 specifications. For example, the class hierarchy displayed in Figure 2 is formalized as follows:
ResidentialSmall Buildings Buildings hasRoofType . PitchedRoof hasArea . SmallArea Apartment Buildings Buildings hasRoof . FlatRoof hasHeight . Low Industrial and Factory Buildings Buildings hasRoof . FlatRoof hasArea . LargeArea hasHeight . Low
These class definitions are similar to the IF/THEN rules. For example, if an object has a flat roof, is a high object and is in the subclass of the “Buildings” class, then this object belongs to the “Apartment Buildings” class. The “Buildings” class was already classified as the ALS analysis was targeted towards extracting only building footprints and neglecting the other classes. In the next step, we instantiate the qualitative description like “Small Area” with the data driven features identified as relevant by the RF classifier, introduced in the previous section. Finally, the building types classification is carried out using the FaCT++ reasoner [63]. A reasoner is a software program that infers superclass/subclass relationships from the ontology and conducts consistency, equivalence and instantiation testing [63]. Thus, by running a class query, e.g., “Residential/Small Buildings”, the reasoner returns all individuals (buildings objects) that satisfy the “Residential/Small Buildings” definition specified in the ontology.

3.3. Accuracy Assessment

The classification accuracy was assessed by means of precision (Equation (1)), recall (Equation (2)), and F-measure indicators (Equation (3)) [64]. Precision indicates the number of retrieved instances that are relevant (identified in the reference data), whereas recall indicates the number of the relevant instances that are retrieved [64]. The validation data were generated using the procedure described above (Section 3.2.2). Given the reduced size of the analyzed area, we classified all buildings extracted from ALS into the classes of interest: 73 “Apartment Buildings”, 27 “Industrial and Factory Buildings”, and 687 “Residential/Small Buildings”.
precision = true positive true positive + false positive
recall = true positives true positives + false negatives
F-measure = 2 × ( precision × recall ) precision + recall

4. Results and Discussion

This paper explored the use of the ontology to classify building types relying exclusively on the information extracted from ALS data.

4.1. Buildings Extraction from ALS Data

The building polygons for the analyzed area have been extracted by applying the methodology described in Section 3.1. In order to provide an accuracy measure of the extracted building objects a measure of completeness and correctness has been applied. For the described data set, a completeness measure of 97.80% and correctness of 80.05% was achieved. We observed that some buildings were misclassified and discarded from the final building class, as uncorrected intensity data for the final classification was used. Due to the range-dependency and atmospheric influences, the recorded signal intensity did not show proper results, but rather a distorted value which was offset enough to appear as if it were vegetation. Some of the vegetation residuals were too dense, so that the extraction algorithm merged them together into polygons resembling buildings.

4.2. Feature Importance Results

The MDA and MDG measures used to predict the explanatory power of the input variables (VI) are depicted in Figure 3. The most relevant features for all evaluated classes are: Slope, Height, Area, and Asymmetry. Slope and height features were predicted as being the most important features for categorising the evaluated buildings types. This result emphasizes the potential of the ALS data to discriminate between different building types. The importance of height and area for classifying building classes was also emphasized in these studies [51,52].
Despite the fact that shape metrics are recognized as important features for discriminating between different building types [18,50], the importance predicted by RF for these features in our study area is much lower than slope, height, or area (Figure 3). This can be also explained by the errors encountered during the ALS pre-processing step that altered the shape of the building polygons, or merged the adjacent buildings into the same building object.
We utilized the RF to predict the feature relevance (VI), because it is a non-parametric classifier [55], which proved “computational efficiency and robustness to outliers and noises” [16]. Furthermore, this study [58] showed that the MDA criterion performs slightly better for feature selection than the Mean Discriminant Function Coefficient metric, corresponding to the Linear Discriminant Analysis (LDA). Steiniger et al. [18] used box-and-whisker plots to assess the importance of different features for discriminating between the evaluated urban areas. As the authors emphasized [18], this is not the best solution for testing the power of features to discriminate between target classes, as it only indicates “whether classes are separable by a simple one-dimensional decision stump” [18].

4.3. Results of the Ontology-Based Classification of the Building Types

The final classification model consists of the following Feature Vector (FV): FV = [Slope, Height and Area]. The thresholds of these features were empirically determined by the RF classifier. The relevant features together with the identified thresholds have been modeled in the ontology (Figure 1 Step 3.2.3). For example, the “Flat-Roof” concept is defined as an ontology class whose quantitative value is specified by defining restrictions on the “Slope-Value” data property (see the code snippet on the next page).
<EquivalentClasses>
  <Class IRI="#Flat-Roof"/>
  <DataSomeValuesFrom>
    <DataProperty IRI="#Slope-Value"/>
    <DatatypeRestriction>
      <Datatype abbreviatedIRI="xsd:double"/>
      <FacetRestriction facet="&xsd;maxExclusive">
        <Literal datatypeIRI="&xsd;double"< 25.0</Literal>
      </FacetRestriction>
    </DatatypeRestriction>
  </DataSomeValuesFrom>
</EquivalentClasses>
After modeling all relevant features in the ontology, the FaCT++ reasoner was used to allocate the buildings polygons to the defined buildings categories. The results are displayed on Figure 4.
The “Residential/Small Buildings” class yielded satisfactory classification results: precision (97.7%) and recall (98%), F-Measure: 97% (Table 3). Only 16 buildings from this class were confused with the other two classes. The highest overlap occurred with the apartment buildings, which have slope values higher than the average slope of this class: 30 degrees.
The “Apartment Buildings” class achieved a much lower accuracy: 50.6% recall, 74% precision and 60% F-Measure (Table 4). The overlap with the other two classes was caused by the presence of “Residential/Small Buildings” with slope values lower than the defined threshold (>40 degrees) and due to the overlap with four “Industrial and Factory Buildings” that are higher than the average height of this class: 6.3 m. The information about the buildings area could not be used to avoid the confusion with the industrial building, because of the buildings extraction errors: e.g., the adjacent apartment buildings were merged together into one larger building.
The “Industrial and Factory Buildings” class achieved the lowest value of F-Measure: 51% (Table 5). The high misclassification rate of this class is due to the large number of “Residential/Small Buildings” misclassified as industrial buildings. To avoid the confusion between these classes, additional information such as mean distance between buildings [52] and building density should be included in the class definitions [14,18]. While the OWL2 ontology language used in this work is well suited for inferring implicit taxonomic relationships between concepts, or between individuals and concepts, “it can make limited assertions about the relationships between two individuals” [65]. In the future work, we plan to use the Semantic Web Rule Language (SWRL) formalism to model the spatial relations following the approach described in this study [35].

4.4. Ontology Considerations

The ontology developed in this study has been elicited from the textual descriptions of the building types found in the literature and adapted to the ALS data. As proven in this study [66], the literature can be used as surrogate for developing ontologies of objects to be identified in the analyzed data. Participatory methods such as experts interviewing represent another solution to develop domain ontologies [67].
The buildings definitions specified in our ontology reflect the characteristics of the buildings in the considered urban landscape, i.e., Biberach an der Riss. As buildings characteristics manifest differently from one city to another [52], it is difficult to develop a generic ontology of building types. Therefore, different ontologies that account for building characteristics in different urban environments need to be developed and aligned to an upper-level ontology in order to enable domain knowledge integration. In the future work, the lightweight ontology developed in this study will be extended with additional classes and will be aligned to the SWEET ontology following the methodology described in this study [68].
Classification of huge numbers of individuals using complex class definitions can present a challenging task for the reasoners in terms of computational resources and time consumption. Li et al. [69] and Bock et al. [70] reported about the time critical behaviour of various reasoners. In our particular case, the performance of the reasoner was reasonable with about 180 s for about 800 individuals.
The ontology is foreseen to complement the existing algorithm dedicated to classification tasks and implemented in different software solutions. The added value of the ontology-based classification can be summarized as follows:
(i)
The logical consistency of the developed ontology can be automatically evaluated by the existing reasoner [19].
(ii)
Ontology represents a declarative knowledge model that can be subject to community scrutiny and can be easily extended or adapted to new application scenarios [20].
(iii)
Data provenance can be easily identified [43] as the class definitions are explicitly formulated into a machine and human understandable format. Therefore, the users can assess whether the generated thematic information fits the purpose of their application.
(iv)
The semantics of the evaluated categories is explicitly specified and therefore, it is possible to infer implicit knowledge by running a reasoner.
In this study, the buildings objects extracted from ALS data are allocated to the building categories using the FACT+++ reasoner. Since the processing time of reasoners increases with the numbers of modelled concepts and individuals [69,70], we plan to integrate the ontologies in other software environments, the remote sensing community is familiar with. We aim at developing an XML-based middleware tool that maps the ontology constructed in the OWL2 format to the class hierarchy formalism supported by the eCognition software program. The strength of this approach is the direct integration of ontologies into OBIA frameworks [71] in order to ease and to increase the transparency of the remotely sensed data classification.

5. Summary

This paper presents a methodological framework for classifying building types detected from ALS data using OBIA methods. The buildings were classified using a hybrid approach that accounts for both machine-learning techniques and the latest knowledge in engineering advances, i.e., ontology. The developed ontology modeled the domain knowledge about the evaluated buildings types, and mapped this knowledge to the quantitative information extracted from ALS data. The features (quantitative information extracted from ALS data) were selected by applying the RF classifier. The classification yielded convincing classification results for the “Residential/Small Buildings” class (F-Measure = 97.7%), whereas, the “Apartment Buildings” and “Industrial and Factory Buildings” class achieves less accurate results: F-Measure = 60% and 51%, respectively. To avoid the high overlap between the analyzed classes, additional information such as spatial relations needs to be included in the class definition. The reliability of the classification results were also influenced by the quality of the buildings boundaries delineated from ALS data. In the future work, we plan to improve the developed ALS data analysis procedure by applying the laser scanning intensity correction proposed by [48], and fine tuning the extraction algorithm to better separate dense vegetation from buildings. Despite the above-mentioned limitations, the presented methodology can be further extended and applied to the detection and classification of various building types in urban environments. The results of our work can be accessed from the web mapping application developed using the Esri ArcGIS Online cloud-based application: http://uia.maps.arcgis.com/apps/OnePane/basicviewer/index.html?appid=6345994404284c879e103fb07bc6a88c.

Acknowledgments

The presented work is framed within the Doctoral College GIScience (DK W 1237N23) and ABIA project (grant number P25449). The research of this work is funded by the Austrian Science Fund (FWF) and the Salzburg University of Applied Sciences. The authors are very thankful to the three reviewers those comments and feedback helped us to improve this paper.

Author Contributions

Mariana Belgiu proposed and developed the concept, created the research design, conducted the coordination of the research activities, performed the ontology development and formalization, Random Forest analysis, manuscript writing, results interpretation and coordinated the revision activities. Ivan Tomljenovic developed the LiDAR-based object extraction algorithm, performed the accuracy assessment of the extracted building polygons and contributed to the manuscript writing and revision. Thomas J. Lampoltshammer developed the JSON2OWL converter, contributed to the accuracy assessment and had minor contributions to the manuscript writing and revision. Thomas Blaschke contributed to the LiDAR-based object analysis and manuscript writing. Bernhard Höfle contributed to the LiDAR-based object extraction and analysis and manuscript revision.

Conflict of Interest

The authors declare no conflict of interest.

References

  1. Okada, S.; Takai, N. Classifications of Structural Types and Damage Patterns of Buildings for Earthquake Field Investigation. Proceedings of the 12th World Conference on Earthquake Engineering, Auckland, New Zealand, 30 January–4 February 2000.
  2. Heiple, S.; Sailor, D.J. Using building energy simulation and geospatial modeling techniques to determine high resolution building sector energy consumption profiles. Energy Build 2008, 40, 1426–1436. [Google Scholar]
  3. Cheng, L.; Gong, J.; Chen, X.; Han, P. Building boundary extraction from high resolution imagery and lidar data. Int. Archive. Photogramm. Remote Sens. Spatial Inf. Sci 2008, 37(Part B3), 693–698. [Google Scholar]
  4. Niemeyer, J.; Rottensteiner, F.; Soergel, U. Contextual classification of lidar data and building object detection in urban areas. ISPRS J. Photogramm. Remote Sens 2014, 87, 152–165. [Google Scholar]
  5. Rottensteiner, F.; Briese, C. A New Method for Building Extraction in Urban Areas from High-Resulution LIDAR Data. Proceedings of Commission IV Symposium “Geospatial Theory, Processing and Applications”, Ottawa, ON, Canada, 9–12 July 2001.
  6. Huang, H.; Brenner, C.; Sester, M. A generative statistical approach to automatic 3D building roof reconstruction from laser scanning data. ISPRS J. Photogramm. Remote Sens 2013, 79, 29–43. [Google Scholar]
  7. Awrangjeb, M.; Ravanbakhsh, M.; Fraser, C.S. Automatic detection of residential buildings using LIDAR data and multispectral imagery. ISPRS J. Photogramm. Remote Sens 2010, 65, 457–467. [Google Scholar]
  8. Hermosilla, T.; Ruiz, L.A.; Recio, J.A.; Estornell, J. Evaluation of automatic building detection approaches combining high resolution images and lidar data. Remote Sens 2011, 3, 1188–1210. [Google Scholar]
  9. Chen, Y.; Su, W.; Li, J.; Sun, Z. Hierarchical object oriented classification using very high resolution imagery and LIDAR data over urban areas. Advanc. Space Res 2009, 43, 1101–1110. [Google Scholar]
  10. Wurm, M.; Taubenböck, H.; Roth, A.; Dech, S. Urban Structuring Using Multisensoral Remote Sensing Data: By the Example of the German Cities Cologne and Dresden. Proceedings of Urban Remote Sensing Event, Shanghai, China, 20–22 May 2009.
  11. Barnsley, M.J.; Barr, S.L. Distinguishing urban land-use categories in fine spatial resolution land-cover data using a graph-based, structural pattern recognition system. Comput. Environ. Urban Syst 1997, 21, 209–225. [Google Scholar]
  12. Herold, M.; Scepan, J.; Müller, A.; Günther, S. Object-Oriented Mapping and Analysis of Urban Land Use/Cover Using IKONOS Data. Proceedings of 22nd EARSeL Symposium Geoinformation for European-Wide Integration, Prague, Czech Republic, 4–6, June 2002.
  13. De Almeida, J.P.; Morley, J.G.; Dowman, I.J. A graph-based algorithm to define urban topology from unstructured geospatial data. Int. J. Geogr. Inf. Sci 2013, 27, 1514–1529. [Google Scholar]
  14. Gonzalez-Aguilera, D.; Crespo-Matellan, E.; Hernandez-Lopez, D.; Rodriguez-Gonzalvez, P. Automated urban analysis based on LiDAR-derived building models. IEEE Trans. Geosci. Remote Sens 2013, 51, 1844–1851. [Google Scholar]
  15. Forestier, G.; Puissant, A.; Wemmert, C.; Gançarski, P. Knowledge-based region labeling for remote sensing image interpretation. Comput. Environ. Urban Syst 2012, 36, 470–480. [Google Scholar]
  16. Guan, H.; Li, J.; Chapman, M.; Deng, F.; Ji, Z.; Yang, X. Integration of orthoimagery and lidar data for object-based urban thematic mapping using random forests. Int. J. Remote Sens 2013, 34, 5166–5186. [Google Scholar]
  17. Smeulders, W.M.A.; Worring, M.; Santini, S.; Gupta, A.; Jain, R. Content-based image retrieval at the end of the early years. IEEE Trans. Pattern Anal. Mach. Intell 2000, 22, 1349–1380. [Google Scholar]
  18. Steiniger, S.; Lange, T.; Burghardt, D.; Weibel, R. An approach for the classification of urban building structures based on discriminant analysis techniques. Trans. GIS 2008, 12, 31–59. [Google Scholar]
  19. Arvor, D.; Durieux, L.; Andrés, S.; Laporte, M.-A. Advances in geographic object-based image analysis with ontologies: A review of main contributions and limitations from a remote sensing perspective. ISPRS J. Photogramm. Remote Sens 2013, 82, 125–137. [Google Scholar]
  20. Lüscher, P.; Weibel, R.; Burghardt, D. Integrating ontological modelling and Bayesian inference for pattern classification in topographic vector data. Comput. Environ. Urban Syst 2009, 33, 363–374. [Google Scholar] [Green Version]
  21. Gruber, T.R. A translation approach to portable ontology specifications. J. Knowl. Acquis. Knowl.-Based Syst 1993, 5, 199–220. [Google Scholar]
  22. Wang, Z.; Schenk, T. Extracting Buildings Information from LiDAR Data. Proceedings of ISPRS Commission III Symposium on Object Recognition and Scene Classification from Multispectral and Multisensor Pixels, Columbus, OH, USA, 6–10 July 1998; pp. 279–284.
  23. Alharthy, A.; Bethel, J. Heuristic Filtering and 3D Feature Extraction from LiDAR Data. Proceedings of Computer Society Conference on Computer Vision and Pattern Recognition, Kauai, HI, USA, 8–14 December 2001.
  24. Elaksher, A.F.; Bethel, J.S. Building Extraction Using LiDAR Data. Proceedings of ASPRS-ACSM Annual Conference and FIG XXII Congress, Wachington, DC, USA, 22–26 May 2002.
  25. Bimal, R.K.; Kumar, S.R. An algorithm for polygonal approximation of digitized curves. Pattern Recognit. Lett 1992, 13, 489–496. [Google Scholar]
  26. Hofmann, A.; Maas, H.G.; Streilein, A. Knowledge-based building detection based on laser scanner data and topographic map information. Int. Archives Photogramm. Remote Sens 2002, 34, 169–174. [Google Scholar]
  27. Cho, W.; Jwa, Y.-S.; Chang, H.-J.; Lee, S.-H. Pseudo-Grid Based Building Extraction Using Airborne LIDAR Data. Proceedings of ISPRS Congress Istanbul 2004, Istanbul, Turkey, 12–23 July 2004; pp. 3–6.
  28. Miliaresis, G.; Kokkas, N. Segmentation and object-based classification for the extraction of the building class from LIDAR DEMs. Comput. Geosci 2007, 33, 1076–1087. [Google Scholar]
  29. Evans, I. An integrated system for terrain analysis and slope mapping. Zeitschrift fuer Geomorphologie 1980, 36, 274–290. [Google Scholar]
  30. Jochem, A.; Hoefle, B.; Wichmann, V.; Rutzinger, M.; Zipf, A. Area-wide roof plane segmentation in airborne LiDAR point clouds. Comput. Environ. Urban Syst 2012, 36, 54–64. [Google Scholar]
  31. Wurm, M.; Taubenböck, H.; Schardt, M.; Esch, T.; Dech, S. Object-based image information fusion using multisensor earth observation data over urban areas. Int. J. Imag. Data Fus 2011, 2, 121–147. [Google Scholar]
  32. Agarwal, P. Ontological considerations in GIScience. Int. J. Geogr. Inf. Sci 2005, 19, 501–536. [Google Scholar]
  33. Lutz, M.; Klien, E. Ontology-based retrieval of geographic information. Int. J. Geogr. Inf. Sci 2006, 20, 233–260. [Google Scholar]
  34. Lüscher, P.; Weibel, R.; Burghardt, D. Alternative Options of Using Processing Knowledge to Populate Ontologies for the Recognition of Urban Concepts. Proceedings of 11th ICA Workshop on Generalisation and Multiple Representation, Montpellier, France, 20–21 June 2008.
  35. De Bertrand de Beuvron, F.; Marc-Zwecker, S.; Puissant, A.; Zanni-Merk, C. From expert knowledge to formal ontologies for semantic interpretation of the urban environment from satellite images. Int. J. Knowl.-Based Intell. Eng. Syst 2013, 17, 55–65. [Google Scholar]
  36. Thonnat, M. Knowledge-based techniques for image processing and image understanding. J. de Physique EDP Sci 2002, 4, 189–235. [Google Scholar]
  37. Hudelot, C.; Thonnat, M. A Cognitive Vision Platform for Automatic Recognition of Natural Complex Objects. Proceedings of the 15th IEEE International Conference on Tools with Artificial Intelligence ICTAI ’03, Sacramento, CA, USA, 3–5 November 2003.
  38. Liu, Y.; Zhang, D.; Lu, G.; Ma, W.-Y. A survey of content-based image retrieval with high-level semantics. Pattern Recognit 2007, 40, 262–282. [Google Scholar]
  39. Guarino, N. Formal Ontology and Information Systems. Proceedings of International Conference on Formal Ontology in Information Systems (FOIS1998), Trento, Italy, 6–8 June 1998; pp. 3–15.
  40. Masolo, C.; Borgo, S.; Gangemi, A.; Guarino, N.; Oltramari, A.; Oltramari, R.; Schneider, L.; Istc-cnr, L.P.; Horrocks, I. The WonderWeb Library of Foundational Ontologies and the DOLCE Ontology; WonderWeb Deliverable D17, Final Report; ISTC-CNR: Trento, Italy, 2002. [Google Scholar]
  41. Raskin, R. Guide to SWEET Ontologies; NASA/Jet Propulsion Lab: Pasadena, CA, USA. Available online: http://sweet.jpl.nasa.gov/guide.doc (accessed on 30 January 2014).
  42. Mark, D.M.; Smith, B.; Egenhofer, M.; Hirtle, S. Ontological Foundations for Geographic Information Science. In A Research Agenda for Geographic Information Science; McMaster, R.B., Usery, E.L., Eds.; CRC Press: Boca Raton, FL, USA, 2005. [Google Scholar]
  43. Janowicz, K. Observation-driven geo-ontology engineering. Trans. GIS 2012, 16, 351–374. [Google Scholar]
  44. Motik, B.; Patel-Schneider, P.F.; Parsia, B.; Bock, C.; Fokoue, A.; Haase, P.; Hoekstra, R.; Horrocks, I.; Ruttenberg, A.; Sattler, U. Owl 2 web ontology language: Structural specification and functional-style syntax. W3C Recomm 2009, 27, 1–133. [Google Scholar]
  45. Trimble. eCognition Developer; Version 8.7.2; Trimble: Munich, Germany, 2012. [Google Scholar]
  46. Rutzinger, M.; Rottensteiner, F.; Pfeifer, N. A comparison of evaluation techniques for building extraction from airborne laser scanning. IEEE J. Sel. Top. Appl. Earth Obs. Remote Sen 2009, 2, 11–20. [Google Scholar]
  47. Zevenbergen, L.W.; Thorne, C.R. Quantitative analysis of land surface topography. Earth Surf. Process. Landf 1987, 12, 47–56. [Google Scholar]
  48. Höfle, B.; Pfeifer, N. Correction of laser scanning intensity data: Data and model-driven approaches. ISPRS J. Photogramm. Remote Sens 2007, 62, 415–433. [Google Scholar]
  49. Höfle, B.; Hollaus, M.; Hagenauer, J. Urban vegetation detection using radiometrically calibrated small-footprint full-waveform airborne LiDAR data. ISPRS J. Photogramm. Remote Sens 2012, 67, 134–147. [Google Scholar]
  50. Taubenböck, H.; Klotz, M.; Wurm, M.; Schmieder, J.; Wagner, B.; Wooster, M.; Esch, T.; Dech, S. Delineation of central business districts in Mega city regions using remotely sensed data. Remote Sens. Environ 2013, 136, 386–401. [Google Scholar]
  51. Walde, I.; Hese, S.; Schmullius, C. Graph Based Mapping of Urban Structure Types from High Resolution Satellite Image Objects. Proceedings of 4th International conference on Geographic Object-Based Image Analysis, Rio de Janeiro, Brazil, 7–9 May 2012.
  52. Walde, I.; Hese, S.; Berger, C.; Schmullius, C. Graph-based mapping of urban structure types from high-resolution satellite image objects: Case study of the German cities Rostock and Erfurt. IEEE Geosci. Remote Sens. Lett 2013, 10, 932–936. [Google Scholar]
  53. Hudelot, C.; Atif, J.; Bloch, I. Fuzzy spatial relation ontology for image interpretation. Fuzzy Set. Syst 2008, 159, 1929–1951. [Google Scholar]
  54. Kursa, M.B.; Rudnicki, W.R. Feature selection with the Boruta Package. J. Stat. Softw 2010, 36, 1–13. [Google Scholar]
  55. Breiman, L. Random forest. Mach. Learn 2001, 45, 5–32. [Google Scholar]
  56. Stumpf, A.; Kerle, N. Object-oriented mapping of landslides using Random Forests. Remote Sens. Environ 2011, 115, 2564–2577. [Google Scholar]
  57. Corcoran, J.; Knight, J.; Gallant, A. Influence of multi-source and multi-temporal remotely sensed and ancillary data on the accuracy of random forest classification of wetlands in Northern Minnesota. Remote Sens 2013, 5, 3212–3238. [Google Scholar]
  58. Immitzer, M.; Atzberger, C.; Koukal, T. Tree species classification with random forest using very high spatial resolution 8-Band WorldView-2 Satellite data. Remote Sens 2012, 4, 2661–2693. [Google Scholar]
  59. Touw, W.G.; Bayjanov, J.R.; Overmars, L.; Backus, L.; Boekhorst, J.; Wels, M.; van Hijum, S.A. Data mining in the life sciences with random forest: A walk in the park or lost in the jungle? Brief. Bioinforma 2013, 14, 315–326. [Google Scholar]
  60. Rodriguez-Galiano, V.F.; Ghimire, B.; Rogan, J.; Chica-Olmo, M.; Rigol-Sanchez, J.P. An assessment of the effectiveness of a random forest classifier for land-cover classification. ISPRS J. Photogramm. Remote Sens 2012, 67, 93–104. [Google Scholar]
  61. Stadtsplanungsamt, Biberach der der Riss. Stadt Biberach. Available online: http://31.25.153.41/mapguide/mapviewerajax/?WEBLAYOUT=Library://web/Stadtplan.WebLayout&LOCALE=de&USERNAME=Anonymous&Password= (accessed on 30 January 2014).
  62. Team, D.C. R: A Language and Environment for Statistical Computing; R Foundation for Statistical Computing: Vienna, Austria, 2013. [Google Scholar]
  63. Tsarkov, D.; Horrocks, I. FaCT++ description logic reasoner: System description. Automated Reason 2006, 4130, 292–297. [Google Scholar]
  64. Van Rijsbergen, C. Information Retrieval; Butterworth-Heinemann: London, UK, 1979. [Google Scholar]
  65. Lutz, M.; Kolas, D. Rule-based discovery in spatial data infrastructure. Trans. GIS 2007, 11, 317–336. [Google Scholar]
  66. Belgiu, M.; Drǎguţ, L.; Strobl, J. Quantitative evaluation of variations in rule-based classifications of land cover in urban neighbourhoods using WorldView-2 imagery. ISPRS J. Photogramm. Remote Sens 2014, 87, 205–215. [Google Scholar]
  67. Kohli, D.; Sliuzas, R.; Kerle, N.; Stein, A. An ontology of slums for image-based classification. Comput. Environ. Urban Syst 2012, 36, 154–163. [Google Scholar]
  68. Tripathi, A.; Babaie, H.A. Developing a modular hydrogeology ontology by extending the SWEET upper-level ontologies. Comput. Geosci 2008, 34, 1022–1033. [Google Scholar]
  69. Li, Y.; Yu, Y.; Heflin, J. Evaluating Reasoners under Realistic Semantic Web Conditions. Proceedings of the 2012 OWL Reasoner Evaluation Workshop, Ulm, Germany, 22 July 2012.
  70. Bock, J.; Haase, P.; Ji, Q.; Volz, R. Benchmarking OWL Reasoners. Proceedings of the ARea2008 Workshop, Tenerife, Spain, 2 June 2008.
  71. Blaschke, T. Object based image analysis for remote sensing. ISPRS J. Photogramm. Remote Sens 2010, 62, 2–16. [Google Scholar]
Figure 1. Overview of the methodology followed in this study.
Remotesensing 06 01347f1
Figure 2. Excerpt of the buildings types hierarchy. The evaluated building classes are defined as subclasses of Urban-Features; The Properties of the buildings are related using the AND and OR operator (intersection and union of the selected properties).
Remotesensing 06 01347f2
Figure 3. The Variable Importance (VI) by Mean Decrease Accuracy (MDA) and Mean Decrease Gini (MDG) measures.
Remotesensing 06 01347f3
Figure 4. The results of the classification performed using ontology and Random Forest (RF) classifier. The buildings were extracted from ALS data.
Remotesensing 06 01347f4
Table 1. Buildings characteristics computed from Airborne Laser Scanner (ALS) data.
VariablesVariablesFeature Value RangeExplanations Provided by [45]
ExtentArea[0, scene size]The area of the identified object

Shape FeaturesRadius 1[0, ∞]Similarity of an object to an ellipse (totally enclosing the image object)
Radius 2[0, ∞]Similarity of an object to an ellipse (totally enclosed by the image object)
Rectangular Fit[0, 1]Objects squareness
Elliptic Fit[0, 1]Explains how well an object fits an ellipse
Asymmetry[0, 1]Relative length of an object compared to a regular polygon
Border Index *[1, ∞]Describes how jagged an object is; the more jagged, the higher its border index
Main Direction[0, 180]Defined as the direction of the eigenvector belonging to the larger of the two eigenvalues
Shape Index[1, ∞]Describes the smoothness of buildings boundaries the smoother the border of an image object, the lower its shape index
Compactness[0, ∞]The more compact, the smaller its border appears. Similar to Border Index, but it is based on area
Roundness[0, ∞]How similar an image is to an ellipse by the difference of enclosing and the enclosed ellipse
Density[0, depending on the shape of image object]The most dense shape is a square

HeightMean Height2–25 mCalculated from nDSM

SlopeSlope[0, 80°]Calculated from nDSM
*Border Index is similar to the Shape Index feature, but it uses a rectangular approximation instead of a square.
Table 2. The natural language description of the analyzed buildings classes, based on [51] and [52].
Buildings ClassNatural Language Description
Residential/Small BuildingsHigh building density, small, rectangular building form (simple form)
Apartments/Block BuildingsRectangular or elongated form, higher than industrial and factory buildings
Industrial and Factory BuildingsLow density building areas, larger dimensions, complex and compact building form, diverse main directions
Table 3. Classification results yielded for “Residential/Small Buildings” class.
Residential/Small BuildingsRelevantNot Relevant
Retrieved55116
Not Retrieved9109
Recall (%)98.3
Precision (%)97.1
F-Measure (%)97.7
Total687
Table 4. Classification results yielded for “Apartment Buildings” class.
Apartment BuildingsRelevantNot Relevant
Retrieved3713
Not Retrieved36711
Recall (%)50.6
Precision (%)74.0
F-Measure (%)60.1
Total73
Table 5. Classification results yielded for “Industrial and Factory Buildings” class.
Industrial and Factory BuildingsRelevantNot Relevant
Retrieved2247
Not Retrieved5723
Recall (%)81.4
Precision (%)37.2
F-Measure (%)51.1
Total27

