4.1. Results of the Training Data Set—Development of the Feature Extraction Procedure—Area Based Accuracy Assessment
The methodology described in
Section 3 was developed using the TerraSAR-X dual-pol High Resolution SpotLight imagery acquired on 5 September 2010. After that the best suited parameters for the oil well pad extraction at this scene were applied to extract the oil well pads at the second acquisition (19 October 2010), enabling a fully automated feature extraction (see
Section 4.2).
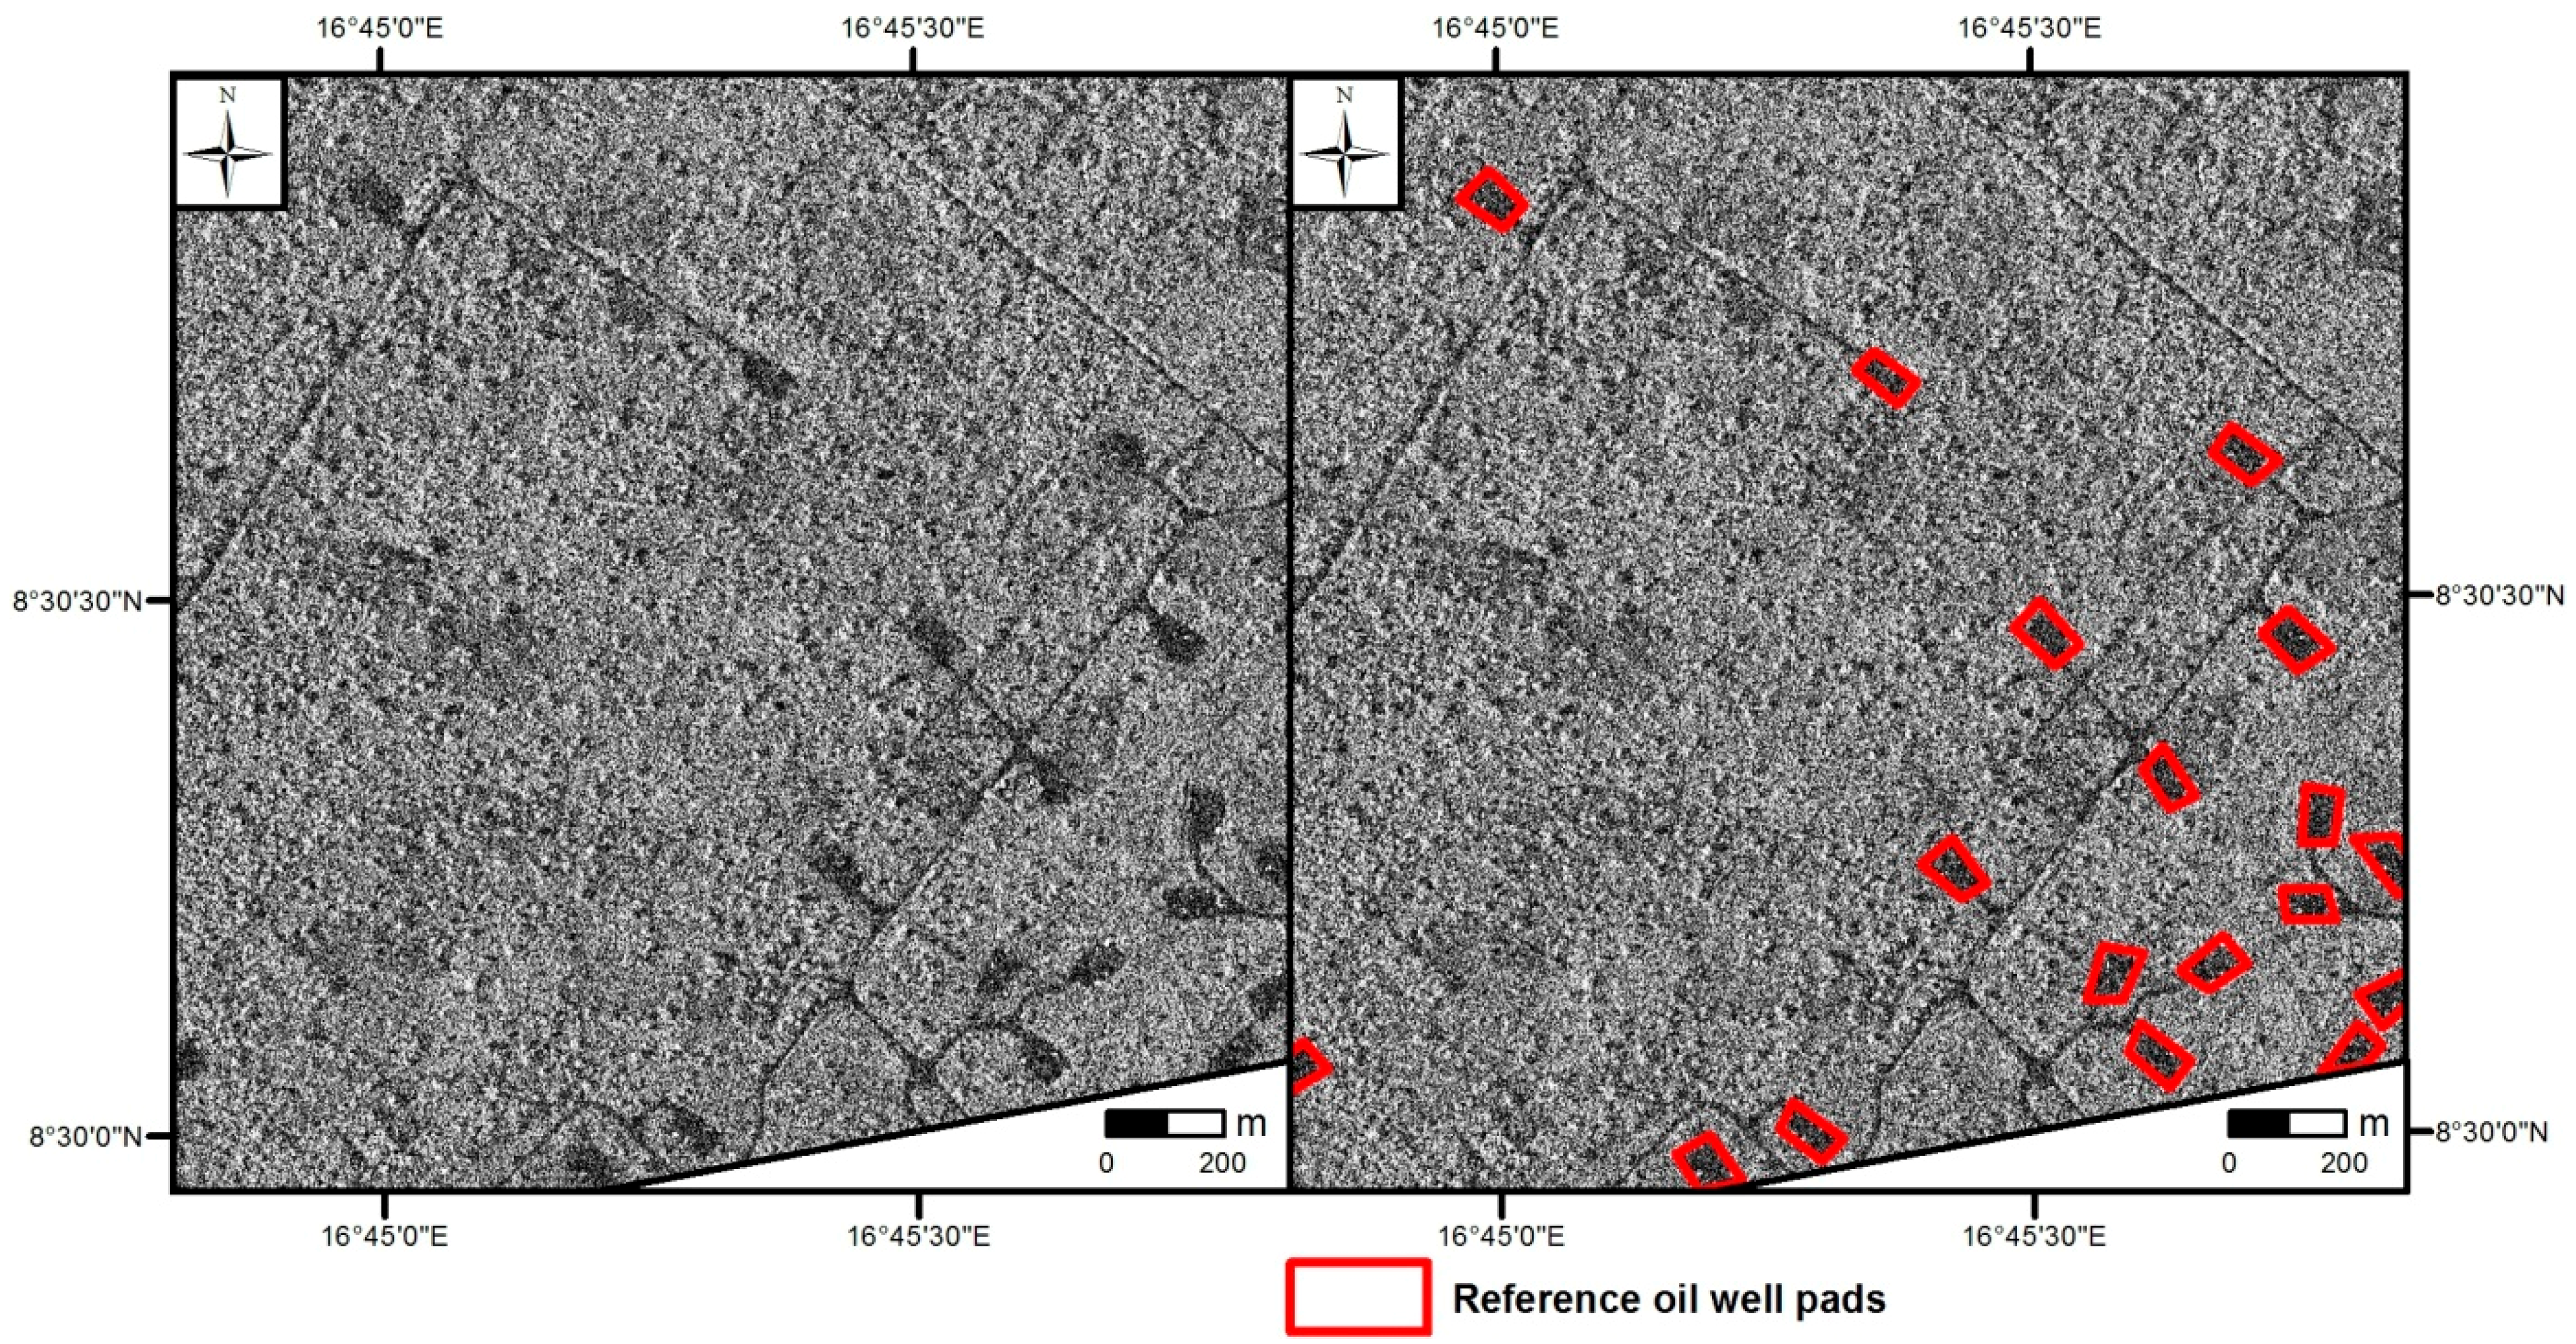
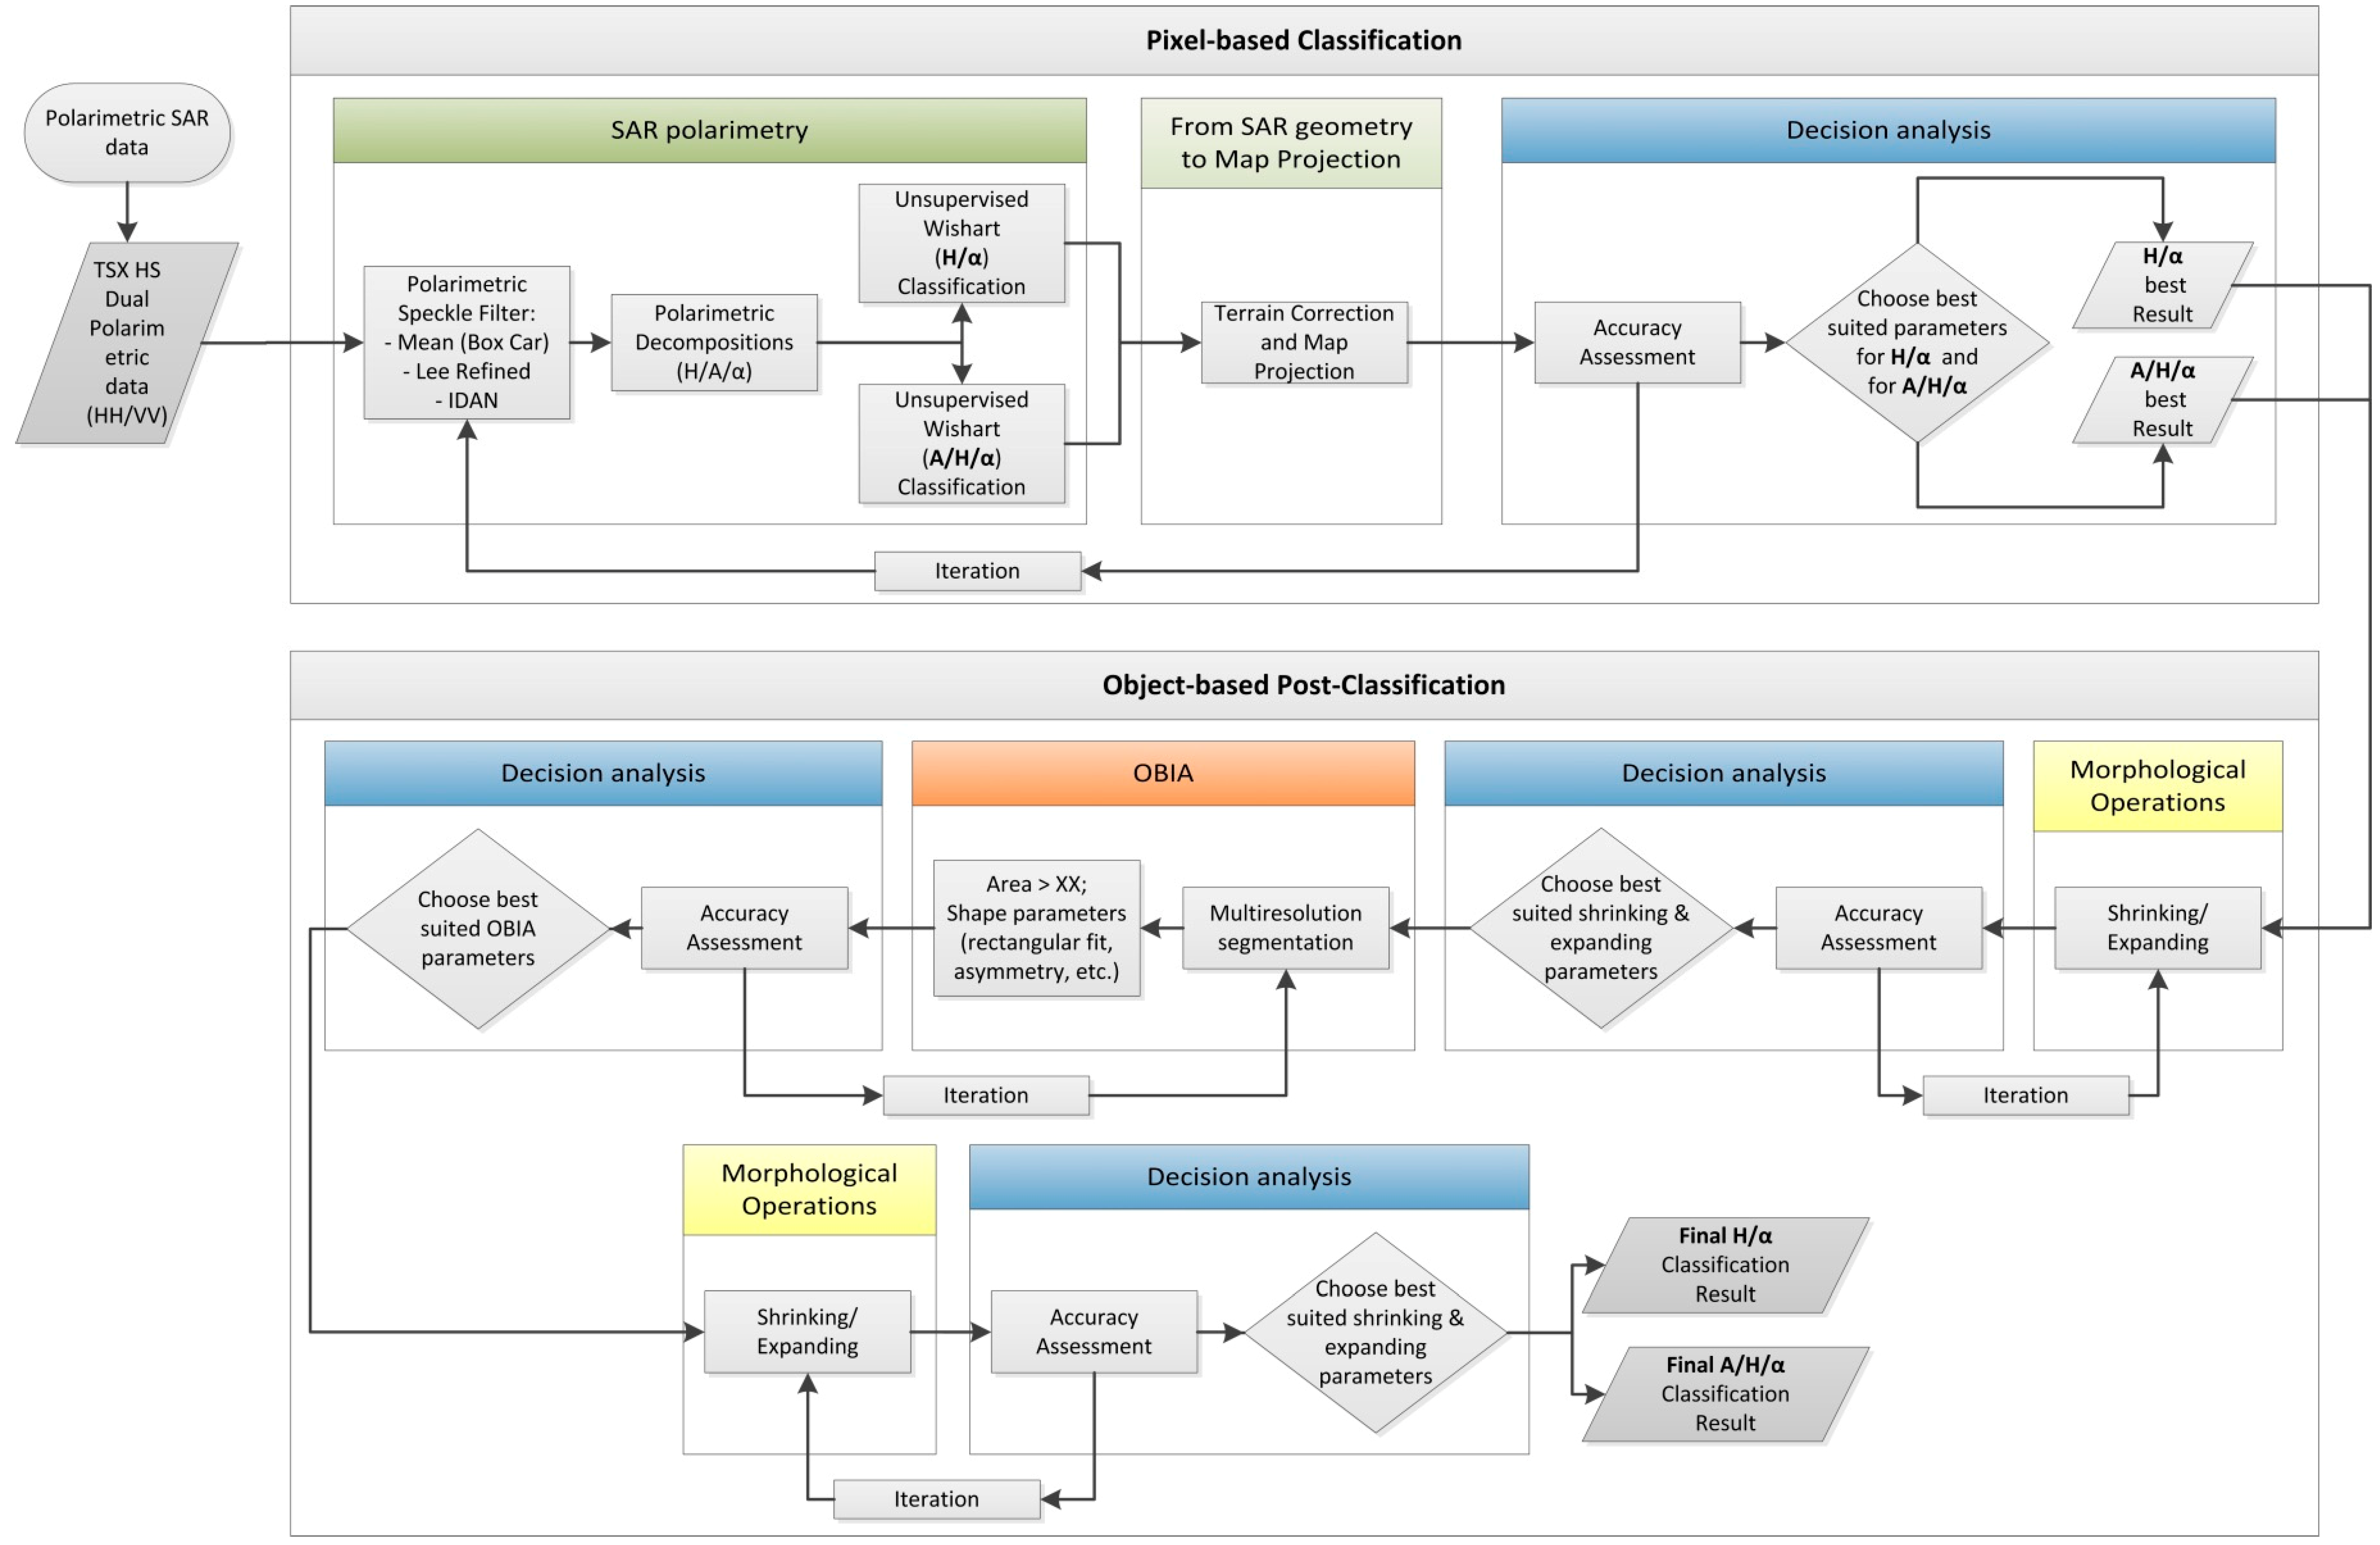
Figure 5 shows for a subset of the study area the result of the first step—the pixel-based PolSAR Wishart classification (based on H/α). When visually comparing the classification with the reference data (manually digitized polygons), one can recognize that all oil well pads are detected. However, there is also a strong overestimation, as also roads and tracks and other smaller areas free of vegetation (bare land) are classified as the same class as the oil well pads. This is confirmed by the high producer’s accuracy (=high detection rate) of 82.25% or 69.56% for H/α or A/H/α, respectively. The strong overestimation is reflected by the relatively low user’s accuracy of 6.29% or 7.02% for H/α or A/H/α, respectively. The mentioned values for the producer’s and user’s accuracies are valid for the best suited parameters (IDAN 50,
M = 9; described in detail below).
Figure 5.
Subset of the study area. Left: Original TerraSAR-X acquisition (5 September 2010). Right: Best result of the pixel-based Wishart classification. This first classification step is based on H/α (with
M = 9) using the IDAN filter (with 50 pixel max. region growing). Visual comparison with the reference data shows a high detection rate of the oil well pads, but also a strong overestimation (e.g., roads and tracks and other areas of bare land are classified as the same class (class 1, red) as the oil well pads). Visual comparison with optical imagery enables an assignment of the classes to different types of land cover and backscattering mechanisms (
cf. also
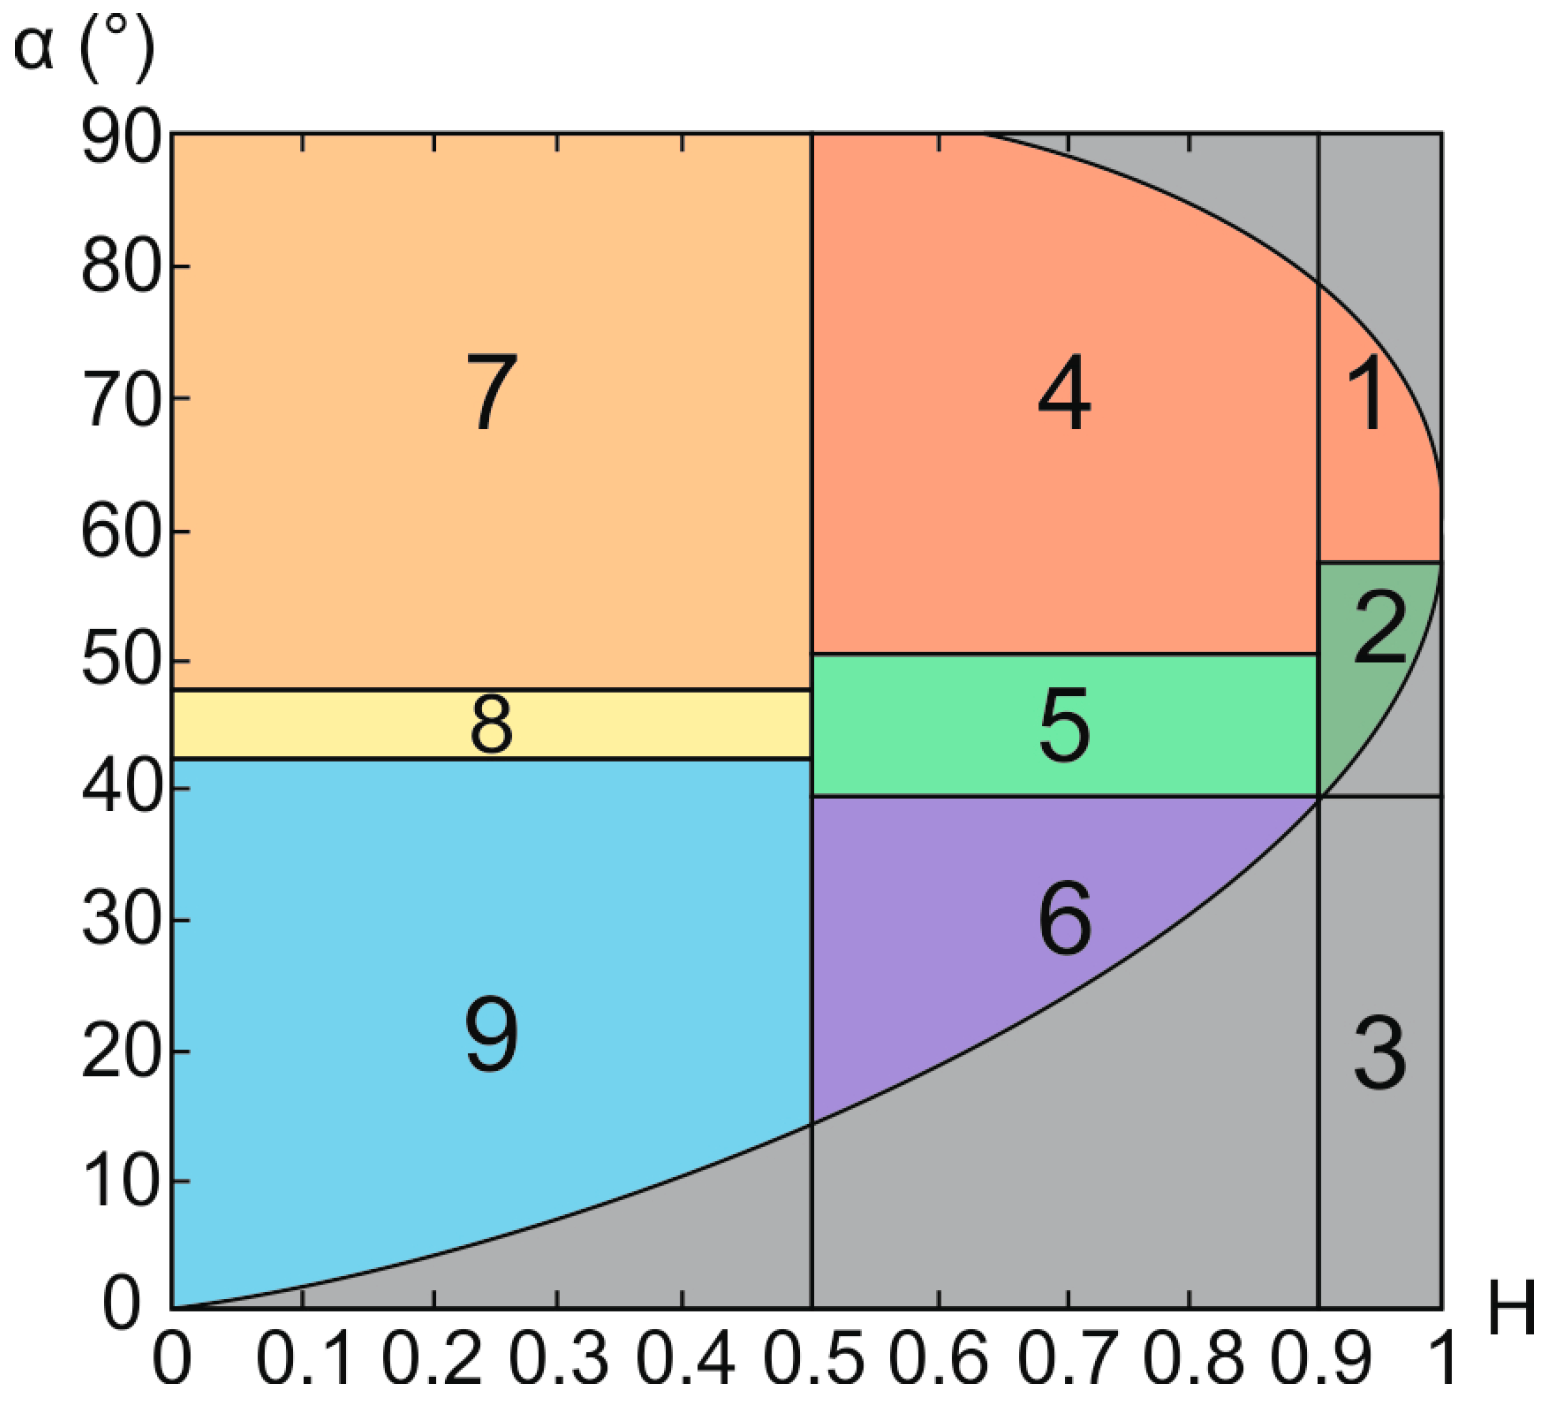
Section 3.1.3): The classes 2, 8, 6 and 7 represent different kinds of double bouncing (segment 4 in
Figure 4) caused by urban construction (2 and 8) or forest (6 and 7), respectively. This doubled assignment of the classes (2 and 8 or 6 and 7, respectively) can be explained by different power of backscattering. The classes 3, 4 and 5 represent areas of rougher surfaces with lower vegetation (segment 6 in
Figure 4), vegetated areas (segment 5) and forest (segment 2), respectively. TerraSAR-X © 2014 German Aerospace Center (DLR), 2014 Airbus Defence and Space/Infoterra GmbH.
Figure 5.
Subset of the study area. Left: Original TerraSAR-X acquisition (5 September 2010). Right: Best result of the pixel-based Wishart classification. This first classification step is based on H/α (with
M = 9) using the IDAN filter (with 50 pixel max. region growing). Visual comparison with the reference data shows a high detection rate of the oil well pads, but also a strong overestimation (e.g., roads and tracks and other areas of bare land are classified as the same class (class 1, red) as the oil well pads). Visual comparison with optical imagery enables an assignment of the classes to different types of land cover and backscattering mechanisms (
cf. also
Section 3.1.3): The classes 2, 8, 6 and 7 represent different kinds of double bouncing (segment 4 in
Figure 4) caused by urban construction (2 and 8) or forest (6 and 7), respectively. This doubled assignment of the classes (2 and 8 or 6 and 7, respectively) can be explained by different power of backscattering. The classes 3, 4 and 5 represent areas of rougher surfaces with lower vegetation (segment 6 in
Figure 4), vegetated areas (segment 5) and forest (segment 2), respectively. TerraSAR-X © 2014 German Aerospace Center (DLR), 2014 Airbus Defence and Space/Infoterra GmbH.
![Remotesensing 06 11977 g005]()
The validation or accuracy assessment (of
Section 4.1 and
Section 4.2) was applied to the entire AoI and is based on the comparison of the area of the oil well pads classified by the described methodology with the area of the reference data. This type of accuracy assessment is much more accurate than an accuracy assessment based on only counting the numbers of correctly and falsely detected oil well pads (
cf. Section 4.3).
For all tested combinations of different speckle filters (box car, refined Lee, IDAN) and different values for
N and
M (
cf. Section 3.1.4), there is a relatively high overall accuracy ranging between 69% and 97%. Moreover, the user’s and producer’s accuracies for the class “non oil well pads” (
i.e., the remaining land cover classes outside the oil well pads) are very high for all the tested combinations (ranging between 90%–99% or 68%–92%, respectively). This effect can be explained by the domination of the class “non oil well pads” regarding the percentage area of the entire study area. Consequently, to analyze the accuracy of the presented feature extraction method, we focus on the user’s and producer’s accuracy of the class oil well pads.
As described in
Section 3.1.4 in an iterative process the best suited combination for the pixel-based PolSAR classification was derived.
The
Figure 6 and
Figure 7 show the user’s accuracy values for the box car filter (with 3 ≤
N ≤ 19 and 3 ≤
M ≤ 9), the refined Lee filter (with 7 ≤
N ≤ 11 and 1 ≤
M ≤ 9) and the IDAN filter (with a maximum region growing of 50 pixels and 1 ≤
M ≤ 9). With
M describing the pixel size of the additional filtering of the Wishart classification.
Figure 6.
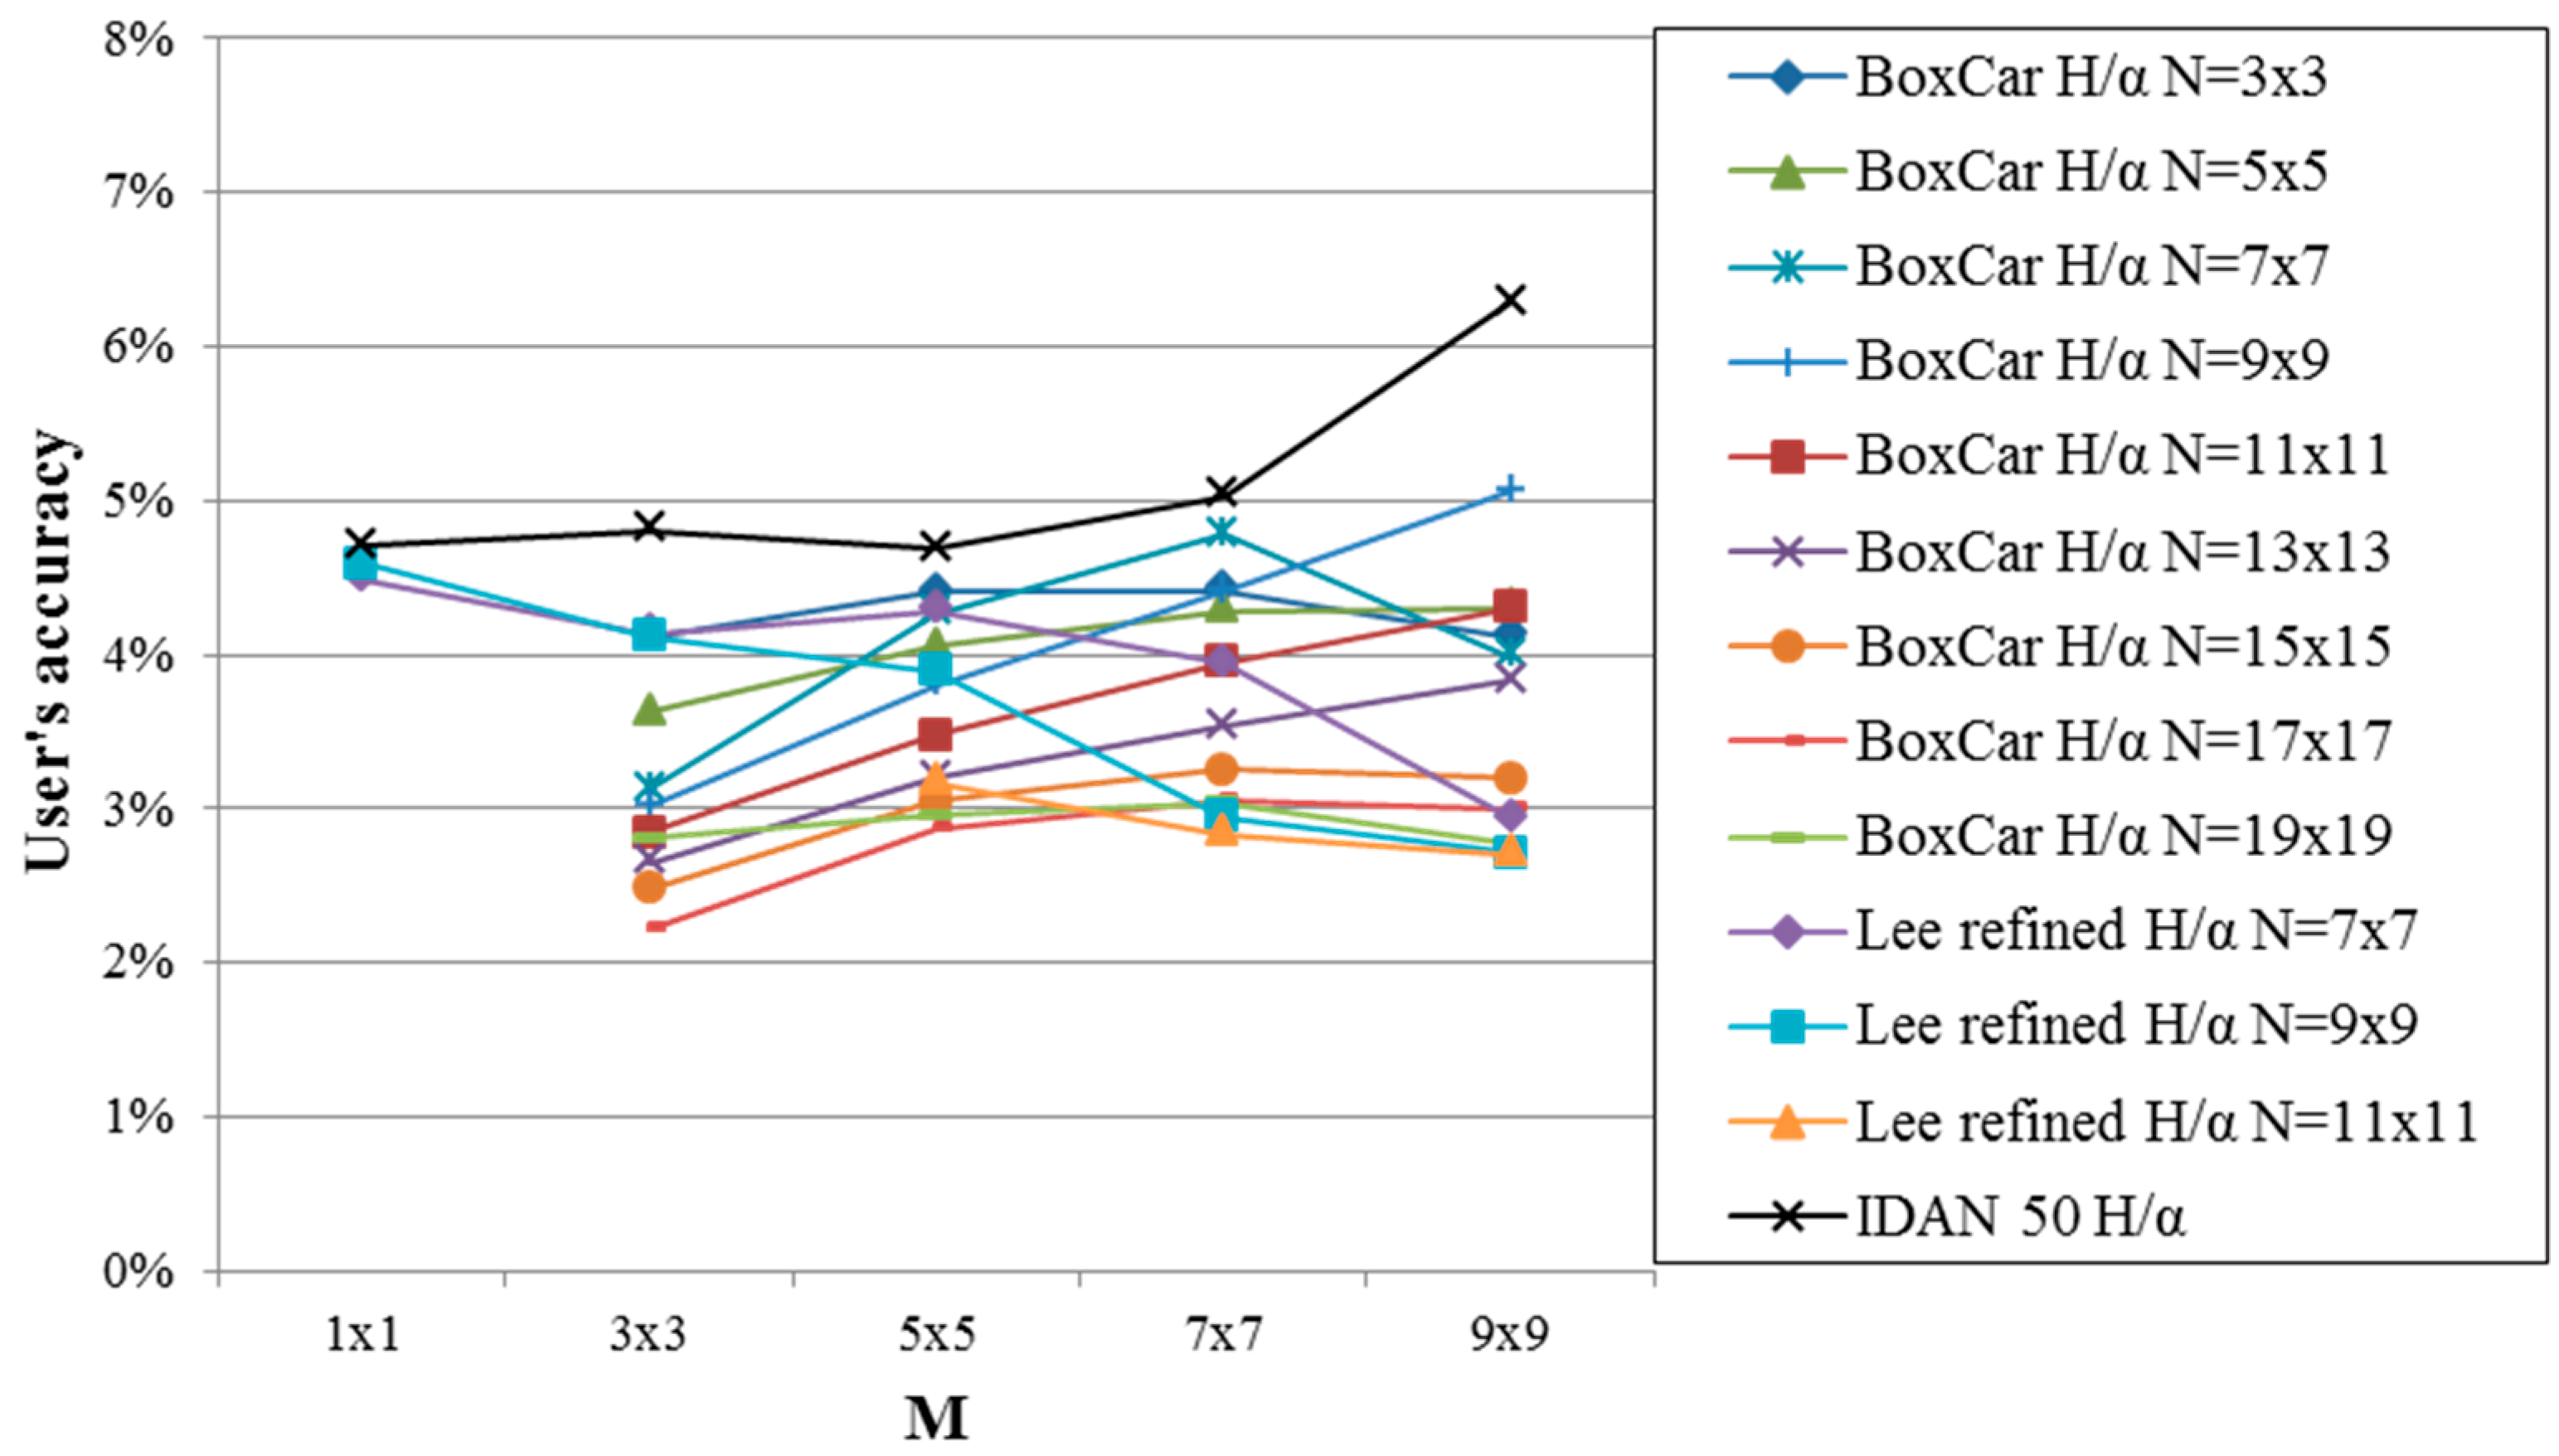
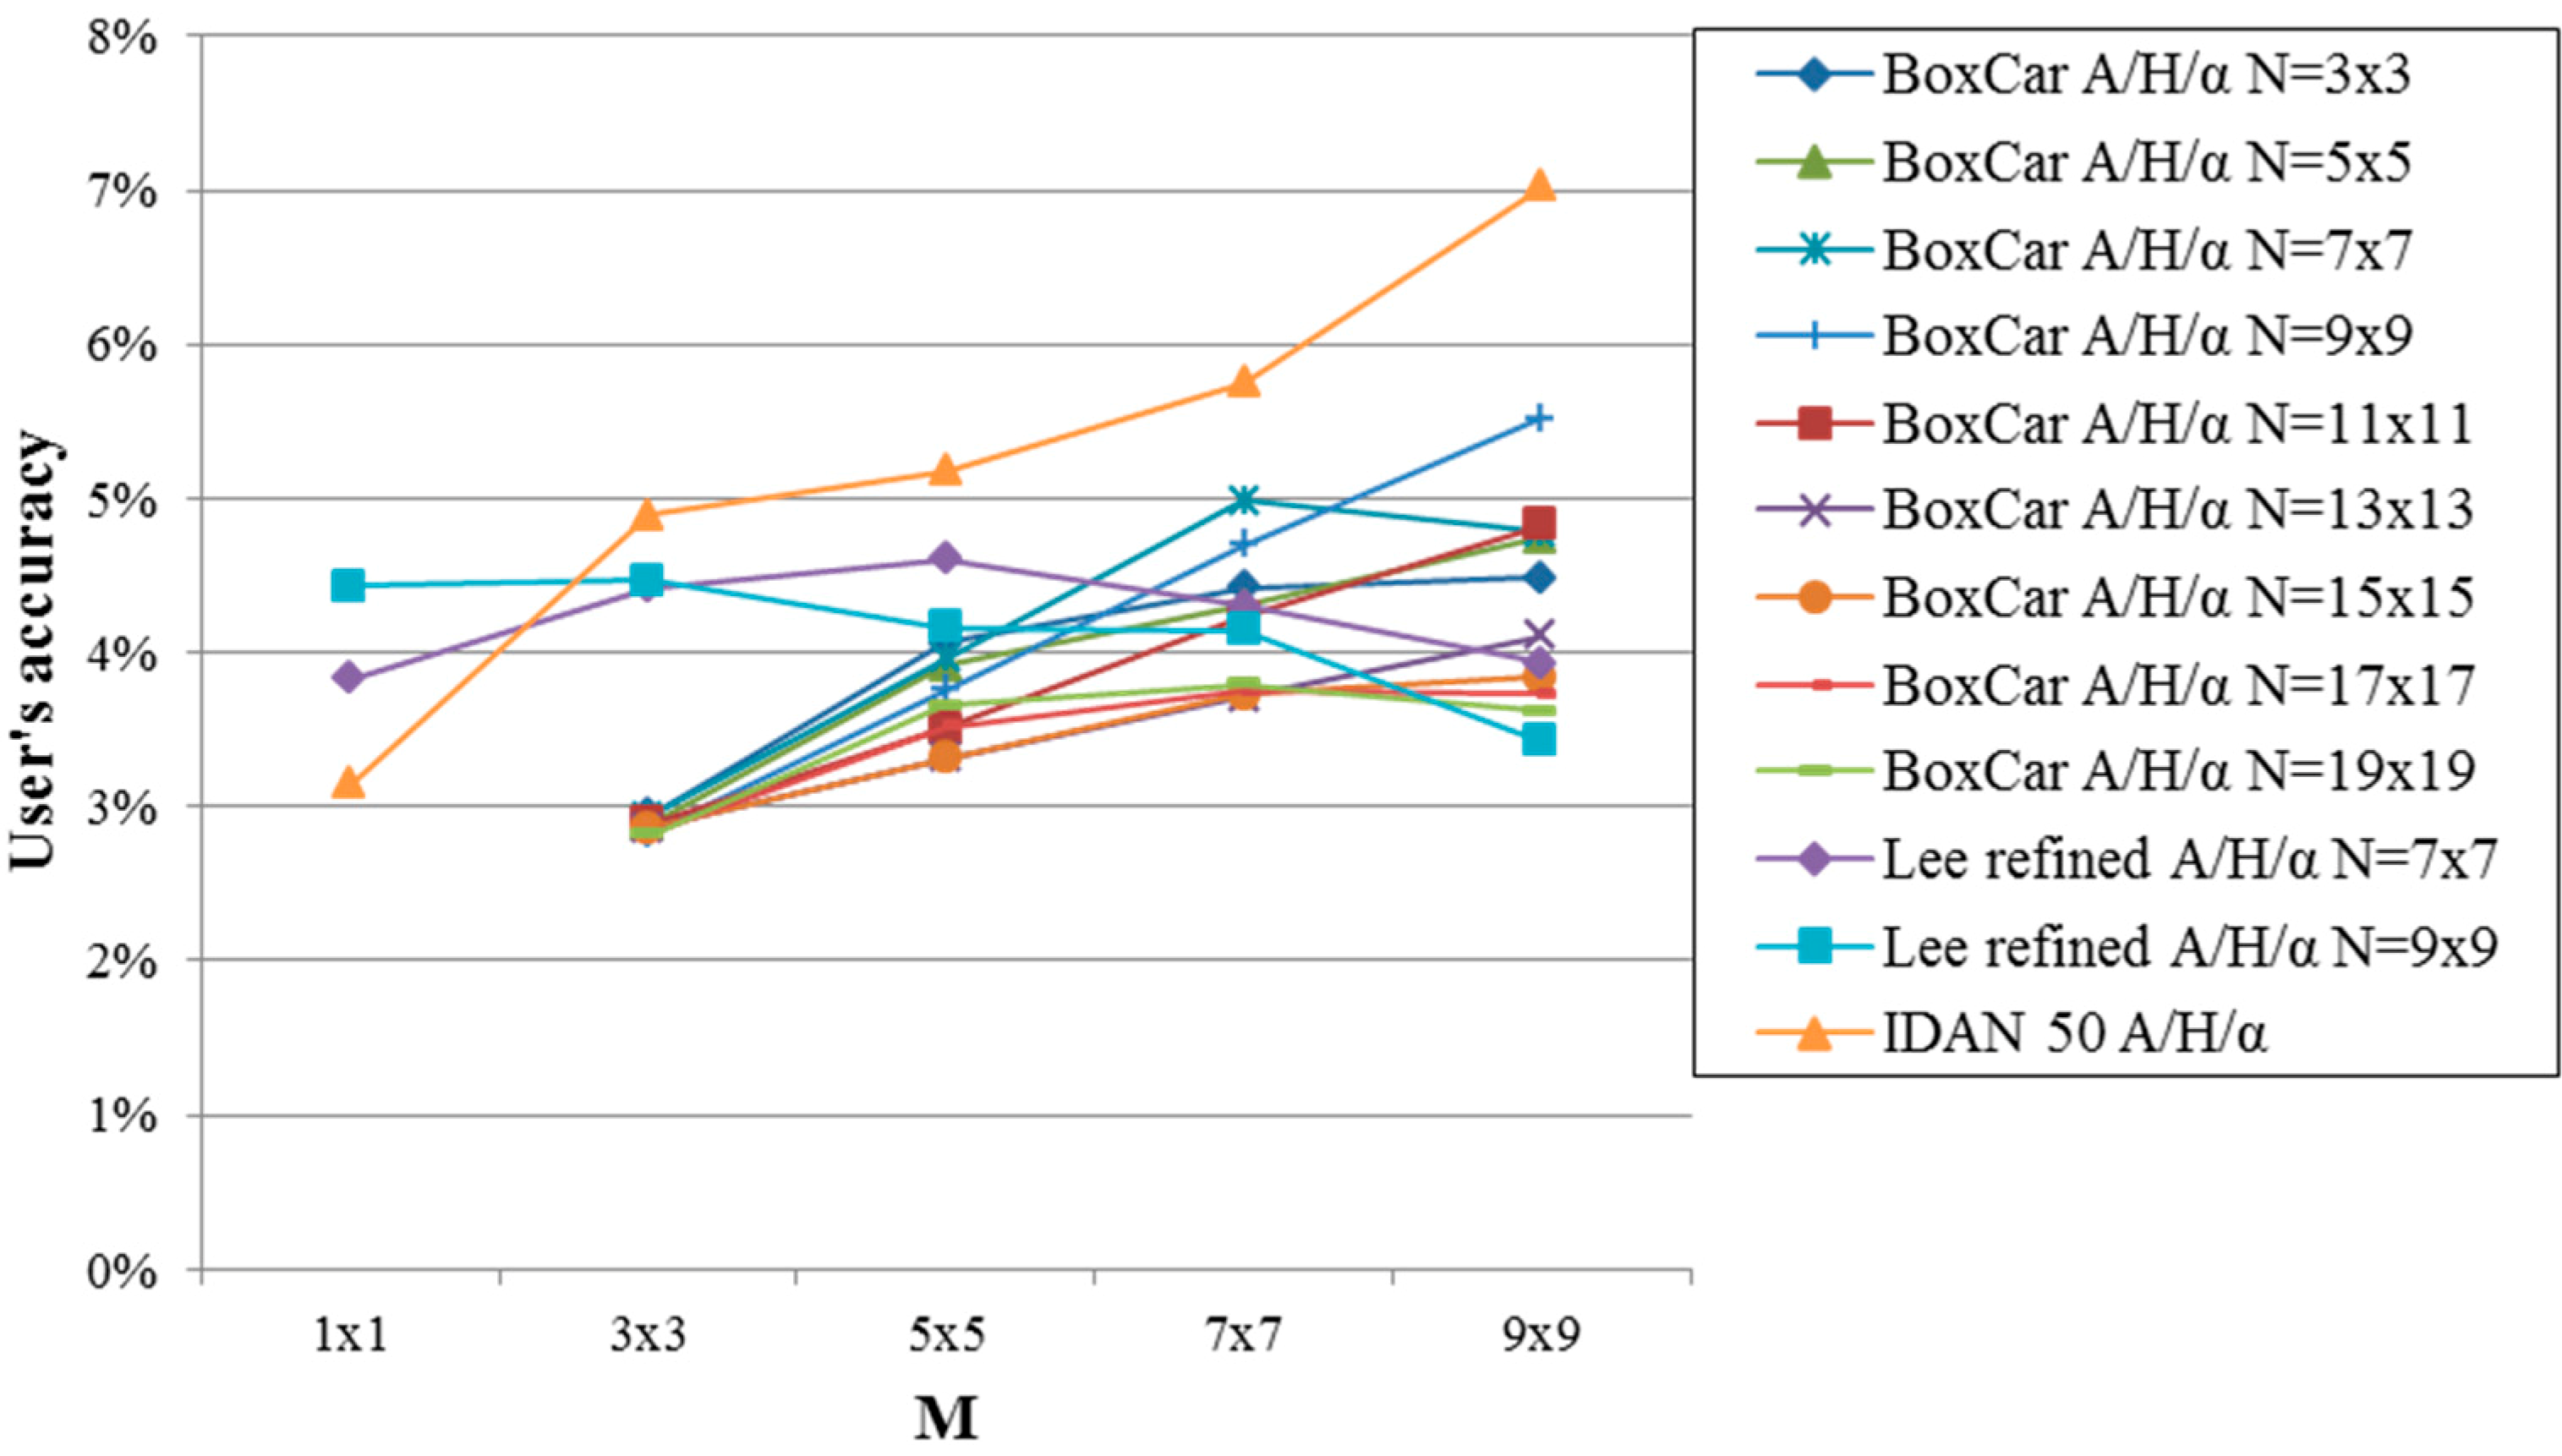
User’s accuracy vs. window size M after the pixel-based PolSAR classification based on H/α (box car, refined Lee and IDAN filter) for the first TerraSAR-X acquisition (5 September 2010).
Figure 6.
User’s accuracy vs. window size M after the pixel-based PolSAR classification based on H/α (box car, refined Lee and IDAN filter) for the first TerraSAR-X acquisition (5 September 2010).
Except for N = 3 and N = 19, the box car filter shows an increase of the user’s accuracy with increasing M. All in all, when focusing on the user’s accuracy values at the highest value of M = 9, the user’s accuracy increases with increasing N with the highest value at N = 9. At N > 9, the user’s accuracy decreases again with increasing N. The best result of the box car filter is achieved at N = M = 9.
The refined Lee filter shows an opposed trend. Here, the user’s accuracy decreases with increasing M. The best result for this speckle filter is at N = 7, M = 5.
The best result of all polarimetric speckle filters is achieved by using the IDAN filter (with 50 pixels maximum region growing) and M = 9. This combination achieves the best result of 6.29% for the user’s accuracy (with 82.25% producer’s accuracy) for H/α and 7.02% user’s accuracy (with 69.56% producer’s accuracy) with additionally considering the anisotropy (A/H/α). The achieved Cohen’s Kappa values are 0.10 or 0.11 for H/α or A/H/α, respectively.
Figure 7.
User’s accuracy vs. window size M after the pixel-based PolSAR classification based on A/H/α (box car, refined Lee and IDAN filter) for the first TerraSAR-X acquisition (5 September 2010).
Figure 7.
User’s accuracy vs. window size M after the pixel-based PolSAR classification based on A/H/α (box car, refined Lee and IDAN filter) for the first TerraSAR-X acquisition (5 September 2010).
The second part of the developed feature extraction procedure—the object-based post-classification (
cf. Section 3.2)—uses the best result of the previous step as input: IDAN filter (with 50 pixels maximum region growing) and
M = 9.
Figure 8 shows the development of the user’s
versus the producer’s accuracy within the object-based refinement for H/α and A/H/α, respectively.
As described in
Figure 4, the object-based post-classification starts with shrinking (
s) and expanding (
e) of the binary data with focus on the possible oil well pads. The best suited results were achieved with
s =
e = 4 pixels for H/α and
s =
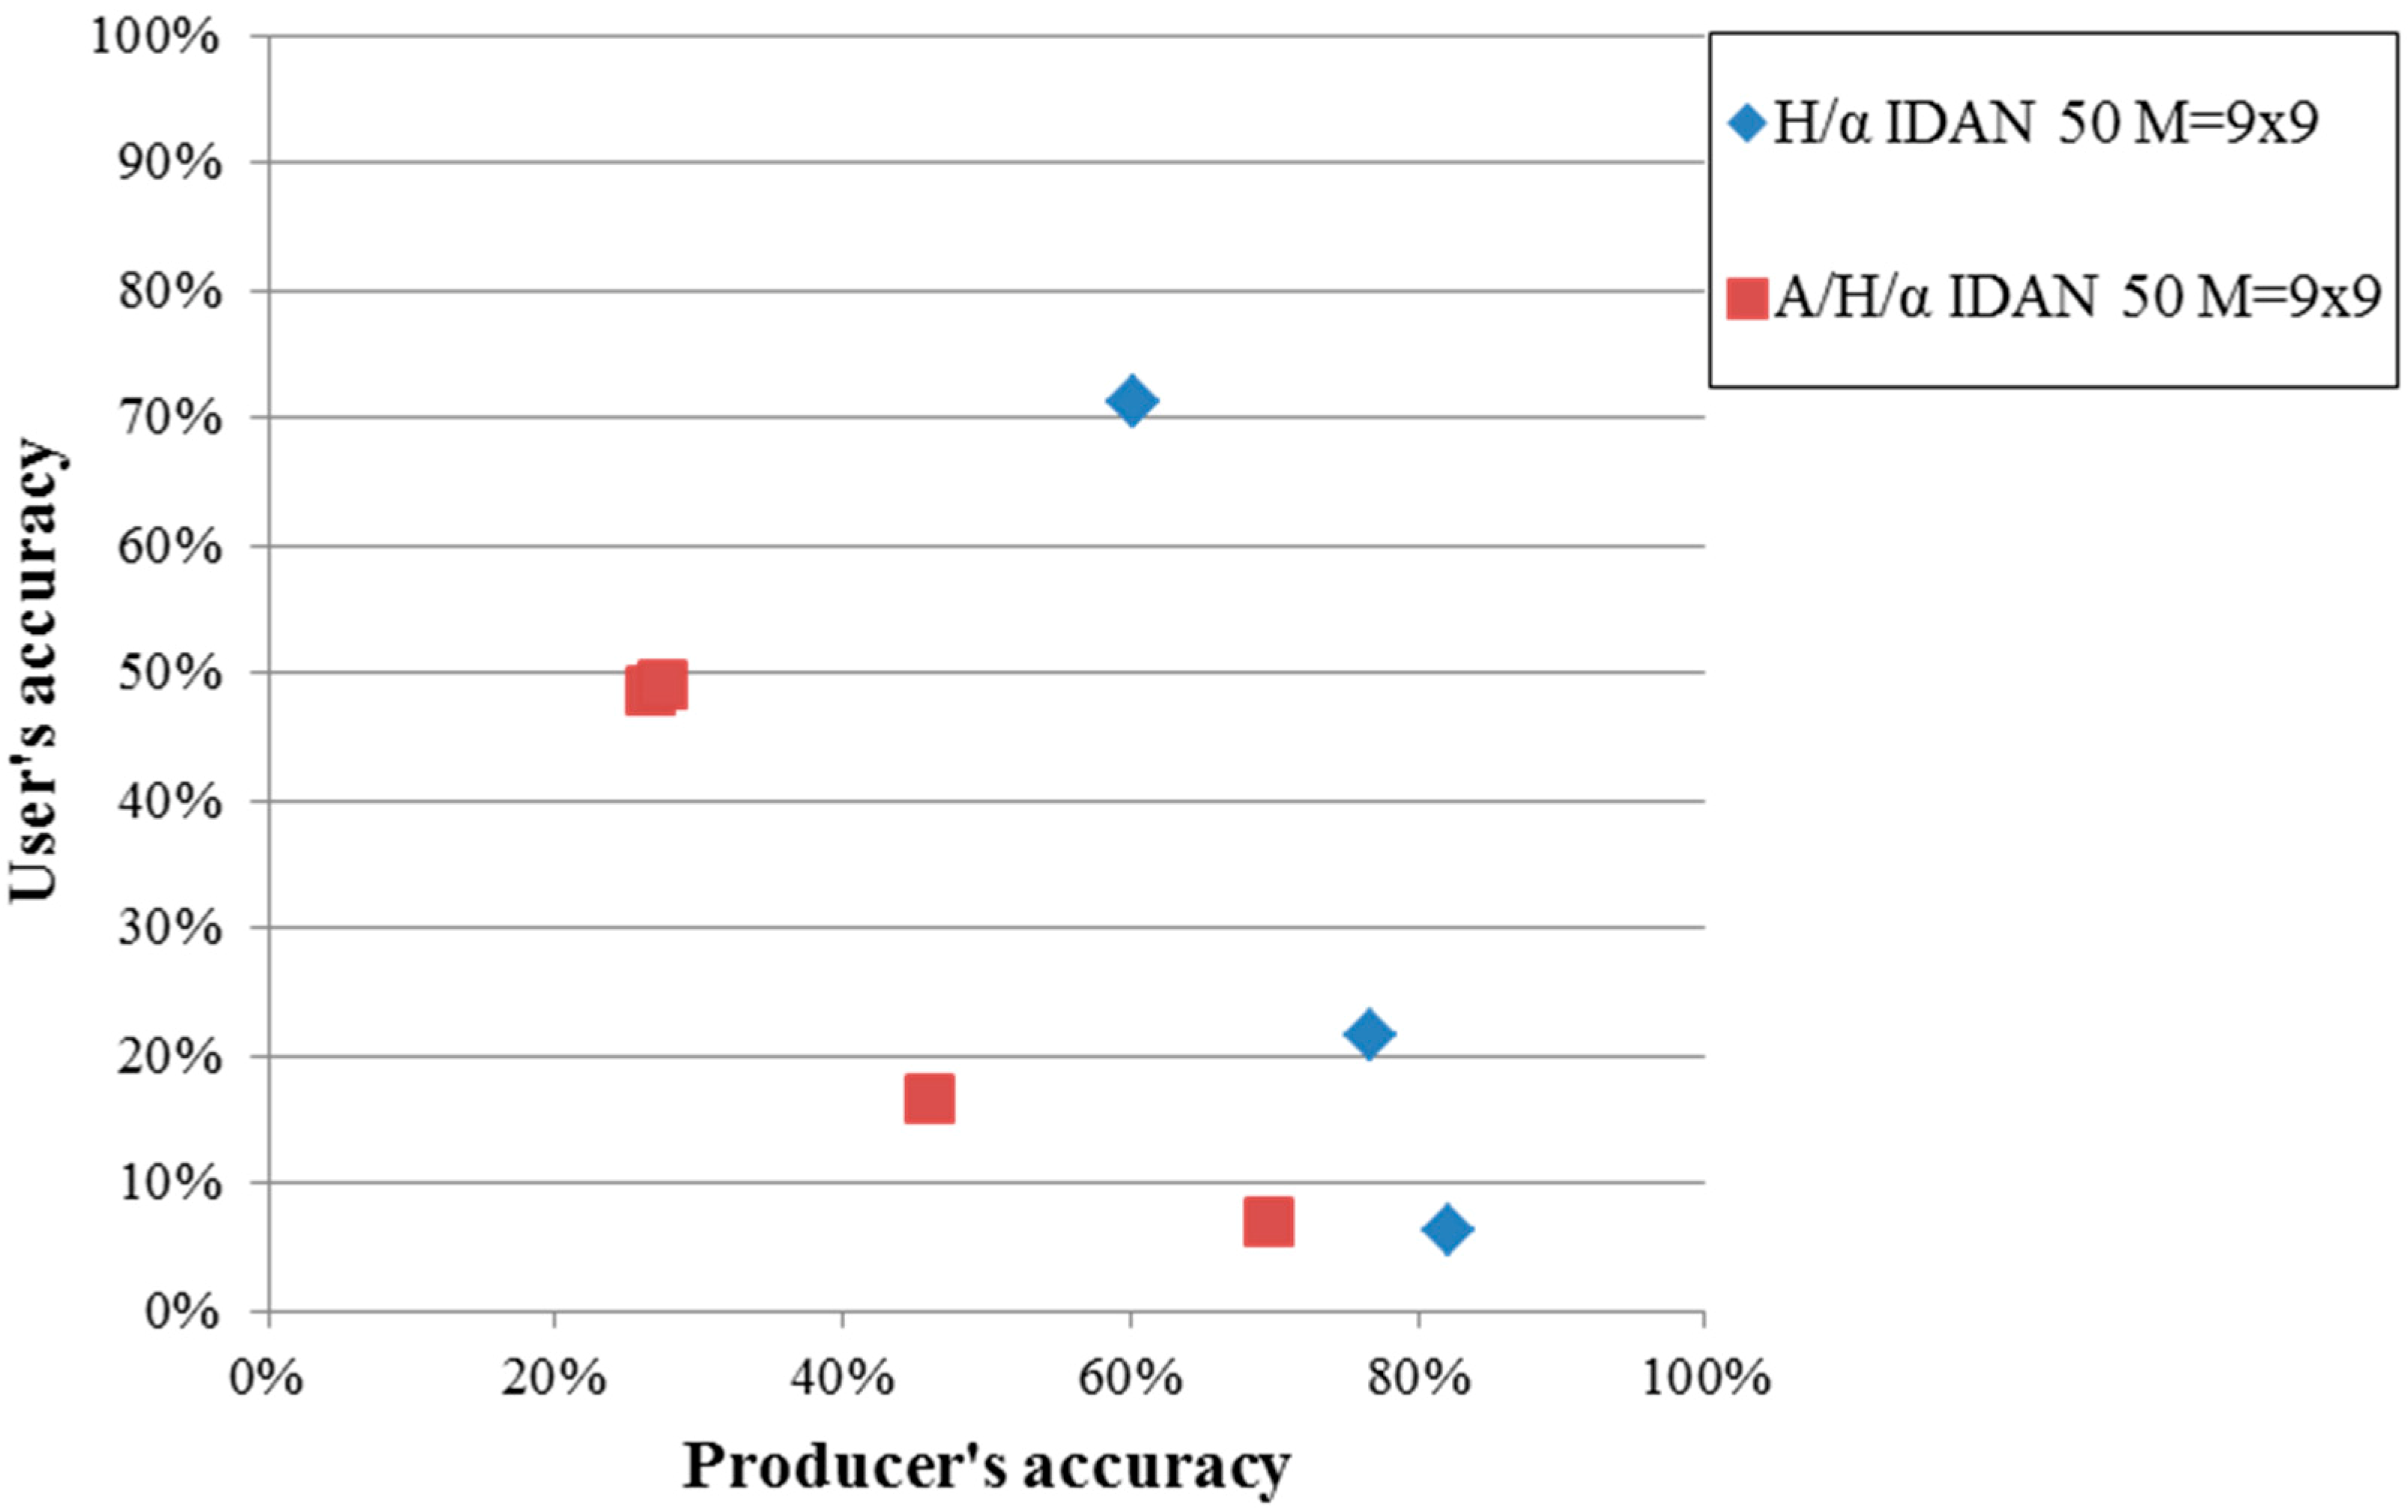
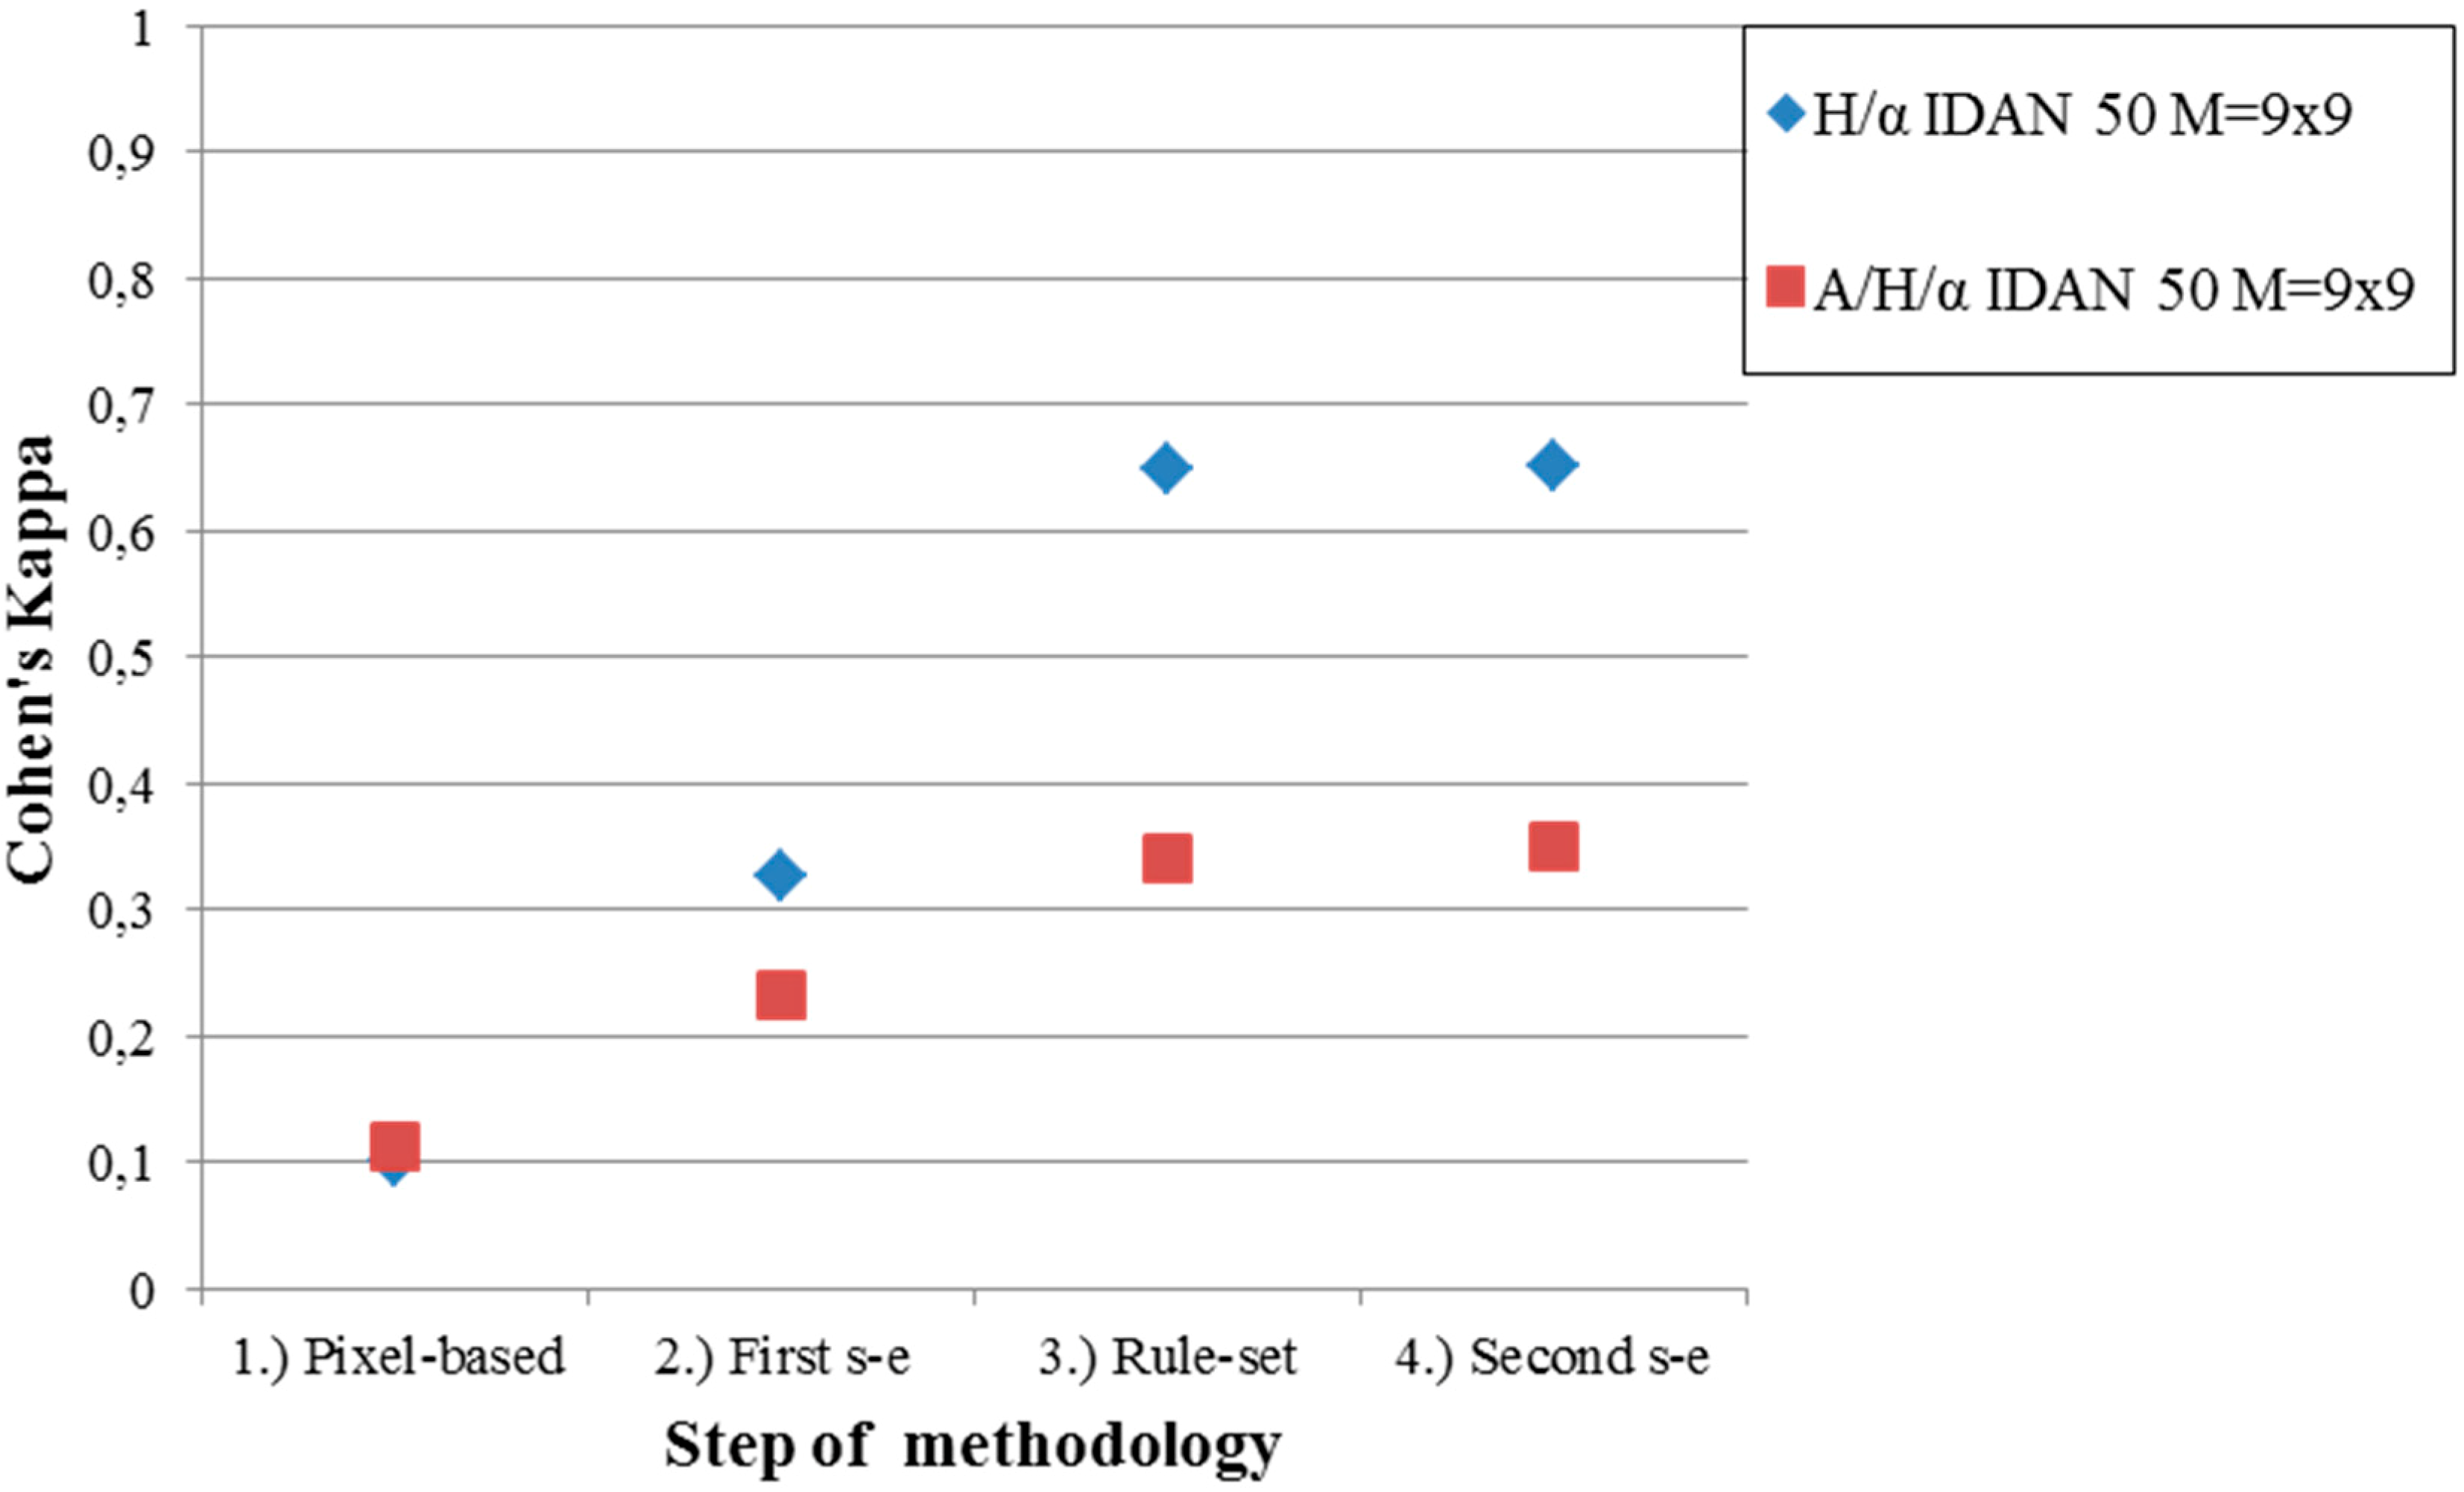
e = 2 for additionally considering the anisotropy (A/H/α). Thereby, the user’s accuracy of H/α was increased threefold (doubled) from the original 6.29% (7.02% for A/H/α) to 21.54% (16.54%), while the producer’s accuracy of H/α was only slightly reduced from the primary 82.25% (69.56% for A/H/α) to 76.72% (46.13% for A/H/α). The first shrinking and expanding procedure also strongly increased the Cohen’s Kappa value from 0.10 or 0.11 to 0.33 or 0.23 for H/α or A/H/α, respectively (
Figure 9).
The second object-based post-classification step includes a rule-set based procedure (
cf. Section 3.2) considering the minimum area of the oil well pads, their more or less rectangular shape and the nature of other land cover types characterized by the same backscattering properties (e.g., features free of vegetation with linear shape—high asymmetry—such as roads and tracks). This refinement procedure strongly increased the user’s accuracy of H/α by an order of magnitude (compared to the primary pixel-based classification) to 71.16% (
Figure 8). The user’s accuracy of A/H/α increased to 48.72%. The corresponding producer’s accuracy of H/α remains still relatively high with 60.16%. Contrary to this, the producer’s accuracy of A/H/α strongly decreased to 26.63%. This second post-classification step increased the Cohen’s Kappa to 0.65 for H/α (0.34 for A/H/α).
The third step of the object-based refinement is a combination of expanding and shrinking procedures. The best suited results were achieved for a combination of
e,
s,
s,
e with
e =
s = 3 pixels. This last post-classification step has more visual influences, such as cleaning (smoothing) of the boundaries of the extracted oil well pad objects, as the user’s accuracies only slightly increased to 71.28% or 49.19% for H/α or A/H/α, respectively. The corresponding final producer accuracies also slightly increased by this last morphological step to 60.24% or 27.54% for H/α or A/H/α, respectively (
Figure 8). The final achieved Cohen’s Kappa value is 0.65 for H/α (0.35 for A/H/α) (
Figure 9).
Figure 8.
Development of user’s accuracy vs. producer’s accuracy for the OBIA improvements (for the best results of the pixel-based PolSAR classification) based on H/α or A/H/α, respectively (for the first TerraSAR-X acquisition (5 September 2010)). Processing steps from lower right to upper left: (1) pixel-based, (2) first s-e, (3) rule-set, (4) second s-e. Please notice that the third and fourth point are located very close to each other (valid for both, H/α and A/H/α).
For sake of completeness, the final values for the overall accuracy and the user’s and producer’s accuracy for the class “non oil well pads” are 99.08%, 99.34% and 99.74%. However, as mentioned in the beginning of this section, these values are not relevant for the validation of this methodology, as the area of the class “non oil well pads” is much larger than the area of the oil well pads. Therefore, the focus is on the user’s and producer’s accuracies of the class “oil well pads”.
The visual comparison of the classification with the reference data (see
Figure 10) confirms the high accuracy values of the final result of the oil well pad feature extraction.
In conclusion,
Figure 8 clearly demonstrates the surplus value which is achieved by combining a traditional pixel-based classification with an object-based post-classification procedure additionally taking the properties like shape, area and neighboring relations into account.
Figure 9.
Development of the Cohen’s Kappa coefficient for the OBIA improvements (for the best results of the pixel-based PolSAR classification) based on H/α or A/H/α, respectively (for the first TerraSAR-X acquisition (5 September 2010)).
Figure 9.
Development of the Cohen’s Kappa coefficient for the OBIA improvements (for the best results of the pixel-based PolSAR classification) based on H/α or A/H/α, respectively (for the first TerraSAR-X acquisition (5 September 2010)).
Figure 10.
Subset of the study area. Original TerraSAR-X acquisition (5 September 2010) (
left). Final result of the feature extraction methodology (
right): Combination of the pixel-based PolSAR Wishart classification (based on H/α with
M = 9; IDAN filter with 50 pixel max. region growing) with the object-based post-classification. The visual comparison of the classification and the reference data confirms the high accuracy values reported in
Figure 8. TerraSAR-X © 2014 German Aerospace Center (DLR), 2014 Airbus Defence and Space/Infoterra GmbH.
4.2. Results—Application of the Fully Automated Feature Extraction Methodology to the Second TerraSAR-X Acquisition—Area Based Accuracy Assessment
To investigate the transferability of the PolSAR data based oil well pad feature extraction methodology described in
Section 3, the feature extraction procedure was in addition applied to a second High Resolution SpotLight TerraSAR-X acquisition (19 October 2010) recorded
ca. 1.5 month later over the same AoI. To enable a fully automated feature extraction and also a direct comparison of the achieved accuracies at the different acquisition dates, the same parameters which worked out to be suited best (see
Table 2) during the training procedure based on the first TerraSAR-X acquisition (5 September 2010) (
cf. Section 4.1) were used for the processing of the second one (19 October 2010).
Table 2.
Best suited parameters for the oil well pad feature extraction derived by the training procedure (based on the TerraSAR-X acquisition 5 September 2010) and applied to the second acquisition (19 October 2010).
Table 2.
Best suited parameters for the oil well pad feature extraction derived by the training procedure (based on the TerraSAR-X acquisition 5 September 2010) and applied to the second acquisition (19 October 2010).
| Parameter/Processing Step | Value |
|---|
| IDAN speckle filter | 50 pixels maximum region growing |
| M | 9 |
| Shrinking, expanding | s = e = 4 for H/α; s = e = 2 for A/H/α |
| Rule-set | Minimum area, shape, (asymmetry, rectangular fit) |
| Expanding, shrinking, shrinking, expanding | e = s = 3 for both H/α and A/H/α |
Due to changes on the ground in the time period between the two SAR acquisitions (i.e., construction of few new oil well pads by the oil industry), the reference dataset of the first TerraSAR-X acquisition had to be updated. In practice, the topicality of reference dataset was checked based on the second SAR acquisition. New constructed oil well pads were added to the dataset.
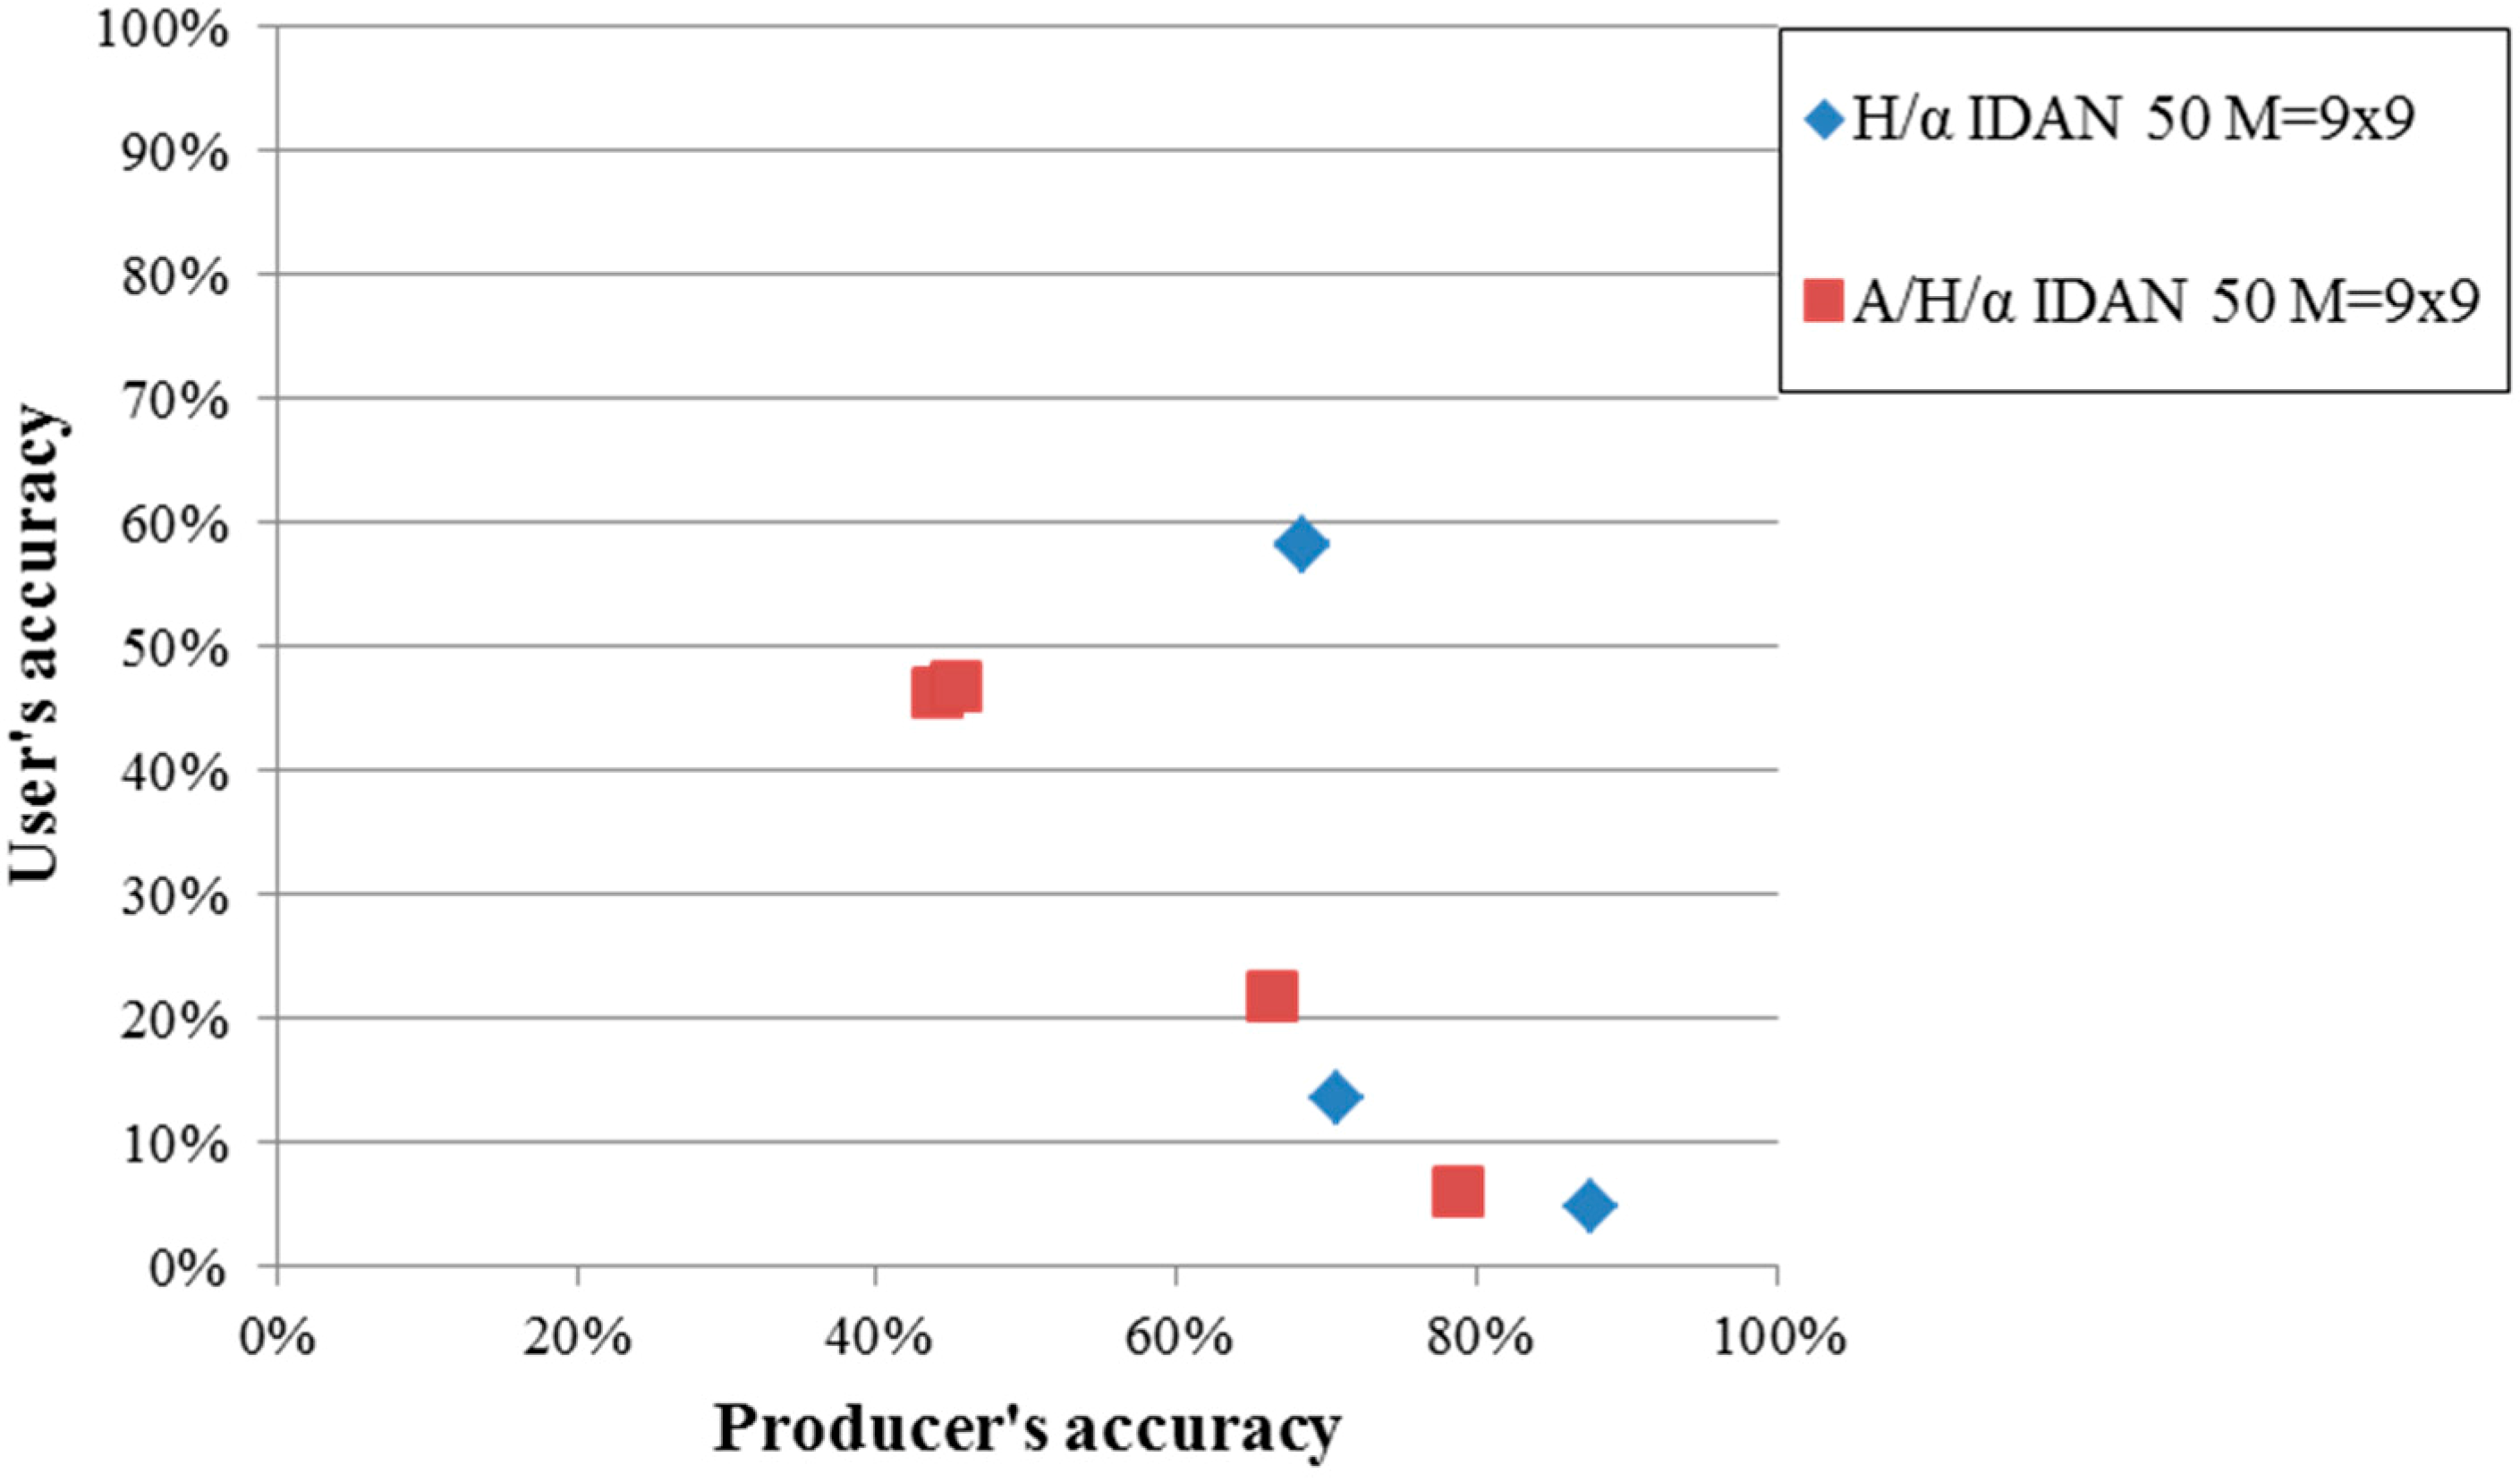
Figure 11, the development of the user’s and producer’s accuracies—shows a similar trend for the second TerraSAR-X acquisition (19 October 2010) as the first one (5 September 2010) described in
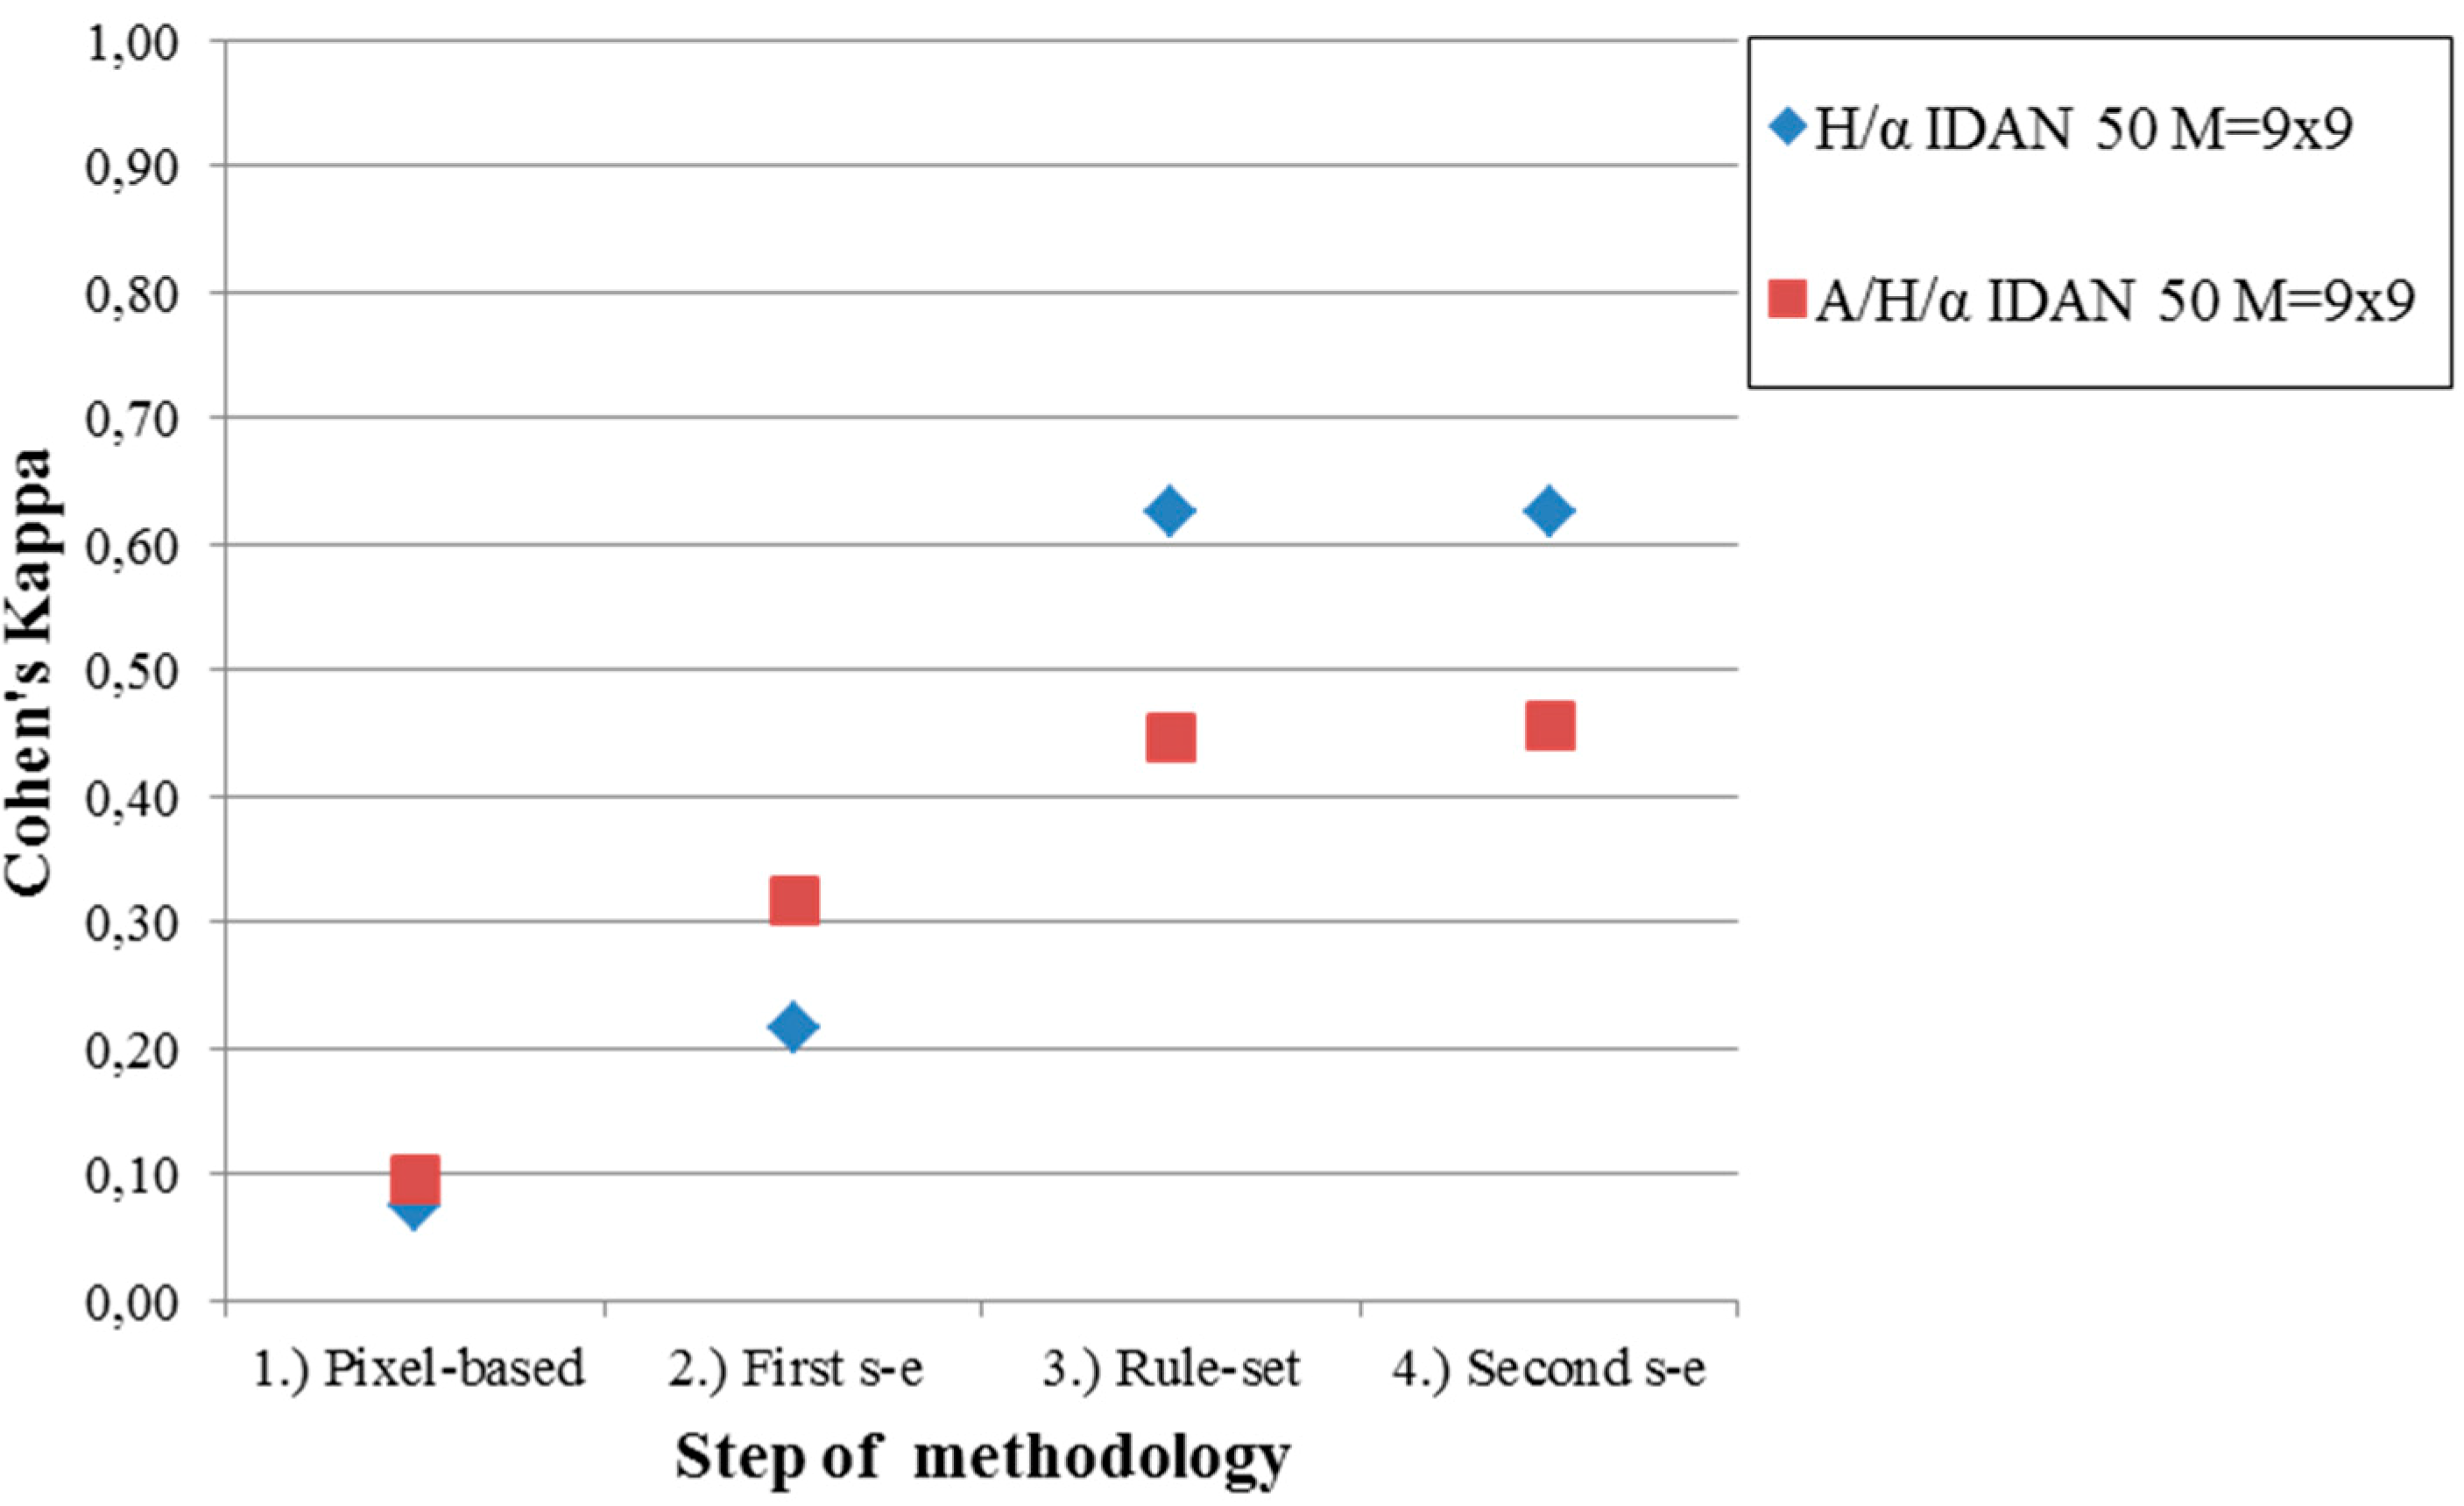
Section 4.1. The PolSAR pixel-based Wishart classification achieved a user’s and producer’s accuracy of 4.83% for H/α (6.00% for A/H/α) and 87.59% (78.62% for A/H/α), respectively. The Cohen’s Kappa was 0.07 or 0.09 for H/α or A/H/α, respectively (
Figure 12).
The first step of the object-based post-classification—shrinking and expanding with s = e = 4 for H/α (s = e = 2 for A/H/α) increased the user’s accuracy to 13.70% for H/α (21.79% for A/H/α) by slightly decreasing the producer’s accuracy to 70.60% for H/α (66.40% for A/H/α). Thereby, the Cohens’s Kappa was increased to 0.22 for H/α (0.32 for A/H/α).
After the second step—the rule-set based OBIA approach—the user’s accuracies increased to 58.14% or 46.35% for H/α or A/H/α, respectively, while the producer’s accuracies decreased to 68.44% or 44.07%, respectively, and the Cohen’s Kappa increased to 0.62 or 0.45, respectively (
Figure 11 and
Figure 12).
The final expanding-shrinking-combination of e, s, s, e (with s = e = 3 pixels) increased the user’s accuracy (Cohen’s Kappa) to 58.28% (0.63) or 46.86% (0.46) for H/α or A/H/α, respectively. The finally achieved producer’s accuracy is 68.49% for H/α (45.35% for A/H/α). For sake of completeness, the final values for the overall accuracy and the user’s and producer’s accuracy for the class “non oil well pads” are 98.94%, 99.45% and 99.48%.
Figure 11.
Development of user’s accuracy vs. producer’s accuracy for the OBIA improvements based on H/α or A/H/α, respectively (for the second TerraSAR-X acquisition (19 October 2010)). Processing steps from lower right to upper left: (1) pixel-based, (2) first s-e, (3) rule-set, (4) second s-e. Please notice that the third and fourth point are located very close to each other (valid for both, H/α and A/H/α).
Figure 12.
Development of the Cohen’s Kappa coefficient for the OBIA improvements based on H/α or A/H/α, respectively (for the second TerraSAR-X acquisition (19 October 2010)).
Figure 12.
Development of the Cohen’s Kappa coefficient for the OBIA improvements based on H/α or A/H/α, respectively (for the second TerraSAR-X acquisition (19 October 2010)).
4.3. Results—Accuracy Assessment Based on the Number of Correctly Classified Oil Well Pads
The accuracy assessment executed in
Section 4.1 and
Section 4.2 was based on the percentage area of correctly classified oil well pads. This type of accuracy assessment is much more accurate and therefore better suited to validate the developed PolSAR and OBIA feature extraction technique. However, for practical applications it is often satisfactory to know the number of correctly/falsely detected oil well pads, including over- and underestimation. Therefore, this section reports the results of an accuracy assessment based on the number of oil well pads and not on the percentage area of detection.
The
Table 3,
Table 4,
Table 5 and
Table 6 show for both TerraSAR-X acquisitions the number-based user’s and producer’s accuracies for H/α and A/H/α, respectively. The user’s and producer’s accuracy of the class “non oil well pad” as well as the overall accuracy and the Cohen’s Kappa coefficient are not included in the
Table 3,
Table 4,
Table 5 and
Table 6, as the focus of the presented methodology is on the extraction of the oil well pads and not on their surroundings,
i.e., the aim is not to proof whether a “non oil well pad” is correctly classified as being located outside the oil well pads.
Table 3.
Number-based accuracy assessment for TerraSAR-X acquisition 5 September 2010—H/α.
Table 3.
Number-based accuracy assessment for TerraSAR-X acquisition 5 September 2010—H/α.
| 5 September 2010 H/α | Reference Data | ∑ | |
|---|
| Oil Well Pad | Non Oil Well Pad | User’s Accuracy |
|---|
| Classification | Oil well pad | 113 | 19 | 132 | 85.61% |
| Non oil well pad | 26 | - | - | - |
| ∑ | 139 | - | - | - |
| Producer’s accuracy | 81.29% | - | - | - |
Table 4.
Number-based accuracy assessment for TerraSAR-X acquisition 5 September 2010—A/H/α.
Table 4.
Number-based accuracy assessment for TerraSAR-X acquisition 5 September 2010—A/H/α.
| 5 September 2010 A/H/α | Reference Data | ∑ | |
|---|
| Oil Well Pad | Non Oil Well Pad | User’s Accuracy |
|---|
| Classification | Oil well pad | 136 | 145 | 281 | 48.40% |
| Non oil well pad | 3 | - | - | - |
| ∑ | 139 | - | - | - |
| Producer’s accuracy | 97.84% | - | - | - |
Table 5.
Number-based accuracy assessment for TerraSAR-X acquisition 19 October 2010—H/α.
Table 5.
Number-based accuracy assessment for TerraSAR-X acquisition 19 October 2010—H/α.
| 19 October 2010 H/α | Reference Data | ∑ | |
|---|
| Oil Well Pad | Non Oil Well Pad | User’s Accuracy |
|---|
| Classification | Oil well pad | 129 | 45 | 174 | 74.14% |
| Non oil well pad | 16 | - | - | - |
| ∑ | 145 | - | - | - |
| Producer’s accuracy | 88.97% | - | - | - |
Table 6.
Number-based accuracy assessment for TerraSAR-X acquisition 19 October 2010—A/H/α.
Table 6.
Number-based accuracy assessment for TerraSAR-X acquisition 19 October 2010—A/H/α.
| 19 October 2010 A/H/α | Reference Data | ∑ | |
|---|
| Oil Well Pad | Non Oil Well Pad | User’s Accuracy |
|---|
| Classification | Oil well pad | 157 | 237 | 394 | 39.85% |
| Non oil well pad | −12 | - | - | - |
| ∑ | 145 | - | - | - |
| Producer’s accuracy | 108.28% | - | - | - |
The number-based accuracy assessment achieves much higher values for the user’s and producer’s accuracies, as this type of accuracy assessment focuses on the number of correctly/falsely detected oil well pads and not on the percentage area correctly detected. However, the trend is the same: The highest value for the user’s accuracy is achieved for the first TerraSAR-X acquisition (5 September 2010) for H/α with 85.61% (compared to 71.28% for the area-based accuracy assessment), followed by H/α for the second acquisition (19 October 2010) and by A/H/α for the first and the second acquisition, respectively. The same is true for the producer’s accuracy for H/α when comparing the number- and area-based accuracy assessment values (
cf. Section 4.1 and
Section 4.2).
However, for A/H/α the producer’s accuracy shows very high values at the number-based accuracy assessment. For the second TerraSAR-X acquisition (19 October 2010) A/H/α even shows a producer’s accuracy of >100%. The reason for this is that the additional consideration of the anisotropy,
i.e., A/H/α, leads to a very strong fragmentation of the possible oil well pad objects. Contrary to the large oil well pad objects which were extracted using only H/α (see
Section 4.1 and
Figure 10), the feature extraction based on A/H/α results in a much higher number of possible oil well pad objects, which are much smaller compared to the one extracted by the method based on H/α. This is also reflected by the number of classified oil well pads shown in the
Table 3,
Table 4,
Table 5 and
Table 6: When comparing the values for H/α with the one based on A/H/α, we can recognize a strong increase from 132 or 174 to 281 or 394 classified pads (for 5 September 2010 or 19 October 2010, respectively). For comparison the number of the reference oil well pads is 139 or 145, respectively (
cf. also
Section 5.3).


