In this section, the overall procedure for the generation of traffic information is presented. All processing steps for estimating road traffic information are performed on-board the aircraft. To fulfill the interface specification of the Internet traffic portal, only the conversion of the traffic information is done on the ground. In addition, another outlier correction procedure, which is done according to [
41], can be activated at the ground station. This module was transferred to the ground in order to save computing power in the on-board system. After georeferencing of the images (
Section 2.2), external geoinformation is used for delineation of road areas (
Section 3.1). The following vehicle detection (
Section 3.2) is performed in the regions of interest of the first image of each sequence (image burst). All detected vehicles are tracked by shape-based matching, as described in
Section 3.3. The performance of the algorithms has to fulfill the time constraints given by the burst mode configuration, which limits the overall processing time to 7 s. Details of our strategy for saving computation time are given in the following section.
3.1. Image Preprocessing
Orthoimage preparation for vehicle detection is performed for each camera viewing direction. The images are overlayed with road axes obtained from a Navteq database. This is done in order to reduce the search area for vehicle detection and limit it to road areas. In this preprocessing step, it is possible to choose roads of certain level types by the number of lane categories or other road attributes. All of the pixels located between a certain width buffer along the road axes are selected as the region-of-interest. A typical value used for the road buffer width is 22 m, because it works for all types of road categories. It is sufficient to cover motorways with four or more lanes while taking into account the errors in the location of road axes and image georeferencing. If the extraction of traffic information is limited to minor roads (e.g., in city regions), the buffer width can be reduced. In a future version of the processing chain, we plan to adapt the road buffer width to the lane categories.
All regions-of-interest are aligned in the road direction by resampling, which leads to straightened and rotated road snippets. All vehicles appear horizontal. Thus, there is no need for rotational invariant feature calculation during detection, which may be computational expensive compared to the used Haar-like features. A look-up table for the transformation of pixel and UTM coordinates from the straightened road images back to the original images is created. It contains both the pixel coordinates in the straightened image and the UTM coordinates of each node of the respective Navteq section. Thus, each vehicle position detected in the straightened roads image can be transformed into the coordinate system of the original image.
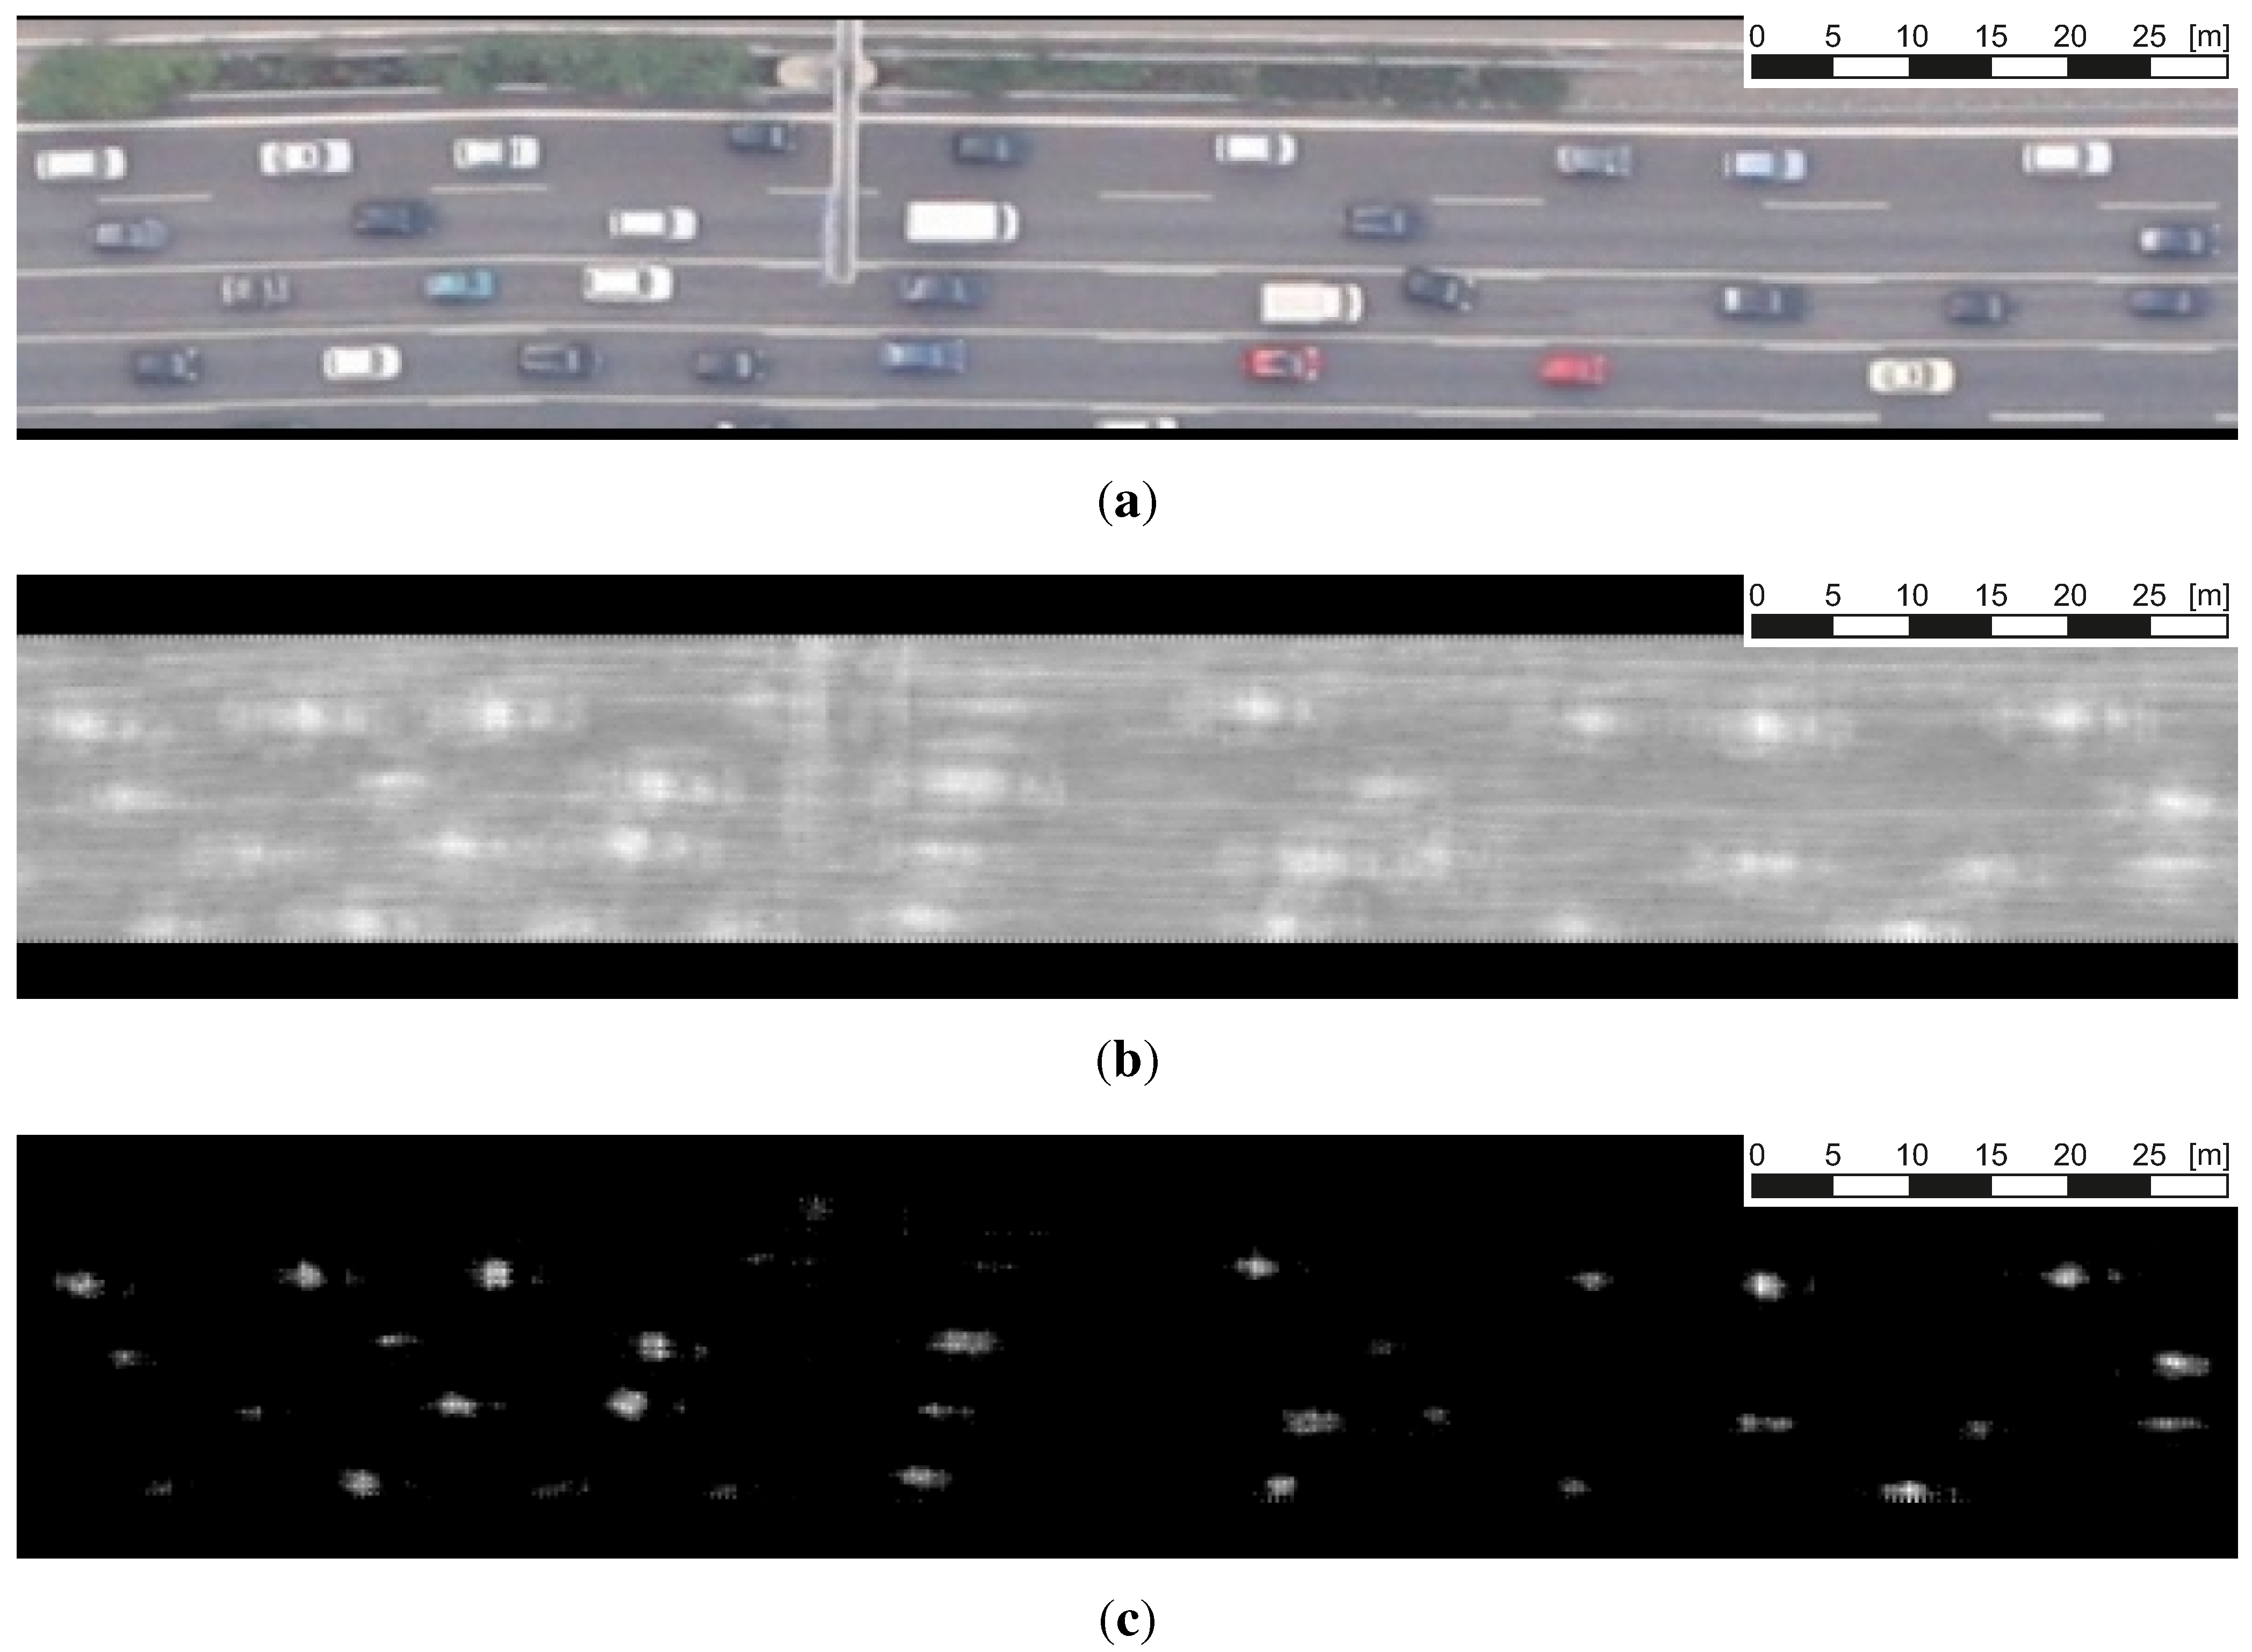
Figure 3a shows the situation after road buffering and straightening. The images of the straightened roads obtained from each first image of an exposure burst are transferred to the next module of the traffic processor, the vehicle detector.
Figure 3.
Results of the boosted classifier. (a) Straightened image; (b) boosting results; (c) boosting results after threshold.
Figure 3.
Results of the boosted classifier. (a) Straightened image; (b) boosting results; (c) boosting results after threshold.
3.3. Vehicle Tracking
The proposed vehicle tracking is performed using explicit shape models generated on each vehicle on the roads. For that, we generate a shape model within the radius of 5.2 m centered on each vehicle detection. This usually covers complete cars. For trucks, a shape model is created with the same radius centered on the driving cab. This area on the truck usually comprises the most characteristic signature of each individual truck. Tracking takes place between consecutive images of an image sequence (burst). Tracking is performed by matching the vehicles detected in the first image over the following images of the sequence. The vehicle pattern is updated after each tracking step. This makes the tracking method almost invariant for illumination or perspective changes. Vehicle positions in the first image of each burst are known prior to vehicle tracking from the previously detection. A shape model is generated for each position of a detected vehicle. Position prediction for the second image is based on the position detected in the first image and the maximum vehicle speed expected. A search area is spanned in the travel direction originating from the known position of the vehicle in the image before. The assumed travel direction is derived from the direction of the road (obtained from Navteq data) on which the vehicle was detected. The instance with the best matching score is assumed to be the correct match. A threshold for the score, which is normalized to a range of 0.0 and 1.0, is applied. For matching scores below this threshold, it is assumed that the vehicle is not visible in the second image and that the match is skipped. The best results with minimum false positive and negative rates were obtained with a threshold of 0.6. The search area length is calculated corresponding to the road section maximum speed plus a constant and a linear tolerance. Typical values used for the tolerance are 10 km/h for the constant contribution and 20% for the linear portion (10 km/h is about twice the error in measuring velocity, and 20% is usually the threshold, where a speeding ticket comes along with harsh sanctions).
Shape-based matching, which forms the main operator of tracking, is based on pixel-wise template matching of the image gradients. Common gradient-based methods, like the generalized Hough transform (e.g., [
78,
79]), have the disadvantage that they are not invariant against larger illumination changes. They are edge point based, and the number of extracted points depends on the image contrast. Thus, a lower contrast reduces the number of edge points, which affects the matching in the same way that occlusion of an object would [
80]. Therefore, [
80] proposed a pixel-wise, shape-based matching approach, since it is robust against occlusion, clutter and nonlinear illumination changes. In detail, an
n pixel model of an object is defined according to [
76] as a set of points:
with
i = 1, ...,
n, and:
as the associated gradient direction vectors generated by edge extraction [
81]. The search area in the target image of the template search is represented by a direction vector:
for each image point (
r, c). The normalized similarity measure
s for shape-based template matching is calculated then as:
In order to speed up the search, a hierarchical search using image pyramids is used.
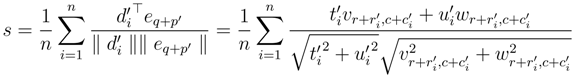
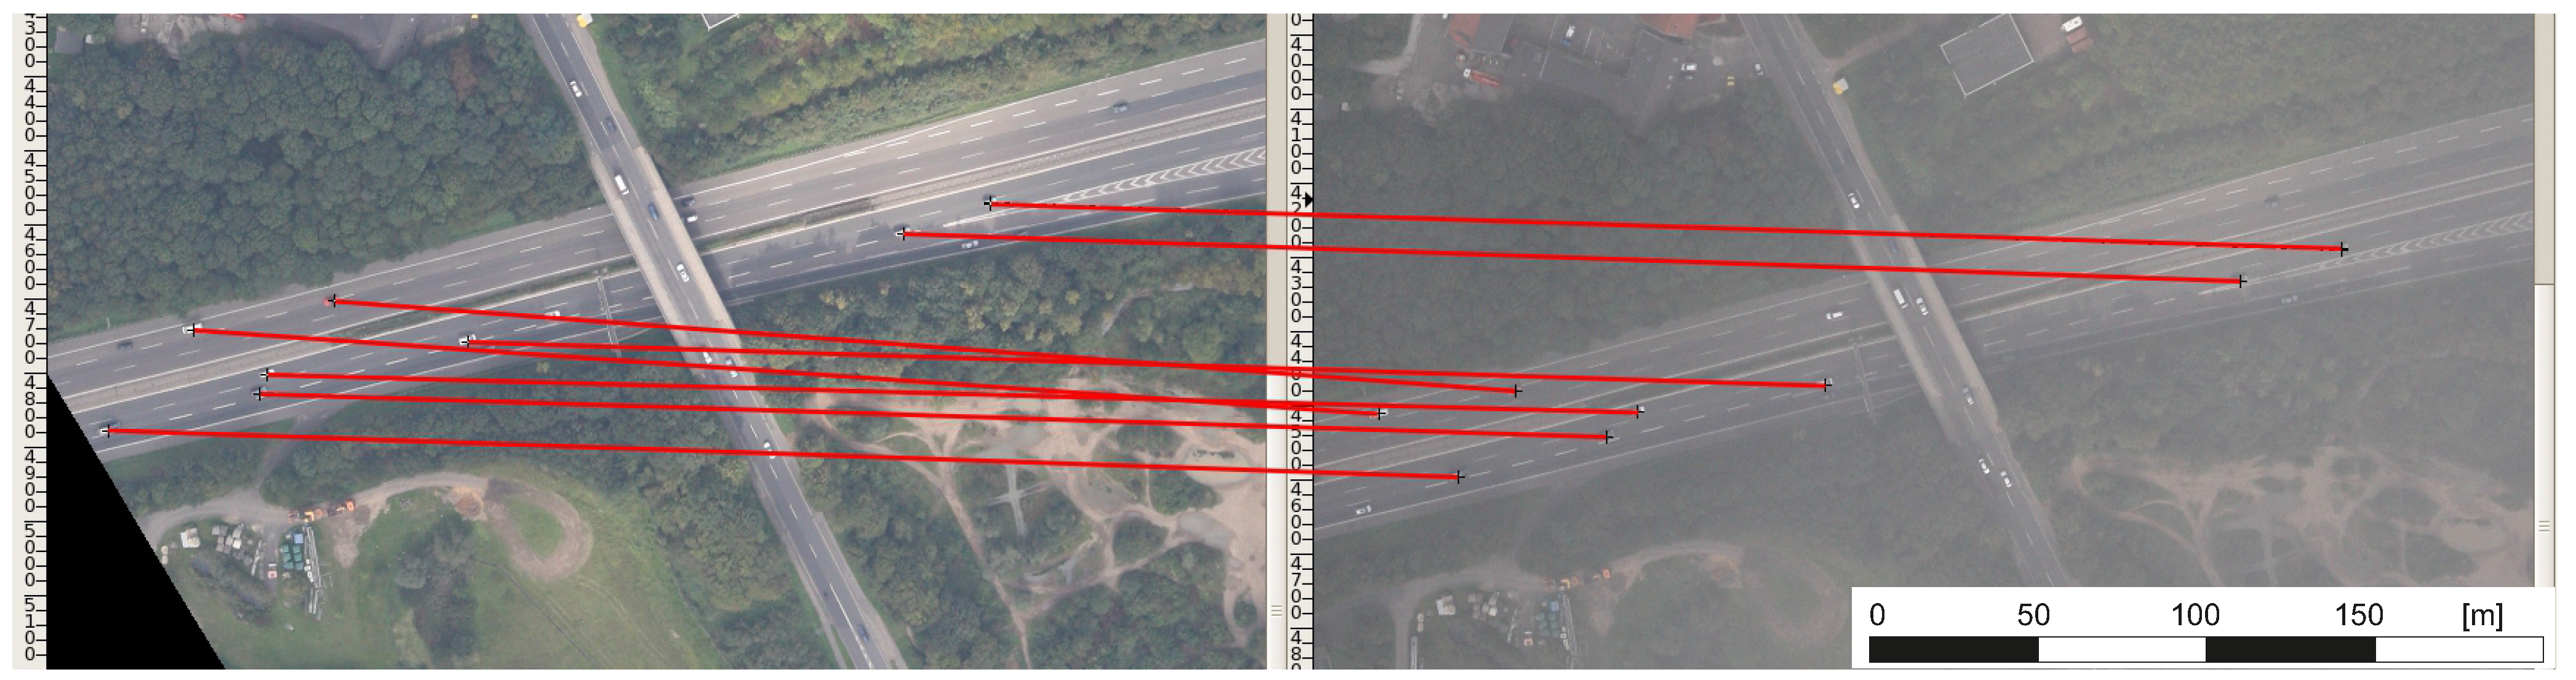
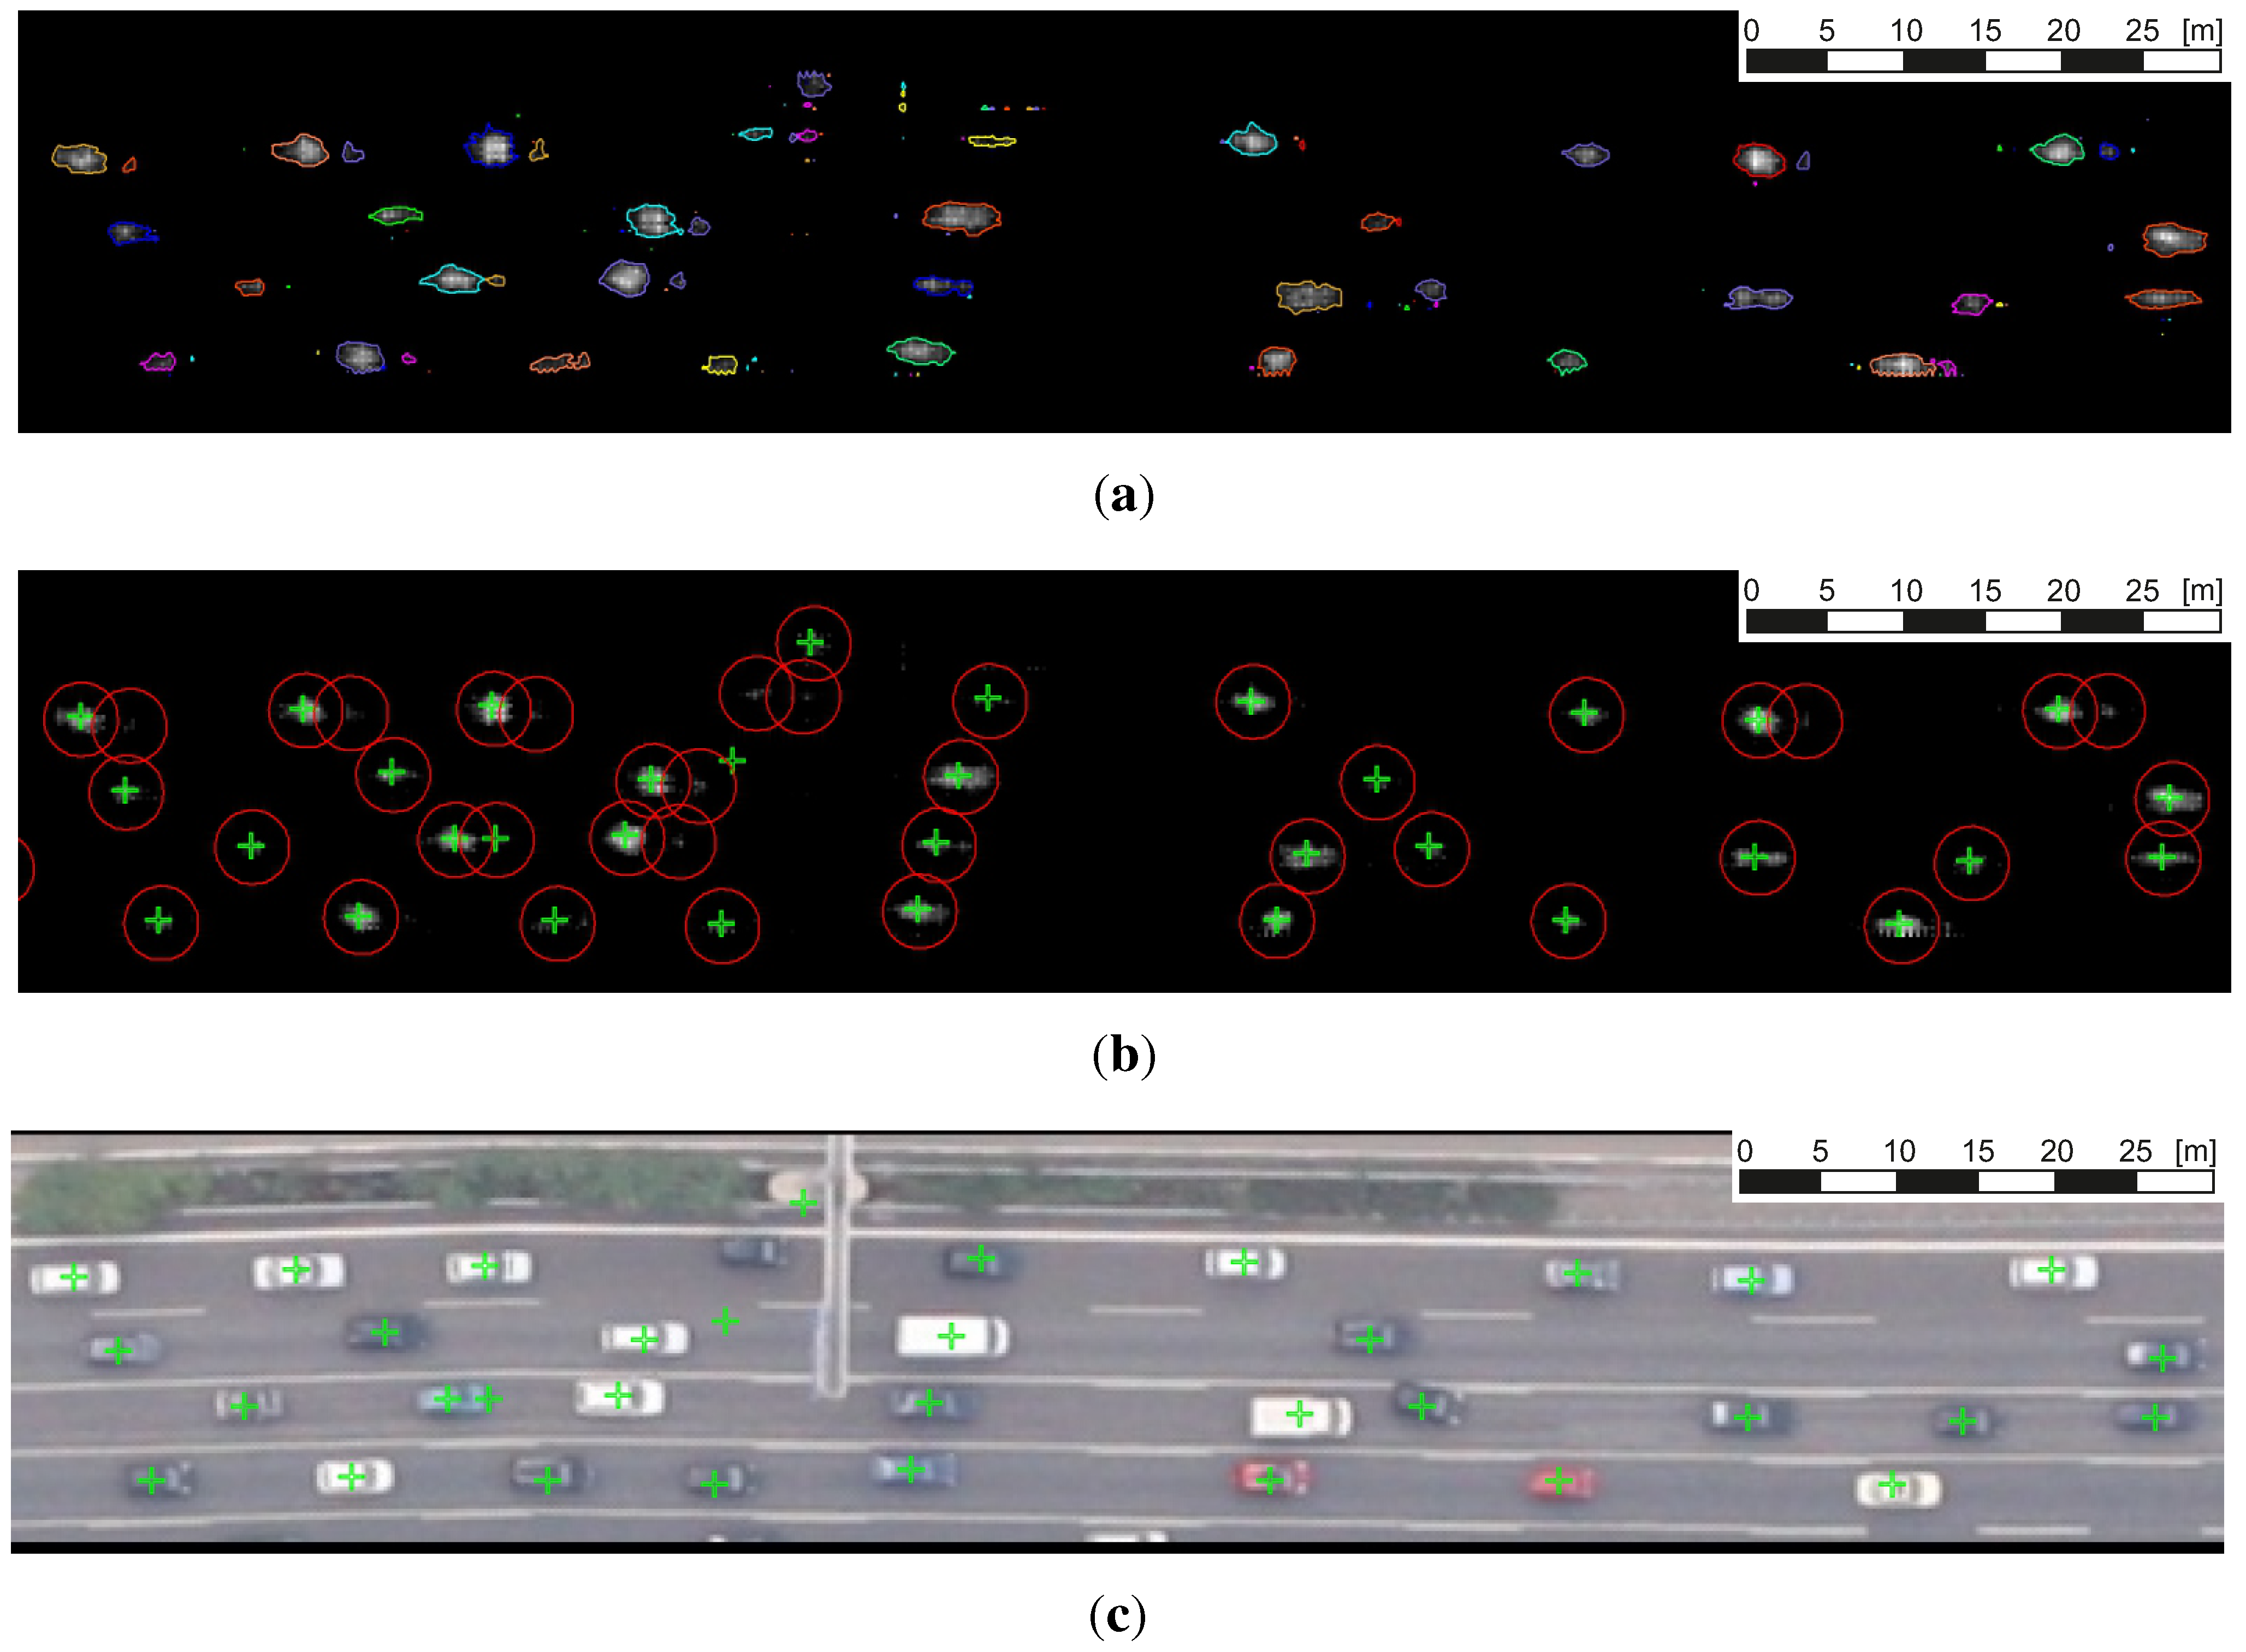
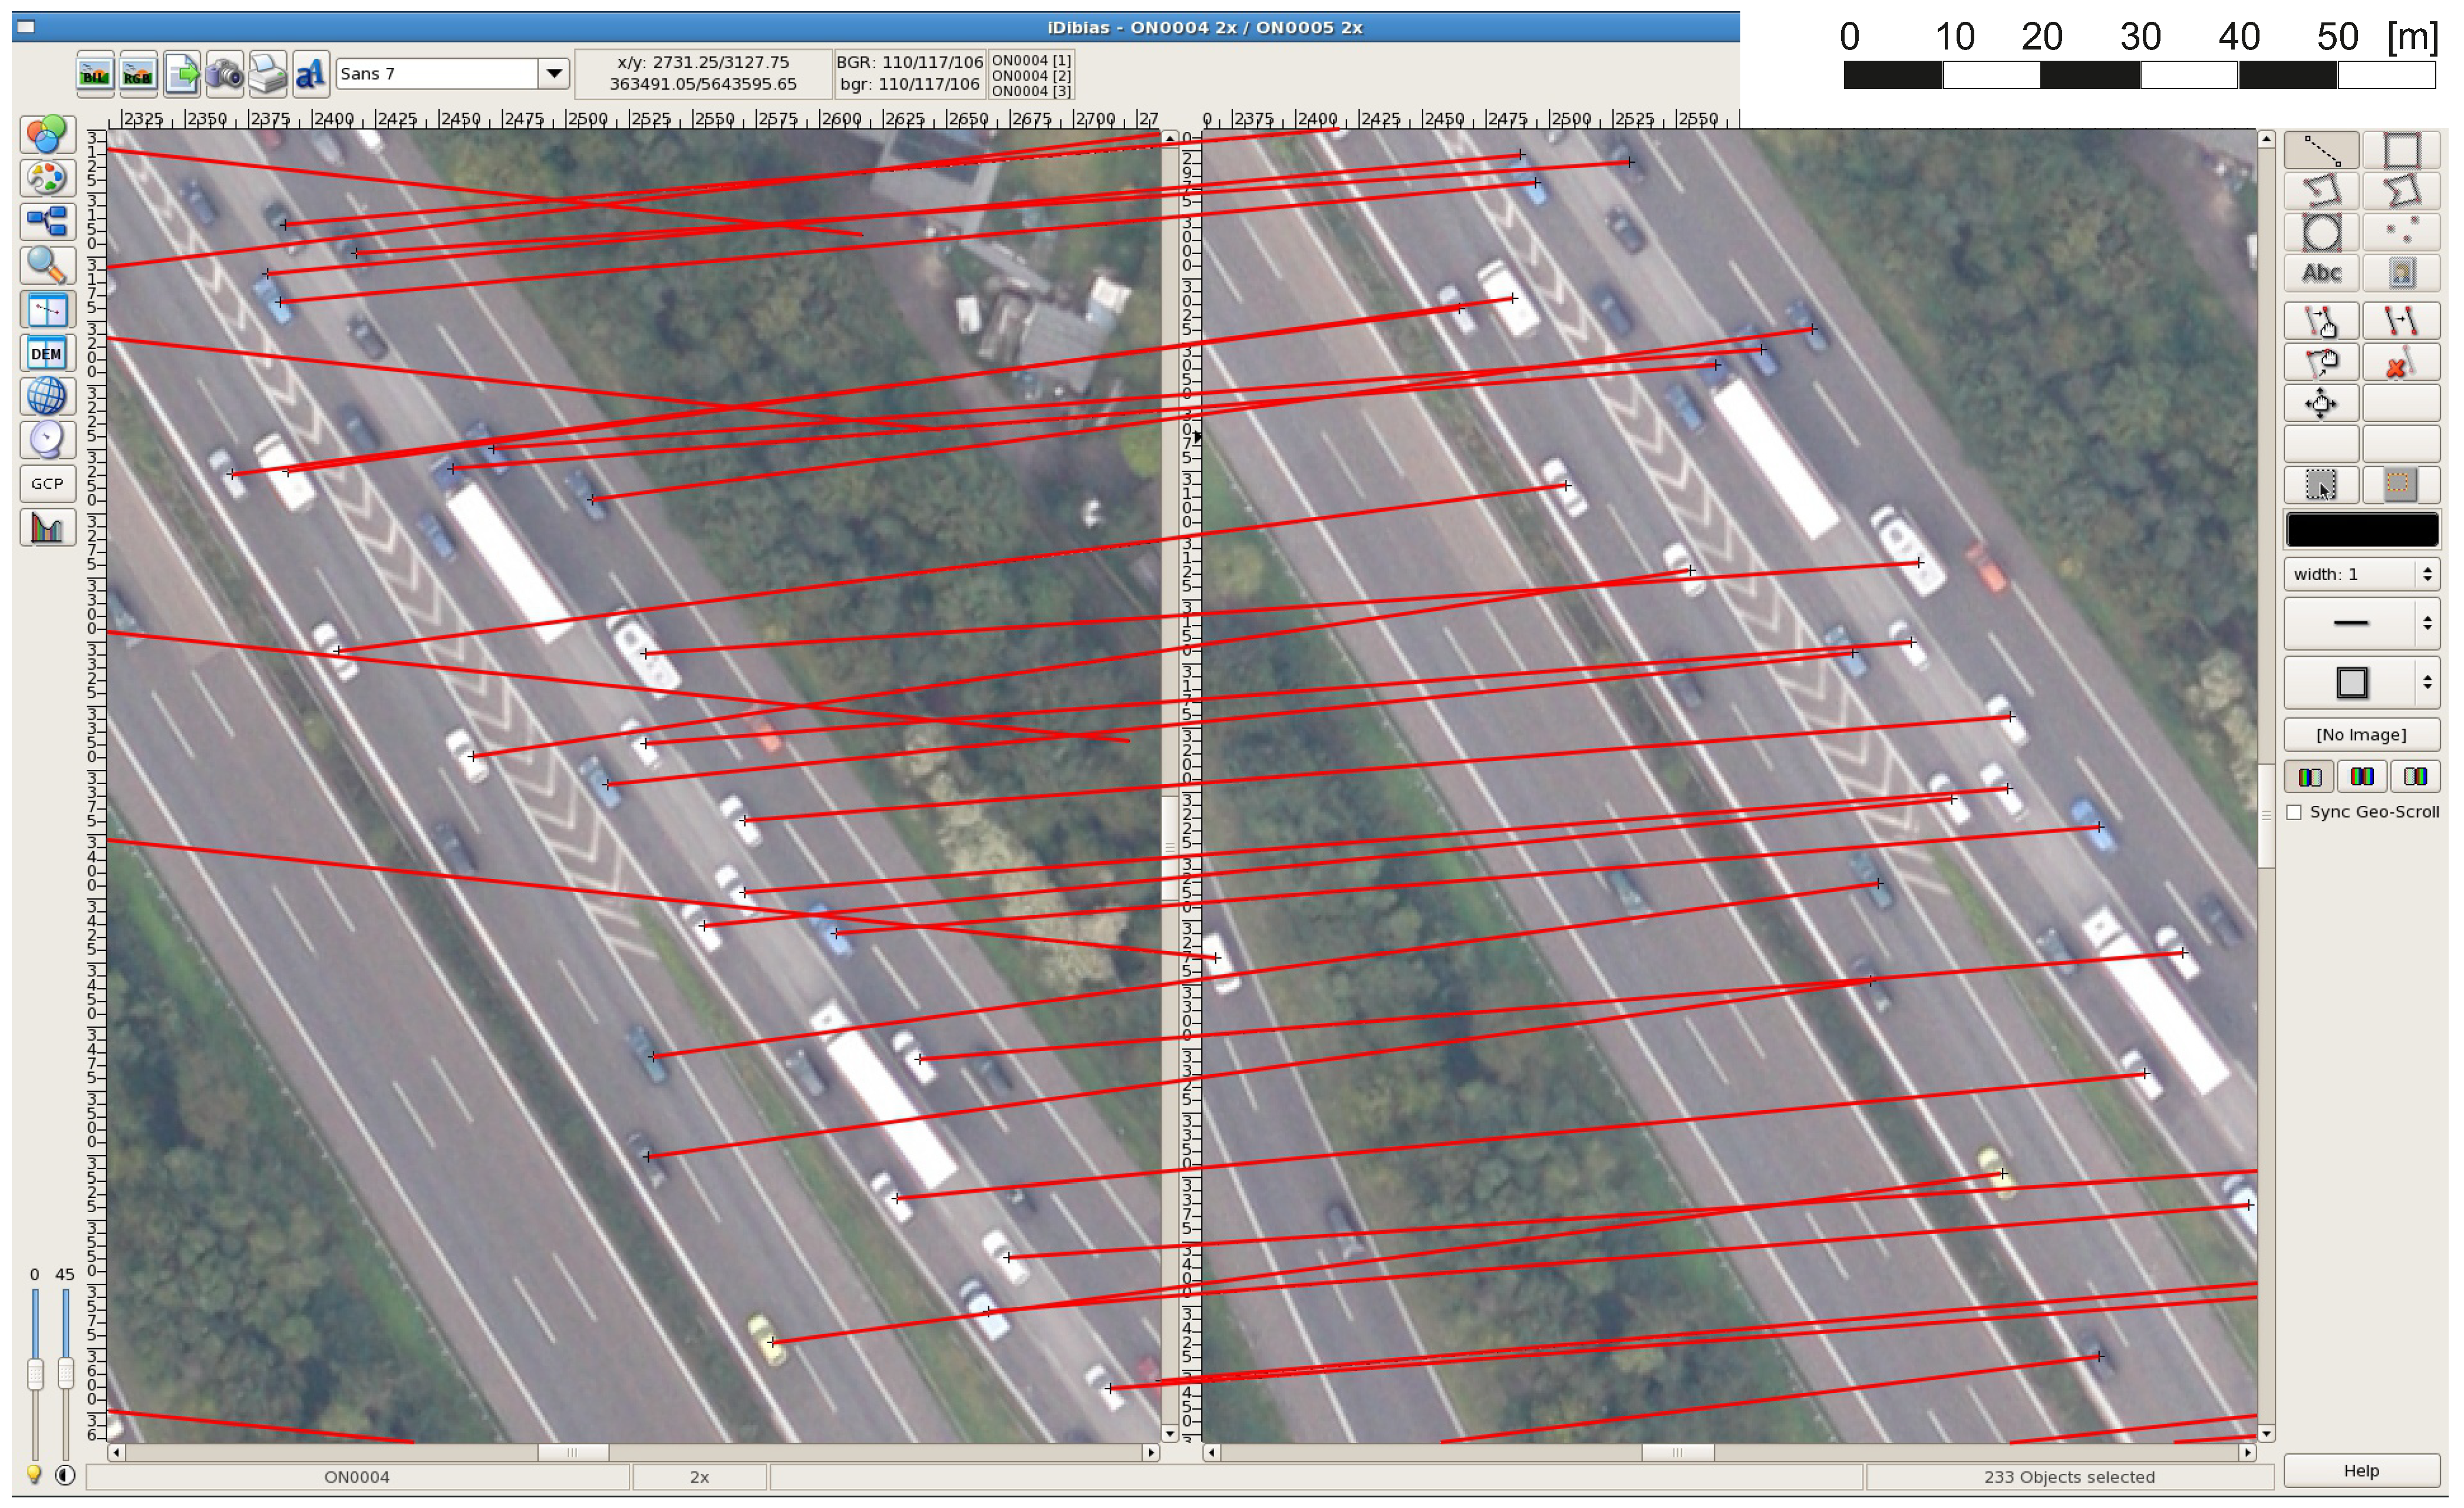
Figure 5 shows the typical result obtained from the vehicle matching operator prior to the elimination of outliers. The vehicle positions obtained after tracking are stored and can be used for a second call of the vehicle tracking module with the next image pair of the sequence.
The first step in reducing outliers is performed in the vehicle tracking module inside the aircraft. The goal is to reduce false matches in tracking, as well as false positives in detection (e.g., road markings that have been erroneously detected as vehicles). The latter may be partially revealed by a possible irregular behavior in tracking. If the direction deviation exceeds 30°, the match is refused. No direction criterion is applied below a speed threshold of 10 km/h, since inaccuracies in georeferencing may influence travel directions beyond the derivation criterion (see also
Section 5.3). The threshold value of 30° was chosen, since we already observed angles of more than 20° during lane changes in the case of congestion situations on motorways. Moreover, in intersection areas, we observed vehicles with up to a 30° deviation from the straight driving direction, which need to be detected by our rotation variant vehicle detector (
Section 3.2). ASCII data files containing the corrected tracking results are transferred to the ground instantaneously via a radio link system. Since the radio link may be working at full capacity due to the images being sent to the ground, ASCII files with traffic data are highly prioritized in order to keep the traffic data highly current.
Further outlier reduction is performed on the ground due to limited processing power on-board the aircraft. A fuzzy logic is applied for this purpose, as described in [
42]. In summary, vehicle velocities are evaluated with respect to the state of traffic and the distance to or from the next intersection. For example, if a vehicle is far from an intersection and its velocity is significantly below the average of the free flowing traffic situation around the car, it is rejected. If the image burst sequence consists of more than two consecutive images, a further validation of plausibility for each vehicle trajectory is performed at the ground station. The time derivatives of velocity and direction are checked for plausibility for each vehicle track. If the acceleration, deceleration or direction change leaves physically realistic value ranges, the vehicle trajectory is assumed to be an outlier and removed from the traffic data. The thresholds for the maximum acceleration and deceleration allowed are set to 5 m/s
2 and 10 m/s
2. The maximum acceleration is a typical value for a premium car, like the Porsche Cayenne Turbo or Jaguar XKR Coupe (0–100 km/h) [
82]. The maximum deceleration is a typical value for a premium car (e.g., Mercedes CLK 430 or Chevrolet Corvette, 100–0 km/h) [
82]. For direction change, a maximum of 8°/s (0.1396 rad/s) is allowed. This value is due to the following assumptions. The minimum curve radius for European motorways with a recommended speed of 80 km/h is 240 m (e.g., [
83]). This corresponds to a lateral acceleration of 2 m/s
2. In [
84], the measured velocity
v85% in bends with a radius of 240 m is 92 km/h is shown. This corresponds to a lateral acceleration of 2.8 m/s
2. In order to additionally catch the 15% of drivers driving faster than 92 km/h, we assume an additional 20% and an additionally constant of 10 km/h for the 92 km/h, as described before. Totally, we assume for a bend with a 240-m radius a maximum speed of 120 km/h. This value leads to a rate of turn of 7.95°/s, which we rounded to 8°/s. This corresponds to a lateral acceleration of 4.6 m/s
2.
At the ground station, traffic data obtained by the airborne camera system are prepared for use in a traffic portal or GIS. This is done by assigning each vehicle to its nearest Navteq road section while taking into account that its driving direction has to correspond to the direction of the respective Navteq section. If the vehicle cannot be allocated to any road axis, it is assumed to be an outlier and rejected. This outlier correction does not influence the behavior of the traffic data extraction at intersections. This is due to the following fact. Since the vehicle detector is sensitive to driving directions, we cannot detect vehicles which have a direction angle of more than around 30°/s for any Navteq road axis. Nevertheless, vehicles lost due to this property of the vehicle detector are rare in practice. An average vehicle density and velocity is calculated for each Navteq segment located in the first image of a burst. This spatially aggregated data represent the road level-of-service. Single vehicle trajectories can be used after fusion with the traffic information recorded by ground-based sensor networks for the initialization of traffic simulations (e.g., [
14]).
Figure 5.
Typical matching result of the vehicle tracking algorithm between the first (left) and second image (right) of a camera burst (example from the nadir camera, Cologne campaign on 17 September 2011).
Figure 5.
Typical matching result of the vehicle tracking algorithm between the first (left) and second image (right) of a camera burst (example from the nadir camera, Cologne campaign on 17 September 2011).


