Detecting Large-Scale Landslides Using Lidar Data and Aerial Photos in the Namasha-Liuoguey Area, Taiwan

Abstract
:1. Introduction
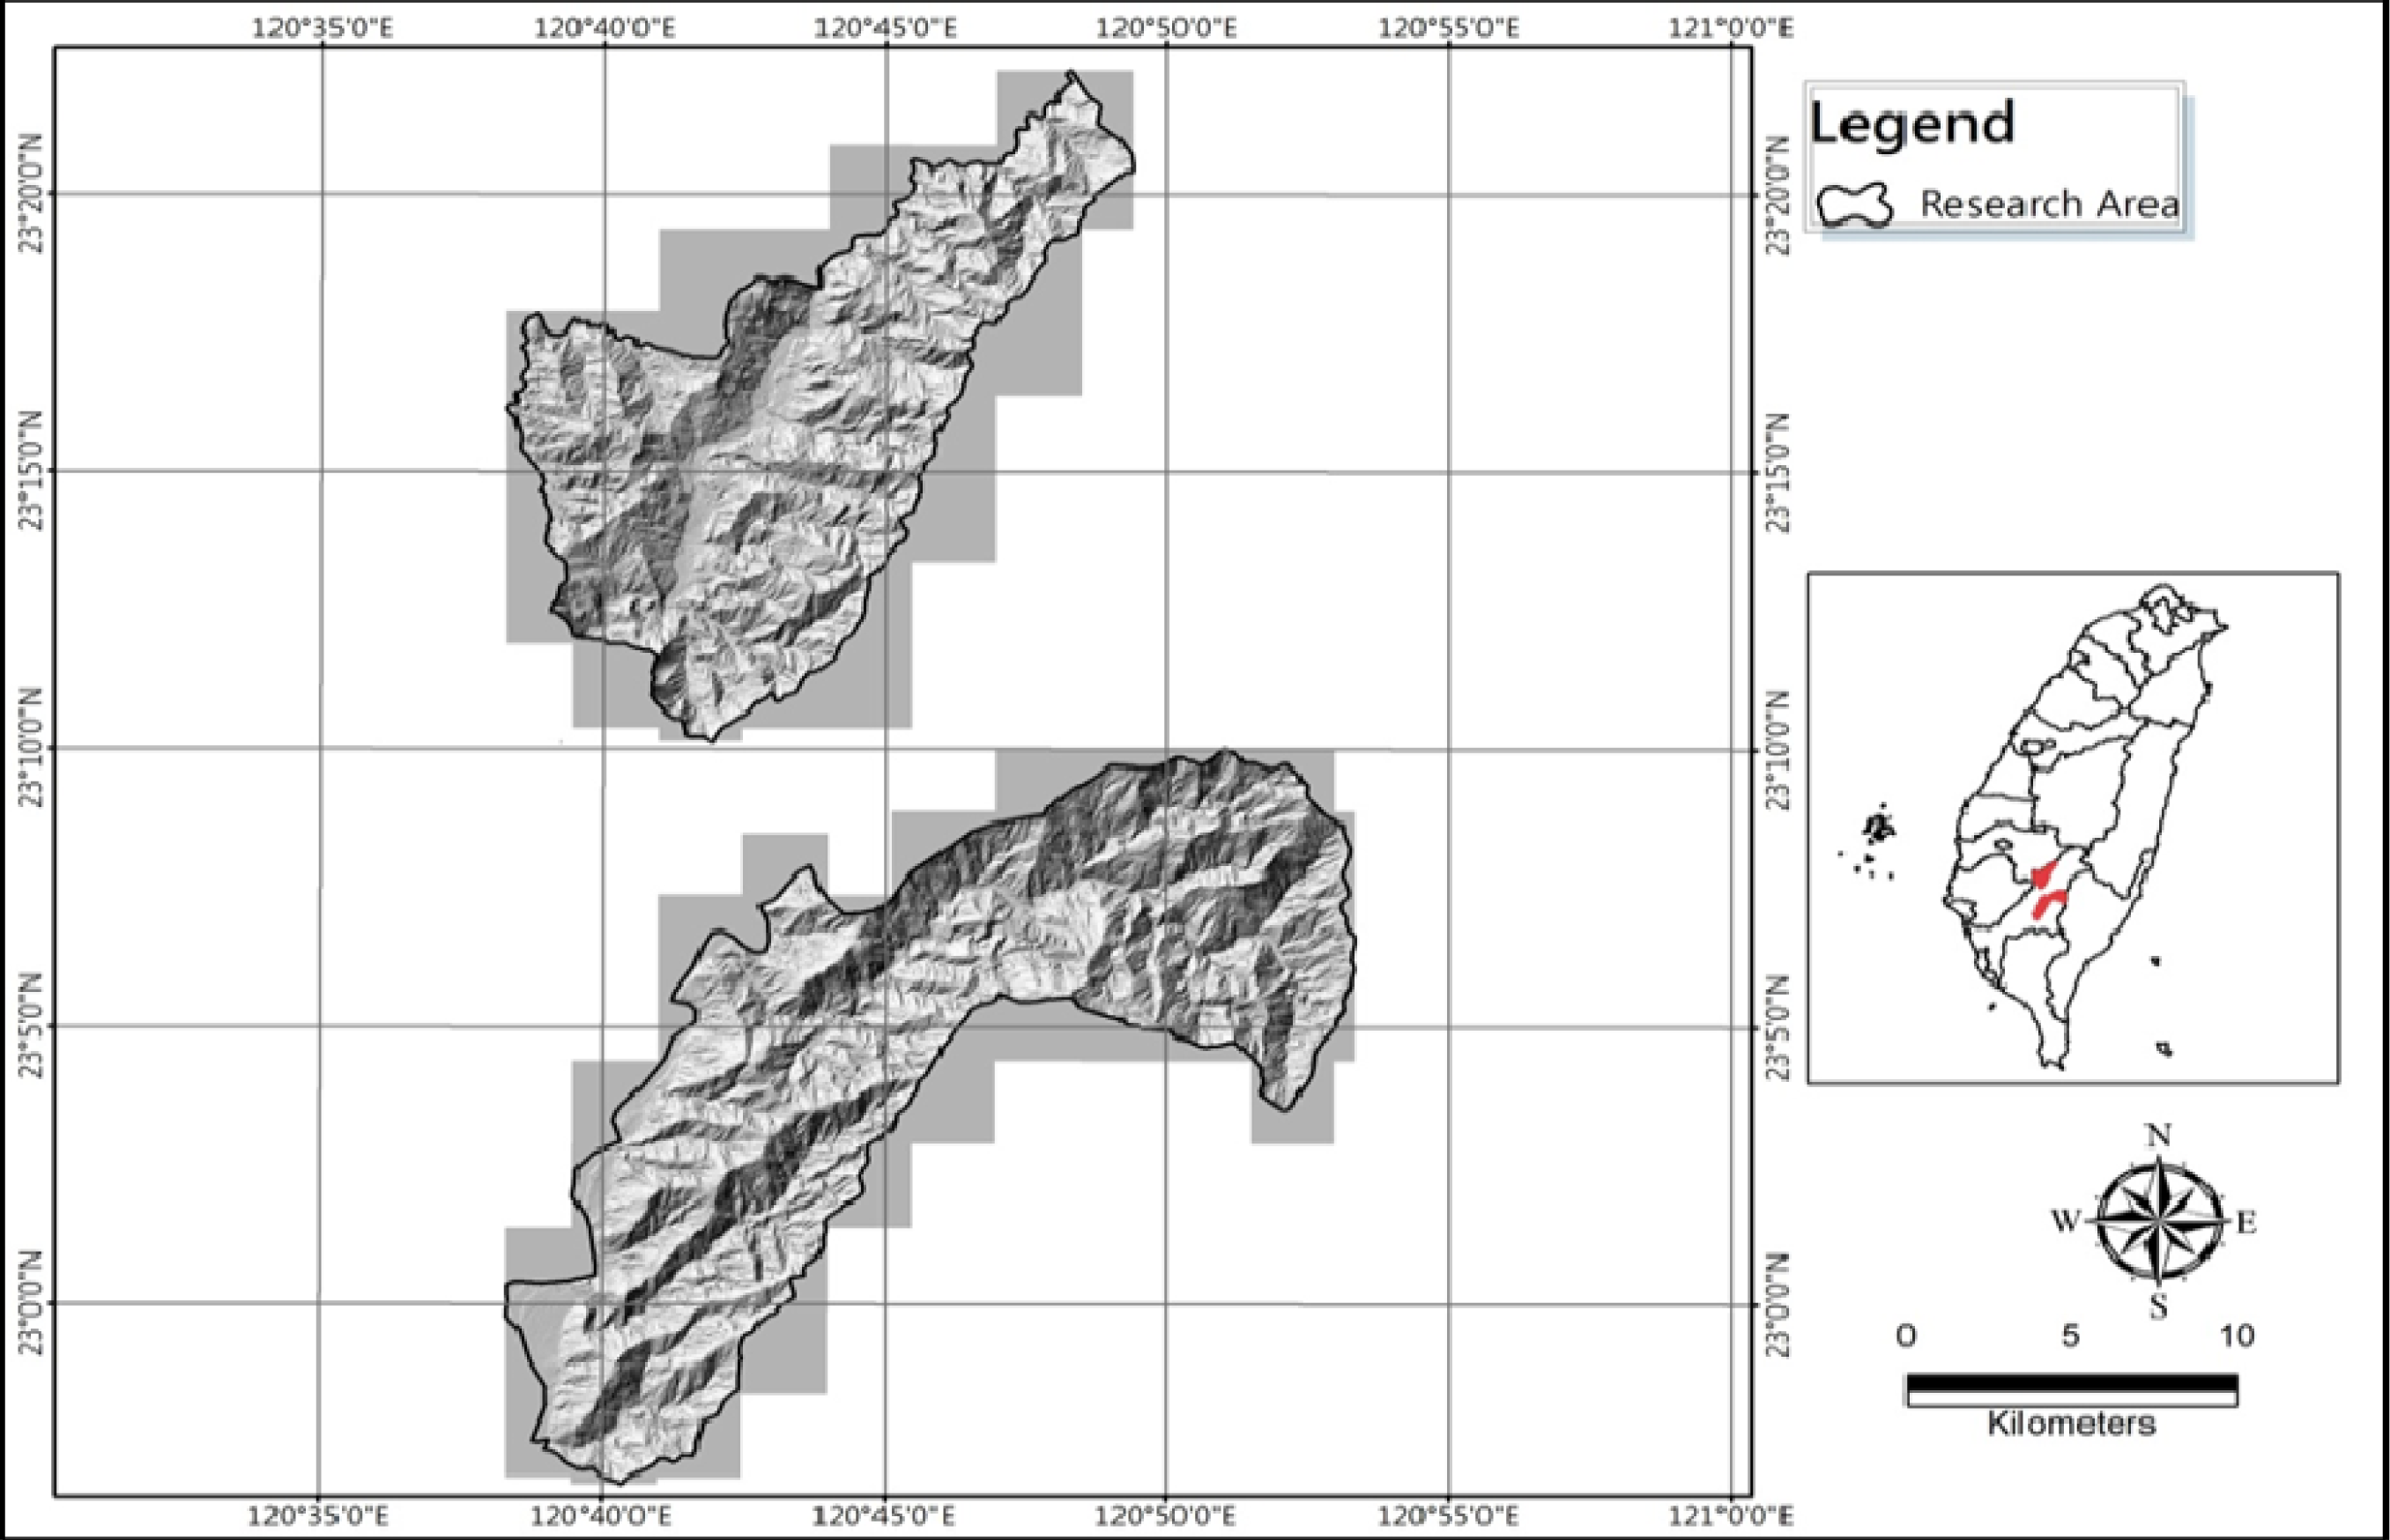
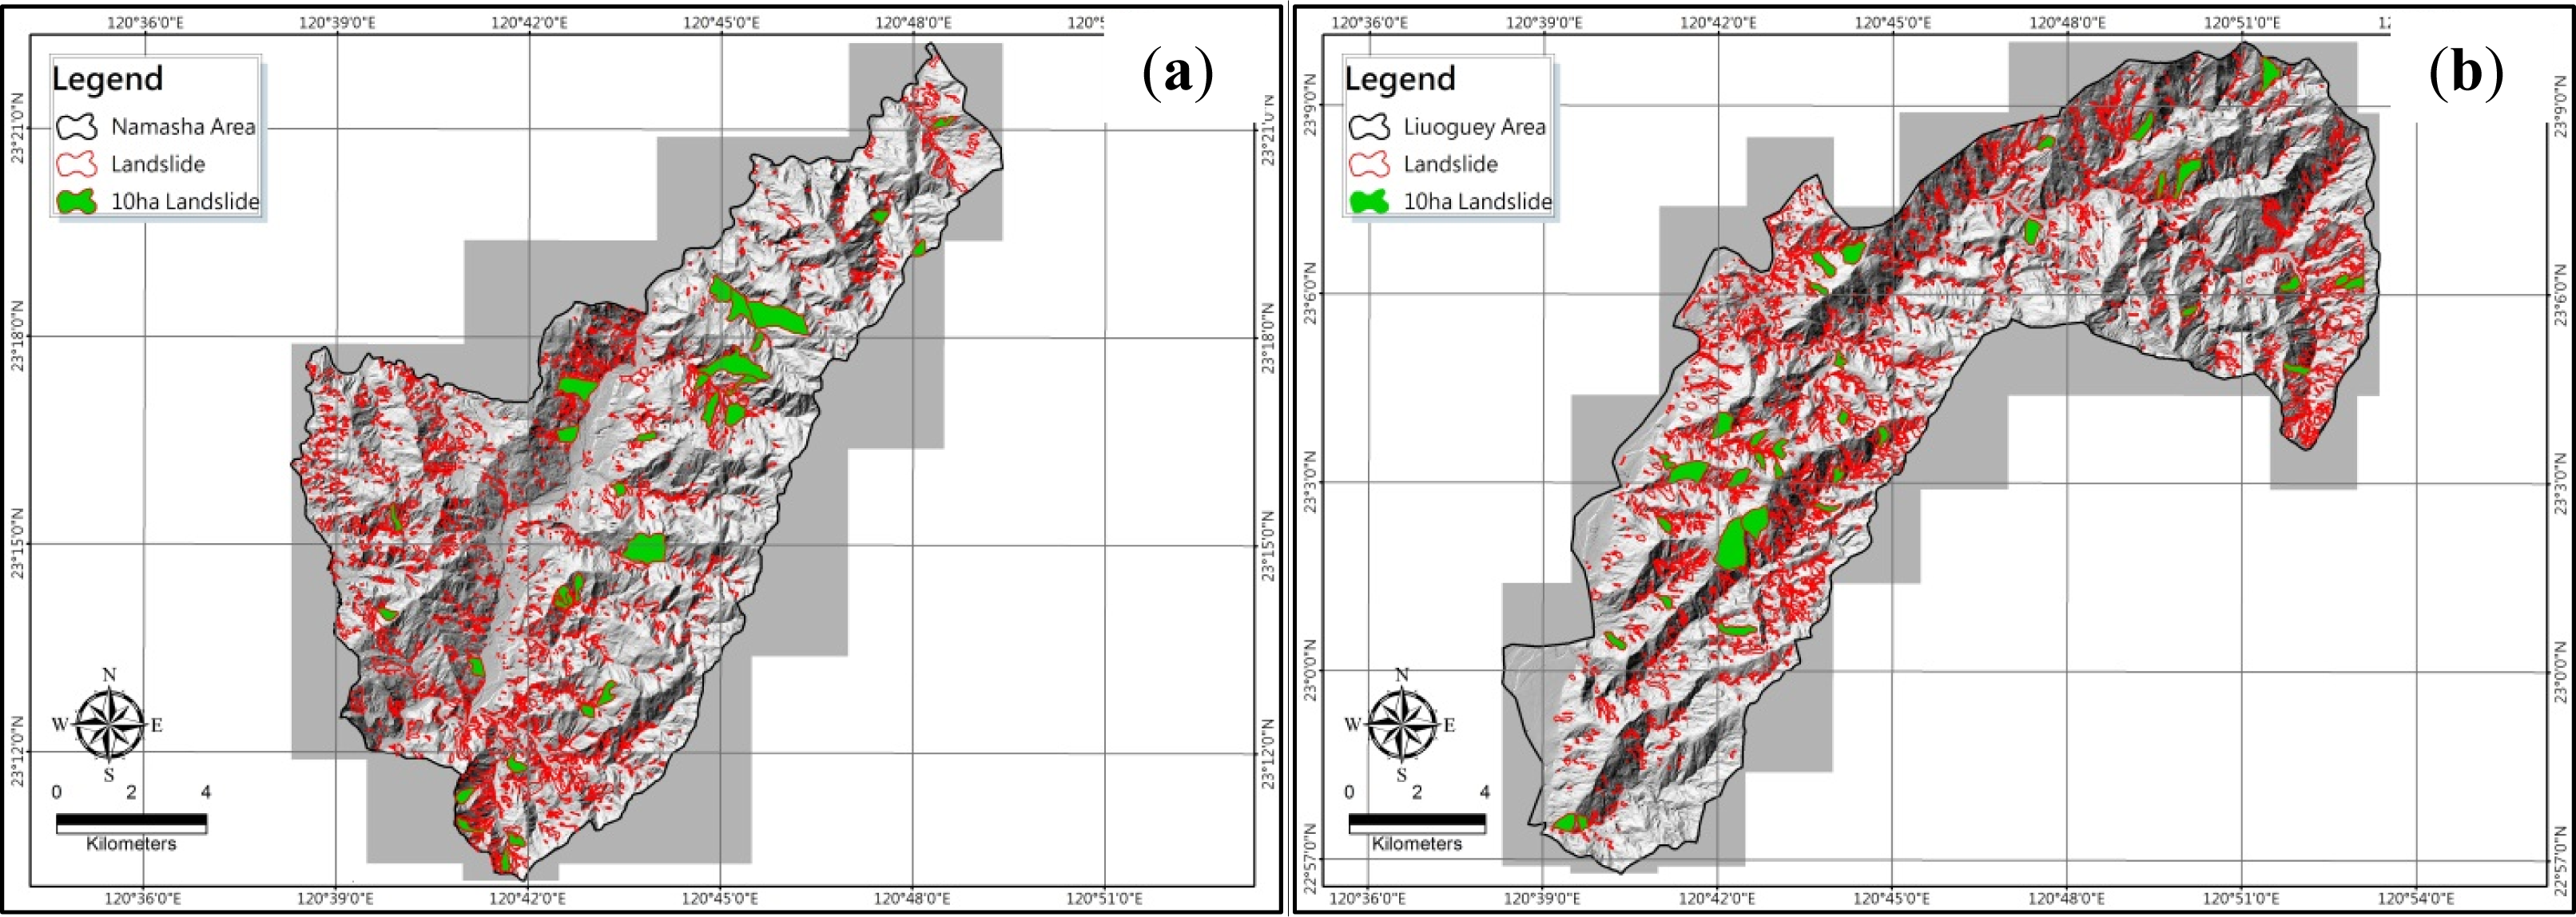
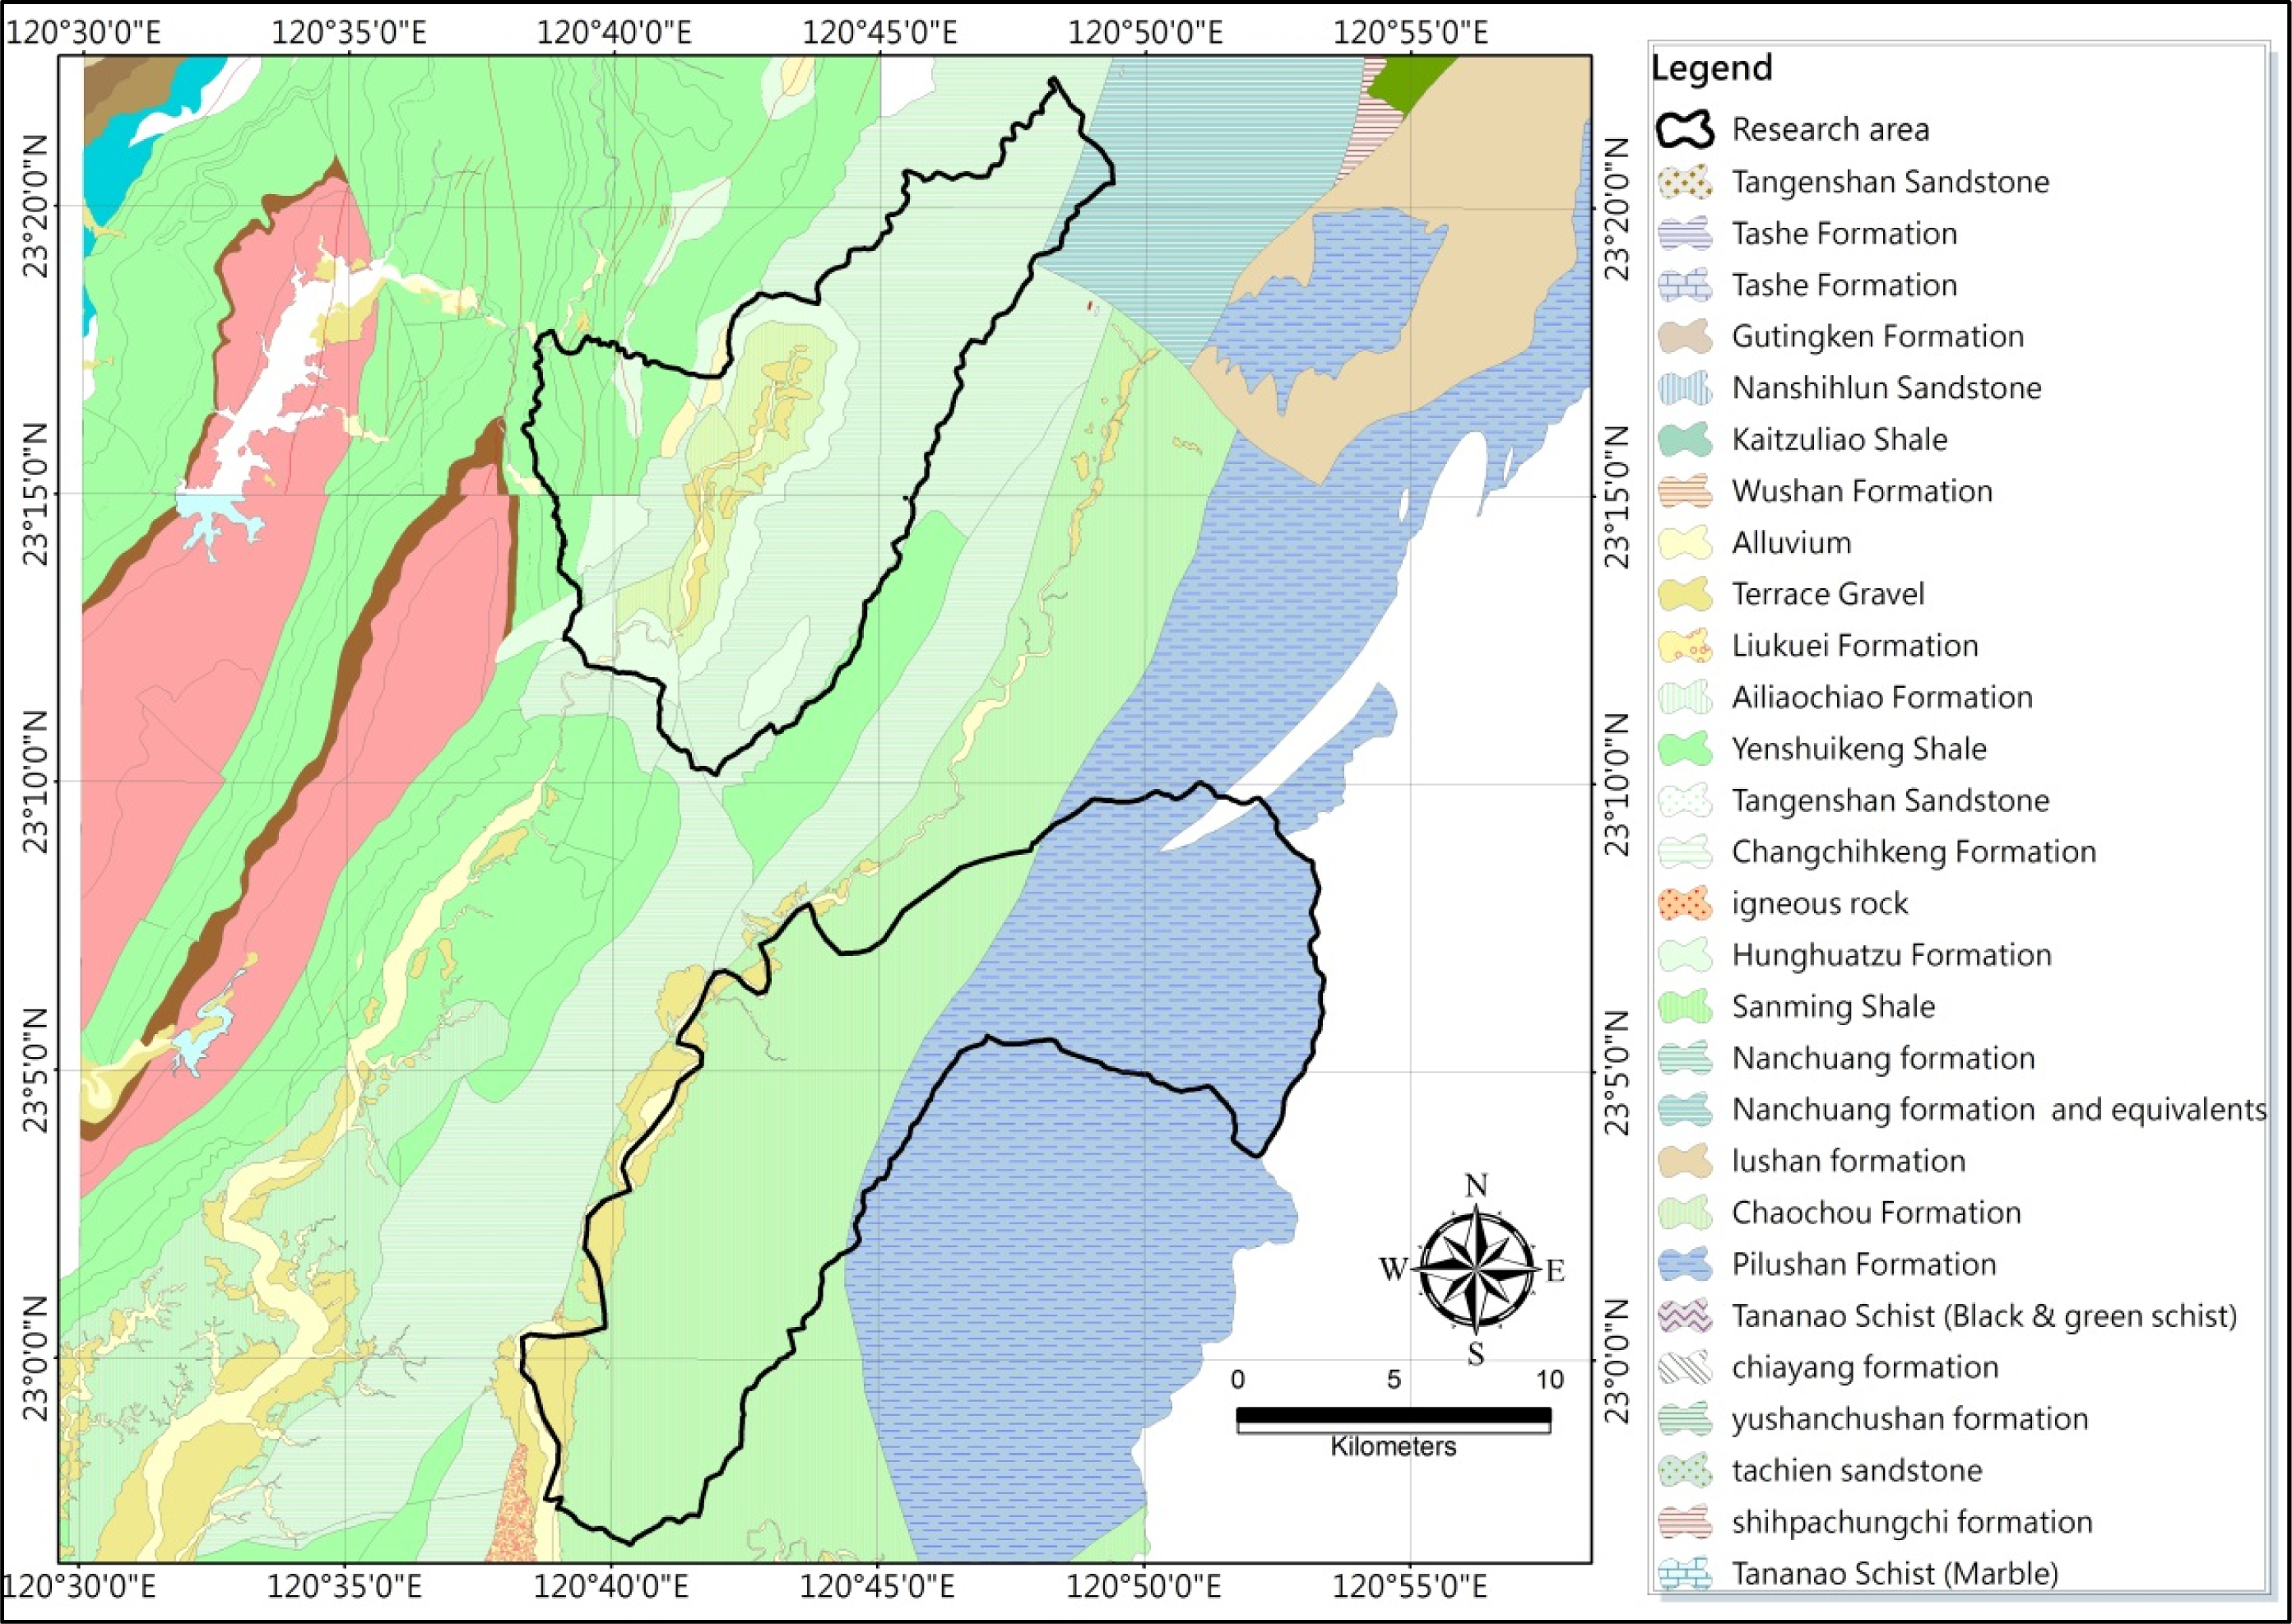
2. Study Area
3. Large-Scale Landslide Detection Using Lidar Data
3.1. Classification of Large-Scale Landslides
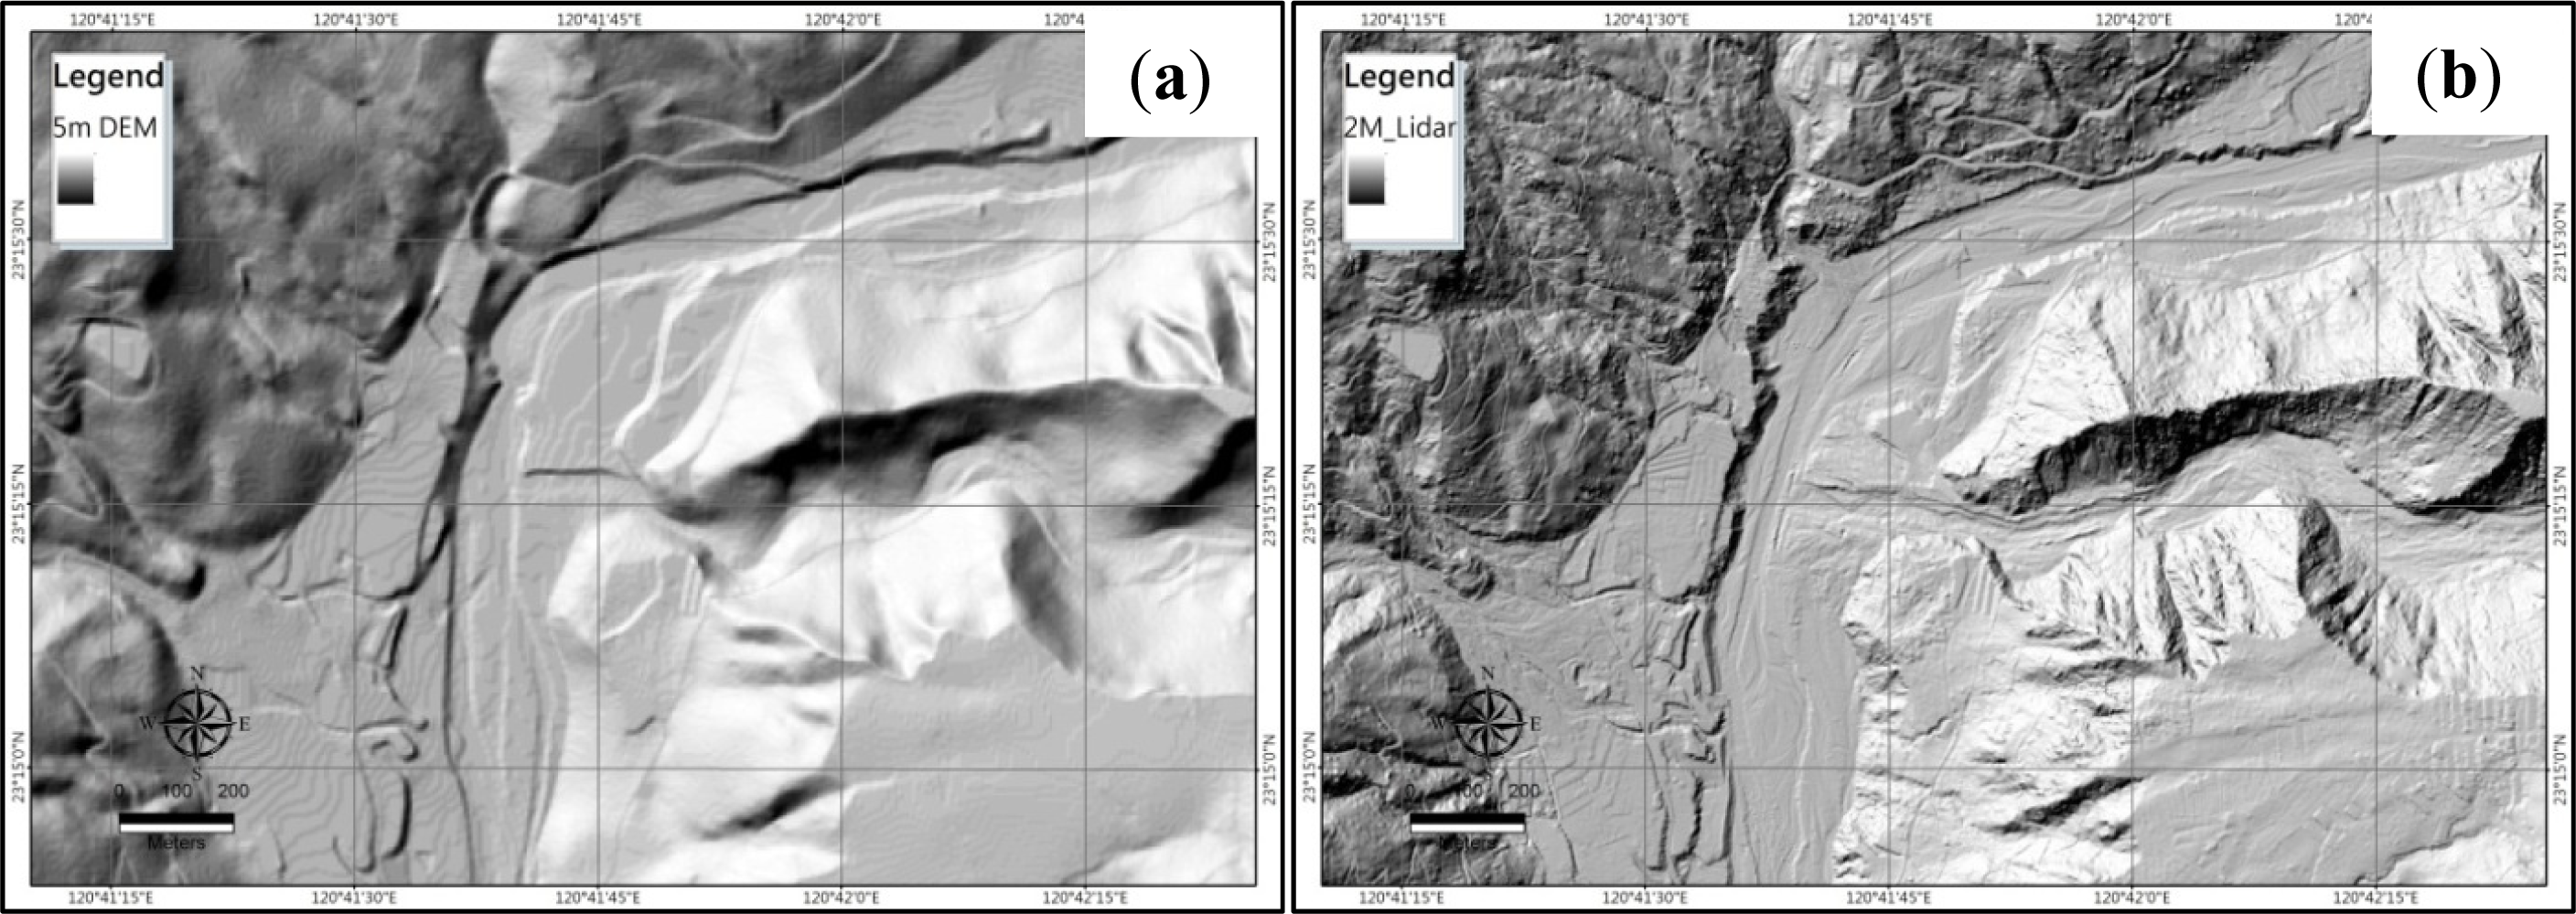
3.2. The Resolution of Lidar DEM Data
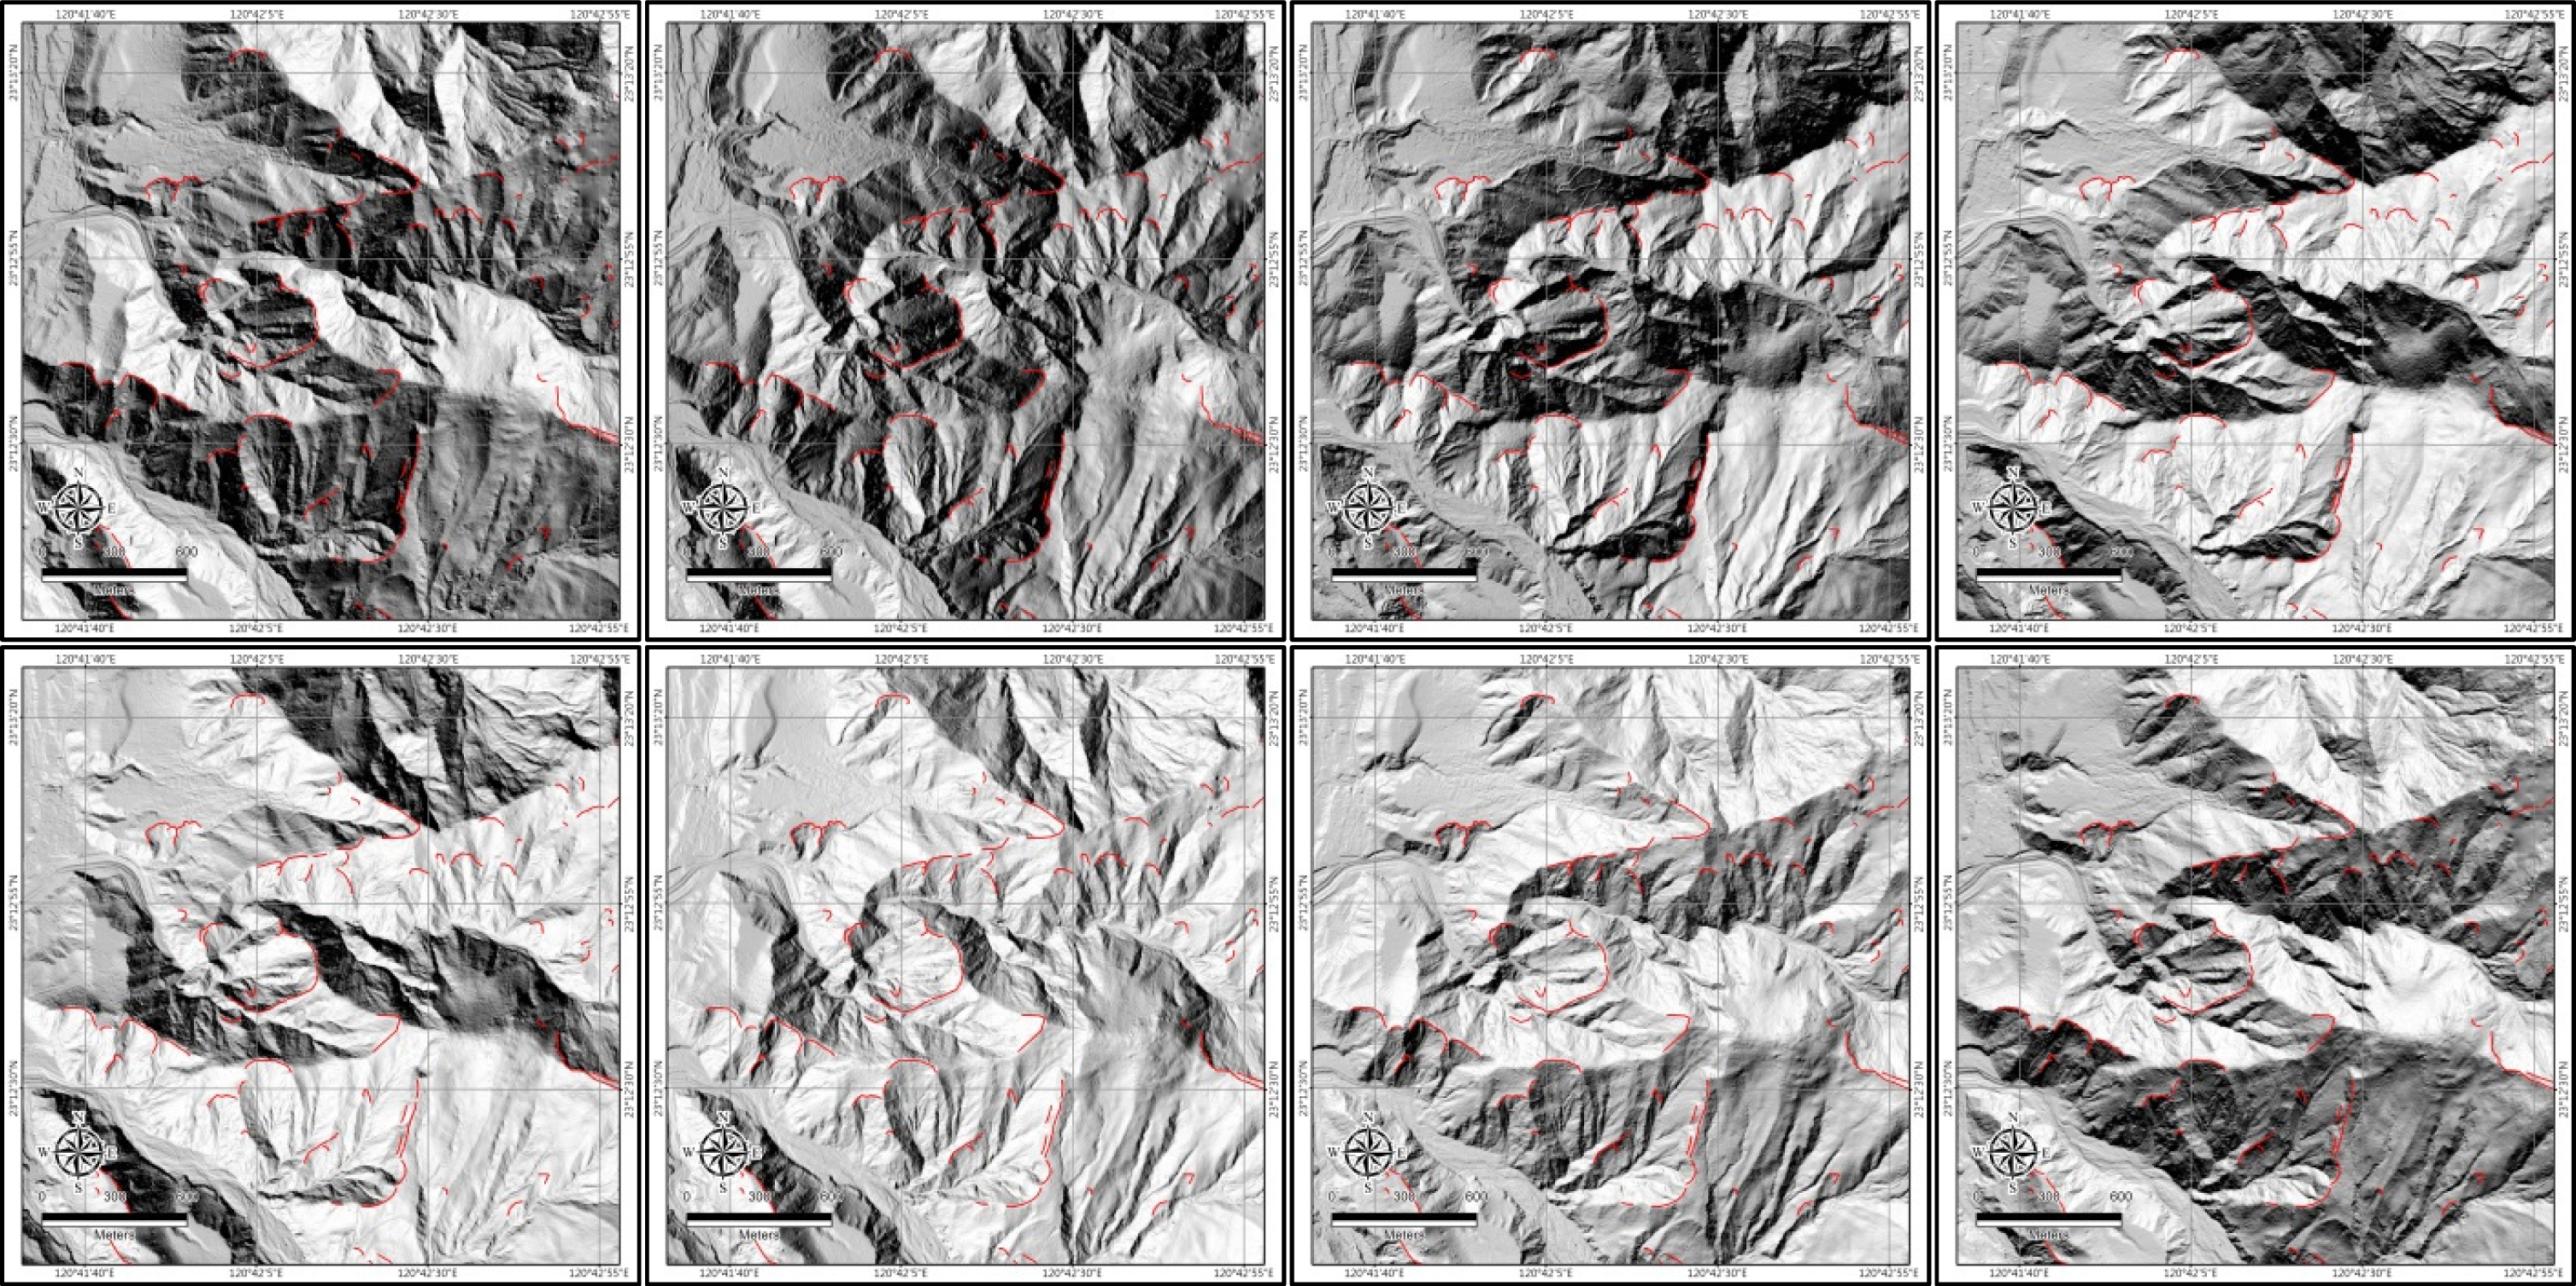
3.3. Detection of Large-Scale Landslides
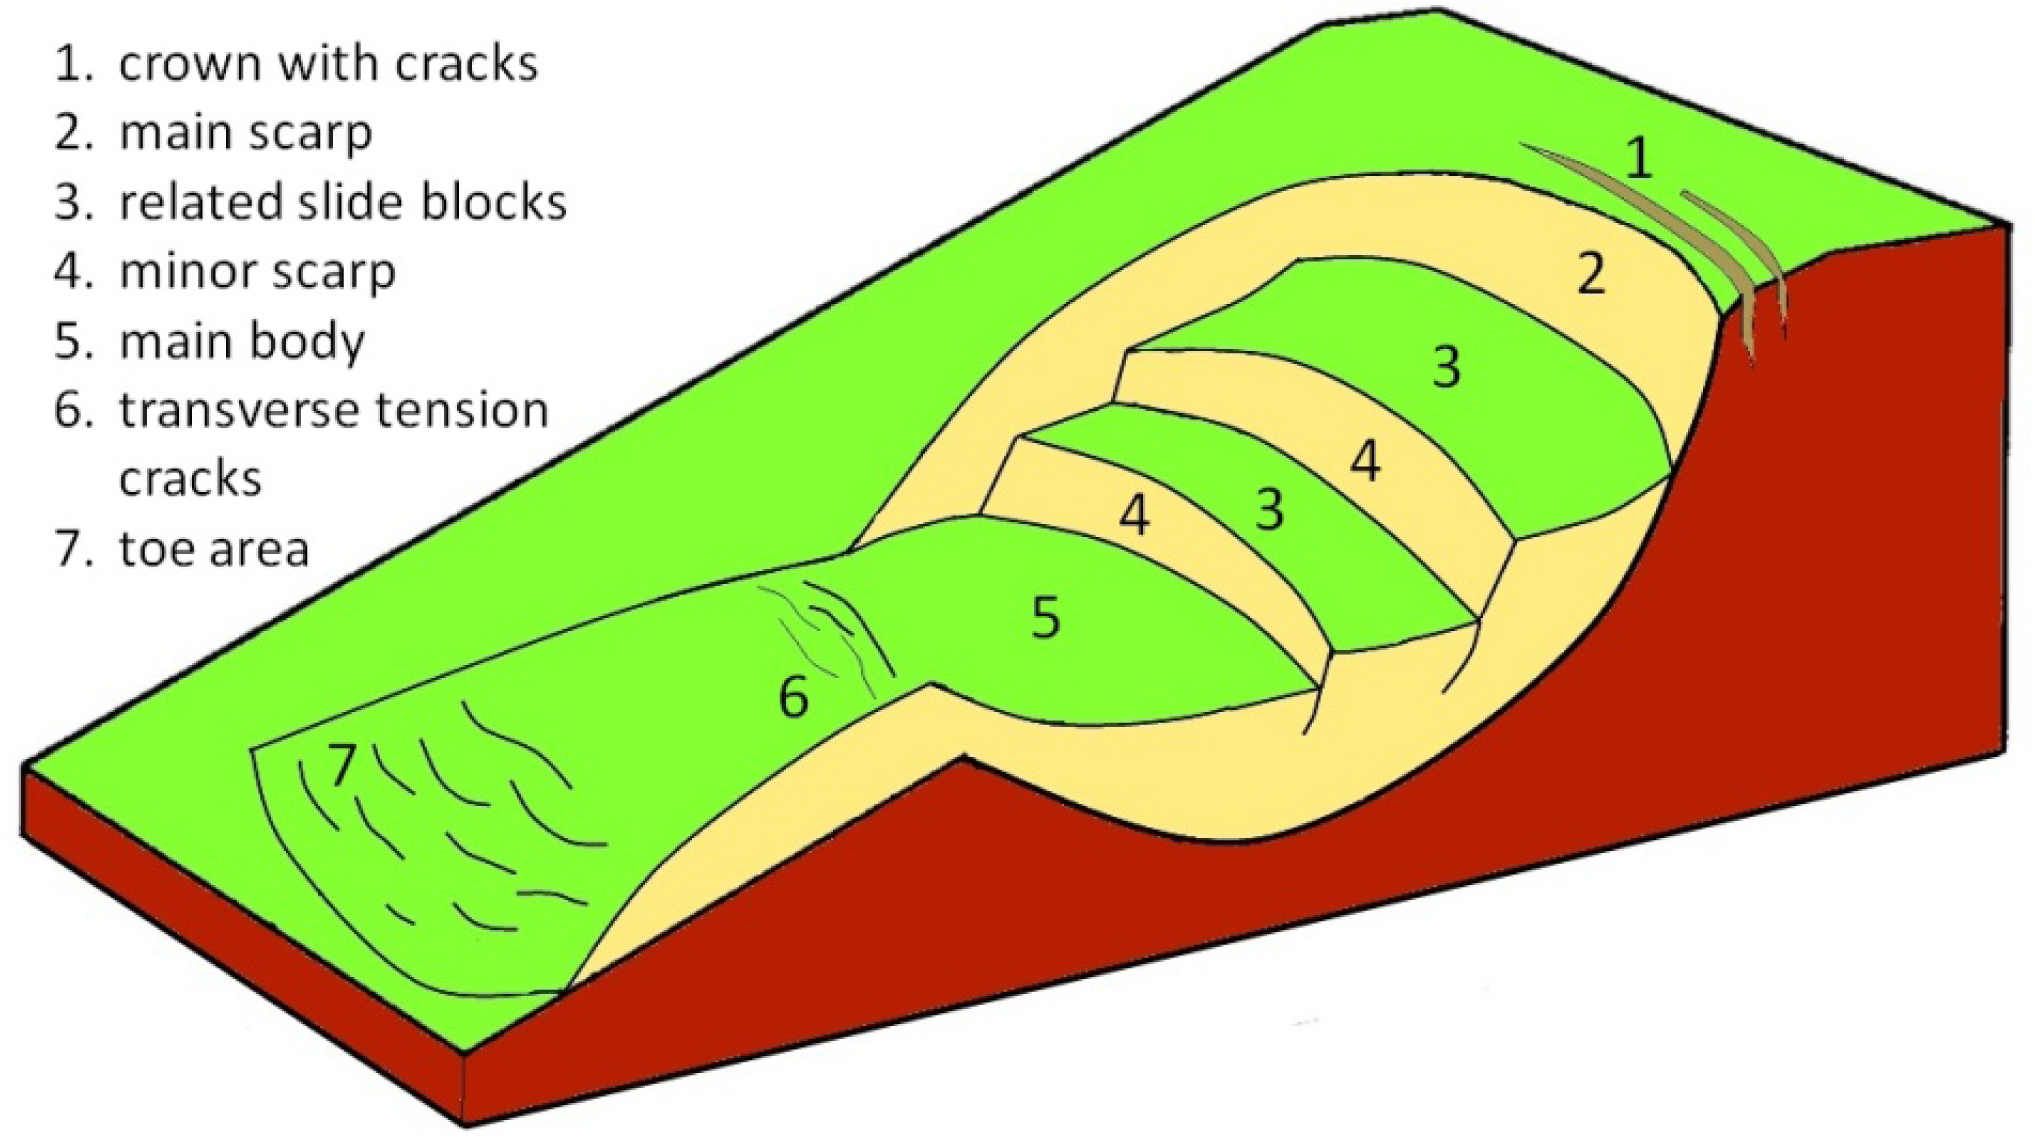
- (1)
- Crown: the top of the large-scale landslide with tension cracks.
- (2)
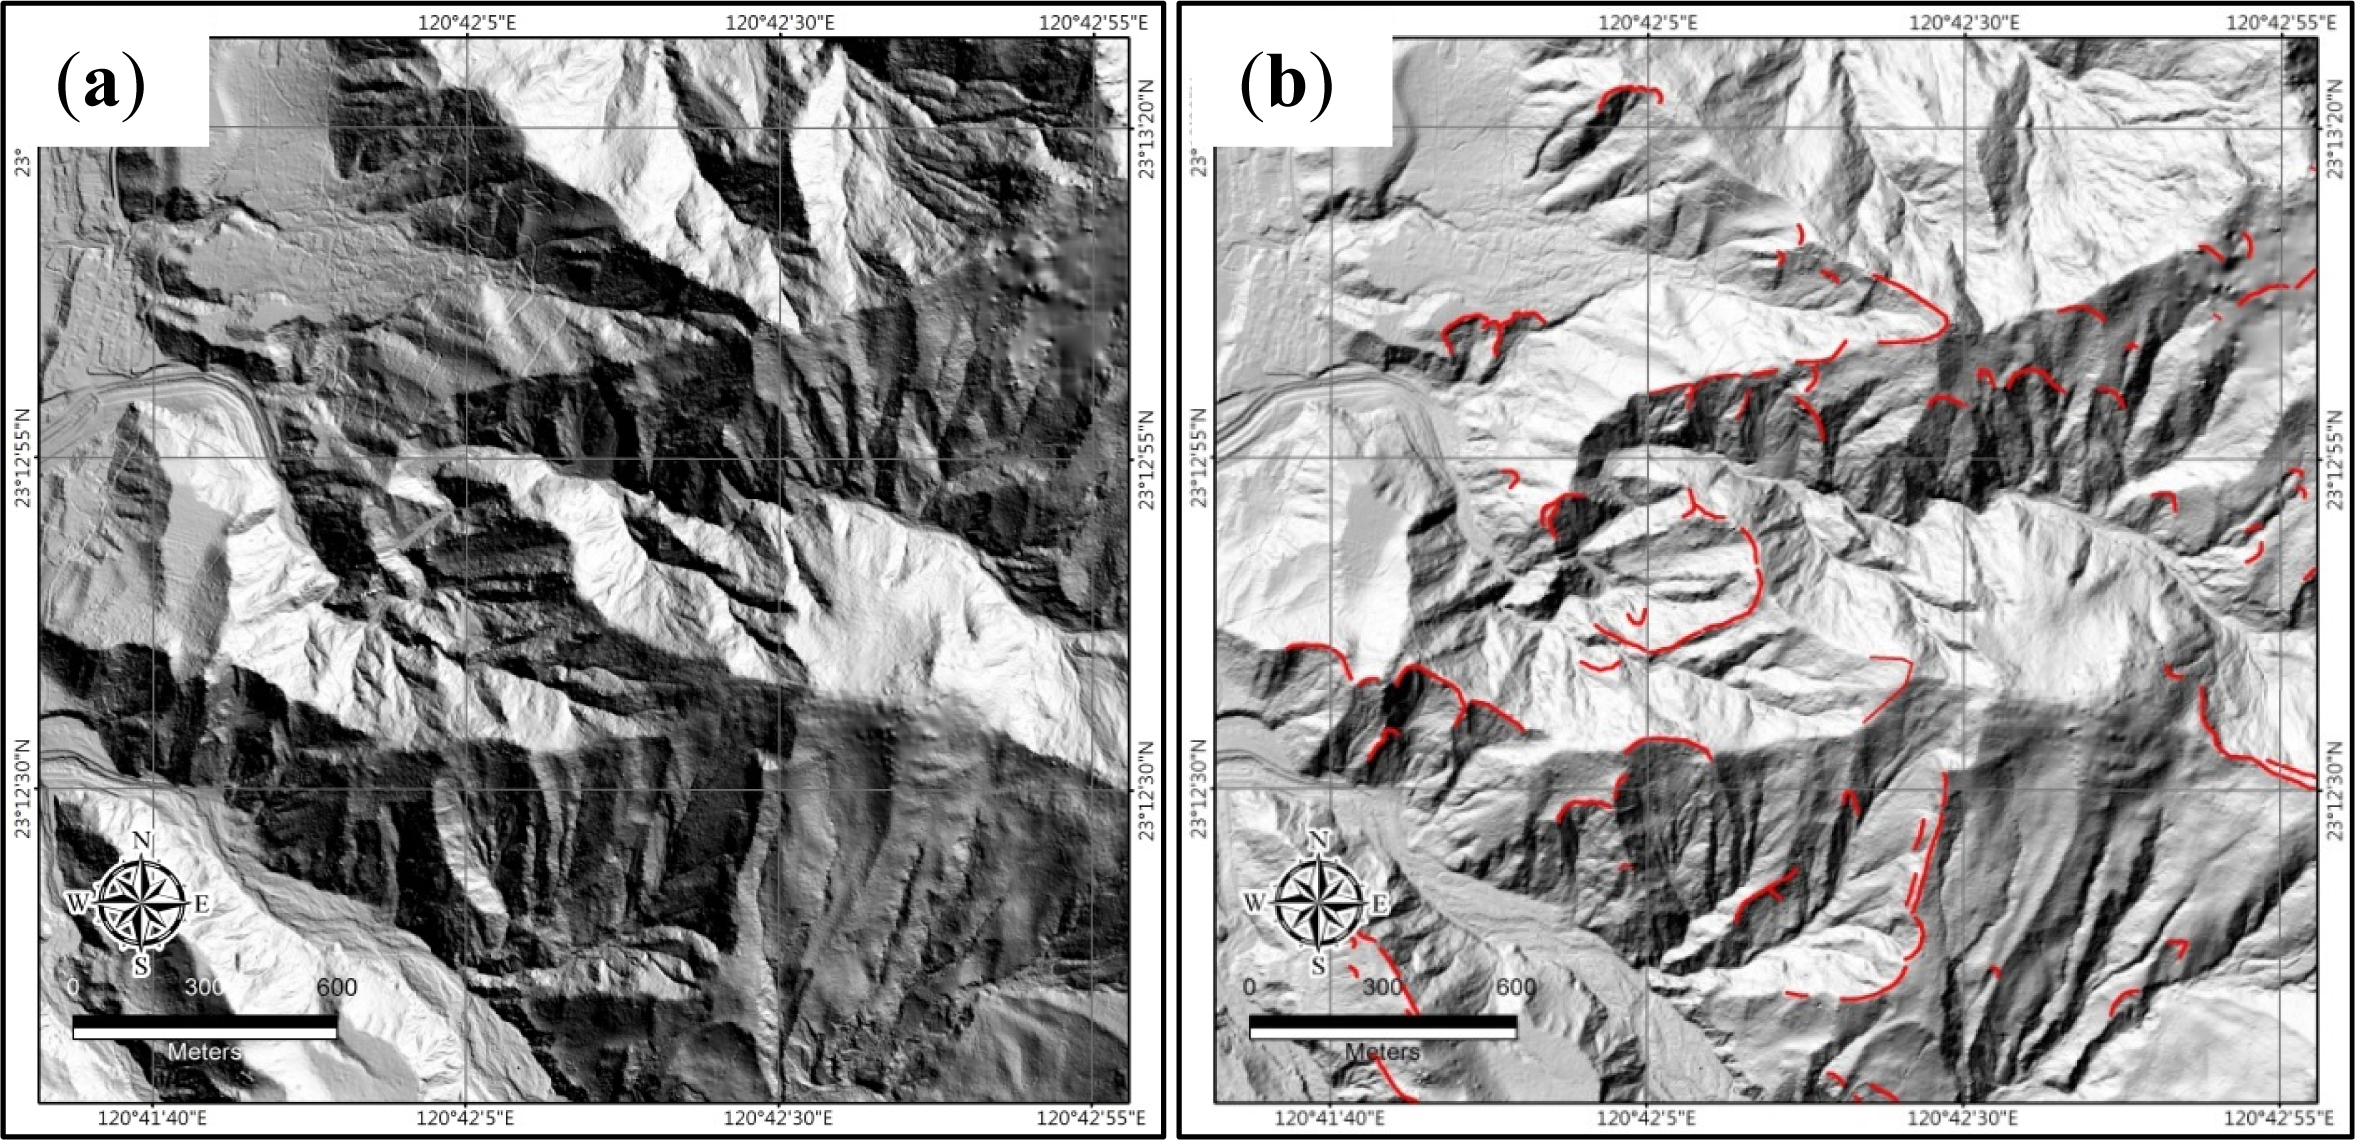
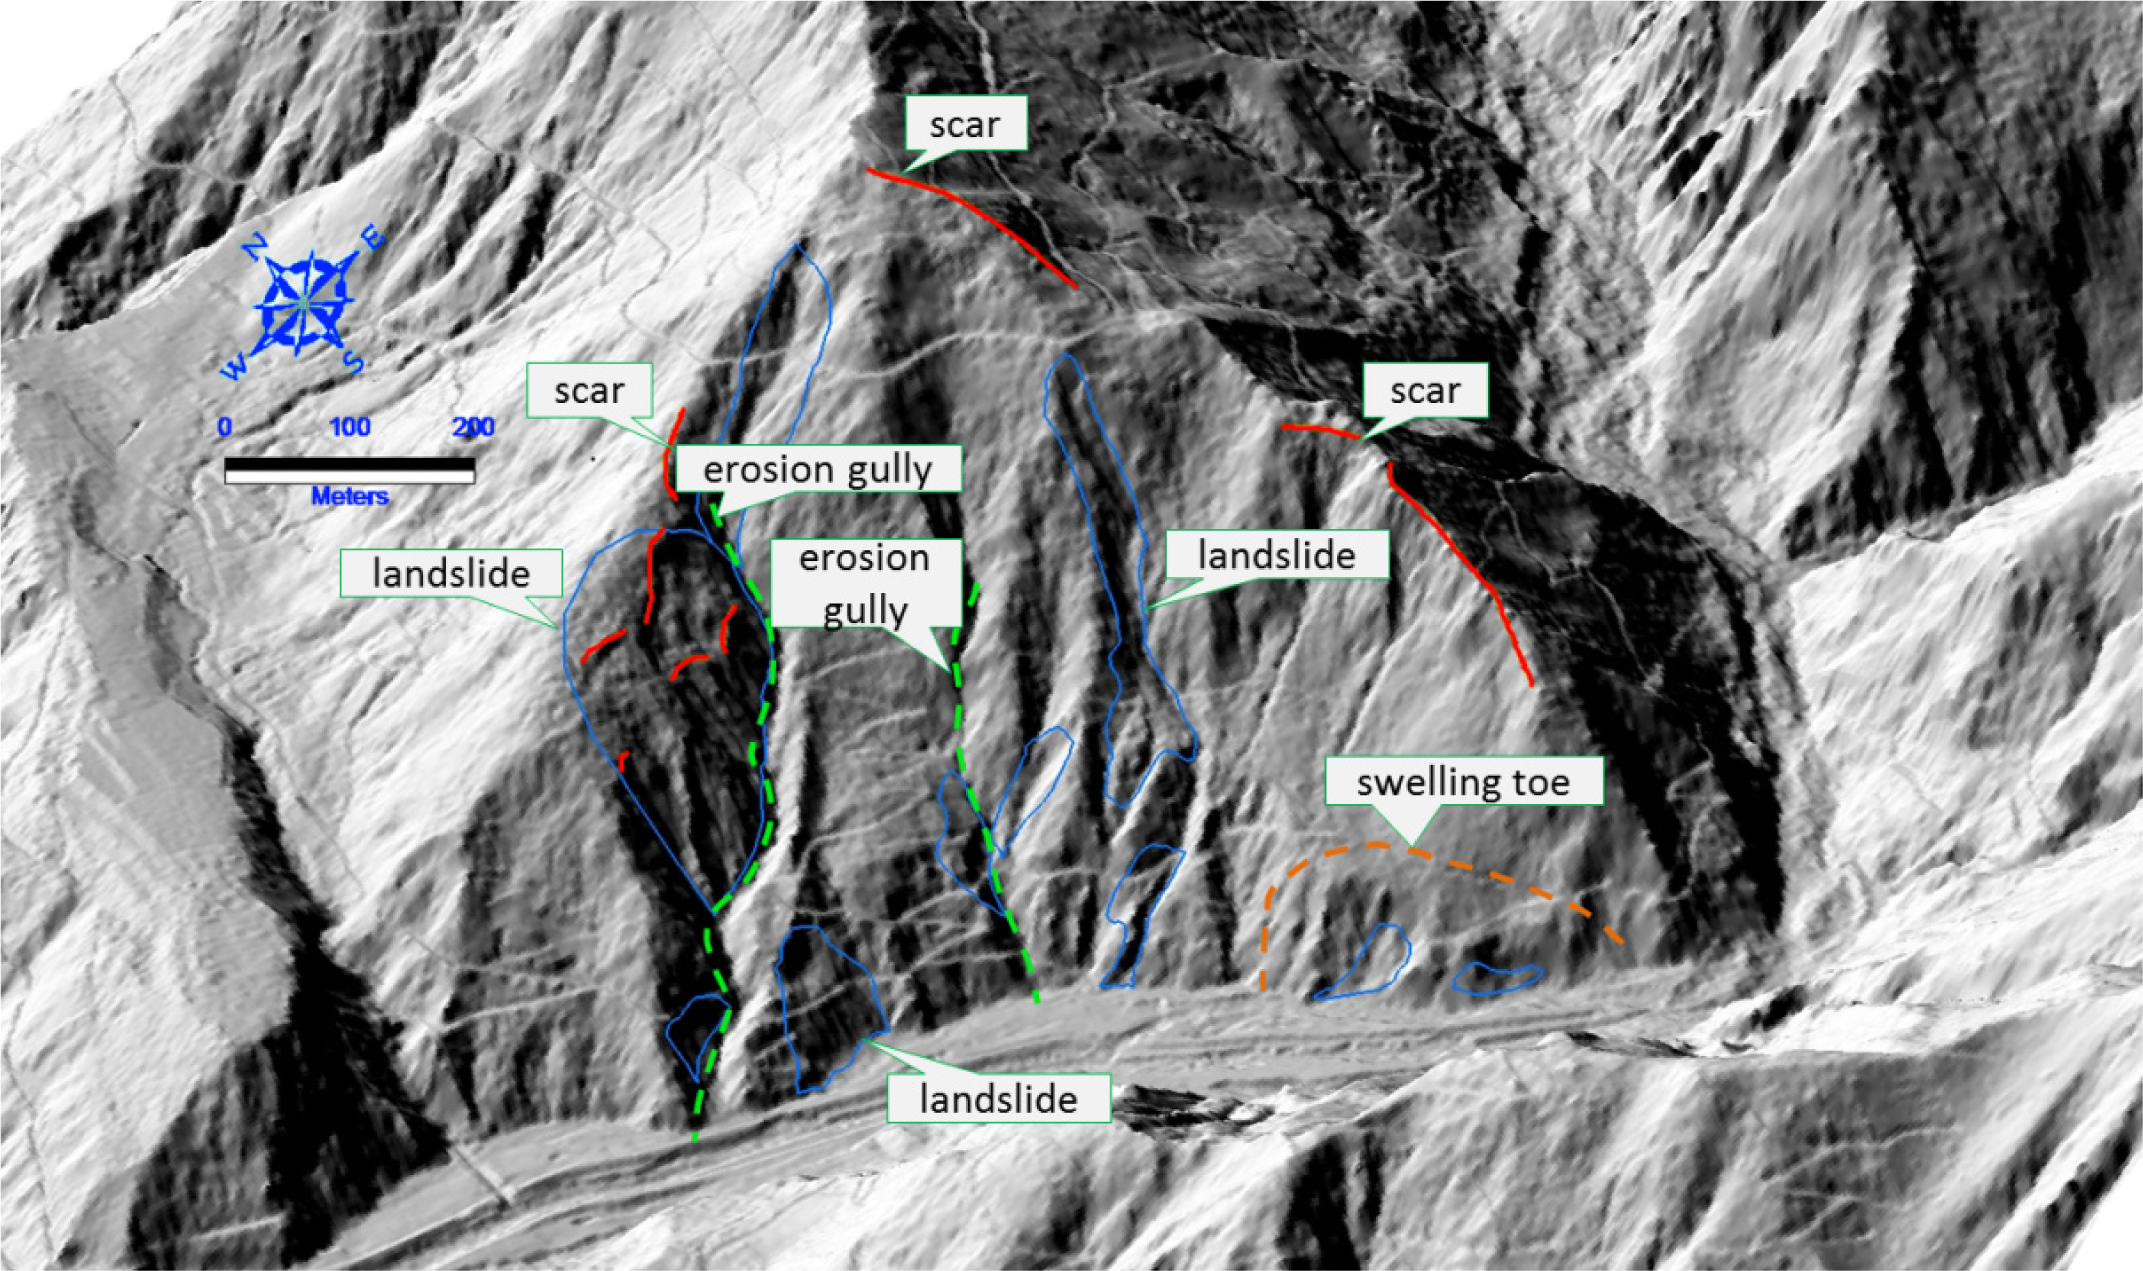
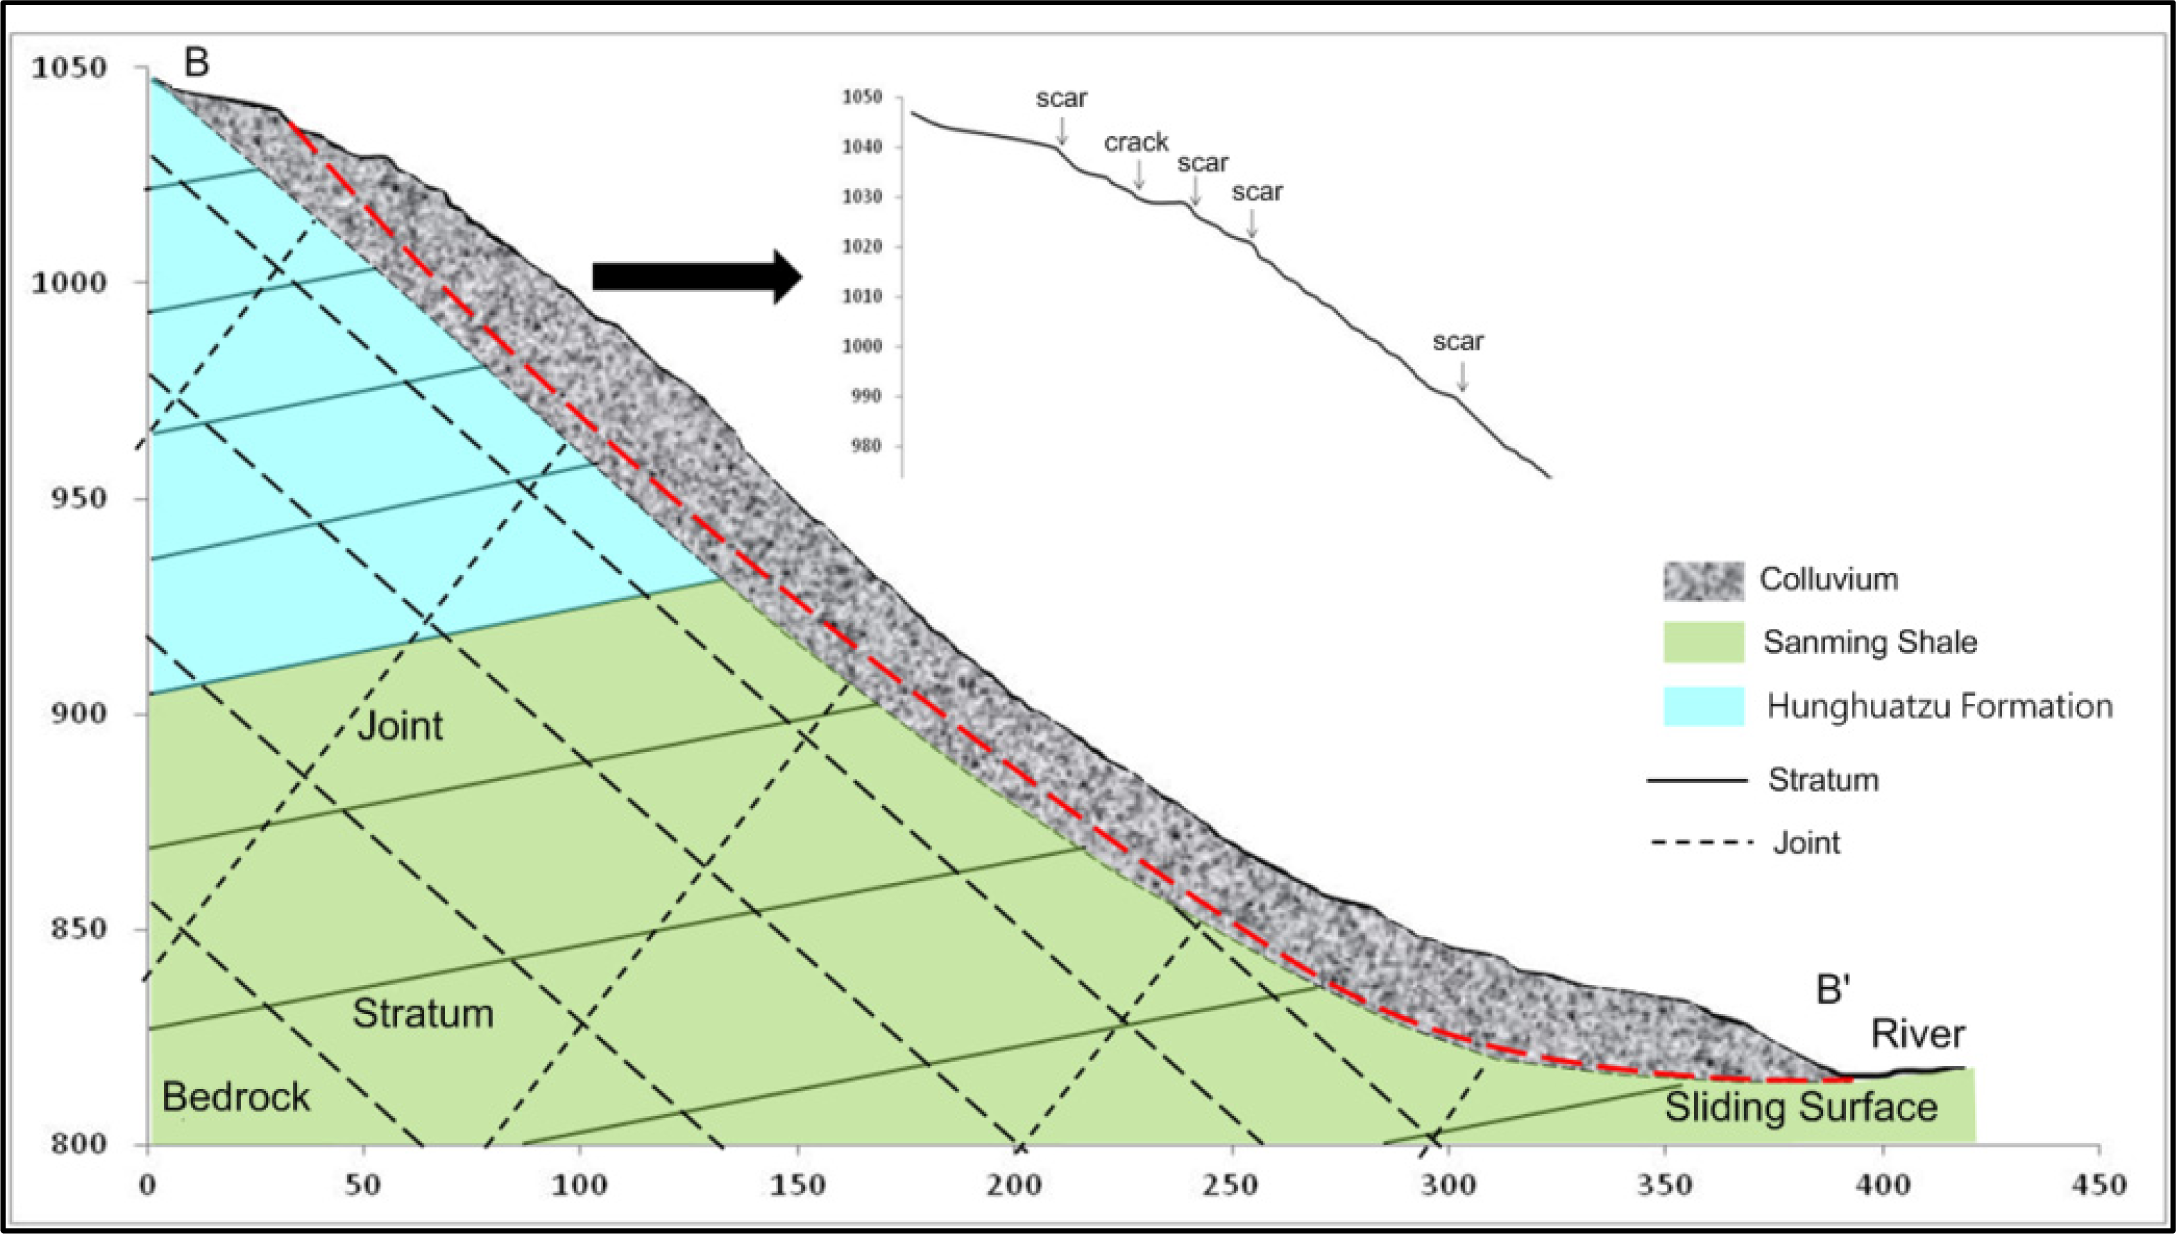
- Scarp: the scars form an approximate horseshoe shape; newly developed scars are brighter, circular tension cracks are found on top of the scars, swamps and/or ponds usually lie at the toe of scar.
- (3)
- Multiple crest lines: tension cracks develop near the crest of large-scale landslides, making the ground sag, and causing multiple crest lines to develop in the area next to the cracks.
- (4)
- Related sliding block: sliding blocks are observed between different scars, and the slope angles are usually not very steep.
- (5)
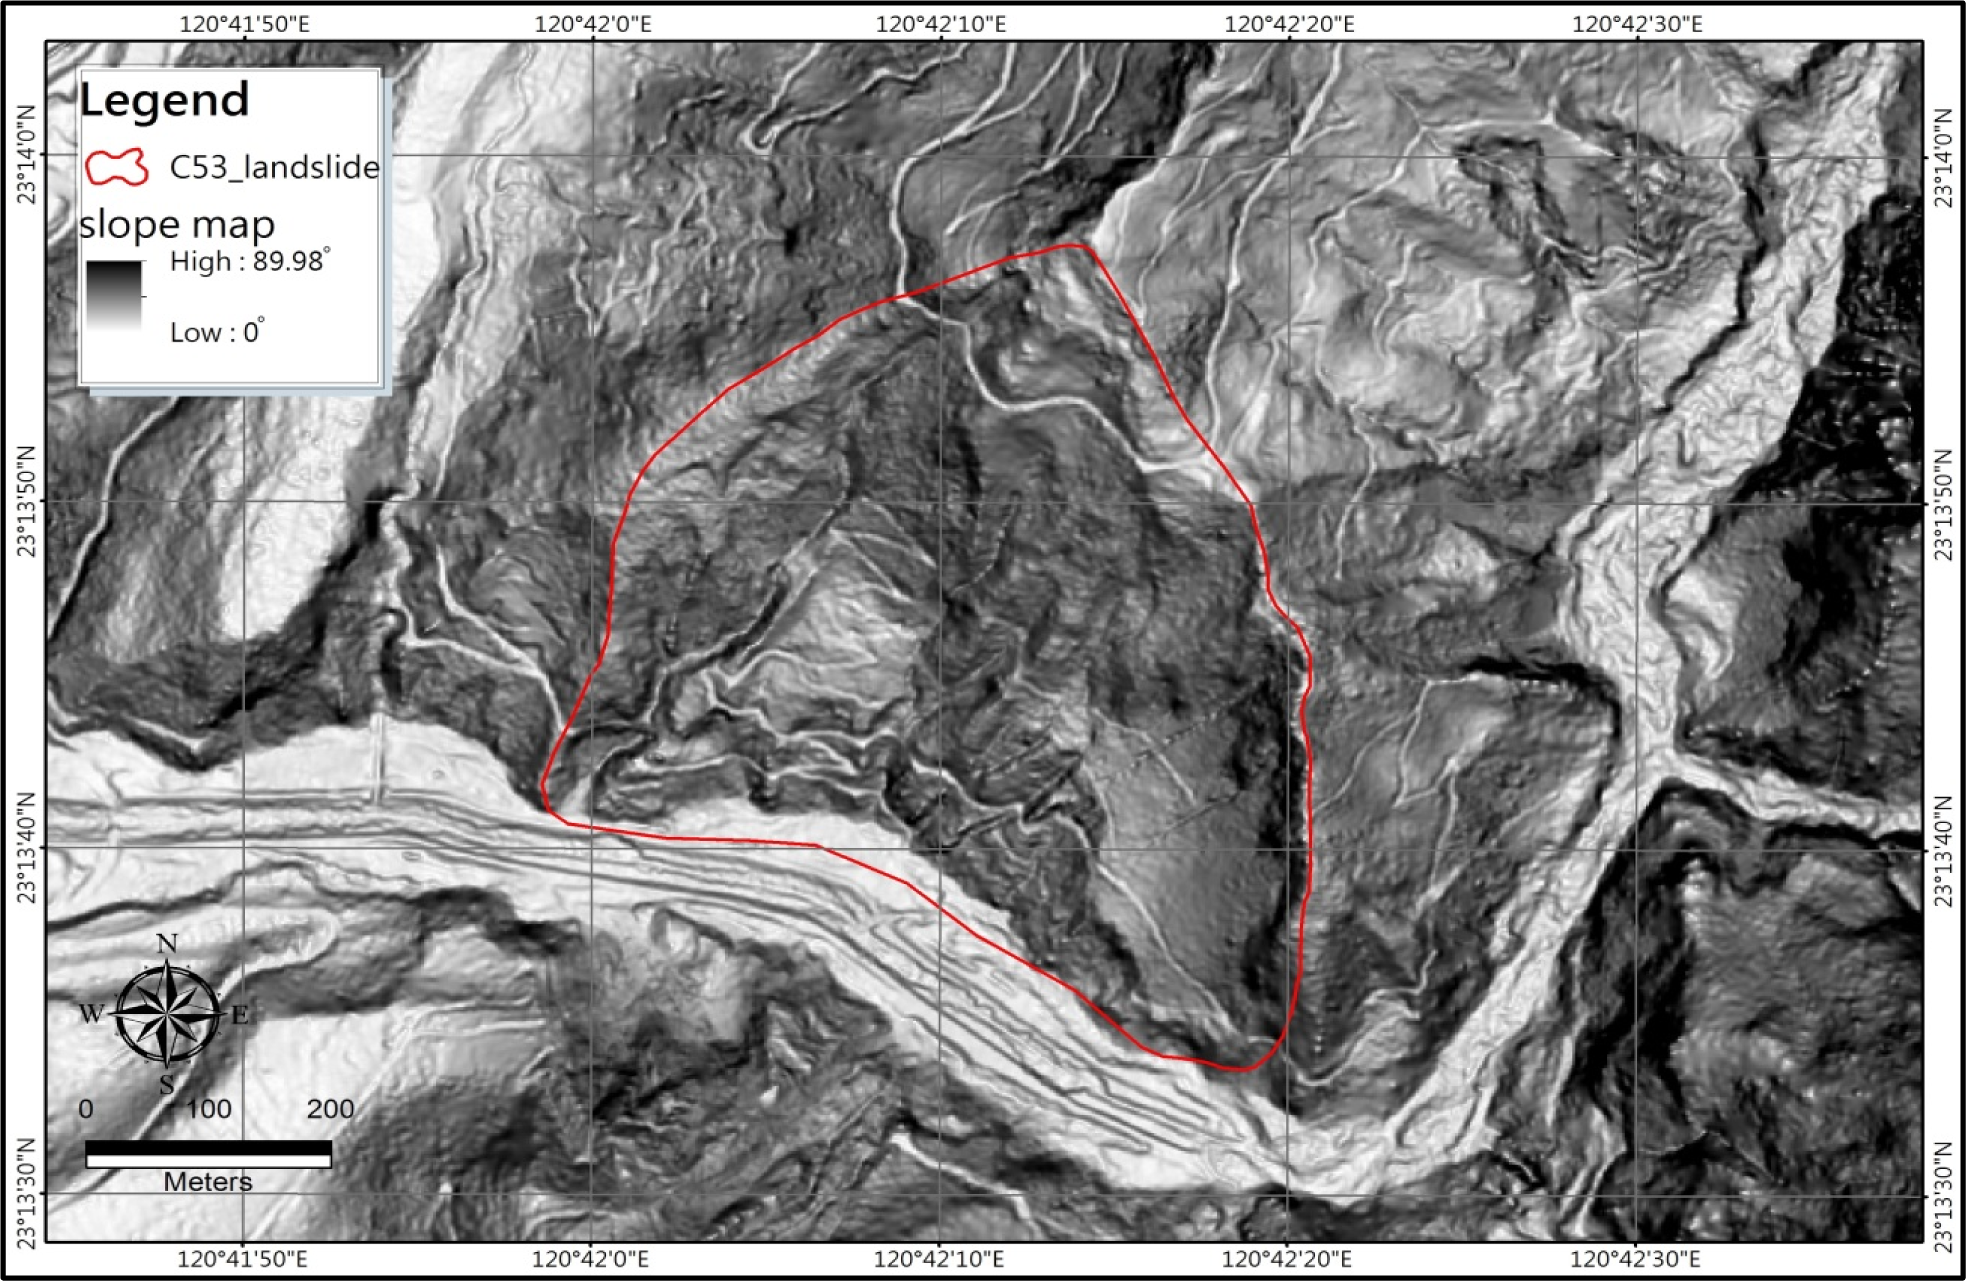
- Landslide body: the vegetation in this area appears to be different from the surrounding areas, (e.g., lawn, bamboo forest), or forming a terrace. The upper part of the landslide body is a sagging terrain; main sliding body is presented as smooth angle and not too steep. The lower part of the body is as raised terrain.
- (6)
- Side cracks or erosion gullies: both sides of the landslide could be eroded by water due to the presence of landslide cracks. The two erosion side cracks could develop into gullies and incise toward the crest of the landslide, and eventually causing them to link together.
- (7)
- Bulging or swelling at the toe area: the toe of the landslide becomes bulged due to squeezing of the sliding slope body. The toe sometimes locates on the erosion side of riverbanks and further scouring actions often trigger new slides.
4. Comparisons of Landslide Investigation Methods Using Lidar Data and Aerial Photos
4.1. The Results of Landslide Identification using Aerial Photos
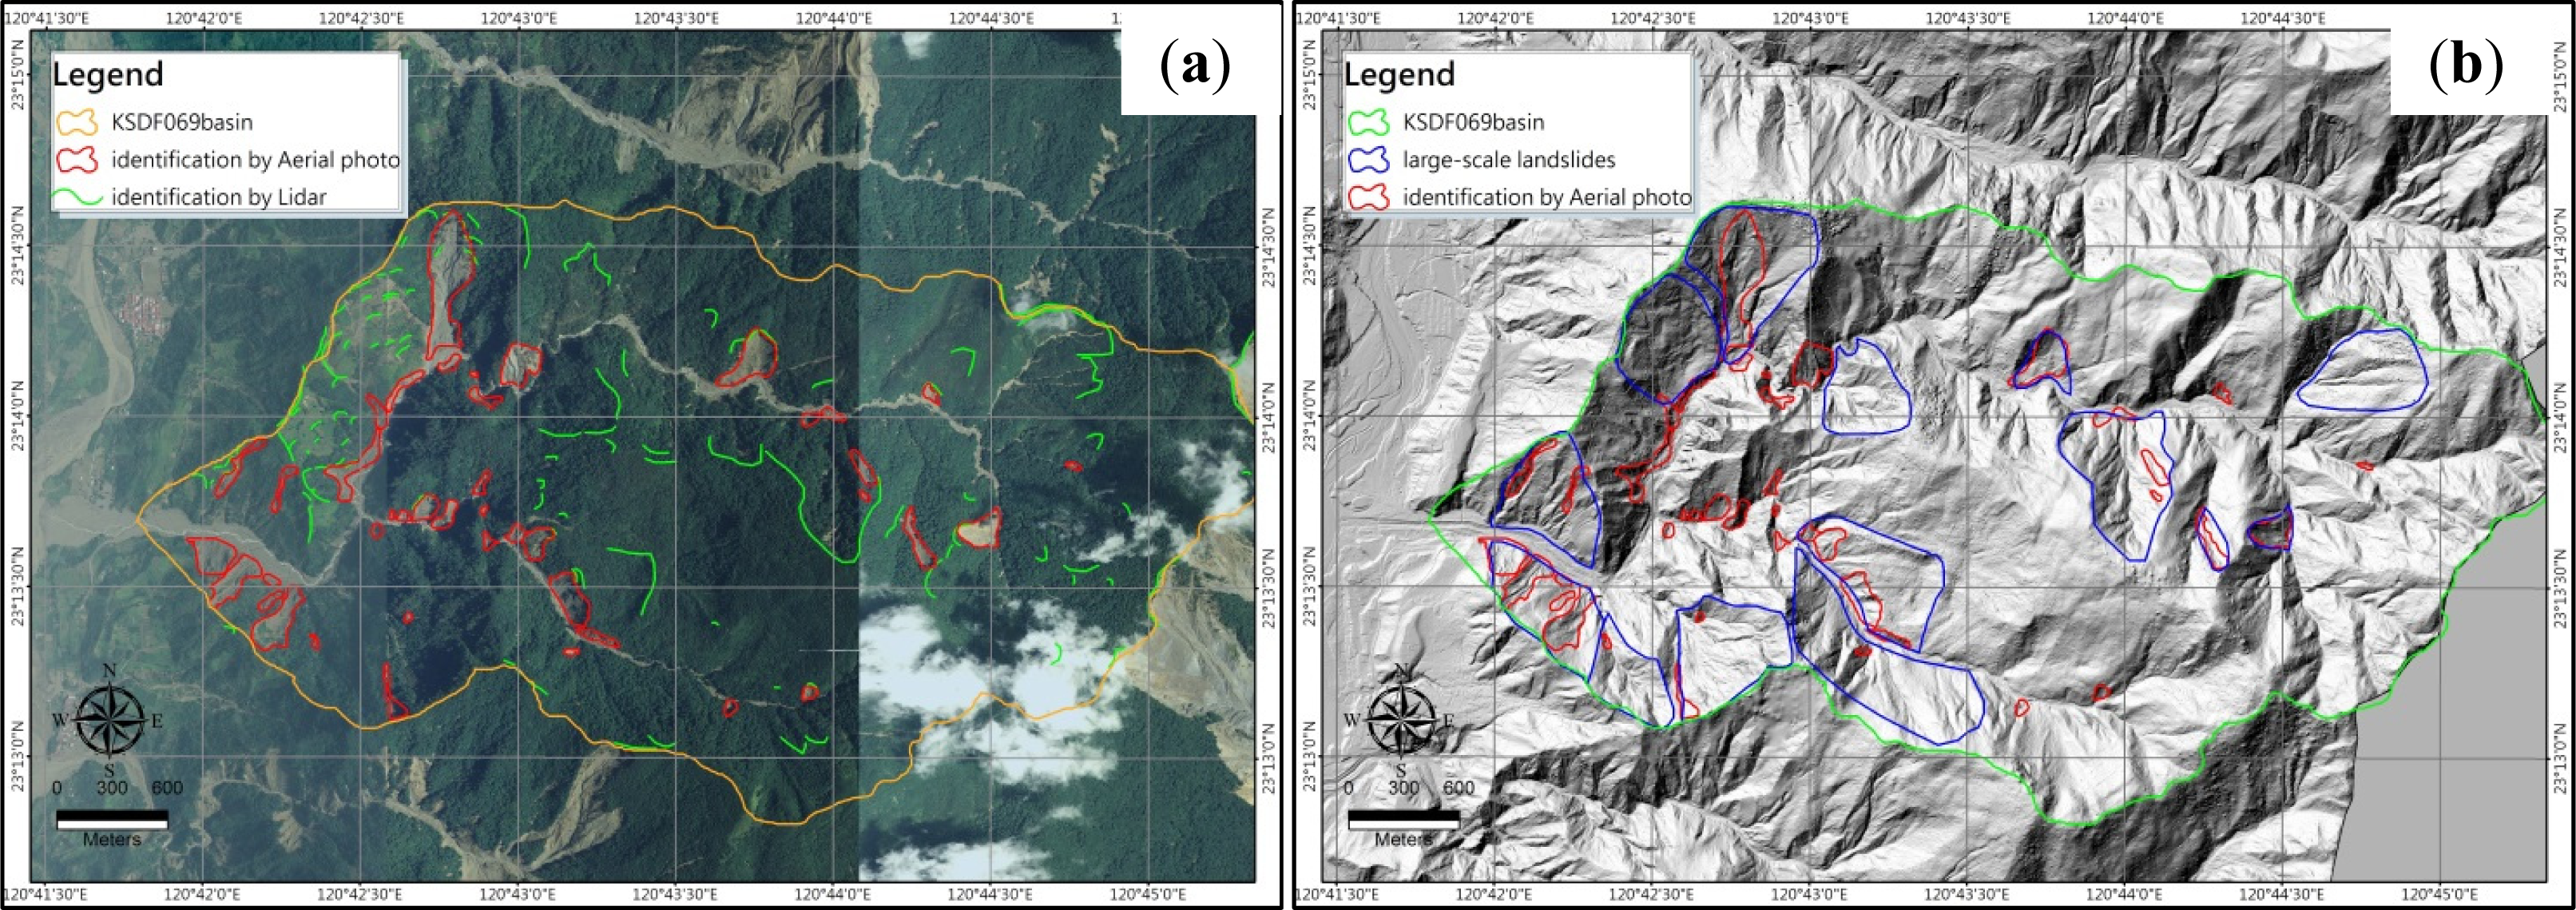
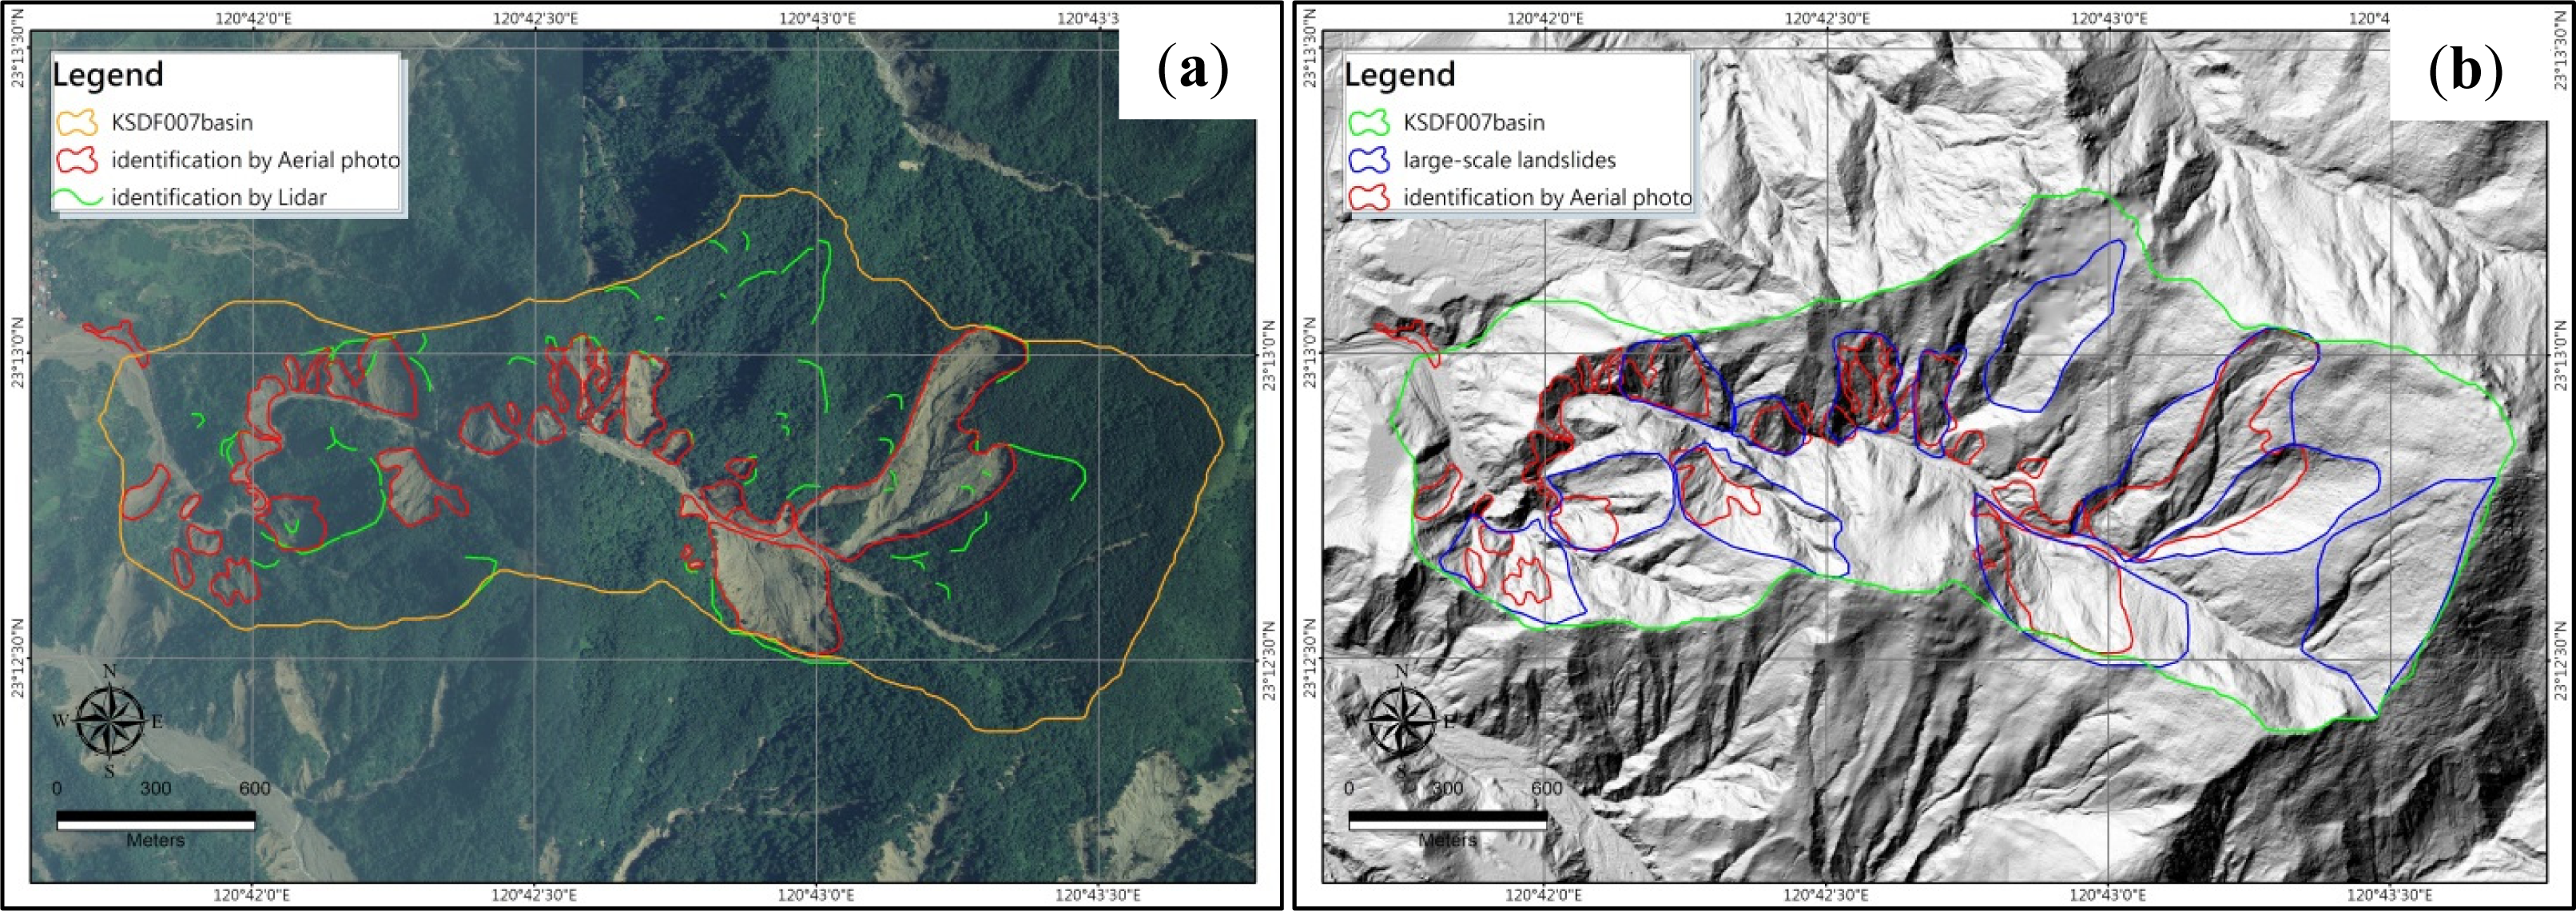
4.2. Comparisons of Mapped Landslides using Lidar Information and Aerial Photos
5. Validation of Mapped Large-Scale landslides
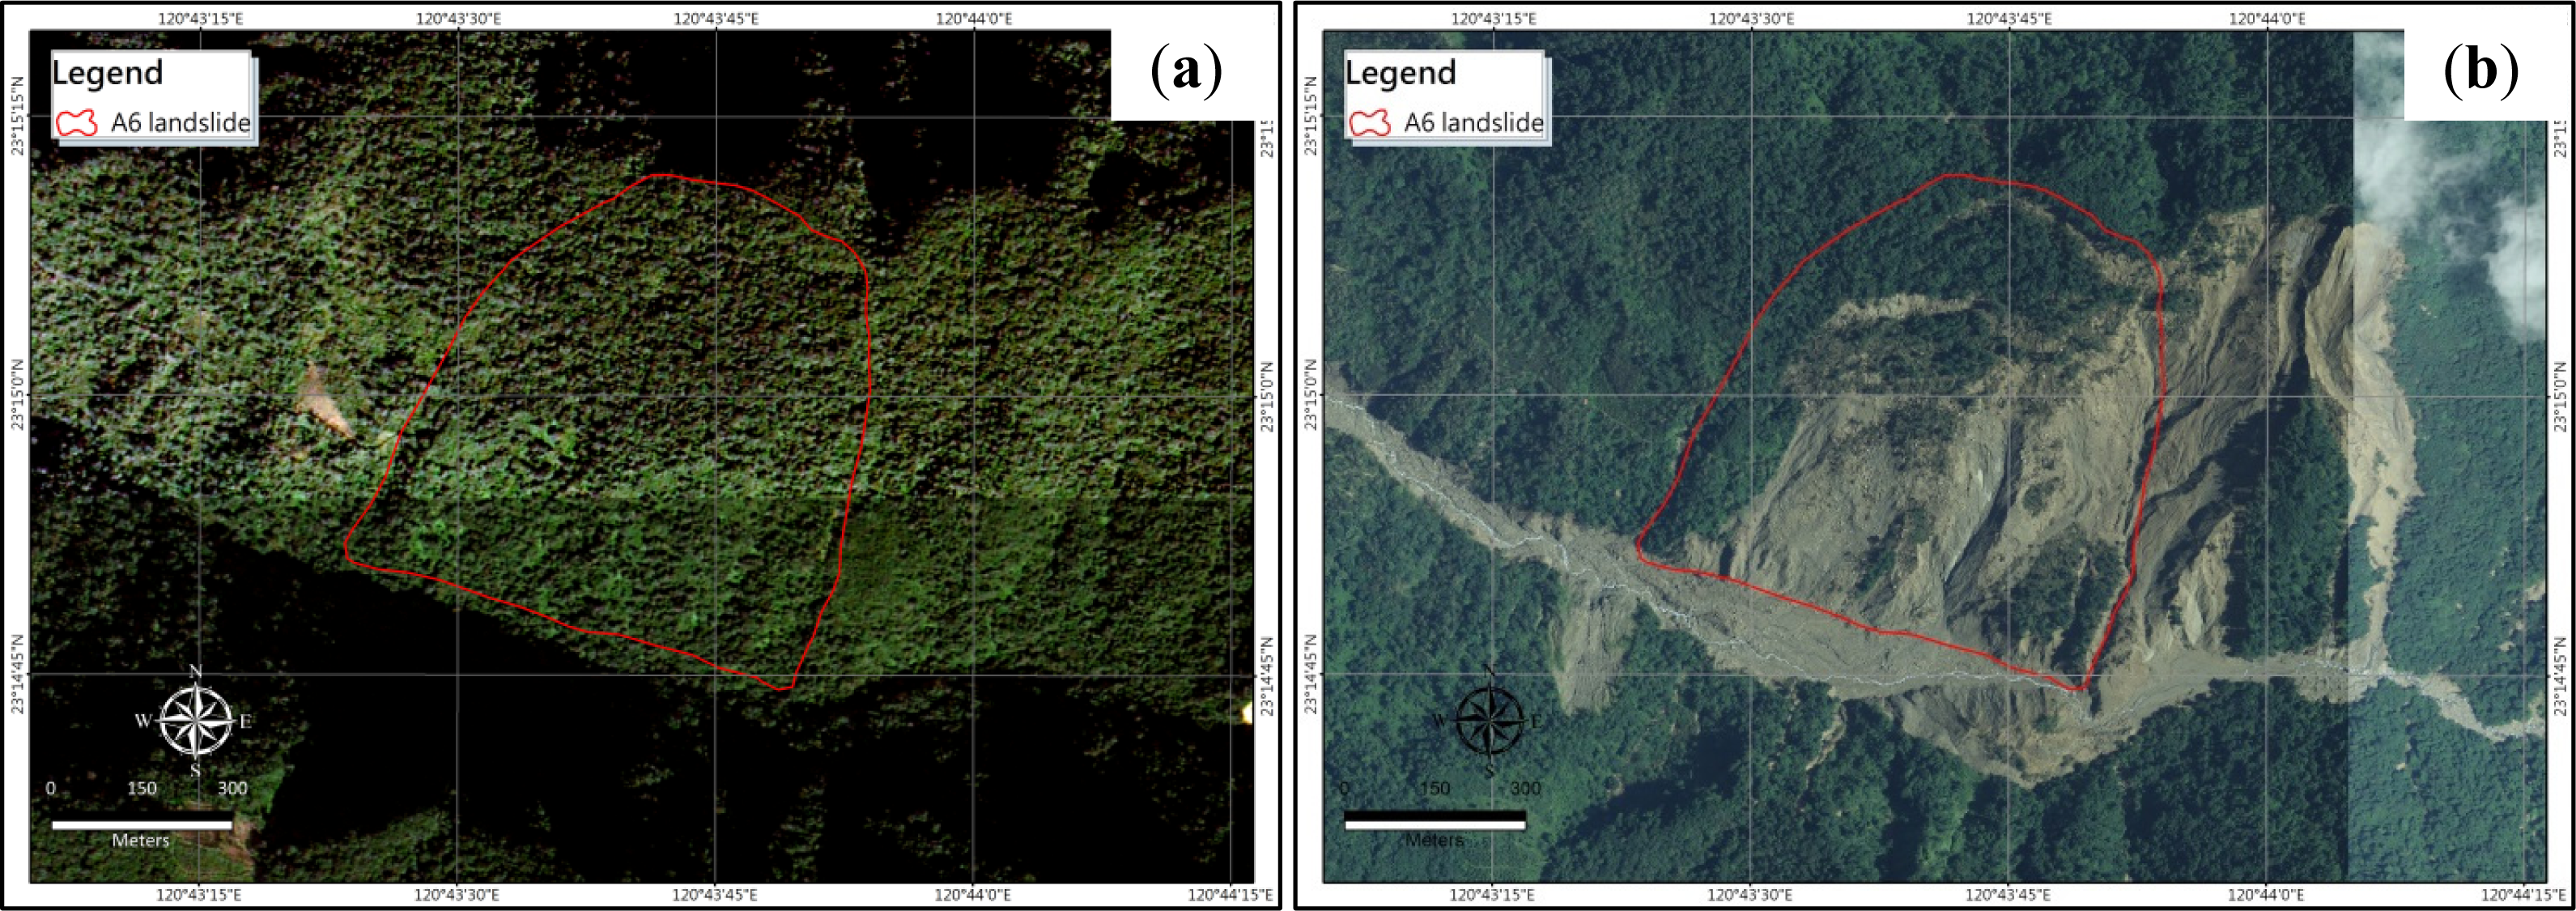
5.1. An Overview of Large-Scale Landslides No.A6 & A112
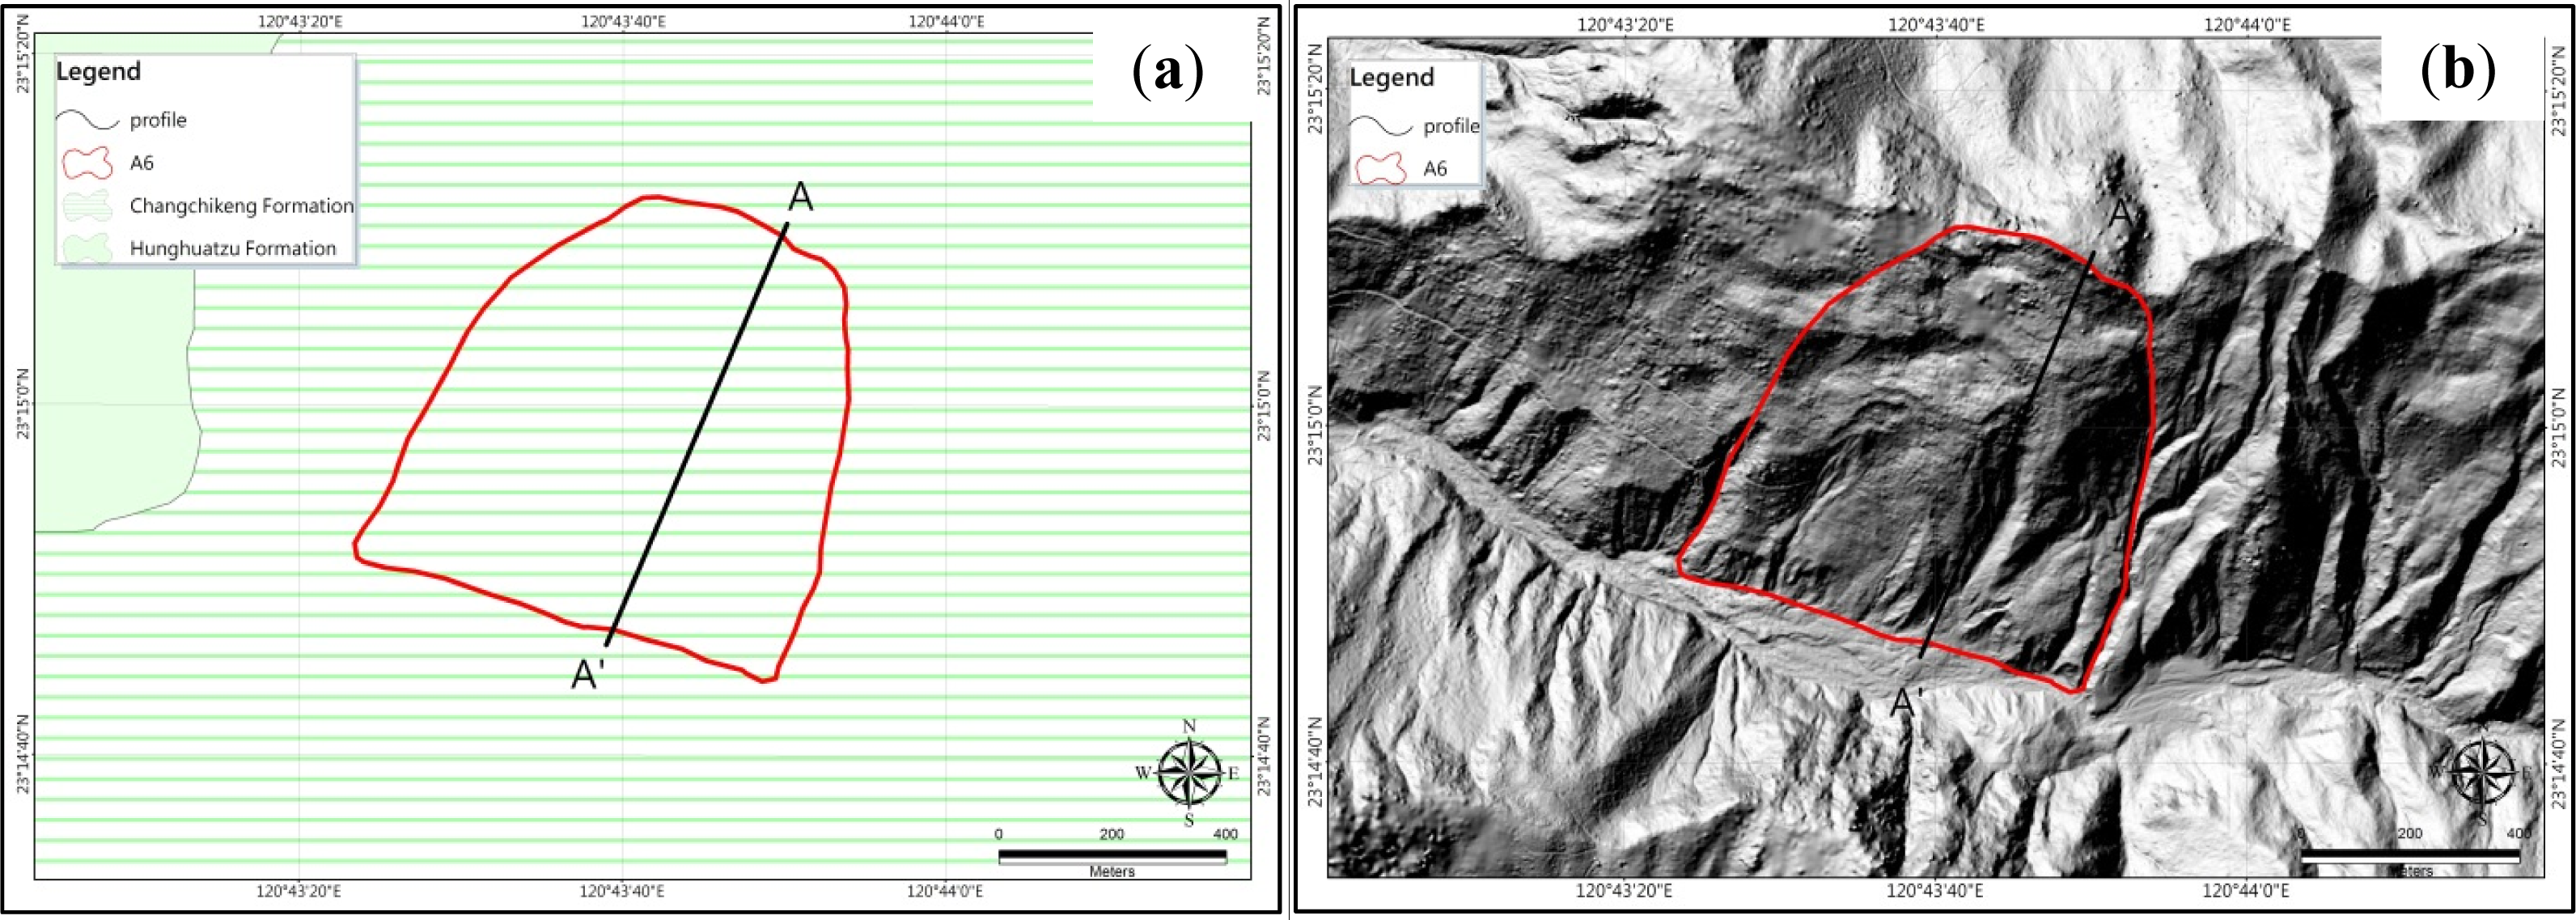
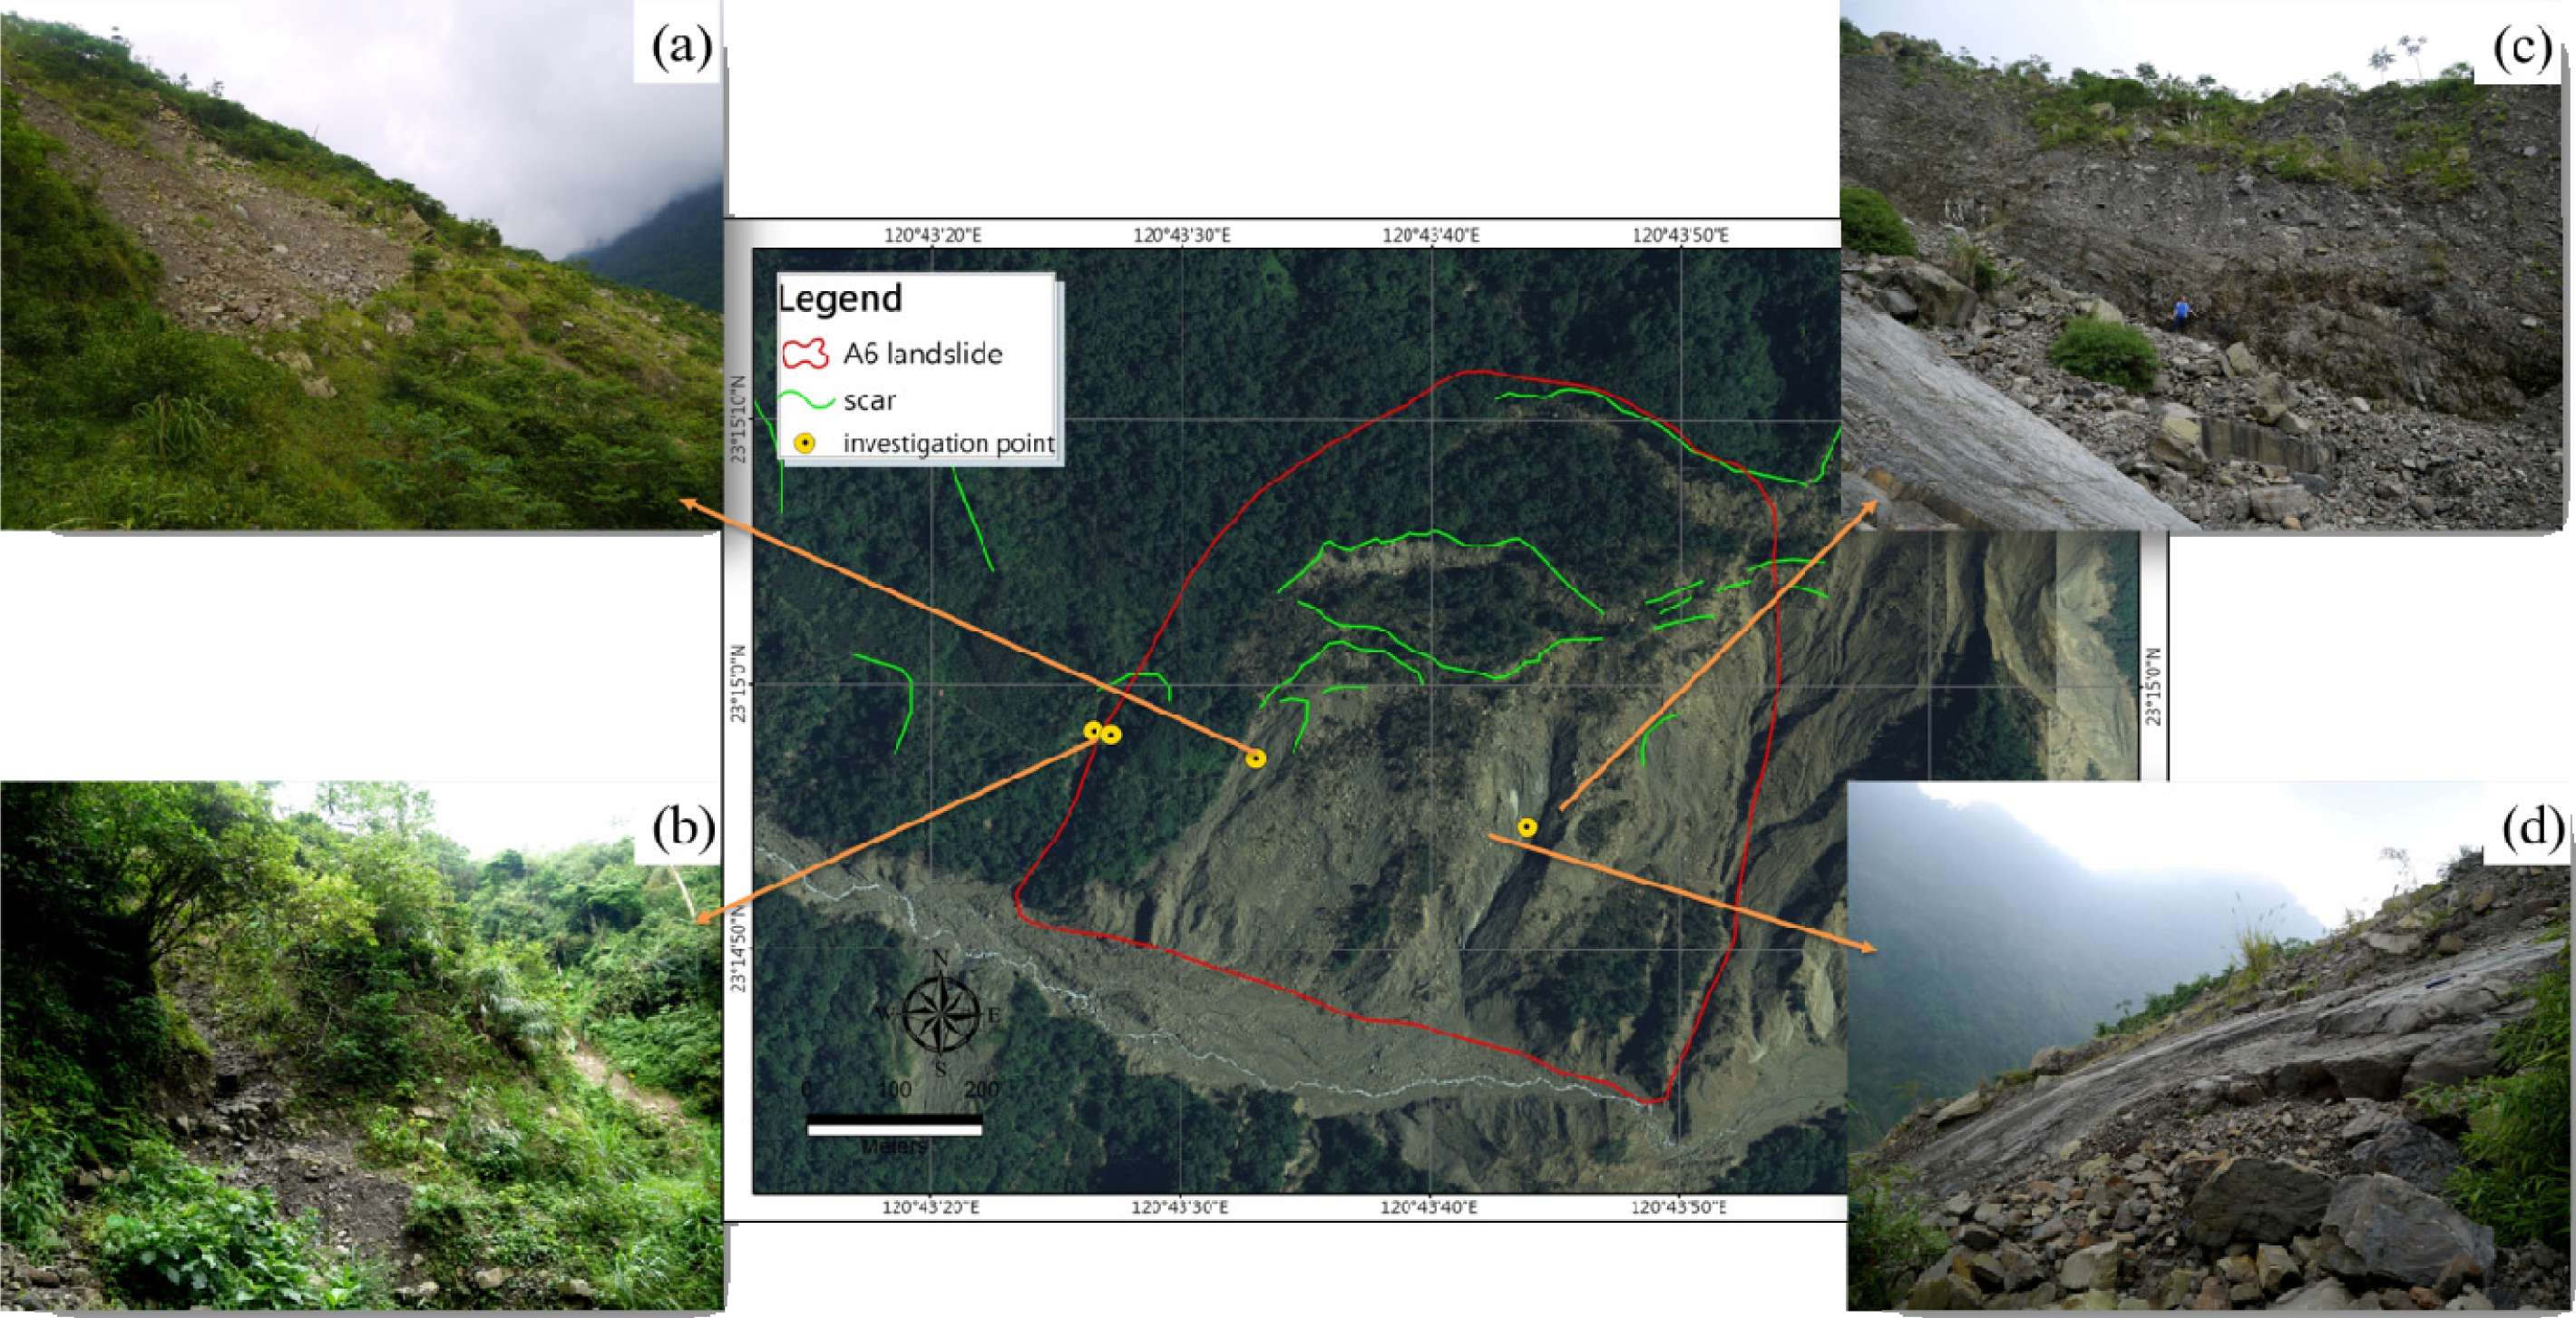
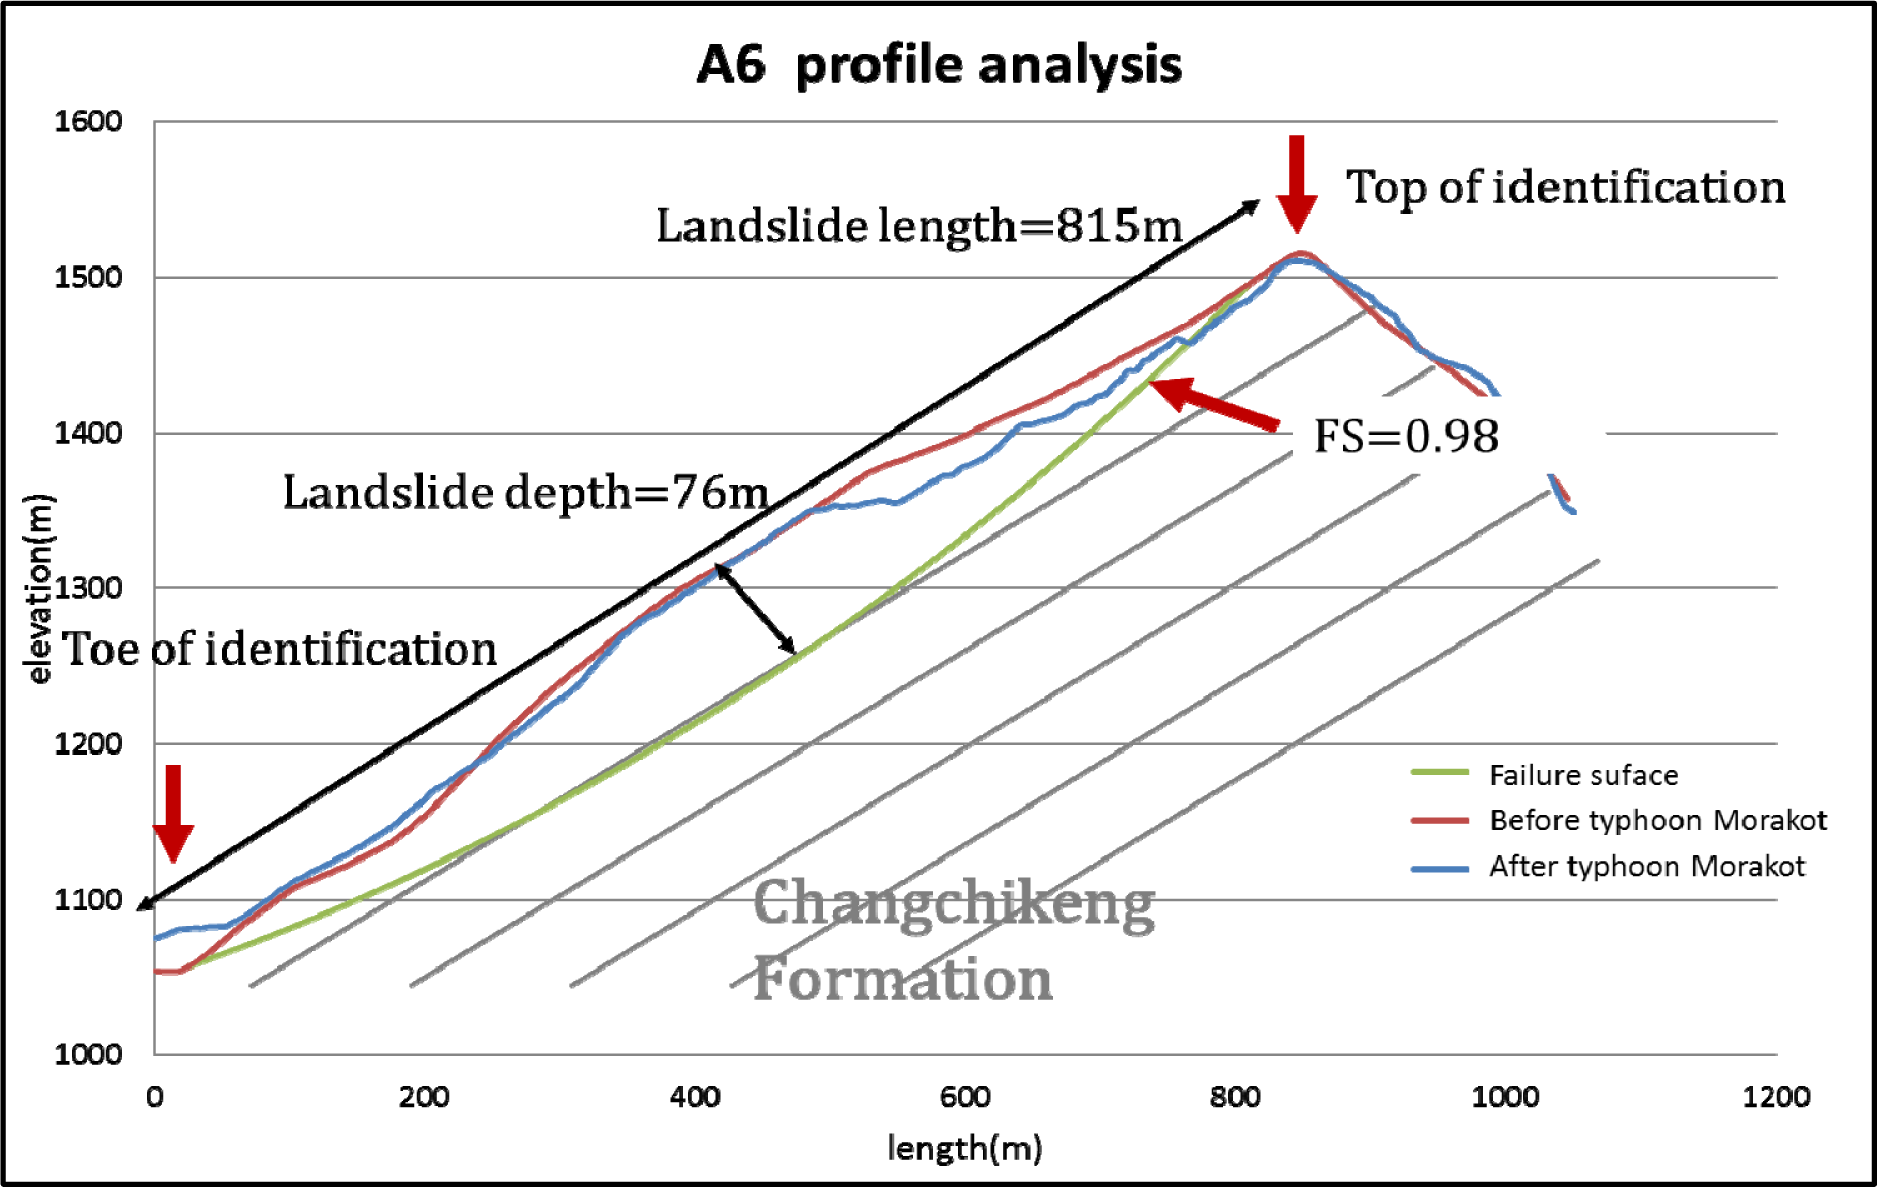
5.1.1. The A6 Large-Scale Landslide
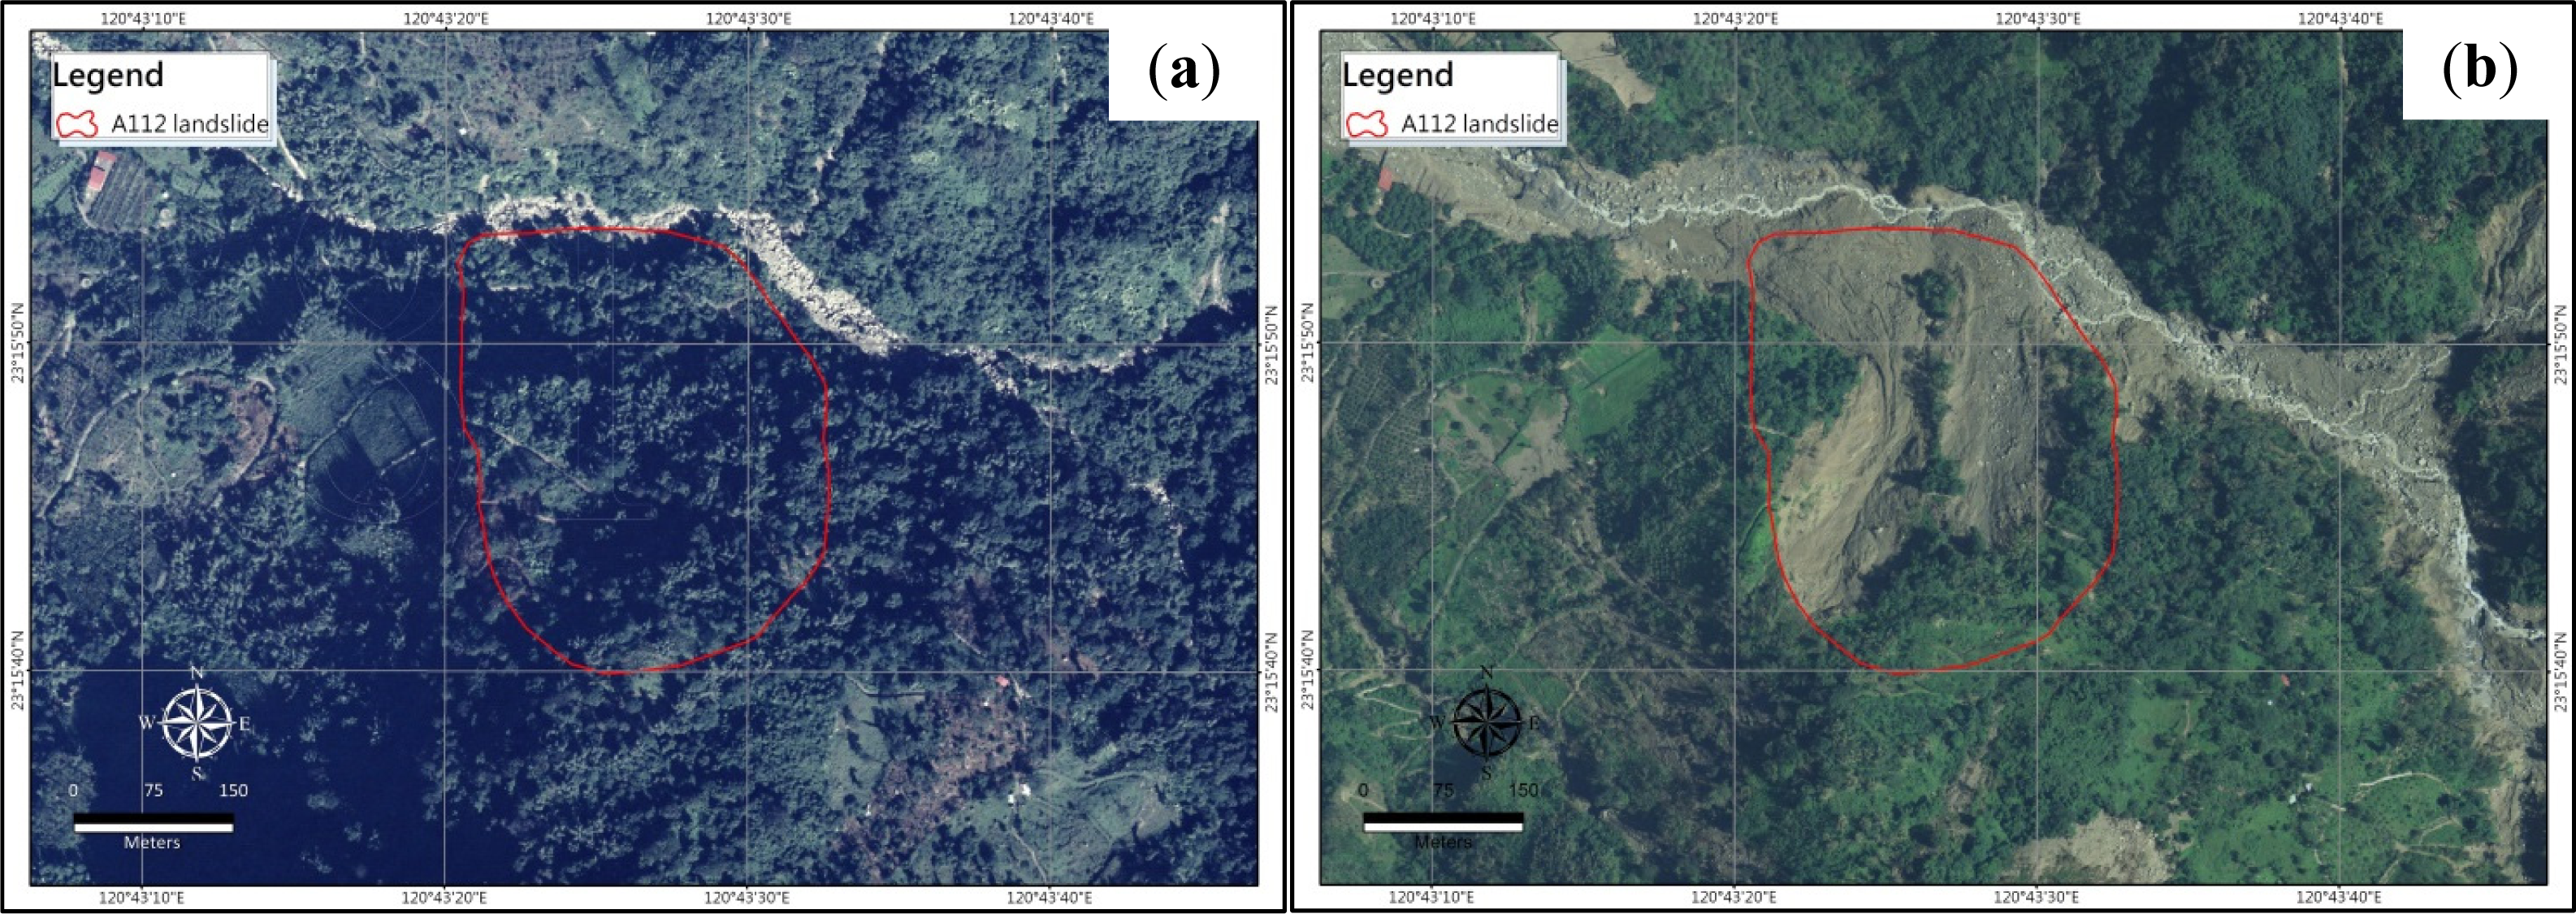
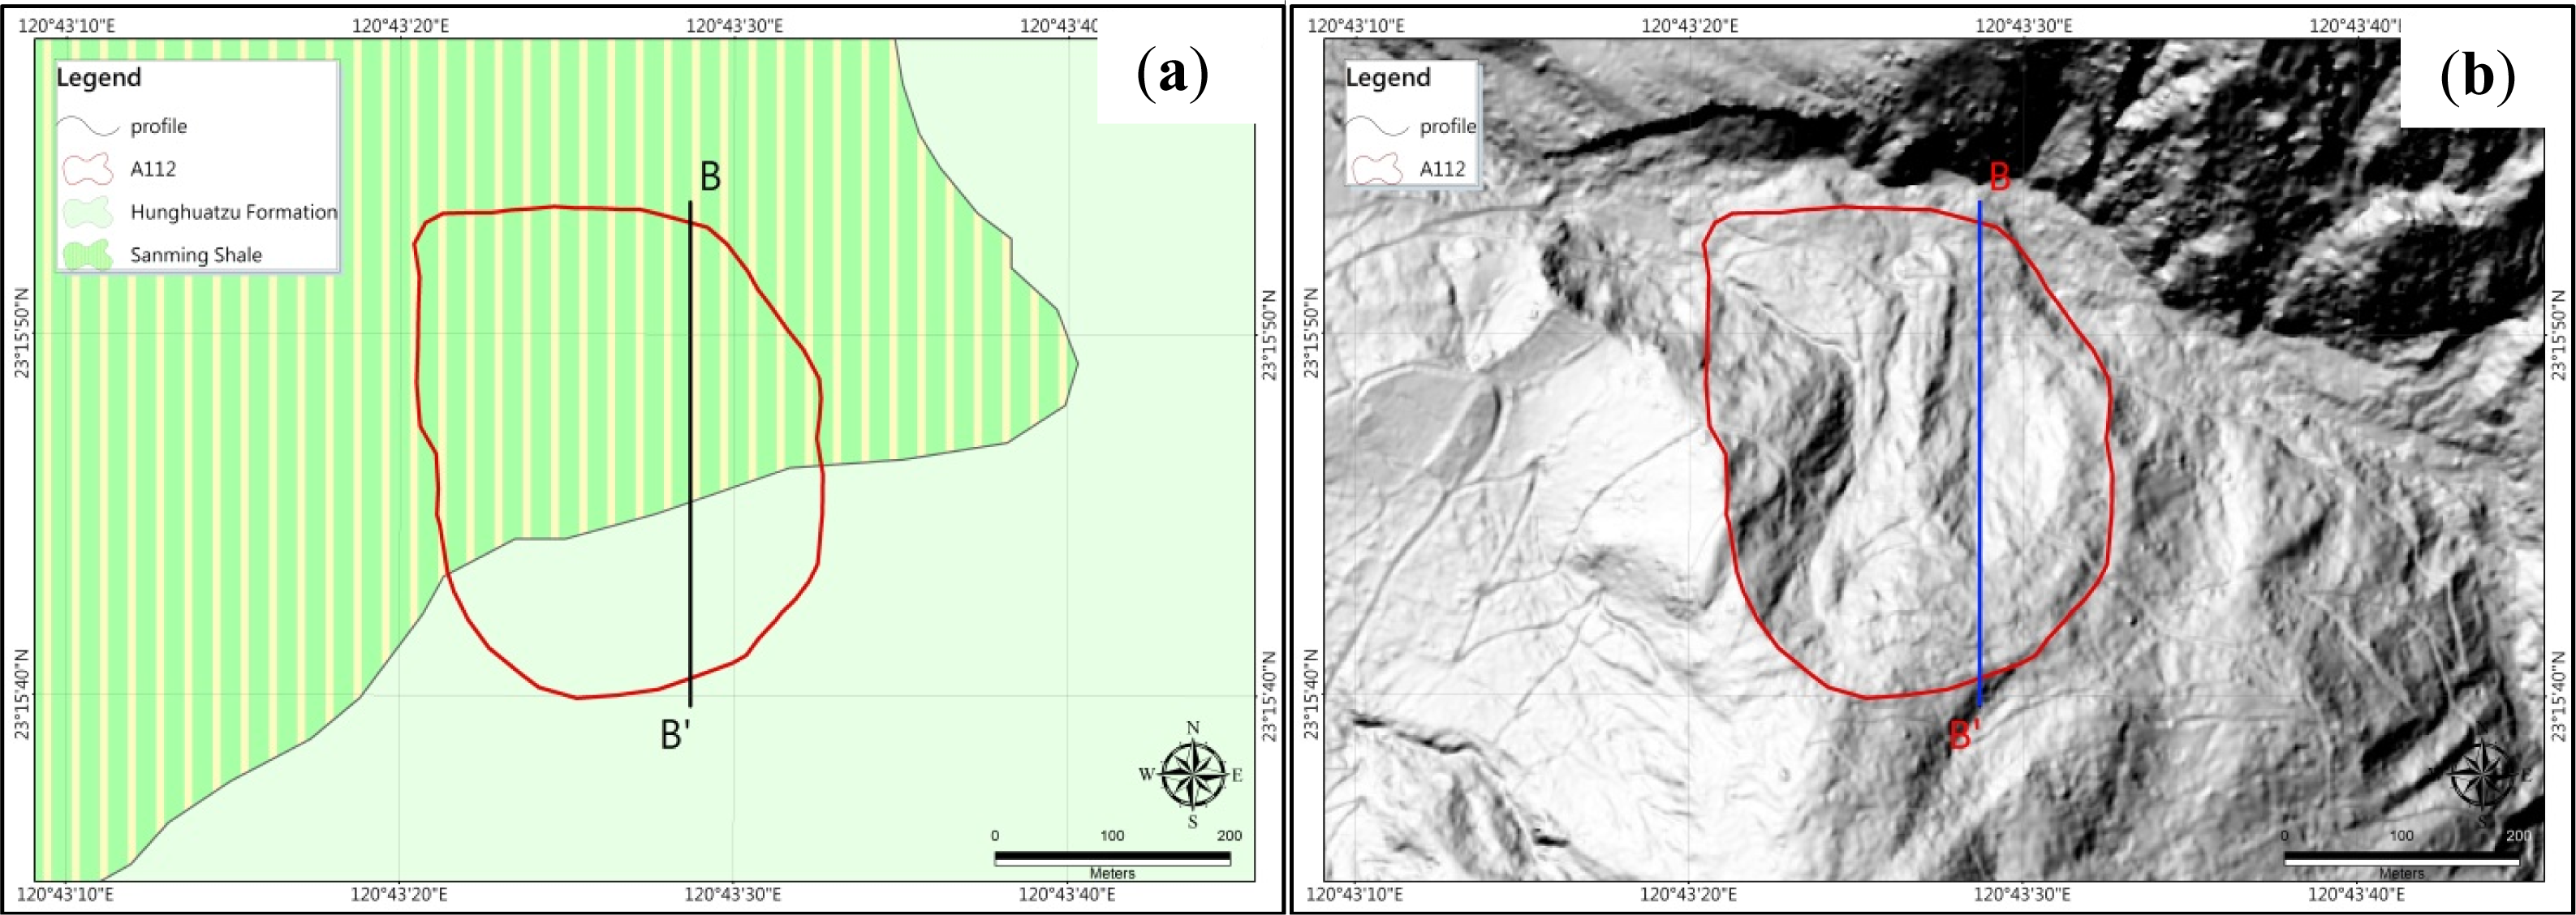
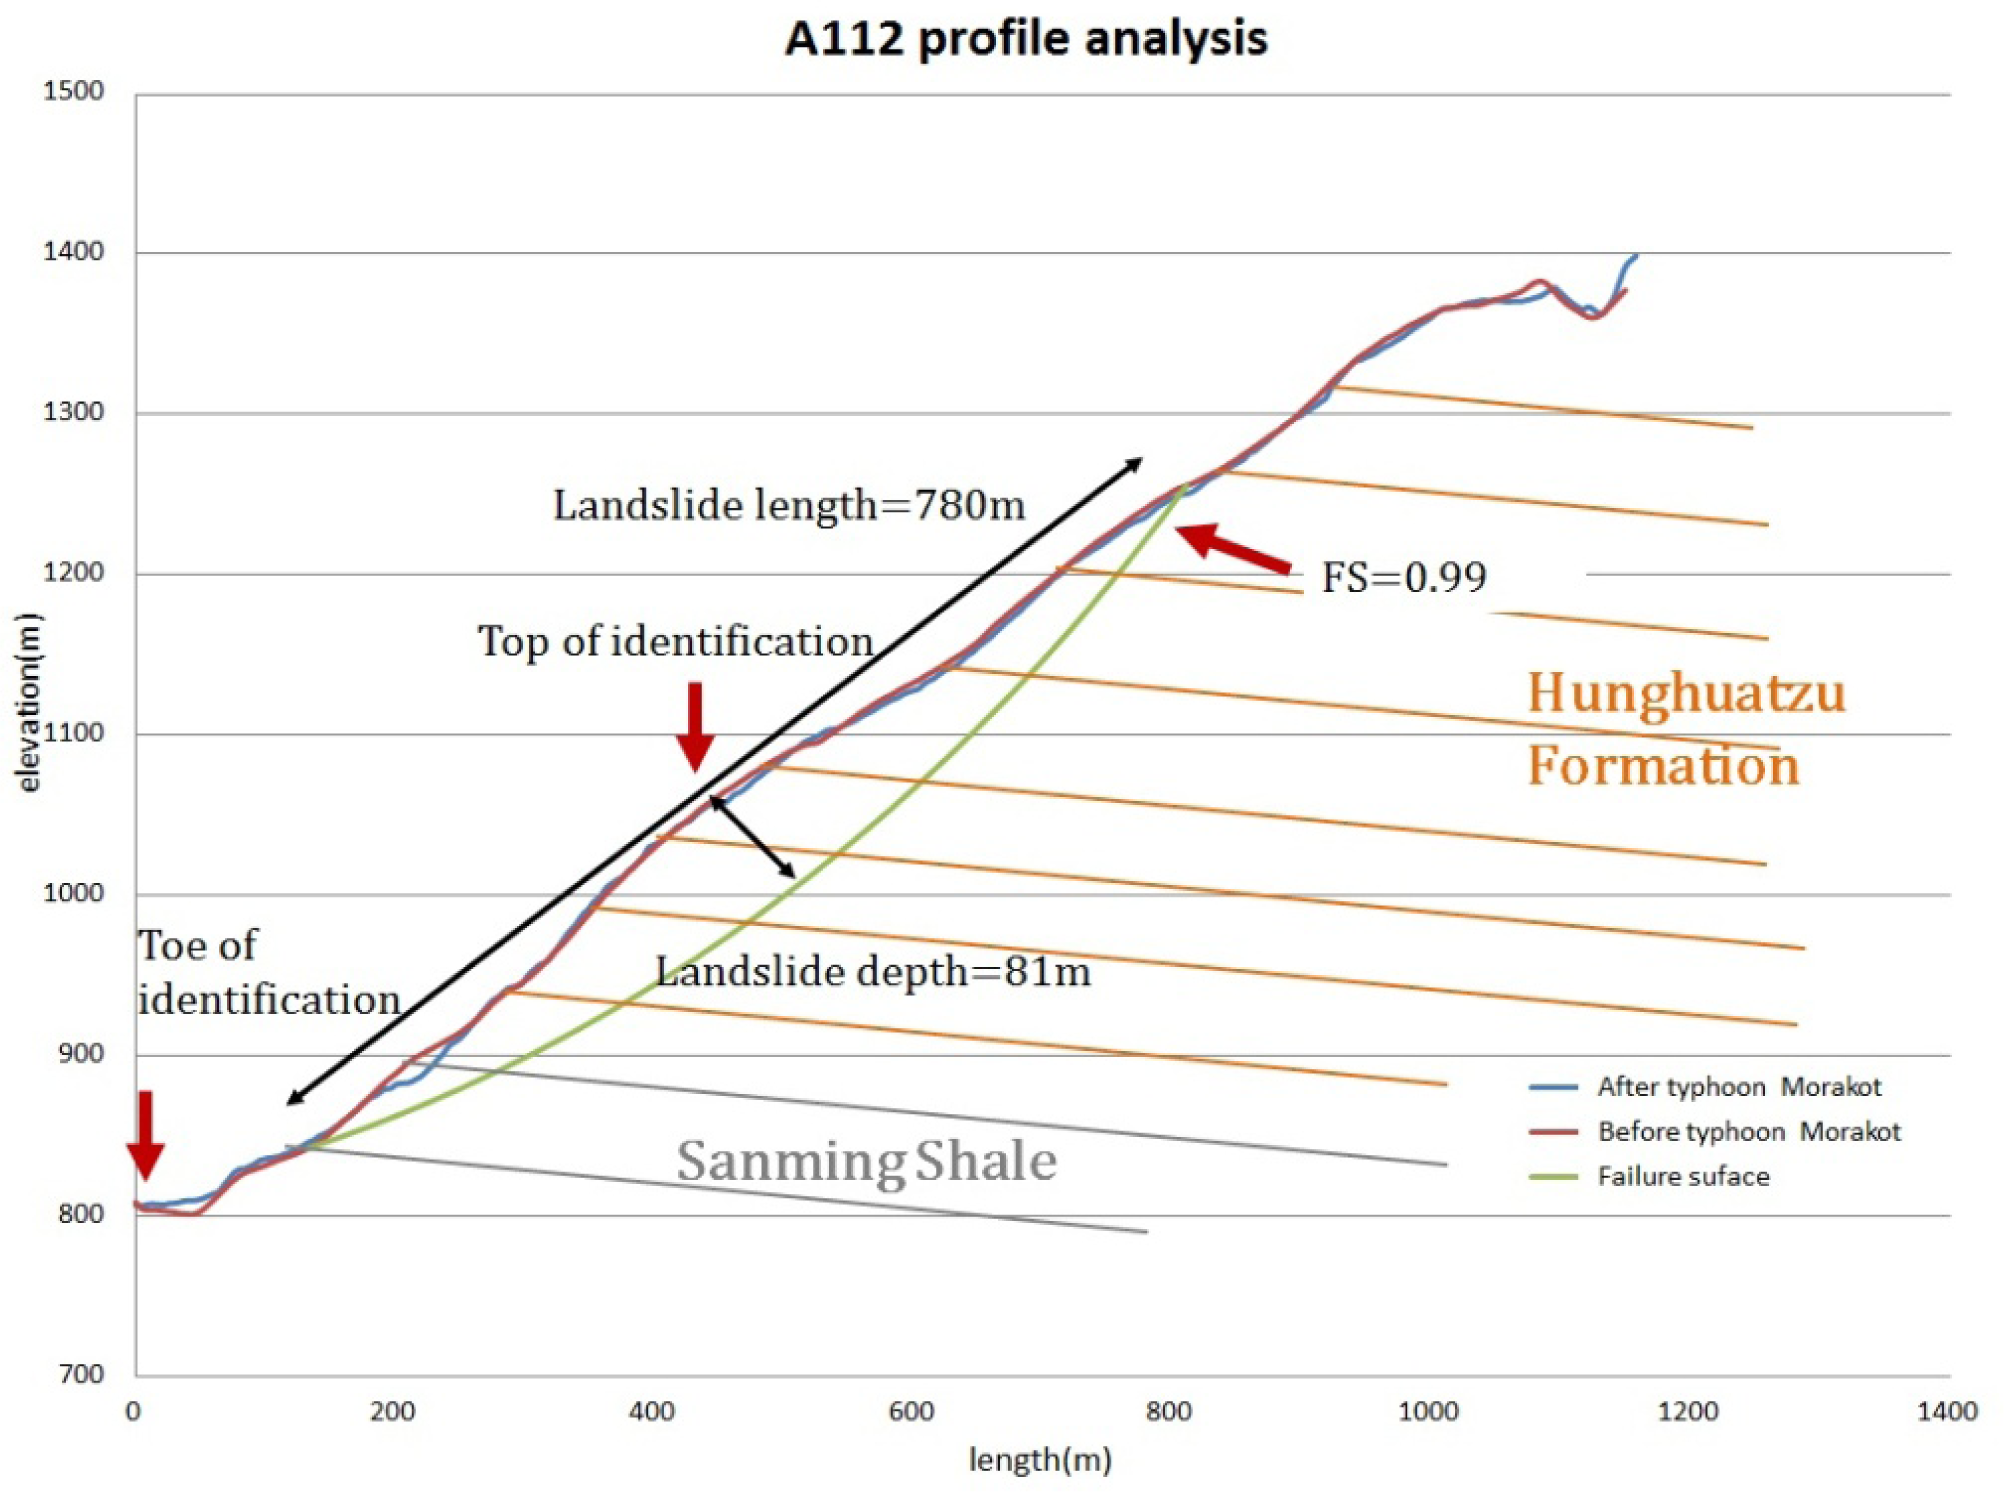
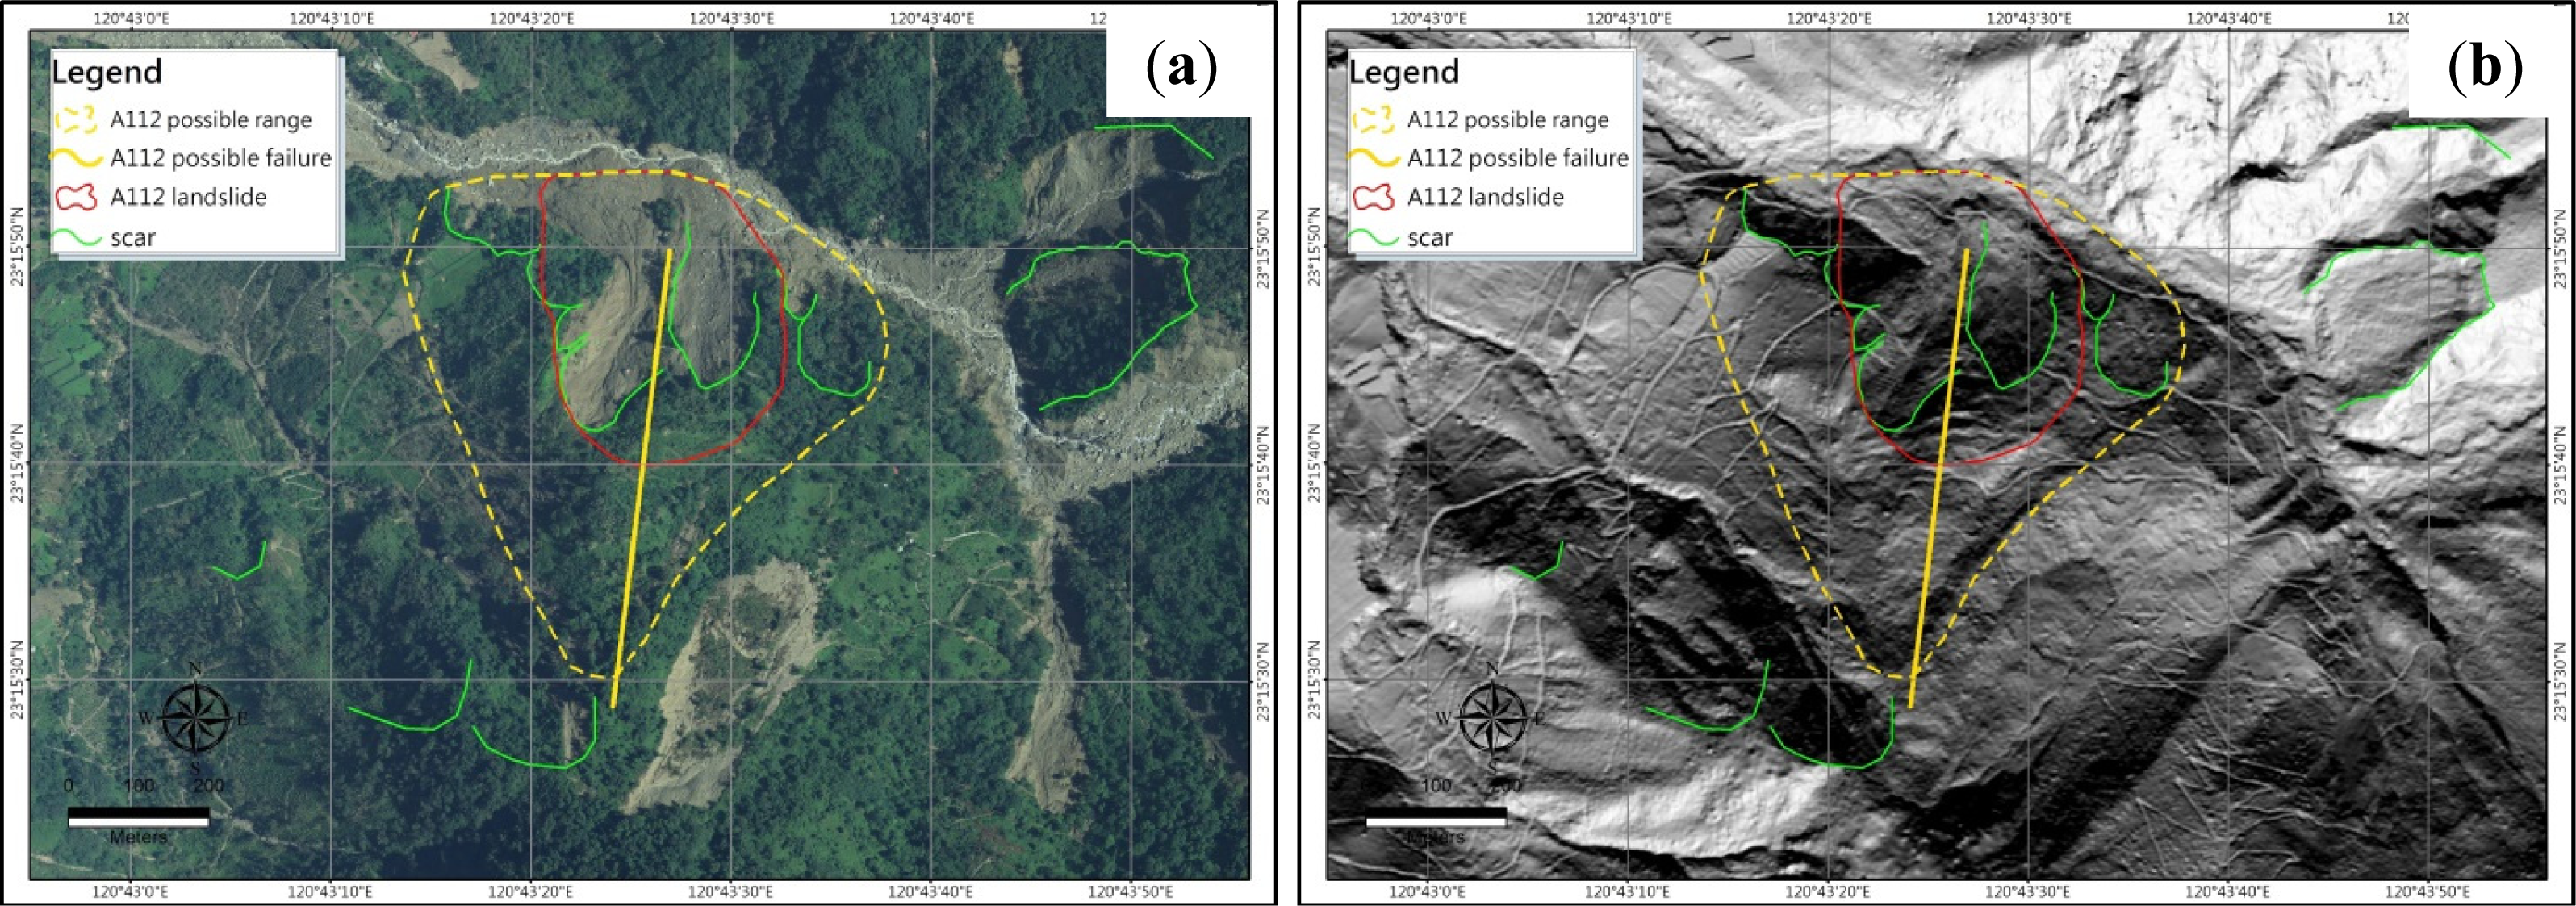
5.1.2. The A112 Large-Scale Landslide
5.2. Field Investigations and Stability Analysis of the A6 and A112 Large-Scale Landslides
5.2.1. Field Investigation and Stability Analysis of the A6 Large-Scale Landslide
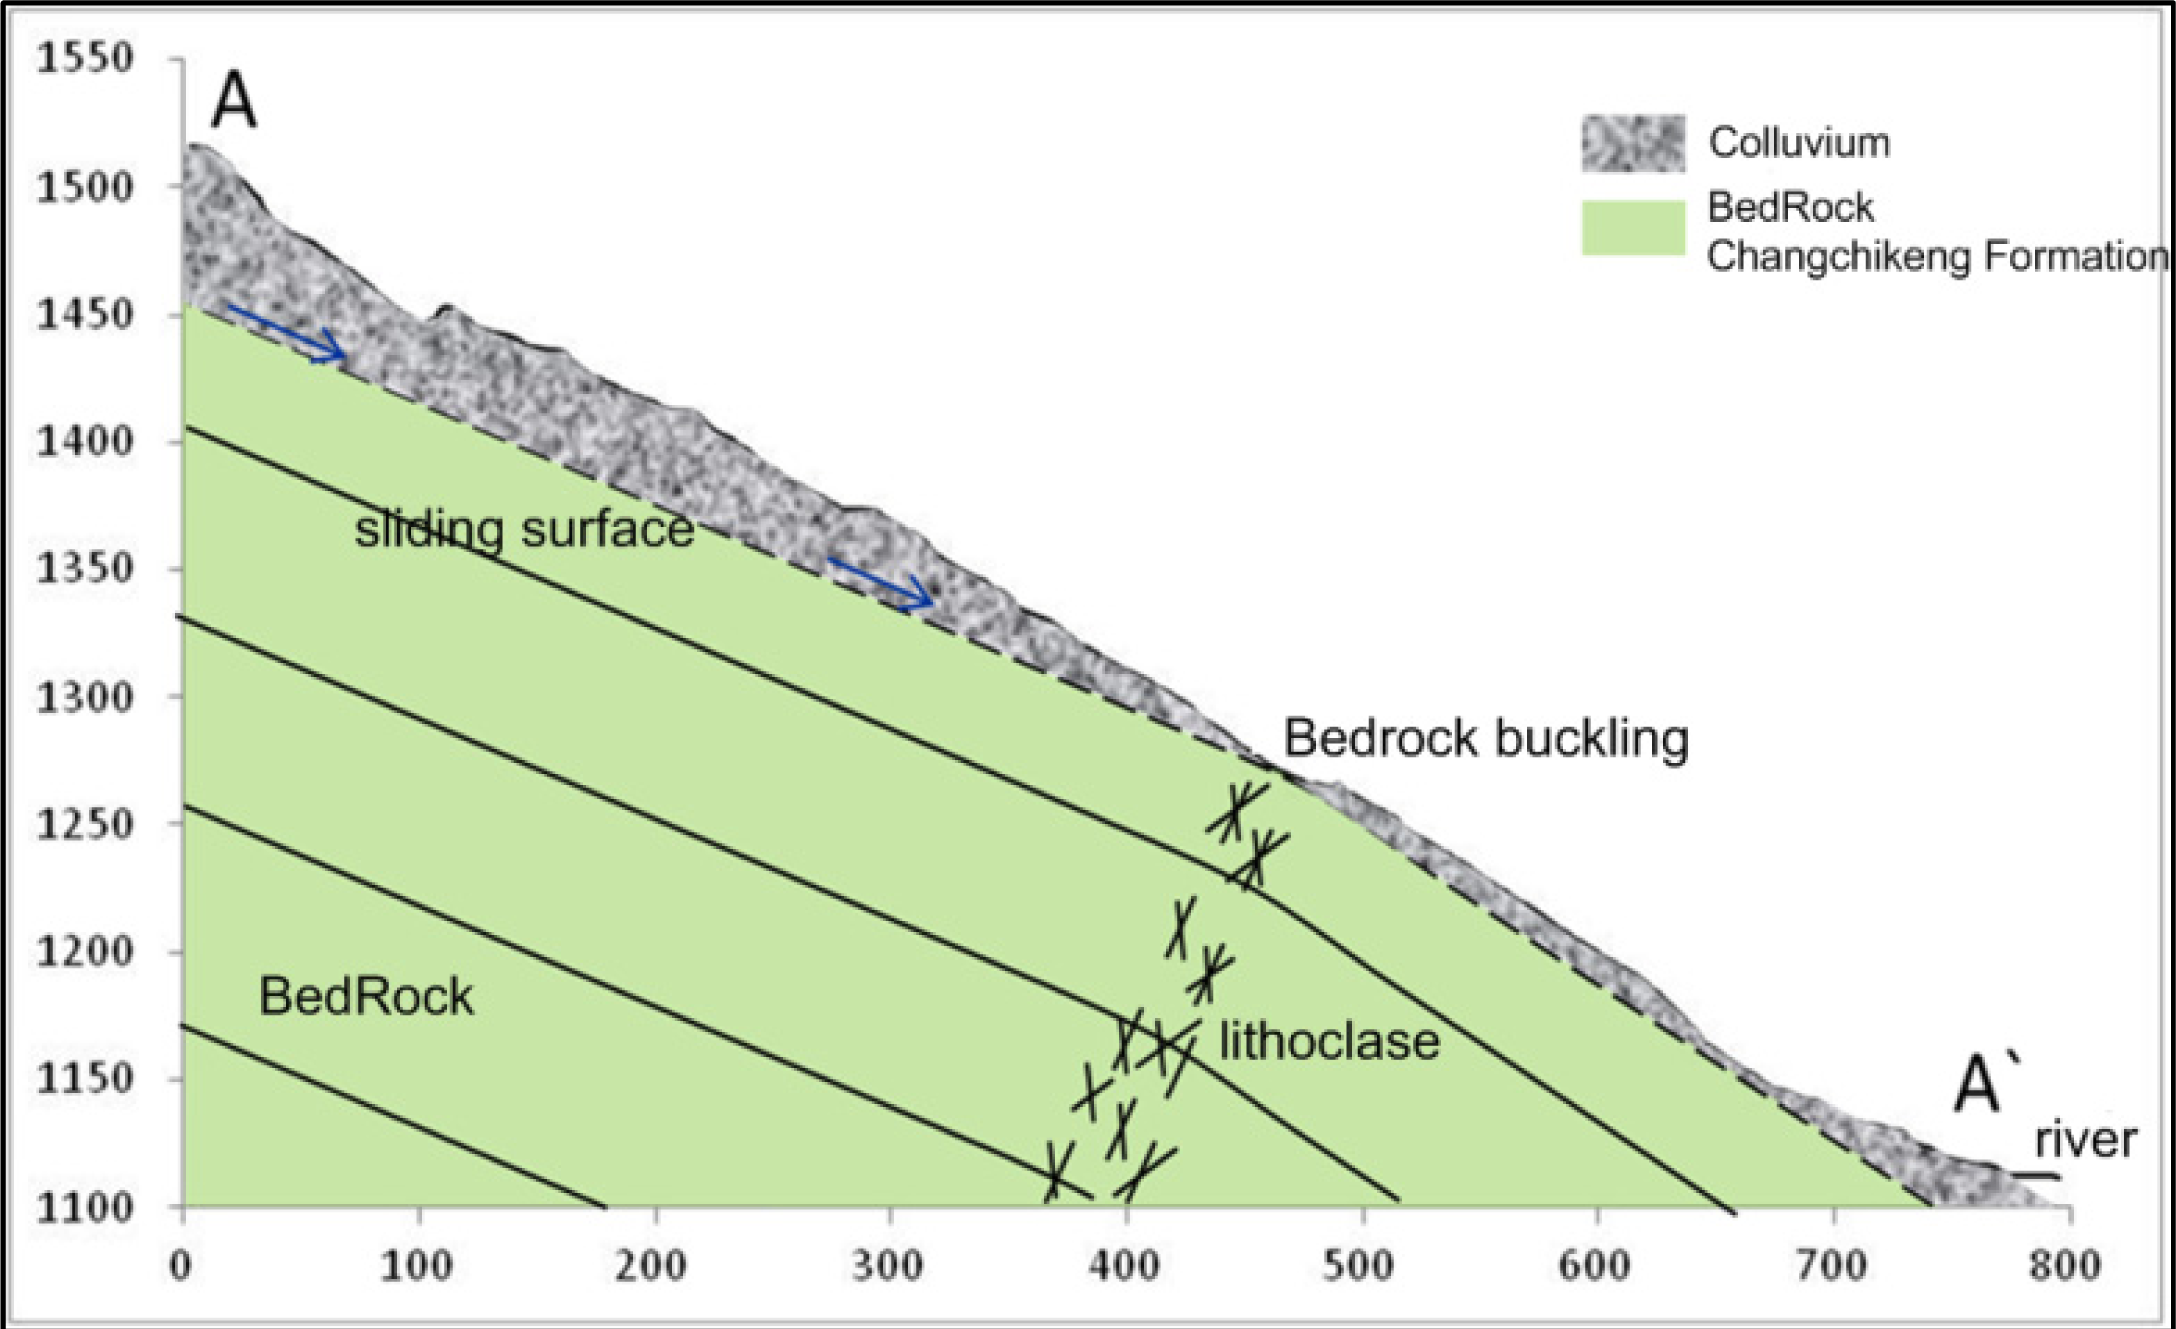
5.2.2. Field Investigation and Stability Analysis of the A112 Large-Scale Landslide
6. Conclusions
Acknowledgments
Conflicts of Interest
References
- Chigira, M. The Potential Area of Large-Scale Landslides; (In Chinese); Scientific & Technical Publishing Co., Ltd: Taipei, Taiwan, 2011. [Google Scholar]
- Lin, M.L.; Wang, K.L.; Chen, S.C.; Feng, Z.Y.; Chang, K.T. Typhoon Morakot Major Hazard Investigation Project: Sub-Project(2), Major Landslide Hazard Investigation (Choshui River and Chishan River Basins); (In Chinese); National Science and Technology Center for Disaster Reduction: Taipei, Taiwan, 2009. [Google Scholar]
- Schulz, W.H. Landslides Mapped Using LIDAR Imagery; US Geological Survey Open-File Report 2004-1396; US Department of the Interior, US Geological Survey: Seattle, WA, USA, 2004. [Google Scholar]
- Schulz, W.H. Landslide Susceptibility Estimated From Mapping Using Light Detection and Ranging (LIDAR) Imagery and Historical Landslide Records; Open-File Report 2005-1405; US Department of the Interior, US Geological Survey: Seattle, WA, USA, 2005. [Google Scholar]
- Miner, A.S.; Flentje, P.; Mazengarb, C.; Windle, D.J. Landslide Recognition using LiDAR derived Digital Elevation Models-Lessons Learnt from Selected Australian Example. Proceedings of 11th IAEG Congress of the International Association of Engineering Geology and the Environment, Auckland, New Zealand, 5–10 September 2010; pp. 5–9.
- Lin, M.L.; Wang, K.L.; Chen, T.C.; Lin, S.C. Case study of severe debris flow hazard caused by typhoon Morakot (In Chinese). Sino-Geotechnics 2009, 122, 123–132. [Google Scholar]
- Shao, P.H.; Kao, M.C. Geologic Map of Taiwan Scale 1:50,000 (Zhongpu); (In Chinese); Central Geological Survey, MOEA: Taipei, Taiwan, 2009. [Google Scholar]
- Sung, Q.C.; Lin, C.W.; Lin, W.H.; Lin, W.C. Geologic Map of Taiwan Scale 1:50,000 (Jiaxian); (In Chinese); Central Geological Survey, MOEA: Taipei, Taiwan, 2000. [Google Scholar]
- Ho, C.S. Introduction to the Geology of Taiwan Explanatory Text of the Geologic Map of Taiwan; (In Chinese); Central Geological Survey, MOEA: Taipei, Taiwan, 1986. [Google Scholar]
- Varnes, D.J. Landslide Types and Processes. In Landslides and Engineering Practice; Highway Research Board Special Report 29; National Research Council (US): Washington, DC, USA, 1958; pp. 20–47. [Google Scholar]
- Varnes, D.J. Slope Movement Types and Processes. In Landslides: Analysis and Control; Transportation Research Board: Washington, DC, USA, 1978; pp. 11–33. [Google Scholar]
- Foundation, N.R.D. Deep-Seated Landslide Susceptibility Analysis in Reservoir Area; (In Chinese); Water Resource Planning Institute, Water Resource Agency, MOEA: Taichung, Taiwan, 2011. [Google Scholar]
- Lin, M.L.; Wang, K.L.; Liao, J.T.; Yu., B.S. Simulation and Monitoring in Areas Susceptible to Landslide Hazard (2/4); (In Chinese); Central Geological Survey, Ministry of Economics: Taipei, Taiwan, 2008. [Google Scholar]


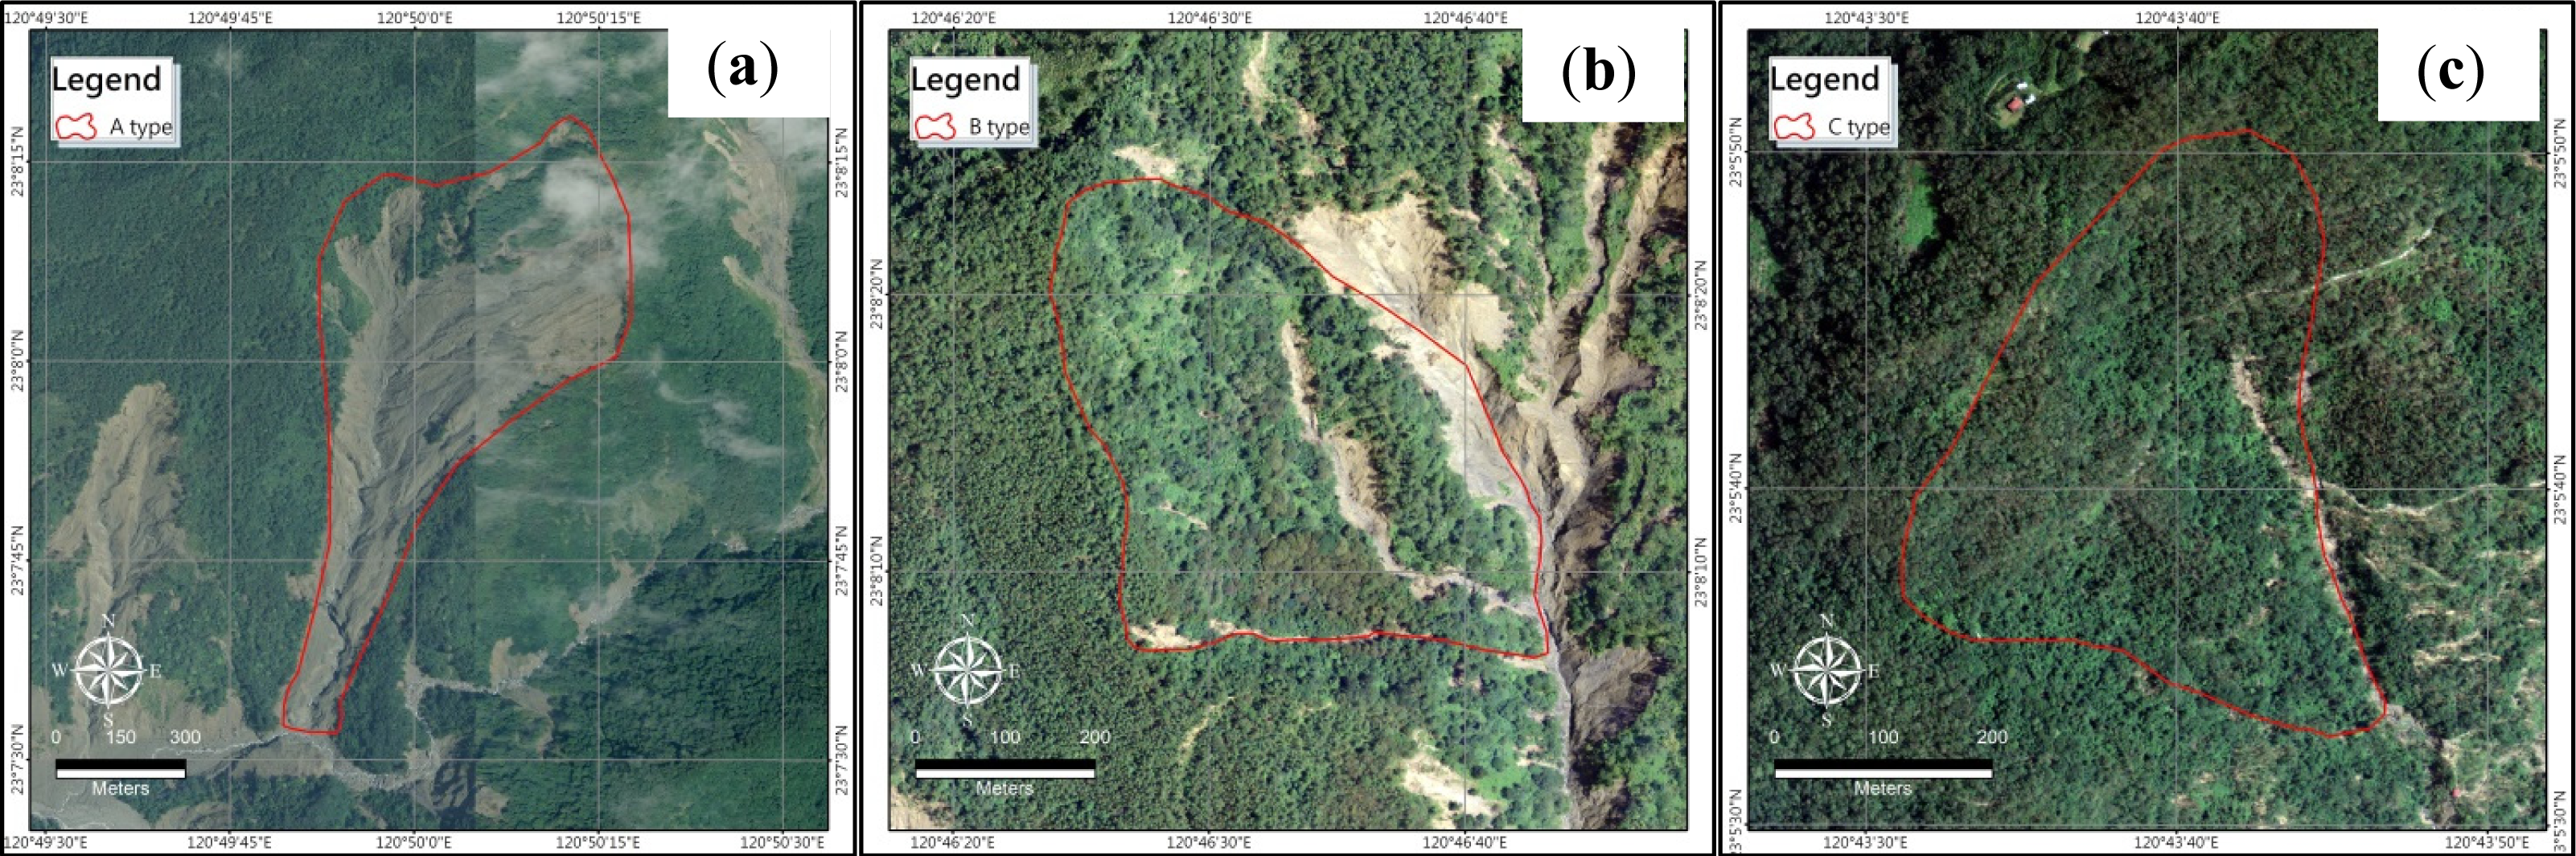
| Type | Classification | Landslide Occurrence | Properties |
|---|---|---|---|
| A | Current event | Landslide | With clear geomorphologic evidences and significant scarps |
| B | Prior event | Landslide | With geomorphologic evidences but no significant scarp |
| C | With geomorphologic evidences | Uncertain | With some geomorphologic evidences |
| D | Without geomorpho-logic evidences | No slide yet | With some geological properties that are prone to landslides |
© 2014 by the authors; licensee MDPI, Basel, Switzerland This article is an open access article distributed under the terms and conditions of the Creative Commons Attribution license ( http://creativecommons.org/licenses/by/3.0/).
Share and Cite
Lin, M.-L.; Chen, T.-W.; Lin, C.-W.; Ho, D.-J.; Cheng, K.-P.; Yin, H.-Y.; Chen, M.-C. Detecting Large-Scale Landslides Using Lidar Data and Aerial Photos in the Namasha-Liuoguey Area, Taiwan. Remote Sens. 2014, 6, 42-63. https://doi.org/10.3390/rs6010042
Lin M-L, Chen T-W, Lin C-W, Ho D-J, Cheng K-P, Yin H-Y, Chen M-C. Detecting Large-Scale Landslides Using Lidar Data and Aerial Photos in the Namasha-Liuoguey Area, Taiwan. Remote Sensing. 2014; 6(1):42-63. https://doi.org/10.3390/rs6010042
Chicago/Turabian StyleLin, Meei-Ling, Te-Wei Chen, Ching-Weei Lin, Dia-Jie Ho, Keng-Ping Cheng, Hsiao-Yuan Yin, and Mei-Chen Chen. 2014. "Detecting Large-Scale Landslides Using Lidar Data and Aerial Photos in the Namasha-Liuoguey Area, Taiwan" Remote Sensing 6, no. 1: 42-63. https://doi.org/10.3390/rs6010042