


Abstract
Historically, the Defense Meteorological Satellite Program’s Operational Linescan System (DMSP-OLS) was the unique satellite sensor used to collect the nighttime light, which is an efficient means to map the global economic activities. Since it was launched in October 2011, the Visible Infrared Imaging Radiometer Suite (VIIRS) sensor on the Suomi National Polar-orbiting Partnership (NPP) Satellite has become a new satellite used to monitor nighttime light. This study performed the first evaluation on the NPP-VIIRS nighttime light imagery in modeling economy, analyzing 31 provincial regions and 393 county regions in China. For each region, the total nighttime light (TNL) and gross regional product (GRP) around the year of 2010 were derived, and a linear regression model was applied on the data. Through the regression, the TNL from NPP-VIIRS were found to exhibit R2 values of 0.8699 and 0.8544 with the provincial GRP and county GRP, respectively, which are significantly stronger than the relationship between the TNL from DMSP-OLS (F16 and F18 satellites) and GRP. Using the regression models, the GRP was predicted from the TNL for each region, and we found that the NPP-VIIRS data is more predictable for the GRP than those of the DMSP-OLS data. This study demonstrates that the recently released NPP-VIIRS nighttime light imagery has a stronger capacity in modeling regional economy than those of the DMSP-OLS data. These findings provide a foundation to model the global and regional economy with the recently availability of the NPP-VIIRS data, especially in the regions where economic census data is difficult to access.
1. Introduction
Regional and global economic data is important to understanding the developing world, and performing an economic census plays a major role in collecting such data. However, the economic census data is sometimes difficult to acquire at both the regional and global scales. In addition, the economic census data is always coarse in the spatial dimension, because the data in the basic administrative regions is inaccessible in many countries. Therefore, surveying the world economy in spatial dimensions using technical approaches as alternatives to the traditional economic census is an important and challenging task for the academic community [1,2].
Compared to the high cost of performing a traditional economic census, a remote sensing technique provides an efficient approach to survey the economy. A typical example is using remotely sensed optical imagery for mapping the urban land use distribution, which is an important indicator of the economic status of a country [3–5]. In addition, remote sensing can also be used to investigate agriculture [6,7], fishery [8,9] and forestry [10], which are important components of a country’s economy. Among the various sources of remote sensing data, nighttime light imagery has played a direct and unique role in investigating economic activities, because the artificial nighttime light can reflect the use of public lighting and commercial lighting, which are strongly associated with the state of the economy. A number of studies have indicated that the nighttime light has a very high correlation with the national and regional economic volume [11,12]. Compared to the census approach, the mapping of nighttime light can help to investigate the economics on a large scale with very low cost; thus, the nighttime light imagery has been used to investigate the regional economics in many countries [13–17].
Traditionally, the nighttime light data is acquired by the Defense Meteorological Satellite Program’s Operational Linescan System (DMSP-OLS) sensors, which is owned by the U.S. Air Force and archived by National Oceanic and Atmospheric Administration (NOAA) of the United States. The first DMSP satellite was launched in 1972, and the digital format of the imagery has been recorded since the year of 1992. From 1992 to the present, there were a series of DMSP satellites (e.g., F10–F18) imaging nighttime light. A DMSP-OLS sensor can acquire images every day, but the daily acquired imagery is usually improper for further analysis, because such image signal strength reduces due to sensor noise, atmospheric effects and moonlight variation. Thus individual DMSP-OLS images taken over a year should be combined together to produce a global annual stable light product, namely the average visible, stable lights and cloud-free composite, which has been produced by the Earth Observation Group in the NOAA National Geophysical Data Center. The composites, at spatial a resolution of 30 arc second, have pixel values ranging between 0 and 63. All the DMSP-OLS composites are available at the website of NOAA ( http://www.ngdc.noaa.gov/dmsp/downloadV4composites.html). Although some nighttime light imagery at higher spatial resolution have been evaluated in environmental and economic fields [18,19], the only practical nighttime light data on economic evaluation was DMSP-OLS data, due to its large coverage area and low price.
A new generation of nighttime light imagery emerged in 2012, the Visible Infrared Imaging Radiometer Suite (VIIRS) nighttime light imagery, acquired by the Suomi National Polar-orbiting Partnership (NPP) Satellite. Similar with the DMSP-OLS nighttime light data, the NPP-VIIRS was initially designed to monitor the atmosphere and environment, and its nighttime light imagery is a byproduct of the data under the cloud-free condition. A more detailed introduction on NPP-VIIRS is provided in the website of National Aeronautics and Space Administration ( http://npp.gsfc.nasa.gov/index.html). On January 3rd, 2013, National Oceanic and Atmosphere Administration (NOAA) released the first global nighttime light imagery derived from the NPP-VIIRS data at its website ( http://www.ngdc.noaa.gov/dmsp/data/viirs_fire/viirs_html/viirs_ntl.html). The imagery was generated by using the VIIRS day/night band data acquired on nights with zero moonlight. The observed individual NPP-VIIRS images in 18–26 April 2012 and 11–23 October 2012 were used, and a cloud mask was introduced using the VIIRS M15 thermal band to produce the global nighttime light imagery.
Although DMSP-OLS nighttime light imagery has shown strong capacity in evaluating economic distribution over both global and regional scales, its weakness is obvious—no on-board radiometric calibration and limited radiometric detection capacity, which results in the over-saturation problem in urban centers [20–23]. All these weaknesses may reduce the correlation between the detected nighttime light and the economic activities. Fortunately, the arrival of NPP-VIIRS, with its on-board radiometric calibration and wider radiometric detection range, can provide a more accurate nighttime light source for economic modeling. Therefore, the purpose of this study is to investigate the potential of NPP-VIIRS nighttime light imagery in modeling a regional economy, with a comparative analysis between the DMSP-OLS data and the NPP-VIIRS data.
2. Study Area and Data
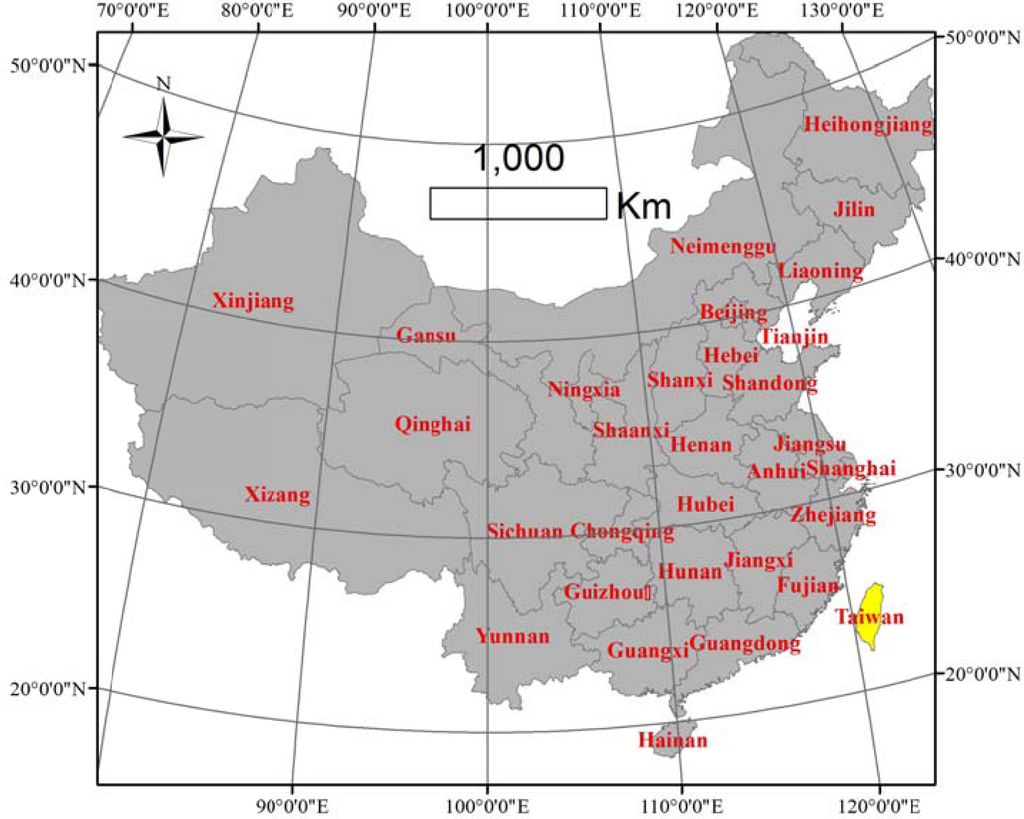
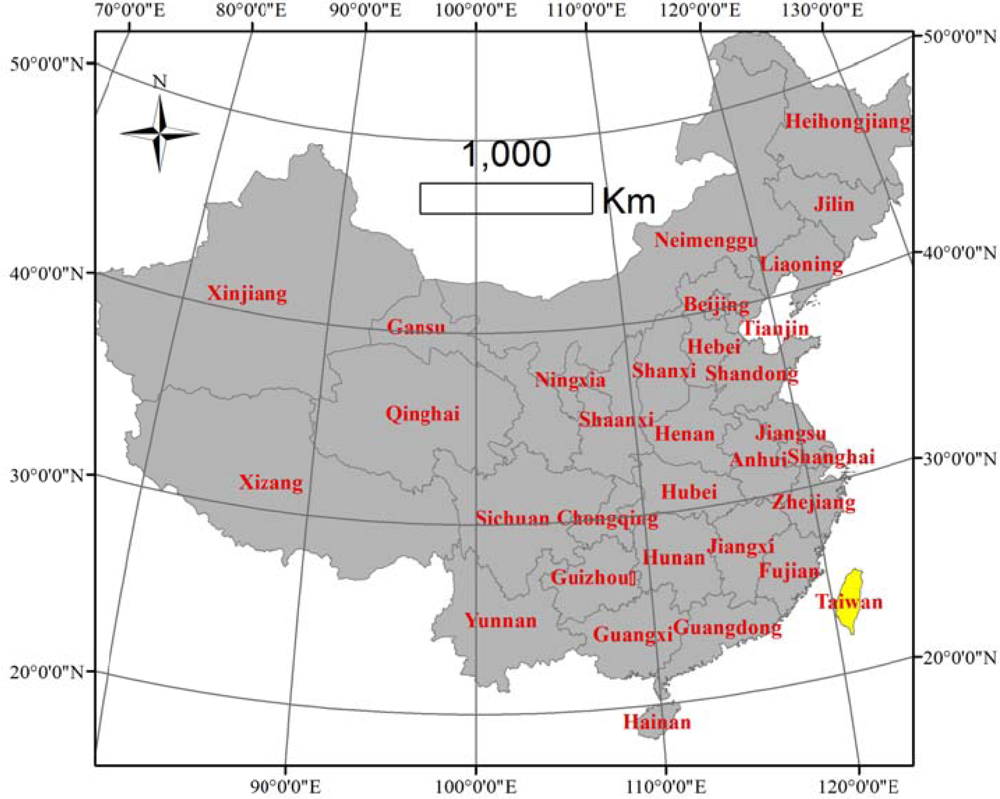
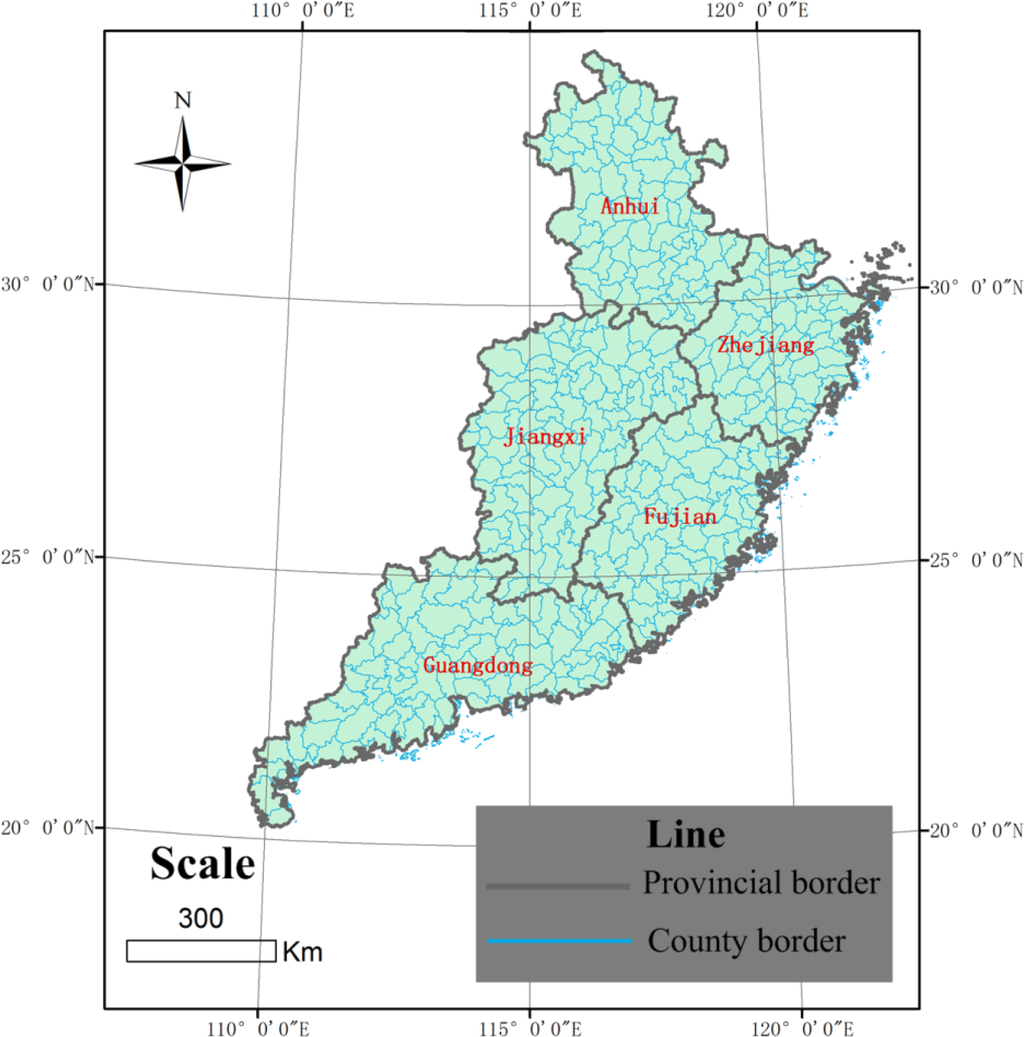
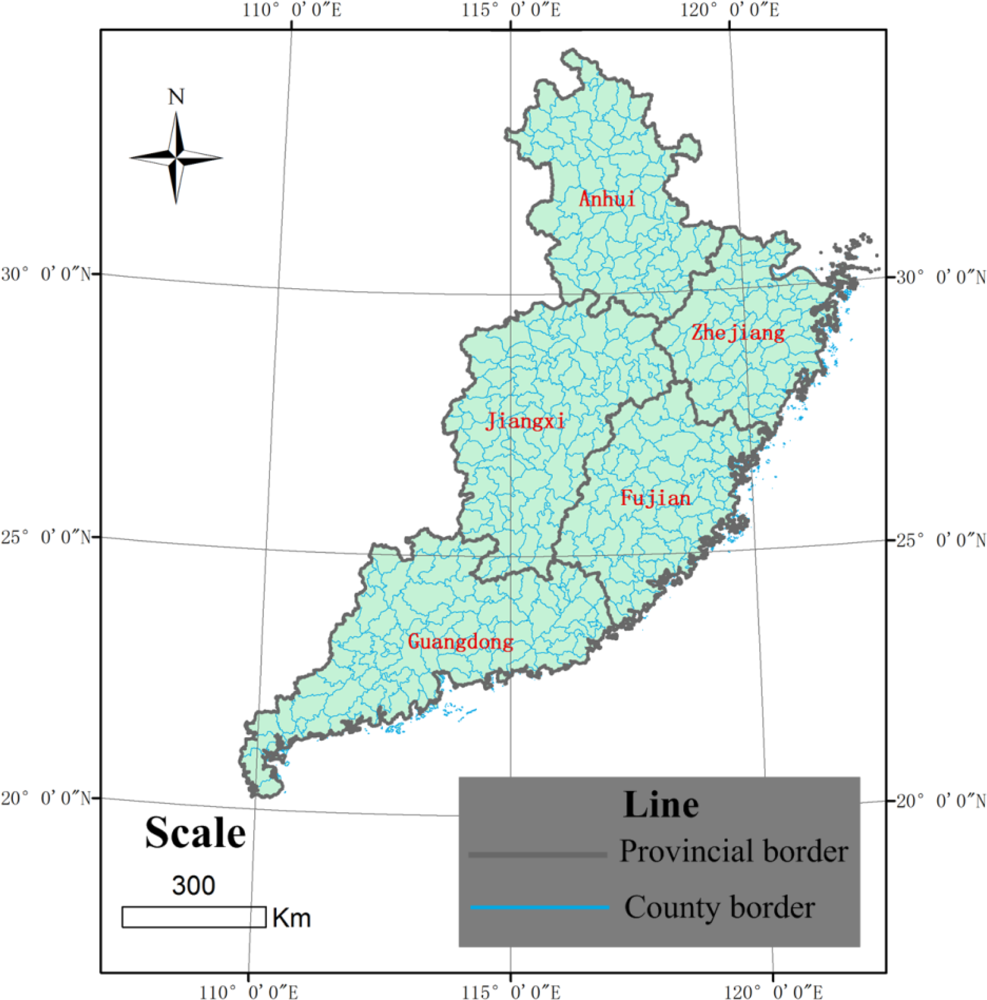
To evaluate the potential of NPP-VIIRS nighttime light imagery in modeling a regional economy, we used China’s provincial and county level administrative regions for analysis. In China, there are three major levels of administrative areas: province, prefecture and county. In this study, all the provincial regions, except Hong Kong, Macau and Taiwan, were selected, resulting in 31 provincial regions for analysis. At the county level, there are over 2000 counties in China, of which the administrative boundary is difficult to acquire one by one. Counties in five provinces, Anhui, Fujian, Guangdong, Jiangxi and Zhejiang were used, and as a result, there are 393 county level regions for analysis. More specifically, in this study, the county level regions include three types: municipality in a prefecture-level city, county and county level city. In fact, the municipality has a higher administrative rank than a county, but the economic data and boundaries of its districts are difficult to collect from public sources; thus, each municipality is treated as a statistical region along with the county level region. Figure 1 and Figure 2 illustrate the 31 provinces and 393 county level regions as maps, respectively, and Table 1 lists the number of county level regions in the five provinces.
Figure 1.
The 31 provinces in China’s mainland for analysis in this study. Note: this map is not a full map of China and only shows the regions used in this study, so that Hong Kong, Macao, all the islands and the ocean are not illustrated in this map.
Figure 2.
The 393 county level regions in the five provinces for analysis in this study.
Table 1.
The numbers of the county level regions in the five provinces.
In this study, the DMSP-OLS data and NPP-VIIRS data were used. Because the NPP-VIIRS data is only available for the year 2012, we chose the DMSP-OLS data with an acquisition year close to 2012; the closest available DMSP-OLS data are the annual stable nighttime light composites in 2009 and 2010, which were acquired by the F16 and F18 satellites, respectively. The NPP-VIIRS imagery is a preliminary product, which contains lights from cities, towns, transportation corridors, gas flares, and biomass burning and background noise, and in some places has features associated with the reflectance of light off bright surfaces, such as snow covered mountains or bright playa lake beds. In addition, the confounding factors that are irrelevant to economic activities must be removed. We propose a simple and approximate process for removing the confounding factors, which uses a hypothesis that the lit areas in 2010 and 2012 are the same, and is based on the following process: generate a mask with all positive value pixels from the DMSP-OLS imagery in 2010 and multiply the NPP-VIIRS imagery by the mask to derive a denoised nighttime light imagery. The hypothesis is approximately correct because there should be a small number of pixels where the lit value increased from zero to positive. Nevertheless, the process is efficient and the data quality has been improved.
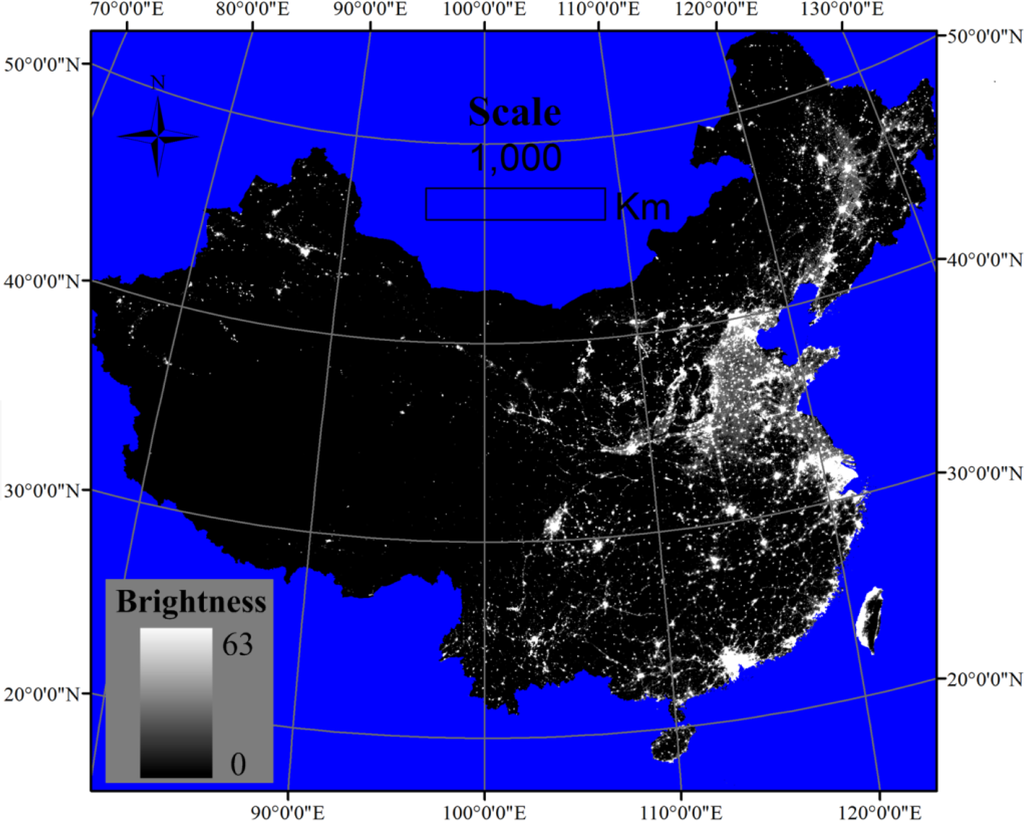
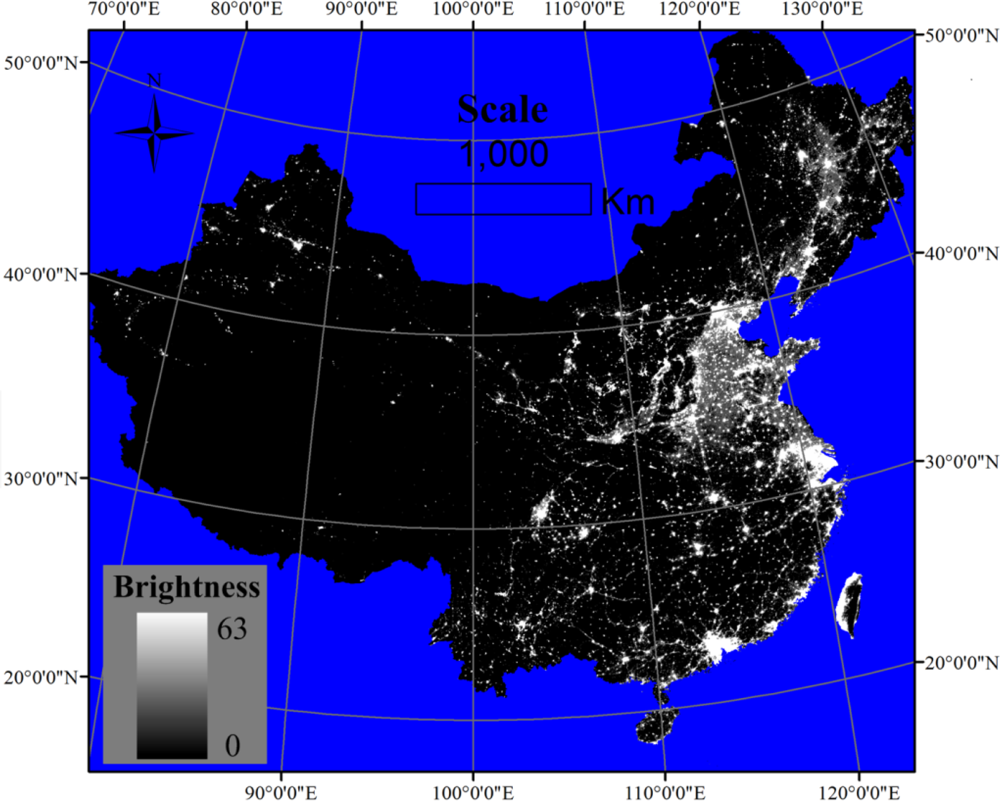
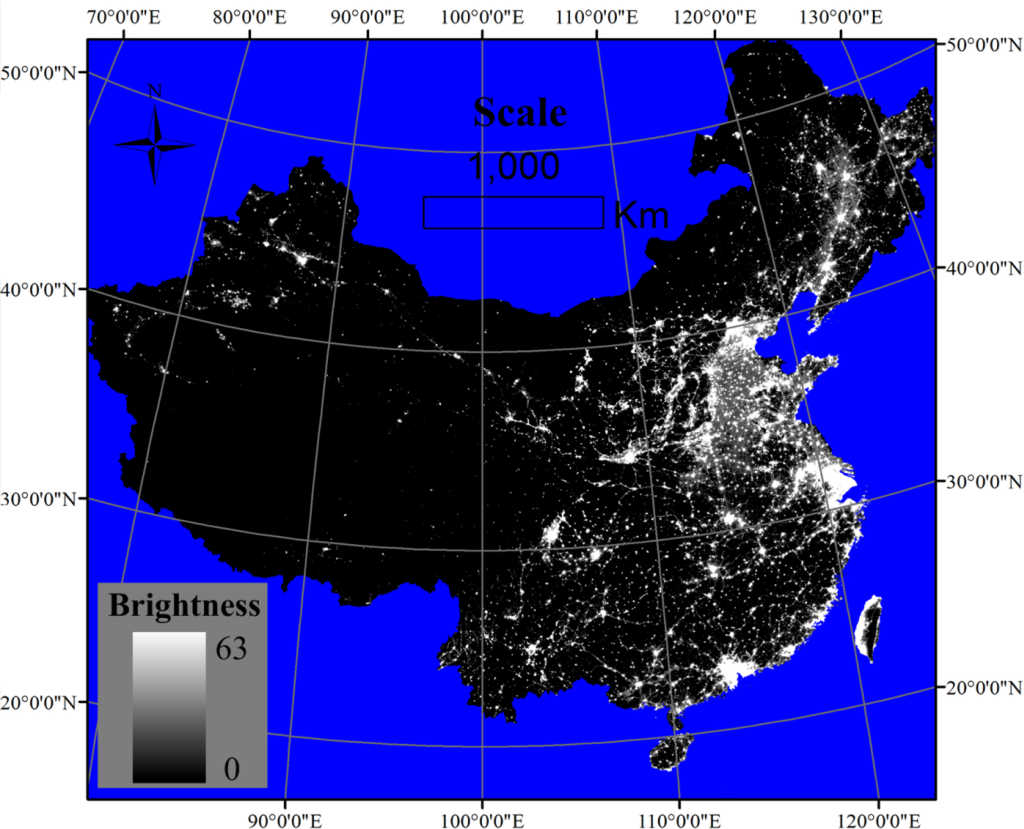
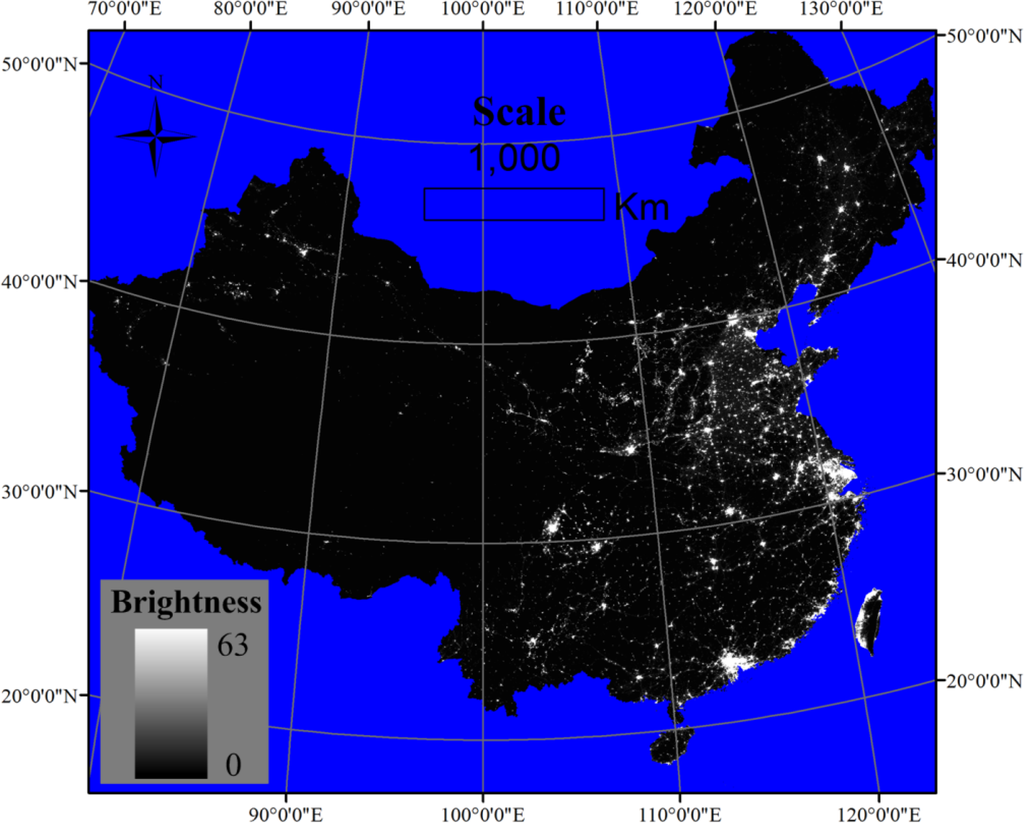
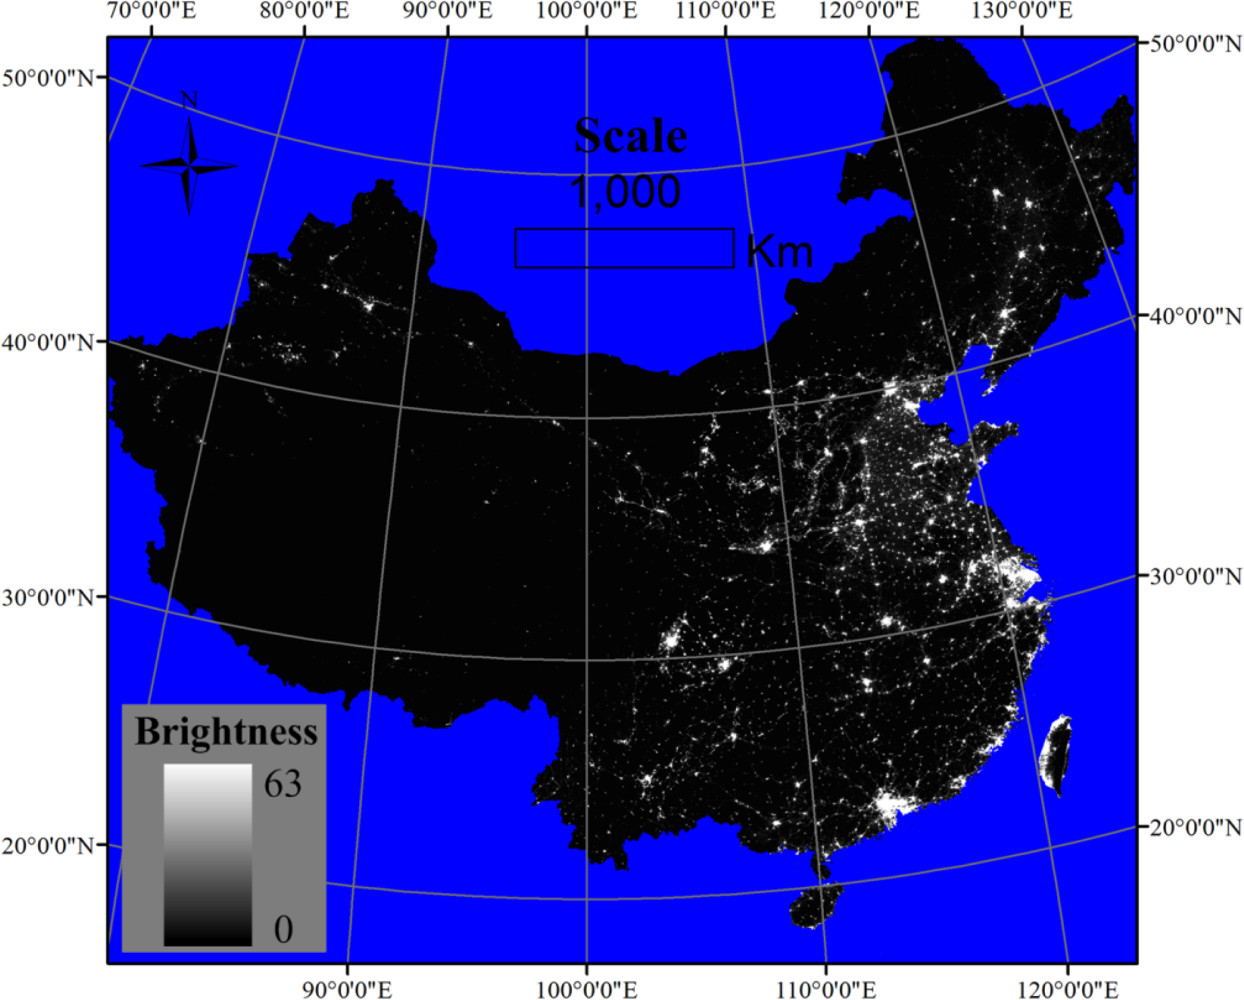
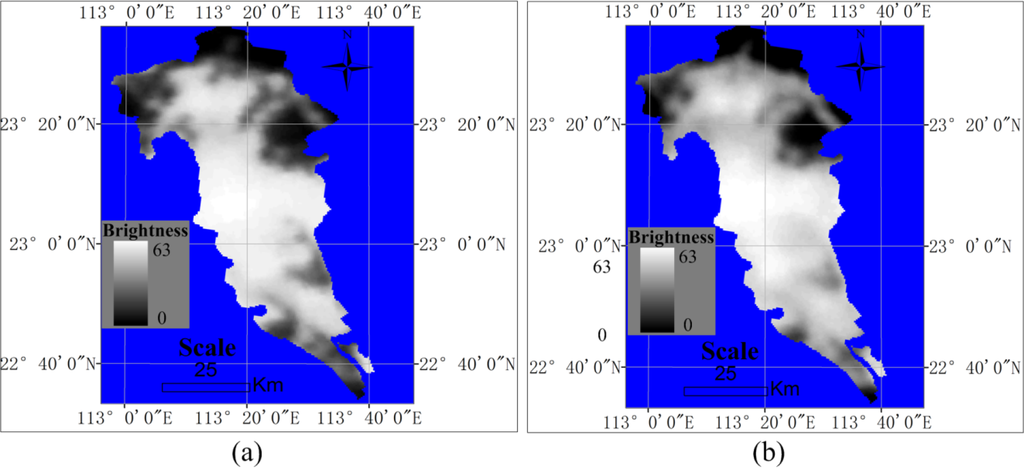
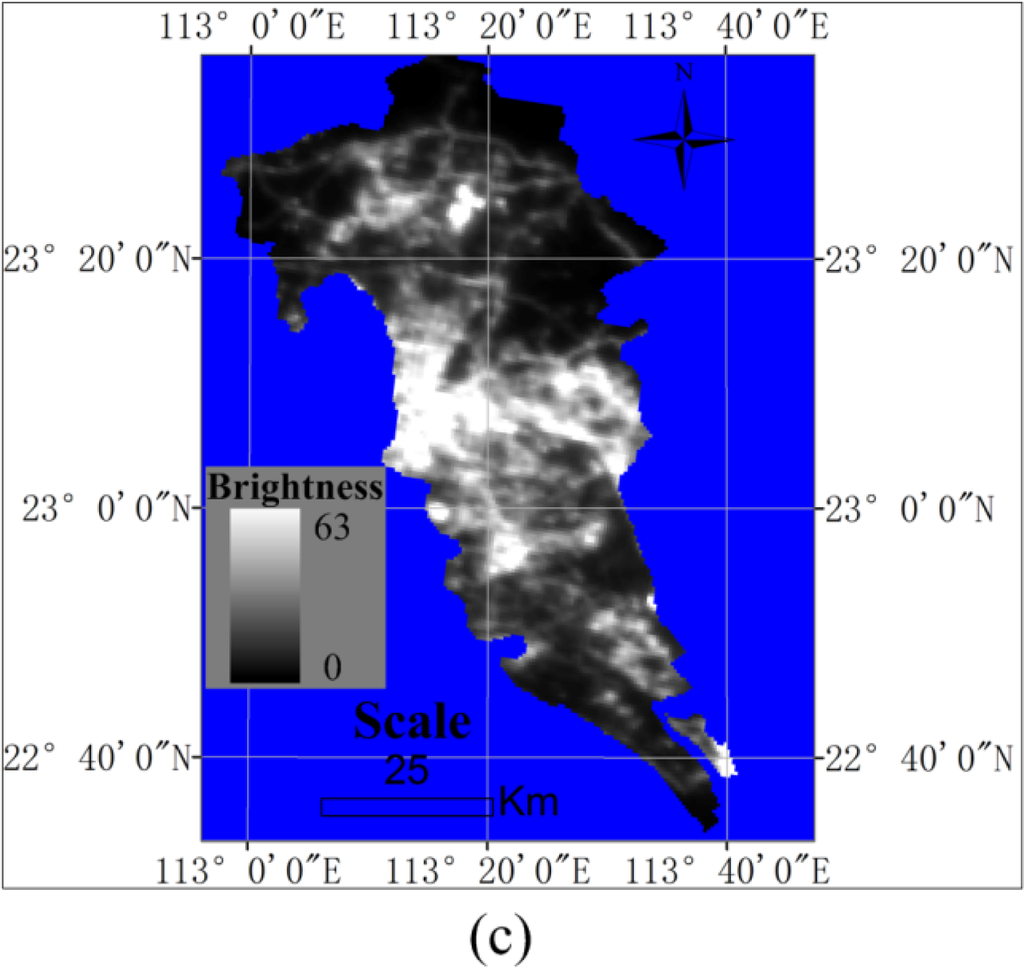
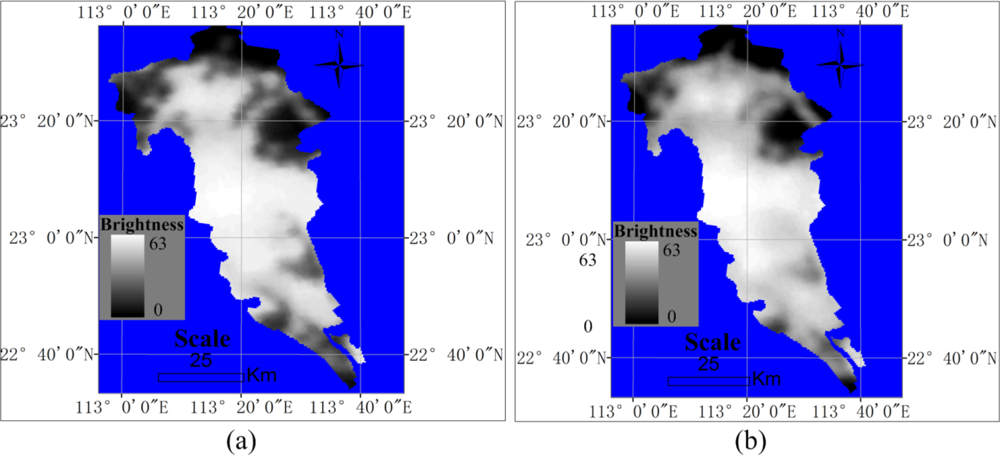
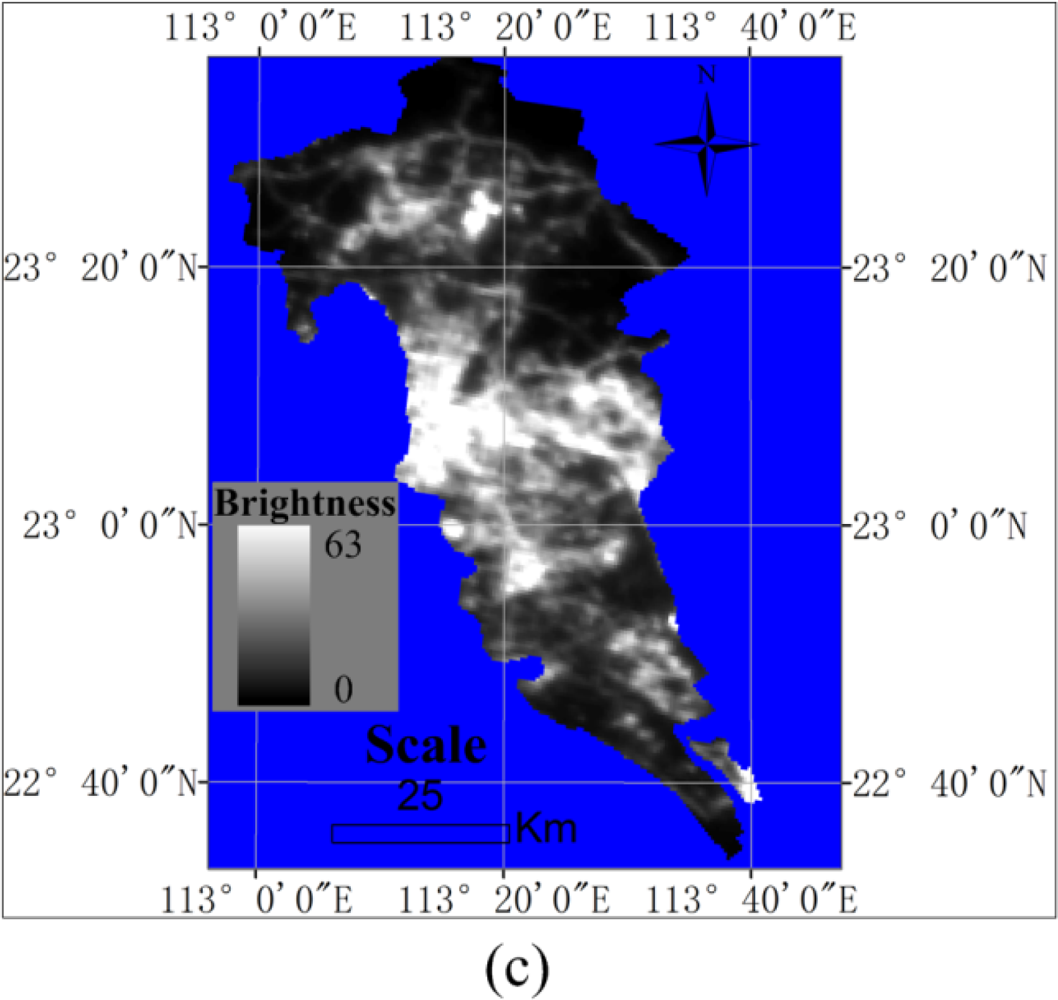
All the nighttime light imagery was reprojected to a Lambert azimuthal equal area projection with a spatial resolution at 500 m. The two types of nighttime light data are described in Table 2. The nighttime light imagery of China in 2009, 2010 and 2012 are shown in Figures 3, 4 and 5, respectively. In addition, the nighttime light imagery in Guangzhou municipality was shown as a local case in Figure 6.
Table 2.
Spatial resolution of the nighttime light imagery in this study
Figure 3.
DMSP-OLS (F16 satellite) nighttime light imagery of China’s land in 2009.
Figure 4.
DMSP-OLS (F18 satellite) nighttime light imagery of China’s land in 2010.
Figure 5.
NPP-VIIRS nighttime light imagery of China’s land in 2012. Note: the VIIRS imagery has a wide radiometric detection limit, so that there is a number of pixels with values greater than 63, but pixels of this type only occupy approximately 0.05% of all the pixels with positive values, so the pixel values larger than 63 is set to the brightest color in the map to keep it consistent with the DMSP-OLS data for illustration.
Figure 6.
The nighttime light in Guangzhou municipality: (a) DMSP-OLS (F16 satellite) data in 2009, (b) DMSP-OLS (F18 satellite) data in 2010, and (c) NPP-VIIRS data in 2012.
The gross regional production (GRP) data for each county level region and provincial region is derived from China Statistical Yearbook for Regional Economy and Urban Statistical Yearbook of China [24,25]. The Chinese currency unit of the GRP is Renminbi (RMB), also called Chinese Yuan.
3. Methodology and Analysis
3.1. Linear Regression Model
To evaluate the capacity of nighttime light imagery in modeling the economy, we prepare the GRP data and nighttime light data for each administrative region and perform a regression analysis to quantify the relationship between the two types of data. The total nighttime light (TNL), defined as the sum of all pixel values in a region of an image [22], is used as the nighttime light data to characterize an administrative region. Because the GRP data in 2012 is not available, the TNL data in 2012 was associated with the 2010 GRP data. A linear regression model without an intercept was used to describe the relationship between GRP and TNL as
where g denotes the GRP, t denotes the TNL and w represents the slope. At the provincial level, the GRP data and the TNL data were analyzed for the 31 provincial regions using the regression analysis. At the county level, the GRP data and the TNL data were analyzed for the 393 county level regions. To describe the regression analysis more clearly, the analysis data is listed in Table 3.
Table 3.
The total nighttime light (TNL) and gross regional product (GRP) for the regression analysis of data from different satellite sensors and acquisition year.
3.2. Regression Results
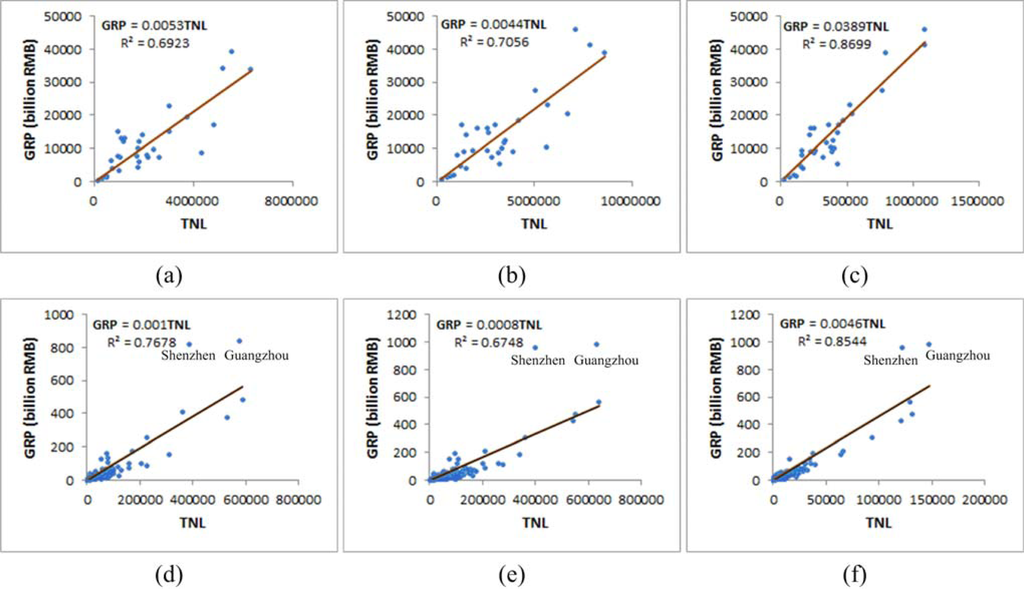
Through the linear regression, the TNL-GRP relationship was analyzed, as shown in Figure 7. At the provincial level, the R2 of the DMSP-OLS data with GRP are 0.6923 in 2009 (DMSP-F16 satellite) and 0.7056 in 2010 (DMSP-F18 satellite), whereas that of the NPP-VIIRS data with GRP is 0.8699 in 2010. The results show that the VIIRS data can better reflect the GRP than the DMSP-OLS data in provincial regions.
Figure 7.
The scatter diagram of the regression variables in provincial regions and in county regions: (a) DMSP-OLS (satellite DMSP-F16) data in 2009 versus GRP data in 2009 of the provincial regions, (b) DMSP-OLS (satellite DMSP-F18) data in 2010 versus GRP data in 2010 of the provincial regions, (c) NPP-VIIRS data in 2012 versus GRP data in 2010 of the provincial regions, (d) DMSP-OLS (satellite DMSP-F16) data in 2009 versus GRP data in 2009 of the county regions, (e) DMSP-OLS (satellite DMSP-F18) data in 2010 versus GRP data in 2010 of the county regions and (f) NPP-VIIRS data in 2012 versus GRP data in 2010 of county regions.
At the county level, we found that the TNL-GRP relationship from the VIIRS data is stronger than those of the DMSP-OLS data. The R2 values are 0.7678 and 0.6748 for the data from 2009 (DMSP-F16 satellite) and 2010 (DMSP-F16 satellite), respectively, which are lower than 0.8544, the R2 value from the NPP-VIIRS data. Thus, NPP-VIIRS data is more strongly correlated with GRP than those of DMSP-OLS data from both the DMSP-F16 and DMSP-F18 satellites at the county level.
From the regression analysis, it is easy to determine that the NPP-VIIRS imagery has higher capacity in modeling the GRP. Here, we use the regression model to predict the GRP from nighttime light to evaluate the capacity of TNL in predicting GRP. For each region, a predicted GRP is calculated from the slope values and TNL using Equation (2). Because the numbers of provincial regions and county regions are 31 and 393, respectively, of which the latter is too large to be shown in a table; thus, we only list the real GRP and predicted GRP of the provincial regions in Table 4 and list the county data in the Appendix. Next, a relative error was used to evaluate the capacity of TNL in predicting GRP as
where g denotes the real GRP and g′ denotes the predicted GRP. The relative error values of all the provincial regions are listed in Table 4.
Table 4.
Real GRP, predicted GRP and relative error in the provincial regions. RG represents real GRP, PG represents predicted GRP and RE represents the relative error.
From Table 4, we found that the predictability of different nighttime light sensors varies in different provincial regions. For example, the relative error of the predicted GRP in 2009 derived from DMSP-OLS data in 2009 in Liaoning Province and Heilongjiang Province are 5.3% and 168.4%, respectively, which are very different. In comparison, the counterparts of the predicted GRP in 2010 derived from the NPP-VIIRS data in 2012 are −1.7% and 40.4%, respectively, which are much closer.
To evaluate the predictability of different nighttime light data for the GRP comprehensively, we classified the absolute relative error into three levels: 0–25% as high accuracy, 25–50% as moderate accuracy and >50% as wrong. Next, we calculated the percent of each level for the different estimation approaches. For example, when estimating the GRP from the DMSP-OLS data in 2009 in the provincial regions, there are nine provincial regions with high accuracy among the 31 regions, and the fraction of provincial regions of high accuracy is 29.03%. Based on this criterion, the predictability for each type of nighttime light imagery was quantified with the three indices listed in Table 5.
Table 5.
Different levels of accuracies of the predicted GRP.
In the provincial regions, the NPP-VIIRS data exhibits a high capacity in predicting the GRP, with a high accuracy percent of 54.84%, which is much higher than those of the DMSP-OLS data in 2009 and 2010, as indicated in the table. In addition, the fraction of the data providing wrong predictions from the NPP-VIIRS data (29.03%) is much lower than those of the DMSP-OLS data in 2009 (41.94%) and 2010 (38.71%) as Table 5 indicates. Therefore, the NPP-VIIRS data is more reliable for predicting the GRP data in China’s provincial regions.
In the county regions, the fraction of high accuracy predictions from the NPP-VIIRS data is 34.10%, which is significantly higher than those of the DMSP data in 2009 and 2010, with values of 18.32% and 10.69%, respectively. The wrong percent index also demonstrates that the NPP-VIIRS data in more capable in accurately predicting the GRP than those of the DMSP data in 2009 and 2010, as indicated in Table 5.
Thus, we can conclude that the NPP-VIIRS data is more reliable for predicting the economic data than those of the DMSP-OLS data, and the NPP-VIIRS data is more robust in different spatial scales than those of the DMSP-OLS data. In addition, it is interesting to find a general underestimation in more developed regions (e.g., Beijing, Shanghai) and overestimation in less developed areas (e.g., Ningxia, Xinjinag, and Tibet). To explore this pattern in the NPP-VIIRS data, we performed a correlation analysis between the GRP Per Capita in 2010 and the relative error for the 31 provincial level regions, and found that the correlation coefficient is equal to −0.3849 under a significance level of 0.05, which indicates that the relative error has significant negative correlation with the GRP Per Capita.
3.3. Regression Analysis in the County Level Regions by Discarding Two Outliers
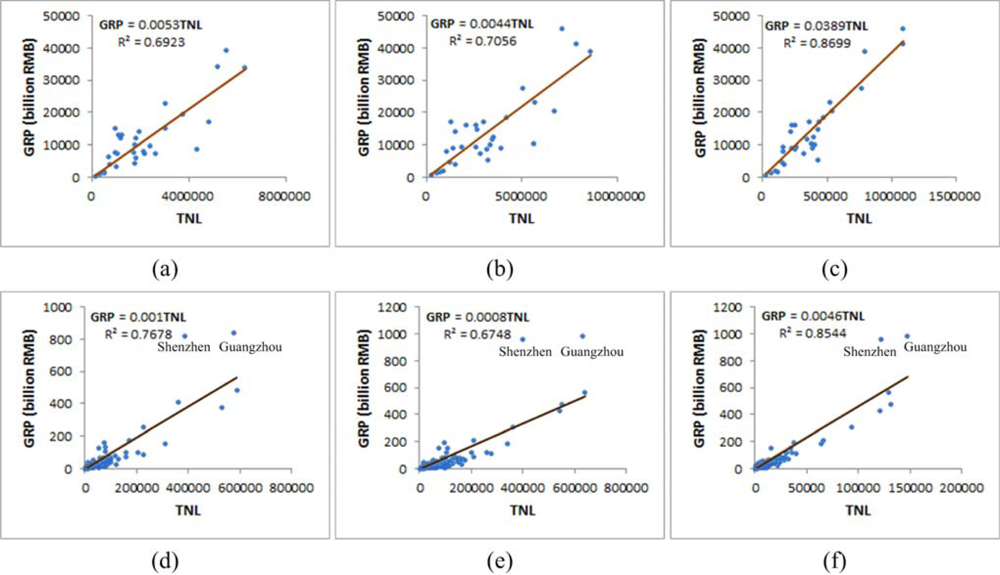
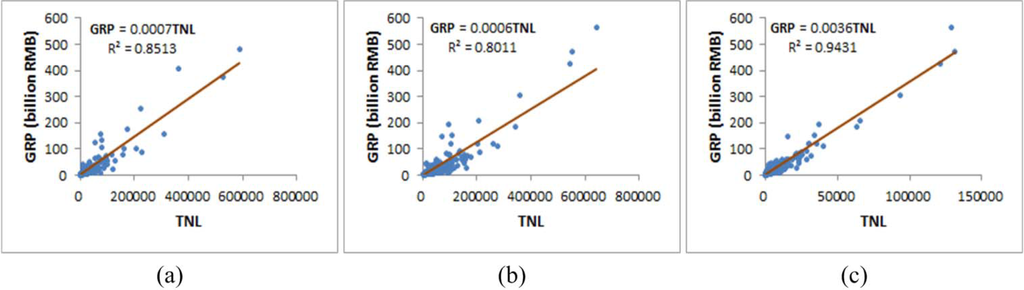
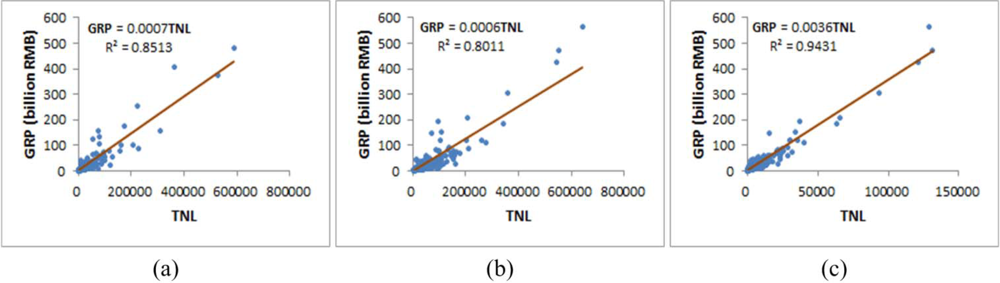
There are two obvious outliers in the regression analysis of the county regions in the above section (Figure 7), Guangzhou and Shenzhen, which are two major economic centers in Southern China. A possible reason for these outliers is that more GRP can be generated in these regions per unit NTL. Here, we discarded the two outliers and performed the regression analysis, which left 391 county regions for the regression analysis. The results of the regression analysis and its predictability analysis are shown in Figure 8 and Table 6, respectively.
Figure 8.
The scatter diagram of the regression analysis in the county regions after discarding Guangzhou and Shenzhen as outliers: (a) DMSP-OLS data in 2009 versus the GRP data in 2009 of the county regions, (b) DMSP-OLS data in 2010 versus the GRP data 2010 of the county regions, and (c) NPP-VIIRS data in 2012 versus the GRP data in 2010 of the county regions.
Table 6.
Different levels of accuracies of the predicted GRP by discarding the two outliers.
From Figure 8, the R2 of the DMSP-OLS data in 2009, that in 2010 and the NPP-VIIRS data are 0.8513, 0.8011 and 0.9431, respectively, all of which are all significantly improved by discarding the two outliers, as demonstrated by comparison to the corresponding original R2 values of 0.7678, 0.6748 and 0.8544 (Figure 7). In particular, the NPP-VIIRS data are perfectly correlated with the GRP data, with an R2 of 0.9431. In addition, removing the outliers also greatly improved the predictability of all the nighttime light data, as indicated in Table 6—the high accuracy percentage increases and the wrongly predicted percentage decreases, as listed in Tables 5 and 6. These findings demonstrate that ability of the DMSP-OLS and NPP-VIIRS data to model the GRP can be greatly improved in county regions by discarding only very a few outliers. Furthermore, the NPP-VIIRS data is still more predictable in reflecting the GRP than those of the DMSP-OLS data under this condition.
3.4. Potential Factors behind the Results
From the experiments, the NPP-VIIRS nighttime light imagery exhibits a stronger ability than the DMSP-OLS nighttime light imagery to model and predict the gross regional product (GRP) in China. Due to absence of the GRP data in 2012, we made use of the 2012 NPP-VIIRS nighttime light imagery to model the GRP in 2010. Although there is a two-year gap between the NPP-VIIRS data and the GRP data, the NPP-VIIRS data exhibited good performance in modeling the GRP data. Naturally, we can infer that when using the NPP-VIIRS data to model the GRP data in the same year, the relationship should be stronger. Moreover, the NPP-VIIRS imagery we used is a primary product made by NOAA, who did not remove the background noise and some temporary lit sources, e.g., forest fires. To deal with this problem, we used a mask derived from the DMSP-OLS data in 2010 to only include the stable artificial lit sources to make the NPP-VIIRS data more efficient. Because the DMSP-OLS composites are generated from many individual images from one year with a series of advanced processing steps, such as denoising, while the NPP-VIIRS is only generated from several images without denoising, the two types of data cannot be directly compared. Nevertheless, the NPP-VIRRS data provided the best results, and there is significant room for improvement in the NPP-VIIRS data quality and NOAA is working to improve the data.
There are three potential factors that should make NPP-VIIRS imagery more efficient than the DMSP-OLS imagery in modeling the economy. First, the DMSP-OLS imagery has a serious problem of over-saturation in city centers because of the limitation of the radiometric detection ability [26]. To support this point of view, we calculated the ratio of the over-saturation area to the lit area for each provincial region from the DMSP-OLS data in 2010, and three regions, Beijing, Shanghai and Tianjin, were found to be in top three, with the ratio values of 13.82%, 13.41% and 4.93%, respectively. Because these three regions are highly over-saturated lit regions, the regression model significantly underestimated the GRP of the regions of Beijing, Shanghai and Tianjin, with relative errors of −54.6%, −67.9% and −35.6%, respectively, while the relative errors from the NPP-VIIRS estimation for Beijing, Shanghai and Tianjin were −40.6%, −17.9% and −5.0%, respectively (Table 4). Therefore, the GRP estimation can be improved significantly in the over-saturated regions when using the NPP-VIIRS data instead of the DMSP-OLS data. Second, while DMSP-OLS performs measurements around dusk or dawn, NPP-VIIRS performs measurements around midnight. Because human activities are often affected by time, the timing differences could have a big impact on sensors’ capability to capture economic activities. Third, the onboard calibration on NPP-VIIRS, which is absent on DMSP-OLS, can also have a huge impact on data quality. The mechanism of the above three factors are primarily inferred, and more rigorous investigations should be taken to clarify them.
4. Discussion
Although there were several remotely sensed nighttime light sources of data [11,18,19], the only global source for economic modeling was the DMSP-OLS data, which is useful in mapping the spatial distribution of the economy. Nevertheless, the DMSP-OLS has severe limits in spatial resolution and radiometric detection range [22], which hinder accurate economic modeling. The optimal manner to observe the global nighttime light is by using the Nightsat Mission concept [27], which aims to develop a specific remote sensing satellite to comprehensively record the light at fine spatial, temporal, spectral and radiometric resolution. However, due to the high cost and technical requirements, the Nightsat Mission is only in the blueprint stage. Under this background, the NPP-VIIRS nighttime light imagery, a byproduct of the recently launched Suomi NPP satellite, is currently making great progress in acting as a bridge to the Nightsat mission from the DMSP satellites.
Historically, modeling China’s regional economy using nighttime light imagery mainly takes prefecture and provincial level regions as material for analysis [13,17], and it is the first time to make the analysis in China’s county level regions which is more valuable than those of the provincial and prefectural regions since the these regions are basic statistical units in China and their statistical data are more likely to have error. Like the previous work of modeling regional economy [13,14], the nighttime light data cannot model the regional economy as the unique source because the regression model should be set up with samples from economic data in the same country or region. Therefore, prior knowledge is needed when using the nighttime light in modeling regional economy.
Since the product of the global NPP-VIIRS nighttime light imagery was released by NOAA in 2013, there has been no published work related to the NPP-VIIRS nighttime light imagery, and this study is the first evaluation of NPP-VIIRS nighttime light imagery which proves the its stronger capacity in modeling regional economy than the DMSP-OLS nighttime light imagery.
5. Conclusion
The Visible Infrared Imaging Radiometer Suite (VIIRS) sensor on the Suomi National Polar-orbiting Partnership (NPP) Satellite is a new generation sensor to record nighttime light, while this task was only assigned to the Defense Meteorological Satellite Program’s Operational Linescan System (DMSP-OLS) before 2011. As economic modeling is the a work that nighttime light imagery can efficiently deal with, this study made a first evaluation of the NPP-VIIRS nighttime light imagery by modeling China’s regional economy in 31 provincial units and 393 county units.
Through regression analysis, the NPP-VIIRS data was found to exhibit a stronger capacity in modeling the regional economy compared with the nighttime light data acquired from the DMSP/F16 and DMSP/F18 satellites. Quantitatively, the total nighttime light (TNL) from NPP-VIIRS were found to exhibit R2 values of 0.8699 and 0.8544 with the provincial GRP and county GRP, respectively, which are significantly stronger than the relationship (R2 at 0.6923 and 0.7678 for F16 satellite and R2 at 0.7056 and 0.6748 for F18 satellite) between the TNL from DMSP-OLS and GRP. And it is interesting find the TNL-GRP relationship can be significantly improved by discarding only two outliers in the regression analysis of the county level regions, making the R2 values from 0.7678, 0.6748 and 0.8544 to 0.8513, 0.8011 and 0.9431 for DMSP-OLS/F16, DMSP-OLS/F18 and NPP-VIIRS, respectively. With this improvement, TNL from the NPP-VIIRS imagery can be used to predict the GRP in county level regions with 42.97% of them in high accuracy, while the rates of the DMSP-OLS/ F16 and DMSP-OLS/ F18 are 36.06% and 19.18%, respectively. All these results demonstrate that the NPP-VIIRS data is more powerful than the DMSP-OLS data in modeling regional economy.
The good performance of the NPP-VIIRS data revealed by our analysis provides a quantitative foundation to use such imagery as data source for taking the economic census in the countries with low-quality statistical systems and countries where economic data is blocked to the outside. Consequently, such economic census data can help international community to provide humanitarian aid to the regions under economic crisis and humanitarian disasters.
Since NPP-VIIRS imagery is a recently emerging data source, all the released data is one scene of images acquired in 2012, which is insufficient to make a comprehensive evaluation. As the National Oceanic and Atmospheric Administration (NOAA) is working to produce more and higher quality NPP-VIIRS nighttime light imagery, future study can be taken on multi-temporal analysis of the imagery in many fields such as land cover mapping, change detection, energy consumption evaluation and fishing boats detection. Besides, more advanced technique should be developed to analyze this kind of imagery because of its higher spatial resolution than the traditional DMSP-OLS nighttime light imagery.
Acknowledgments
We would like to thank the anonymous reviewers who gave very helpful comments to improve the quality of this paper. This research was supported by the National Natural Science Foundation of China under grant nos. 41023001, 41101413, 41001260, 41101407 and 41071261, National Technology Support Project under grant nos. 2011BAB01B01 and 2012BAH28B04, the PhD Program Foundation of Ministry of Education of China under grant no. 20110141120073 and the 863 Program under grant nos. 2012AA12A304 and 2012AA12A306.
- Conflict of InterestThe authors declare no conflict of interest.
References
- Henderson, V.; Storeygard, A.; Weil, D.N. A bright idea for measuring economic growth. Am. Econ. Rev 2011, 101, 194–199. [Google Scholar]
- Chen, X.; Nordhaus, W.D. Using luminosity data as a proxy for economic statistics. Proc. Natl. Acad. Sci. USA 2011, 108, 8589–8594. [Google Scholar]
- Deng, X.Z.; Huang, J.K.; Rozelle, S.; Uchida, E. Growth, population and industrialization, and urban land expansion of China. J. Urban Econ 2008, 63, 96–115. [Google Scholar]
- Kumar, M.; Mukherjee, N.; Sharma, G.P.; Raghubanshi, A.S. Land use patterns and urbanization in the holy city of Varanasi, India: A scenario. Environ. Monit. Assess 2010, 167, 417–422. [Google Scholar]
- Ghosh, T.; Powell, R.L.; Elvidge, C.D.; Baugh, K.E.; Sutton, P.C.; Anderson, S. Shedding light on the global distribution of economic activity. Open Geogr. J 2010, 3, 148–161. [Google Scholar]
- Siebert, S.; Portmann, F.T.; Doll, P. Global patterns of cropland use intensity. Remote Sens 2010, 2, 1625–1643. [Google Scholar]
- Bastiaanssen, W.G.M.; Molden, D.J.; Makin, I.W. Remote sensing for irrigated agriculture: Examples from research and possible applications. Agric. Water Manag 2000, 46, 137–155. [Google Scholar]
- Churnside, J.H.; Brown, E.D.; Parker-Stetter, S.; Horne, J.K.; Hunt, G.L.; Hillgruber, N.; Sigler, M.F.; Vollenweider, J.J. Airborne remote sensing of a biological hot spot in the Southeastern Bering Sea. Remote Sens 2011, 3, 621–637. [Google Scholar]
- Knudby, A.; Roelfsema, C.; Lyons, M.; Phinn, S.; Jupiter, S. Mapping fish community variables by integrating field and satellite data, object-based image analysis and modeling in a traditional Fijian fisheries management area. Remote Sens 2011, 3, 460–483. [Google Scholar]
- Whitehurst, A.S.; Swatantran, A.; Blair, J.B.; Hofton, M.A.; Dubayah, R. Characterization of canopy layering in forested ecosystems using full waveform Lidar. Remote Sens 2013, 5, 2014–2036. [Google Scholar]
- Doll, C.N.H.; Muller, J.-P.; Morley, J.G. Mapping regional economic activity from night-time light satellite imagery. Ecol. Econ 2006, 57, 75–92. [Google Scholar]
- Elvidge, C.D.; Baugh, K.E.; Kihn, E.A.; Kroehl, H.W.; Davis, E.R.; Davis, C.W. Relation between satellite observed visible-near infrared emissions, population, economic activity and electric power consumption. Int. J. Remote Sens 1997, 18, 1373–1379. [Google Scholar]
- Wang, W.; Cheng, H.; Zhang, L. Poverty assessment using DMSP/OLS night-time light satellite imagery at a provincial scale in China. Adv. Space Res 2012, 49, 1253–1264. [Google Scholar]
- Ghosh, T.; Anderson, S.; Powell, R.L.; Sutton, P.C.; Elvidge, C.D. Estimation of Mexico’s informal economy and remittances using Nighttime Imagery. Remote Sens 2009, 1, 418–444. [Google Scholar]
- Roychowdhury, K.; Jones, S.D.; Arrowsmith, C.; Reinke, K. A comparison of high and low gain DMSP/OLS satellite images for the study of socio-economic metrics. IEEE J. Sel. Top. Appl. Earth Observ. Remote Sens 2011, 4, 35–42. [Google Scholar]
- Propastin, P.; Kappas, M. Assessing Satellite-observed nighttime lights for monitoring socioeconomic parameters in the Republic of Kazakhstan. GISci. Remote Sens 2012, 49, 538–557. [Google Scholar]
- Ma, T.; Zhou, C.; Pei, T.; Haynie, S.; Fan, J. Quantitative estimation of urbanization dynamics using time series of DMSP/OLS nighttime light data: A comparative case study from China’s cities. Remote Sens. Environ 2012, 124, 99–107. [Google Scholar]
- Kuechly, H.U.; Kyba, C.C.M.; Ruhtz, T.; Lindemann, C.; Wolter, C.; Fischer, J.; Holker, F. Aerial survey and spatial analysis of sources of light pollution in Berlin, Germany. Remote Sens. Environ 2012, 126, 39–50. [Google Scholar]
- Levin, N.; Duke, Y. High spatial resolution night-time light images for demographic and socio-economic studies. Remote Sens. Environ 2012, 119, 1–10. [Google Scholar]
- Letu, H.; Hara, M.; Tana, G.; Nishio, F. A saturated light correction method for DMSP/OLS nighttime satellite imagery. IEEE Trans. Geosci. Remote Sens 2012, 50, 389–396. [Google Scholar]
- Lu, D.; Tian, H.; Zhou, G.; Ge, H. Regional mapping of human settlements in southeastern China with multisensor remotely sensed data. Remote Sens. Environ 2008, 112, 3668–3679. [Google Scholar]
- Zhang, Q.L.; Seto, K.C. Mapping urbanization dynamics at regional and global scales using multi-temporal DMSP/OLS nighttime light data. Remote Sens. Environ 2011, 115, 2320–2329. [Google Scholar]
- Zhang, Q.; Schaaf, C.; Seto, K.C. The vegetation adjusted NTL urban index: A new approach to reduce saturation and increase variation in nighttime luminosity. Remote Sens. Environ 2013, 129, 32–41. [Google Scholar]
- National Bureau of Statistics of China. Urban Statistical Yearbook of China 2009–2010; China Statistical Press: Beijing, China, 2010–2011. [Google Scholar]
- National Bureau of Statistics of China. China Statistical Yearbook for Regional Economy 2009–2010; China Statistical Press: Beijing, China, 2010–2011. [Google Scholar]
- Letu, H.; Hara, M.; Yagi, H.; Naoki, K.; Tana, G.; Nishio, F.; Shuhei, O. Estimating energy consumption from night-time DMPS/OLS imagery after correcting for saturation effects. Int. J. Remote Sens 2010, 31, 4443–4458. [Google Scholar]
- Elvidge, C.D.; Cinzano, P.; Pettit, D.R.; Arvesen, J.; Sutton, P.; Small, C.; Nemani, R.; Longcore, T.; Rich, C.; Safran, J.; Weeks, J.; Ebener, S. The Nightsat mission concept. Int. J. Remote Sens 2007, 28, 2645–2670. [Google Scholar]
Appendix

Table A1.
The gross regional product (GRP) and total nighttime light (TNL) in the 393 county level regions. DMSP 2009 represents the DMSP-OLS data in 2009, DMSP 2010 represents the DMSP-OLS data in 2010 and NPP 2012 represents the NPP-VIIRS data in 2012.
© 2013 by the authors; licensee MDPI, Basel, Switzerland This article is an open access article distributed under the terms and conditions of the Creative Commons Attribution license (http://creativecommons.org/licenses/by/3.0/).