The Application of Deep Convective Clouds in the Calibration and Response Monitoring of the Reflective Solar Bands of FY-3A/MERSI (Medium Resolution Spectral Imager)


Abstract
:1. Introduction
2. Methodology
3. Results and Analysis
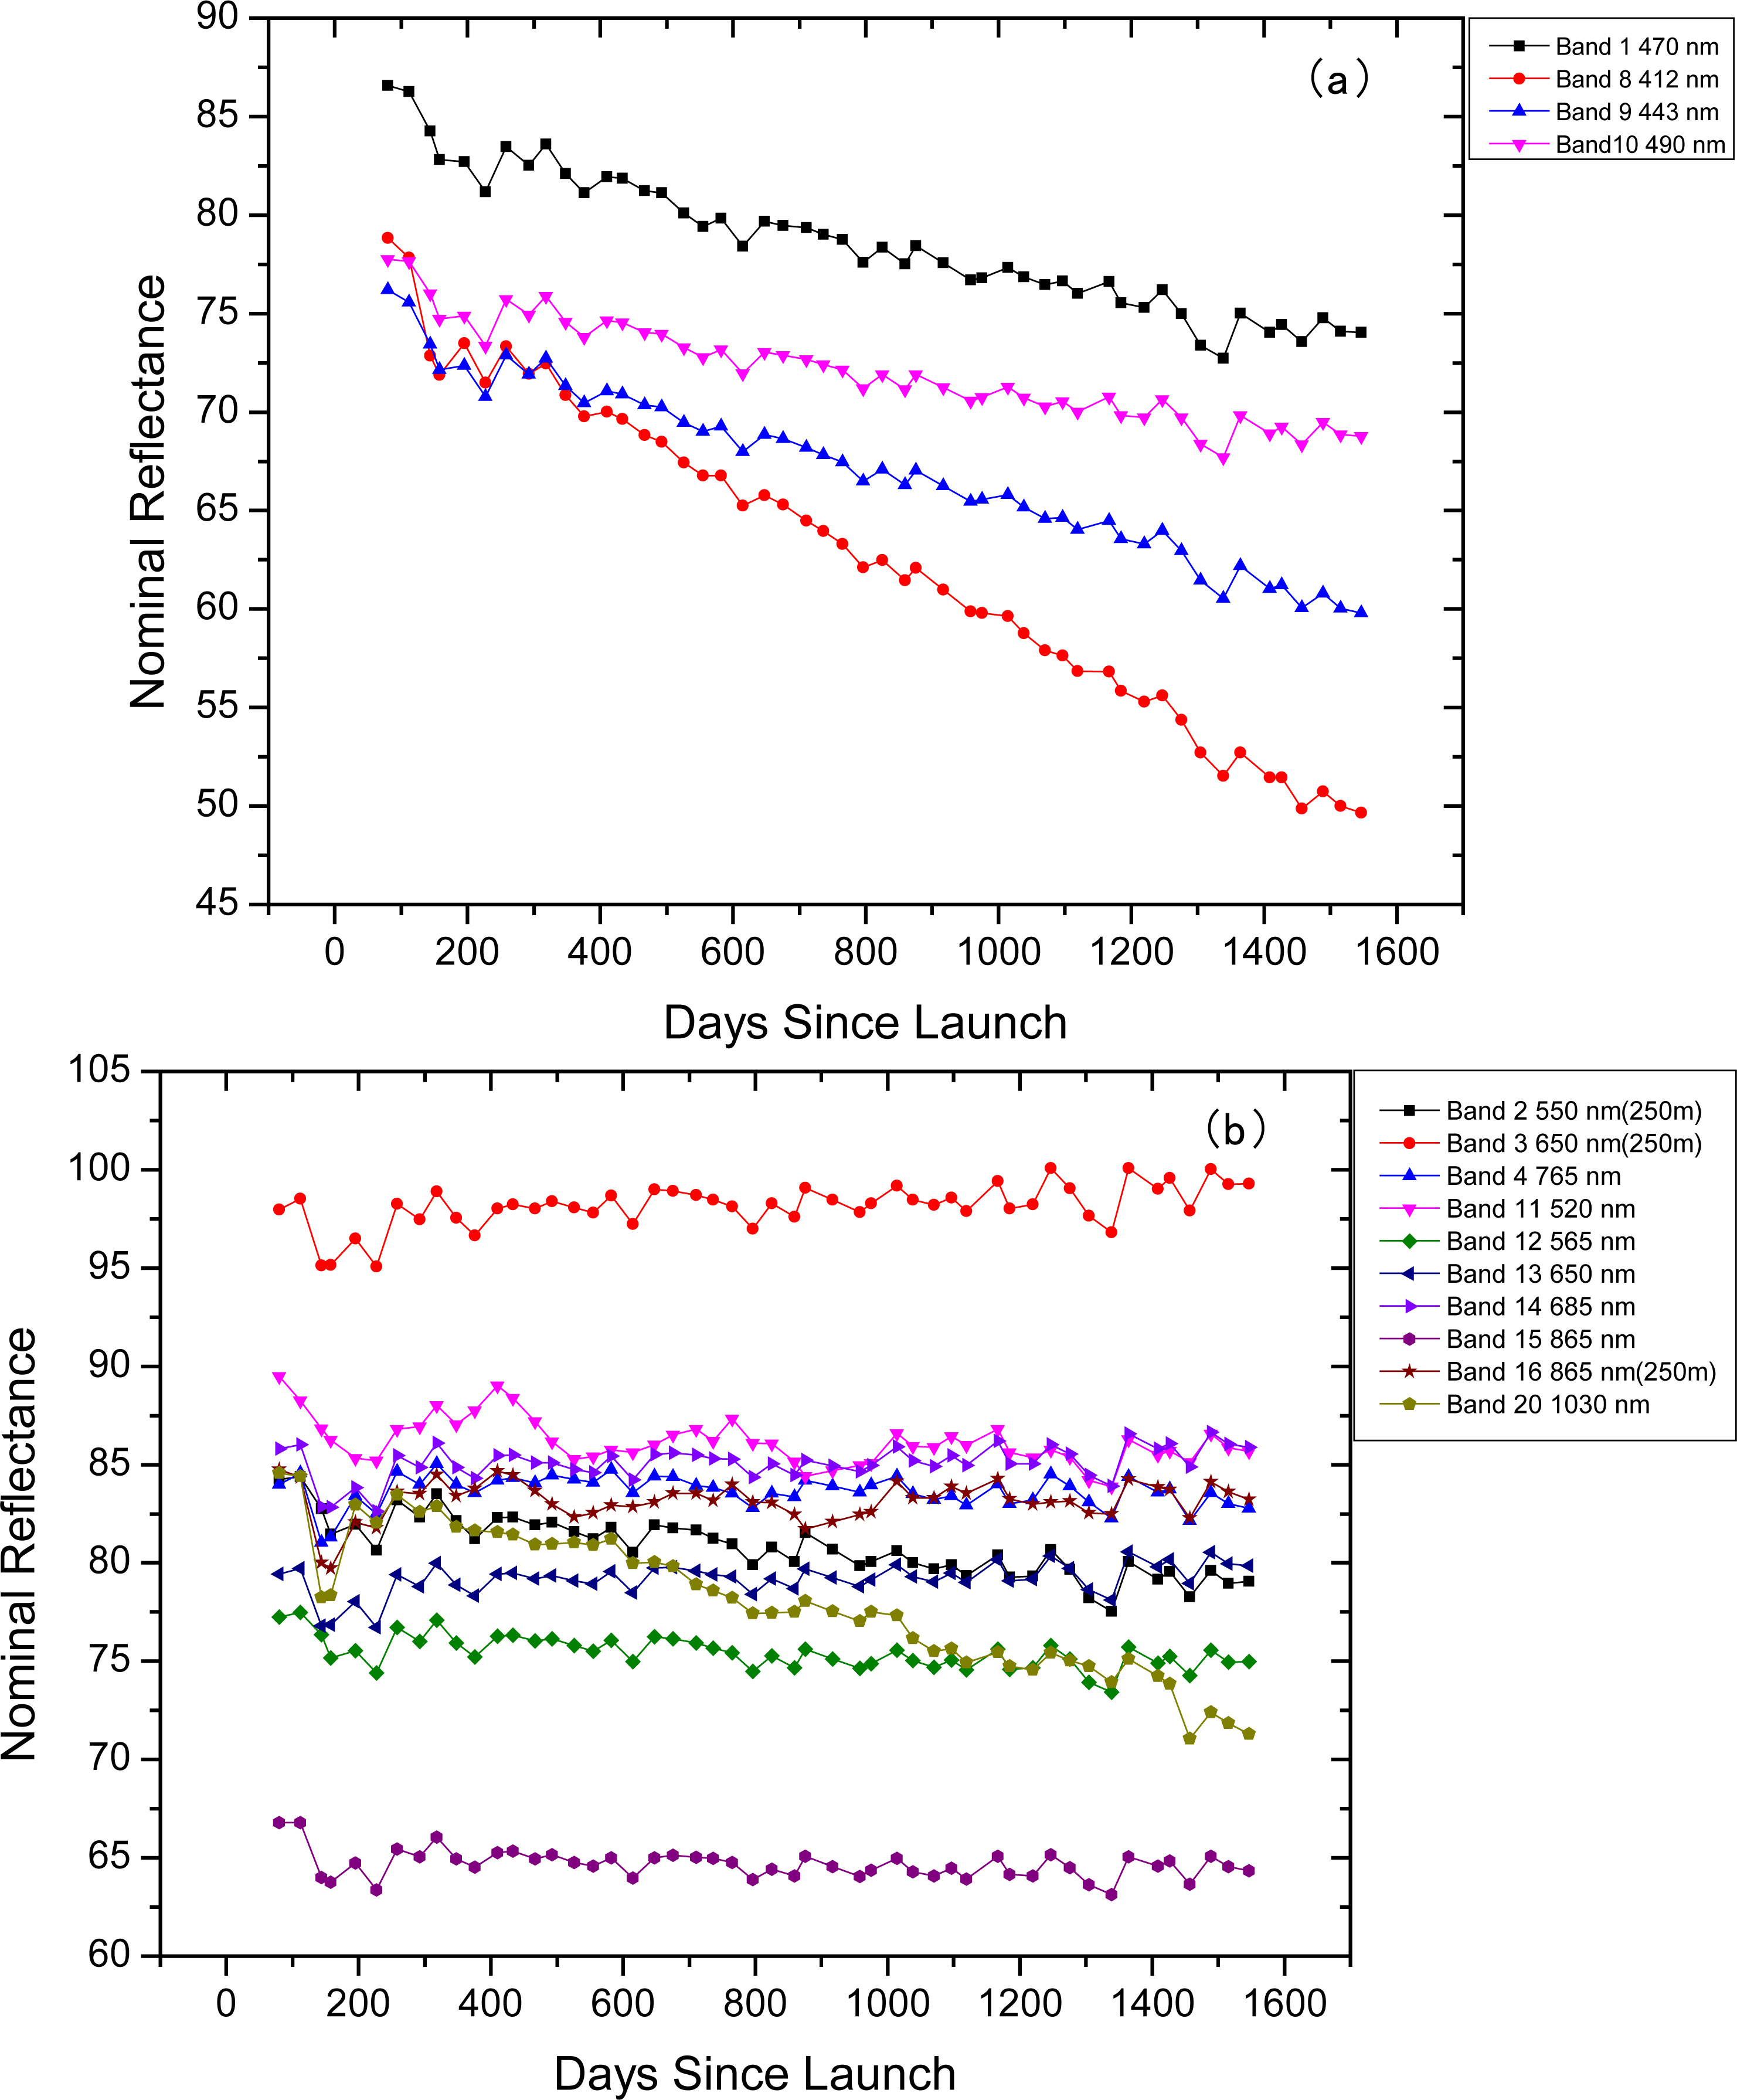
3.1. The Degradation of FY-3A/MERSI by DCC Method
3.2. Comparison with Other Methods
4. Conclusions
Acknowledgments
Conflicts of Interest
References
- Dinguirard, M.; Slater, P.N. Calibration of space multispectral imaging sensor: A review. Remote Sens. Environ 1999, 68, 194–205. [Google Scholar]
- Hu, X.Q.; Zhang, Y.X.; Qiu, K.M. In-flight radiometric calibration for VNIR channels of FY-1C satellite sensor by using irradiance based method (In Chinese). J. Remote Sens 2003, 7, 458–464. [Google Scholar]
- Xiong, X.; Barnes, W. An overview of MODIS radiometric calibration and characterization. Adv. Atmos. Sci 2006, 23, 69–79. [Google Scholar]
- Rao, C.R.N.; Chen, J. Inter-satellite calibration linkages for the visible and near-infrared channels of the Advanced Very High Resolution Radiometer on the NOAA-7, -9, and -11 spacecraft. Int. J. Remote Sens 1995, 16, 1931–1942. [Google Scholar]
- Koslowsky, D. Signal degradation of the AVHRR shortwave channels of NOAA 11 and NOAA 14 by daily monitoring of desert targets. Adv. Space Res 1997, 19, 1355–1358. [Google Scholar]
- Minnis, P.; Nguyen, L.D.; Doelling, D.R.; Young, D.F.; Miller, W.F.; Kratz, D.P. Rapid calibration of operational and research meteorological satellite imagers. J. Atmos. Oceanic Ocean. Technol 2002, 19, 1233–1249. [Google Scholar]
- Heidinger, A.K. Calibration of visible and near-infrared channels of the NOAA-12 AVHRR using time series of observations over deserts. Int. J. Remote Sens 2003, 24, 3635–3649. [Google Scholar]
- Six, D.; Fily, M.; Alvain, S.; Henryc, P.; Benoist, J.P. Surface characterisation of the Dome Dome Concordia area (Antarctica) as a potential satellite calibration site, using Spot 4/Vegetation instrument. Remote Sens. Environ 2004, 89, 83–94. [Google Scholar]
- Eplee, R.E.; Barnes, R.A.; Patt, F.S.; Meister, G.; McClain, C.R. SeaWiFS Lunar Calibration Methodology after Six Years on Orbit. Proceedings of Earth Observing Systems IX, Denver, CO, USA, 26 October 2004.
- Mitchell, D.G. Global Space-Based Inter-Calibration System (GSICS). Proc. SPIE 2007, 6684. [Google Scholar] [CrossRef]
- Goldberg, M.; Ohring, G.; Butler, J.; Cao, C.; Datla, R.; Doelling, D.V.; Hewison, G.T.; Iacovazzi, B.; Kim, D.; Kurino, T.; et al. The global space-based inter-calibration system. Bull. Am. Meteorol. Soc 2011, 92, 467–475. [Google Scholar]
- Doelling, D.R.; Nguyenb, L.; Minis, P. On the Use of Deep Convective Clouds to Calibrate AVHRR Data. Proceedings of Earth Observing System IX, Denver, CO, USA, 26 October 2004.
- Hu, Y.; Wielicki, B.A.; Yang, P.; Stackhouse, P.W.; Lin, B.; Young, D.F. Application of deep convective cloud albedo observation to satellite-based study of the terrestrial atmosphere: Monitoring the stability of spaceborne measurements and assessing absorption anomaly. IEEE Trans. Geosci. Remote Sens 2004, 42, 2594–2599. [Google Scholar]
- Minnis, P.; Doelling, D.R.; Nguyen, L. Assessment of the visible channel calibrations of the VIRS on TRMM and MODIS on Aqua and Terra. J. Atmos. Ocean. Technol 2008, 25, 385–400. [Google Scholar]
- Fougnie, B.; Bach, R. Monitoring of radiometric sensitivity changes of space sensors using deep convective clouds: Operational application to PARASOL. IEEE Trans. Geosci. Remote Sens 2009, 47, 851–861. [Google Scholar]
- Doelling, D.R.; Daniel, M.; Benjamin, R.S.; Rajendra, B.; Arun, G. The characterization of deep convective clouds as an invariant calibration target and as a visible calibration technique. IEEE Trans. Geosci. Remote Sens 2013, 51, 1147–1159. [Google Scholar]
- Yang, J.; Dong, C.H.; Lu, N.M. FY-3A: The new polar-orbiting meteorological satellite of China. Acta Meteorol. Sin 2009, 67, 0501–0509. [Google Scholar]
- Dong, C.; Yang, J.; Zhang, W.; Yang, Z.; Lu, N.; Shi, J.; Zhang, P.; Liu, Y.; Cai, B. An overview of a new Chinese weather satellite FY-3A. Bull. Am. Meteorol. Soc 2009, 90, 1531–1544. [Google Scholar]
- Hu, X.Q.; Sun, L.; Liu, J.J.; Ding, L.; Wang, X.; Li, Y.; Zheng, Z.J.; Xu, N.; Chen, L. Calibration for the solar reflective bands of medium resolution spectral imager onboard FY-3A. IEEE Trans. Geosci. Remote Sens 2012, 50, 4915–4928. [Google Scholar]
- Hu, X.Q.; Liu, J.J.; Sun, L.; Rong, Z.G.; Li, Y.; Zhang, Y.; Zheng, Z.; Wu, R.; Zhang, L.; Gu, X. Characterization of CRCS Dunhuang test site and vicarious calibration utilization for Fengyun (FY) series sensors. Can. J. Remote Sens 2010, 36, 566–582. [Google Scholar]
- Sun, L.; Hu, X.Q.; Guo, M.H.; Xu, N. Multi-site calibration tracking for FY-3A mersi solar bands. IEEE Trans. Geosci. Remote Sens 2013, 50, 4929–4942. [Google Scholar]
- Ricchiazzi, P.; Yang, S.; Gautier, C.; Sowle, D. SBDART: A research and teaching software tool for plane-parallel radiative transfer in the Earth’s atmosphere. Bull. Am. Meteorol. Soc 1998, 79, 2101–2114. [Google Scholar]
- Xiong, X.; Sun, J.; Barnes, W.; Salomonson, V.; Esposito, J.; Erives, H.; Guenther, B. Multiyear on-orbit calibration and performance of Terra MODIS solar reflective bands. IEEE Trans. Geosci. Remote Sens 2007, 45, 879–889. [Google Scholar]
- Xiong, X.; Sun, J.; Xie, X.; Barnes, W.L.; Salomonson, V.V. On-orbit calibration and performance of Aqua MODIS reflective solar bands. IEEE Trans. Geosci. Remote Sens 2010, 48, 535–546. [Google Scholar]
- Sohn, B.J.; Ham, S.H.; Han, Y. Possibility of the visible-channel calibration using deep convective clouds overshooting the TTL. J. Appl. Meteorol. Climatol 2009, 48, 2272–2283. [Google Scholar]
- Sterckx, S.; Stefan, L.; Stefan, A. Rayleigh, deep convective clouds, and cross-sensor desert vicarious calibration validation for the PROBA-V mission. IEEE Trans. Geosci. Remote Sens 2013, 51, 1437–1452. [Google Scholar]


| Band | Central Wavelength (μm) | Spectral Bandwidth (μm) | Resolution (m) | Noise | Dynamic Range |
|---|---|---|---|---|---|
| 1 | 0.470 | 0.05 | 250 | 0.45 | 100 |
| 2 | 0.550 | 0.05 | 250 | 0.4 | 100 |
| 3 | 0.650 | 0.05 | 250 | 0.4 | 100 |
| 4 | 0.865 | 0.05 | 250 | 0.45 | 100 |
| 5 | 11.25 | 2.5 | 250 | 0.54 K | 330 K |
| 6 | 1.640 | 0.05 | 1,000 | 0.08 | 90 |
| 7 | 2.130 | 0.05 | 1,000 | 0.07 | 90 |
| 8 | 0.412 | 0.02 | 1,000 | 0.1 | 80 |
| 9 | 0.443 | 0.02 | 1,000 | 0.1 | 80 |
| 10 | 0.490 | 0.02 | 1,000 | 0.05 | 80 |
| 11 | 0.520 | 0.02 | 1,000 | 0.05 | 80 |
| 12 | 0.565 | 0.02 | 1,000 | 0.05 | 80 |
| 13 | 0.650 | 0.02 | 1,000 | 0.05 | 80 |
| 14 | 0.685 | 0.02 | 1,000 | 0.05 | 80 |
| 15 | 0.765 | 0.02 | 1,000 | 0.05 | 80 |
| 16 | 0.865 | 0.02 | 1,000 | 0.05 | 80 |
| 17 | 0.905 | 0.02 | 1,000 | 0.1 | 90 |
| 18 | 0.940 | 0.02 | 1,000 | 0.1 | 90 |
| 19 | 0.980 | 0.02 | 1,000 | 0.1 | 90 |
| 20 | 1.030 | 0.02 | 1,000 | 0.1 | 90 |
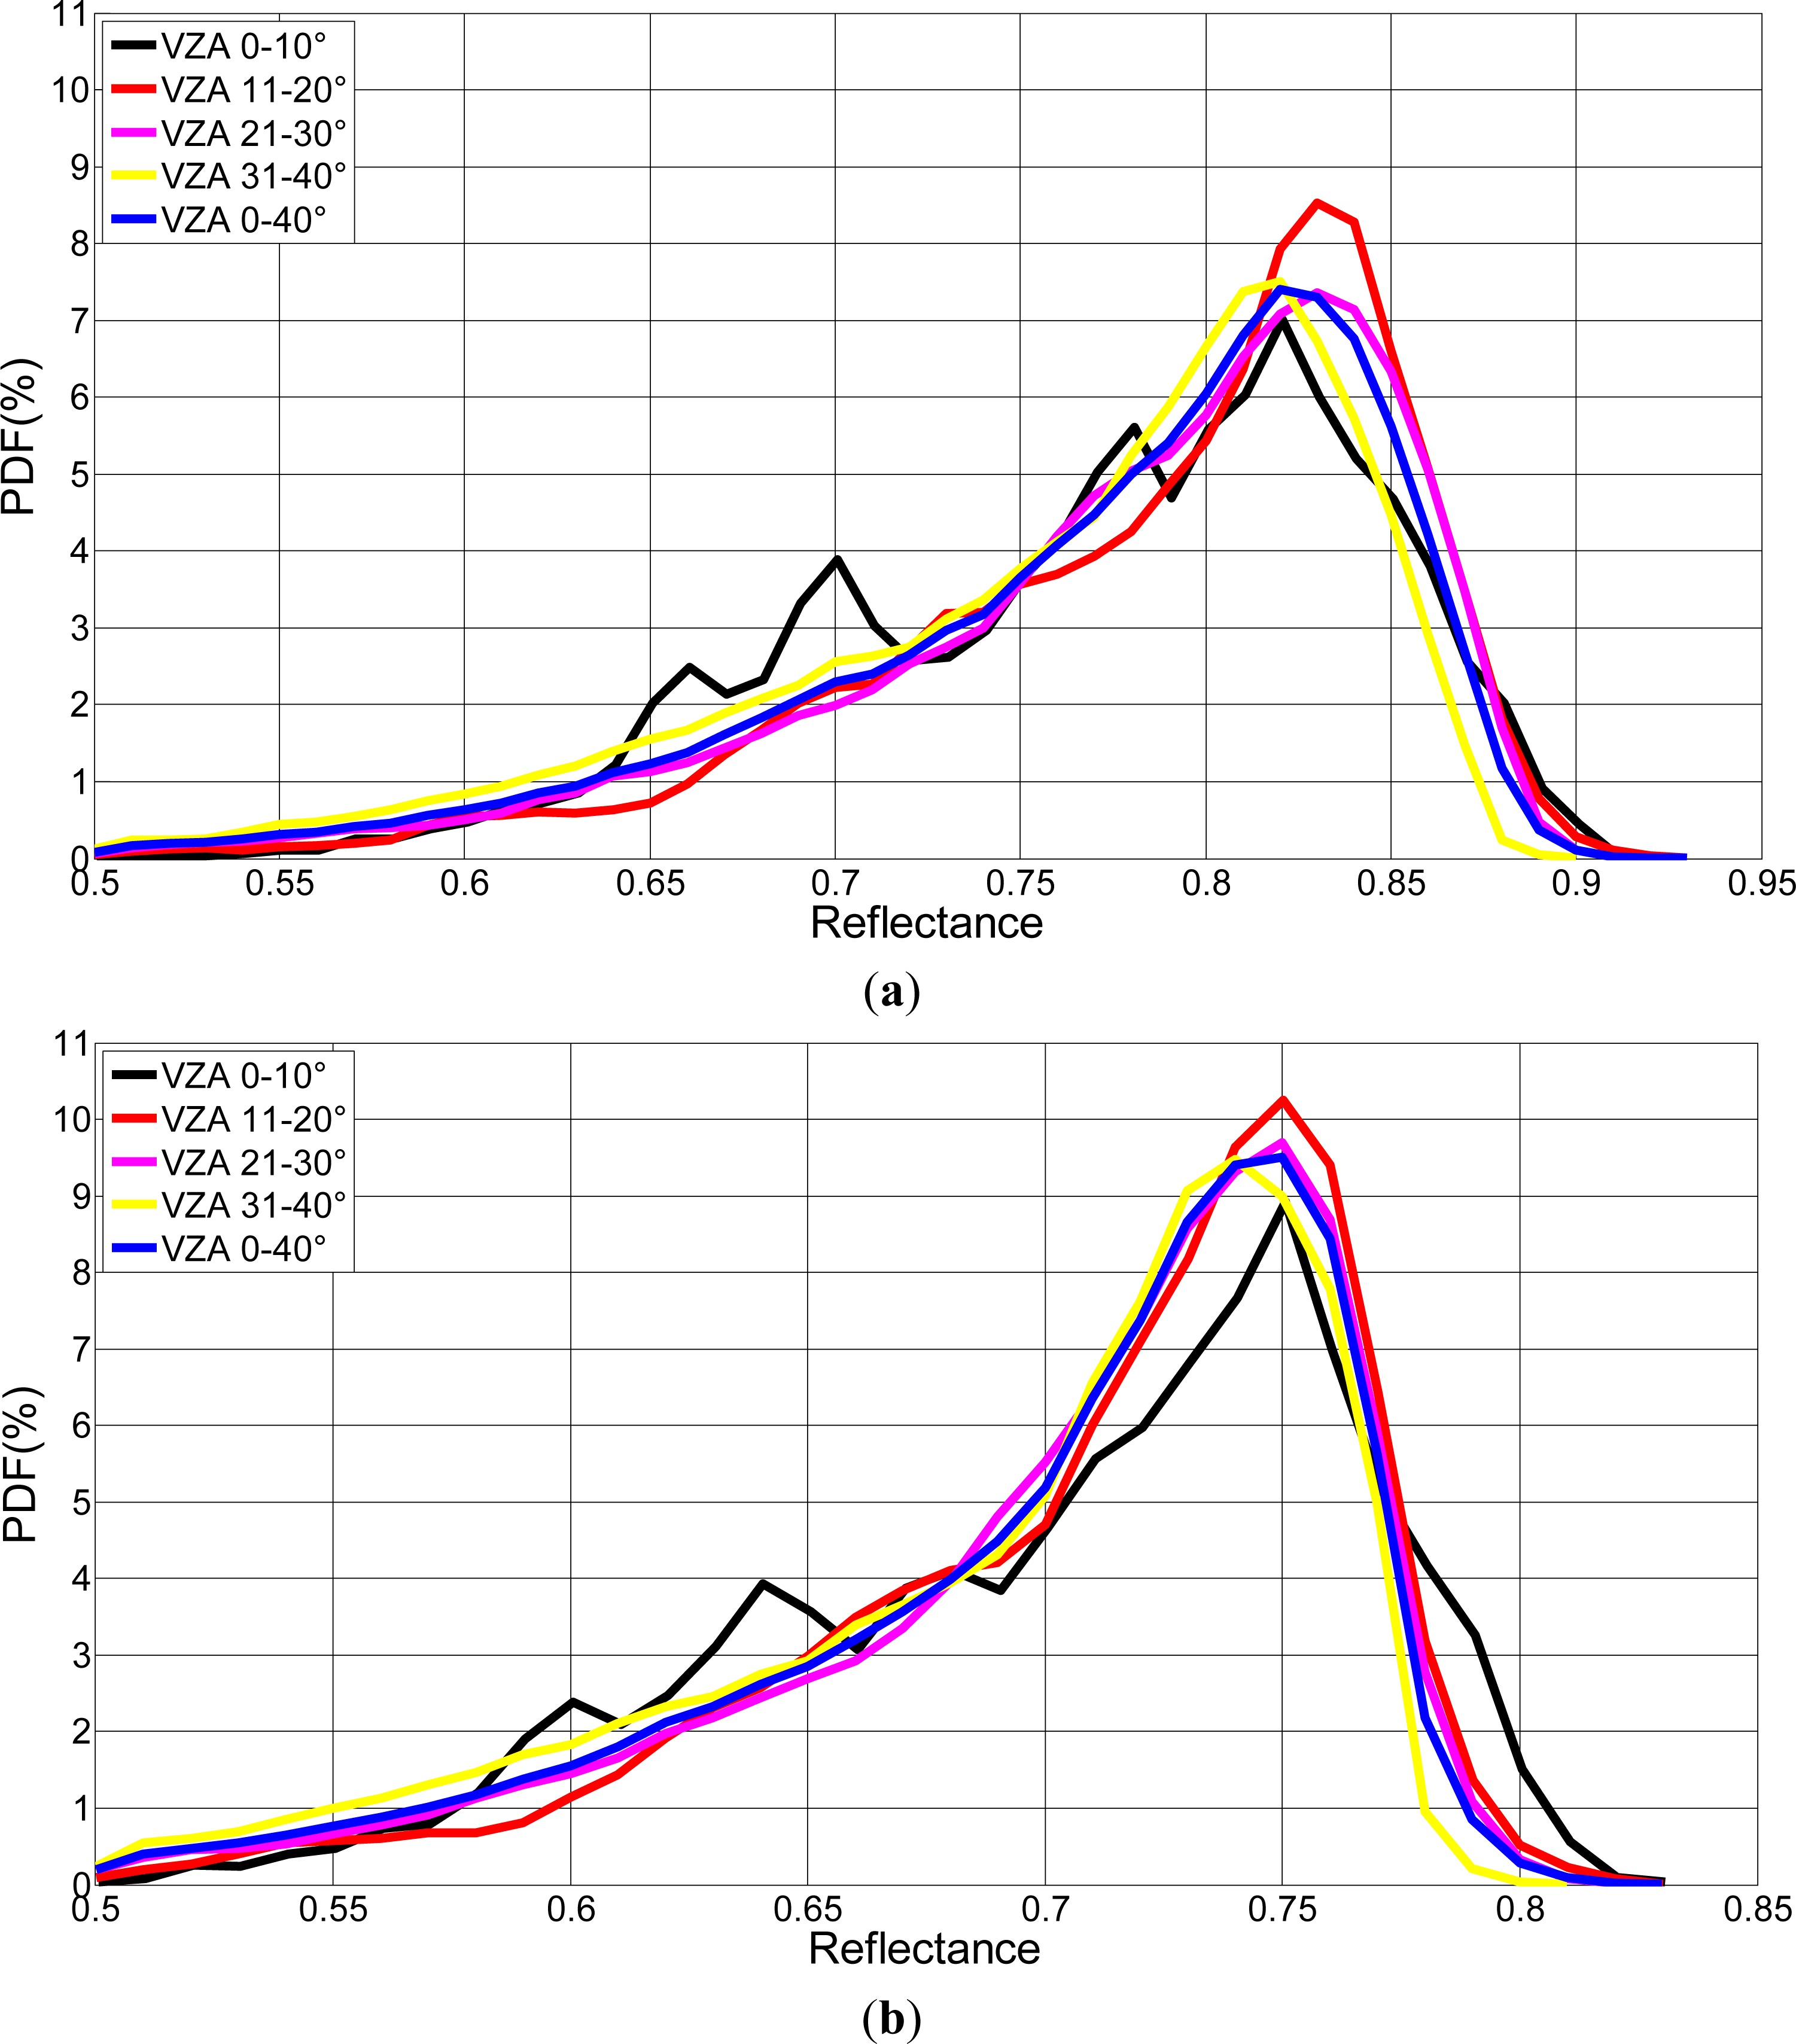
| VZA | After ADM | Before ADM | Count Number | ||||
|---|---|---|---|---|---|---|---|
| Mode | Mean | Median | Mode | Mean | Median | ||
| 0–10 | 0.76 | 0.70 | 0.67 | 0.83 | 0.77 | 0.71 | 30144 |
| 11–20 | 0.76 | 0.71 | 0.67 | 0.84 | 0.79 | 0.72 | 256436 |
| 21–30 | 0.76 | 0.70 | 0.67 | 0.84 | 0.78 | 0.72 | 564305 |
| 31–40 | 0.75 | 0.70 | 0.66 | 0.83 | 0.76 | 0.70 | 540100 |
| 0–40 | 0.76 | 0.70 | 0.67 | 0.83 | 0.77 | 0.72 | 1390985 |
| STD | 0.0050 | 0.0050 | 0.0050 | 0.0058 | 0.0130 | 0.0096 | |
| Bands | Central Wavelength | Mean % | Median % | Mode % | 2σ/Mean % Mean | 2σ/Mean % Median | 2σ/Mean % Mode | |
|---|---|---|---|---|---|---|---|---|
| Blue | 8 | 412 | 37.84 | 37.63 | 38.02 | 2.89 | 2.73 | 2.42 |
| 9 | 443 | 20.88 | 21.00 | 21.85 | 2.10 | 2.17 | 2.63 | |
| 1 | 470 | 14.42 | 14.52 | 14.93 | 2.01 | 2.12 | 2.09 | |
| 10 | 490 | 11.38 | 11.51 | 12.3 | 1.87 | 1.93 | 2.28 | |
| Vis-NIR | 11 | 520 | 2.60 | 2.44 | 2.05 | 2.20 | 2.08 | 2.09 |
| 2 | 550 (250 m) | 5.79 | 5.90 | 6.85 | 1.82 | 1.95 | 1.94 | |
| 12 | 565 | 2.47 | 2.61 | 3.26 | 1.69 | 1.81 | 2.25 | |
| 3 | 650 (250 m) | −2.45 | −2.19 | −1.42 | 1.88 | 1.99 | 1.70 | |
| 13 | 650 | −1.88 | −1.57 | −0.5 | 1.88 | 1.88 | 1.88 | |
| 14 | 685 | −1.60 | −1.31 | −0.41 | 1.87 | 1.89 | 2.15 | |
| 4 | 765 | 0.49 | 1.18 | 1.21 | 1.83 | 1.56 | 1.74 | |
| 16 | 865 (250 m) | −0.20 | 0.35 | 0.15 | 2.11 | 1.57 | 2.42 | |
| 15 | 865 | 1.60 | 1.91 | 2.7 | 2.06 | 2.12 | 2.71 | |
| 20 | 1030 | 15.87 | 15.86 | 15.91 | 1.41 | 1.46 | 1.78 | |
| WV | 17 | 905 | 5.85 | 5.98 | 6.02 | 2.01 | 1.41 | 1.41 |
| 18 | 940 | 9.05 | 9.04 | 9.4 | 1.84 | 1.97 | 2.39 | |
| 19 | 980 | 7.84 | 8.49 | 8.81 | 1.22 | 1.26 | 1.52 | |
| Bands | Central Wavelength | 8–9 August Linear Fit | 9–10 August Linear Fit | 10–11 August Linear Fit | 11–12 August Linear Fit | 8–12 August Linear Fit | 8–12 August Quadratic Fit | 2σ/Mean % Linear | 2σ/Mean % Quadratic | |
|---|---|---|---|---|---|---|---|---|---|---|
| Blue | 8 | 412 | 9.99 | 8.54 | 8.03 | 9.26 | 37.89 | 37.84 | 2.89 | 2.89 |
| 9 | 443 | 6.34 | 4.55 | 4.04 | 5.80 | 20.89 | 20.88 | 2.10 | 2.10 | |
| 1 | 470 | 5.25 | 3.47 | 2.44 | 2.48 | 14.54 | 14.42 | 2.26 | 2.01 | |
| 10 | 490 | 3.82 | 2.88 | 2.05 | 2.02 | 11.44 | 11.38 | 2.02 | 1.87 | |
| Vis-NIR | 11 | 520 | −0.42 | 0.40 | −0.91 | −0.04 | 2.58 | 2.60 | 2.25 | 2.20 |
| 2 | 550 (250 m) | 1.97 | 1.12 | 1.22 | 1.08 | 5.79 | 5.79 | 1.83 | 1.82 | |
| 12 | 565 | 1.5 | 1.07 | 0.64 | 0.11 | 0.07 | 2.47 | 2.48 | 1.69 | |
| 3 | 650 (250 m) | −1.19 | −0.50 | −0.73 | −0.62 | −2.42 | −2.45 | 1.90 | 1.88 | |
| 13 | 650 | −1.30 | −0.33 | −0.67 | −0.59 | −1.86 | −1.88 | 1.89 | 1.88 | |
| 14 | 685 | −0.94 | −0.41 | −0.84 | −0.76 | −1.60 | −1.60 | 1.87 | 1.87 | |
| 4 | 765 | −1.91 | 0.73 | 0.04 | 0.73 | 0.54 | 0.49 | 1.95 | 1.83 | |
| 16 | 865 (250 m) | −1.61 | −0.09 | −1.57 | −0.25 | −0.22 | −0.20 | 2.11 | 2.11 | |
| 15 | 865 | 0.96 | 0.32 | 0.060 | −0.08 | 1.58 | 1.60 | 2.09 | 2.06 | |
| 20 | 1,030 | 3.78 | 4 | 3.28 | 4.20 | 15.87 | 15.87 | 1.68 | 1.41 | |
| WV | 17 | 905 | 2.50 | 1.41 | 0.57 | 0.16 | 5.69 | 5.85 | 2.18 | 2.01 |
| 18 | 940 | 3.06 | 1.99 | 1.57 | 1.24 | 8.94 | 9.05 | 1.84 | 1.84 | |
| 19 | 980 | 0.90 | 2.02 | 1.32 | 1.29 | 7.84 | 7.84 | 1.59 | 1.59 |
| Bands | Central Wavelength | DCC (%) | Aqua-MODIS SNO (%) | Dunhuang Site (%) | Multi-Site (%) | Mean (except DCC, %) | Bias (DCC-Mean, %) | STD | |
|---|---|---|---|---|---|---|---|---|---|
| Blue | 8 | 412 | 37.84 | 35.43 | 36.76 | 38.08 | 36.76 | 1.08 | 1.21 |
| 9 | 443 | 20.88 | NA | 20.65 | 23.94 | 22.30 | −1.42 | 1.84 | |
| 1 | 470 | 14.42 | 15.99 | 14.44 | 18.18 | 16.20 | −1.78 | 1.77 | |
| 10 | 490 | 11.38 | 13.18 | 10.74 | 15.67 | 13.20 | −1.82 | 2.21 | |
| Vis-NIR | 11 | 520 | 2.60 | NA | 8.57 | 12.04 | 10.31 | −7.71 | 4.77 |
| 2 | 550 (250 m) | 5.79 | 6.58 | 5.67 | 9.12 | 7.12 | −1.33 | 1.60 | |
| 12 | 565 | 2.47 | 4.67 | 3.75 | 6.00 | 4.81 | −2.34 | 1.49 | |
| 3 | 650 (250 m) | −2.45 | −1.25 | 0.83 | −2.46 | −0.96 | −1.49 | 1.55 | |
| 13 | 650 | −1.88 | −3.2 | 0.45 | −1.32 | −1.36 | −0.52 | 1.51 | |
| 14 | 685 | −1.60 | NA | 1.43 | −1.59 | −0.08 | −1.52 | 1.75 | |
| 15 | 765 | 0.49 | −2.76 | 1.79 | 1.81 | 0.28 | 0.21 | 2.15 | |
| 4 | 865 (250 m) | −0.20 | NA | 2.14 | −0.31 | 0.92 | −1.12 | 1.38 | |
| 16 | 865 | 1.60 | NA | 3.81 | 1.21 | 2.51 | −0.91 | 1.40 | |
| 20 | 1,030 | 15.87 | NA | 17.33 | 16.06 | 16.70 | −0.83 | 0.79 | |
| WV | 17 | 905 | 5.85 | NA | 4.00 | 7.13 | 5.57 | 0.29 | 1.57 |
| 18 | 940 | 9.05 | NA | 16.00 | 14.52 | 15.26 | −6.21 | 3.66 | |
| 19 | 980 | 7.84 | NA | 11.92 | 10.18 | 11.05 | −3.21 | 2.05 |
© 2013 by the authors; licensee MDPI, Basel, Switzerland This article is an open access article distributed under the terms and conditions of the Creative Commons Attribution license ( http://creativecommons.org/licenses/by/3.0/).
Share and Cite
Chen, L.; Hu, X.; Xu, N.; Zhang, P. The Application of Deep Convective Clouds in the Calibration and Response Monitoring of the Reflective Solar Bands of FY-3A/MERSI (Medium Resolution Spectral Imager). Remote Sens. 2013, 5, 6958-6975. https://doi.org/10.3390/rs5126958
Chen L, Hu X, Xu N, Zhang P. The Application of Deep Convective Clouds in the Calibration and Response Monitoring of the Reflective Solar Bands of FY-3A/MERSI (Medium Resolution Spectral Imager). Remote Sensing. 2013; 5(12):6958-6975. https://doi.org/10.3390/rs5126958
Chicago/Turabian StyleChen, Lin, Xiuqing Hu, Na Xu, and Peng Zhang. 2013. "The Application of Deep Convective Clouds in the Calibration and Response Monitoring of the Reflective Solar Bands of FY-3A/MERSI (Medium Resolution Spectral Imager)" Remote Sensing 5, no. 12: 6958-6975. https://doi.org/10.3390/rs5126958