Forest Cover Changes in Tropical South and Central America from 1990 to 2005 and Related Carbon Emissions and Removals

Abstract
:1. Introduction
2. Experimental Section
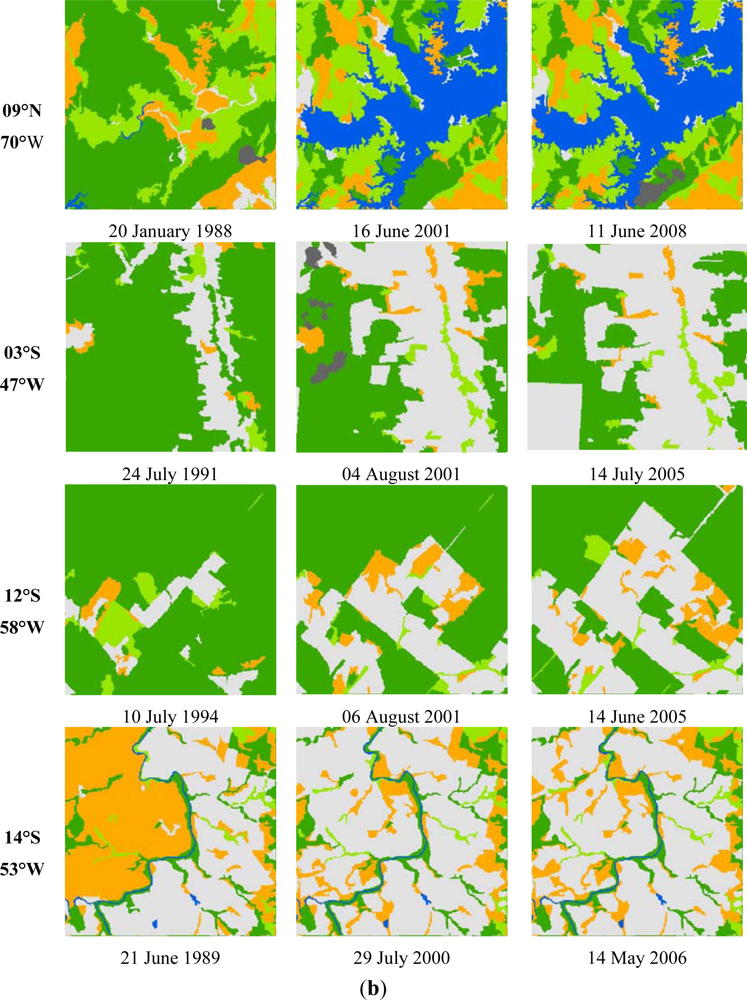
2.1. Satellite Imagery Acquisition and Pre-Processing
2.2. Image Classification
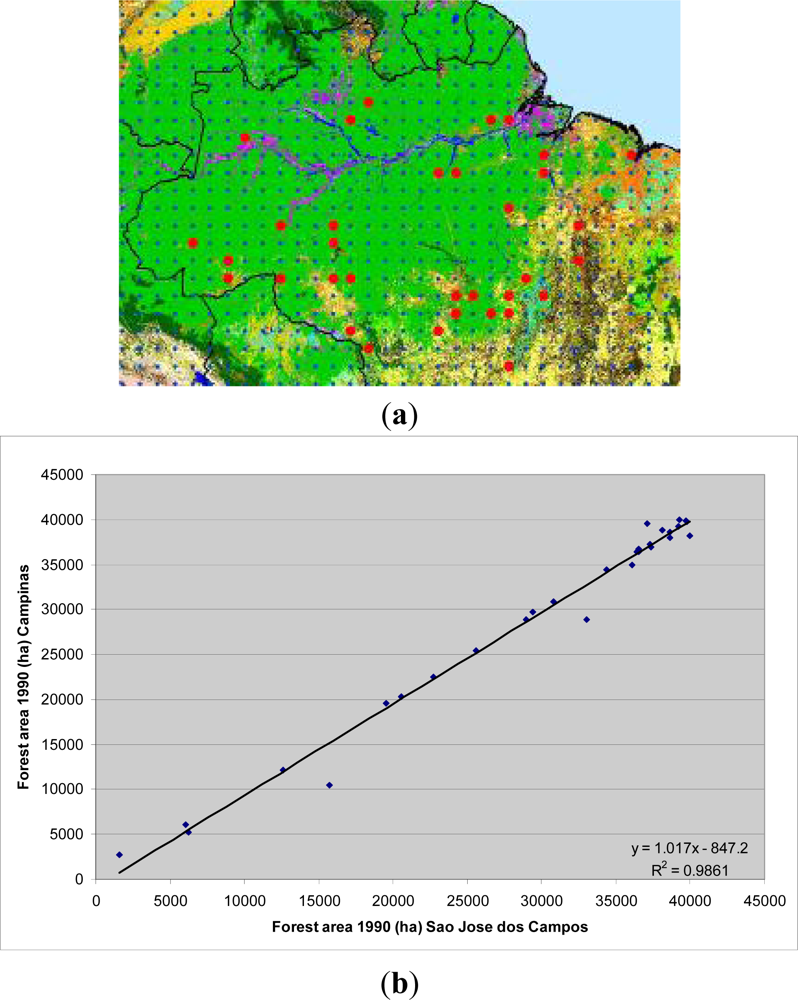
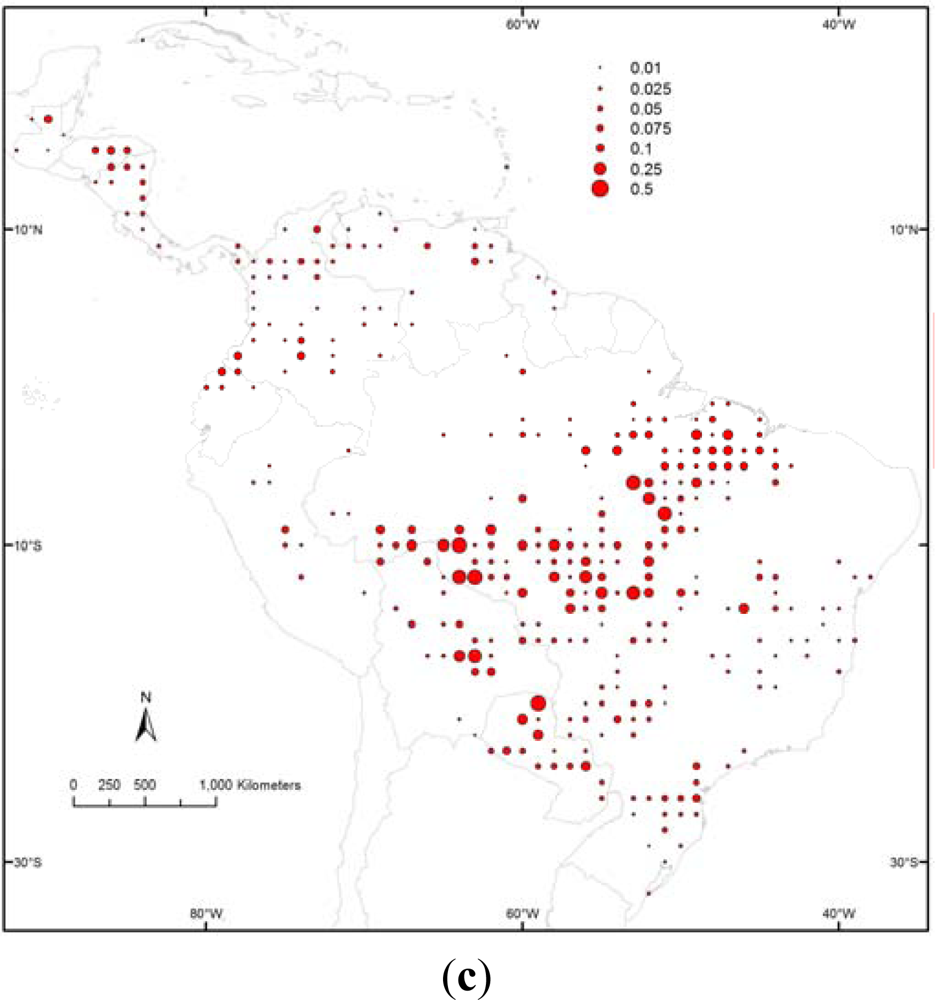
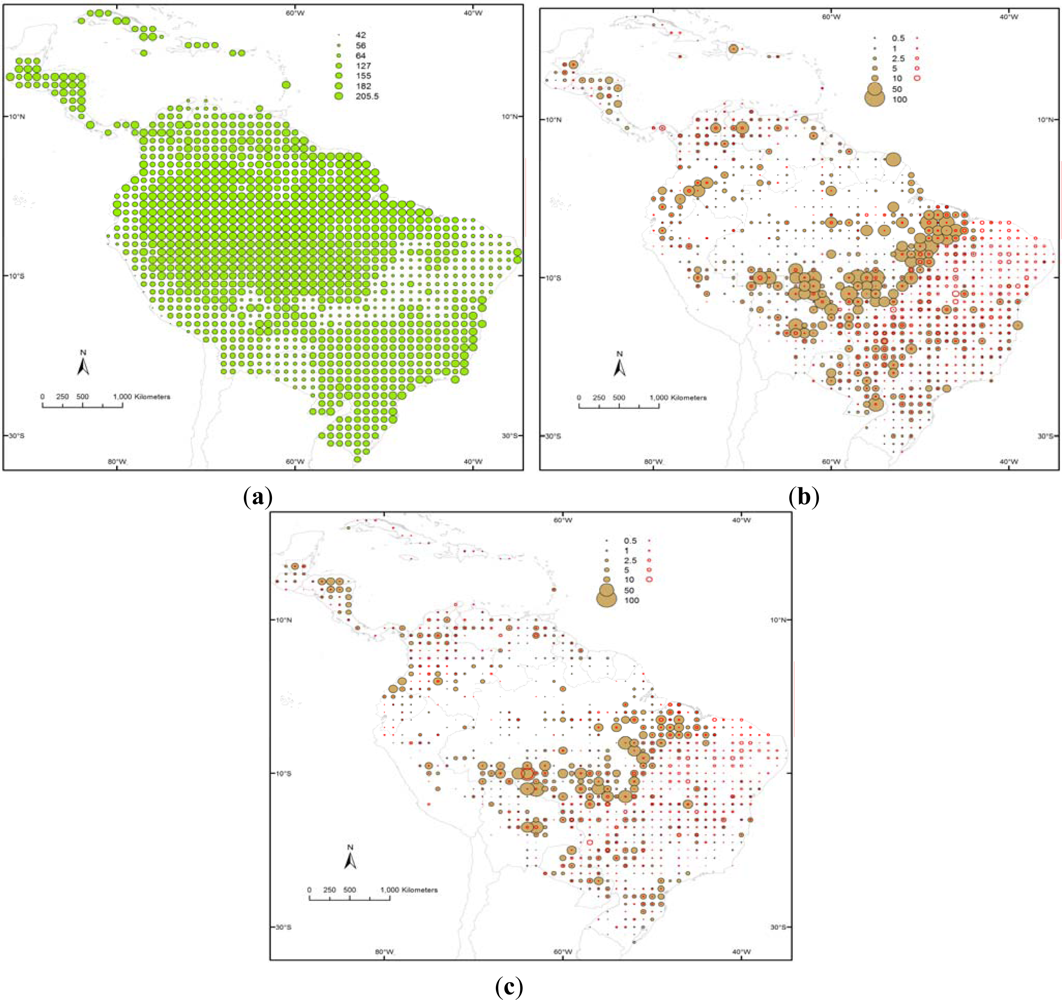
2.3. Extrapolation of Results
2.4. Independent Analysis of Image Interpretations
2.5. Calculations of Emissions Estimates
3. Results and Discussion
3.1. Forest Area and Area Change Results
3.2. Emissions Estimates Results
4. Conclusions
Acknowledgments
References
- Grainger, A. Difficulties in tracking the long-term global trend in tropical forest area. Proc. Natl. Acad. Sci. USA 2008, 105, 818–823. [Google Scholar]
- Pan, Y.; Birdsey, R.A.; Fang, J.; Houghton, R.; Kauppi, P.E.; Kurz, W.A.; Phillips, O.L.; Shvidenko, A.; Lewis, S.L.; Canadell, J.G.; et al. A large and persistent carbon sink in the world’s forests. Science 2011, 333, 988–993. [Google Scholar]
- Achard, F.; Eva, H.D.; Stibig, H.J.; Mayaux, P.; Gallego, J.; Richards, T.; Malingreau, J.P. Determination of deforestation rates of the world’s humid tropical forests. Science 2002, 297, 999–1002. [Google Scholar]
- Hansen, M.C.; Stehman, S.V.; Potapov, P.V.; Loveland, T.R.; Townshend, J.R.G.; DeFries, R.S.; Pittman, K.W.; Arunarwati, B.; Stolle, F.; Steininger, M.K.; et al. Humid tropical forest clearing from 2000 to 2005 quantified by using multitemporal and multiresolution remotely sensed data. Proc. Natl. Acad. Sci. USA 2008, 105, 9439–9444. [Google Scholar]
- Gibbs, H.K.; Ruesch, A.S.; Achard, F.; Clayton, M.K.; Holmgren, P.; Ramankutty, N.; Foley, J.A. Tropical forests were the primary sources of new agricultural land in the 1980s and 1990s. Proc. Natl. Acad. Sci. USA 2010, 107, 16732–16737. [Google Scholar]
- FAO. Global Forest Assessment 2010: Main Report; Food and Agriculture Organization of the UN: Rome, Italy, 2010; p. 378. [Google Scholar]
- Mollicone, D.; Achard, F.; Federici, S.; Eva, H.D.; Grassi, G.; Belward, A.; Raes, F.; Seufert, G.; Stibig, H.J.; Matteucci, G.; et al. An incentive mechanism for reducing emissions from conversion of intact and non-intact forests. Climate Change 2007, 83, 477–493. [Google Scholar]
- Grassi, G.; Monni, S.; Federici, S.; Achard, F.; Mollicone, D. Applying the conservativeness principle to REDD to deal with the uncertainties of the estimates. Environ. Res. Lett 2008, 3, 035005. [Google Scholar]
- GOFC-GOLD. A Sourcebook of Methods and Procedures for Monitoring and Reporting Anthropogenic Greenhouse Gas Emissions and Removals Caused by Deforestation, Gains and Losses of Carbon Stocks in Forests Remaining Forests, and Forestation; GOFC-GOLD GOFC-GOLD Project Office, Natural Resources Canada: Calgary, AB, Canada, 2010; p. 210. [Google Scholar]
- Duveiller, G.; Defourny, P.; Desclée, B.; Mayaux, P. Deforestation in Central Africa: Estimates at regional, national and landscape levels by advanced processing of systematically-distributed Landsat extracts. Remote Sens. Environ 2008, 112, 1969–1981. [Google Scholar]
- FAO; JRC; SDSU; ULC. The 2010 Global Forest Resources Assessment Remote Sensing Survey: An Outline of the Objectives, Data, Methods and Approach; FAO: Rome, Italy, 2009. [Google Scholar]
- INPE. Monitoramento da Floresta Amazonica Brasileira por Satelite. Available online: http://www.obt.inpe.br/prodes/index.html (accessed on 5 November 2011).
- Pelletier, J.; Ramankutty, N.; Potvin, C. Diagnosing the uncertainty and detectability of emission reductions for REDD + under current capabilities: An example for Panama. Environ. Res. Lett 2011, 6, 024005. [Google Scholar]
- McRoberts, R.; Tomppo, E. Remote sensing support for national forest inventories. Remote Sens. Environ 2007, 110, 412–419. [Google Scholar]
- Achard, F.; Stibig, H.J.; Eva, H.D.; Lindquist, E.J.; Bouvet, A.; Arino, O.; Mayaux, P. Estimating tropical deforestation from Earth observation data. Carbon Manage 2010, 1, 271–287. [Google Scholar]
- Arai, E.; Shimabukuro, Y.E.; Pereira, G.; Vijaykumar, N.L. A multi-resolution multi-temporal technique for detecting and mapping deforestation in the Brazilian amazon rainforest. Remote Sens 2011, 3, 1943–1956. [Google Scholar]
- Mayaux, P.; Holmgren, P.; Achard, F.; Eva, H.; Stibig, H.J.; Branthomme, A. Tropical forest cover change in the 1990s and options for future monitoring. Philos. Trans. R. Soc. B: Biol. Sci 2005, 360, 373–384. [Google Scholar]
- Eva, H.; Carboni, S.; Achard, F.; Stach, N.; Durieux, L.; Faure, J.-F.; Mollicone, D. Monitoring forest areas from continental to territorial levels using a sample of medium spatial resolution satellite imagery. ISPRS J. Photogramm 2010, 65, 191–197. [Google Scholar]
- Stehman, S.V. Comparing estimators of gross change derived from complete coverage mapping versus statistical sampling of remotely sensed data. Remote Sens. Environ 2005, 96, 466–474. [Google Scholar]
- Tucker, C.J.; Grant, D.M.; Dykstra, J.D. NASA’s global orthorectified landsat data set. Photogramm. Eng. Remote Sensing 2004, 70, 313–332. [Google Scholar]
- Beuchle, R.; Eva, H.D.; Stibig, H.J.; Bodart, C.; Brink, A.; Mayaux, P.; Johansson, D.; Achard, F.; Belward, A. A satellite data set for tropical forest area change assessment. Int. J. Remote Sens 2011, 32, 7009–7031. [Google Scholar]
- Bodart, C.; Eva, H.; Beuchle, R.; Raši, R.; Simonetti, D.; Stibig, H.J.; Brink, A.; Lindquist, E.; Achard, F. Pre-processing of a sample of multi-scene and multi-date Landsat imagery used to monitor forest cover changes over the tropics. ISPRS J. Photogramm 2011, 66, 555–563. [Google Scholar]
- Hansen, M.C.; Roy, D.P.; Lindquist, E.; Adusei, B.; Justice, C.O.; Altstatt, A. A method for integrating MODIS and Landsat data for systematic monitoring of forest cover and change in the Congo Basin. Remote Sens. Environ 2008, 112, 2495–2513. [Google Scholar]
- Raši, R.; Bodart, C.; Stibig, H.J.; Eva, H.; Beuchle, R.; Carboni, S.; Simonetti, D.; Achard, F. An automated approach for segmenting and classifying a large sample of multi-date Landsat imagery for pan-tropical forest monitoring. Remote Sens. Environ 2011, 115, 3659–3669. [Google Scholar]
- Särndal, C.E.; Swensson, B.; Wretman, J. Model Assisted Survey Sampling; Springer-Verlag: New York, NY, USA, 1992. [Google Scholar]
- Stehman, S.V.; Hansen, M.C.; Broich, M.; Potapov, P.V. Adapting a global stratified random sample for regional estimation of forest cover change derived from satellite imagery. Remote Sens. Environ 2011, 115, 650–658. [Google Scholar]
- Foody, G.M. Assessing the accuracy of land cover change with imperfect ground reference data. Remote Sens. Environ 2010, 114, 2271–2285. [Google Scholar]
- Gibbs, H.K.; Brown, S.; Niles, J.O.; Foley, J.A. Monitoring and estimating tropical forest carbon stocks: Making REDD a reality. Environ. Res. Lett 2007, 2, 13. [Google Scholar]
- Eva, H.D.; Achard, F.; Stibig, H.-J.; Mayaux, P. Response to comment on “determination of deforestation rates of the world’s humid tropical forests”. Science 2003, 299, 1015. [Google Scholar]
- Malhi, Y.; Wood, D.; Baker, T.R.; Wright, J.; Phillips, O.L.; Cochrane, T.; Meir, P.; Chave, J.; Almeida, S.; Arroyo, L.; et al. The regional variation of aboveground live biomass in old-growth Amazonian forests. Glob. Chang. Biol 2006, 12, 1107–1138. [Google Scholar]
- Nogueira, E.M.; Fearnside, P.M.; Nelson, B.W.; Barbosa, R.I.; Keizer, E.W.H. Estimates of forest biomass in the Brazilian Amazon: New allometric equations and adjustments to biomass from wood-volume inventories. For. Ecol. Manage 2008, 256, 1853–1867. [Google Scholar]
- Asner, G.P.; Powell, G.V.N.; Mascaro, J.; Knapp, D.E.; Clark, J.K.; Jacobson, J.; Kennedy-Bowdoin, T.; Balaji, A.; Paez-Acosta, G.; Victoria, E.; et al. High-resolution forest carbon stocks and emissions in the Amazon. Proc. Natl. Acad. Sci. USA 2010, 107, 16738–16742. [Google Scholar]
- IPCC. IPCC Guidelines for National Greenhouse Gas Inventories; IPCC National GHG Inventories Programme: Hayama, Japan, 2006. [Google Scholar]
- Ramankutty, N.; Gibbs, H.K.; Achard, F.; Defries, R.; Foley, J.A.; Houghton, R.A. Challenges to estimating carbon emissions from tropical deforestation. Glob. Chang. Biol 2007, 13, 51–66. [Google Scholar]
- Achard, F.; Eva, H.D.; Mayaux, P.; Stibig, H.J.; Belward, A. Improved estimates of net carbon emissions from land cover change in the tropics for the 1990s. Glob. Biogeochem. Cycl 2004, 18, GB2008 1–11. [Google Scholar]
- Eva, H.D.; Belward, A.S.; de Miranda, E.E.; Di Bella, C.M.; Gond, V.; Huber, O.; Jones, S.; Sgrenzaroli, M.; Fritz, S. A land cover map of South America. Glob. Chang. Biol 2004, 10, 731–744. [Google Scholar]
- FAO. Global Forest Resources Assessment 2000; FAO: Rome, Italy, 2001. [Google Scholar]
- Skole, D.; Tucker, C. Tropical deforestation and habitat fragmentation in the amazon: Satellite data from 1978 to 1988. Science 1993, 260, 1905–1910. [Google Scholar]
- Hansen, M.C.; Shimabukuro, Y.E.; Potapov, P.; Pittman, K. Comparing annual MODIS and PRODES forest cover change data for advancing monitoring of Brazilian forest cover. Remote Sens. Environ 2008, 112, 3784–3793. [Google Scholar]
- Brazil Second National Communication of Brazil to the United Nations Framework Convention on Climate Change. Available online: http://www.mct.gov.br/index.php/content/view/326984.html (accessed on 25 July 2011).
- Cerri, C.C.; Maia, S.M.F.; Galdos, M.V.; Cerri, C.E.P.; Feigl, B.J.; Bernoux, M. Brazilian greenhouse gas emissions: The importance of agriculture and livestock. Sci. Agric 2009, 66, 831–843. [Google Scholar]
- Dorais, A.; Cardille, J. Strategies for incorporating high-resolution google earth databases to guide and validate classifications: Understanding deforestation in Borneo. Remote Sens 2011, 3, 1157–1176. [Google Scholar]
- Goetz, S.; Dubayah, R. Advances in remote sensing technology and implications for measuring and monitoring forest carbon stocks and change. Carbon Manage 2011, 2, 231–244. [Google Scholar]


| Size of Sample Sites Land Cover Type | 20 × 20 km Area | 20 × 20 km s.e. | 10 × 10 km Area | 10 × 10 km s.e. |
|---|---|---|---|---|
| Tree Cover | 727.6 | 8.7 | 731.2 | 9.2 |
| Tree Cover Mosaic | 63.2 | 1.8 | 64.0 | 2.1 |
| Other Wooded Land | 190.9 | 4.9 | 191.2 | 5.4 |
| Other Land Cover | 445.0 | 7.8 | 439.1 | 8.7 |
| Water | 26.2 | 2.9 | 30.1 | 3.2 |
| (a) | ||||||||||||
| 2000/1990 | Tree Cover | Tree Cover Mosaic (TCM) | Other Wooded Land (OWL) | Other Land Cover (OLC) | Water | Total 1990 | ||||||
| area | s.e. | area | s.e. | area | s.e. | area | s.e. | area | s.e. | area | s.e. | |
| Tree Cover | 693,900 | 9,100 | 8,200 | 600 | 5,900 | 400 | 22,400 | 1,700 | 700 | 300 | 731,200 | 9,200 |
| TCM | 3,500 | 200 | 52,000 | 1,900 | 3,200 | 200 | 5,000 | 300 | 400 | 200 | 64,000 | 2,100 |
| OWL | 2,100 | 500 | 2,500 | 200 | 166,500 | 5,200 | 19,800 | 1,000 | 300 | 100 | 191,200 | 5,400 |
| OLC | 1,600 | 200 | 1,500 | 100 | 13,400 | 800 | 421,700 | 8,300 | 900 | 200 | 439,100 | 8,700 |
| Water | 100 | 0 | 100 | 100 | 200 | 100 | 1,200 | 200 | 25,900 | 3,000 | 27,500 | 2,100 |
| Total 2000 | 701,200 | 9,200 | 64,300 | 2,100 | 189,300 | 5,300 | 470,100 | 9,300 | 28,100 | 3,200 | 1,453,000 | |
| (b) | ||||||||||||
| 2005/2000 | Tree Cover | Tree Cover Mosaic (TCM) | Other Wooded Land (OWL) | Other Land Cover (OLC) | Water | Total 2000 | ||||||
| area | s.e. | area | s.e. | area | s.e. | area | s.e. | area | s.e. | area | s.e. | |
| Tree Cover | 678,900 | 9,500 | 4,900 | 400 | 4,100 | 400 | 13,000 | 1,200 | 300 | 100 | 701,200 | 9,600 |
| TCM | 2,000 | 300 | 58,000 | 2,100 | 1,500 | 200 | 2,600 | 200 | 200 | 100 | 64,200 | 2,200 |
| OWL | 1,100 | 200 | 1,300 | 400 | 172,300 | 5,600 | 14,200 | 1,700 | 400 | 200 | 189,200 | 5,600 |
| OLC | 400 | 100 | 400 | 100 | 6,000 | 600 | 462,300 | 9,000 | 900 | 200 | 470,000 | 9,100 |
| Water | 0 | 0 | 0 | 0 | 0 | 0 | 1,300 | 300 | 26,700 | 3,200 | 28,100 | 3,300 |
| Total 2005 | 682,400 | 9,600 | 64,500 | 2,200 | 184,000 | 5,600 | 493,400 | 9,600 | 28,500 | 3,400 | 1,452,800 | |
| Source Forest cover | Landsat Pathfinder | FAO FRA-2000 RSS | TREES-II | SDSU | FAO FRA-2010 CS | This study |
|---|---|---|---|---|---|---|
| Central and South America (for year 2000) | 700.4 | 726.8 | 814.3 | 883.6 | 733.3 (se 10.3) | |
| Legal Amazon (for year 1990) | 361.3 | 381.9 | 389.3 (se 5.4) |
| Source Region | INPE 1 | FAO FRA-2000 RSS 2 | SDSU | FAO FRA-2010 CS | This Study |
|---|---|---|---|---|---|
| Gross annual forest loss | |||||
| Tropical America 1990–2000 | 4.05 | 3.74 (se 0.22) | |||
| Tropical America 2000–2005 | 4.3 | 4.40 (se 0.32) | |||
| Brazil 1990–2000 | 2.59 (se 0.35) | ||||
| Brazil 2000–2005 | 3.3 | 3.02 (se 0.25) | |||
| Legal Amazon 1990–2000 | 1.68 | 2.07(se 0.35) | |||
| Legal Amazon 2000–2005 | 2.24 | 2.6 | 2.55 (se 0.26) | ||
| Net annual forest cover changes | |||||
| Tropical America 1990–2000 | 3.85 | 4.19 | 2.98 (se 0.26) | ||
| Tropical America 2000–2005 | 4.34 | 3.74 (se 0.39) | |||
| Brazil 1990–2000 | 2.89 | 2.09 (se 0.36) | |||
| Brazil 2000–2005 | 3.09 | 2.57 (se 0.31) | |||
| Source of Estimate Carbon Emissions/Loss | TREES-II 1990–1997 | Brazil 1st National Communication | Brazil 2nd National Communication | FAO FRA-2010 CS | Pan et al. 2011 [2] | This Study 10 Year Committed | This Study Total Carbon Loss |
|---|---|---|---|---|---|---|---|
| Annual C emissions (106 tC·y−1) | |||||||
| Tropical America 1990–2000 | 519 | 1510 | 482 | 698 | |||
| Tropical America 2000–2005 | 1370 | 583 | 845 | ||||
| Brazil 1990–2000 | 282 | 351 | |||||
| Brazil 2000–2005 | 325 | 423 | |||||
| Legal Amazon 1990–2000 | 260 | 277 | |||||
| Legal Amazon 2000–2005 | 350 | ||||||
| Annual CO2 emissions (106 tCO2·y−1) | |||||||
| Brazil 1990–2000 | 997 | 944 | 888 | 1,287 | |||
| Brazil 2000–2005 | 1,081 | 1,250 | 1,070 | 1,551 | |||
| Legal Amazon 1990–2000 | 599 | 700 | 1,015 | ||||
| Legal Amazon 2000–2005 | 829 | 885 | 1,282 |
Share and Cite
Eva, H.D.; Achard, F.; Beuchle, R.; De Miranda, E.; Carboni, S.; Seliger, R.; Vollmar, M.; Holler, W.A.; Oshiro, O.T.; Barrena Arroyo, V.; et al. Forest Cover Changes in Tropical South and Central America from 1990 to 2005 and Related Carbon Emissions and Removals. Remote Sens. 2012, 4, 1369-1391. https://doi.org/10.3390/rs4051369
Eva HD, Achard F, Beuchle R, De Miranda E, Carboni S, Seliger R, Vollmar M, Holler WA, Oshiro OT, Barrena Arroyo V, et al. Forest Cover Changes in Tropical South and Central America from 1990 to 2005 and Related Carbon Emissions and Removals. Remote Sensing. 2012; 4(5):1369-1391. https://doi.org/10.3390/rs4051369
Chicago/Turabian StyleEva, Hugh D., Frédéric Achard, René Beuchle, Evaristo De Miranda, Silvia Carboni, Roman Seliger, Michael Vollmar, Wilson A. Holler, Osvaldo T. Oshiro, Victor Barrena Arroyo, and et al. 2012. "Forest Cover Changes in Tropical South and Central America from 1990 to 2005 and Related Carbon Emissions and Removals" Remote Sensing 4, no. 5: 1369-1391. https://doi.org/10.3390/rs4051369