Improving Landslide Forecasting Using ASCAT-Derived Soil Moisture Data: A Case Study of the Torgiovannetto Landslide in Central Italy

 ,
,  ,
,
Abstract
:1. Introduction
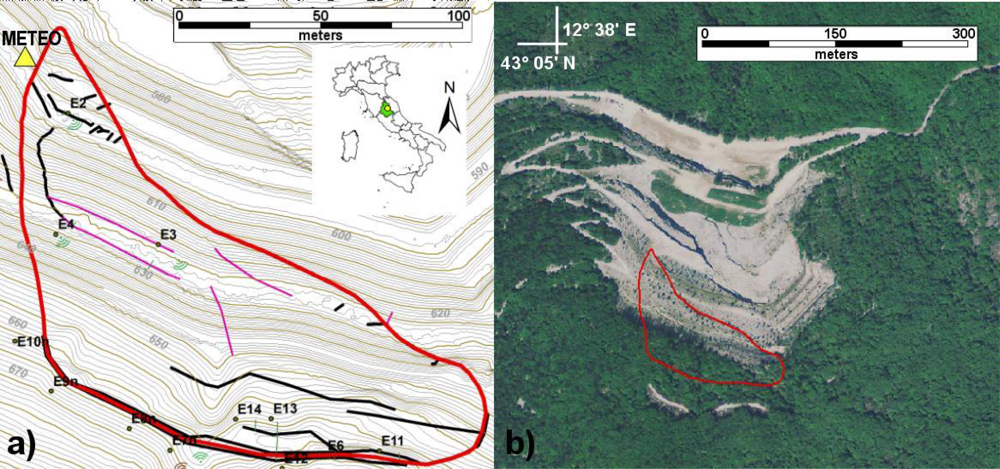
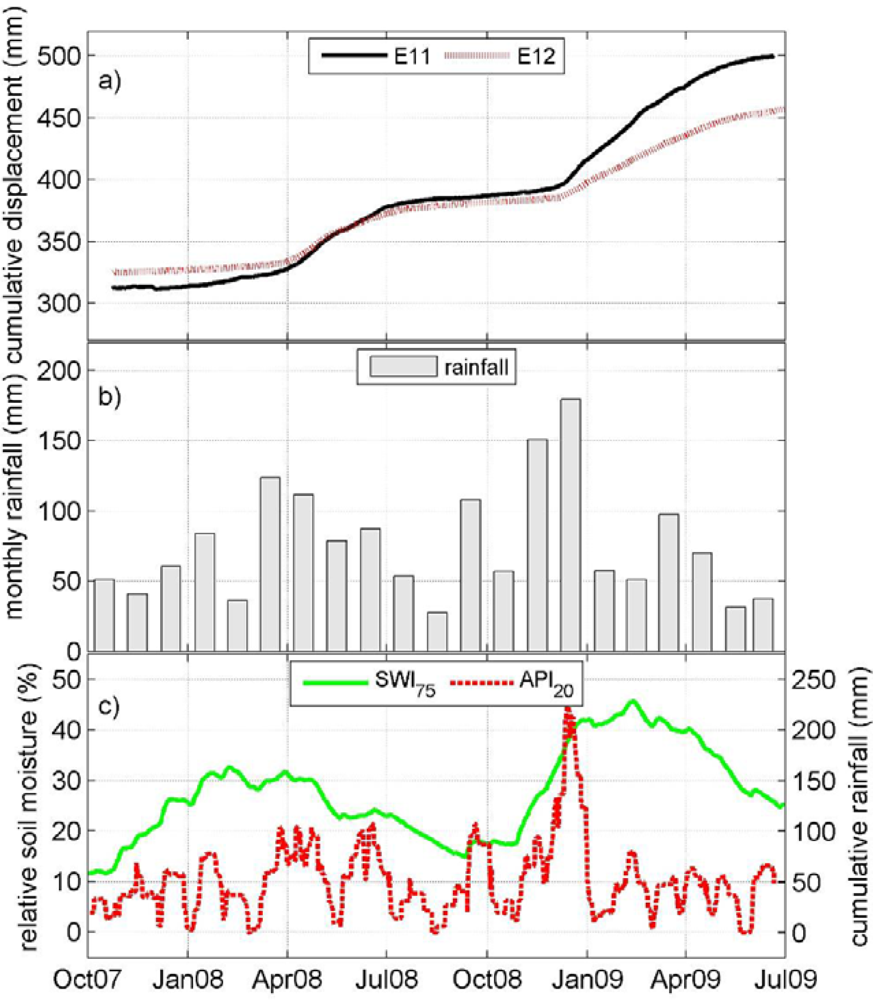
2. Study Area and Data Set
ASCAT Soil Water Index Product
3. Methods
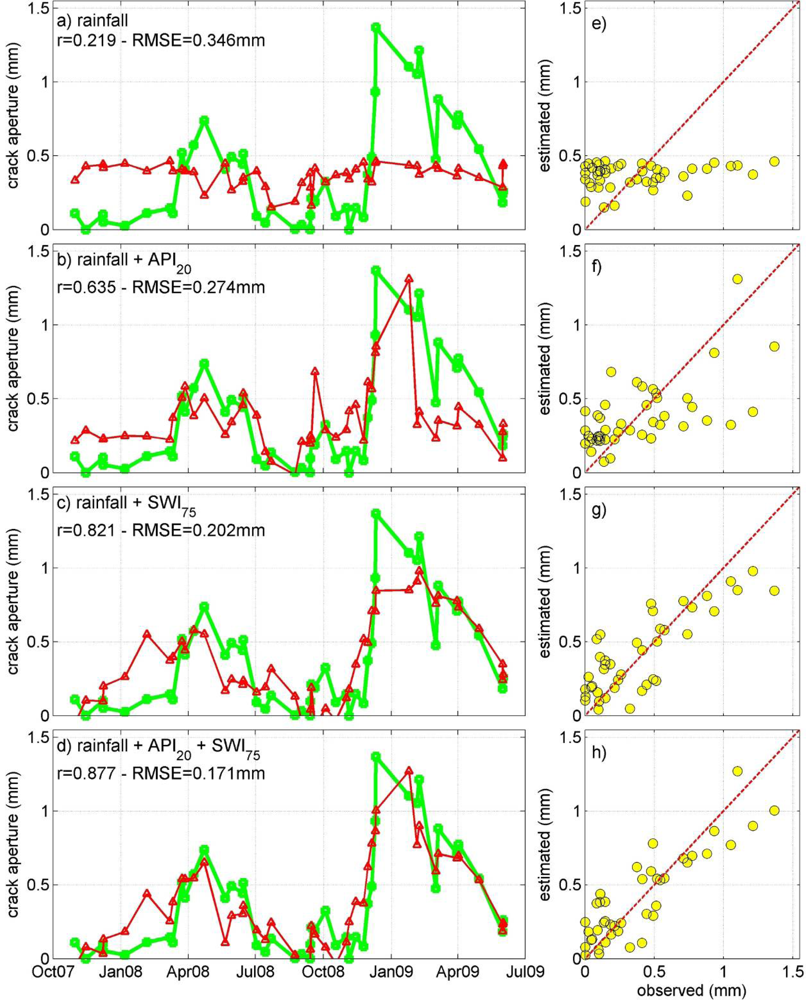
4. Results
5. Conclusions
Acknowledgments
References
- Guzzetti, F.; Reichenbach, P.; Cardinali, M.; Ardizzone, F.; Galli, M. The impact of landslides in the Umbria region, central Italy. Nat. Hazards Earth Syst. Sci 2003, 3, 469–486. [Google Scholar]
- Guzzetti, F.; Stark, C.P.; Salvati, P. Evaluation of flood and landslide risk to the population of Italy. Environ. Manage 2005, 36, 15–36. [Google Scholar]
- Ponziani, F.; Pandolfo, C.; Stelluti, M.; Berni, N.; Brocca, L.; Moramarco, T. Assessment of rainfall thresholds and soil moisture modeling for operational hydrogeological risk prevention in the Umbria region (central Italy). Landslides 2012. [Google Scholar] [CrossRef]
- Ray, R.L.; Jacobs, J.M.; Ballestero, T.P. Regional landslide susceptibility: Spatiotemporal variations under dynamic soil moisture conditions. Natural Hazards 2011, 59, 1317–1337. [Google Scholar]
- Ren, D.; Fu, R.; Leslie, L.M.; Dickinson, R.E. Predicting storm-triggered landslides. Bull. Am. Meteorol. Soc 2011, 92, 129–139. [Google Scholar]
- Guzzetti, F.; Carrara, A.; Cardinali, M.; Reichenbach, P. Landslide hazard evaluation: A review of current techniques and their application in a multi-scale study, central Italy. Geomorphology 1999, 31, 181–216. [Google Scholar]
- Caine, N. The rainfall intensity: Duration control of shallow landslides and debris flows. Geografiska Annaler A 1980, 62, 23–27. [Google Scholar]
- Glade, T.; Crozier, M.; Smith, P. Applying probability determination to refine landslide-triggering rainfall thresholds using an empirical ‘antecedent daily rainfall model’. Pure Appl. Geophys 2000, 157, 1059–1079. [Google Scholar]
- Guzzetti, F.; Peruccacci, S.; Rossi, M.; Stark, C.P. Rainfall thresholds for the initiation of landslides in central and southern Europe. Meteorol. Atmos. Phys 2007, 98, 239–267. [Google Scholar]
- Guzzetti, F.; Peruccacci, S.; Rossi, M.; Stark, C.P. The rainfall intensity-duration control of shallow landslides and debris flows: an update. Landslides 2008, 5, 3–17. [Google Scholar]
- Brunetti, M.T.; Peruccacci, S.; Rossi, M.; Luciani, S.; Valigi, D.; Guzzetti, F. Rainfall thresholds for the possible occurrence of landslides in Italy. Nat. Hazards Earth Syst. Sci 2010, 10, 447–458. [Google Scholar]
- Iverson, R.M. Landslide triggering by rain infiltration. Water Resour. Res 2000, 36, 1897–1910. [Google Scholar]
- Baum, R.L.; Savage, W.Z.; Godt, J.W. TRIGRS—A Fortran Program for Transient Rainfall Infiltration and Grid-Based Regional Slope-Stability Analysis; Version 2.0; US Geological Survey Open-File Report 1159; USGS Central Region Geologic Hazards Team: Denver, CO, USA, 2008; p. 75. [Google Scholar]
- Capparelli, G.; Versace, P. FLaIR and SUSHI: Two mathematical models for early warning of landslides induced by rainfall. Landslides 2010, 8, 67–79. [Google Scholar]
- Greco, R.; Guida, A.; Damiano, E.; Olivares, L. Soil water content and suction monitoring in model slopes for shallow flowslides early warning applications. Phys. Chem. Earth 2010, 35, 127–136. [Google Scholar]
- Segoni, S.; Leoni, L.; Benedetti, A.I.; Catani, F.; Righini, G.; Falorni, G.; Gabellani, S.; Rudari, R.; Silvestro, F.; Rebora, N. Towards a definition of a real-time forecasting network for rainfall induced shallow landslides. Nat. Hazards Earth Syst. Sci 2010, 9, 2119–2133. [Google Scholar]
- Liao, Z.; Hong, Y.; Kirschbaum, D.; Adler, R.; Gourley, J.J.; Wooten, R. Evaluation of TRIGRS (Transient Rainfall Infiltration and Grid-based Regional Slope-Stability Analysis)’s predictive skill for hurricane-triggered landslides: A case study in Macon county, North Carolina. Natural Hazards 2011, 43, 245–256. [Google Scholar]
- Crozier, M.J. Prediction of rainfall-triggered landslides: A test of the antecedent water status model. Earth Surf. Process Landf 1999, 24, 825–833. [Google Scholar]
- Capparelli, G.; Tiranti, D. Application of the MoniFLaIR early warning system for rainfall-induced landslides in Piedmont region (Italy). Landslides 2010, 7, 401–410. [Google Scholar]
- Tsai, T.-L.; Chen, H-F. Effects of degree of saturation on shallow landslides triggered by rainfall. Environ. Earth Sci 2010, 59, 1285–1295. [Google Scholar]
- Godt, J.W.; Baum, R.L.; Chleborad, A.F. Rainfall characteristics for shallow landsliding in Seattle, Washington, USA. Earth Surf. Processes Landf 2006, 31, 97–110. [Google Scholar]
- Pelletier, J.D.; Malamud, B.D.; Blodgett, T.; Turcotte, D.L. Scale-invariance of soil moisture variability and its implications for the frequency-size distribution of landslides. Eng. Geol 1997, 48, 255–268. [Google Scholar]
- Ray, R.L.; Jacobs, J.M.; Cosh, M.H. Landslide susceptibility mapping using downscaled AMSR-E soil moisture: A case study from Cleveland Corral, California, US. Remote Sens. Environ 2010, 114, 2624–2636. [Google Scholar]
- Pfister, L.; Drogue, G.; El Idrissi, A.; Humbert, J.; Iffly, J.F.; Matgen, P.; Hoffmann, L. Predicting peak discharge through empirical relationships between rainfall, groundwater level and basin humidity in the Alzette River basin (Grand-Duchy of Luxembourg). J. Hydrol. Hydromech 2003, 51, 210–220. [Google Scholar]
- Brocca, L.; Melone, F.; Moramarco, T. Empirical and Conceptual Approaches for Soil Moisture Estimation in View of Event-Based Rainfall-Runoff Modeling. In Progress in Surface and Subsurface Water Studies at the Plot and Small Basin Scale; Maraga, F., Arattano, M., Eds.; IHP-VI; Technical Documents in Hydrology; UNESCO: Paris, France, 2005; Volume 77, pp. 1–8. [Google Scholar]
- Brocca, L.; Melone, F.; Moramarco, T. On the estimation of antecedent wetness condition in rainfall-runoff modelling. Hydrol. Processes 2008, 22, 629–642. [Google Scholar]
- Brocca, L.; Galli, M.; Stelluti, M. Preliminary analysis of distributed in situ soil moisture measurements. Adv. Geosci 2005, 2, 81–86. [Google Scholar]
- Baum, R.L.; Godt, J.W. Early warning of rainfall-induced shallow landslides and debris flows in the USA. Landslides 2009, 7, 259–272. [Google Scholar]
- Harris, S.J.; Orense, R.P.; Itoh, K. Back analyses of rainfall-induced slope failure in Northland Allochthon formation. Landslides 2011. [Google Scholar] [CrossRef]
- Hawke, R.; McConchie, J. In situ measurement of soil moisture and pore-water pressures in an ‘incipient’ landslide: Lake Tutira, New Zealand. J. Environ. Manage 2011, 92, 266–274. [Google Scholar]
- Ray, R.L.; Jacobs, J.M. Relationships among remotely soil moisture, precipitation and landslide events. Natural Hazards 2007, 43, 211–222. [Google Scholar]
- Teng, B.; Kirschbaum, D.B.; Hong, Y.; Adler, R. Improving Global Landslide Algorithm Forecasting with Satellite Soil Moisture Data. Presented at AGU Fall Meeting, San Francisco, CA, USA, 15–19 December 2008.
- Graziani, A.; Rotonda, T.; Tommasi, P. Stability and Deformation Mode of Rock Slide along Interbeds Reactivated by Rainfall. Proceedings of the First Italian Workshop on Landslides, Naples, Italy, 8–10 June 2009; pp. 62–71.
- Salciarini, D.; Tamagnini, C.; Conversini, P. Discrete element modeling of debris-avalanche impact on earthfill barriers. Phys. Chem. Earth 2010, 35, 172–181. [Google Scholar]
- Wagner, W.; Lemoine, G.; Rott, H. A method for estimating soil moisture from ERS scatterometer and soil data. Remote Sens. Environ 1999, 70, 191–207. [Google Scholar]
- Wagner, W.; Lemoine, G.; Borgeaud, M.; Rott, H. A study of vegetation cover effects on ERS scatterometer data. IEEE Trans. Geosci. Remote Sens 1999, 37, 938–948. [Google Scholar]
- Albergel, C.; Rüdiger, C.; Carrer, D.; Calvet, J.C.; Fritz, N.; Naeimi, V.; Bartalis, Z.; Hasenauer, S. An evaluation of ASCAT surface soil moisture products with in-situ observations in southwestern France. Hydrol. Earth Syst. Sci 2009, 13, 115–124. [Google Scholar]
- Brocca, L.; Melone, F.; Moramarco, T.; Wagner, W.; Hasenauer, S. ASCAT soil wetness index validation through in-situ and modeled soil moisture data in central Italy. Remote Sens. Environ 2010, 114, 2745–2755. [Google Scholar]
- Brocca, L.; Hasenauer, S.; Lacava, T.; Melone, F.; Moramarco, T.; Wagner, W.; Dorigo, W.; Matgen, P.; Martínez-Fernández, J.; Llorens, P.; et al. Soil moisture estimation through ASCAT and AMSR-E sensors: an intercomparison and validation study across Europe. Remote Sens. Environ 2011, 115, 3390–3408. [Google Scholar]
- Parrens, M.; Zakharova, E.; Lafont, S.; Calvet, J.-C.; Kerr, Y.; Wagner, W.; Wigneron, J.-P. Comparing soil moisture retrievals from SMOS and ASCAT over France. Hydrol. Earth Syst. Sci 2012, 16, 423–440. [Google Scholar]
- Sinclair, S.; Pegram, G.G.S. A comparison of ASCAT and modelled soil moisture over South Africa, using TOPKAPI in land surface mode. Hydrol. Earth Syst. Sci 2010, 14, 613–626. [Google Scholar]
- Su, Z.; Wen, J.; Dente, L.; van der Velde, R.; Wang, L.; Ma, Y.; Yang, K.; Hu, Z. The Tibetan Plateau observatory of plateau scale soil moisture and soil temperature (Tibet-Obs) for quantifying uncertainties in coarse resolution satellite and model products. Hydrol. Earth Syst. Sci 2011, 15, 2303–2316. [Google Scholar]
- Brocca, L.; Melone, F.; Moramarco, T.; Morbidelli, R. Antecedent wetness conditions based on ERS scatterometer data. J. Hydrol 2009, 364, 73–87. [Google Scholar]


| Date | Duration (h) | Pmax-1h (mm) | Ptot (mm) | SWI75 (%) | API20 (mm) | dH (mm) |
|---|---|---|---|---|---|---|
| 07-10-30 17:30 | 6.5 | 6.6 | 14.7 | 15.3 | 37.8 | 0.109 |
| 07-11-14 08:00 | 10.5 | 4.0 | 28.8 | 18.7 | 68.9 | 0.000 |
| 07-12-07 17:30 | 7.5 | 1.8 | 13.8 | 22.0 | 21.4 | 0.101 |
| 07-12-08 04:30 | 10.0 | 3.6 | 21.2 | 22.8 | 42.6 | 0.052 |
| 08-01-06 08:00 | 12.0 | 1.4 | 12.4 | 27.1 | 22.0 | 0.025 |
| 08-02-04 23:30 | 6.5 | 4.2 | 18.2 | 32.9 | 41.9 | 0.111 |
| 08-03-07 05:00 | 12.0 | 1.6 | 20.8 | 28.8 | 33.4 | 0.145 |
| 08-03-11 02:00 | 10.0 | 3.6 | 13.0 | 29.8 | 54.6 | 0.109 |
| 08-03-23 10:00 | 13.0 | 4.0 | 21.2 | 31.2 | 97.6 | 0.520 |
| 08-03-27 17:00 | 4.5 | 3.4 | 10.6 | 31.5 | 90.6 | 0.413 |
| 08-04-08 15:00 | 11.0 | 6.2 | 34.0 | 30.3 | 105.3 | 0.573 |
| 08-04-22 14:30 | 3.5 | 10.8 | 12.6 | 30.6 | 104.6 | 0.739 |
| 08-05-21 01:00 | 12.5 | 2.4 | 21.8 | 22.4 | 44.6 | 0.411 |
| 08-05-29 18:30 | 1.5 | 9.5 | 15.1 | 22.2 | 73.3 | 0.492 |
| 08-06-13 16:30 | 3.0 | 6.6 | 12.0 | 23.1 | 79.8 | 0.444 |
| 08-06-14 10:30 | 7.0 | 6.0 | 17.2 | 23.3 | 103.2 | 0.513 |
| 08-07-02 14:30 | 4.5 | 3.8 | 14.4 | 22.6 | 60.8 | 0.090 |
| 08-07-14 12:30 | 2.5 | 8.4 | 14.2 | 21.4 | 29.0 | 0.045 |
| 08-07-22 00:00 | 5.5 | 15.2 | 21.8 | 20.3 | 53.6 | 0.136 |
| 08-08-23 14:30 | 3.0 | 13.4 | 20.6 | 16.1 | 27.6 | 0.003 |
| 08-09-01 15:30 | 6.0 | 7.6 | 17.4 | 14.8 | 45.0 | 0.032 |
| 08-09-12 19:30 | 5.5 | 5.2 | 21.8 | 14.1 | 42.5 | 0.001 |
| 08-09-13 09:30 | 3.0 | 9.2 | 19.6 | 15.8 | 62.1 | 0.097 |
| 08-09-14 17:00 | 1.0 | 15.1 | 25.6 | 16.2 | 89.9 | 0.212 |
| 08-09-19 08:00 | 9.0 | 2.6 | 10.8 | 17.4 | 107.3 | 0.190 |
| 08-10-03 21:30 | 6.0 | 7.6 | 18.8 | 16.9 | 62.7 | 0.324 |
| 08-10-17 18:00 | 2.5 | 4.8 | 12.6 | 17.1 | 32.1 | 0.090 |
| 08-11-01 00:30 | 15.0 | 5.0 | 20.8 | 19.9 | 58.2 | 0.147 |
| 08-11-04 17:30 | 6.5 | 6.2 | 14.8 | 21.9 | 75.8 | 0.000 |
| 08-11-13 12:30 | 5.5 | 4.2 | 23.0 | 26.4 | 92.5 | 0.146 |
| 08-11-24 12:30 | 21.0 | 4.0 | 39.2 | 28.8 | 75.2 | 0.084 |
| 08-11-30 02:00 | 5.5 | 5.8 | 11.0 | 31.7 | 105.6 | 0.374 |
| 08-12-05 12:30 | 6.0 | 8.2 | 24.4 | 34.5 | 129.6 | 0.491 |
| 08-12-10 02:30 | 11.5 | 2.8 | 27.6 | 36.6 | 164.6 | 0.933 |
| 08-12-10 22:30 | 13.0 | 4.2 | 43.8 | 39.2 | 208.4 | 1.369 |
| 09-01-24 20:30 | 13.5 | 1.2 | 15.4 | 43.8 | 228.2 | 1.102 |
| 09-02-04 16:00 | 13.0 | 1.8 | 11.6 | 46.8 | 40.8 | 1.054 |
| 09-02-07 13:30 | 6.5 | 2.2 | 13.2 | 46.2 | 61.8 | 1.213 |
| 09-03-02 05:00 | 9.0 | 1.8 | 10.8 | 41.3 | 17.2 | 0.477 |
| 09-03-05 06:30 | 8.0 | 2.6 | 10.2 | 42.5 | 42.4 | 0.881 |
| 09-03-30 20:30 | 1.5 | 5.0 | 11.8 | 40.1 | 46.0 | 0.710 |
| 09-04-01 21:30 | 5.0 | 2.6 | 10.2 | 40.3 | 60.0 | 0.773 |
| 09-04-29 14:00 | 5.5 | 5.4 | 11.6 | 34.5 | 49.2 | 0.543 |
| 09-05-31 10:00 | 2.5 | 8.4 | 13.0 | 26.0 | 18.0 | 0.183 |
| 09-05-31 15:30 | 10.5 | 2.2 | 13.2 | 26.0 | 31.2 | 0.239 |
| 09-06-01 04:30 | 13.5 | 2.0 | 17.0 | 26.5 | 48.6 | 0.260 |
Share and Cite
Brocca, L.; Ponziani, F.; Moramarco, T.; Melone, F.; Berni, N.; Wagner, W. Improving Landslide Forecasting Using ASCAT-Derived Soil Moisture Data: A Case Study of the Torgiovannetto Landslide in Central Italy. Remote Sens. 2012, 4, 1232-1244. https://doi.org/10.3390/rs4051232
Brocca L, Ponziani F, Moramarco T, Melone F, Berni N, Wagner W. Improving Landslide Forecasting Using ASCAT-Derived Soil Moisture Data: A Case Study of the Torgiovannetto Landslide in Central Italy. Remote Sensing. 2012; 4(5):1232-1244. https://doi.org/10.3390/rs4051232
Chicago/Turabian StyleBrocca, Luca, Francesco Ponziani, Tommaso Moramarco, Florisa Melone, Nicola Berni, and Wolfgang Wagner. 2012. "Improving Landslide Forecasting Using ASCAT-Derived Soil Moisture Data: A Case Study of the Torgiovannetto Landslide in Central Italy" Remote Sensing 4, no. 5: 1232-1244. https://doi.org/10.3390/rs4051232