1. Introduction
Often confused and ambiguously replaced with land cover, the ‘land use’ concept has evolved over recent decades to be primarily considered as the socioeconomic function of land. While land cover and land cover change detection by satellite imagery have been one of the main aims of the evolution of technologies and methodologies from the beginning of the remote sensing (RS) era, land use recognition and land use change assessment through RS still remain major challenges for the RS scientific community.
It is recognized that large-scale changes in land use and land cover have occurred over the last few centuries and that this can have significant consequences on the functioning of the Earth System [
1]. In fact, it has been estimated that 35% of anthropogenic emissions (measured in CO
2 equivalents) originated from land use/cover changes [
2,
3] and therefore land use is considered to be a primary force in determining human impacts on ecosystems and the climate system. As the scientific community generated increasing amounts of evidence on the impacts of land use on surface-atmosphere energy exchanges, the carbon and water cycles, and the provision of ecosystem goods and services, these issues and interactions together became one of the focal points on the global environmental change research agenda [
3–
8]. Consequently, changes in land and ecosystems and their implications for global environmental change and sustainability are a major research challenge for the so-called ‘land change science’ [
3].
The UNFCCC [
9] specified that Parties should report on greenhouse gas (GHG) emissions by sources and removals by sinks resulting from
direct human-induced land use change and forestry activities. National GHG inventories, as set out by the IPCC, should be transparent, complete (all land within a country should be included), internally consistent over time, comparable between countries, accurate and adequate (
i.e., capable of accounting for land use categories and land use changes). Consequently, information on land cover and land use is becoming increasingly important for policy-making, business and environmental planning from the global to local scale. The collection and analysis of high quality land use and land use change data are therefore major research challenges and essential to the fulfillment of UNFCCC requirements. In this context, we argue that satellite RS imagery represents a valuable and cost-effective tool which could be particularly useful in filling the gaps in the availability of data regarding Land Use, Land Use Change and Forestry (LULUCF) activities [
10] for different levels of data needs [
11].
In this paper we present a methodological approach based on RS techniques to assess land use in accordance with the UNFCCC requirements. The methodology is based primarily on the recognition of the land key elements, the assessment of their socio-economic functions and the adoption of the “predominant land use” criteria in the classification scheme.
2. The Evolution of the Land Use Concept
The land use representation starts from the assessment of the land cover (the observed physical cover of the Earth’s surface [
12]). During the last few decades the land use concept has been defined in two different ways: the
activities undertaken on a surface that induce land cover transformation (the management dimension); and the
purpose underlying that transformation (the functional dimension) [
4–
16]. Land use dynamics are a major determinant of land cover changes [
17].
To improve the understanding of land-use/land-cover relationships, land use must be linked to human actions [
14] and, specifically, to the economic drivers behind these actions. In recent years, international organizations (such as the Food and Agriculture Organization of the United Nations, FAO; and the Statistical Office of the European Union, EUROSTAT) and global analyses [
8,
18–
20] have focused on the functional dimensions of land use and the socio-economic functions of the land.
The UNFCCC, and the IPCC, identified the use of land as one of the key factors to address in order to account for GHGs emissions to the atmosphere. In 2000, the Global Forest Resource Assessment (FRA 2000) of the FAO [
21] defined forest as a land use class and the deforestation process as a land-use change. It is interesting to recall the process that FAO followed in order to change its forest definition: in the first phase of FRA 2000, forest was considered a land cover class “with a continuous vegetation cover in which tree crown cover exceeds 10 percent”, while the official FRA 2000 definition specified that “forests are determined both by the presence of trees and the absence of other predominant land uses”. Thus, forest was considered a land use class, with the FRA 2000 specifying that “one driving factor behind this re-examination was the request for input to the Kyoto Protocol of the UNFCCC process and the elaborations on carbon sequestration in forests”. The FRA 2005 further elaborates the forest definition by making explicit that forest: “does not include land that is predominantly under agricultural or urban land use” and considers that “forest is land spanning more than 0.5 hectares with trees higher than 5 meters and a canopy cover of more than 10 percent, or trees able to reach these thresholds
in situ”.
In Europe, a further activity led to a revision of the land use concept: the Land use/cover area frame survey (LUCAS) project of EUROSTAT [
22], which considered land use as the description of the socio-economic function of the land.
Under the UNFCCC, all countries agreed on several commitments (Art. 4 of the Convention), one of them being the development of national inventories of all GHGs using comparable methodologies to be agreed upon by the Conference of the Parties. The task of developing these “comparable methodologies” was assigned to the IPCC, which developed guidelines and guidance, such as the 2003 Good Practice Guidance for Land Use, Land Use Change and Forestry (GPG-LULUCF) [
10] and the 2006 IPCC Guidelines for National Greenhouse Gas Inventories for Agriculture, Forestry and Other Land Uses (GL-AFOLU) [
23]. In these documents six broad categories of land uses were defined: Forest land, Cropland, Grassland, Wetlands, Settlements, Other land. Each category is further subdivided into two sub-categories: land category remaining in the same land category and land converted to the land use category in question. Only broad and non-prescriptive definitions are provided for these land use categories: countries may use their own definitions, which may or may not refer to internationally accepted definitions (e.g., FAO) and may be stratified (e.g., by climate or ecological zones), so that the emissions/removals can be estimated at an appropriate level of detail [
11].
The RS scientific community has invested much effort in improving techniques for the detection of land cover and land cover change since the 1970s (when the first satellite specifically designed to collect data on the Earth’s surface was launched by the USA: Earth Resources Technology Satellite, ERTS-1). Improvements in the technical capabilities of the sensors (not only spatial, spectral and temporal resolutions but also the characterization and calibration of different sensors) and the new potentialities of satellites and image processing algorithms represent an authentic technological revolution for the observation of the Earth. However, land use recognition through RS is still not considered feasible, because the use of land depends not only on the land cover elements but also on their social and economical properties. For instance, depending on their human use, a group of trees could be classified as forest, cropland or settlement.
To respond to the above-outlined scientific challenges, this paper describes a method to assess land use through RS. This method is based on a systematic approach that avoids theoretical ambiguity between land cover and land use. The technical constraints which may hinder the proposed approach are also explained and discussed.
3. The Evolution of RS Technologies
RS has played a key role in the monitoring of the magnitude of climate change effects [
24] and especially of the relevance of land use change which represents one of the main drivers of change [
2,
4,
25]. Long-term, multispectral satellite observations since the early 1980s are the basis for understanding the dynamics of terrestrial vegetation and responses to changes in the climate and human land use [
26].
The need and urgency to characterize and quantify human-actions on climate change persuaded the international community to include several specific reporting requirements under the UNFCCC, in light of the technical-scientific capabilities of countries to assess, and report on, human-induced GHG emissions and removals.
Following the IPCC’s methodologies for the LULUCF sector, RS data can be used to support activity data estimation (area extension and area change extension). Yet there are a number of challenges to using a RS based approach, for example, the definition of forest land with a minimum area of land between 0.05–1.0 ha (agreed in the Marrakesh Accords) [
27] that requires a minimum spatial resolution (from very high resolution to high resolution, e.g., from sub-meter to 30–40 m pixel resolution).
The potential of RS to assist countries in fulfilling their reporting requirements under the UNFCCC is also useful for obtaining area estimates of land use categories and land use changes for the historical trend (e.g., the establishment of a 1990 baseline) or for the quantification of emissions and removals due to land disturbance processes (e.g., fire, landslides, etc.).
The development of RS technologies has expanded our capacity to monitor the Earth’s surface through the improvement of spatial, temporal and spectral resolutions of RS data. In the meantime, there has also been fast development of RS techniques to investigate and analyze ecosystems, basins, regions and continents [
30]. However, with the realization of global (e.g., GlobCOVER of the European Space Agency) [
31] and regional (e.g.,: TREES Project, of the Joint Research Centre of the European Union) [
32] RS Earth observation projects, the scientific community realized that there were intrinsic limits to the identification of changes occurring on land using low and medium spatial resolution satellite data. Today, due to the rapid development of satellite technology (see
Table 1), it is possible to investigate and conduct analysis at stand, and even tree, scale. These RS achievements allow the detection of different land elements using satellite imagery and thus now make possible the evaluation and identification of land uses, which is the focus of this paper. Indeed, very high spatial resolution images have a pixel resolution on the ground smaller than the size of a tree crown: they provide many pixels per object rather than many objects in a single pixel [
33,
28]. This therefore facilitates the identification of almost all key land elements (See
Figure 1). The analysis of pixel combinations allows the analysis of the spatial combination of key land elements, which will be the first step towards the identification of land uses by RS.
4. Methods
In this article, the term
Land use refers to the description of the socio-economic function of the land;
Land cover is considered to be the observed physical cover of the Earth’s surface (for the purpose of this paper the definitions developed by EUROSTAT in its LUCAS project have been adopted [
22]).
Key land element is defined as a physical component of the land that characterizes one or more land cover classes and/or land use categories.
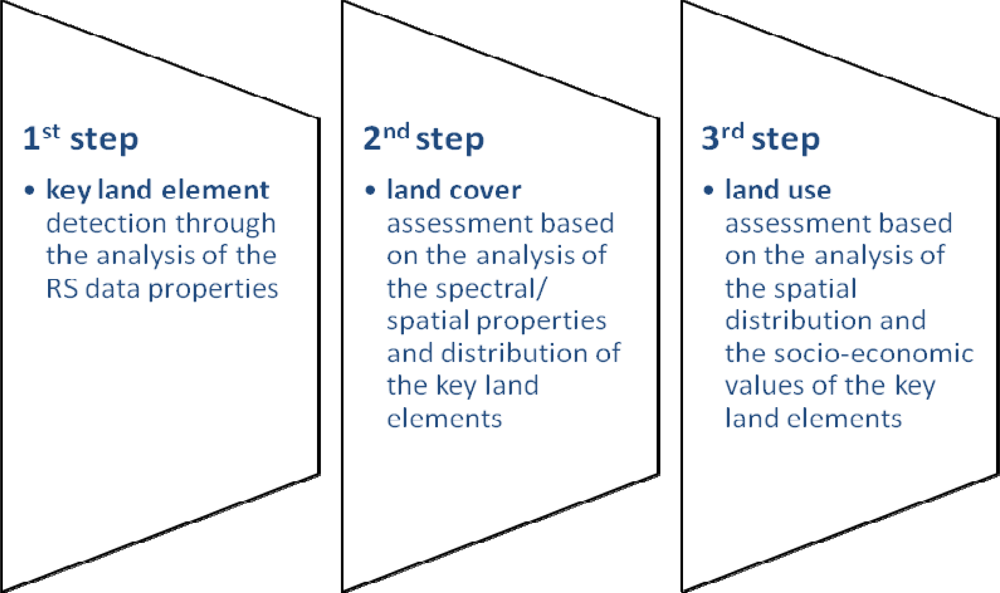
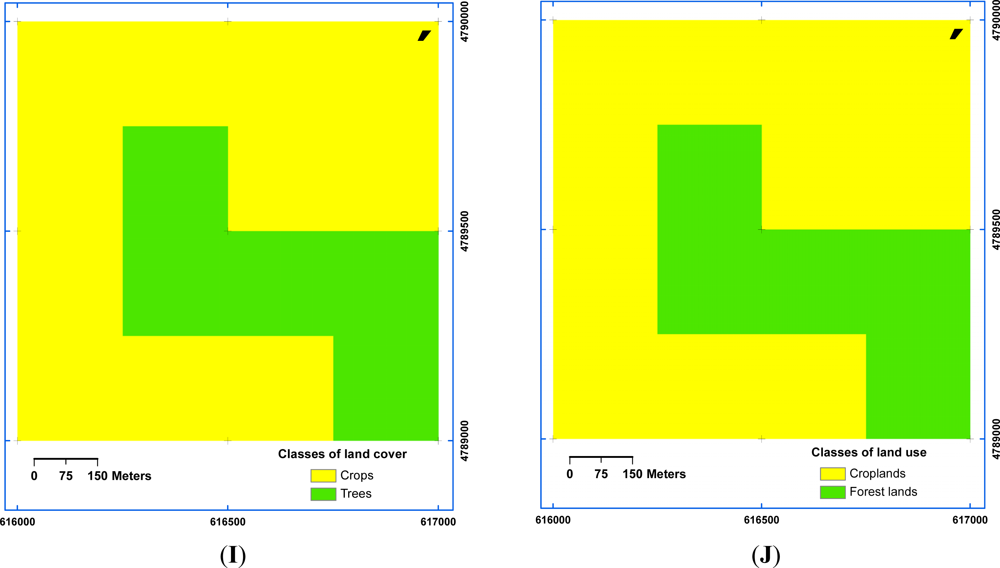
The methodology set out in this paper focuses on the analysis of the function of the key land elements and on the possibility of detecting them through RS data. Both land cover and land use concepts are based on the analysis of the spatial aggregation of elements present in the land (There may be some exceptions, e.g., area with no land elements but that still fall under a specific land use, such as firebreaks that would be considered as Forest land). For land cover, it is most often the extension and homogeneity of land elements by aggregation that determine a class, while for land use it is often the economic value of the different land elements that characterizes the predominant land use category. For example, the key land element which characterizes forest (land cover) and forest land (land use) is the tree: once we are able to detect it, it will be its spatial and functional relationship with other key land elements that will determine which land cover class or land use categories the area will fall under. Thus the critical step to determine land cover and land use through RS application is the detection of the single land element. The spatial dimension of the key land elements (see
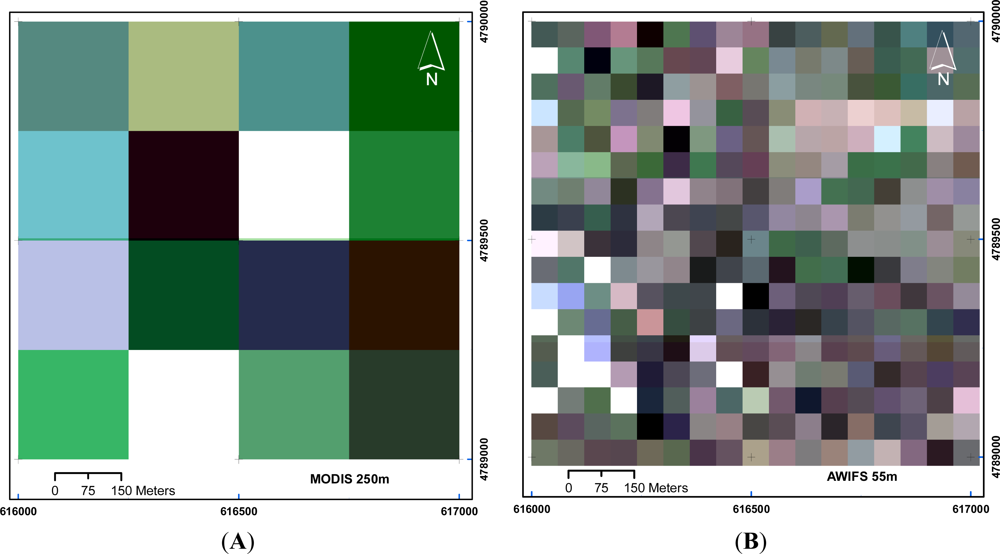
Table 2) has a wide range, varying from less than one meter to more than one kilometer. The capacity to detect all or almost all of the key land elements is then strongly correlated to the spatial resolution on the ground of the RS data and also in part to the spectral or radiometric resolution. In general, when the pixel spatial resolution is lower than the dimensions of the land elements, then the single land elements should be detectable. However, if the pixel spatial resolution is larger than the dimension of the land elements, it will be not possible to detect the single elements, but their presence will have to be determined through an analysis of the pixel’s spectral properties which then will be used in texture and object-oriented analyses,
etc. (
Figure 2).
Another factor which affects the capacity to detect the key land element is the methodology used to elaborate the RS data. In general, to detect the single elements, the methodologies which analyze the single pixel or single object properties may be more appropriate, but the choice of a determinate methodology will depend on the land properties, as the performance of methodologies may vary according to the data used and the characteristics of land elements. In this paper, different methodologies have been tested with the intention of demonstrating that the methodology to assess land use may be applied in combination with the most common approaches for image processing (e.g., pixel based and object oriented). Some results are presented in this paper as examples while others are available in the online supporting materials.
Once detection of the key land elements has been carried out, the land cover is determined by the presence and spatial distribution of the land elements on the surface. The land cover classification through RS images is generally undertaken through the identification of homogeneous areas following geometric, contextual and radiometric characteristics. If the data (pixel spatial resolution lower than land elements dimension) and methodology allow the detection of all land elements, the land cover assessment is not required for the land use assessment. While if the data (for instance, if the pixel spatial resolution is greater than the dimensions of land elements) and the methodology do not allow the detection of all the key land elements, then the land cover assessment is a necessary step for the land use assessment. In this paper we do not discuss the method used to assess the land cover as many methodologies have already been developed and most of them are suitable to be used within the proposed methodological approach to assess land use. If the assessment of the land use has to be realized through a multi-temporal approach and with the use of different RS data than a harmonized approach to assess land cover, such as the Land Cover Classification System, LCCS [
34], could facilitate the assessment of the land use.
The land use describes a function of the land, and all the possible functions (e.g., forest land, settlement, cropland, etc.) need a minimum area to be valid. Thus, to determine these land use functions, it is necessary to observe a portion of land so that the presence and the functional relationships among the key land elements may be assessed. The portion of land that should be observed may reflect the minimum mapping unit (mmu) of a land use category or it could be larger, additionally including the surroundings of the observed/sampling point.
With the suggested methodology, the assessment of the land use may follow two possible procedures: one which directly analyzes the spatial distribution and the relations between the key land elements, and another which analyzes the land cover distribution.
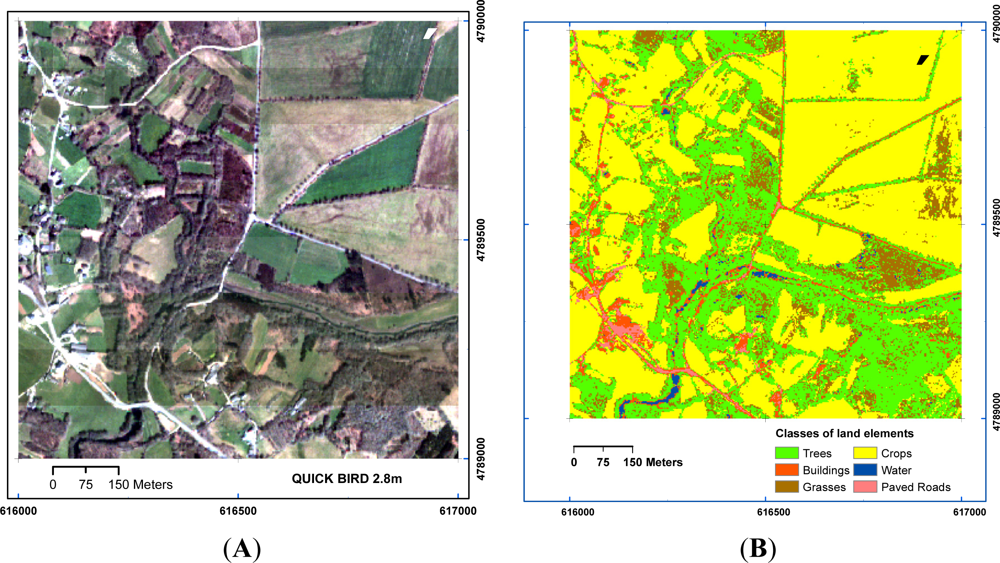
The first procedure requires RS data which allows the detection of the key land elements, e.g., orthophoto or very high resolution satellite images. Once the thematic product which reveals the position of all the key land elements is assessed (see
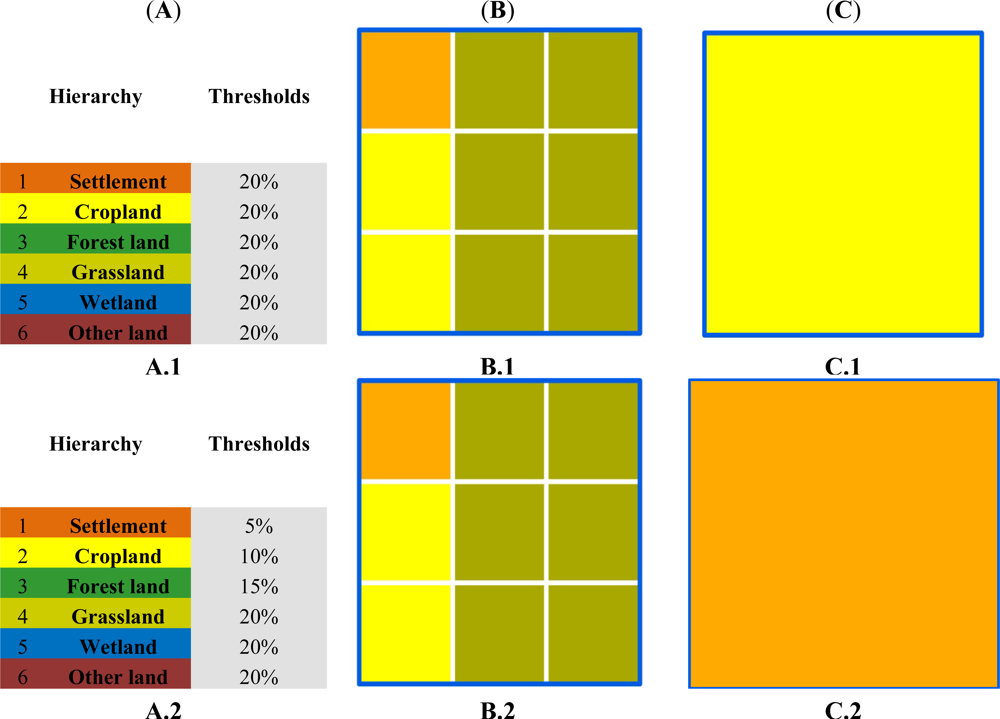
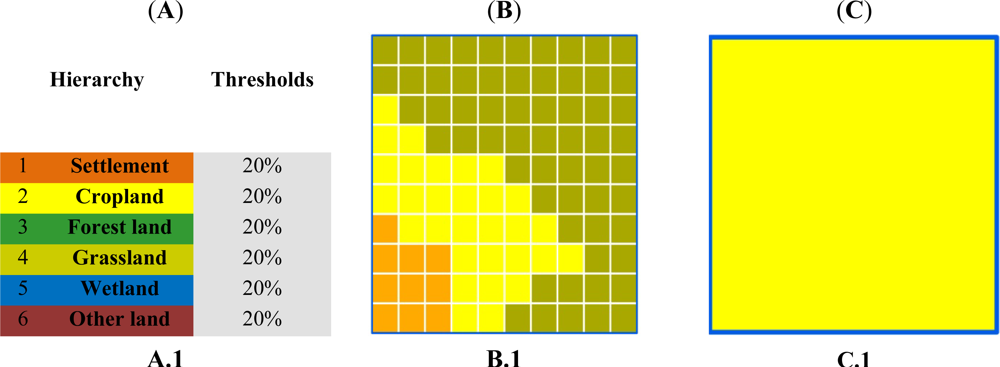
Figure 3), the analysis of the distribution and functional relationship between them will be undertaken through spatial rules that assess the land uses that are present and identification of the predominant one. These rules are project- or user-dependent (the functional relationship between the same key land elements may change, according to different socio-economic conditions and national circumstances) and they are critical in order to proceed with the land use assessment and mapping. The concept that underpins these rules is that the land use function of the land can be expressed through hierarchical relationships between the key land elements and these functional relations are based on thresholds reflecting the relevance and predominance of key land elements in the observed area. An example for these rules is a hierarchical sequence such as
settlement > cropland > forest land > grassland > wetland > other land, with a threshold of 20% for all of the land use categories to determine their predominance. In this specific case, if the minimum observed area shows that there is 10% settlement, 30% cropland, and 60% grassland, then the predominant land use of the observed area will be cropland, because the area occupied by the settlement land use category (the first one in the hierarchy) is less than the specified threshold (20%) (
Figure 4 A.1; B.1; C.1). In the same case, the use of a different hierarchy such as
grassland > cropland > settlement > forest land> wetland > other land, will produce a different result and the predominant land use of the observed area will be grassland (
Figure 4 A.2; B.2; C.2).
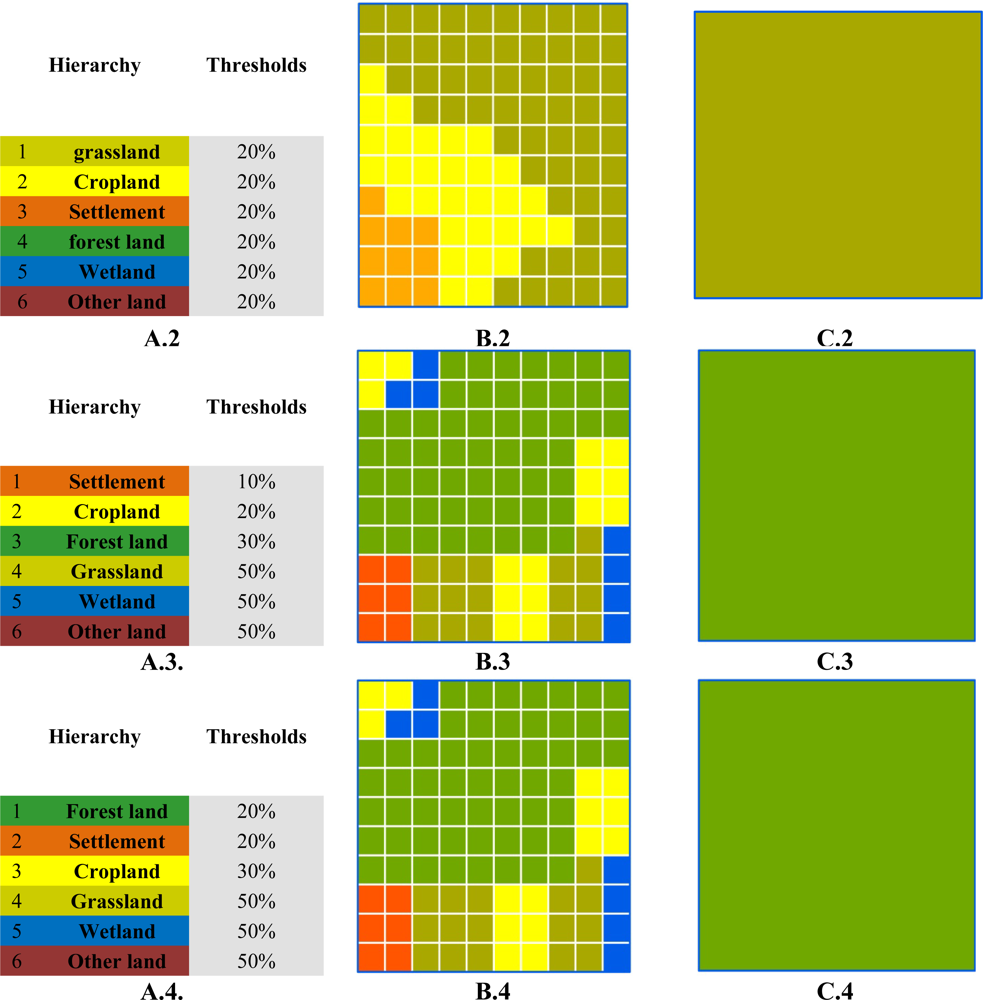
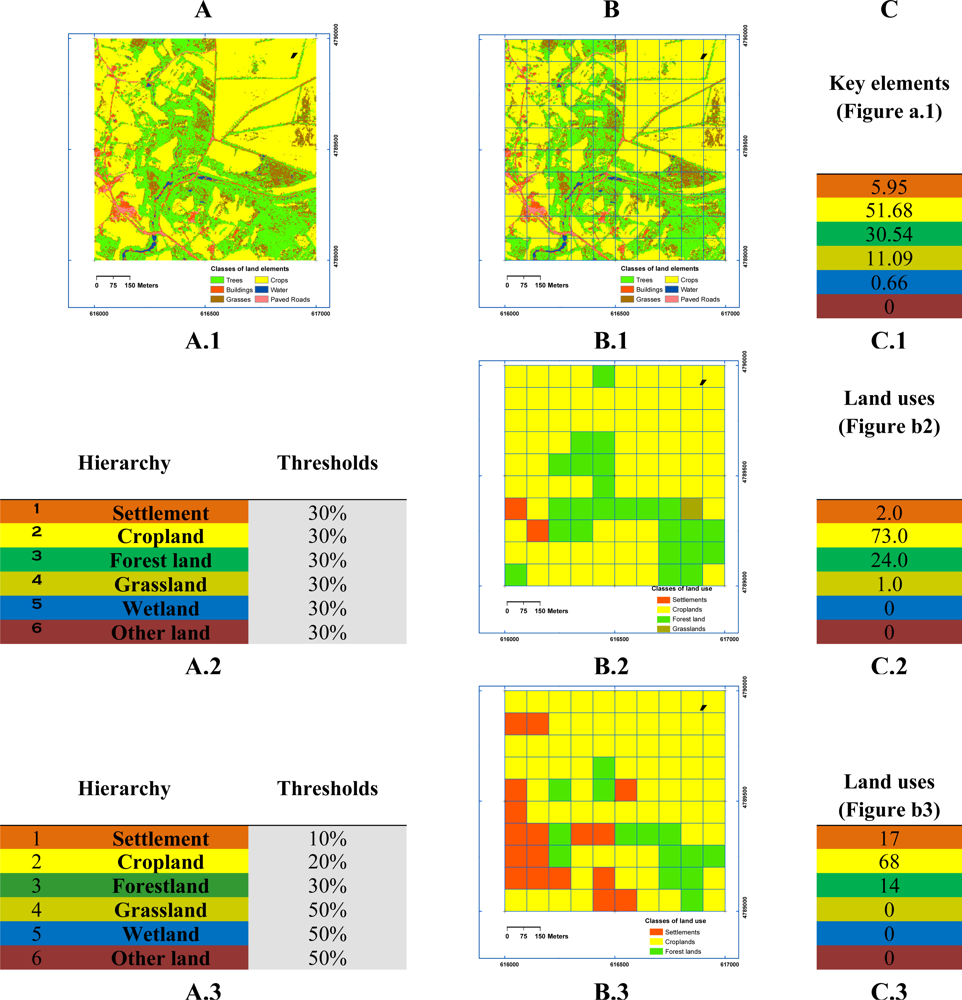
The second procedure should be used when RS data do not allow the detection of the single key land elements, e.g., Landsat data or coarser spatial resolution where the pixel dimension on the ground exceeds the dimension of the key land elements. In this case, the intermediate step is a pixel-based land cover layer (map) which is used as the best proxy to reflect the presence of key land elements. The spatial rules to assess the land use will be directly applied to the land cover information. The land cover information will be pixel-based and the land use rules will be applied through a matrix of pixels where the predominance will be assessed through thresholds (a 2 × 2 matrix will enable only thresholds which are multiples of 25%, while a 3 × 3 matrix will enable thresholds that are multiples of 11%). An example for this second procedure is a hierarchical sequence such as
settlement > cropland > forest land > grassland > wetland > other land, with a threshold of 20% for all the land use categories to reveal their relevance. In this specific case, if we analyze a 3 × 3 matrix (almost one hectare with Landsat ETM+ data) and there is one pixel classified as settlement, two pixels classified as cropland, and six pixels classified as grassland, then the predominant land use of the observed area will be cropland (
Figure 5 A.1; B.1; C.1). In the same example, if thresholds are modified and a threshold of 5% in settlement, 10% in croplands and 15% in forest land are decided, the predominant land use of the observed area will be settlement (
Figure 5 A.2; B.2; C.2).
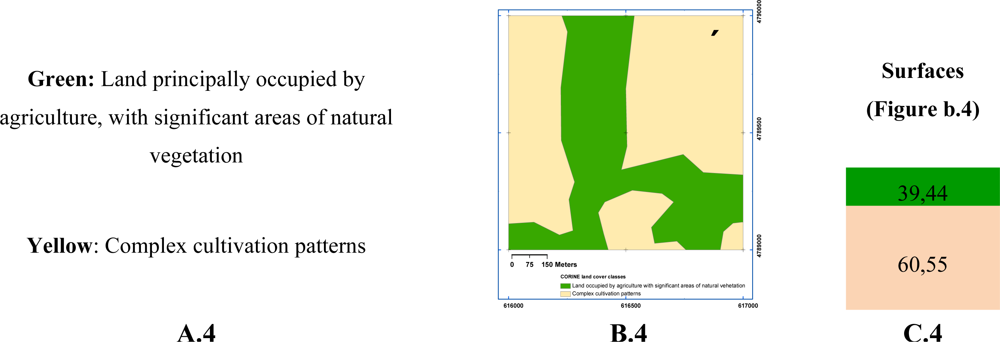
Figure 4 A.3 represents another example using a very high spatial resolution image with the hierarchical sequence
settlement > cropland > forest land > grassland > wetland > other land, but in this case with the thresholds being: 10% in settlements; 20% in croplands; 30% in forest lands; and 50% in grasslands and wetlands, to express their predominance. In this specific case, if in the minimum observed area (as an example, of 1 ha) there is 6% of settlement, 15% of cropland, 56% of forest land, 16% grassland, and 7% of wetland (
Figure 4 B.3), then the predominant land use of the observed area will be forest land (
Figure 4 C.3). While with the hierarchical sequence
forest land > settlement > cropland > grassland > wetland > other land, and the thresholds being: 20% in forest land; 20% in settlement and 30% in croplands, the predominant land use of the observed area will again be forest land (
Figure 4 A.4; B.4; C.4).
5. Results and Discussion
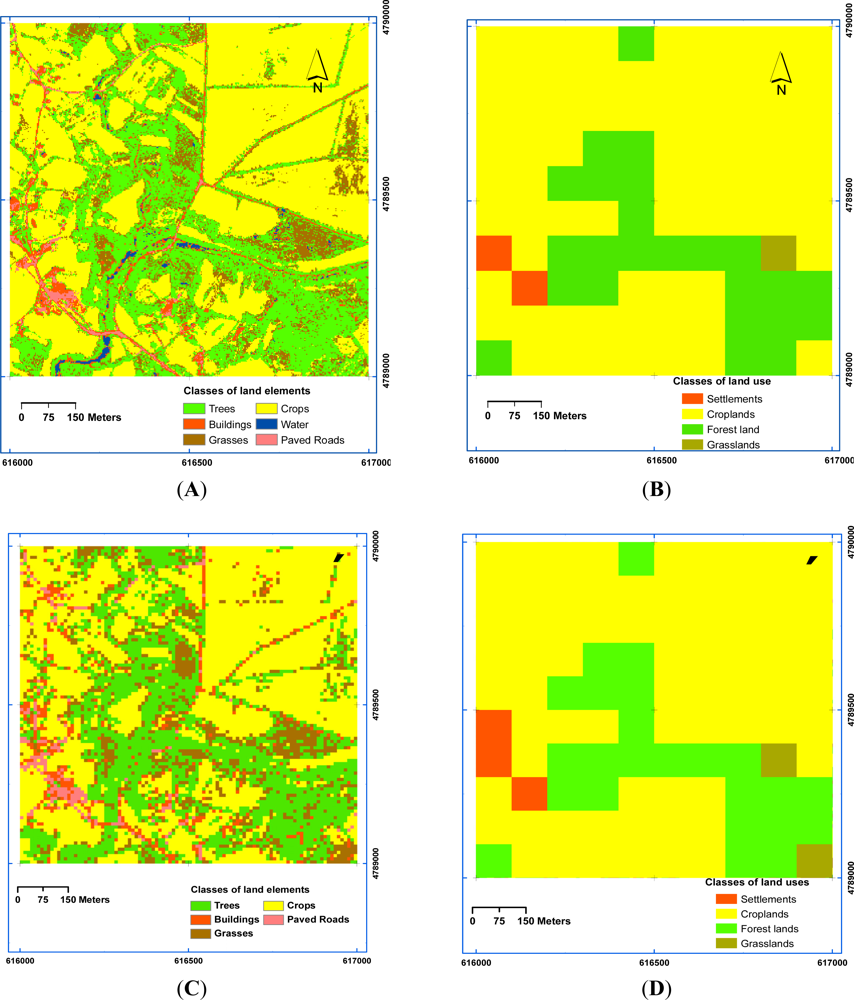
The next Figure (
Figure 6) shows the results obtained after applying the methodology, with different rules, on the same heterogeneous European landscape of Northwestern Spain. Using a very high spatial resolution image (QuickBird satellite with 2.8 m of spatial resolution), 1 km
2 of surface was analyzed and six classes of key land elements were identified by means of a maximum likelihood algorithm based on pixels (See
Figure 3), showing a global accuracy of 93.9% with a Kappa value of 0.883. A hierarchical sequence of
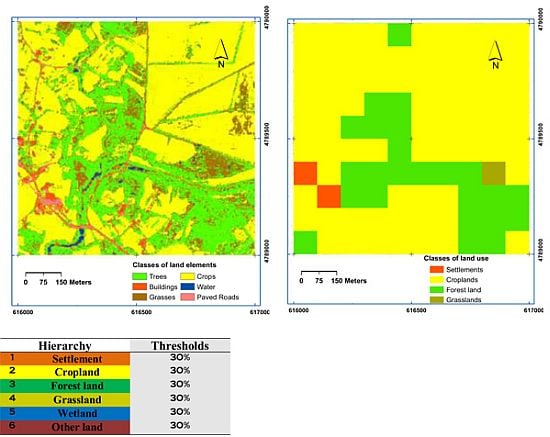
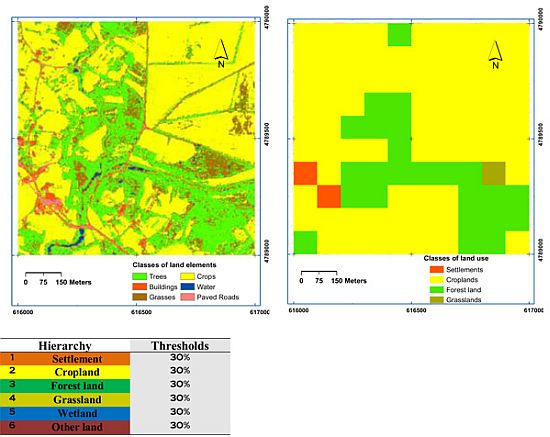
settlement > cropland > forest land > grassland > wetland > other land was then applied in both cases, but in the Study Case 1 (
Figure 6 A.2; B.2) a threshold of 30% was applied in all the land uses. In the Study Case 2 (
Figure 6 A.3; B.3) the thresholds applied were as follows: 10% in settlements; 20% in croplands; 30% in forest lands; and 50% in grasslands and wetlands, to express their predominance. Again, 1 ha was considered as the minimum observed area that was symbolized as a zonal grid of 1ha. Results of both tests show relevant differences in both the number and type of land use classes identified as the proportion of the different land uses, reflecting the expression of different possibilities in the land use functions of the land (
Figure 6 C.2; C.3).
The results presented in this paper demonstrated that different ways to represent land use are always possible, and in general there will never be an objective option. The most appropriate result will have to be assessed following the rules adopted to assess the land use function of the territory. These rules that support the results should be decided in light of local or national circumstances and socioeconomic functions and they will therefore be user dependent. As an example in this paper we have compared the results with the European CORINE Land Cover map 2000 (
http://www.eea.europa.eu/data-and-maps/data#c12=corine+land+cover+version+13). CORINE map is a well-known European cartography that partly applies a land use concept. In this study area, CORINE draws two categories of land use/cover: (a) Land principally occupied by agriculture, with significant areas of natural vegetation; and (b) Complex cultivation patterns. It allows us to visually represent the hierarchy and thresholds applied in Case 1 that best reflect the land use function (
Figure 6 B.4; C.4), showing an overall accuracy of 82.0% with a Kappa value of 0.460 in Case 1 and an overall accuracy of 80.0% with a Kappa value of 0.339 in Case 2 (it is important to note that the relevance of the correspondence with CORINE is, in this example, only relative).
As reported above, this paper does not discuss the method to assess land cover, as many methodologies are suitable for use within the proposed methodological approach to assess land use. Moreover, this methodology could be applied with any optical, RADAR or LIDAR RS data. The only limitation that concerns this approach is the data suitability in the recognition of the land elements and the consequent accuracy of the land cover representation.
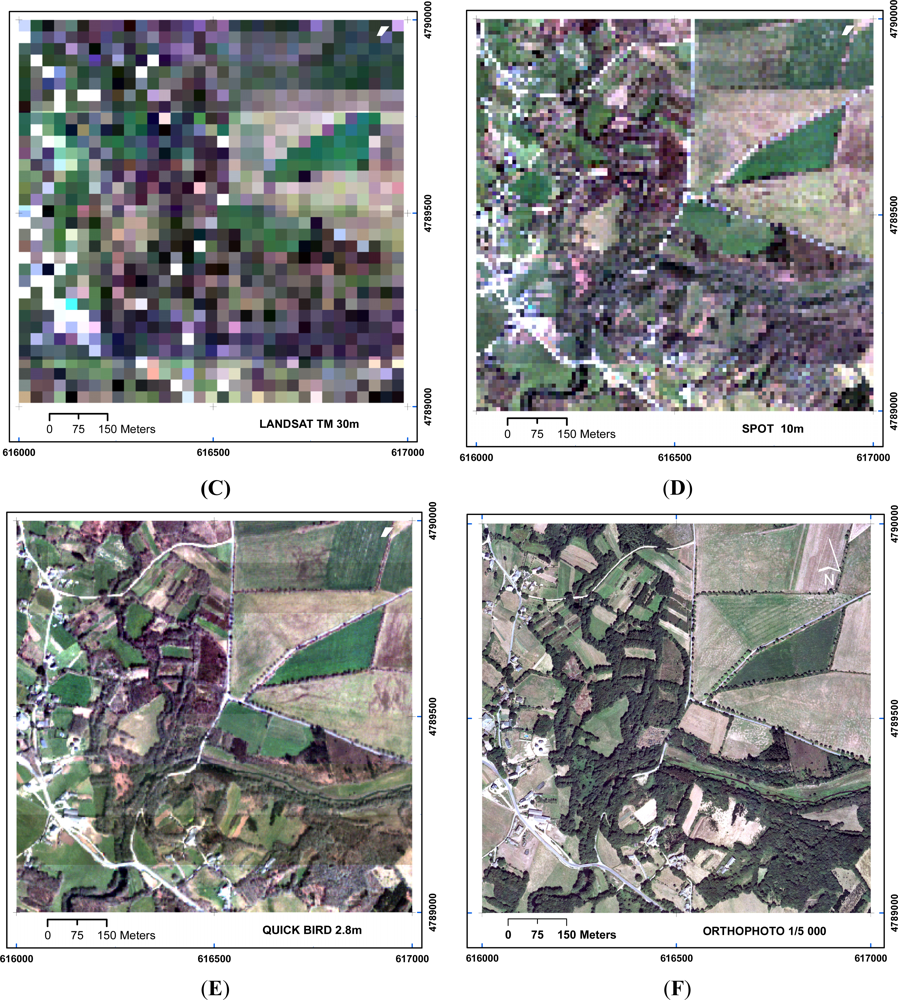
Figure 7 shows the influence of spatial resolution on the number and categories of land elements/covers identified, and finally on the recognized land uses on a real European landscape (NW Spain). Images with different spatial resolutions were used (2,8 m; 10 m; 30 m; 60 m; and 250 m) in an area of 1 km
2, and key land elements or covers were identified by means of a maximum likelihood algorithm based on pixels. Global accuracies and Kappa values of the different classifications are shown in
Table 3, as well as the number and categories recognized. The number of identified land use categories decreases as spatial resolution decreases. But high spatial resolution (like Landsat with 30 m) shows good overall accuracy (87.0%) and results (in terms of the number and type of land use categories identified).In some cases, Landsat class data might be considered the optimal data source, as they provide a good balance between adequate spectral, spatial and temporal resolutions.
The methodology presented in this paper may facilitate a consistent land uses representation over time. The wide availability of RS data and the capacity of the methodology to change/adapt the rules for the data analysis will allow countries to adopt it and more easily provide land use and land use change data in the context of UNFCCC. The cases presented in this paper demonstrate that it is possible to obtain an appropriate representation of the land uses when Landsat class data or data with higher spatial resolution are available. This opens the way for a good prospect for an appropriate and consistent representation of land use through RS as a new generation of high resolution class satellites are going to be available soon (Sentinel-ESA,
http://www.esa.int/esaLP/SEM3ZT4KXMF_LPgmes_0.html; Landsat-8 USA,
http://landsat.gsfc.nasa.gov/; CBERS-3 Brazil-China,
http://www.cbers.inpe.br/index.php). When data allow the application of the two methodological approaches, with or without the preliminary land cover assessment, the result is not in large differences in the land use representation, and both could represent an appropriate solution. Users will have to select the approaches that, following their specific land use hierarchal rules, will generate a more appropriate representation of the land use functions of the territory.


