Article

A New Algorithm for the Satellite-Based Retrieval of Solar Surface Irradiance in Spectral Bands

1
Deutscher Wetterdienst, Frankfurter Str. 135, D-60387 Offenbach, Germany
2
EHF Laboratory, Department of Physics, Universtiy of Oldenburg, Carl v. Ossietzky Str. 9-11, D-26129 Oldenburg, Germany
*
Author to whom correspondence should be addressed.
Remote Sens. 2012, 4(3), 622-647; https://doi.org/10.3390/rs4030622
Submission received: 27 January 2012 / Revised: 24 February 2012 / Accepted: 25 February 2012 / Published: 2 March 2012

Abstract

:
Accurate solar surface irradiance data is a prerequisite for an efficient planning and operation of solar energy systems. Further, it is essential for climate monitoring and analysis. Recently, the demand on information about spectrally resolved solar surface irradiance has grown. As surface measurements are rare, satellite derived information with high accuracy might fill this gap. This paper describes a new approach for the retrieval of spectrally resolved solar surface irradiance from satellite data. The method combines a eigenvector-hybrid look-up table approach for the clear sky case with satellite derived cloud transmission (Heliosat method). The eigenvector LUT approach is already used to retrieve the broadband solar surface irradiance of data sets provided by the Climate Monitoring Satellite Application Facility (CM-SAF). This paper describes the extension of this approach to wavelength bands and the combination with spectrally resolved cloud transmission values derived with radiative transfer corrections of the broadband cloud transmission. Thus, the new approach is based on radiative transfer modeling and enables the use of extended information about the atmospheric state, among others, to resolve the effect of water vapor and ozone absorption bands. The method is validated with spectrally resolved measurements from two sites in Europe and by comparison with radiative transfer calculations. The validation results demonstrate the ability of the method to retrieve accurate spectrally resolved irradiance from satellites. The accuracy is in the range of the uncertainty of surface measurements, with exception of the UV and NIR (≥ 1200 nm) part of the spectrum, where higher deviations occur.

1. Introduction

The surface solar irradiance (I) is defined as the incoming solar radiation at the surface in the 0.2–4.0 μm wavelength region. The solar surface irradiance retrieval reported in this paper is part of a suite of data sets derived within the Satellite Application Facility on Climate Monitoring (CM-SAF). The CM-SAF is part of the European Organization for the Exploitation of Meteorological Satellites (EUMETSAT) ground segment and part of the EUMETSAT network of Satellite Application Facilities [1]. It contributes to the operational long term monitoring of the climate system by providing Essential Climate Variables [2] related to the energy and water cycle of the atmosphere. These are currently cloud parameters, surface and top of atmosphere (TOA) radiation budget components and atmospheric water vapor [3] and [4].
Surface solar irradiance data with high resolution in space-time are necessary for a better understanding of climate variability, climate dynamics (extremes and the change of patterns in space-time) and for assessing the radiation balance of the climate system. Moreover, these data are well suitable for the verification of reanalysis data and regional climate models (e.g., [5]). Finally, solar irradiance is of importance for the satellite based estimation of drought and evaporation and the analysis of the hydrological cycle. Solar surface irradiance assessment from geostationary satellites constitutes a powerful alternative to meteorological ground network for climatological data [6] and is the primary source of observational data in regions where ground based measurements are rare. (e.g., over ocean and on the African continent).
In addition to the broadband surface solar irradiance, CM-SAF aims to retrieve spectrally resolved irradiance in high accuracy and a high resolution in space and time. This paper contains the description of the applied method, referred to as SPECMAGIC, as well as validation of the spectrally resolved irradiance and a discussion of the results.
Spectrally resolved irradiance provides additional and further information for the abovementioned climate analysis and monitoring issues. Further, spectrally resolved irradiance enables the calculation of photosynthetic active radiation. More over, it enables the calculation of daylight, which is of importance for the design and planning of office buildings and medicine studies, e.g., concerning Seasonal Affective Disorder.
A very important and growing area of application is the use of solar surface irradiance for the efficient utilization of solar energy systems. Accurate solar surface irradiance data is a prerequisite for an efficient planning and operation of solar energy systems. Recently, the demand of measurements of spectrally resolved solar surface irradiance has grown in view of the development of tandem and triple solar cells as well as thin film solar cells. Tandem and tridem cells cover a broader range of the spectra including the water vapor bands which increases the need for accurate spectrally resolved irradiance.
As ground measurements are rare, satellite derived information constitutes the primary data source for spectrally resolved irradiance within the scope of climate monitoring and solar energy applications. Satellite data allow the determination of the solar irradiance with a high spatio-temporal resolution and a large regional coverage (up to global) by combination of different satellites. Various algorithms have been developed to produce surface solar radiation data sets (e.g., [713]) covering different approaches.
In contrast to retrieval methods for the broadband irradiance, retrieval algorithms for the generation of long term series of spectrally resolved irradiance are very rare and satellite based long term data records of spectrally resolved surface irradiance are so far not available (at least to the knowledge of the authors). The algorithm described here is dedicated to generate such a long time series, covering at least 25 years based on Meteosat satellite data. The algorithm will be applied within the CM-SAF for the generation of spectrally resolved irradiance. As a result of its concept it aims to fulfill both aspects—it is fast enough to generate long time series and it is accurate enough to provide the data in climate quality. The objective of this manuscript is the description and validation of a new retrieval method for satellite-based spectrally resolved surface irradiance with emphasis on the visible and near-infrared (VIS/NIR) region of the spectrum.

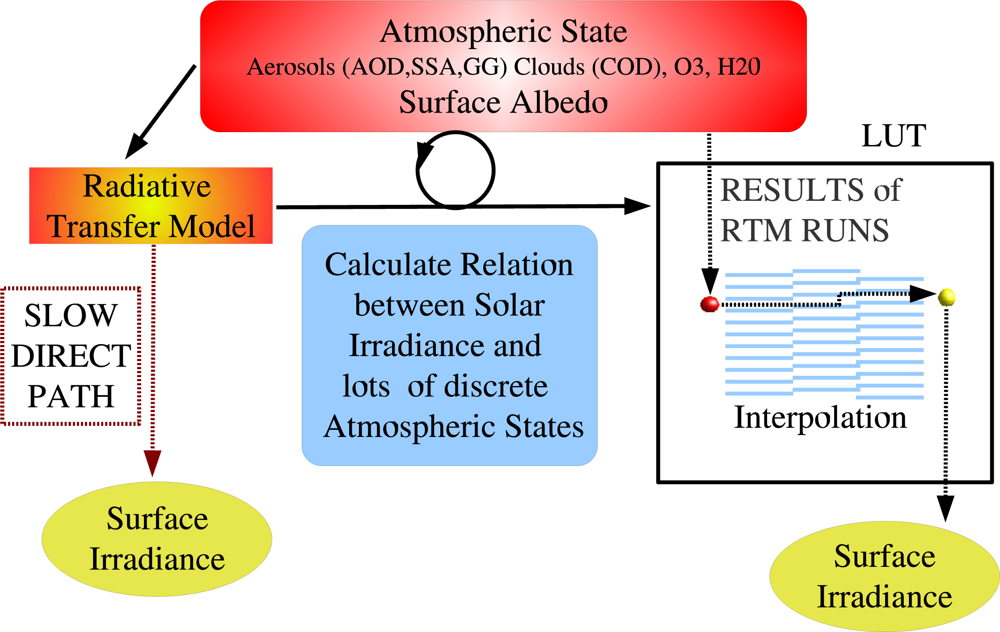
2. Outline of the Method for the Retrieval of Spectrally Resolved Irradiance

The main challenge of the development of algorithms for the satellite based retrieval of long time series of spectrally resolved irradiance is to fulfill two aspects which seem to be in contradiction. Firstly, the algorithm should be able to provide data records with a high accuracy. Secondly, the algorithm has to be fast in order to be able to generate a long time series with an appropriate spatial coverage. The second requirement prevents the operational use of radiative transfer models (RTM) as the processing of the enormous amounts of satellite pixels would take too much time. Moreover, radiative transfer models do not relate directly the observed satellite radiances to the spectrally resolved surface irradiance. For the reasons mentioned above, there has been a need for the development of a new approach for the satellite based retrieval of spectrally resolved solar irradiance. One concept applied within the new algorithm is the use of improved lookup tables.
A lookup table (LUT) is a data structure used to replace a runtime computation with a simpler interpolation operation within discrete pre-computed results, see Figure 1 as an illustration.
In our case pre-computed radiative transfer model (RTM) results contain the transmittance for a variety of atmospheric and surface states. Once the LUTs have been computed, the transmittance for a given atmospheric state can be extracted from the LUTs by interpolation for each satellite pixel and time. Finally, solar surface irradiance can be calculated from the transmittance by multiplication with the extraterrestrial incoming solar flux density.
The idea behind the LUT approach for an irradiance retrieval scheme is to achieve equal accuracy as with the direct usage of an RTM, but without the need to perform RTM calculations for each pixel and time, thus leading to an improved computing performance.
Atmospheric absorption and Rayleigh scattering are predominantly responsible for changes in the shape of the spectrum at the surface relative to the top of atmosphere. The effect of Mie scattering on the shape of the spectrum is in comparison with these processes rather weak.
This in turn suggests the separation of the effects of clouds, which is predominantly a Mie scattering effect, from the clear sky effect on spectrally resolved solar irradiance. The broadband cloud effect on the solar irradiance can be well defined with the effective cloud albedo derived with the established, accurate and fast Heliosat method (e.g., [14,15]). The spectral treatment of clouds is therefore reduced to the spectral correction of the broadband effective cloud albedo of the rather weak Mie scattering effect on the spectrum. For this correction a simple lookup table can be calculated with radiative transfer models that converts the broadband to the spectral cloud albedo, described in detail in Section 4.
The remaining issue is related to the estimation of the clear sky spectrum. For this issue the hybrid eigenvector LUT approach discussed in detail in Mueller et al. [13] is applied, this broadband method is referred to as MAGIC (Mesoscale Atmospheric Irradiance Code). This approach has been developed for the broadband irradiance but is extended to spectral bands utilizing its complete strength. This extension is discussed in this manuscript. The lookup tables needed to apply this approach [13] has been calculated with the radiative transfer model (RTM) libRadtran using the disort solver [16]. libRadtran [17]isa collection of C and Fortran functions and programs for calculation of solar and thermal radiation in the Earth’s atmosphere (A. Kylling and B. Mayer, http://www.libradtran.org). It has (also) been validated by comparison with other models [18] and radiation measurements [19].
libRadtran offers the possibility of using the correlated-k approach of Kato et al. [20]. The correlated-k method is developed to compute the spectral transmittance (hence the spectral fluxes) based on grouping of gaseous absorption coefficients. The main idea is to benefit from the fact that the same value of the absorption coefficient k is encountered many times over a given spectral interval. Thus, the computing time can be decreased by eliminating the redundancy, grouping the values of k, and performing the transmittance calculation only once for a given value of k. The Kato approach comes with 32 bands in the solar spectrum. The width of the bands depends on the distribution and structure of the absorption bands and ranges from about 20–30 nm in the UV/VIS up to hundreds of nanometers in the NIR.
libRadtran is very flexible with respect to the atmospheric input, e.g., different possibilities for the input of the aerosol information can be chosen by the user. The correlated-k option of libRadtran supports the adaptation of the broadband hybrid eigenvector LUT approach [13] for spectrally resolved irradiance.
It is important to mention that the basis for the clear sky part of the method described in Section 3 has been the broadband approach discussed in Mueller et al.[13]. This includes the combination of a basis LUT for the treatment of the aerosol effect and parameterizations of the absorption processes induced by ozone and water vapour, referred to as hybrid eigenvector approach in [13]. The equations used to consider the effect of water vapour, ozone and the diurnal cycle equals therefore the broadband equations described in [13].
The new items added by this publication is the extension of the broadband clear sky approach to Kato wavelength bands, including verification against radiative transfer results and measurements. This verification is an essential imperative as it can not be assumed a priori that the broadband equations and parameterizations works well for every Kato band. It is the first time that the eigenvector-hybrid approach has been exploited for the retrieval of the spectrally resolved irradiance. The equations and parameterizations applied are essential for the understanding of the described approach and are therefore discussed in Section 3, where the clear sky part of SPECMAGIC is presented in more detail.
In Mueller et al.[13] the broadband cloud effect on the irradiance is considered by a look-up table, whereas the treatment of clouds in the current scheme is based on the retrieval of the effective cloud albedo, discussed in more detail by Mueller et al. [21]. For the all sky spectrally resolved irradiance the treatment of the spectral effect of clouds is needed. For this purpose a new approach has been developed which is firstly described in this manuscript, please see Section 4.2 for further details. Also, the combination of this approach with the clear sky eigenvector LUT hybrid method is a new feature of the algorithm for the retrieval of spectrally resolved irradiance, referred to as SPECMAGIC. It is the first time that SPECMAGIC is described and validated with radiative transfer results and ground measurements.

3. Clear Sky Approach for the Retrieval of Spectrally Resolved Irradiance

The core and starting point of the hybrid eigenvector LUT approach has been an analysis of the principal components and dependencies of the interaction between the atmospheric variables, the surface albedo and the surface solar irradiance (transmittance) [13]. The analysis of the principal components allows to delete parameters with marginal effect on solar surface irradiance (<0.1%) within the retrieval. Relevant remaining processes for cloud free skies are scattering and absorption by aerosols, the absorption by water vapor (H2O) and ozone (O3), and the reflection by the Earth’s surface. Respective variables belonging to these processes are aerosol optical depth (aod), single scattering albedo (ssa) and asymmetry parameter (gg) of aerosols, the water vapor vertical column and the surface albedo. The analysis of the system’s interaction allows the selection of processes and variables which have to be considered within a basis LUT from those that can be parameterized by simple equations. Atmospheric variables that belong to radiation processes that are not dependent upon the amount/value of other atmospheric variables are not considered within the basis LUT. The basis LUT can be calculated for fixed values of the respective variables. Deviations of the variables from the fixed values can be corrected afterwards as their effect depends not on other variables. The effect of ozone or water vapor amounts, respectively, is pre-dominantly independent of aerosol properties. The effect of the surface albedo can be treated with a simple scaling. These findings are based on radiative transfer model studies [13]. Hence, no RTM calculations are saved in the basis LUT, but their effect is corrected by simple “correction” equations. Water vapor and ozone are pure absorber. The amount of absorption depends on the water vapor amount and the path length through the atmosphere, which is pre-dominantly independent of aerosol properties, amount of ozone and surface albedo.
The effect of aerosols is a mixture of scattering and absorption. The effect of aerosols on the atmospheric transmission can not be described by a single quantity, e.g., by the aerosol optical depth (aod), but more variables are needed. For example, for the same aod value different aerosol types, expressed by the single scattering albedo (ssa) and the the asymmetry parameter (gg), lead to significantly different values of solar surface irradiance. Hence, the effect of aod on the atmospheric transmission depends on the single scattering albedo or the asymmetry parameter (aerosol type) and visa versa.
The effect of aerosol scattering and absorption on spectrally resolved irradiance (denoted as IΛ) are considered within a 3-dimensional basis lookup table. IΛ is calculated for different values of aod, gg and ssa, and the results are saved in the LUT. The effect of water vapour (H2O), ozone (O3) and surface albedo (SAL) is corrected after interpolation to the given aerosol state, defined by aod, ssa and gg, has taken place. Hence, the overall approach to calculate the clear sky surface irradiance used in this paper, can be summarized as:
I Λ = ( I Λ ( aod , ssa , gg ) LUT + I Λ , H 2 Ocor + I Λ , O 3 cor ) * SAL Λ , cor
where, IΛ is the final spectrally resolved irradiance for cloud free skies, I Λ ( aod , ssa , gg ) LUT is the spectrally resolved irradiance for a given aerosol state derived from the basis LUT for fixed water vapour, ozone and surface albedo. IΛ,H2Ocor and IΛ,O3cor are the correction of deviations in water vapour and ozone from the fixed values used in the LUT, respectively. Finally SALΛ,cor is the scaling to the given surface albedo relative to 0.2, which has been used in all previous steps.
More details on the calculation of the basis LUT used to derive I Λ ( aod , ssa . gg ) LUT are given in Section 3.1. The applied corrections for water vapor and ozone deviations as well as for SAL are described in Sections 3.2 and 3.3, respectively.
The clear sky method is referred to be a hybrid “eigenvector” LUT approach and is discussed in more detail by Mueller et al. [13]. It reduces the amount of needed RTM calculation for the generation of the look-up tables and increases the computing performance. The Appendix provides a mathematical background for the decision whether a process is independent or not.

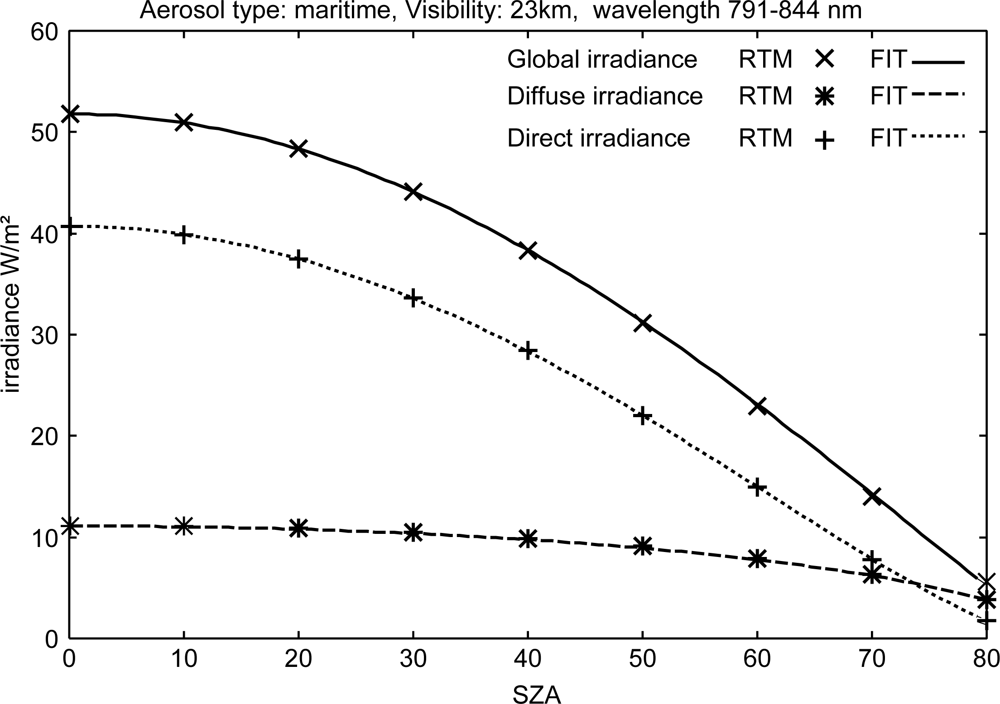
3.1. Basis LUT: Treatment of Aerosols

The basis clear sky LUT consists of spectrally resolved RTM results for aerosols with different values of aerosol optical depth (aod), single scattering albedo (ssa) and asymmetry parameter (gg). The basis LUT is dedicated to consider the effect of aerosol scattering and absorption. The absorption by water vapour and ozone as well as the surface reflection are predominantly independent from the aerosol state and fixed values have been used for the calculation of the basis LUT, i.e., a water vapor column of 15 mm, an ozone content of 345 DU, and a surface albedo of 0.2. The atmospheric values conform to the US standard atmosphere. The effect of the solar zenith angle on the transmission, hence the solar irradiance, is considered by the use of the Modified Lambert–Beer (MLB) function developed by Mueller et al.[22], which is given in Equation (2).
I Λ = I 0 , enh , Λ * exp ( τ 0 Λ cos a Λ ( θ z ) ) * cos ( θ z )
where τ is the optical depth of the vertical column, IΛ is the solar radiation at ground for a solar zenith angle (SZA) of θz and I0,enh,Λ is based on the extraterrestrial irradiance according to Equation (3) at wavelength (wavelengths band) Λ. The cosine of the solar zenith angle accounts for the decrease of the surface flux density due to the increase of the solar zenith angle (the same amounts of photons are distributed over a larger area for increasing solar zenith angles). This relation is identical to the Lambert–Beer function (or MLB function) with exception of an additional “empirical” correction exponent a, hence a correction of the parameter τ cos ( θ z ) [22]. The correction parameters aΛ are calculated based on two RTM runs, one at θz =0 and the other at θz =60°, hence the correction parameters aΛ can be calculated without the need for a numerical fit. I0,enh is based on the extraterrestrial irradiance at the top of atmosphere and estimated using Equation (3)[22].
I 0 , enh , Λ = ( 1 + I 0 Λ D Λ B Λ I Λ ) I 0 Λ
Here DΛ and BΛ are the diffuse and direct (beam) component of the solar surface irradiance IΛ = BΛ + DΛ at a SZA of zero. The application of this equation is needed in order to preserve a good match of the MLB relation with RTM results for high optical depths, where the use of the extraterrestrial irradiance I fails. It is important to notice that the Modified Lambert–Beer relation (Equation (2)) is also used for the calculation of the direct (beam) irradiance BΛ, with the exception that instead of using I0,enh,Λ the original extraterrestrial irradiance I must be used. The fitting parameters aΛ have different values for direct irradiance and (total) solar surface irradiance. Using the MLB function, the calculated direct irradiance, diffuse irradiance as well as the solar surface irradiance can be reproduced very well (see Figure 2 as an example). The MLB function is discussed in detail by Mueller et al.[22], including proof and verification. Further validations are given by Ineichen et al.[23].
The MLB parameters aΛ, I0,enh,Λ and τ are saved in the basis LUT for each wavelength band and different values of aerosol optical depth (aod), single scattering albedo (ssa) and asymmetry parameter (gg). The resulting basis LUT is three dimensional and contains the MLB-parameters to calculate Ibasis and Bbasis with Equation (2). The effect of aod is significantly larger than the effect of both ssa and gg, so the basis LUT contains MLB parameters for 23 aod values times three ssa values times two gg values (ssa ∈ {0.7, 0.85, 1.0} and gg ∈ {0.6, 0.78}). The spectral effect of aerosols is considered by application of a standard aerosol model [24,25].
The calculation of the solar irradiance is done as follows: for any given aerosol state the nearest neighbors are selected from the LUT and the solar irradiance is calculated for these nearest neighbors at any given solar zenith angle by application of the MLB relation. Subsequent interpolation between the nearest neighbors provides the solar irradiance for a given aerosol state, but only for fixed water vapor, surface albedo and ozone values. In order to correct for variations from the fixed values occurring in nature, the parameterizations described in Sections 3.2 and 3.3 are applied as consecutive steps.
The sensitivity of surface irradiance on atmospheric variables has been evaluated for all steps in order to reduce the mesh points of the needed RTM calculations as much as possible. Decision criteria for the mesh width has been the effect of the parameters on the atmospheric transmission in combination with its degree of non-linearity, e.g., for a parameter with large effect on the atmospheric transmission but a predominantly linear behavior the interpolation grid can be wide-meshed, while with increasing non-linearity the distance between the grid-points has to be decreased.

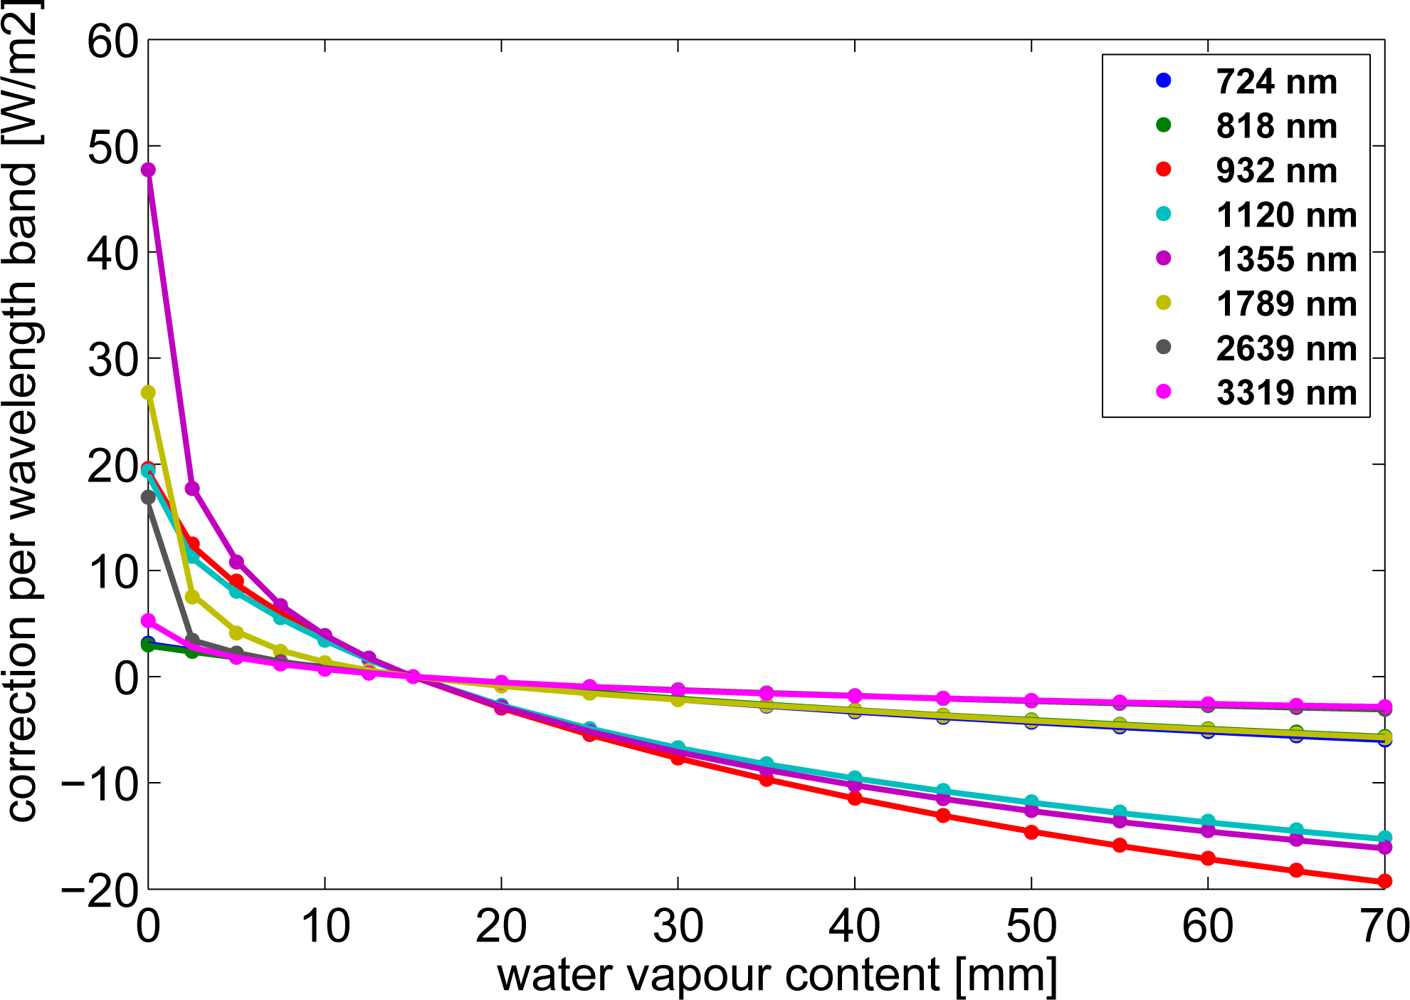
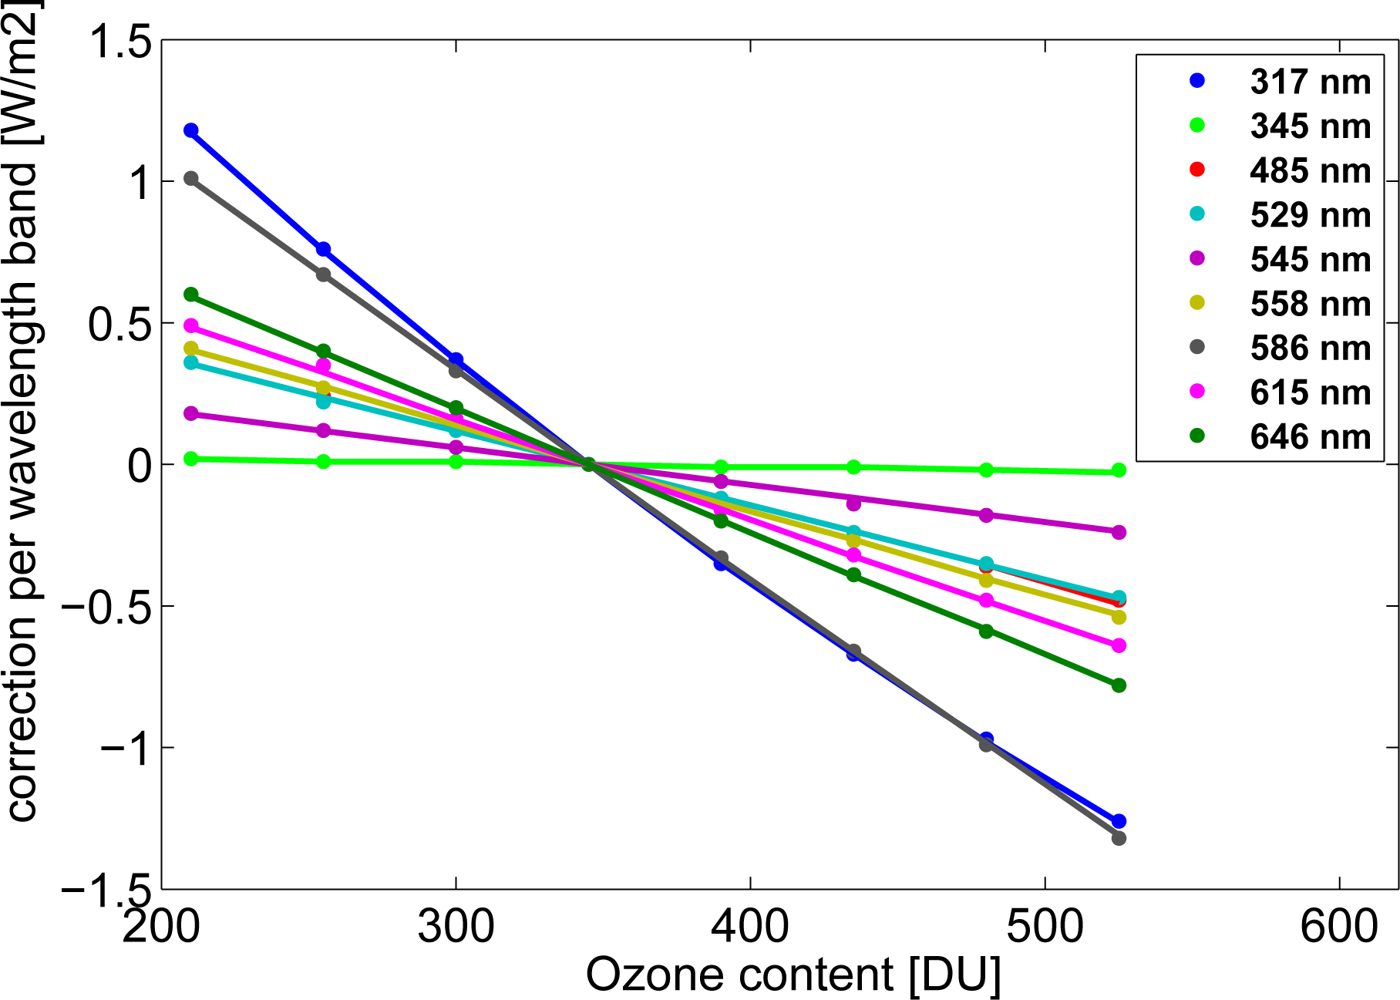
3.2. Treatment of Water Vapor and Ozone Variations

The results of radiative transfer modeling reveals that the effect of variations in water vapor and ozone is predominantly independent of the atmospheric state (in particular the aerosol state) [13]. Taking benefit of this feature the basis LUT has been calculated for a fixed value of water vapor (15 mm) and deviations relative to this value are corrected subsequently by application of Equation (4), which is based on the broadband correction applied in [13]. RTM runs for the clear-sky case have been performed, in order to derive the atmospheric transmissivity correction (Equation (4)) for water vapor variations relative to the fixed standard values used in the basis LUT.
I basis , Λ H 2 O = I basis , Λ + Δ I H 2 O , Λ cos b Λ θ z .
ΔIH2O,Λ is the difference between the irradiance I basis , Λ H 2 O for the real amount of water vapor and Ibasis,Λ resulting from interpolation within the basis “aerosol” LUT. ΔIH2O,Λ is calculated for the following set of input parameters (θz =0, a rural aerosol type with aod = 0.2, ssa = 0.94, gg = 0.75, 345 DU ozone, and SALΛ = 0.2). bΛ is a “fitting” parameter applied to match the solar zenith angle dependency of water vapour absorption.
ΔIH2O,Λ is pre-calculated for 18 water vapor columns, seven of them in the range of [0...15] mm and eleven within [20...75] mm. Respective values of ΔIH2O,Λ and bΛ are saved in an LUT for each wavelength band. The use of this LUT enables the calculation of the irradiance for the real water vapor values given for the specific pixel and time. Only 19 of the 32 Kato bands are influenced by water vapor absorption, consequently only for these the LUT contains non-zero values for ΔIH2O,Λ and bΛ. The parameter bΛ is limited by bΛ ⩽ 1.
The differences between explicit RTM runs and results derived using Equation (4) are in general quite small as visualized in Figure 3 for a sun zenith angle of 20° as an example.
For solar surface irradiance the deviations between radiative transfer results and the parameterization are negligible for the majority of cases. Only for extreme atmospheric conditions (high SZA, very high or low amount of water vapor), considerable deviations between explicit RTM runs and parameterization occur. The wavelength bands Λ ∈ {724 nm, 932 nm, 1,355 nm} are most sensitive to changes in water vapor content. For those, deviations in the irradiance are given in Table 1 for the worst case of 80° SZA and 70 mm water vapor content.
In a further independent step the same approach as in Equation (4) is used for ozone.
I basis , Λ H 2 O , O 3 = I basis , Λ H 2 O + Δ I O 3 , Λ cos c Λ θ z .
ΔIO3,Λ is the difference between the irradiance I basis , Λ H 2 O , O 3 for the real amount of ozone and I basis , Λ H 2 O derived for the fixed value of ozone. cΛ is a “fitting” parameter applied to match the solar zenith angle dependency of ozone absorption.
The effect of ozone on the broadband solar surface irradiance is quite small, therefore three pre-calculated ΔIO3 values are sufficient. In contrast, for spectrally resolved irradiance eight pre-calculated ΔIO3 values are needed (210 to 525 DU, in steps of 45 DU). The LUT for ΔIO3 and cΛ contains nonzero values for 13 of 32 Kato bands. For broadband irradiance the parameter cΛ < 1. This relation also holds for direct irradiance for most wavelength bands, but fails to generate reliable results for the ultraviolet range. Here, appropriate modifications of Equation (5) might resolve the problem.
Again small differences between explicit RTM runs and results derived using Equation (5) are observed, illustrated for a sun zenith angle of 20° for global irradiance in Figure 4. Nevertheless, for high SZA considerable deviations between explicit RTM runs and parameterization occur. For the wavelength bands Λ ∈ {317 nm, 586 nm, 646 nm} that are highly sensitive to changes in ozone content, deviations in the irradiance are given in Table 2 for the worst case of 80° SZA and 525 DU ozone content.

3.3. Treatment of Surface Albedo

RTM calculations for a variety of atmospheric states have shown that the effect of the surface albedo on the solar surface irradiance is predominantly independent of the atmospheric clear sky state.
The following formula was derived for broadband solar surface irradiance [13]:
I Λ = I basis , Λ H 2 O , O 3 * ( 0.98 + 0.1 S A L Λ )
I basis , Λ H 2 O , O 3 is the solar surface irradiance derived from the basis LUT for a surface albedo of 0.2 for all wavelength after Equations (4) and (5) have been applied. SALΛ is the variable surface albedo and IΛ is the solar irradiance after the surface albedo correction has been applied.
This formula was derived for broadband surface irradiance and albedo [13]. Nevertheless, within the spectral model, we assume that this formula can also be applied to spectral reflectance SALΛ. However, the applied equation simplifies the spectral effect of the surface albedo. Increased surface albedo will increase particularly short wavelengths because of the strongly wavelength-dependent backscattering by the atmosphere as discussed, e.g., by Lenoble et al.[26]. This effect is not accounted for by the applied equation.
As a database for spectral reflectance we use the spectral albedo functions assigned to each of 20 land-use types, originating from the NASA CERES/SARB Surface Properties Project ([27,28]). The land-use types are fixed throughout the year, hence variation of the surface albedo over the year are not considered. The spectral resolution of the derived surface albedo equals the grid of the correlated-k Fu/Liou parameterization in the range of 800–4,000 nm. Within the 290–800 nm range the surface-type dependent albedo files provided with libRadtran can be used, which have a significantly higher spectral resolution. These are not defined for the same land-use types, but for a smaller set of classes like lawn, grass, water and rye. To solve this problem we use a feasible linear combination of libRadtran spectral reflectances to estimate the reflectivity of the NASA CERES/SARB classes. The diurnal variation of the spectral surface albedo is determined as a function of solar zenith angle, as given by [29]. The scene dependent solar zenith adjustment factors needed for this function are also taken from the NASA CERES/SARB Surface Properties Project.

3.4. Sensitivity on Atmospheric Background Profiles

The atmospheric background profile provides the vertical information on the total number density needed for the calculation of the Rayleigh scattering. In addition, it provides the vertical profile of water vapor and ozone, which are scaled according to the column amounts. Yet, using different background profiles (e.g., mid-latitude summer, polar winter, ...) has predominantly no effect on the solar surface irradiance. Consequently, in the new approach all RTM calculations are only performed for the US standard atmosphere rather than for 5 atmospheric background profiles as before in the CM-SAF prototype.

3.5. Summary of Clear Sky Approach

The basis LUT is three dimensional and contains the MLB-parameters to calculate Ibasis and Bbasis with Equation (2). The irradiances are interpolated from this basis LUT for the respective aerosol state, expressed by specific values of aod, ssa and gg. The spectral effect of aerosols is considered by application of a standard aerosol model [24,25]. The effect of deviations in water vapor, ozone and surface albedo relative to the fixed values used in the calculation of the basis LUT are corrected by application of the parameterizations described in detail in Sections 3.2 and 3.3.
Figure 5 illustrates the new clear-sky scheme and the context and order of the parameterizations.
Due to optimizations of the interpolation grid and the application of the water and ozone correction as well as the surface albedo parameterization the amount of needed RTM calculations is enormously reduced, e.g., by a factor of 10,000 without losing accuracy. This is illustrated in Table 3.

4. All Sky Approach for the Retrieval of Spectrally Resolved Irradiance

4.1. Retrieval of Effective Cloud Albedo

The broadband cloud transmission is calculated from the effective cloud albedo derived with the Heliosat method ([14,15]). The effective cloud albedo is defined as the normalized difference between the all sky and clear sky reflection in the visible observed by the satellite. The deviation of the all sky reflection of the pixel from the clear sky reflection is a measure of the cloud effect on the Earth’s solar radiation budget. In order to derive the effective cloud albedo, different luminance conditions arising from variations in the observed reflections due the Sun-Earth distance and the solar zenith angle have to be corrected. Furthermore, the dark offset of the instrument has to be subtracted from the satellite image counts. The observed reflections are therefore normalized by application of Equation (7):
ρ = D D 0 f cos ( θ )
Here, D is the observed digital count including the dark offset of the satellite instrument. D0 is the dark offset, θ is the solar zenith angle and f corrects the variations in the Sun-Earth distance. The effective cloud albedo (CAL) is then derived from the observed normalized reflections by Equation (8):
CAL = ρ ρ cs ρ max ρ cs
Here, ρ is the observed reflection for each pixel and time. ρcs is the clear sky reflection, which is a monthly value derived for every pixel and time slot separately. This is essentially done by using the reflection of the pixel in a cloud free case. This is usually the relative minimum of the reflections during a certain time span (e.g., a month) derived for each pixel of the satellite image. Further details on the method to derive ρcs are given in [15]. ρmax is the “maximum” reflection. It is determined by the 95 percentile of all reflection values at local noon in a target region, characterized by high frequency of cloud occurrence for each month. Changes in the sensitivity of the satellite instrument would lead to a respective change in the 95 percentile. In this manner changes in the satellite brightness sensitivity are accounted for.
The wavelength dependency of the effective cloud albedo and hence the cloud transmission is accounted for in a second step (Section 4.2).

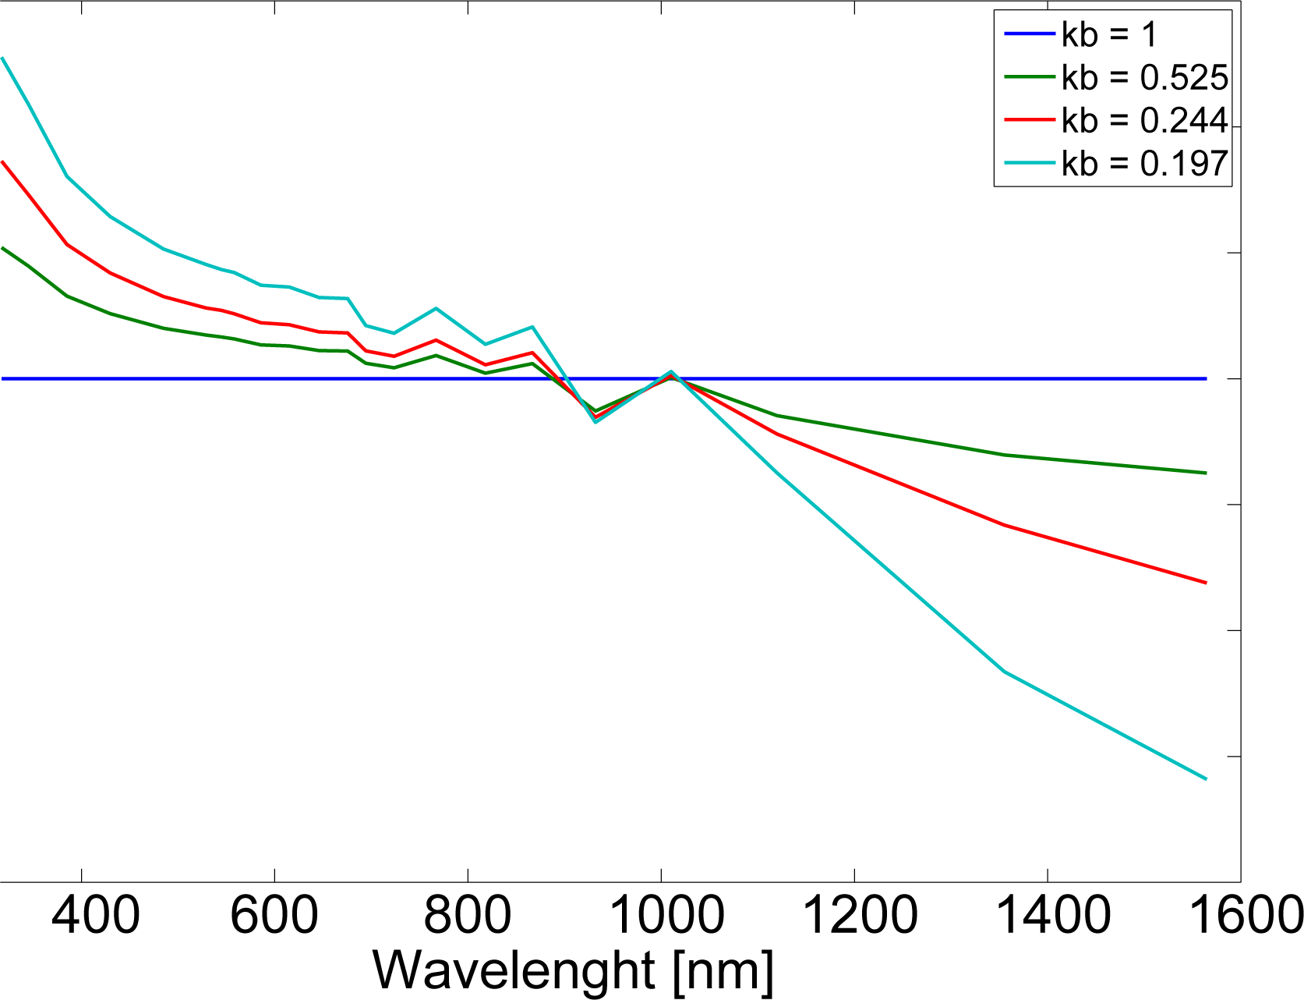
4.2. Spectral Correction of Cloud Effect

The broad band cloud transmission is equivalent to the clear sky index kbb defined as the ratio of solar surface irradiance I to clear sky irradiance Ics:
k b b = I / I cs .
This value is related to the effective cloud albedo given by the Heliosat relation (e.g., [14]or[15]) via:
k b b = { 1.2 for CAL 0.2 1 CAL for 0.2 < CAL 0.8 1.1661 1.781 CAL + 0.73 CAL 2 for 0.8 < CAL 1.05 0.09 for CAL > 1.05.
The occurrence of clouds results in a shift of clear sky spectrum from the red towards the blue range. Hence, a conversion from the broadband cloud transmission described by the clear sky index kbb to a wavelength dependent transmission kΛ is required. The clear sky state does not predominantly affect the spectral correction discussed hereafter. Hence the standard atmosphere of the basis LUT has been used for the derivation of the spectral correction.
For this, libRadtran RTM runs have been performed for the different wavelength bands and for the broadband with SAL and SZA set to zero and for cloud layers with cloud optical depth values of COD = 0, 10, 20, 40, 80 and 160. The corresponding wavelength dependent clear sky index values are gained through division of the resulting solar surface irradiance by the irradiance for COD = 0. Hence clear sky indices for all wavelength bands and the broadband are available after this step. The broadband clear sky index values for the different CODs are kbb = 1, 0.525, 0.244, 0.197, 0.102 and 0.050, respectively.
Conversion factors are calculated for each wavelength band with a radiative transfer model by Equation (11) in order to consider the spectral effect of clouds on the broadband transmission.
f Λ = k Λ RTM k b b RTM
Here, fΛ is the conversion factor, k Λ RTM and k b b RTM are the clear sky indices for the wavelength bands (denoted by Λ) and the broadband (denoted by bb) calculated with radiative transfer model (denoted by RT M)
The resulting conversion factors are shown in Figure 6.
The conversion factors are saved in a LUT and applied to correct the wavelength effect of clouds on the clear sky transmission for every satellite pixel and time by application of Equation (12):
k Λ = f Λ k bb sat .
and subsequently by application of Equation (13):
I Λ = k Λ I cs , Λ
here, kΛ is the derived all sky spectrally resolved clear sky index and k bb sat is the broadband clear sky index observed by satellite. IΛ is the all sky and Ics,Λ the clear sky spectrally resolved irradiance, respectively. Ics,Λ is derived with the clear sky method described in Section 3.
The surface reflection is already accounted for within the retrieval of the effective cloud albedo which motivates the setting of the surface albedo to zero. However, the effective cloud albedo is retrieved with a broadband visible channel, hence, the spectral dependency of multiple scattering between clouds and the surface is not accounted for within the applied spectral correction. Furthermore, the approach discussed in this manuscript simplifies the spectral dependency of clouds on the solar zenith angle. Radiation with shorter wavelengths in the visible-UV penetrate clouds more effectively than at longer wavelengths, and the difference increases with increasing solar zenith angle [30]. This effect is not accounted for by the discussed approach.

4.3. Used Input on the Atmospheric State

The information on the effective cloud albedo is derived with the Heliosat method, described in Section 4. This methods accounts also for the effect of surface reflection in cloudy situations by consideration of the observed clear sky reflection (see Section 4.1). The effective cloud albedo is retrieved in pixel resolution from the broadband visible channel of the Meteosat satellites. This means that CAL is available in 30 min resolution for Meteosat First Generation and in 15 minute resolution for Meteosat Second Generation (MSG). For this study CAL derived from MSG’s high resolution visible broadband channel has been used, hence a CAL value has been available every 15 min at a given location. Further information on MSG channels are given in [1]. The spectral effect of aerosols is considered by application of a standard aerosol model [24,25]. The irradiances are interpolated from this basis LUT for the respective aerosol state. For information about the aerosol state an aerosol climatology based on AEROCOM data [31] merged with ground based measurements from the AErosol RObotic NETwork (AERONET) [32] are used. It comes as a climatology of monthly means in 1 × 1 degree resolution. Alternatively aerosol information can be taken from the Global Aerosol Date Set (GADS/OPAC) [33] using relative humidity from the National Centers for Environmental Prediction (NCEP) [34] in order to consider the effect of relative humidity on aerosol optical depth, single scattering albedo and asymmetry parameter.
The water vapor profile results from the reanalysis of the European Centre for Medium-Range Weather Forecasts at a 0.25 × 0.25 degree grid [35,36]. Monthly values have been used. For ozone, climatologies based on the Total Ozone Mapping Spectrometer (TOMS) and the Ozone Measuring Instrument (OMI) are used [37].
The treatment of the surface reflection in clear sky situation has been discussed in Section 3.3. The surface albedo does not vary throughout the year but is based on long term annual means. Details are given in Section 3.3. This means that seasonal and year to year variations in snow cover are not considered. This induces uncertainties of about 2%–4% in regions with frequent variations in snow cover. Occasionally higher uncertainties might occur.

5. Irradiance on a Tilted Surface

Measurements of the whole spectrum covering Ultraviolet (UV), visible (VIS) and near infrared (NIR) are very rare. Within the development of the solar energy business there has been a need for measurement of the spectrum on tilted surfaces. As a result, available measurements covering the complete solar spectrum over a longer time period are usually performed on tilted planes. The validation of the spectrally resolved irradiance will be therefore performed by the use of ground measurements on tilted planes. Hence, a model for the transformation of the horizontal irradiance to the irradiance on tilted planes is needed. This in turn introduces on one hand an additional error source, but provides on the other hand a better measure of the SPECMAGIC method within solar energy applications.
It is current practice to model the broadband irradiance on a tilted surface Itilt as a composition of direct beam Btilt, sky diffuse Dtilt and ground-reflected radiation Ireflected (e.g., [38]):
I tilt = B tilt + D tilt + I reflected .
The direct and reflected components are easy to calculate:
B tilt = B cos δ cos θ z ,
I reflected = I 1 cos α 2 SAL ,
with the angle of incidence δ and the tilt angle α, where I and B are the irradiance and beam irradiance on a horizontal plane.
For the diffuse sky component models with different degrees of detail exist, preferably containing an isotropic, a circumsolar and a horizon brightening factor (see [39]):
D tilt = D ( 1 + cos α 2 ) ( 1 + sin 3 α 2 ) ( 1 + cos 2 δ sin 3 θ z ) .
here, D is the diffuse irradiance on a horizontal plane.
Klucher [38] introduced an anisotropic all-sky factor F into this type of model.
F = 1 ( D I ) 2
D tilt = D ( 1 + cos α 2 ) ( 1 + F sin 3 α 2 ) ( 1 + F cos 2 δ sin 3 θ z ) .
For overcast skies with F = 0 the model equals an isotropic distribution, for clear skies F → 1 Equation (17) is approximated.
The parameterizations given in Equations (15), (16) and (19) are used within this study to calculate the tilted irradiance Itilt for each wavelength band.

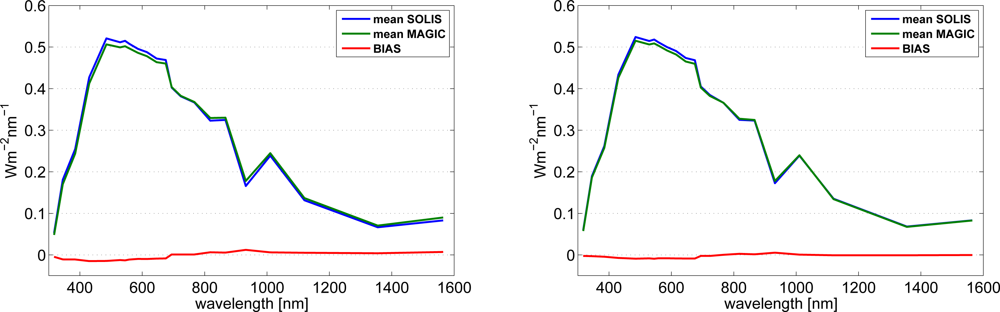
6. Validation of the Retrieved Spectral Solar Surface Irradiance

6.1. Measurements of the Solar Spectral Surface Irradiance

Two data sets of spectral measurements are used for the validation of the method. They cover one year and are specified in Table 4. Both data sets were quality checked by the institutes that carried out the measurements. Please note, that these measurements are performed on a tilted plane, because they are intended to be used within photovoltaic performance studies.
To make the datasets comparable they were averaged to hourly values. Moreover, they have been integrated to the spectral bands used in our approach. As the instruments are limited within the interval of 300 to 1,700 nm, we can perform this integration for the 20 Kato bands defined within the interval of 317–1,613 nm. Both data sets have been used in a preceding study in a comparison with SOLIS (SOLar Irradiance Scheme) [22].

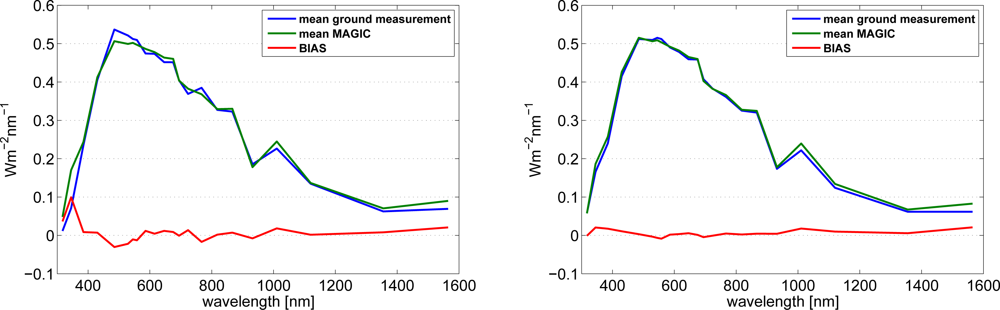
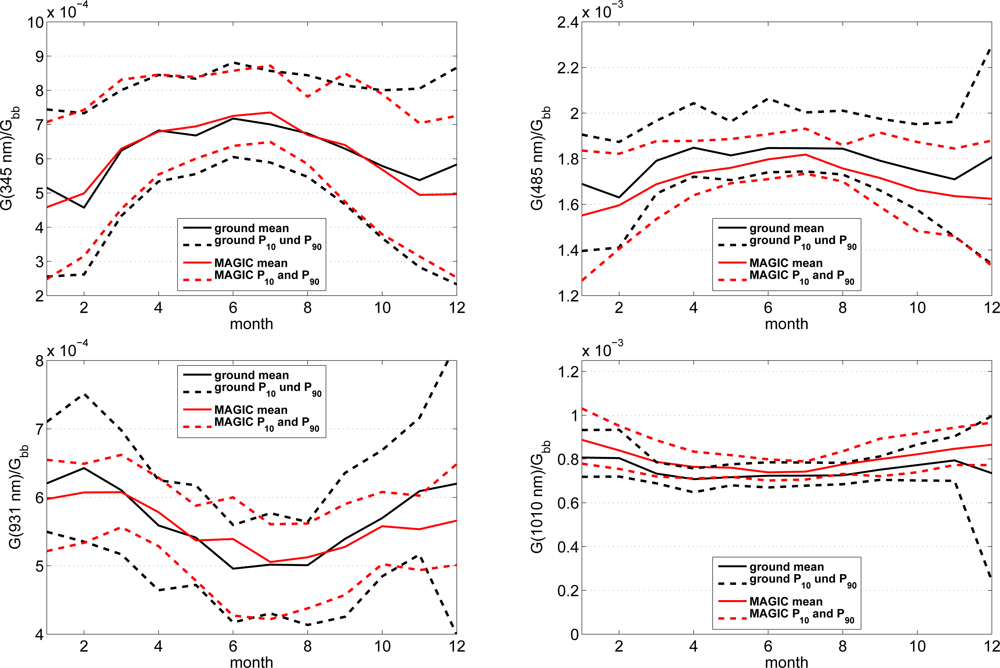
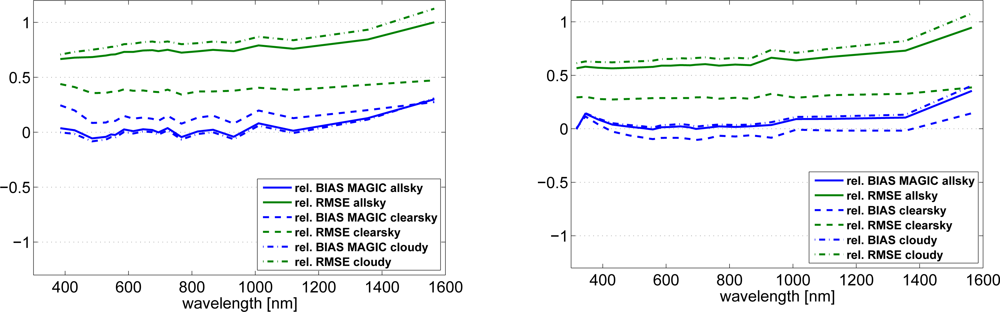
6.2. Validation Results

Different aspects were used for validation of the data retrieved with SPECMAGIC.
First, the retrieved annual averages of IΛ have been compared with measurements for each wavelength band for cloud free skies. Cloud free cases are classified by the ratio between diffuse and global irradiance, for a ratio below 0.3 clear sky cases are assumed. The applied error measures, Root Mean Square Deviation (RMSE) and Bias, are based on comparison of hourly values and are defined in the Appendix. Please note that the comparison on hourly basis leads to high values of the root mean square deviations. Therefore, the absolute and relative bias values are the main quantities applied for the evaluation of the ability of the method to provide accurate spectral resolved irradiance. The resulting spectra are given for both sites together with the bias in Figure 7.
In general a good agreement between the retrieved and the measured spectrum is apparent. The retrieved annual spectrum is in better agreement with Stuttgart measurements. This is also depicted in the bias. The bias is closer to zero at Stuttgart than at Loughborough. The good match in the UV at the Stuttgart site in contrast to the mismatch at the Loughborough site might be a result of an outdated calibration of the instrument in the UV where aging and blurring of optical devices happens much faster. The bias shows no striking spectral feature or trend between 400 and 1400 nm. Secondly, SPECMAGIC has been compared with SOLIS) [22] for cloud-free skies. SOLIS follows a concept of integrated radiative transfer runs, but takes benefit of the modified Lambert–Beer relation in order to improve the computing performance. The use of identical atmospheric input for SOLIS and SPECMAGIC avoids the occurrence of differences in the comparison that are induced by uncertainties in the atmospheric input. As the MLB approach is applied in both schemes also uncertainties induced by this approach are avoided. Hence, the comparison results provide information about the accuracy of the applied hybrid eigenvector approach and parameterizations for water vapor, ozone and surface albedo corrections relative to explicit radiative transfer modeling for typical atmospheric conditions.
Figure 8 shows the comparison results. It is observed that the SPECMAGIC annual spectrum is in good agreement with the SOLIS annual spectrum. However, the bias indicates a slight tendency of SPECMAGIC to underestimate the SOLIS results for wavelength bands with Λ < 700 nm and to overestimate the SOLIS results for wavelength bands with Λ > 700 nm.
The relative bias and root mean square deviation (RMSE) resulting from the comparison of SPECMAGIC with the ground measurements are illustrated for both sites in Figure 9.
In order to investigate differences in the spectral features between cloudy and cloud free situations, the respective statistical quantities are diagrammed separately in addition. It can be seen that the relative RMSE is dominated by the cloudy situations, and it is significantly reduced for clear sky situations. A striking feature is the large all sky relative bias above 1,300 nm. For clear sky irradiance an significant increase in the relative bias is also apparent, which indicates that the clear sky model might be a main driver. However, the results indicate that also the spectral cloud correction contributes significantly to the bias. Further analysis is needed before final conclusions can be drawn, especially as systematic measurement errors can not be excluded a priori, but have to be seriously taken into account. Below 1,200 nm the retrieval shows a good performance. This indicates that the applied spectral correction of clouds works well here.
The final analysis concentrates on four wavelength bands. We use an ozone absorption band centered around 345 nm (328–363 nm). A second band is chosen in the visible range (center 485 nm, 452–517 nm). The third band is a water vapor absorption band (center 931 nm, 889–975 nm). The following band is a near infrared band that is not affected by water vapor absorption (center 1,010 nm, 975–1,046 nm). For these four bands the yearly course is given for both sites in Figures 10 and 11. The irradiance values at the specified bands are normalized with the broadband irradiances to concentrate the analysis on purely spectral effects. The monthly averages as well as the 10th and 90th percentile of normalized irradiance are given in these figures.
A first inspection of the SPECMAGIC retrievals shows that the annual cycle of the four chosen bands are similar for both sites. In summer the UV and VIS bands have a higher share in the broadband irradiance than in wintertime. The opposite is apparent for the water vapour and NIR bands. However, a remarkable misfit between SPECMAGIC and ground measurements occurs at Loughborough for the UV band. Here, the ground measurements shows only a slight annual cycle, which seems to be unlikely. The more pronounced annual cycle given by SPECMAGIC seems to be more realistic. The good match of the annual cycle at Stuttgart supports this hypothesis. This is another hint for an outdated or misaligned calibration in the UV at Loughborough, which has been already indicated by the comparison of the annual averages (see Figure 7). The difference of the WV absorption band at Loughborough needs further investigation. The observations at Stuttgart show an overall good agreement with SPECMAGIC.

7. Discussion

The paper describes a unique method for the retrieval of long time series of spectrally resolved surface irradiance based on satellite data. This method will be used for the generation of a climate data record within the CM-SAF. The data will be processed and provided on user demand, which requires a fast and accurate method and inhibits the use of explicit RTM calculation and SOLIS [22]. The respective data will be available free of charge. The new method is based on radiative transfer modeling and enables the use of improved information on the atmospheric state. Several methods, especially those applied within the solar energy community, are still not able to utilize atmospheric aerosol and water vapour information (e.g., [14,40]), but use only turbidity in order to consider the clear sky attenuation. This might lead to reasonable results for either global or direct irradiance, but it is not possible to provide consistent set of the two parameters, see Mueller et al.[22] for further details. For the spectrally resolved irradiance the situation is even worse. The use of aerosol, ozone and water vapor instead of turbidity is a must for an accurate calculation of the spectrally resolved surface irradiance. Turbidity does not provide information about the amount of water vapor or ozone and it is therefore not possible to consider the effect of water vapor or ozone on the spectrum in an appropriate manner. SPECMAGIC overcomes this limitation.

8. Conclusions

The basis for the physical model and the retrieval of spectrally resolved irradiance has been the MAGIC broadband algorithm [13]. It is the first time that the eigenvector-hybrid LUT approach has been exploited for the retrieval of the spectrally resolved irradiance. The method is validated with spectral measurements of two sites in Europe for 22 spectral bands. The validation results demonstrate that the retrieval performs well. The accuracy is in the range of the uncertainty of surface measurements, which is about 5%, with exception of the UV and NIR (≥1,200 nm) part of the spectrum, where higher deviations occur. There is a need to investigate the differences in the UV spectra in more detail. However, it might be that at least parts of the differences are due to calibration issues as a consequence of aging (blurring) of the optical devices in the UV resulting from the photochemically very aggressive UV radiation.
The comparison with measurements on tilted planes shows also evidence for the ability of the method to provide spectral resolved irradiance on horizontal surfaces accurately. Spectrally resolved irradiance on horizontal surfaces is needed for climate monitoring and analysis, but for many application, e.g., for land surfaces, daylight applications and photosynthetic active radiation, irradiance on tilted planes is also of great importance. Beside these applications, the performed comparisons with measurements on tilted planes have demonstrated the ability of SPECMAGIC to provide accurate data also for solar energy applications.
The treatment of spectrally resolved cloud transmission by the discussed method might fail in bands with strong water/ice absorption (e.g., 1.6, 2.2 micron) as these effects are strongly dependent on cloud droplet size. Variations in droplet size are not explicitly considered by the applied method. Hence, the spectrally resolved irradiance in these spectral regions should be handled with care and might be unreliable.

Acknowledgments

This work is partly funded by EUMETSAT within the SAF framework. We thank the European tax payers, as the funding is originally given by them. The authors thank Thomas Betts from CREST, Loughborough, and Bastian Ziner from IPE Stuttgart, for providing the spectral ground measurement data.

References

  1. Schmetz, J.; Pili, Tjemkes, P.S.; Just, D.; Kerkmann, J.; Rota, S.; Ratier, A. An introduction to Meteosat Second Generation (MSG). Bull. Am. Met. Soc 2002, 83, 977–992. [Google Scholar]
  2. GCOS, The Second Report on the Adequacy of the Global Observing Systems for Climate in Support of the UNFCCC; Vol. Rep. GCOS-82; WMO: Geneva, Switzerland, 2003.
  3. Woick, H.; Dewitte, S.; Feijt, A.; Gratzki, A.; Hechler, P.; Hollmann, R.; Karlsson, K.G.; Laine, V.; Loewe, P.; Nitsche, H.; et al. The satellite application facility on climate monitoring. Adv. Space Res 2002, 30, 2405–2410. [Google Scholar]
  4. Schulz, J.; Albert, P.; Behr, H.; Caprion, D.; Deneke, H.; Dewitte, S.; Dürr, B.; Fuchs, P.; Gratzki, A.; Hechler, P.; et al. Operational climate monitoring from space: The EUMETSAT satellite application facility on climate monitoring (CM-SAF). Atmos. Chem. Phys. Discuss 2008, 8, 8517–8563. [Google Scholar]
  5. Babst, F.; Mueller, R.; Hollmann, R. Verification of NCEP reanalysis shortwave radiation with mesoscale remote sensing data. IEEE Geosci. Remote Sens. Lett 2008, 5, 34–37. [Google Scholar]
  6. Perez, R.; Renne, D.; Seals, R.; Zelenka, A. The strengths of satellite based solar resource assessment. In Production of Site/Time-Specific Irradiances from Satellite and Ground Data; Report 98-3. New York State Energy Research and Development Authority: Albany, NY, USA, 1998. [Google Scholar]
  7. Möser, W.; Raschke, E. Incident solar radiation over Europe estimated from METEOSAT data. J. Climate Appl. Meteor 1984, 23, 166–170. [Google Scholar]
  8. Cano, D.; Monget, J.; Albuisson, M.; Guillard, H.; Regas, N.; Wald, L. A method for the determination of the global solar radiation from meteorological satellite data. Solar Energy 1986, 37, 31–39. [Google Scholar]
  9. Bishop, J.K.B.; W.B.R. Spatial and temporal variability of global surface solar irradiance. J. Geophys. Res 1991, 96, 839–858. [Google Scholar]
  10. Pinker, R.; Laszlo, I. Modelling surface solar irradiance for satellite applications on a global scale. J. Appl. Meteor 1992, 31, 166–170. [Google Scholar]
  11. Darnell, W.; Staylor, W.; Gupta, S.; Ritchey, N.; Wilber, A. Seasonal variation of surface radiation budget derived from ISCCP-C1 data. J. Geophys. Res 1992, 97, 15741–15760. [Google Scholar]
  12. Rigolier, M.; Levefre, M.; Wald, L. The method Heliosat-2 for deriving shortwave solar radiation from satellite images. Solar Energy 2004, 77, 159–169. [Google Scholar]
  13. Mueller, R.; Matsoukas, C.; Gratzki, A.; Hollmann, R.; Behr, H. The CM-SAFoperational scheme for the satellite based retrieval of solar surface irradiance—A LUT based eigenvector hybrid approach. Remote Sens. Environ 2009, 113, 1012–1022. [Google Scholar]
  14. Hammer, A.; Heinemann, D.; Hoyer, C.; R., K.; Lorenz, E.; Mueller, R.; Beyer, H. Solar Energy Assessment Using Remote Sensing Technologies. Remote Sens. Environ 2003, 86, 423–432. [Google Scholar]
  15. Posselt, R.; Mueller, R.; Stöckli, R.; Trentmann, J. Spatial and temporal homogeneity of solar surface irradiance across satellite generations. Remote Sens 2011, 3, 1029–1046. [Google Scholar]
  16. Stammes, K.; Tsay, S.; Wiscombe, W.; Jayaweera, K. Numerically stable algorithm for discrete-ordinate-method radiative transfer in multiple scattering and emitting layered media. Appl. Opt 1988, 27, 2502–2509. [Google Scholar]
  17. Mayer, B.; Kylling, A. Technical note: The libRadtran software package for radiative transfer calculations—Description and examples of use. Atmos. Chem. Phys 2005, 5, 1855–1877. [Google Scholar]
  18. Koepke, P.; Bais, A.; Balis, D.; Buchwitz, M.; de Backer, H.; de Cabo, X.; Eckert, P.; Eriksen, P.; Gillotay, D.; Koskela, T.; Lapeta, V.; Litynska, Z.; Lorente, J.; Mayer, B.; Renauld, A.; Ruggaber, A.; Schauberger, G.; Seckmeyer, G.; Seifert, P.; Schmalwieser, A.; Schwander, H.; Vanicek, K.; Weber, M. Comparison of models used for UV index calculations. Photochem. Photobiol 1998, 67, 657–662. [Google Scholar]
  19. Mayer, B.; Seckmeyer, G.; Kylling, A. Systematic long-term comparison of spectral UV measurements and UVSPEC modeling results. J. Geophys. Res 1997, 102, 8755–8767. [Google Scholar]
  20. Kato, S.; Ackerman, T.; Mather, J.; Clothiaux, E. The k-distribution method and correlated-k approximation for a short-wave radiative transfer. J. Quant. Spectrosc. Radiat. Transfer 1999, 62. [Google Scholar]
  21. Mueller, R.; Trentmann, J.; Träger-Chatterjee, C.; Posselta, R.; Stöckli, R. The Role of the Effective Cloud Albedo for Climate Monitoring and Analysis. Remote Sens 2011, 3, 2305–2320. [Google Scholar]
  22. Mueller, R.; Dagestad, K.; Ineichen, P.; Schroedter-Homscheidt, M.; Cros, S.; Dumortier, D.; Kuhlemann, R.; Olseth, J.; Piernavieja, G.; Reise, C.; Wald, L.; Heinemann, D. Rethinking satellite based solar irradiance modelling. The SOLIS clear-sky module. Remote Sens. Environ 2004, 91, 160–174. [Google Scholar]
  23. Ineichen, P. Comparison of eight clear sky broadband models against 16 independent data banks. Solar Energy 2006, 80, 468–478. [Google Scholar]
  24. Shettle, P.; Fenn, R.W. Models of the Atmospheric Aerosols and Their Optical Properties. AGARD Conference Proceedings No. 183, Optical Propagation in the Atmosphere, Lyngby, Denmark; 1976. [Google Scholar]
  25. Shetlle, E. Models of Aerosols, Clouds and Precipitation for Atmospheric Propagation Studies. AGARD Conference Proceedings No. 454, Atmospheric Propagation in the UV, Visible, IR and MM-Wave Region and Related Systems Aspects, Copenhagen, Denmark, 9–13 October 1989.
  26. Lenoble, J. Modeling of the influence of snowreflectance on ultraviolet irradiance for cloudless sky. Appl. Opt 1998, 37, 2441–2447. [Google Scholar]
  27. Loveland, T.R.; Belward, A.S. The IGBP-DIS Global 1 km Land Cover Data Set, DISCover first results. Int. J. Remote Sens 1997, 18, 3289–3295. [Google Scholar]
  28. Brown, J.F.; Loveland, T.; Merchant, J.W.; Reed, B.C.; Ohlen, D.O. Using multi-source data in global land-cover characterization: concepts, requirements, and methods. Photogramm. Eng. Remote Sensing 1993, 59, 977–987. [Google Scholar]
  29. Dickinson, R.E. Land surface processes and climate—Surface albedos and energy balance. Adv. Geophys 1983, 25, 305–353. [Google Scholar]
  30. Lindfors, A.; Arola, A. On the wavelength-dependent attenuation of UV radiation by clouds. Geophys. Res. Lett 2008, 35, L05806. [Google Scholar]
  31. Kinne, S.; Schulz, M.; Textor, C.; Guibert, S.; Balkanski, Y.; Bauer, S.E.; Berntsen, T.; Berglen, T.F.; Boucher, O.; Chin, M.; et al. An AeroCom initial assessment—Optical properties in aerosol component modules of global models. Atmos. Chem. Phys 2006, 6, 1815–1834. [Google Scholar]
  32. Holben, B.N.; Eck, T.F.; Slutsker, I.; Tanré, D.; Buis, J.P.; Setzer, A.; Vermote, E.; Reagan, J.A.; Kaufman, Y.J.; Nakajima, T.; et al. AERONET—A federated instrument network and data archive for aerosol characterization. Remote Sens. Environ 1998, 66, 1–16. [Google Scholar]
  33. Hess, M.; Koepke, P.; Schult, I. Optical properties of aerosols and clouds: The software package OPAC. Bull. Amer. Meteor. Soc 1998, 79, 831–844. [Google Scholar]
  34. Kalnay, E.; Kanamitsu, M.; Kistler, R.; Collins, W.; Deaven, D.; Gandin, L.; Iredell, M.; Saha, S.; White, G.; Woollen, J.; et al. The NCEP/NCAR 40-year reanalysis project. Bull. Amer. Meteor. Soc 1996, 77, 437–471. [Google Scholar]
  35. Dee, D.P.; Uppala, S. Variational bias correction of satellite radiance data in the ERA-interim reanalyis. Q. J. Roy. Meteor. Soc 2009, 135, 1830–1841. [Google Scholar]
  36. Betts, A.K.; Ball, J.H.; Bosilovich, M.; Viterbo, P.; Zhang, Y.; Rossow, W.B. Intercomparison of water and energy budgets for five Mississippi subbasins between ECMWF re-analysis (ERA-40) and NASA Data Assimilation Office fvGCM for 1990–1999. J. Geophys. Res. 2003, 108. [Google Scholar] [CrossRef]
  37. Ziemke, J.R.; Chandra, S.; Labow, G.J.; Bhartia, P.K.; Froidevaux, L.; Witte, J.C. A global climatology of tropospheric and stratospheric ozone derived from Aura OMI and MLS measurements. Atmos. Chem. Phys 2011, 11, 9237–9251. [Google Scholar]
  38. Klucher, T. Evaluation of models to predict insolation on tilted surfaces. Solar Energy 1979, 23, 111–114. [Google Scholar]
  39. Temps, R.C.; Coulson, K.L. Solar Radiation Incident Upon Slopes of Different Orientations. Solar Energy 1977, 19, 179–184. [Google Scholar]
  40. Drews, A.; Beyer, H.; Rindelhardt, U. Quality of performance assessment of PV plants based on irradiance maps. Solar Energy 2008, 82, 1067–1075. [Google Scholar]

Appendix

Meaning of Eigenvector Approach

A process is called independent of other atmospheric processes if for a given deviation of an atmospheric variable (here water vapour for example) a unique scalar tH2O can be defined which fulfills the following equation.
RTM δ H 2 O I 0 = t H 2 O I 0
I0 is the extraterrestrial irradiance and RTMδH2O is an operator, describing the effect of deviations in water vapour on I0. For every RTMδH2O a unique tH2O exists which depends only on the amount of water vapour and on no other atmospheric variable. The value of t describes the atmospheric transmission. The atmospheric transmission of the operator RT MδH2O depends only on the amount of water vapour. tH2O can therefore by interpreted as eigen-value of the operator RT MδH2O and Io as “eigenvector”.
For aerosols this is not the case, because no eigenvalue exists. Hence,
RTM δ AOD I 0 t aod I 0
For equal δ AOD not a unique but different taod values exist, as t depends on the value of aod, ssa and gg. The transmission for a given aerosol optical depth depends also on the values for the single scattering albedo and the asymmetry parameter.
For the surface albedo, Equation (20) is also valid not for the extraterrestrial irradiance but the surface irradiance:
δ SAL I surf = t H 2 O I surf

Applied Error Measures

Bias: The bias (or mean error) is simply the mean difference between the two considered datasets. It indicates whether the dataset on average overestimates or underestimates the reference dataset (e.g., ground measurement denoted as o).
Bias = 1 n k = 1 n ( y k o k ) = y ¯ o ¯
Relative Bias: is the Bias divided by the absolute value of the reference.
Bias = y ¯ o ¯ o ¯
Standard deviation (SD): The standard deviation SD is a measure for the spread around the mean value of the distribution formed by the differences between the generated and the reference dataset.
SD = 1 n 1 k = 1 n ( ( y k o k ) ( y ¯ o ¯ ) ) 2
Root Mean Square Deviation: The root-mean-square deviation (RMSD) or root-mean-square error (RMSE) results from the bias and the standard deviation and is defined as follows. It measures beside the bias also the scatter of the data.
RMSE = BIAS 2 + SD
Relative Root Mean Square Error: is the RMSE divided by the absolute value of the reference data set.
RMSE = BIA S 2 + SD o ¯
Figure 1. The principle of an LUT approach. The relation of the transmission to a variety of atmospheric states is pre-calculated with a radiative transfer model (RTM) and saved in a look-up table (LUT). Based on the amount of considered atmospheric states the LUT table is large. Usually, 105 to 107 calculations are needed for a classical LUT approach if specific scientific optimizations are not applied. This figure has been previously published in [13].
Remotesensing 04 00622f1
Figure 2. Comparison between RTM calculations and fit using the Modified Lambert–Beer relation. Example for a fit of narrow-band spectral irradiance. Global irradiance is synonymous to solar irradiance at the surface. Direct irradiance is the direct portion (beam) of the solar surface irradiance. This figure has been previously published in [22].
Remotesensing 04 00622f2
Figure 3. Differences between I basis , Λ H 2 O and Ibasis,Λ estimated by explicit RTM calculations (dots) and by use of the correction formula (lines, Equation (4)) for eight Kato wavelength bands and the solar zenith angle of 20°.
Remotesensing 04 00622f3
Figure 4. Differences between I basis , Λ H 2 O , O 3 and I basis , Λ H 2 O estimated by explicit RTM calculations (dots) and by use of the correction formula (lines, Equation (5)) for nine Kato wavelength bands and the solar zenith angle of 20°.
Remotesensing 04 00622f4
Figure 5. Diagram of the new clear sky LUT. SZW is the solar zenith angle. NWP is Numerical Weather Prediction, I is the solar surface irradiance. This procedure is applied for each wavelength band. Figure has been previously published in [13].
Remotesensing 04 00622f5
Figure 6. Conversion from the broadband cloud transmission described by the clear sky index kbb to a wavelength dependent transmission k Λ = f Λ k bb sat. The corresponding conversion factor f is given for different cloud optical depths expressed by different broadband cloud transmissions kbb.
Remotesensing 04 00622f6
Figure 7. Average spectrum for Kato bands measured at Loughborough (left) and Stuttgart (right) in comparison with SPECMAGIC. The bias is given in addition.
Remotesensing 04 00622f7
Figure 8. Average spectrum for Kato bands retrieved with SPECMAGIC and with SOLIS for Loughborough (left) and Stuttgart (right). The bias is given in addition.
Remotesensing 04 00622f8
Figure 9. Relative bias and RMSE of SPECMAGIC retrieval with respect to ground measurements performed at Loughborough (left) and Stuttgart (right) for all situations, clear sky and cloudy sky.
Remotesensing 04 00622f9
Figure 10. Annual course of normalized irradiance for four wavelength bands for Loughborough. Comparison of measured data and SPECMAGIC retrievals.
Remotesensing 04 00622f10
Figure 11. Annual course of normalized irradiance for four wavelength bands for Stuttgart. Comparison of measured data and SPECMAGIC retrievals.
Remotesensing 04 00622f11
Table 1. Comparison of irradiance calculated with either RTM or the parameterization given in Equation (4) for the worst case scenario of 80 degree SZA and 70 mm water vapour content. The deviations are therefore upper limits, which are only reached in extreme atmospheric conditions. Values are given for three water vapor bands for solar surface irradiance IΛ and direct irradiance BΛ.
Katoband Λ[nm]Width [nm]Deviation Relative to RTM [W/m2/band]Dito [W/m2/nm]
72438.2IΛ−0.74−0.019
93286.0IΛ−2.11−0.025
1,335321.8IΛ−0.73−0.0023
93286.0BΛ−1.93−0.022
Table 2. Comparison of irradiance calculated with either RTM or the parameterization given in Equation (5). Values are given for three ozone bands calculated with high SZA of 80° and extreme ozone content of 525DU for solar surface irradiance IΛ and direct irradiance BΛ.
Katoband Λ[nm]Width [nm]Deviation Relative to RTM [W/m2/band]Dito [W/m2/nm]
31720.9IΛ−0.19−0.0091
58638.4IΛ−0.20−0.0052
64641.7IΛ−0.09−0.0022
31720.9BΛ−0.028−0.0013
64641.7BΛ−0.12−0.0028
Table 3. Reduction of needed RTM runs, comparison of original prototype CM-SAF algorithm with the new algorithm. RIA: RTM based Impact Analysis, analysis of Principal Components and Symmetries. MLB: Modified Lambert–Beer Relation.
ParameterRTM Runs broadband prototypeRTM Runs broadband new conceptRTM Runs 32 spectral bands new conceptMethod
Background atmosphere511RIA
Aerosol AOD and type×10 × 8×10 × 3 × 2×23 × 3 × 2ssa and gg instead of 8 types
SZA×8×2×2MLB function
H2O, O3×10 × 5+10 +3+18 +8parameterization
SAL×8+0+0parameterization
Totel number1,280,000133302
Table 4. Description of the datasets used for this investigation.
DatasetLoughboroughStuttgart
Location52.77°N, −1.23°E48.75°N, 9.11°E
Provided byCREST, Loughborough UniversityIPE, Stuttgart University
PeriodSep 2003–Aug 20042008
ApparatusHoriba, custom buildStellarnet EPP 2000C UV-VIS, EPP 2000 NIR INGAS
Temporal resolution2 min scan, every 10 min1 min scan every min., delivered as 15 min average
Spectral resolution10 nm1 nm
Spectral range300 to 1,700 nm300 to 1,700 nm
Orientation20° EastSouth
Tilt52°33°
Completeness original data40%98%
Completeness hourly data35%97%

