How Robust Are Burn Severity Indices When Applied in a New Region? Evaluation of Alternate Field-Based and Remote-Sensing Methods

1
School of Forest Resources, College of the Environment, University of Washington, Box 352100, Seattle, WA 98195, USA
2
Pacific Wildland Fire Sciences Lab, USDA Forest Service, 400 N 34th Street, Suite 201, Seattle, WA 98103, USA
*
Author to whom correspondence should be addressed.
Remote Sens. 2012, 4(2), 456-483; https://doi.org/10.3390/rs4020456
Submission received: 10 January 2012
/
Revised: 1 February 2012
/
Accepted: 1 February 2012
/
Published: 9 February 2012
(This article belongs to the Special Issue Advances in Remote Sensing of Wildland Fires)
Abstract
:Remotely sensed indices of burn severity are now commonly used by researchers and land managers to assess fire effects, but their relationship to field-based assessments of burn severity has been evaluated only in a few ecosystems. This analysis illustrates two cases in which methodological refinements to field-based and remotely sensed indices of burn severity developed in one location did not show the same improvement when used in a new location. We evaluated three methods of assessing burn severity in the field: the Composite Burn Index (CBI)—a standardized method of assessing burn severity that combines ecologically significant variables related to burn severity into one numeric site index—and two modifications of the CBI that weight the plot CBI score by the percentage cover of each stratum. Unexpectedly, models using the CBI had higher R2 and better classification accuracy than models using the weighted versions of the CBI. We suggest that the weighted versions of the CBI have lower accuracies because weighting by percentage cover decreases the influence of the dominant tree stratum, which should have the strongest relationship to optically sensed reflectance, and increases the influence of the substrates strata, which should have the weakest relationship with optically sensed reflectance in forested ecosystems. Using a large data set of CBI plots (n = 251) from four fires and CBI scores derived from additional field-based assessments of burn severity (n = 388), we predicted two metrics of image-based burn severity, the Relative differenced Normalized Burn Ratio (RdNBR) and the differenced Normalized Burn Ratio (dNBR). Predictive models for RdNBR showed slightly better classification accuracy than for dNBR (overall accuracy = 62%, Kappa = 0.40, and overall accuracy = 59%, Kappa= 0.36, respectively), whereas dNBR had slightly better explanatory power, but strong differences were not apparent. RdNBR may provide little or no improvement over dNBR in systems where pre-fire reflectance is not highly variable, but may be more appropriate for comparing burn severity among regions.
Keywords:
fire ecology; fire severity; Landsat; change detection; dNBR; RdNBR; CBI; GeoCBI; Washington State; Cascade Range1. Introduction
The large size, inaccessibility, and spatial variability of wildland fires have caused multispectral satellite data to become a common tool for mapping fire locations and effects. Remotely sensed indices are commonly used to map burn severity of wildfires, but remotely sensed indices are more meaningful when they can be linked with field-based assessments of burn severity. We evaluate the applicability of methodological refinements to field-based and remotely sensed indices of burn severity developed in other locations, to a new location, the northern Cascade Range of Washington, USA. We compare two remotely sensed indices of burn severity; the differenced Normalized Burn Ratio (dNBR) and the Relative differenced Normalized Burn Ratio (RdNBR), a refinement of the dNBR which had stronger correlations with field-based assessments of burn severity and higher classification accuracy when evaluated in other regions [1,2].
We also compare three methods of measuring burn severity in the field: the Composite Burn Index, (CBI), which was specifically developed to validate and produce regionally-based classification schemes of remotely sensed burn severity data [3], and two variations of a methodical refinement of the CBI based on the Geometrically structure Composite Burn Index (GeoCBI), which has been used successfully in Spain and Portugal [4,5]. Regional empirical validation of burn severity indices is necessary because previous research has shown that the relationships between remotely sensed and field-based assessments vary among regions [6]. Regressions that predict remotely sensed burn-severity from field measurements can be used to classify the remotely sensed data into distinct severity classes [1,2]. Although some information is lost in the classification process, categorical images facilitate: (1) visual interpretation of images; (2) comparisons of multiple fires or fires from multiple regions; (3) analysis of the spatial context and spatial pattern of severity; (4) spatially explicit predictions of the impacts of the fire (i.e., soil erosion, water quality, succession, and carbon emissions); and (5) targeted management responses to those impacts.
In addition to providing a test of the transferability of new methods to a novel location, our results also provide an empirically derived classification scheme for two commonly used remotely sensed indices of burn severity. This classification scheme should be applicable to ecologically similar areas in the Cascade Range, from northern Oregon to southern British Columbia. No empirical validation of the relationship of the two burn severity indices with field data has been conducted in the Cascade Range of Washington and Oregon, although they have been conducted for many different vegetation types across North America [1,2,7–14]. In the northern Cascade Range, the benefits of using remote sensing to quantify the severity and spatial pattern of fires are particularly strong. Fire regimes are generally of mixed severity. Burn severity varies with fuel continuity, the fire tolerance of the vegetation, and variation in the post-fire response of the vegetation, and generally increases with elevation, although within individual fires there are spatially complex severity patterns [15]. Furthermore, remote sensing may be the only option in relatively inaccessible and rugged terrain of this region, which makes fieldwork difficult, dangerous, or even impossible [16]. Therefore, remotely sensed indices of burn severity greatly augment field studies in mixed-severity fire regimes like those of the northern Cascade Range by allowing the variation of the within-fire burn severity pattern to be quantified, and permitting differences in severity and spatial pattern of fires across the region to be assessed.
1.1. Remotely Sensed Burn-Severity Indices
Fire severity is the ecological effect of fire on soils and plants, and is of interest because it is often related to short-term and long-term changes in biogeochemical cycles and plant and animal community composition, structure, and function. Common measurements of fire severity quantify the consumption of organic materials, such as the loss of litter and duff, canopy fuel consumption (often measured by the height or percentage of scorch and char on trees), or twig diameter remaining on residual branches. Measurements may also include additional proxies for consumption, such as tree mortality and white ash deposition [17,18]. In forested ecosystems fire severity has often been classified solely by overstory tree mortality, while incorporating other variables secondarily. For example, Larson and Franklin [19] defined low, moderate, and high severity fire levels by 0–20%, 20.1–80%, and >80.1% basal area mortality. In the context of remote sensing “fire severity” usually refers to measurements made in the same season as the fire [17]. This study examines “burn severity”, not fire severity, using measurments made one year after the fire, and therefore includes aspects of fire severity described above, such as the consumption of organic materials and tree mortality, and aspects of ongoing ecosystem responses, such as delayed tree mortality, vegetation resprouting, and colonization of new propagules.
Remotely sensed measurements of burn severity aggregate fire effects at the spatial grain of the sensor; for dNBR and RdNBR burn severity measurements are aggregated at the spatial grain of a Landsat pixel, 30 m2. Both indices are based on the NBR, which was first proposed by López-Garcia and Caselles [20] to identify burned areas in Spain. The original formula for NBR was given by Key and Benson [3]. NBR is usually scaled by 1,000 and rounded to an integer; this scaling factor was subsequently integrated into the NBR equation (for example see [21]):
where R4 and R7 are the intensity of per-pixel surface spectral reflectance of Landsat bands 4 (0.76–0.90 μm, near-infrared) and 7 (2.08–2.35 μm, mid-infrared) [3,7]. Band 4 is sensitive to the cell structure of plants, which can be related to plant abundance and productivity. Band 7 is sensitive to the cellulose content and water content of the plants, and increases with greater cover of soil, ash, or carbon [7]. In forested systems Band 7 increases with higher burn severity [7] but may decrease with burn severity in grass dominated systems [22]. In forested systems recent burns have negative NBR values (R4 < R7) whereas unburned vegetated has strongly positive NBR values (R4 > R7).
The dNBR is based on the change over time from pre-fire NBR image to the post-fire NBR image:
Usually the dNBR is calculated using images from either the same season as the fire, or from one year before and after the fire. Increasingly positive values of dNBR indicate increasing burn severity [7].
In order to improve classification accuracy of the dNBR in mixed forest and shrubland in California, Miller and Thode [1] developed the Relative differenced Normalized Burn Ratio (RdNBR). The RdNBR normalizes the dNBR by the initial image reflectance to account for spatial variation in pre-fire leaf area index. In addition to normalizing the image by pre-fire reflectance, dNBR values are also normalized by subtracting the average dNBR value sampled from unburned areas outside the fire perimeter, in order to account for inter-annual variation in phenology [2]. This step is included explicitly in the equation below, as the dNBRoffset value, which is equal to the average dNBR value of sampled unburned vegetation (of a type that is similar to the vegetation that did burn). In theory, the dNBRoffset = 0 when the phenologies of the pre-fire and post-fire image are perfectly matched. This processing step was described in Miller and Thode [1], but was not explicitly included in the original RdNBR equation. It is included in the RdNBR equation below, which is the RdNBR equation recorded in the metadata for all RdNBR images processed by the national Monitoring Trends in Burn Severity Program (described below) (for example of formula see [21]).
These two normalization processes correct for pre-fire spatial variation in reflectance in the image and produce more consistent RdNBR values across image sets, facilitating the comparison of different fires [1,2].
In temperate conifer forests in western North America, dNBR and RdNBR have been shown to be correlated with field-based assessments of burn severity in a number of different forested systems [1,2,6,7,9,12,23]. In forested systems, dNBR and RdNBR provide more accurate measurements of burn severity than many other indices that use Landsat TM or ETM+ data, such as the differenced normalized vegetation index (dNDVI) or indices based on principal component analysis or machine-learning algorithms based on the reflectance of all the Landsat bands [6,24], although single-date indices using band ratios, tassel-cap transformations, and spectral mixture analysis have also been successfully used to map burn severity [9,25,26]. When tested in mixed-conifer forests of the Sierra Nevada with the 224 spectral bands available from the Airborne Visible and Infrared Imaging Spectrometer (AVIRIS) sensor, the bands used in the dNBR calculation were among the four most sensitive bands to changes in surface spectral reflectance after fire [27]. Brewer et al. [24] compared six approaches of classifying and mapping fire severity in the Rocky Mountains (USA) with Landsat TM data to a “control” method of photo-interpretation and field data, and found the dNBR to be the most accurate and consistent index. Overall, correlations with field-based data and classification accuracies of the indices are good, but do seem to vary among regions; of the 26 studies using dNBR reviewed by French et al. [9] the average classification accuracy was 73% but accuracies varied from 50 to 95%. Also, because the two spectral bands do not change at the same rate with increased burn severity, NBR, by itself, does not meet the criteria for being an “optimal index” for assessing burn severity [22]. Other remote-sensing methods, such as spectral-mixture analysis, have also shown promise for detecting burn severity and post-fire effects [26], but field evaluation of these methods have been limited in geographic scope compared to dNBR and RdNBR.
Overall, dNBR and RdNBR are the most widely used indices for assessing burn severity. Their multi-temporal nature minimizes classification errors due to sun-sensor geometry and phenology. Because both indices use Landsat imagery, which has relatively high resolution (30 m), is readily available, and is now free to the public, they have been widely used in both research and management [17]. In the United States, there is also a deep temporal record of burn severity using both dNBR and RdNBR: the Monitoring Trends in Burn Severity project (MTBS) has mapped all fires that occurred between 1984 and 2010 that were >405 ha in the western USA and >202 ha in the eastern USA, with plans to continue mapping severity of fires in the future [28]. MTBS uses the dNBR index to produce five-class categorical burn-severity images, but unclassified dNBR and RdNBR images are also produced for all fires [28]; as of April 2011 over 12,500 fires had been mapped [29].
Classifications based on RdNBR are more accurate than those based on dNBR in vegetation with a mix of grass and shrubland or with a mix of forest and non-forest [1,2,6]. In the Sierra Nevada, Miller and Thode [1] found that where pre-fire vegetation is highly variable, RdNBR has similar or slightly lower classification accuracy than dNBR in the low-severity class, but higher overall classification accuracy and greater classification accuracy in the high-severity class. Severely burned areas are often of greater interest to scientists and managers than lightly burned areas, since the former often have greater change in vegetation species composition, slower vegetation recovery, greater susceptibility to invasive species establishment, and higher erosion potential.
RdNBR may be more robust than dNBR for comparing multiple fires, particularly among fires in different types of forests, different regions, or heavily vegetated and sparsely vegetated areas [1,2,6]. Based on a large field data set from 25 fires in the Sierra Nevada and Klamath mountains of California, Miller et al. [2] found that RdNBR was better than dNBR when burn-severity thresholds were extrapolated to fires not included in the original calibration. However, it is not clear if RdNBR is more accurate than dNBR in all systems or for all uses. Zhu et al. [6] found that RdNBR produced more consistent regression curves across multiple regions, but dNBR had higher regional correlations with field data. A recent study in the Canadian Rocky Mountains and the western boreal forests of Canada, using field data from six fires, found higher correlation and better classification accuracy with dNBR (72.2%) than RdNBR (65.2%), and concluded that classification based on RdNBR was no better than dNBR when based either on regressions from individual fires or on pooled data from multiple fires [12]. There is not yet strong consensus regarding the strengths and weaknesses of each index; their relative merits vary among ecosystems and with the scale of analysis.
1.2. Field-Based Assessments of Burn Severity
Field measurements of burn severity must be aggregated to the spatial resolution of the remotely sensed images for the two to be compared. For this purpose, Key and Benson [3] developed the Composite Burn Index (CBI), a standardized procedure for assessing burn severity in the field in order to calibrate and validate 30-m resolution Landsat-based burn-severity images. The CBI combines ecologically significant variables related to burn severity into one numeric site index assessed over a 30-m diameter plot. Ocular estimates of burn severity from 0 (unchanged) to 3 (high severity) are made for four to five individual factors for each of 5 strata present on a plot (Table 1). (Individual rating factors include estimates of litter and duff consumption; soil exposure; herbaceous and shrub mortality, resprouting, and colonization; and tree char, scorch, and mortality.) Like many ecological metrics, CBI is an imperfect but useful way to characterize the combined effects of multiple causes, e.g., flame length, fireline intensity, fire residence time, and vegetation response to fire. The full CBI protocol is available in Key and Benson [3]. If a rating factor or stratum is not present on a plot it is not assessed. The CBI score is the average score of all evaluated rating factors.
CBI scores have stronger relationships with remotely sensed burn-severity indices than other common measurements of severity, such as fire-caused change in basal area or tree canopy cover [2]. In some systems, such as boreal forests [30] and chaparral [10], CBI does not capture burn-severity characteristics that have a strong relationship with ecosystem response to the fire, but in conifer forests in the western USA, the CBI corresponds well with field-based measurements of plant injury, fuel consumption, and tree mortality [2,3].
The CBI provides a standardized method for estimating burn severity for a site, but has been criticized because it does not account for differences in the fractional cover of each stratum [4,5]. In a modeling analysis of spectral reflectance De Santis and Chuvieco [4] found that the fractional cover of individual strata influences the overall reflectance of a plot. On high-severity plots the fraction of cover does not affect plot reflectance, since leaf area index is generally low [4], and strata tend to burn with similar severity. In contrast, at moderate and low burn severity relatively small changes in the fraction of cover of vegetation influence the reflectance of the both bands used in the NBR calculation [4].
To address this issue De Santis and Chuvieco proposed a modification to the original CBI calculation, which they termed the Geometrically Structured Composite Burn Index (GeoCBI) [5]. This method accounts for the fraction of coverage (FCOV) of each stratum in the CBI calculation:
where m refers to each vegetation stratum and n is the number of strata. All vegetated strata are weighed by their FCOV; the substrates stratum is not weighted. De Santis and Chuvieco [5] also slightly modified the individual rating factors in the CBI sheet, adding a “new sprouts” rating factor to the herbs and low shrubs stratum, combined the effects of scorch and char in the intermediate trees and dominant trees categories, and converted the “percent change in cover” rating factor to “change in leaf area index (LAI)”.
CBI and GeoCBI were compared on three fires in Mediterranean ecosystems, measuring post-fire severity during the same season as the fire using immediate post-fire NBR images (single date). Regressions using the GeoCBI had a stronger relationship with remotely sensed measurements of burn severity on plots where the burn severity and fraction of cover of the overstory and the understory strata differed compared to regression using CBI [5].
Researchers in North America have also used a version of the CBI that weighted the scores by FCOV for each stratum [12,13], but without modifying individual rating factors sensu De Santis and Chuvieco [5]. We refer to this as the “weighted CBI” (hearafter WCBI), and calculate it with the same formula as the GeoCBI (Equation (4)), but using the individual rating factors from the original protocol of Key and Benson [3].
Weighted versions of the CBI (GeoCBI and WCBI) are now being used in burn-severity assessments that use data from 1 year post-fire (as opposed to immediate same-season assessments) and multi-temporal burn-severity data (dNBR and RdNBR as opposed to NBR) [12,13,31]. However, validations of weighted versions of the CBI for this application have not been published. Likewise, weighted versions of the CBI have been compared to the original CBI in dry Mediterranean pine-oak forests [5], but not in more densely vegetated mesic conifer forests.
1.3. Study Objectives
The objectives of this study were twofold. First, we tested the hypothesis that WCBI and GeoCBI would outperform the CBI in terms of correlation with the remotely sensed burn-severity indices and their classification accuracy. On a subset of data we also compare the WCBI to the GeoCBI, to assess the impact of the change in the individual rating factors made by De Santis and Chuvieco [5]. Our second objective was to assess the relative performance of dNBR and RdNBR for creating classified burn-severity images in the northern Cascade Range. We developed empirical relationships between the two remotely sensed indices of burn severity and field data, and based on these regressions, evaluated the hypothesis that CBI would predict RdNBR better than dNBR, in terms of variance explained and classification accuracy, thereby confirming that RdNBR provides a better surrogate for the fire effects quantified by CBI. Empirical assessment of burn severity in the study area to date is limited to one fire [32]. Our results, based on local data from multiple fires and a large number of plots, provide a basis for classifying and interpreting remotely sensed burn-severity images from past and future fires in the Cascade Range.
2. Methods
2.1. Study Area
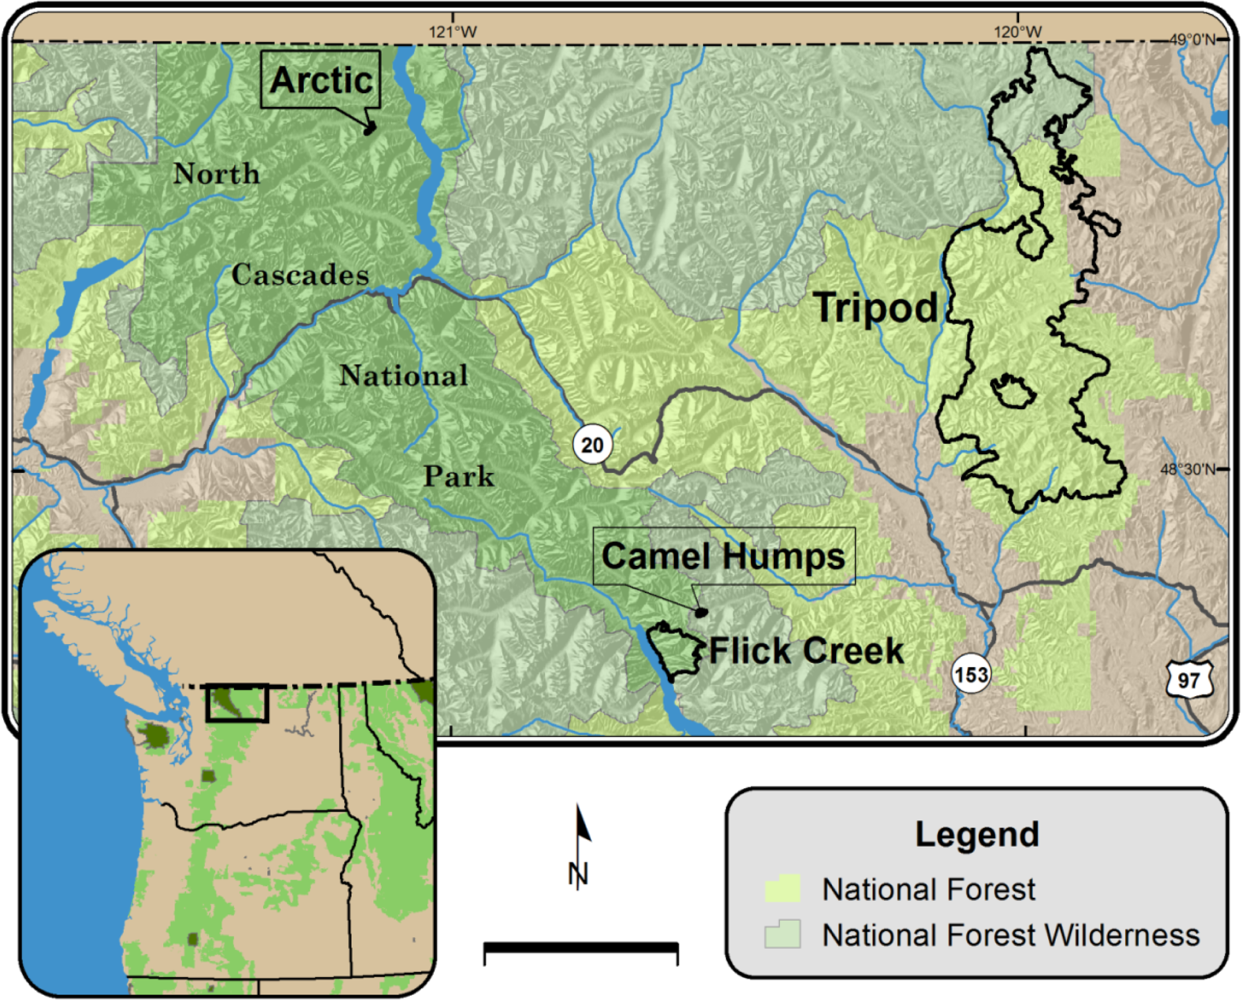
The four fires in this study burned in the northern Cascade Range of Washington, USA (Figure 1). They span the climate and types of vegetation that burn within the northern Cascade Range [33–35] (Table 2). The Camel Humps and Arctic fires burned in subalpine forests. The area where the Arctic fire occurred, experiences greater annual precipitation and lower temperatures than the other fires, reflected in a mesic species composition, dominated by Abies lasiocarpa, Tsuga mertensiana, and Abies amabilis. Dominant tree species in the Camel Humps fire were Abies lasiocarpa and Picea engelmannii. About one third of the Camel Humps fire had burned in the 1994 War Creek fire; these areas were dominated by grasses and sprouting shrub species (e.g., Salix, Ribes and Vaccinium). The Flick Creek fire covered the largest elevation range, but plots were principally located in lower elevations of the fire, in mixed-conifer forests of Pseudotsuga menziesii, Pinus ponderosa, and Abies grandis. Plots on the Tripod fire spanned the widest range of forest types, from Pinus contorta stands that burn predominantly with high severity, to Pseudotsuga menziesii, Pinus ponderosa, and Larix occidentalis forest types that burn more often with low and moderate severity [36–38].
2.2. Field Data
The primary field-based assessment of burn severity, used on all four fires, was the Composite Burn Index (CBI). On the two larger fires, Tripod and Flick Creek, CBI plot locations were selected via stratified random sampling. Plots were stratified by burn severity, forest cover, accessibility, and on the Tripod fire, physiography. Plots were located in fairly homogenous patches of a given severity type. In order to maximize the number of plots in the two smaller fires, Arctic and Camel Humps, plot locations were created by transferring the gridded burn-severity images into grids of points and then selecting a random sample of points spaced at least 60 m apart within each fire. Collection of CBI data was overseen by personnel who had experience with fire ecology in the northern Cascade Range, and followed the standard protocol [3]. On the Arctic and Camel Humps fires the GeoCBI was assessed concurrently with the CBI. Plots on the Tripod, Camels Humps, and Arctic fires were 30 m in diameter. Plots on the Flick Creek fire, installed in conjunction with another study, were 22.6 m in diameter.
The weighted versions of the CBI could not be calculated on all plots. Percentage cover of each stratum was not consistently recorded on the Flick Creek and Tripod fires, and CBI data collection on these fires occurred prior to the introduction of GeoCBI in the literature. The WCBI was calculated for the 146 plots that had proportional-cover data for each stratum. It was unclear if the authors of the GeoCBI intended for strata to be weighted by the pre-fire or post-fire FCOV [5]. Pre-fire FCOV was usually greater and corresponded with the area assessed for each stratum, therefore we calculated WCBI and GeoCBI based on the pre-fire FCOV. Because the individual rating factors on the GeoCBI protocol were slightly different, it was assessed only on the 52 plots in the 2008 fires that were installed after the GeoCBI method was published.
In addition to the 251 CBI plots, data from 388 “forest plots” from a study of the Tripod fire were also used to assess burn severity (Table 3). These plots included measurements of individual tree canopy scorch, char height, tree mortality, and a burn-severity index of surface fuel consumption. To convert these measurements into CBI scores, numerical CBI scores for two different strata, the substrates and overstory trees (equivalent to the combined intermediate and dominant tree strata on the CBI from), were determined based on (1) a burn severity index for the substrates and (2) the average plot canopy scorch percentage, maximum char height, and tree mortality for the overstory trees. The plot CBI score was calculated based on the average of substrates and understory CBI scores (Table 4) [42]. Exploratory data analysis showed no statistical difference between models based on CBI plots and CBI scores calculated from forest plots [15], so both were used.
2.3. Remotely Sensed Data
Burn-severity images for the 2006 Tripod and Flick Creek fires were downloaded from the Monitoring Trends in Burn Severity website [43]. Pre-fire images were from one or two years before the fire, and post-fire images were from the year after the fire. For the smaller 2008 Camel Humps and Arctic fires, which were not available online, we identified cloud-free Landsat image pairs with matching phenology (Table 5). Burn-severity images were produced by the US Geological Survey National Center for Earth Resources Observation and Science (EROS) following standard protocols of the Monitoring Trends in Burn Severity project. Image data were geometrically registered, terrain-corrected, and radiometrically corrected. The NBR index was calculated for pre-fire and post-fire images and inspected for co-registration accuracy. NBR images were differenced for each fire-scene pair to generate the dNBR, and the RdNBR was created from the pre-fire NBR and the dNBR images [28]. Perimeters based on remote-sensing data are more consistent than other mapping methods, particularly in complex terrain [44], therefore fire perimeters were corrected, if necessary, based on the remotely sensed burn-severity images.
2.4. Statistical Modeling and Classification Accuracy Assessment
The relationship between field-based data and remotely sensed measurements of burn severity was estimated using linear and non-linear models. Previous studies have used CBI as a response variable [12,27,45] and as a predictor variable [1,2,46], but because regression analysis typically implies a causal relationship between one or more predictors and a response, we use CBI as a predictor because burn severity causes changes in reflectance, not the other way around. This allows us to use the variable that has the greatest certainty associated with its meaning (CBI) to predict the variable that has no inherent ecological meaning (dNBR or RdNBR). Additional advantages of using CBI as a predictor variable include the ability to directly compare our results to the first regional study comparing dNBR and RdNBR [1], and to easily predict threshold values for image classification for dNBR and RdNBR from any CBI value.
DNBR and RdNBR pixel values were sampled at plot locations in ArcGIS Version 9.2 using bilinear interpolation, which calculates a value at a point location by identifying the four nearest pixel centers, weights each based on its distance from the target point, and then assigns a value based on the weighted average of the four pixel values. Exploratory data analysis indicated that bilinear interpolation performed better than nearest neighbor (the value of the nearest cell) or cubic convolution (the distance-weighted value of the nearest 16 cells) [15]. As in previous studies [1,2,6,9,11–14], a non-linear model of the relationship between the field-based and remotely sensed data was usually necessary. To model dNBR or RdNBR (y) as a function of CBI, WCBI or GeoCBI (x) we used the following model form:
where a, b, c are estimated coefficients, except in cases where a linear model was sufficient. Exploratory data analysis showed that the above model, though visually very similar to the models used by Miller and Thode [1], had lower standard error of the estimates, and all the parameter estimates were significant [15].
Based on the models, CBI threshold values were used to predict dNBR and RdNBR threshold values. Because CBI is a continuous index, any CBI value can be used with the regression equation to predict associated classification threshold values for dNBR or RdNBR; the choice of CBI values can be made according to the desired application. We chose CBI values that would facilitate comparisons of classification thresholds and burn-severity levels among different study areas. The thresholds between the four severity classes—high, moderate, low, and unchanged—were based on the same CBI values that were used by Miller and Thode [1] and Soverel et al. [12], and burn severity category descriptions follow those of Miller and Thode [1] (Table 6).
DNBR and RdNBRs were compared based on model R2 and the accuracy with which plots and pixels were classified. The classification accuracy was calculated from a confusion matrix showing the classification of field plots (columns) and remotely sensed pixels (rows) of each model [47]. Confusion matrices were used to compute (1) the producer’s accuracy (percentage of CBI plots classified correctly in each class), (2) the user’s accuracy (percentage of pixel values classified correctly in each class), (3) the overall accuracy (percentage of correct classifications across all classes) [47], and (4) the kappa statistic, a measure of overall accuracy compared to random classification [47]. Kappa values of 1 indicate a 100% agreement and kappa values of 0 indicated that the classification was no better than a random assignment.
To evaluate the different methods of measuring burn severity in the field, models predicting dNBR and RdNBR based on CBI and WCBI scores were compared on one subset of data (n = 146), and CBI, WCBI, and GeoCBI are compared on a smaller subset of data (n = 52). To compare the two burn-severity indices, dNBR and RdNBR, the full data set of 639 field plots from all four fires was used. All statistical analysis and classification accuracy assessments were performed in the statistical programming language R [48].
3. Results
3.1. Comparison of CBI Indices
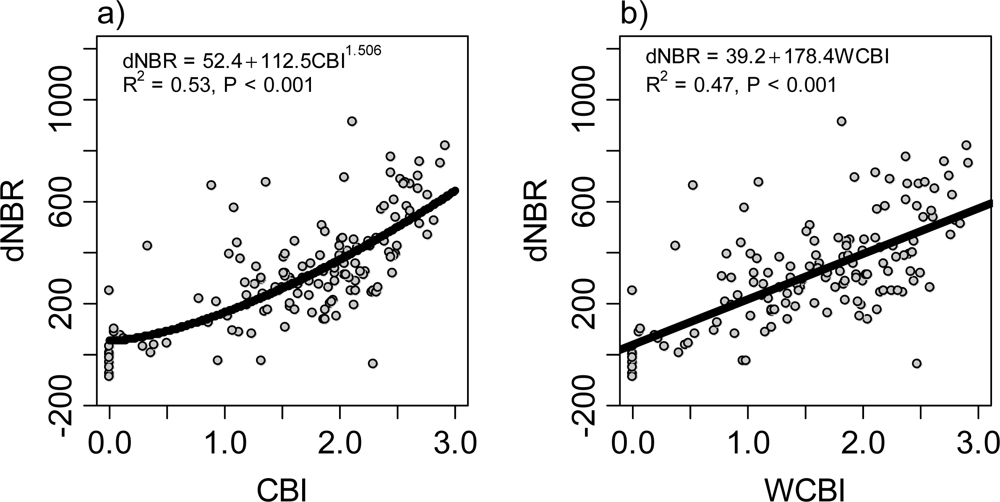
Regression models predicting dNBR based on CBI had higher R2, overall accuracy, and Kappa values than those based on WCBI or GeoCBI (Table 7), although differences between the three indices were not large. Therefore, contrary to our first hypothesis, there was no indication that WCBI or GeoCBI consistently performed better than CBI. For regression models predicting RdNBR, CBI performed better than WCBI using the data set of 146 plots (Figure 2). WCBI had better classification accuracy than CBI in the low-severity class, but worse classification accuracy than CBI in the moderate- and high-severity classes.
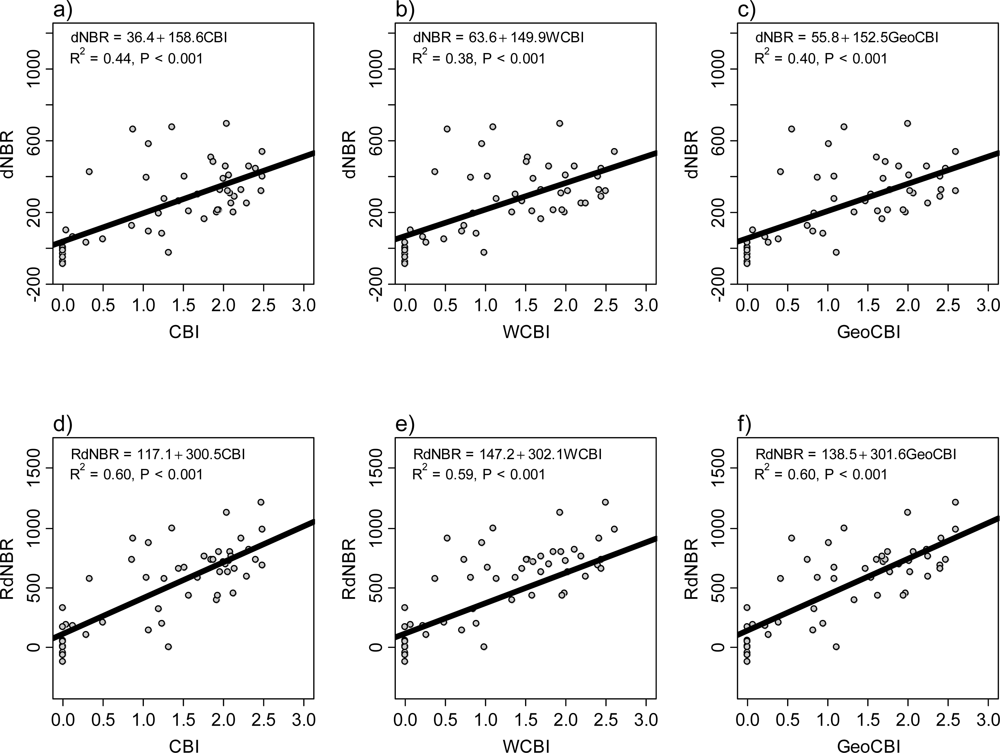
Regression models for CBI, WCBI and GeoCBI using the data set of 52 plots explained a similar amount of variance (Figure 3). WCBI had slightly higher classification accuracy than CBI and GeoCBI, but these differences were not dramatic (Table 7). The difference in the individual rating factors in the GeoCBI did not lead to any better or worse classification accuracy than the WCBI (Table 7).
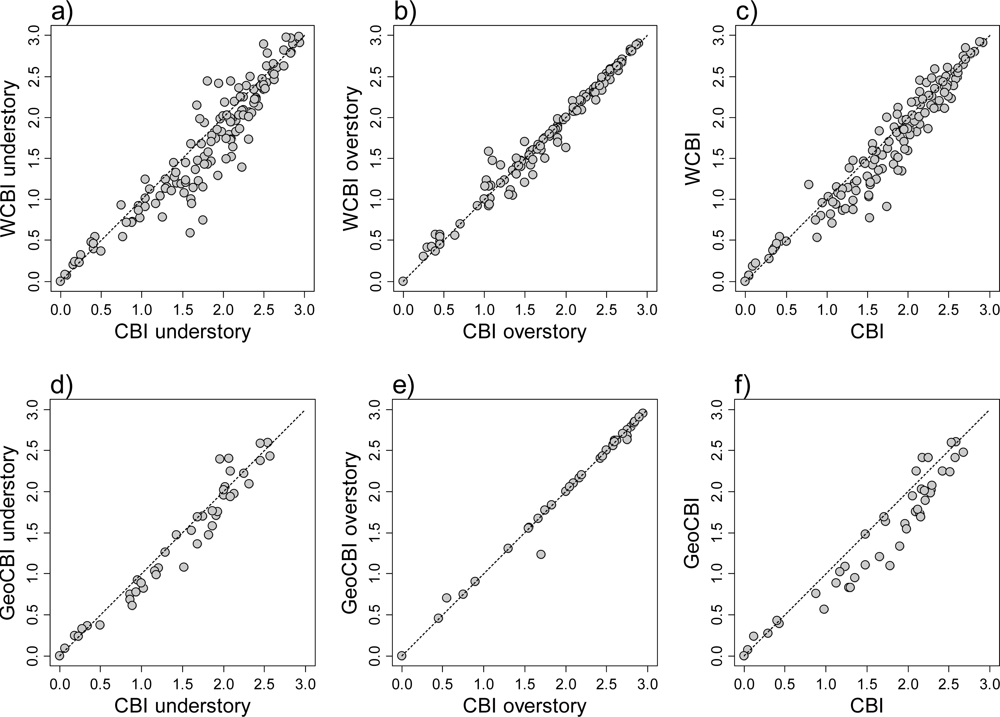
Classification accuracy in the moderate- and high-severity classes decreased when WCBI, as opposed to CBI, was used (Table 8). The increased classification accuracy in the unchanged and low-severity classes reflects differences in WCBI and GeoCBI from CBI scores in low- and moderate-severity plots. Scores were more consistent in unchanged and high-severity plots. WCBI and GeoCBI plot scores were mostly lower than CBI scores when the CBI score was between 1.0 and 2.0 (Figure 4), primarily due to differences between the CBI and WCBI scores for the understory strata (Figure 4).
3.2. Comparison of dNBR and RdNBR
The model predicting dNBR from CBI had slightly higher R2 than those predicting RdNBR from CBI (Figure 5), but the model with RdNBR had better classification accuracy. Contrary to our second hypothesis, models predicting RdNBR did not consistently perform better than those predicting dNBR; strong differences between the variance explained and classification accuracy of the two indices were not apparent. Overall, RdNBR showed slightly better classification accuracy than dNBR: the dNBR model had lower overall accuracy and kappa value than RdNBR (Tables 9 and 10), and RdNBR had higher producer’s accuracy in all classes but the unchanged class, and higher user’s accuracy in all classes but the high-severity class.
For both dNBR and RdNBR, user’s and producer’s accuracies were lowest in the low-severity class; all models misclassified low-severity plots and pixels as moderate severity more often than they were correctly classified as low severity. No other burn-severity classes suffered from this problem. The high- and moderate-severity classes consistently had higher classification accuracy than the other two burn-severity classes.
4. Discussion
Neither of our hypotheses was supported by our results. We expected that the weighted versions of the CBI (WCBI and GeoCBI) would outperform the CBI in predicting the remotely sensed burn-severity indices with respect to explanatory power and classification accuracy. In fact, they often performed worse. The poor performance of the weighted versions of the CBI may be because they overemphasize the substrates stratum and underemphasize the dominant and intermediate tree strata—which should be most closely related to plot reflectance—in their calculation.
Our second hypothesis was that RdNBR would outperform dNBR in both in terms of variance explained and classification accuracy. Although RdNBR showed slightly better classification accuracy than dNBR, particularly for the high-severity class, a strong difference in the accuracies of the two indices was not apparent. RdNBR may not improve on dNBR in systems where pre-fire reflectance is not highly variable, but may be a more appropriate index when comparing burn severity among regions.
4.1. Weighted versions of the CBI
Weighting the CBI scores by the fraction of cover of each stratum is consistent with remote-sensing theory [4,5] and is intuitive. Therefore it was surprising that the WCBI and GeoCBI performed worse than the original CBI in terms of R2 and classification accuracy. To understand why WCBI and GeoCBI did not perform as well as CBI, a closer look at how the weighted version of the CBI can shift burn-severity scores was necessary. Therefore we calculated the “influence” of each stratum on the overall plot CBI and WCBI score. For WCBI, influence is equal to the FCOV of a stratum divided by the sum of the FCOV for all strata assessed in a plot. The WCBI influence is equal to the GeoCBI influence because they are based on the same FCOV values, so for simplicity we use the larger WCBI data set in the example that follows. The CBI influence of a stratum is equal to the number of rating factors assessed in that stratum divided by the total number of rating factors assessed in the plot. The null model would be that each of the five strata has a CBI influence of 0.2. This was not always the case because some plots lacked individual strata or individual rating factors were not assessed because they were not present.
Comparing the WCBI influence to the CBI influence reveals the strata that had the greatest effect on the plot WCBI scores (Figure 6). WCBI most often modified plot scores by increasing the influence of the substrates while decreasing the influence of the tall shrubs, intermediate trees, and dominant trees (Figure 6). The average WCBI influence of the substrates stratum was 0.51, much higher than the null model of 0.20. The average WCBI influence of the herbs and low shrubs stratum was 0.24, similar to the null model. The tall shrubs, intermediate trees, and dominant trees all had lower WCBI influence than the null model; 0.06, 0.10, 0.15, respectively.
Because the substrates had the strongest influence on plot WCBI severity scores, the difference between WCBI and CBI reflected the severity of the substrates stratum over other strata. Most commonly, the substrates stratum burned with lower severity than the tall shrubs, intermediate trees, and dominant trees, causing WCBI and GeoCBI scores to be lower than CBI scores (Figure 7(b,d), Table 11). Occasionally, WCBI and GeoCBI increased plot severity scores, predominantly in higher-severity plots, by increasing the influence of the substrates stratum when it burned with higher severity than the rest of the plot (Figure 7(f), Table 11). It is possible for plots with high variation in the WCBI influence between strata to have similar CBI and WCBI scores if burn severity was similar among strata.
WCBI occasionally changed the plot score so that it better reflected actual conditions on the ground, by decreasing the influence of a stratum that burned with different severity from the rest of the plot and covered only a small portion of the plot. Nevertheless, based on the overwhelming influence of the substrates stratum compared to the other strata (Figure 6), we suggest that the weighted versions of the CBI were less accurate because they overvalued the substrates stratum and undervalued the intermediate tree and dominant tree strata. In optical remote sensing, the tree strata should have the strongest influence on reflectance, because trees (1) obscure the reflectance of lower strata, and (2) have greater biomass and leaf area index for a given amount of cover.
Quantifying how each stratum contributes to overall plot reflectance in mesic mixed-conifer and subalpine forests, perhaps based on leaf area index, would facilitate the development of a more robust weighting scheme [4]. Meanwhile, the greater influence of the dominant tree strata on plot reflectance could be addressed by following the methods of Soverel et al. [12], who weighted the dominant tree stratum twice as strongly as the other strata to account for its greater influence on reflectance. Alternatively, the influence of the substrates stratum on the overall score could be lessened by weighting it by pre-fire fraction of cover of burnable material (i.e., the combined cover of litter, duff, and woody fuels), limiting its influence to the null level of 0.2, or fitting weighting parameters to each stratum.
4.2. DNBR and RdNBR
We expected categorized images of burn severity based on RdNBR to have higher classification accuracy than those based on dNBR [1,2]. R2 values for the models using dNBR were slightly higher than for the models using RdNBR, but classifications based on RdNBR had slightly better classification accuracy. The performance of RdNBR therefore falls in between the results of Miller and Thode [1], who found that RdNBR performed better than dNBR in the Sierra Nevada, and the results of Soverel et al. [12], who found dNBR had higher classification accuracy than RdNBR in the Canadian boreal forest and the Canadian Rockies. One possible explanation for similarity between dNBR and RdNBR in the northern Cascade Range is that pre-fire vegetation cover in the northern Cascade Range is consistently high, particularly compared to the Sierra Nevada. With little difference in pre-fire reflectance, the absolute change measured by the dNBR would be similar to the relative change measured by the RdNBR.
We consider both dNBR and RdNBR to be suitable for producing categorical burn-severity images in areas with continuous forest cover in the Cascade Range. Our overall classification accuracies were within the range found in California and Canada [1,2,12] (Table 12). RdNBR was designed for locations where pre-fire reflectance is variable [1,2], and has been shown to perform better there than dNBR. In contrast, RdNBR may not improve on dNBR where vegetation cover is continuous and pre-fire reflectance is relatively uniform, such as in the northern Cascade Range.
Because both dNBR and RdNBR can be used to produce classified burn-severity images with similar classification accuracy in the northern Cascade Range, selection of dNBR or RdNBR should be based on the particular management or study goals. Given that classification thresholds from RdNBR are more robust for extrapolation to fires not included in the original study [2], and the slightly higher classification accuracy of RdNBR—particularly for the high-severity class—researchers and managers wishing to apply the regional classification thresholds developed in this study to additional fires in the northern Cascades region and beyond may be best served by using RdNBR. Conversely, dNBR may be better suited to addressing research questions about the absolute change as opposed to relative change caused by a fire (for modeling changes to biomass, for example), unburned and low severity areas, when the continuous burn severity values are of interest, and when the remotely sensed severity of a particular fire is to assessed, particularly if the class thresholds can be further calibrated using aerial photography or local field data.
Our results provide a regional empirical basis for producing categorical burn-severity images; the classification thresholds for the burn-severity classes above should be applicable to ecologically similar areas, ranging from the Cascade Range in northern Oregon to its northern extent in southern British Columbia. Any CBI value can be chosen for a specific application and used to predict dNBR or RdNBR values using our regional equations, above. For example, if managers were interested in identifying areas with “very high” burn severity due to concerns about delayed regeneration of wind dispersed tree species, they could identify a CBI value associated with those ecological effects, and use it to predict a dNBR or RdNBR threshold value.
An additional presumed benefit of RdNBR is consistent classification thresholds across regions. Comparisons of this study to others in temperate conifer forests of North America seem to indicate the RdNBR may produce more consistent classification thresholds between the moderate-high classes than dNBR, but for lower-severity classes the benefit of one index over the other is not evident (Table 13): RdNBR values for the moderate-high severity class threshold ranged between 641 and 703 (range = 62), and dNBR values for the moderate-high severity class threshold ranged between 367 and 568 (range = 201). Thresholds for using dNBR were higher than those for the Sierra Nevada presented in Miller and Thode [1] but lower than those developed by Soverel et al. [13] for Canada, and most similar to the dNBR thresholds of Key and Benson [3] that were developed primarily with field data from Glacier National Park (Table 13).
Because of the similarities between the high-severity classification thresholds across regions, and the better classification accuracy of the high-severity classes, managers and researchers may be best served by focusing on moderate and high severity in future analyses. We found that the high- and moderate-severity classes had the highest classification accuracies, whereas the classification accuracy for the low-severity class was poor. Other studies have also found that the high-severity class can be classified with the greatest accuracy [1,45]. Also, RdNBR class thresholds for the high-severity class are more consistent across studies in different regions than dNBR class thresholds (Table 13). Focusing primarily on high and moderate severity should not present a problem to researchers and managers, as high-severity fire causes the greatest ecological change and is therefore often of most interest. If low and unchanged severity are of interest, they may be better represented as one class instead of two. Methods of analyzing the distribution [51,52] and spatial pattern [53] of uncategorized, continuous, remotely sensed burn severity data should also be explored and assessed in a variety of ecological settings.
4.3. Future Research
In order for additional methods to be useful for assessing burn severity across larger geographic areas, they must be cost efficient, produce results in a timely manner, and be easily implementable; these benefits must be balanced with the need for high accuracy [17]. Continued evaluation of how the classification accuracy of field-based and remotely sensed metrics of burn severity vary between regions, and how classification accuracy is influenced by the ecological variability included in an assessment, will improve our understanding of the relative merits of different remote-sensing methods.
CBI provides a standardized method of aggregating multiple factors relating burn severity into one index, and its widespread use demonstrates its utility. We found that WCBI and GeoCBI did not show any improvement in classification accuracy over the original version of the CBI, because they increase the influence of the substrates stratum, while decreasing the influence of the intermediate and dominant tree strata, on the overall plot severity score. Consequently we recommend that other weighting methods that do not overemphasize the substrates at the expense of the overstory be developed and tested. Diligent recording of the pre-fire and post-fire fractional cover of every stratum on plots should continue in future studies so that additional methods of calculating CBI can to be evaluated.
No other methods of remote sensing of burn severity have been operationally implemented over as large a region or over as temporally deep a time period as dNBR and RdNBR. Therefore, knowledge of how to best select between the two indices for a given location or application is of continued consequence. Focused and rigorous investigation of how pre-fire cover influences explanatory power and classification accuracy is needed so that the best index can be selected for a particular location. Collection of CBI data within a region should be targeted so that areas with continuous pre-fire cover and areas where pre-fire cover is spatially variable are both measured and can be compared. Uncertainties regarding classification thresholds can be addressed by emphasizing the high-severity category, which usually has greater classification accuracy. The high-severity threshold values for RdNBR seem to be relatively consistent across multiple regions; values in Table 13 range from 641 to 703. An analysis of all the available CBI data that tests for consistency of the high-severity RdNBR thresholds, would help determine if one RdNBR high-severity threshold can be used across all temperate conifer forests in western North America.
Further development of more accurate and transferable methods of remotely sensing burn severity is also needed. A variety of other factors, such as pre-fire mortality due to insects, spatial variation of inorganic substrates, and fine-scale spatial variation in burn-severity may have contributed to the slightly lower R2 values found in this study compared to others. Methods using a time series approach may be able to separate out disturbance that occurred before the fire from the impact of the fire itself [54]. The use of spectral mixture analysis to separate out different fire effects, such as the cover of unburned vegetation and charred vegetation, may also provide a more direct mechanistic link between remotely sensed data and fire effects [17,26]. Use of sensors with greater spatial resolution than that available from Landsat satellites may also improve accuracy of burn severity mapping, but currently, affordability and processing requirements limit the use of these data for analyses of large areas. As more accurate methods are developed and tested, they will likely be adopted by programs like MTBS, and used to map severity across large regions.
5. Conclusions
Our analysis illustrates two cases in which methodological refinements—one of a field-based index of burn severity (the Composite Burn Index) and the other of a remotely sensed index of burn severity (the differenced Normalized Burn Ratio)—show to be advantageous in the area they were developed (the Sierra Nevada mountains of California USA, and the Mediterranean, respectively), did not show the same improvement when used in a new location (the northern Cascade Range of Washington, USA). We were unable to reproduce the improved performance of geometrically structured Composite Burn Index (GeoCBI) over the original Composite Burn Index (CBI), as was observed in Mediterranean ecosystems. Nevertheless, methods of calculating the CBI that weight all strata (including the substrates strata) by their proportional cover in their calculation should be evaluated in the future. Within our study area in the northern Cascade Range of Washington, USA, there was little difference in the explanatory power and classification accuracy of models predicting dNBR vs. Relative differenced Normalized Burn Ratio (RdNBR), but the high-severity threshold for RdNBR may be more consistent across regions than the threshold for dNBR. The relationships between the CBI and the dNBR and CBI and the RdNBR capture about 50% of the variance and classify severity with about 60% accuracy, suggesting that the methodology is applicable and useful but could use improvement. Studies comparing burn severity of fires within the Cascade Range of northern Oregon through southern British Columbia will likely be served well by either index, but comparisons across regions may be served best by RdNBR.
Acknowledgments
Thanks to Stephen Howard, USGS, of the EROS Data Center, Sioux Falls, SD for the processing of MTBS data. Jim Lutz and L. Monika Moskal provided helpful advice in the development of this project. Field data collection would not have been possible without the volunteer help of Whitney Albright, Seth Cowdery, Andrew Larson, Alana Lautensleger, and Joe Restaino. Special thanks to Karen Kopper and Susan Prichard, for sharing field data from the Flick Creek and Tripod fires, respectively. Robert Norheim consulted on GIS analysis and produced Figure 1. David L. Peterson, Andrew J. Larson, and two anonymous referees provided constructive feedback on this manuscript. Funding for this research was provided by the US Forest Service, Pacific Northwest Research Station, through a cooperative agreement with the University of Washington, School of Forest Resources.
References
- Miller, J.D.; Thode, A.E. Quantifying burn severity in a heterogeneous landscape with a relative version of the delta Normalized Burn Ratio (dNBR). Remote Sens. Environ 2007, 109, 66–80. [Google Scholar]
- Miller, J.D.; Knapp, E.E.; Key, C.H.; Skinner, C.N.; Isbell, C.J.; Creasy, R.M.; Sherlock, J.W. Calibration and validation of the relative differenced Normalized Burn Ratio (RdNBR) to three measures of fire severity in the Sierra Nevada and Klamath Mountains, California, USA. Remote Sens. Environ 2009, 113, 645–656. [Google Scholar]
- Key, C.H.; Benson, N.C. Landscape Assessment (LA): Sampling and analysis methods. In FIREMON: Fire Effects Monitoring and Inventory System; Lutes, D.C., Keane, R.E., Caratti, C.H., Key, N.C., Sutherland, S., Eds.; Rocky Mountain Research Station, USDA Forest Service: Fort Collins, CO, USA, 2006; pp. LA-1–LA-55. [Google Scholar]
- De Santis, A.; Chuvieco, E. Burn severity estimation from remotely sensed data: Performance of simulation versus empirical models. Remote Sens. Environ 2007, 108, 422–435. [Google Scholar]
- De Santis, A.; Chuvieco, E. GeoCBI: A modified version of the Composite Burn Index for the initial assessment of the short-term burn severity from remotely sensed data. Remote Sens. Environ 2009, 113, 554–562. [Google Scholar]
- Zhu, Z.; Key, C.; Ohlen, D.; Benson, N. Evaluate Sensitivities of Burn-Severity Mapping Algorithms for Different Ecosystems and Fire Histories in the United States; Final Report to the Joint Fire Science Program; Project: JFSP 01-1-4-12; USGS EROS: Sioux Falls, SD, USA, 2006. [Google Scholar]
- Key, C.H. Ecological and sampling constraints on defining landscape fire severity. Fire Ecol 2006, 2, 34–59. [Google Scholar]
- Allen, J.L.; Sorbel, B. Assessing the differenced Normalized Burn Ratio’s ability to map burn severity in the boreal forest and tundra ecosystems of Alaska’s national parks. Int. J. Wildland Fire 2008, 17, 463–475. [Google Scholar]
- French, N.H.F.; Kasischke, E.S.; Hall, R.J.; Murphy, K.A.; Verbyla, D.L.; Hoy, E.E.; Allen, J.L. Using Landsat data to assess fire and burn severity in the North American boreal forest region: An overview and summary of results. Int. J. Wildland Fire 2008, 17, 443–462. [Google Scholar]
- Keeley, J.E.; Brennan, T.; Pfaff, A.H. Fire severity and ecosytem responses following crown fires in California shrublands. Ecol. Appl 2008, 18, 1530–1546. [Google Scholar]
- Hall, R.J.; Freeburn, J.T.; de Groot, W.J.; Pritchard, J.M.; Lynham, T.J.; Landry, R. Remote sensing of burn severity: Experience from western Canada boreal fires. Int. J. Wildland Fire 2008, 17, 476–489. [Google Scholar]
- Soverel, N.O.; Perrakis, D.D.B.; Coops, N.C. Estimating burn severity from Landsat dNBR and RdNBR indices across western Canada. Remote Sens. Environ 2010, 114, 1896–1909. [Google Scholar]
- Soverel, N.O.; Coops, N.C.; Perrakis, D.D.B.; Daniels, L.D.; Gergel, S.E. The transferability of a dNBR-derived model to predict burn severity across 10 wildland fires in western Canada. Int. J. Wildland Fire 2011, 20, 518–531. [Google Scholar]
- Picotte, J.J.; Robertson, K.M. Validation of remote sensing of burn severity in south-eastern US ecosystems. Int. J. Wildland Fire 2011, 20, 453–464. [Google Scholar]
- Cansler, C.A. Drivers of Burn Severity in the Northern Cascade Range, Washington, USA. M.S. Thesis, School of Forest Resources, University of Washington, Seattle, WA, USA; 2011. [Google Scholar]
- Tabor, R.W.; Crowder, D.F. Hiker’s Map of the North Cascades: Routes and Rocks in the Mt. Challenger Quadrangle; The Mountaineers: Seattle, WA, USA, 1968. [Google Scholar]
- Lentile, L.B.; Holden, Z.A.; Smith, A.M.S.; Falkowski, M.J.; Hudak, A.T.; Morgan, P.; Lewis, S.A.; Gessler, P.E.; Benson, N.C. Remote sensing techniques to assess active fire characteristics and post-fire effects. Int. J. Wildland Fire 2006, 15, 319–345. [Google Scholar]
- Keeley, J.E. Fire intensity, fire severity and burn severity: A brief review and suggested usage. Int. J. Wildland Fire 2009, 18, 116–126. [Google Scholar]
- Larson, A.J.; Franklin, J.F. Patterns of conifer tree regeneration following an autumn wildfire event in the western Oregon Cascade Range, USA. Forest Ecol. Manage 2005, 218, 25–36. [Google Scholar]
- López-Garcia, M.J.; Caselles, V. Mapping burns and natural reforestation using Thematic Mapper data. Geocarto Int 1991, 6, 31–37. [Google Scholar]
- US Geological Survey and the US Forest Service. Monitoring Trends in Burn Severity. Assessment of Fire Information; NPS-WANCP-C1LS-20060726. 2011. Available online: http://mtbs.gov/dataquery/individualfiredata.html (accessed on 28 November 2011).
- Roy, D.P.; Boschetti, L.; Trigg, S.N. Remote Sensing of Fire Severity: Assessing the performance of the Normalized Burn Ratio. IEEE Geosci. Remote. Sens. Lett 2006, 3, 112–116. [Google Scholar]
- Hudak, A.T.; Morgan, P.; Bobbitt, M.J.; Smith, A.M.S.; Lewis, S.A.; Lentile, L.B.; Robichaud, P.R.; Clark, J.T.; McKinley, R.A. The relationship of multispectral satellite imagery to immediate fire effects. Fire Ecol 2007, 3, 64–90. [Google Scholar]
- Brewer, C.K.; Winne, J.C.; Redmond, R.L.; Opitz, D.W.; Mangrich, M.V. Classifying and mapping wildfire severity: A comparison of methods. Photogramm. Eng. Remote Sensing 2005, 71, 1311–1320. [Google Scholar]
- Kushla, J.D.; Ripple, W.J. Assessing wildfire effects with Landsat thematic mapper data. Int. J. Remote Sens 1998, 19, 2493–2507. [Google Scholar]
- Lentile, L.B.; Smith, A.M.S.; Hudak, A.T.; Morgan, P.; Bobbitt, M.J.; Lewis, S.A.; Robichaud, P.R. Remote sensing for prediction of 1-year post-fire ecosystem condition. Int. J. Wildland Fire 2009, 18, 594–608. [Google Scholar]
- van Wagtendonk, J.W.; Root, R.R.; Key, C.H. Comparison of AVIRIS and Landsat ETM+ detection capabilities for burn severity. Remote Sens. Environ 2004, 92, 397–408. [Google Scholar]
- Eidenshink, J.; Schwind, B.; Brewer, K.; Zhu, Z.; Quayle, B.; Howard, S. A project for monitoring trends in burn severity. Fire Ecol 2007, 3, 3–21. [Google Scholar]
- Monitoring Trends in Burn Severity. What’s New: Monitoring Trends in Burn Severity (MTBS). 2011. Available online: http://www.mtbs.gov/whatisnew.html (accessed on 1 June 2011).
- Kasischke, E.S.; Turetsky, M.R.; Ottmar, R.D.; French, N.H.F.; Hoy, E.E.; Kane, E.S. Evaluation of the composite burn index for assessing fire severity in Alaskan black spruce forests. Int. J. Wildland Fire 2008, 17, 515–526. [Google Scholar]
- Veraverbeke, S.; Verstraeten, W.W.; Lhermitte, S.; Goossens, R. Evaluating Landsat Thematic Mapper spectral indices for estimating burn severity of the 2007 Peloponnese wildfires in Greece. Int. J. Wildland Fire 2010, 19, 558–569. [Google Scholar] [Green Version]
- Newcomer, M.; Delgado, D.; Gantenbein, C.; Wang, T.; Prichard, S.; Schmidt, C.; Skiles, J.W. Burn Severity Assessment in the Okanogan-Wenatchee Forest Using NASA Satellite Missions. Proceedings of the ASPRS Annual Conference, Baltimore MD, USA, 9–13 March 2009; 1.
- Agee, J.K.; Pickford, S.G. Vegetation and Fuel Mapping of North Cascades National Park Service Complex; National Park Service, Cooperative Park Studies Unit, College of Forest Resources, University of Washington: Seattle, WA, USA, 1985. [Google Scholar]
- Franklin, J.F.; Dyrness, C.T. Natural Vegetation of Oregon and Washington, 2nd ed.; Oregon State University Press: Corvallis, OR, USA, 1988. [Google Scholar]
- Agee, J.K. Fire Ecology of Pacific Northwest Forests, 1st ed; Washington, DC, USA, 1993. [Google Scholar]
- Fahnestock, G.R. Fires, Fuel, and Flora as Factors in Wilderness Management: The Pasayten Case. Proceedings of 15th Tall Timbers Fire Ecology Conference: Pacific Northwest, Portland, OR, USA, 16–17 October 1974; 15, pp. 33–70.
- Prichard, S.J.; Peterson, D.L.; Jacobson, K. Fuel treatments reduce the severity of wildfire effects in dry mixed conifer forest, Washington, USA. Can. J. For. Res 2010, 40, 1615–1626. [Google Scholar]
- Lyons-Tinsley, C.; Peterson, D.L. Surface fuel treatments in young, regenerating stands affect wildfire severity in a mixed conifer forest, eastside Cascade Range, Washington, USA. In Forest Ecol. Manage; 2012; in press. [Google Scholar]
- PRISM Climate Group. United States Average Monthly or Annual Maximum Temperature, 1971–2000; Oregon State University: Corvallis, OR, USA, 2006. Available online: http://prism.oregonstate.edu (accessed on 9 June 2011).
- PRISM Climate Group. United States Average Monthly or Annual Minimum Temperature, 1971–2000; Oregon State University: Corvallis, OR, USA, 2006. Available online: http://prism.oregonstate.edu (accessed on 9 June 2011).
- PRISM Climate Group. United States Average Monthly or Annual Precipitation, 1971–2000; Oregon State University: Corvallis, OR, USA, 2006. Available online: http://prism.oregonstate.edu (accessed on 9 June 2011).
- Prichard, S.J. Tripod fire field data. Unpublished raw data. 2009. [Google Scholar]
- Monitoring Trends in Burn Severity. Individual Fire-Level Geospatial Data; RSAC, USFS: Salt Lake City, UT, USA, 2008. Available online: http://www.mtbs.gov/dataquery/individualfiredata.html (accessed on 1 March 2008).
- Kolden, C.A.; Weisberg, P.J. Assessing accuracy of manually-mapped wildfire perimeters in topographically dissected areas. Fire Ecol. 2007, 3, 22–31. [Google Scholar]
- Cocke, A.E.; Fulé, P.Z.; Crouse, J.E. Comparison of burn severity assessments using Differenced Normalized Burn Ratio and ground data. Int. J. Wildland Fire 2005, 14, 189–198. [Google Scholar]
- Dillon, G.K.; Holden, Z.A.; Morgan, P.; Crimmins, M.A.; Heyerdahl, E.K.; Luce, C. Both topography and climate affected forest and woodland burn severity in two broad regions of western US, 1984 to 2006. Ecosphere 2011, 2. art130. [Google Scholar]
- Lillesand, T.M.; Kiefer, R.W.; Chipman, J.W. Digital image interpertation and analysis. In Remote Sensing and Image Interpretation, 6th ed.; Chapter 7; John Wiley & Sons: Hoboken, NJ, USA, 2007; pp. 585–592. [Google Scholar]
- R Development Core Team. R: A Language and Environment for Statistical Computing; R Foundation for Statistical Computing: Vienna, Austria, 2010. Available online: http://www.R-project.org/ (accessed on 1 January 2008).
- Holden, Z.A.; Evans, J.S. Using fuzzy C-means and local autocorrelation to cluster satellite-inferred burn severity classes. Int. J. Wildland Fire 2010, 19, 853–860. [Google Scholar]
- Holden, Z.A.; Morgan, P.; Evans, J.S. A predictive model of burn severity based on 20-year satellite-inferred burn severity data in a large southwestern US wilderness area. For. Ecol. Manage 2009, 258, 2399–2406. [Google Scholar]
- Thode, A.E.; van Wagtendonk, J.W.; Miller, J.D.; Quinn, J.F. Quantifying the fire regime distributions for severity in Yosemite National Park, California, USA. Int. J. Wildland Fire 2011, 20, 223–239. [Google Scholar]
- Lutz, J.A.; Key, C.H.; Kolden, C.A.; Kane, J.T.; van Wagtendonk, J.W. Fire frequency, area burned, and severity: A quantitative approach to defining a normal fire year. Fire Ecol 2011, 7, 51–65. [Google Scholar]
- Duffy, P.A.; Epting, J.; Graham, J.M.; Rupp, T.S.; McGuire, A.D. Analysis of Alaskan burn severity patterns using remotely sensed data. Int. J. Wildland Fire 2007, 16, 277–284. [Google Scholar]
- Meigs, G.W.; Kennedy, R.E.; Cohen, W.B. A Landsat time series approach to characterize bark beetle and defoliator impacts on tree mortality and surface fuels in conifer forests. Remote Sens. Environ 2011, 115, 3707–3718. [Google Scholar]
Figure 1.
The four fires assessed in this study, labeled and outlined in black, are located in the northern Cascade Range of Washington, USA. The polygon within the Tripod fire is an area that burned approximately 30 years earlier, and was unburned by the fire.
Figure 1.
The four fires assessed in this study, labeled and outlined in black, are located in the northern Cascade Range of Washington, USA. The polygon within the Tripod fire is an area that burned approximately 30 years earlier, and was unburned by the fire.

Figure 2.
Regression models for the WCBI data set (n = 146) between (a) dNBR and CBI, (b) dNBR and WCBI, (c) RdNBR and CBI, and (d) RdNBR and WCBI. Using WCBI instead of CBI allowed for the use of a linear model, but a similar amount of variance was explained in all models.
Figure 2.
Regression models for the WCBI data set (n = 146) between (a) dNBR and CBI, (b) dNBR and WCBI, (c) RdNBR and CBI, and (d) RdNBR and WCBI. Using WCBI instead of CBI allowed for the use of a linear model, but a similar amount of variance was explained in all models.

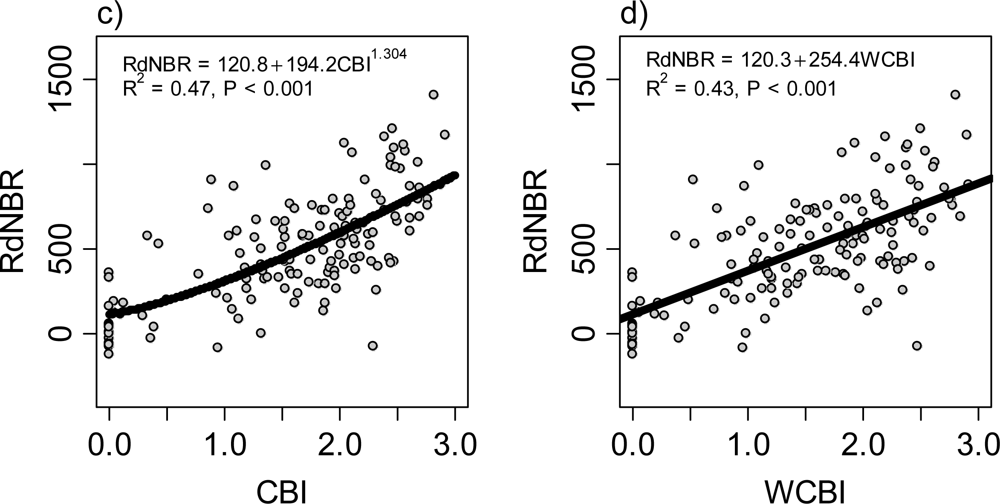
Figure 3.
Linear regression models for the GeoCBI data set (n = 52) from the two fires measured after the GeoCBI was published in 2008. Models are for (a) dNBR and CBI, (b) dNBR and WCBI, (c) dNBR and GeoCBI, (d) RdNBR and CBI, (e) RdNBR and WCBI, and (f) RdNBR and GeoCBI.
Figure 3.
Linear regression models for the GeoCBI data set (n = 52) from the two fires measured after the GeoCBI was published in 2008. Models are for (a) dNBR and CBI, (b) dNBR and WCBI, (c) dNBR and GeoCBI, (d) RdNBR and CBI, (e) RdNBR and WCBI, and (f) RdNBR and GeoCBI.

Figure 4.
Top: CBI and WCBI for (a) understory strata (substrates, herbs and low shrubs, tall shrubs), (b) overstory strata (intermediate trees, and dominant trees), and (c) the plot. Bottom: CBI and GeoCBI for (d) understory strata (substrates, herbs and low shrubs, tall shrubs), (e) overstory strata (intermediate trees, and dominant trees), and (f) the plot. Dashed lines shows theoretical CBI = WCBI, or CBI = GeoCBI.

Figure 5.
Regression models for (a) dNBR, and (b) RdNBR.
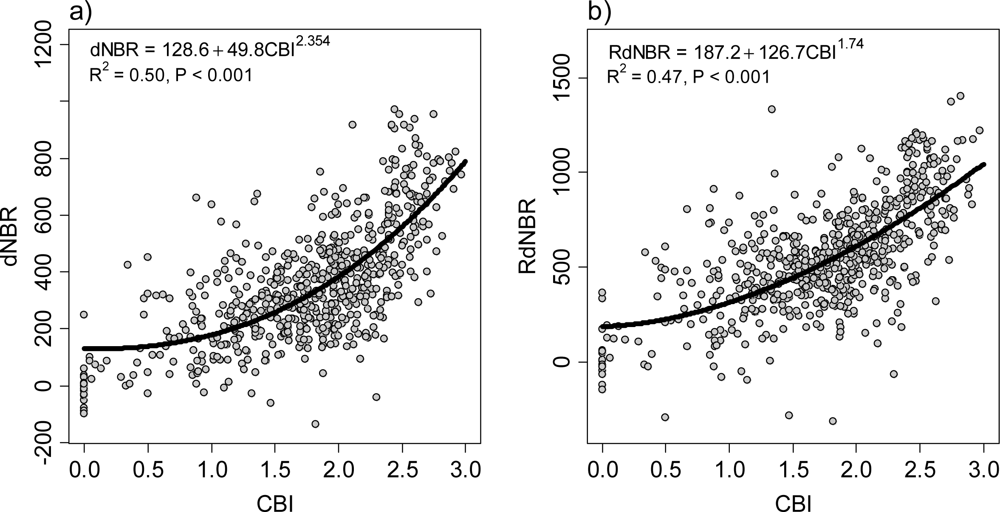
Figure 6.
The influence of each stratum’s WCBI score on the total plot WCBI score plotted against the influence of CBI score on the total plot CBI score. Strata that were not assessed (i.e., 0% cover) were excluded from this analysis. Dashed lines represent the mean CBI and WCBI influence. Comparison of the dashed lines shows that use of WCBI increased the influence of the substrates and herbs and low shrubs strata, and decreased the influence of tall shrubs, intermediate trees, and dominant trees.
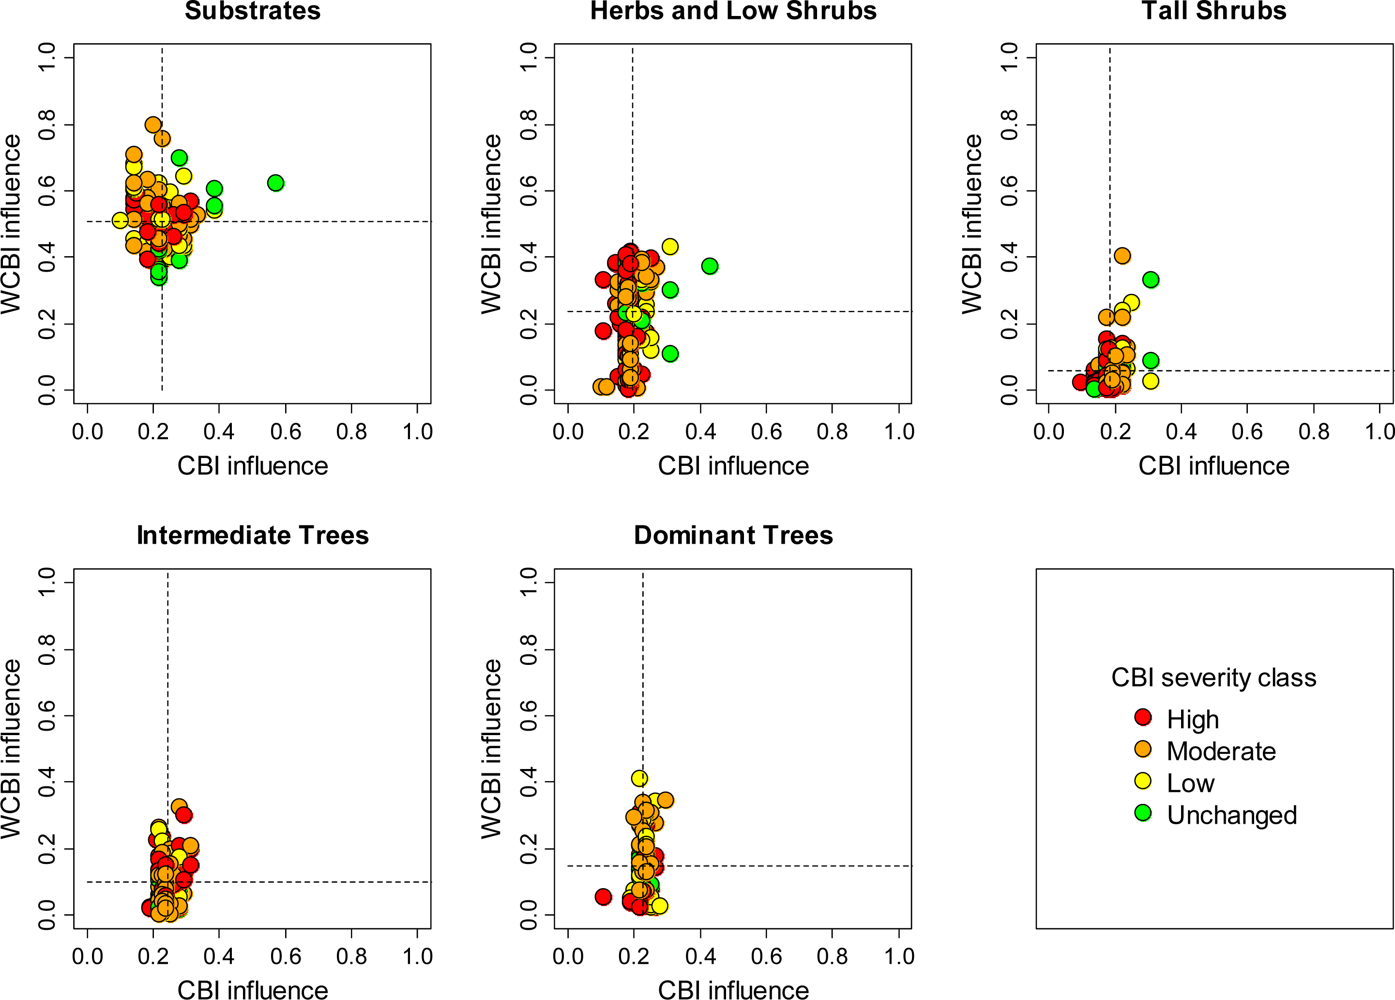
Figure 7.
Examples of (a,b) low, (c,d) moderate, and (e,f) high severity field plots. Plots on left (a,c,e) are example of plots with little differences between CBI and WCBI. Plots on right are examples of plots where the use of WCBI notably decreased (b,d) or increased (f) the estimate of field-based burn severity.


| Strata | Short Name | Number of Rating Factors |
|---|---|---|
| Substrates | Substrates | 5 |
| Herbs, low shrubs and trees <1m | Herbs and low shrubs | 4 |
| Tall shrubs and trees 1–5 m | Tall shrubs | 4 |
| Intermediate trees (subcanopy, pole-sized trees) | Intermediate trees | 5 |
| Big trees (upper canopy, dominant, codominant trees) | Dominant trees | 5 |
| Fire Name | Fire Year | Fire Size (ha) | Elevation (m) | Mean Annual Precip. (mm) | Mean July Max. Temp. (°C) | Mean Jan. Min. Temp. (°C) |
|---|---|---|---|---|---|---|
| Flick Creek | 2006 | 2,856 | 335–2,186 | 750–1,709 | 15–29 | −11–−6 |
| Tripod | 2006 | 70,753 | 1,179–2,307 | 426–939 | 15–27 | −14–−8 |
| Arctic | 2008 | 35 | 1,364–1,810 | 2,387 | 18 | −8 |
| Camel Humps | 2008 | 53 | 1,608–1,917 | 1,757 | 19 | −8 |
| Fire Name | Fire Year | Data Collected | CBI Plots (WCBI, GeoCBI)* | Forest Plots | Total |
|---|---|---|---|---|---|
| Flick Creek | 2006 | 2007 | 100 (39, 0) | 0 | 100 |
| Tripod | 2006 | 2007 | 0 (0, 0) | 388 | 388 |
| 2008 | 43 (0, 0) | 0 | 43 | ||
| 2009 | 56 (55, 0) | 0 | 56 | ||
| Arctic | 2008 | 2009 | 24 (24, 24) | 0 | 24 |
| Camel Humps | 2008 | 2009 | 28 (28, 28) | 0 | 28 |
| Total | 251 (146, 52) | 388 | 639 | ||
*WCBI and GeoCBI were implemented on subsets of the CBI plots.
| CBI Score | 3 | 2.5 | 2 | 1.5 | 1 | 0.5 |
|---|---|---|---|---|---|---|
| Substrates | ||||||
| Substrate burn severity index | >5 | >4 | >3 | >2 | >1.67 | >1 |
| Overstory (intermediate and dominant) trees | ||||||
| Canopy scorch percent | >95 | >70 | >30 | >10 | >5 | >0 |
| Percent tree mortality | 100 | >69 | >49 | >29 | >9 | >0 |
| Maximum char height (meters) | >7 | >5.4 | >3.9 | >2.9 | >1.8 | >0.9 |
| Fire | Year | Landsat Path/Row | Pre-Fire Image Date | Post-Fire Image Date | Sensor |
|---|---|---|---|---|---|
| Flick Creek | 2006 | 46/26 | 8/7/2005 | 7/28/2007 | Landsat 5 TM |
| Tripod Complex | 2006 | 46/26 | 8/7/2005 | 7/28/2007 | Landsat 5 TM |
| Arctic Creek | 2008 | 46/26 | 9/2/2006 | 9/10/2009 | Landsat 5 TM |
| Camel Humps | 2008 | 46/26 | 9/2/2006 | 9/10/2009 | Landsat 5 TM |
Table 6.
CBI severity category definitions *.
| Severity Category | CBI Values | Description |
|---|---|---|
| Unchanged | 0–0.1 | One year after the fire the area was indistinguishable from pre-fire conditions. This does not always indicate the area did not burn. |
| Low | 0.1–1.24 | Areas of surface fire occurred with little change in cover and little mortality of the structurally dominant vegetation. |
| Moderate | 1.25–2.24 | The area exhibits a mixture of effects ranging from unchanged to high severity within the scale of one pixel (30 m2). |
| High | 2.25–3.0 | Vegetation has high to 100% mortality. |
*CBI severity category definitions follow Miller and Thode [1].
| Field Index | Remotely Sensed Index | Number of Plots | R2 | Overall Accuracy | Kappa |
|---|---|---|---|---|---|
| CBI | dNBR | 146 | 0.53 | 63 | 0.459 |
| WCBI | dNBR | 146 | 0.47 | 55 | 0.368 |
| CBI | dNBR | 52 | 0.44 | 56 | 0.417 |
| WCBI | dNBR | 52 | 0.38 | 40 | 0.205 |
| GeoCBI | dNBR | 52 | 0.40 | 42 | 0.227 |
| CBI | RdNBR | 146 | 0.47 | 55 | 0.371 |
| WCBI | RdNBR | 146 | 0.43 | 51 | 0.323 |
| CBI | RdNBR | 52 | 0.60 | 56 | 0.378 |
| WCBI | RdNBR | 52 | 0.59 | 58 | 0.409 |
| GeoCBI | RdNBR | 52 | 0.60 | 52 | 0.336 |
| Field Data Type | CBI | WCBI | CBI | WCBI | GeoCBI | ||
|---|---|---|---|---|---|---|---|
| Number of Plots | 146 | 146 | 52 | 52 | 52 | ||
| dNBR | Producer’s accuracy | Unch. | 75 | 80 | 91 | 91 | 91 |
| Low | 39 | 47 | 45 | 20 | 27 | ||
| Mod. | 66 | 52 | 42 | 32 | 33 | ||
| High | 68 | 58 | 67 | 29 | 25 | ||
| User’s accuracy | Unch. | 63 | 63 | 77 | 67 | 71 | |
| Low | 35 | 46 | 42 | 25 | 36 | ||
| Mod. | 72 | 60 | 83 | 46 | 40 | ||
| High | 68 | 53 | 27 | 17 | 17 | ||
| RdNBR | Producer’s accuracy | Unch. | 75 | 73 | 73 | 82 | 73 |
| Low | 39 | 50 | 36 | 27 | 27 | ||
| Mod. | 50 | 42 | 58 | 74 | 67 | ||
| High | 68 | 58 | 50 | 43 | 38 | ||
| User’s accuracy | Unch. | 63 | 55 | 73 | 75 | 73 | |
| Low | 27 | 43 | 36 | 40 | 36 | ||
| Mod. | 69 | 61 | 70 | 61 | 55 | ||
| High | 58 | 46 | 30 | 43 | 38 | ||
| Overall Accuracy = 59.0 | Kappa = 0.361 | |||||
|---|---|---|---|---|---|---|
| Unchanged | Low | Moderate | High | Total | User’s Accuracy | |
| Unchanged | 24 | 34 | 16 | 1 | 75 | 32.0 |
| Low | 0 | 26 | 64 | 3 | 93 | 28.0 |
| Moderate | 1 | 42 | 224 | 40 | 307 | 73.0 |
| High | 0 | 5 | 56 | 103 | 164 | 62.8 |
| Total | 25 | 107 | 360 | 147 | 639 | |
| Producer’s Accuracy | 96.0 | 24.3 | 62.2 | 70.1 | ||
| Overall Accuracy = 61.7 | Kappa = 0.398 | |||||
|---|---|---|---|---|---|---|
| Unchanged | Low | Moderate | High | Total | User’s Accuracy | |
| Unchanged | 22 | 24 | 14 | 2 | 62 | 35.5 |
| Low | 3 | 32 | 56 | 4 | 95 | 33.7 |
| Moderate | 0 | 42 | 233 | 34 | 309 | 75.4 |
| High | 0 | 9 | 57 | 107 | 173 | 61.8 |
| Total | 25 | 107 | 360 | 147 | 639 | |
| Producer’s Accuracy | 88.0 | 29.9 | 64.7 | 72.8 | ||
Table 11.
Strata CBI scores and FCOV corresponding with plot photos from Figure 5. Plot CBI, WCBI, and GeoCBI are also shown.
| Severity | Low | Moderate | High | ||||
|---|---|---|---|---|---|---|---|
| Change from CBI to WCBI | Low | High | Low | High | Low | High | |
| Photo (Figure 5) | A | B | C | D | E | F | |
| CBI | Substrates | 0.20 | 0.55 | 2.00 | 2.60 | 2.40 | 2.70 |
| Herbs | 0.19 | 0.81 | 1.94 | 2.38 | 2.56 | 2.63 | |
| Tall shrubs | 0.31 | 1.38 | 1.94 | 0.25 | 2.50 | 2.25 | |
| Intermediate trees | 0.45 | 2.00 | 2.10 | 2.75 | 2.30 | 2.35 | |
| Dominant trees | NA | NA | 2.35 | 2.63 | 2.30 | NA | |
| FCOV | Substrates | 1.00 | 1.00 | 1.00 | 1.00 | 1.00 | 1.00 |
| Herbs | 0.35 | 0.65 | 0.25 | 0.85 | 0.80 | 0.65 | |
| Tall shrubs | 0.55 | 0.20 | 0.40 | 0.05 | 0.03 | 0.20 | |
| Intermediate trees | 0.40 | 0.20 | 0.05 | 0.05 | 0.10 | 0.10 | |
| Dominant trees | 0.00 | 0.00 | 0.12 | 0.08 | 0.15 | 0.00 | |
| CBI | 0.29 | 1.19 | 2.08 | 2.14 | 2.40 | 2.49 | |
| WCBI | 0.27 | 0.86 | 2.00 | 2.45 | 2.45 | 2.61 | |
| GeoCBI | 0.27 | 0.83 | 2.02 | 2.41 | 2.47 | 2.60 | |
Table 12.
Classification results for the northern Cascade Range compared to other studies in coniferous forest in North America that use CBI to classify dNBR and RdNBR.
| Study | Index | Location | Number of Plots | Number of Fires | Overall Accuracy | Kappa | R2 |
|---|---|---|---|---|---|---|---|
| Cocke et al. [45] | dNBR | Coconino National Forest, AZ, USA | 92 | 1 | 72.8 | 0.619 | 0.84 |
| Miller and Thode [1] | dNBR | Sierra Nevada, CA, USA | 741 | 14 | 58.7 | 0.41 | 0.49 |
| Holden and Evans [49] | dNBR | Grand Tetons National Park, WY | 53 | 1 | 48 | 0.41 | 0.66 |
| Holden and Evans [49] | dNBR | Yellowstone National Park, WY | 41 | 1 | 59 | 0.41 | 0.64 |
| Holden and Evans [49] | dNBR | Gila National Forest, NM | 55 | 1 | 71 | 0.58 | 0.81 |
| Soverel et al. [12] | dNBR | Canadian Rockies, Canada | 110 | 3 | 62.4 | 0.38 | 0.69 |
| Soverel et al. [12] | dNBR | Western boreal forests, Canada | 125 | 3 | 70.3 | 0.50 | 0.70 |
| This study | dNBR | Northern Cascade Range, WA, USA | 639 | 4 | 59.0 | 0.36 | 0.50 |
| Miller and Thode [1] | RdNBR | Sierra Nevada, CA, USA | 741 | 14 | 59.8 | 0.41 | 0.61 |
| Miller et al. [2] | RdNBR | Sierra Nevada and Klamath, CA, USA | 295 | 25 | -- | 0.46 | 0.68 |
| Soverel et al. [12] | RdNBR | Canadian Rockies, Canada | 110 | 3 | 68.2 | 0.52 | 0.71 |
| Soverel et al. [12] | RdNBR | Western boreal forests, Canada | 125 | 3 | 60.3 | 0.37 | 0.7 |
| This study | RdNBR | Northern Cascade Range, WA, USA | 639 | 4 | 61.7 | 0.40 | 0.47 |
Table 13.
Severity class thresholds for the northern Cascade Range compared to those of other studies in conifer forests of North America that used CBI to classify dNBR and RdNBR using data from one year after fire.
| Study | Index | Location | Remotely Sensed Class Thresholds* | ||
|---|---|---|---|---|---|
| Unchanged-Low | Low-Moderate | Moderate-High | |||
| Key and Benson [3] | dNBR | Glacier National Park, MT, USA | 100 | 270 | 440 |
| Miller and Thode [1] | dNBR | Sierra Nevada, CA, USA | 41 | 177 | 367 |
| Hall et al. [11] | dNBR | Boreal forests, Canada | 41 | 284 | 514 |
| Holden and Evans [49] | dNBR | Grand Teton National Park, WY, USA | −35 | 276 | 556 |
| Holden and Evans [49] | dNBR | Yellowstone National Park, WY, USA | 195 | 333 | 575 |
| Holden and Evans [49] | dNBR | Gila National Forest, NM, USA | 34 | 130 | 434 |
| Soverel et al. [12] | dNBR | Canadian Rockies, Canada | NA | 311 | 568 |
| This study | dNBR | Northern Cascade Range, WA, USA | 106 | 218 | 456 |
| Miller and Thode [1] | RdNBR | Sierra Nevada, CA, USA | 69 | 316 | 641 |
| Holden et al. [50] | RdNBR | Gila national forest, NM, USA | NA | NA | 665 |
| Dillon et al. [46] | RdNBR | Grand Canyon National Park, AZ, USA | NA | NA | 695 |
| This study | RdNBR | Northern Cascade Range, WA, USA | 189 | 372 | 703 |
*The CBI class thresholds used to determine the remotely sensed class thresholds mostly follow those of Miller and Thode [1] (Table 6). Holden et al. [50] used a CBI value of 2.2 based on a 75% overstory mortality threshold or for the moderate-high class. Hall et al. [11] used CBI values of 0.3, 1.6, and 2.3 based on field observations. Key and Benson [3] did not specific associated CBI values, and instead used a 7 class system. Their “moderate-high” threshold shown here is for their moderate-low and moderate-high severity classes; their dNBR threshold between the moderate-high and very high severity classes was 600.
Share and Cite
MDPI and ACS Style
Cansler, C.A.; McKenzie, D. How Robust Are Burn Severity Indices When Applied in a New Region? Evaluation of Alternate Field-Based and Remote-Sensing Methods. Remote Sens. 2012, 4, 456-483. https://doi.org/10.3390/rs4020456
AMA Style
Cansler CA, McKenzie D. How Robust Are Burn Severity Indices When Applied in a New Region? Evaluation of Alternate Field-Based and Remote-Sensing Methods. Remote Sensing. 2012; 4(2):456-483. https://doi.org/10.3390/rs4020456
Chicago/Turabian StyleCansler, C. Alina, and Donald McKenzie. 2012. "How Robust Are Burn Severity Indices When Applied in a New Region? Evaluation of Alternate Field-Based and Remote-Sensing Methods" Remote Sensing 4, no. 2: 456-483. https://doi.org/10.3390/rs4020456