1. Introduction
Remote sensing data are valuable sources for environmental monitoring. They can be utilized in various phases of an environmental hazard from prediction and early monitoring [
1,
2], to management and damage assessment [
3,
4]. From the numerous advantages that remote sensing techniques offer for dealing with natural phenomena, the ability to analyze large geographic areas in a short period of time is especially appealing. In order to have a better perception of natural phenomena and make correct management decisions, it is vital to detect changes accurately and in a timely fashion [
5]. In contrast, fieldwork requires significant effort and time and, in cases of extreme environmental events, it may not be feasible (e.g., limited accessibility or hazardous conditions).
In the United States, one of most destructive natural phenomena in the last decade was Hurricane Katrina (23–30 August 2005), with most of the damage concentrated in New Orleans, LA, USA. Katrina was a strong tropical hurricane, with category 5 intensity over the central Gulf of Mexico [
6]. Wind speed reached 350 km/h when Katrina attained its peak on 28 August [
7]. Katrina caused 1,118 fatalities in Louisiana [
7] and, according to Knabb
et al.[
6], was the costliest and one of the five deadliest hurricanes ever to strike the United States. It was responsible for at least $108 billion of property damage [
8]. The majority of the problems were in New Orleans, where storm surges of up to 19 ft caused levee failure and substantial flooding.
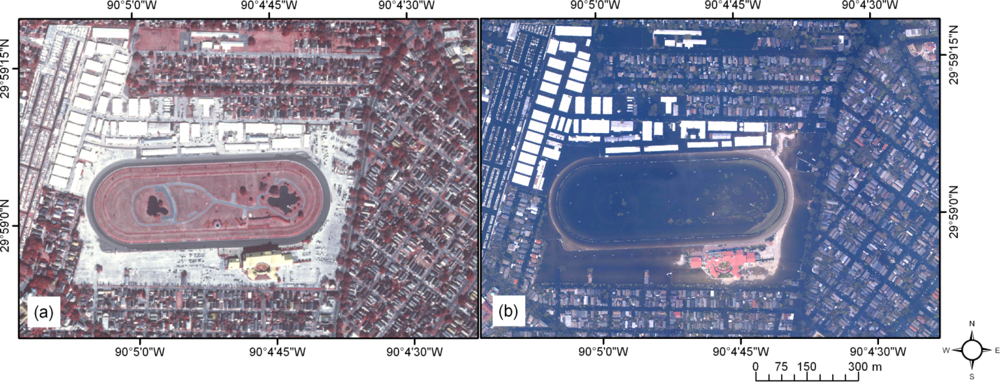
Figure 1 shows two high resolution aerial images of the Fair Grounds Race Course and Slots and its vicinity before (a) and after (b) the hurricane.
Several works have revealed that African Americans were affected by hurricane Katrina more than whites in New Orleans [
9,
10]. Sharkey [
11] shows that the elderly population and African Americans felt the impact of the storm more than other races and classes. This research reports that Katrina took its largest toll and had the highest number of missing people in African American communities. Fussell
et al.[
12] claims that African Americans delayed to return to the city because they lived in areas that experienced more housing damage due to more severe flooding. Moreover, White
et al.[
13] took advantage of public polls to illustrate that African Americans experienced feelings of anger and depression related to the hurricane more than whites did. The objective of this paper is to investigate the effect of decisions associated with the image classification process, such as location of reference samples and selection of classification algorithm, in the flooding estimation and subsequent social analysis, such as the disproportional African-American hardship.
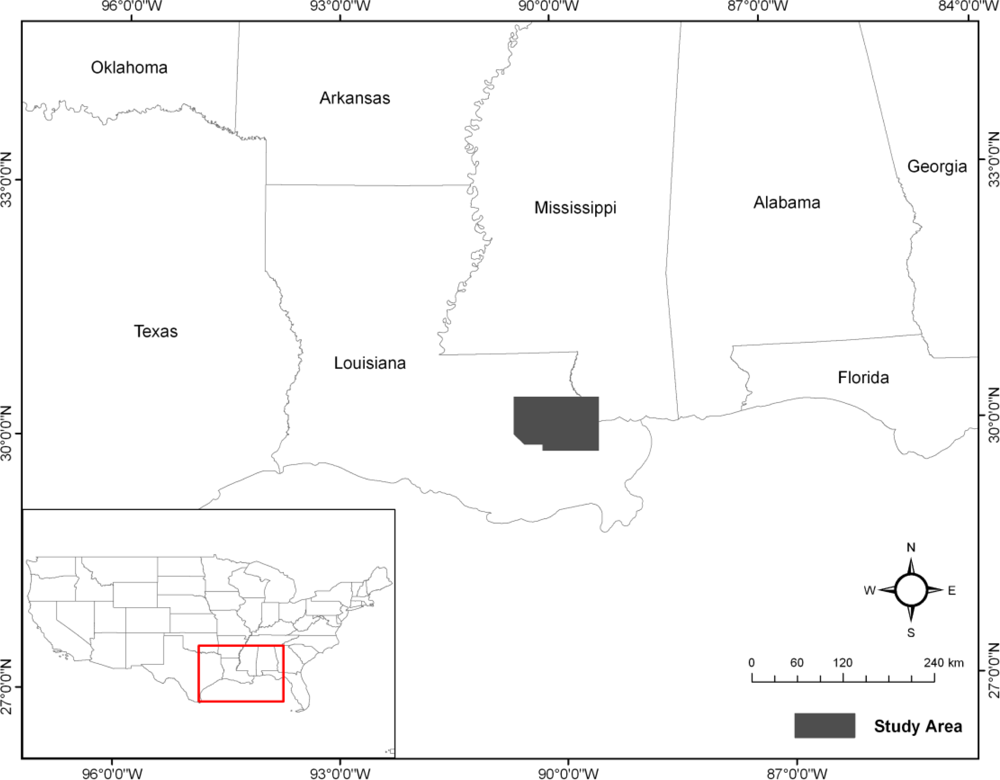
2. Study Area and Datasets
The study area included the city of New Orleans and the surrounding area of Lake Pontchartrain (
Figure 2). New Orleans is located in the state of Louisiana, approximately 90 km north of the Gulf of Mexico and right below Lake Pontchartrain. The Mississippi River crosses the city before reaching Gulf of Mexico and the Atlantic Ocean. The area of the city and its suburbs is approximately 350 square miles and, according to census data of the National Historical Geographic Information System (NHGIS), approximately 1,000,000 people used to live in this area in 2000.
Landsat images are frequently used for land cover change detection (e.g., [
14,
15]). Two Landsat 5 images were used to investigate flooding effects over the study area. One from 22 August 2005 and another from 7 September 2005.
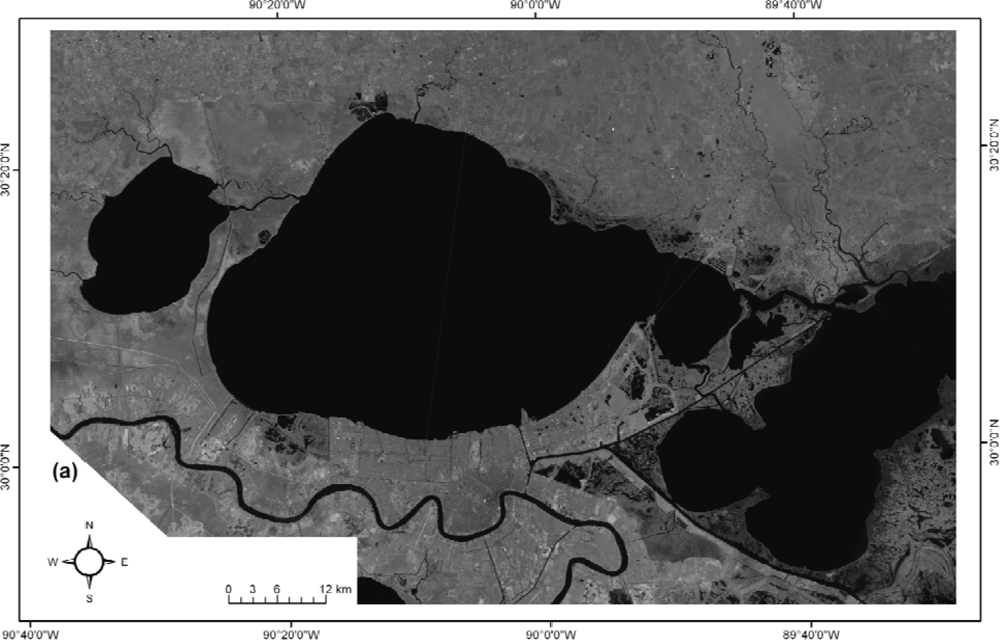
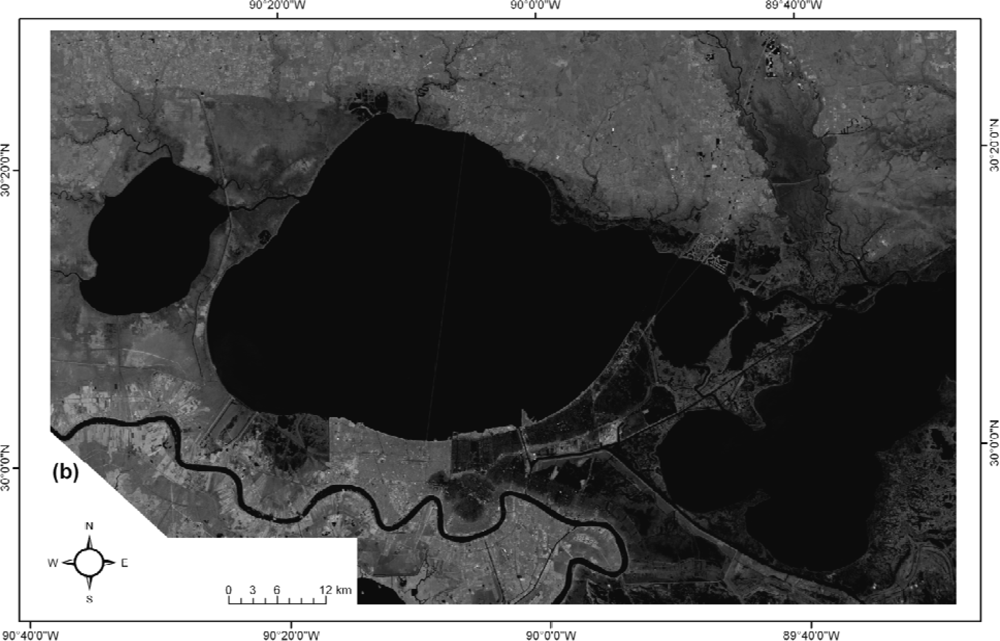
Figure 3 illustrates these two Landsat images using the near infrared band, where water appears darker. The majority of the flooding is concentrated on the southeastern and western image parts. Darker tones in these regions suggest flooding and using the scale bar as a guide, one may start to comprehend the magnitude of the flooding. Since some regions at the southwest portion of our study area were covered with clouds, either on the before or after Katrina image, the shape of the cropped image is irregular.
In order to assess image classification accuracy, two different datasets of high-resolution aerial photography were used. The first dataset, used for pre-Katrina image classification, is the Digital Orthophoto Quarter Quadrangle (DOQQ) 2004. DOQQ 2004 photographs supplied courtesy of “Atlas: The Louisiana Statewide GIS”. These digital orthophotographs, taken in 2004, are color infrared with 1-m pixel size.
Figure 1(a) displays one sample of DOQQ 2004 photographs. The second high-resolution reference dataset, used for post-Katrina image classification, is a set of natural color aerial photographs captured on 16 September 2005, almost two weeks after the Katrina hurricane. It has a pixel size of 0.3 m. These photographs were supplied courtesy of National Oceanic and Atmospheric Administration (NOAA).
Figure 1(b) shows a sample of NOAA photographs.
In addition to high-resolution photographs for remote sensing image classification, census data were used to investigate the effects of Katrina in racial groups. In our research, we took advantage of census data from the year 2000, using demographic data at the census tract geographic level. Tract level data were used instead of the finer block level to limit the effect of misclassifications at the 30 m Landsat pixel size. There was also a five-year temporal difference between the census and the image data, however this was not deemed a significant drawback for our comparative study type. The census dataset was provided by the National Historical Geographic Information System (NHGIS).
3. Experimental Design
Remote sensing change detection techniques are frequently used to study the dynamic nature of the earth’s surface [
16–
18]. In this research, to determine Katrina effects on the study area, we made use of a change detection approach called post-classification comparison [
19–
21]. In post-classification comparison, two images from the same area but captured at different dates are classified separately. Then, land cover of each pixel for two dates is compared and changed pixels are determined. Post-classification comparison is applied frequently because of its high accuracy [
22]. Mas [
23] provides evidence that post-classification comparison is more accurate than many other methods in land cover change detection, such as image differencing, vegetative index differencing, selective principal components analysis, and direct multi-date unsupervised classification, especially for Landsat Images. The other important advantage of post-classification comparison is that it can indicate the source of changes.
The two Landsat 5 images of before and after hurricane were classified. The inputs to each classifier were the six 30 m Landsat bands. The classifier outputs were four major land cover land use (LCLU) classes: “Water,” “Urban,” “Vegetation,” and “Soil/Agricultural.” Two supervised classification algorithms were used to create and compare LCLU maps. Representing a simple algorithm that is easy to train and apply the first choice was a Maximum Likelihood (ML) classifier [
24]. The second algorithm was a Neural Network (NN) classifier [
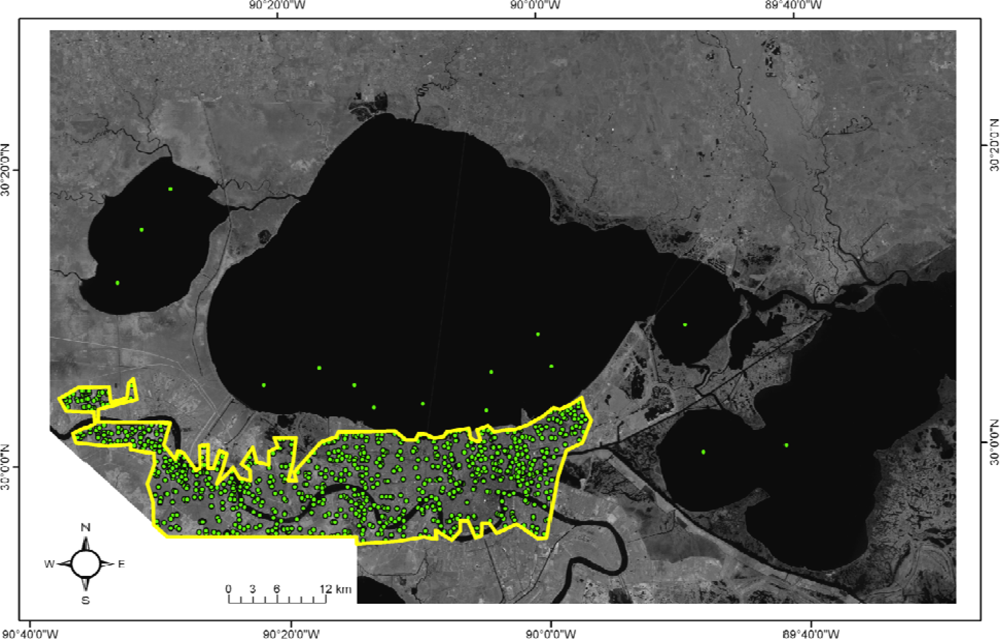
25], a significantly more complex method than the ML, but with significant accuracy improvement potential. During the classification process, the same 1,000 points were digitized from each image using the aerial photographs previously discussed. The reference dataset contained 200 points per class that did not change (800 total) and 200 points that changed from a non-water class to water. We should note that for the changed (flooded) pixels the majority came from the urban class, a small amount from the vegetation and a negligible number from the soil class. These ratios were kept to reflect the actual image change. For calibration and validation purposes, all the above datasets were split in half while keeping the relative category proportions the same. The reference points are mostly collected from the southern parts of Lake Pontchartrain reflecting the more urbanized parts of the image (
Figure 4). The classification algorithms were implemented using ENVI software. The NN classifier was a backpropagation network with one hidden layer. All activation functions were logistic and the best result after 1,000 iterations was reported. The ML classifier was a typical implementation with no probability thresholds incorporated. Four classified maps were produced for the two snapshots and two classification algorithms.
4. Accuracy Assessment and Flooding Estimation Results
The ML and NN classifiers were first assessed using the reference information to detect statistical differences in their accuracy performance. In addition, an investigation took place to compare flooding estimation of the two algorithms within and outside the reference sample area.
4.1. Statistical Assessment within the Reference Sample Area
The validation dataset described in Section 3 was used to assess the accuracy of the classified maps. This dataset includes half of the reference points and has not contributed in the classification process. Remote sensing classification results and their accuracies are examined for both individual maps and change maps.
4.1.1. Individual Map Assessment
For each of the two classifiers two classification maps were produced using the before and after Katrina Landsat imagery.
Tables 1 to
4 show the error matrices for the four classified maps. The results indicate that the Neural Network classifier resulted in higher classification accuracy than the Maximum Likelihood classifier, an expected result due to its advanced modeling capabilities. It should be noted though that for the water class, the class of primary interest for this study, the producer’s and user’s accuracy were similar among the NN and the ML classifiers.
4.1.2. Change Map Assessment
Change products were created for each of the two classifiers. The individual time maps had four classes, so an exhaustive combination of classes would have led to 16 cases for the change maps. Since our primary interest is water changes, the produced change maps were limited to five classes of interest: the three flooding cases (Soil/Agriculture to Water, Vegetation to Water, and Urban to Water), the unchanged Water class, and the remaining combinations in a separate class (Other).
In order to evaluate the accuracy of the two classifiers in detecting flooded areas, the same validation dataset that was used for accuracy assessment of individual maps was incorporated by creating two change classes: “Changed to Water” and “Not Changed to Water.”
Tables 5 and
6 show error matrices for Maximum Likelihood and Neural Network classifiers binary maps, respectively.
4.2. Flooding Estimation Comparisons
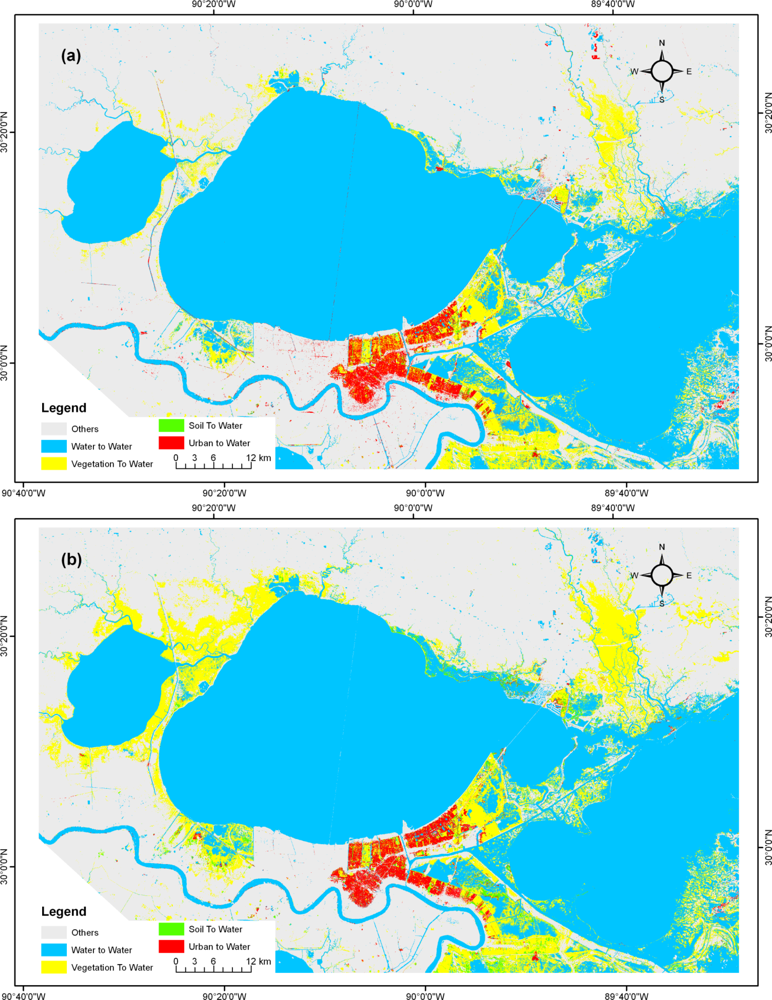
Figure 5 illustrates the change maps generated from the Maximum Likelihood (ML) classifier (a) and from the Neural Network (NN) classifier (b). A significant part of the city and its suburbs is flooded, especially parts close to the levee failure. Comparing the two change maps, a significantly larger amount of “Vegetation to Water” pixels can be identified in the north-west and north-east of Lake Pontchartrain in NN (b) than ML (a) classifiers. Minor differences exist in the “Urban to Water” class.
To investigate further the effects of the classification design to the quantity of flooding, the two classification algorithms were compared inside and outside the reference sample area (see
Figure 4 for area outline).
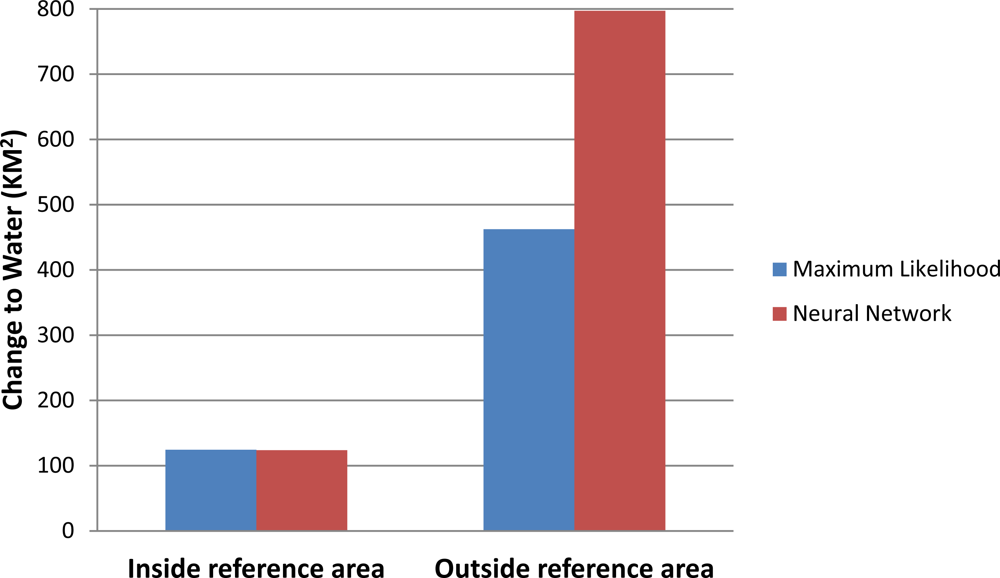
Figure 6 depicts the total “Change to Water” estimation for the two classifiers. There is a clear agreement inside the reference sample area, with the ML classifier estimating 124.4 km
2 and the NN classifier 123.7 km
2. Outside the reference sample area, however, there are significant differences with the ML predicting 462.5 km
2 and the NN identifying 797.2 km
2 as flooded, almost twice the amount. To put the estimation variability in perspective, the Manhattan land area in New York is approximately 60 km
2. This is an important finding as it suggests that reference data collection in conjunction with algorithmic selection could introduce a strong bias in the obtained results. It is also a surprising (and potentially problematic) result as the high change accuracy (95–96%) for both methods would suggest an expectation for similar results.
5. Algorithmic Effect on Racial Distribution of Urban Flooding
Flooding estimations from hurricane Katrina were incorporated in a wide range of applications, from emergency responders to social scientists. In our work, we considered the previously studied disproportionate effect of Katrina on African Americans and investigated whether image classification decisions could potentially alter the results of these social studies.
Demographic data from the year 2000 at the census tract geographic level were utilized. The extent of study area for racial effects was limited to the metropolitan area of New Orleans city that was smaller than that of change detection analysis.
Figure 6 represents the population density map. It is important to note that only populated tracts contributed to racial analysis using a threshold of 1,000 people per square mile [
26]. Tracts in gray color in
Figure 7 were below the density threshold and were not included in the racial analysis. The percent of urban loss (pixels switching from the urban to the water class) for each tract was calculated using the classified maps of before and after Katrina for each tract. In addition, the percent of African-American residents of each tract was extracted from the demographic dataset.
Figure 8 depicts the spatial relationship between percent urban loss and percent of African-American residents using the NN classifier result. There is a positive spatial correlation between tracts of high urban loss and African Americans, especially at the upper right and center of the map. On the other hand, many highly populated tracts (see
Figure 7) at the upper left side of the map with low percentage of African Americans were not significantly flooded.
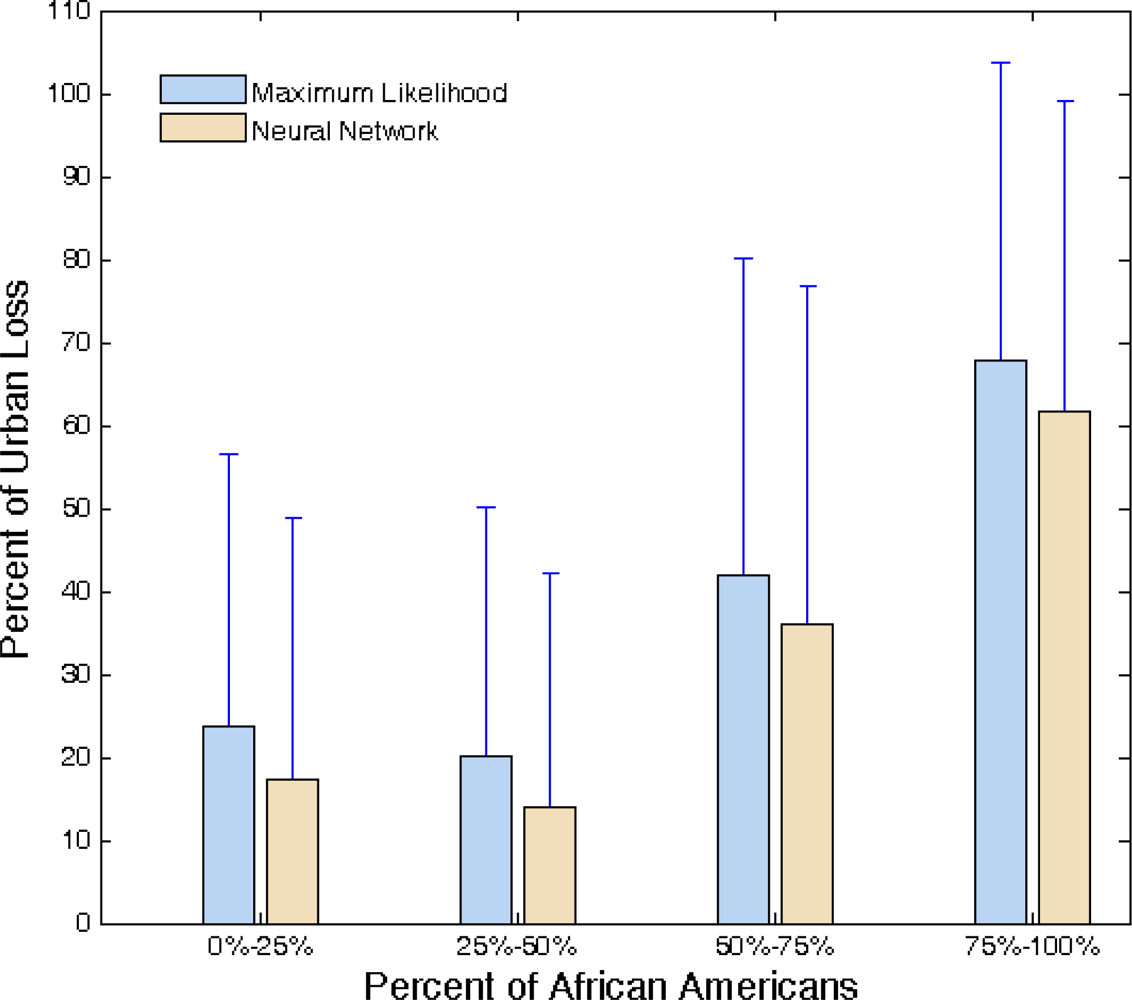
To investigate further,
Figure 8 illustrates the relationship between urban loss and percent of African-American residents. In this chart, tracts are grouped into different bins based on 25% quartiles of African Americans. Bars represent mean value of urban loss for each bin. Moreover, standard deviation of tracts’ urban loss for each bin is depicted. The ML method estimates higher urban loss but the strong positive correlation between percent of African Americans and urban loss is evident for both classifiers. The similarities between both classifiers could probably be attributed to the significant geographic overlap between the reference sample area and the selected tracts.
Statistical tests are also conducted to see if differences among the mean value of urban loss of categories in
Figure 8 are significant. A pairwise t-test is selected over conducting analysis of variance (ANOVA) because the percent of African Americans is an observation and not a treatment factor which is categorized arbitrarily.
Table 7 presents p-values of two tailed t-tests for all combinations of the four groupings for African-American concentration. The null hypothesis is equality of mean urban loss, and alternative hypothesis is inequality of them. Values above and below the main diagonal represent p-values for ML and NN classification outputs, respectively. Results verify that the differences in urban loss due to flooding are statistically different among different African-American concentration groupings. They also show that both algorithms would lead to similar statistical conclusions.
6. Discussion
An important question related to environmental disasters is quantity, spatial extent, and internal spatial distribution of their impacts. In some cases, a timely response is critical, which in combination with accessibility issues on the ground, propel remote sensing as an efficient, if not the only, monitoring method. This paper adds to the already wide collection of remote sensing applications with the addition of presenting linkages to classification setup decisions.
In terms of remote sensing techniques, numerous classifiers can be used to create land cover and land use maps. The discrepancies among various classifiers can be significant based on research question types and accuracy expectations. Furthermore, user expertise and software availability may differ, suggesting that advanced classification methods may not always be implementable. In this research, a simple classifier (Maximum Likelihood) and a fairly complex classifier (Neural Network) are incorporated to obtain an estimate on the impact of the classification algorithm on results. Despite substantial accuracy differences between ML and NN on single image classification, both classifiers were considered statistically accurate for the specific task, water detection. Racial analysis on the change products also suggested high consistency between the two classifiers, mostly attributed to the high overlap between the reference data locations and the census tracts.
However, caution should be exercised for parts of the imagery that are not well represented in the reference dataset. As our experiments have shown, large discrepancies may appear despite reassuring statistical evaluations in the training/validation process. For example, the ML classifier significantly underestimated flooding in the entire study area compared to the NN method, yet for the racial study, the ML method provided higher flooding than the NN. In cases where reference data may be acquired over the entire study area, it is suggested that a geographically stratified sampling scheme is implemented. There are, however, cases where reference data may not be available or will be too time consuming to acquire due to the urgency of product delivery. In those cases, a potential solution would be the implementation of multiple classifiers to ensure no major differentiation in obtained results. Users should also evaluate algorithmic complexity with respect to the training sample size. A well-known limitation of machine learning algorithms is that as algorithmic complexity increases, so does the tendency to overgeneralize (i.e., identify patterns where they may not exist). A cross-validation experimental design becomes essential to limit (or at least warn) of potential overfitting issues.
Furthermore, this study focused on a relatively easy classification; water extraction is not as challenging when multispectral information is available. The value proposition of a complex classifier may have been different if similar analysis was conducted with high resolution aerial photography, where spectral separability may not be sufficiently high thus advanced modeling methods would be advisable.
7. Conclusion
Remote sensing data and methods can significantly assist in environmental monitoring tasks. In this research we have demonstrated their utility in Hurricane Katrina flooding assessment. More specifically, we examined the relationship of algorithmic reference data and methods to the obtained flooding estimates. In this site, a Maximum Likelihood and Back Propagation Neural Network classifiers were tested estimating flooding very closely within the reference sample area (124.4 km2 for the ML classifier and 123.7 km2 for the NN classifier) but with significant variability at other parts of the image (462.5 km2 for the ML and 797.2 km2 for the NN). Furthermore, post-evaluation using Census 2000 data indicated a disproportional urban loss due to flooding among African Americans. Classification algorithmic decisions did not indicate significant differences, a result attributed to the significant geographic overlap between reference data locations and the examined census tracts. Moving forward, it is suggested that users should exercise caution in any post-analysis in areas with limited or no reference data when the spectral complexity is high, especially in urban/semi-urban areas.


