<?xml version="1.0" encoding="UTF-8"?>
<!DOCTYPE article PUBLIC "-//NLM//DTD Journal Publishing DTD v2.3 20070202//EN" "journalpublishing.dtd">
<article xmlns:mml="http://www.w3.org/1998/Math/MathML" xmlns:xlink="http://www.w3.org/1999/xlink" xml:lang="en" article-type="research-article">
<front>
<journal-meta>
<journal-id journal-id-type="publisher-id">REMSE</journal-id>
<journal-title>Remote Sensing</journal-title>
<issn pub-type="epub">2072-4292</issn>
<publisher>
<publisher-name>Molecular Diversity Preservation International (MDPI)</publisher-name></publisher></journal-meta>
<article-meta>
<article-id pub-id-type="doi">10.3390/rs4010120</article-id>
<article-id pub-id-type="publisher-id">remotesensing-04-00120</article-id>
<article-categories>
<subj-group>
<subject>Article</subject></subj-group></article-categories>
<title-group>
<article-title>Detecting Climate Effects on Vegetation in Northern Mixed Prairie Using NOAA AVHRR 1-km Time-Series NDVI Data</article-title></title-group>
<contrib-group>
<contrib contrib-type="author">
<name><surname>Li</surname><given-names>Zhaoqin</given-names></name></contrib>
<contrib contrib-type="author">
<name><surname>Guo</surname><given-names>Xulin</given-names></name><xref ref-type="corresp" rid="c1-remotesensing-04-00120"><sup>*</sup></xref></contrib>
<aff id="af1-remotesensing-04-00120">Department of Geography and Planning, University of Saskatchewan, 117 Science Place, Saskatoon, SK S7N 5C8, Canada; E-Mail: <email>zhl237@mail.usask.ca</email></aff></contrib-group>
<author-notes>
<corresp id="c1-remotesensing-04-00120">
<label>*</label>Author to whom correspondence should be addressed; E-Mail: <email>xulin.guo@usask.ca</email>; Tel.: +1-306-966-5663; Fax: +1-306-966-5680.</corresp></author-notes>
<pub-date pub-type="collection">
<year>2012</year></pub-date>
<pub-date pub-type="epub">
<day>06</day>
<month>01</month>
<year>2012</year></pub-date>
<volume>4</volume>
<issue>1</issue>
<fpage>120</fpage>
<lpage>134</lpage>
<history>
<date date-type="received">
<day>08</day>
<month>11</month>
<year>2011</year></date>
<date date-type="rev-recd">
<day>24</day>
<month>12</month>
<year>2011</year></date>
<date date-type="accepted">
<day>24</day>
<month>12</month>
<year>2011</year></date></history>
<copyright-statement>© 2012 by the authors; licensee MDPI, Basel, Switzerland.</copyright-statement>
<copyright-year>2012</copyright-year>
<license>
<p>This article is an open access article distributed under the terms and conditions of the Creative Commons Attribution license (<ext-link xlink:href="http://creativecommons.org/licenses/by/3.0/" ext-link-type="uri">http://creativecommons.org/licenses/by/3.0/</ext-link>).</p></license>
<abstract>
<p>Grasslands hold varied grazing capacity, provide multiple habitats for diverse wildlife, and are a key component of carbon stock. Research has indicated that grasslands are experiencing effects related to recent climate trends. Understanding how grasslands respond to climate variation thus is essential. However, it is difficult to separate the effects of climate variation from grazing. This study aims to document vegetation condition under climate variation in Grasslands National Park (GNP) of Canada, a grassland ecosystem without grazing for over 20 years, using Normalized Difference Vegetation Index (NDVI) data to establish vegetation baselines. The main findings are (1) precipitation has more effects than temperature on vegetation; (2) the growing season of vegetation had an expanding trend indicated by earlier green-up and later senescence; (3) phenologically-tuned annual NDVI had an increasing trend from 1985 to 2007; and (4) the baselines of annual NDVI range from 0.13 to 0.32, and only the NDVI in 1999 is beyond the upper bound of the baseline. Our results indicate that vegetation phenology and condition have slightly changed in GNP since 1985, although vegetation condition in most years was still within the baselines.</p></abstract>
<kwd-group>
<kwd>climatic variation</kwd>
<kwd>NDVI baseline</kwd>
<kwd>NDVI trend</kwd>
<kwd>semi-arid mixed grassland</kwd></kwd-group></article-meta></front>
<body>
<sec sec-type="intro">
<label>1.</label>
<title>Introduction</title>
<p>Grasslands are economically essential for achieving higher agricultural productivity as they hold the largest grazing capacity in the world [<xref ref-type="bibr" rid="b1-remotesensing-04-00120">1</xref>]. In addition, grasslands are ecologically important because they provide multiple habitats for diverse wildlife [<xref ref-type="bibr" rid="b2-remotesensing-04-00120">2</xref>] and play an important role in carbon stock [<xref ref-type="bibr" rid="b3-remotesensing-04-00120">3</xref>]. Research has indicated climate impacts on grasslands (e.g., [<xref ref-type="bibr" rid="b4-remotesensing-04-00120">4</xref>,<xref ref-type="bibr" rid="b5-remotesensing-04-00120">5</xref>]), which affect agricultural productivity, wildlife habitats, and carbon stocks. At the same time, mixed grasslands in Canada are experiencing increased frequency of extreme weather events [<xref ref-type="bibr" rid="b6-remotesensing-04-00120">6</xref>] such as drought and floods. In addition, climate modeling projects that the precipitation pattern in Canadian prairie may be subject to change in the future [<xref ref-type="bibr" rid="b7-remotesensing-04-00120">7</xref>]. Under such circumstances, the grazing capacity and carbon stock capacity of Canadian prairie may be subjected to change, and wildlife may have to undergo migration, adaptation, or even extinction. Therefore, it is essential to understand how vegetation in Canadian prairie responds to climate variation in order to come up with adaptations to deal with climatic variation.</p>
<p>Grasslands National Park (GNP), located in the southern Canadian prairies and the northern portion of the mixed grass prairie of the northern Great Plains, is an important gene pool of wildlife and a sink of carbon dioxide [<xref ref-type="bibr" rid="b8-remotesensing-04-00120">8</xref>]. GNP is at the northern edge of the continental distribution of C<sub>4</sub> species [<xref ref-type="bibr" rid="b9-remotesensing-04-00120">9</xref>], and it has been conserved since 1984 with few anthropogenic effects [<xref ref-type="bibr" rid="b10-remotesensing-04-00120">10</xref>]. Considerable research has been conducted in GNP. Using remote sensing techniques, C<sub>4</sub> species cover [<xref ref-type="bibr" rid="b11-remotesensing-04-00120">11</xref>], biophysical parameters [<xref ref-type="bibr" rid="b12-remotesensing-04-00120">12</xref>,<xref ref-type="bibr" rid="b13-remotesensing-04-00120">13</xref>] and spatial and vertical heterogeneity [<xref ref-type="bibr" rid="b2-remotesensing-04-00120">2</xref>,<xref ref-type="bibr" rid="b14-remotesensing-04-00120">14</xref>], as well as CO<sub>2</sub> exchange rate [<xref ref-type="bibr" rid="b15-remotesensing-04-00120">15</xref>] have been estimated. These studies have shown the promise of using satellite imagery to study vegetation in GNP. However, relatively little research has focused on climate effects on vegetation in GNP.</p>
<p>Weather has moderate effects on the seasonal and annual variation of Net Primary Productivity (NPP) and spatial biological heterogeneity in GNP [<xref ref-type="bibr" rid="b2-remotesensing-04-00120">2</xref>]. It was asserted that vegetation vigor significantly increased from 1985 through 2006 in the Northern Great Plains, except for sparse vegetation regions [<xref ref-type="bibr" rid="b16-remotesensing-04-00120">16</xref>]. In addition, predictions from the CENTURY model indicate that the stability of the vegetation community in GNP was affected by precipitation variability [<xref ref-type="bibr" rid="b9-remotesensing-04-00120">9</xref>]. These studies indicate climate effects on vegetation growth in GNP. But little research was found to comprehensively investigate how vegetation in the mixed grass prairie responds to climate change, which is important for coming up with adaptations to maintain wildlife habitat.</p>
<p>Normalized Difference Vegetation Index (NDVI) is a good indicator of various vegetation biophysical parameters, including biomass, green leaf area index, percent green cover [<xref ref-type="bibr" rid="b17-remotesensing-04-00120">17</xref>], and net primary production [<xref ref-type="bibr" rid="b18-remotesensing-04-00120">18</xref>], as well as fraction of absorbed photosynthetically active radiation [<xref ref-type="bibr" rid="b19-remotesensing-04-00120">19</xref>]. NDVI also demonstrates strong linear relationships with environmental variables, such as temperature and precipitation, under various environmental circumstances [<xref ref-type="bibr" rid="b20-remotesensing-04-00120">20</xref>]. NDVI data have been widely used to study the temporal response (e.g., [<xref ref-type="bibr" rid="b21-remotesensing-04-00120">21</xref>,<xref ref-type="bibr" rid="b22-remotesensing-04-00120">22</xref>]) and spatial pattern (e.g., [<xref ref-type="bibr" rid="b23-remotesensing-04-00120">23</xref>,<xref ref-type="bibr" rid="b24-remotesensing-04-00120">24</xref>]) of vegetation to climate fluctuations. NDVI data have also been used to explore trends of vegetation (e.g., [<xref ref-type="bibr" rid="b25-remotesensing-04-00120">25</xref>–<xref ref-type="bibr" rid="b27-remotesensing-04-00120">27</xref>]) under climatic variation. In addition, previous studies showed that NDVI could be quantified to measure the deviation of vegetation condition from the normal conditions [<xref ref-type="bibr" rid="b16-remotesensing-04-00120">16</xref>,<xref ref-type="bibr" rid="b28-remotesensing-04-00120">28</xref>,<xref ref-type="bibr" rid="b29-remotesensing-04-00120">29</xref>]. In summary, NDVI can be used to study vegetation response to climatic variation at a range of time and spatial scales [<xref ref-type="bibr" rid="b20-remotesensing-04-00120">20</xref>].</p>
<p>In this paper we examine the impacts of climatic variation on vegetation productivity in GNP, quantified using NDVI, and establish the NDVI baselines. Prior to these analyses, the capability of NDVI as an indicator of vegetation productivity is evaluated using aboveground biomass measurements. In addition, intra-annual relationships between NDVI and climate variables, including temperature and precipitation, are quantified, and variation of growing season in response to climate change is investigated.</p></sec>
<sec sec-type="methods">
<label>2.</label>
<title>Field Site and Data</title>
<sec sec-type="methods">
<label>2.1.</label>
<title>Study Area</title>
<p>This study was conducted in the west block of GNP (49.10°N, 106.89°W), which is located in southern Saskatchewan, Canada (<xref ref-type="fig" rid="f1-remotesensing-04-00120">Figure 1</xref>). The landscape in GNP is characterized by upland prairie, which makes up approximately 70% of the total area, broad valley, and badland. On the upland, the dominant grass species are needle-and-thread grass (<italic>Stipa comata Trin. &amp; Rupr</italic>.), blue grama grass (<italic>Bouteloua gracilis</italic> (<italic>HBK</italic>) <italic>Lang. ex Steud</italic>.), and western wheatgrass (<italic>Agropyron smithii Rydb</italic>.). Sparse shrubs are also present. In the valley, western wheatgrass and northern wheatgrass (<italic>Agropyron dasystachym</italic>) are dominant, along with higher densities of shrubs and occasional trees. Natural fire was almost eliminated from the area and no prescribed burning has occurred since 1980s [<xref ref-type="bibr" rid="b10-remotesensing-04-00120">10</xref>]. Seventy-one bison, including 60 calves, were introduced to a large area (181 km<sup>2</sup>) in the west block of GNP in 2006 for conservation purposes. Light to moderate grazing has much fewer effects on vegetation productivity than climate during 1986–2005, which was indicated by the research conducted in GNP and its surrounding area where light to moderate cattle grazing history extends for at least 100 years [<xref ref-type="bibr" rid="b30-remotesensing-04-00120">30</xref>]. The study period of this study is 1985–2007. It only had light grazing for 2006 and 2007 and grazing impacts would not be significant. The changes of vegetation condition in the study area during the period of 1985–2007 were mainly caused by climatic variation.</p>
<p>GNP is located in a dry and cold steppe climate region. During the period of 1971–2000, the average low temperature in January is −22 °C and average daily July temperature is 28 °C with extremes exceeding 40 °C. The mean annual temperature is 3.8 °C. The averages of the annual total precipitation are 300–400 mm a year, while they are less than 100 mm in drought years. Rainfall during evening storms in May and June accounts for most of the precipitation. As a result, low moisture availability is the dominant climatic feature of the area [<xref ref-type="bibr" rid="b10-remotesensing-04-00120">10</xref>], but growth rates can be high when soil moisture is sufficient [<xref ref-type="bibr" rid="b10-remotesensing-04-00120">10</xref>].</p></sec>
<sec sec-type="methods">
<label>2.2.</label>
<title>Data</title>
<p>NDVI, biomass, and climate data are used in this study. The NDVI data were extracted from Canada-wide 10-day Advanced Very High Resolution Radiometer (AVHRR) 1 km spatial resolution composites. The composites were processed via the New Geocoding and Compositing System (GEOCOMP-n) [<xref ref-type="bibr" rid="b31-remotesensing-04-00120">31</xref>,<xref ref-type="bibr" rid="b32-remotesensing-04-00120">32</xref>] by the Manitoba Remote Sensing Centre, Canada. Compared to the old compositing system, the GEOCOMP-n system produces higher level products with improvements on geocoding, inter-sensor calibration, atmospheric correction, bi-directional reflectance distribution function (BRDF) correction, and identification and removal of cloud contamination [<xref ref-type="bibr" rid="b32-remotesensing-04-00120">32</xref>]. The NDVI composites used were from April 1st to October 31st during the period of 1985 to 2007 and were produced from the imagery of AVHRR onboard the National Oceanic and Atmospheric Administration (NOAA) 9, 11, 14, 16, 17 and 18 satellites. The biomass data were obtained by drying fresh green biomass for 48 h at 60 °C in an oven. The fresh aboveground biomass was harvested from the sampling sites shown in <xref ref-type="fig" rid="f1-remotesensing-04-00120">Figure 1</xref>. At each sampling site, biomass was clipped within a 20 × 50 cm quadrat at 20 m intervals over two 100 m long transects crossing at right angles in 2003 to 2005. 36, 48, and 72 samples were collected in mid June, late June, and early July in 2003, respectively. 132 and 36 samples were collected in mid June and late June in 2004, respectively. 168, 36, and 156 samples were collected in mid June, late June, and mid July in 2005, respectively.</p>
<p>Climate data used are daily temperature and precipitation from 1985 to 2007 in Val Marie, a weather station about 1 km away from the study area.</p></sec></sec>
<sec sec-type="methods">
<label>3.</label>
<title>Methods</title>
<sec sec-type="methods">
<label>3.1.</label>
<title>Applicability of AVHRR/NDVI Data</title>
<p>Negative values in the extracted NDVI data were removed as such values are certainly too low to reflect vegetation. Representativeness of the NDVI data regarding biomass of the sites was investigated prior to the weather data and NDVI baseline analyses. Whether variations of NDVI respond to actual variations of vegetation cover in semiarid areas is debatable, due to seasonal variations in atmospheric water vapor [<xref ref-type="bibr" rid="b33-remotesensing-04-00120">33</xref>], atmospheric aerosol content [<xref ref-type="bibr" rid="b34-remotesensing-04-00120">34</xref>], and large areas of bare soil [<xref ref-type="bibr" rid="b35-remotesensing-04-00120">35</xref>,<xref ref-type="bibr" rid="b36-remotesensing-04-00120">36</xref>]. Orbital drift and sensor changes also exert certain effects on time series AVHRR NDVI datasets [<xref ref-type="bibr" rid="b37-remotesensing-04-00120">37</xref>]. Hence, the first step of this study is to verify the capability of AVHRR/NDVI data to monitor vegetation productivity in GNP, although the promise of using 10 day AVHRR 1 km NDVI data in GNP and the northern Great Plains has already been shown [<xref ref-type="bibr" rid="b2-remotesensing-04-00120">2</xref>,<xref ref-type="bibr" rid="b16-remotesensing-04-00120">16</xref>]. The collected biomass data from all sampling sites were averaged during a 10 day period to match the compositing period of AVHRR imagery. Also, NDVI data extracted for all sampling sites were averaged based on each 10 day period during which biomass data were collected. Finally, the averaged aboveground biomass and NDVI data were plotted to investigate the representativeness of the NDVI data regarding biomass of the sites, and the sample NDVI values were compared to mean NDVI values from the entire study area to assess the representativeness of the sample sites for the study area as a whole.</p></sec>
<sec>
<label>3.2.</label>
<title>Vegetation Phenology</title>
<p>The curvature-change rate method developed in [<xref ref-type="bibr" rid="b38-remotesensing-04-00120">38</xref>] was used to estimate vegetation phenology, namely green-up, peak growth, and senescence in our study. The method was chosen due to its ability to handle multiple growth cycles and its lack of arbitrarily defined thresholds to identify phenological transition dates.</p></sec>
<sec>
<label>3.3.</label>
<title>Relationships between NDVI and Climate Variables</title>
<p>In order to investigate intra-annual NDVI-temperature and NDVI-precipitation relationships, temperature was averaged and precipitation was accumulated based on particular time intervals (<xref ref-type="table" rid="t1-remotesensing-04-00120">Table 1</xref>) designed to accommodate a range of potential lag effects of environmental variables on NDVI. The first and last NDVI data used in the correlation analysis were phenologically-tuned, which means they were determined by onset of green-up and end of senescence. While averaging temperature and summing precipitation, a few values were removed that had at least three consecutive days missing data within a 10 day composite period. Finally, the effects of temperature and precipitation on NDVI were determined based on their correlations at the different time intervals.</p>
<p>To find the time period over which temperature and precipitation most affect vegetation growth in GNP, correlation of NDVI in the current 10 day period (one period refers to 10 days hereafter) was measured with respect to temperature and precipitation within different 10 day periods, first, involving the current period, then the first, second, third, and fourth previous period, respectively (as shown in the first row in <xref ref-type="table" rid="t1-remotesensing-04-00120">Table 1</xref>). Second, NDVI in the current period was measured with respect to temperature and precipitation within 20 days periods, initially, covering the first previous period to the current period, then two periods prior to one period prior, three periods prior to two periods prior, and five periods prior to four periods prior (second row in <xref ref-type="table" rid="t1-remotesensing-04-00120">Table 1</xref>). This same approach was repeated for 30 day periods, 40 day periods and 50 day periods (row 3–5 in <xref ref-type="table" rid="t1-remotesensing-04-00120">Table 1</xref>).</p></sec>
<sec>
<label>3.4.</label>
<title>Trend Detection</title>
<p>The non-parametric Mann-Kendall test (M-K) has been widely used for trend detection of normally or non-normally distributed time series in environmental sciences [<xref ref-type="bibr" rid="b40-remotesensing-04-00120">40</xref>]. It can be applied to detect the trends of vegetation phenology, annual NDVI, mean temperature, total precipitation, and monthly NDVI. For monthly NDVI trends, it was applied to every month from April to October.</p>
<p>Taking NDVI as an example, given the annual NDVI time series NDVI<sub>1</sub>, NDVI<sub>2</sub> ..., NDVI<sub>n</sub> are sequential data values and <italic>n</italic> (23 in this study) is the data set record length, then the M-K test statistic <italic>S</italic> is given by the formula:
<disp-formula id="FD1">
<label>(1)</label>
<mml:math id="mm1" display="block">
<mml:mrow>
<mml:mi>S</mml:mi>
<mml:mo>=</mml:mo>
<mml:msubsup>
<mml:mrow>
<mml:mo>∑</mml:mo></mml:mrow>
<mml:mrow>
<mml:mi>k</mml:mi>
<mml:mo>=</mml:mo>
<mml:mn>1</mml:mn></mml:mrow>
<mml:mrow>
<mml:mi>n</mml:mi>
<mml:mo>−</mml:mo>
<mml:mn>1</mml:mn></mml:mrow></mml:msubsup>
<mml:msubsup>
<mml:mrow>
<mml:mo>∑</mml:mo></mml:mrow>
<mml:mrow>
<mml:mi>J</mml:mi>
<mml:mo>=</mml:mo>
<mml:mi>k</mml:mi>
<mml:mo>+</mml:mo>
<mml:mn>1</mml:mn></mml:mrow>
<mml:mi>n</mml:mi></mml:msubsup>
<mml:mi mathvariant="italic">sgn</mml:mi>
<mml:mrow>
<mml:mo>(</mml:mo>
<mml:mrow>
<mml:msub>
<mml:mrow>
<mml:mi mathvariant="italic">NDVI</mml:mi></mml:mrow>
<mml:mi>j</mml:mi></mml:msub>
<mml:mo>−</mml:mo>
<mml:msub>
<mml:mrow>
<mml:mi mathvariant="italic">NDVI</mml:mi></mml:mrow>
<mml:mi>k</mml:mi></mml:msub></mml:mrow>
<mml:mo>)</mml:mo></mml:mrow></mml:mrow></mml:math></disp-formula></p>
<p>In this expression, <italic>NDVI</italic><italic><sub>j</sub></italic> and <italic>NDVI</italic><italic><sub>i</sub></italic> are the mean annual growing season NDVI values, and
<disp-formula id="FD2">
<label>(2)</label>
<mml:math id="mm2" display="block">
<mml:mrow>
<mml:mi mathvariant="italic">sgn</mml:mi>
<mml:mrow>
<mml:mo>(</mml:mo>
<mml:mrow>
<mml:msub>
<mml:mrow>
<mml:mi mathvariant="italic">NDVI</mml:mi></mml:mrow>
<mml:mi>j</mml:mi></mml:msub>
<mml:mo>−</mml:mo>
<mml:msub>
<mml:mrow>
<mml:mi mathvariant="italic">NDVI</mml:mi></mml:mrow>
<mml:mi>k</mml:mi></mml:msub></mml:mrow>
<mml:mo>)</mml:mo></mml:mrow>
<mml:mo>=</mml:mo>
<mml:mrow>
<mml:mo>{</mml:mo>
<mml:mrow>
<mml:mtable>
<mml:mtr>
<mml:mtd>
<mml:mrow>
<mml:mn>1</mml:mn>
<mml:mo> </mml:mo>
<mml:mi>i</mml:mi>
<mml:mi>f</mml:mi>
<mml:mo> </mml:mo>
<mml:mrow>
<mml:mo>(</mml:mo>
<mml:mrow>
<mml:msub>
<mml:mrow>
<mml:mi mathvariant="italic">NDVI</mml:mi></mml:mrow>
<mml:mi>j</mml:mi></mml:msub>
<mml:mo>−</mml:mo>
<mml:msub>
<mml:mrow>
<mml:mi mathvariant="italic">NDVI</mml:mi></mml:mrow>
<mml:mi>k</mml:mi></mml:msub></mml:mrow>
<mml:mo>)</mml:mo></mml:mrow>
<mml:mo>&gt;</mml:mo>
<mml:mn>0</mml:mn></mml:mrow></mml:mtd></mml:mtr>
<mml:mtr>
<mml:mtd>
<mml:mrow>
<mml:mn>0</mml:mn>
<mml:mo> </mml:mo>
<mml:mi mathvariant="italic">if</mml:mi>
<mml:mo> </mml:mo>
<mml:mrow>
<mml:mo>(</mml:mo>
<mml:mrow>
<mml:msub>
<mml:mrow>
<mml:mi mathvariant="italic">NDVI</mml:mi></mml:mrow>
<mml:mi>j</mml:mi></mml:msub>
<mml:mo>−</mml:mo>
<mml:msub>
<mml:mrow>
<mml:mi mathvariant="italic">NDVI</mml:mi></mml:mrow>
<mml:mi>k</mml:mi></mml:msub></mml:mrow>
<mml:mo>)</mml:mo></mml:mrow>
<mml:mo>=</mml:mo>
<mml:mn>0</mml:mn></mml:mrow></mml:mtd></mml:mtr>
<mml:mtr>
<mml:mtd>
<mml:mrow>
<mml:mo>−</mml:mo>
<mml:mn>1</mml:mn>
<mml:mo> </mml:mo>
<mml:mi mathvariant="italic">if</mml:mi>
<mml:mo> </mml:mo>
<mml:mrow>
<mml:mo>(</mml:mo>
<mml:mrow>
<mml:msub>
<mml:mrow>
<mml:mi mathvariant="italic">NDVI</mml:mi></mml:mrow>
<mml:mi>j</mml:mi></mml:msub>
<mml:mo>−</mml:mo>
<mml:msub>
<mml:mrow>
<mml:mi mathvariant="italic">NDVI</mml:mi></mml:mrow>
<mml:mi>k</mml:mi></mml:msub></mml:mrow>
<mml:mo>)</mml:mo></mml:mrow>
<mml:mo>&lt;</mml:mo>
<mml:mn>0</mml:mn></mml:mrow></mml:mtd></mml:mtr></mml:mtable></mml:mrow></mml:mrow></mml:mrow></mml:math></disp-formula></p>
<p>The variance of <italic>S</italic> is computed as:
<disp-formula id="FD3">
<label>(3)</label>
<mml:math id="mm3" display="block">
<mml:mrow>
<mml:mi mathvariant="italic">VAR</mml:mi>
<mml:mo stretchy="false">(</mml:mo>
<mml:mi>S</mml:mi>
<mml:mo stretchy="false">)</mml:mo>
<mml:mo>=</mml:mo>
<mml:mfrac>
<mml:mrow>
<mml:mi>n</mml:mi>
<mml:mrow>
<mml:mo>(</mml:mo>
<mml:mrow>
<mml:mi>n</mml:mi>
<mml:mo>−</mml:mo>
<mml:mn>1</mml:mn></mml:mrow>
<mml:mo>)</mml:mo></mml:mrow>
<mml:mrow>
<mml:mo>(</mml:mo>
<mml:mrow>
<mml:mn>2</mml:mn>
<mml:mi>n</mml:mi>
<mml:mo>+</mml:mo>
<mml:mi>S</mml:mi></mml:mrow>
<mml:mo>)</mml:mo></mml:mrow></mml:mrow>
<mml:mrow>
<mml:mn>18</mml:mn></mml:mrow></mml:mfrac></mml:mrow></mml:math></disp-formula></p>
<p>The test statistic <italic>Z</italic> is calculated as:
<disp-formula id="FD4">
<label>(4)</label>
<mml:math id="mm4" display="block">
<mml:mrow>
<mml:mi>Z</mml:mi>
<mml:mo>=</mml:mo>
<mml:mrow>
<mml:mo>{</mml:mo>
<mml:mrow>
<mml:mtable>
<mml:mtr>
<mml:mtd>
<mml:mrow>
<mml:mfrac>
<mml:mrow>
<mml:mi>S</mml:mi>
<mml:mo>+</mml:mo>
<mml:mn>1</mml:mn></mml:mrow>
<mml:mrow>
<mml:msqrt>
<mml:mrow>
<mml:mi mathvariant="italic">VAR</mml:mi>
<mml:mo> </mml:mo>
<mml:mo stretchy="false">(</mml:mo>
<mml:mi>S</mml:mi>
<mml:mo stretchy="false">)</mml:mo></mml:mrow></mml:msqrt></mml:mrow></mml:mfrac>
<mml:mo> </mml:mo>
<mml:mo> </mml:mo>
<mml:mi mathvariant="italic">if</mml:mi>
<mml:mo> </mml:mo>
<mml:mi>S</mml:mi>
<mml:mo>&gt;</mml:mo>
<mml:mn>0</mml:mn></mml:mrow></mml:mtd></mml:mtr>
<mml:mtr>
<mml:mtd>
<mml:mrow>
<mml:mn>0</mml:mn>
<mml:mo> </mml:mo>
<mml:mo> </mml:mo>
<mml:mi mathvariant="italic">if</mml:mi>
<mml:mo> </mml:mo>
<mml:mo> </mml:mo>
<mml:mi>S</mml:mi>
<mml:mo>=</mml:mo>
<mml:mn>0</mml:mn></mml:mrow></mml:mtd></mml:mtr>
<mml:mtr>
<mml:mtd>
<mml:mrow>
<mml:mfrac>
<mml:mrow>
<mml:mi>S</mml:mi>
<mml:mo>−</mml:mo>
<mml:mn>1</mml:mn></mml:mrow>
<mml:mrow>
<mml:msqrt>
<mml:mrow>
<mml:mi mathvariant="italic">VAR</mml:mi>
<mml:mo> </mml:mo>
<mml:mo stretchy="false">(</mml:mo>
<mml:mi>S</mml:mi>
<mml:mo stretchy="false">)</mml:mo></mml:mrow></mml:msqrt></mml:mrow></mml:mfrac>
<mml:mo> </mml:mo>
<mml:mo> </mml:mo>
<mml:mi mathvariant="italic">if</mml:mi>
<mml:mo> </mml:mo>
<mml:mi>S</mml:mi>
<mml:mo>&lt;</mml:mo>
<mml:mn>0</mml:mn></mml:mrow></mml:mtd></mml:mtr></mml:mtable></mml:mrow></mml:mrow></mml:mrow></mml:math></disp-formula></p>
<p>The statistical trend of mean NDVI is evaluated using the <italic>Z</italic> value. A negative (positive) <italic>Z</italic> value indicates a downward (upward) trend, and a zero <italic>Z</italic> value means that the time series data have no trend of change. The significance of the detected trend was tested based on 0.05 and 0.10 significance levels.</p></sec>
<sec>
<label>3.5.</label>
<title>NDVI Baselines</title>
<p>Statistically, values beyond two standard deviations of the mean can be defined as anomalies [<xref ref-type="bibr" rid="b41-remotesensing-04-00120">41</xref>]. Regarding AVHRR NDVI, a 0.5 standard deviation value was used to define baselines by Thaim [<xref ref-type="bibr" rid="b42-remotesensing-04-00120">42</xref>], however, it was considered to be too low to highlight the sensitive areas [<xref ref-type="bibr" rid="b43-remotesensing-04-00120">43</xref>]. A two standard deviation value was used to create NDVI baselines for the Northern Great Plains and define the NDVI anomalies [<xref ref-type="bibr" rid="b16-remotesensing-04-00120">16</xref>]. Thus, two standard deviations were also used in this study to establish NDVI baselines in GNP. Annual NDVI baselines were established by subtracting two standard deviations from mean NDVI value of 1985–2007. The same method was used to create monthly NDVI baselines from April to October.</p></sec></sec>
<sec sec-type="results|discussion">
<label>4.</label>
<title>Results and Discussion</title>
<sec>
<label>4.1.</label>
<title>Applicability of AVHRR NDVI</title>
<p>
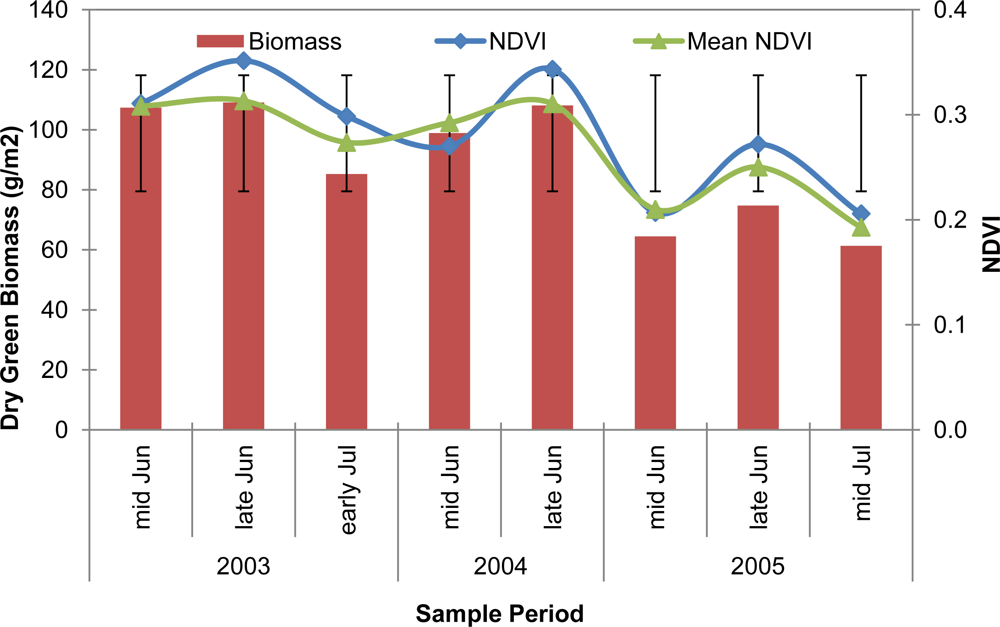
The averaged dry biomass and NDVI from the sampling sites and the mean NDVI in the study area are shown in <xref ref-type="fig" rid="f2-remotesensing-04-00120">Figure 2</xref>. Biomass and NDVI demonstrated clear inter-annual consistency indicated by the larger amount of dry biomass and the corresponding higher NDVI values in 2003 and 2004 and the smaller amount of biomass and lower NDVI in 2005. Within each year, the variations in the biomass are fairly well represented by the changes of NDVI. In addition, NDVI from the sampled area fairly well represents the mean NDVI in the study area. The seasonal and inter-annual consistency of NDVI and biomass support the common use of NDVI to study vegetation response to climate variation [<xref ref-type="bibr" rid="b44-remotesensing-04-00120">44</xref>,<xref ref-type="bibr" rid="b45-remotesensing-04-00120">45</xref>].</p></sec>
<sec>
<label>4.2.</label>
<title>Relationships between NDVI and Climate Variables</title>
<p>
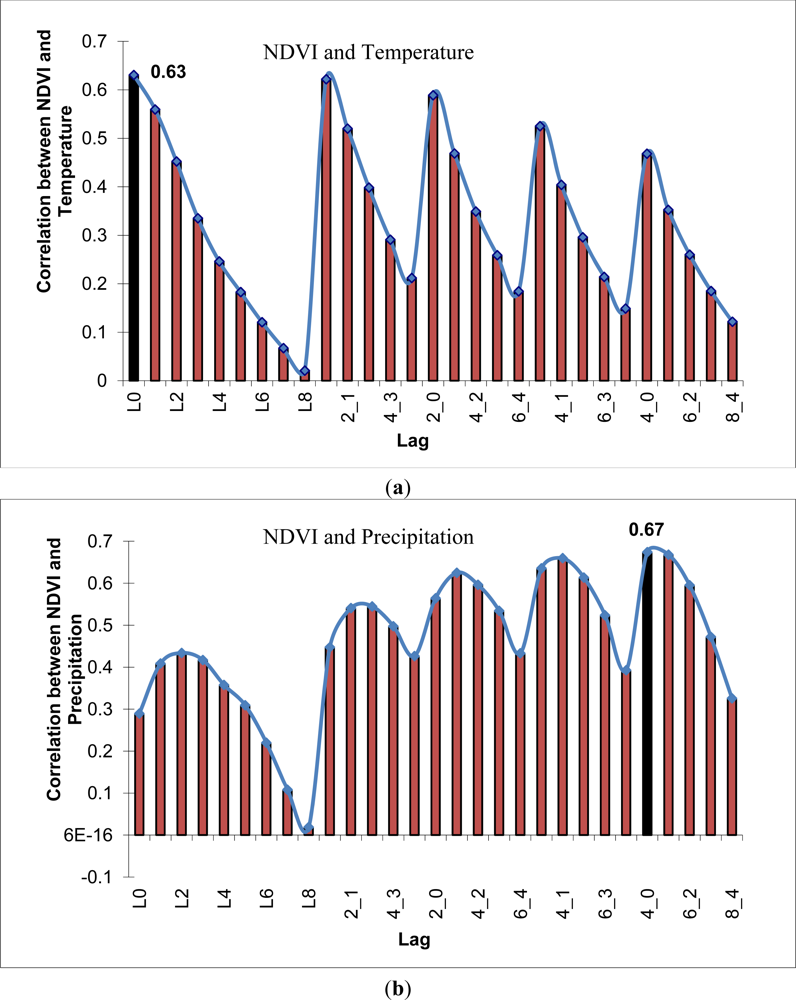
The intra-annual relationships between NDVI and temperature and precipitation at various lags are shown in <xref ref-type="fig" rid="f3-remotesensing-04-00120">Figure 3</xref>. The mean temperature in the current period shows the most significant effect on NDVI with an r value of 0.63 (P = 0.000), followed by the mean temperature during the previous two periods (r = 0.62) (<xref ref-type="fig" rid="f3-remotesensing-04-00120">Figure 3(a)</xref>). This finding is consistent with the assertion of [<xref ref-type="bibr" rid="b9-remotesensing-04-00120">9</xref>] that seasonal temperature has strong impacts on productivity of grass in GNP based on the prescribed temperature trends in the CENTURY model. Precipitation during the 50 day span ending with the current period (“4_0” in <xref ref-type="table" rid="t1-remotesensing-04-00120">Table 1</xref>) has the strongest correlation with NDVI in the current period, indicated by the r value of 0.69 (P = 0.000) (<xref ref-type="fig" rid="f3-remotesensing-04-00120">Figure 3(b)</xref>). This is consistent with the finding of [<xref ref-type="bibr" rid="b39-remotesensing-04-00120">39</xref>] that precipitation and NDVI in the central Great Plains of North America are strongly correlated at a certain temporal scale. The 40 day influence lag of precipitation and non-lag effect of temperature on NDVI indicate that the effect of precipitation lasts much longer than that of temperature in GNP.</p>
<p>The multiple regression approach was applied to evaluate the impacts of temperature and precipitation on the inter-annual variations of NDVI, with the outcome shown in the following equation:
<disp-formula id="FD5">
<label>(5)</label>
<mml:math id="mm5" display="block">
<mml:mrow>
<mml:mi>V</mml:mi>
<mml:mo>=</mml:mo>
<mml:mo>−</mml:mo>
<mml:mn>0.43</mml:mn>
<mml:mo>+</mml:mo>
<mml:mn>0.01</mml:mn>
<mml:mo>×</mml:mo>
<mml:mi>T</mml:mi>
<mml:mo>+</mml:mo>
<mml:mn>0.19</mml:mn>
<mml:mo>×</mml:mo>
<mml:mi mathvariant="italic">Lg</mml:mi>
<mml:mrow>
<mml:mo>(</mml:mo>
<mml:mrow>
<mml:msub>
<mml:mrow>
<mml:mi>P</mml:mi></mml:mrow>
<mml:mi>r</mml:mi></mml:msub></mml:mrow>
<mml:mo>)</mml:mo></mml:mrow>
<mml:mrow>
<mml:mo>(</mml:mo>
<mml:mrow>
<mml:msup>
<mml:mrow>
<mml:mtext>r</mml:mtext></mml:mrow>
<mml:mn>2</mml:mn></mml:msup>
<mml:mo>=</mml:mo>
<mml:mn>0.30</mml:mn>
<mml:mo>;</mml:mo>
<mml:mo> </mml:mo>
<mml:mtext>n</mml:mtext>
<mml:mo>=</mml:mo>
<mml:mn>23</mml:mn>
<mml:mo>;</mml:mo>
<mml:mo> </mml:mo>
<mml:mtext>P</mml:mtext>
<mml:mo>&lt;</mml:mo>
<mml:mn>0.05</mml:mn></mml:mrow>
<mml:mo>)</mml:mo></mml:mrow></mml:mrow></mml:math></disp-formula>where <italic>V</italic> is phenologically-tuned mean annual NDVI; <italic>T</italic> is mean temperature (°C); and <italic>P</italic><italic><sub>r</sub></italic> is the accumulated precipitation (mm) throughout the growing season, considering the lag effects described above; <italic>Lg</italic>(<italic>P</italic><italic><sub>r</sub></italic>) is the base-10 logarithm transformed precipitation; and <italic>n</italic> (23) is the number of years.</p>
<p>As stated in the description of the study site, climate variation is the major contributor to inter-annual NDVI variation, because the effects of grazing and fire are negligible during the study period. But temperature and precipitation can only explain 30% of the inter-annual variations of NDVI. The unexplained portion of the inter-annual variation might be accounted for by variations of some other environmental variables, such as soil moisture, which is controlled by precipitation [<xref ref-type="bibr" rid="b46-remotesensing-04-00120">46</xref>], wind [<xref ref-type="bibr" rid="b47-remotesensing-04-00120">47</xref>], topography [<xref ref-type="bibr" rid="b48-remotesensing-04-00120">48</xref>], and soil type and humus in soil [<xref ref-type="bibr" rid="b23-remotesensing-04-00120">23</xref>].</p>
<p>The multiple regression analysis indicates that the co-effects of temperature and precipitation on inter-annual variation of NDVI in GNP are statistically significant. Spearman correlation analyses were also implemented to investigate the effects of temperature and precipitation separately. The results show that the effect of temperature on the inter-annual NDVI variation is not significant (P &gt; 0.10), while the impact of precipitation is significant (P &lt; 0.05). The finding that precipitation is more important than temperature on inter-annual variability of vegetation productivity in GNP is in agreement with the findings of [<xref ref-type="bibr" rid="b9-remotesensing-04-00120">9</xref>] based on the manipulated climate scenario in the CENTURY model. It is also supported by the assertion of [<xref ref-type="bibr" rid="b49-remotesensing-04-00120">49</xref>] that vegetation growth in northern semi-arid mixed grassland is primarily constrained by soil moisture, which is highly determined by precipitation [<xref ref-type="bibr" rid="b45-remotesensing-04-00120">45</xref>]. Soil moisture or evapotranspiration data, despite the fact that they are not regular observational data in weather networks, can be used to further investigate the impact of climate variation on vegetation productivity in semi-arid mixed grassland.</p></sec>
<sec>
<label>4.3.</label>
<title>Trends of Phenology</title>
<p>The results of the trend analyses on green-up, peak growth, and senescence are demonstrated in <xref ref-type="table" rid="t2-remotesensing-04-00120">Table 2</xref>. The negative <italic>Z</italic> value of green-up indicates that vegetation in GNP has trended to start growing earlier from 1985 to 2007. This green-up trend is consistent with more general conclusions that the growing season start is trending earlier at higher northern latitudes [<xref ref-type="bibr" rid="b50-remotesensing-04-00120">50</xref>,<xref ref-type="bibr" rid="b51-remotesensing-04-00120">51</xref>]. The earlier green-up can be explained by the increased winter temperatures in southern Canada [<xref ref-type="bibr" rid="b52-remotesensing-04-00120">52</xref>].</p>
<p>The positive <italic>Z</italic> value shows that peak growth was delayed at the 0.10 significance level. Senescence also had a delayed trend. The increased annual maximum temperature [<xref ref-type="bibr" rid="b52-remotesensing-04-00120">52</xref>] may account for the delayed peak growth, because high maximum temperature can stunt vegetation development. The increased minimum temperature [<xref ref-type="bibr" rid="b52-remotesensing-04-00120">52</xref>] delayed the occurrence of frosts, which help explain the delayed trend in senescence.</p></sec>
<sec>
<label>4.4.</label>
<title>Trends of NDVI, Temperature, and Precipitation</title>
<p>The results of the M-K test on annual NDVI, mean temperature, total precipitation throughout the growing season, and monthly NDVI are shown in <xref ref-type="table" rid="t3-remotesensing-04-00120">Table 3</xref>. During the time period of 1985–2007, annual NDVI had an increasing trend indicated by the positive <italic>Z</italic> value (0.26). Both annual temperature and precipitation demonstrated an increasing trend indicated by the positive <italic>Z</italic> values of 0.03 and 0.08, respectively. The trend of temperature is significant at the 0.05 level, while the precipitation is significant at the 0.10 level. The increased mean temperature during the growing season is consistent with the fact that annual mean temperature increased from 1900 to 1998 in southern Canada [<xref ref-type="bibr" rid="b51-remotesensing-04-00120">51</xref>]. The increasing trend of precipitation is consistent with the finding of [<xref ref-type="bibr" rid="b52-remotesensing-04-00120">52</xref>,<xref ref-type="bibr" rid="b53-remotesensing-04-00120">53</xref>] that precipitation in Canadian prairies has increased. The increasing trend of annual NDVI can be accounted for by the increased temperature and precipitation.</p>
<p>The positive <italic>Z</italic> values indicate that monthly NDVI in April, May, August, September and October all show increasing trends, which are statistically significant at the 0.10 level. The slightly increased monthly NDVI can be explained by the earlier green-up and the later senescence, which were driven by increased temperature and precipitation.</p></sec>
<sec>
<label>4.5.</label>
<title>NDVI Baselines</title>
<p>The baselines of annual NDVI and monthly NDVI from April to October and the years in which NDVI were out of baselines are listed in <xref ref-type="table" rid="t4-remotesensing-04-00120">Table 4</xref>. The baseline of annual NDVI ranges from 0.13 to 0.32. The largest baseline range (0.12–0.40) was observed in June, followed by July and August, while the smallest baseline range (0.06–0.20) occurred in October. In 1986 and 2000, monthly NDVI values in April are below the low limit of the baseline. 1999 was the only year in which monthly NDVI in May to July and annual NDVI are beyond the upper baselines. Other NDVI and monthly NDVI values were all within the baselines. The anomalies of monthly NDVI in April of 1986 and 2000 may be explained by the cold events in the winters of 1985–1986 and 1999–2000. The occurrence of NDVI anomalies in 1999 may be accounted for by the lag effect of anomalous warming associated with the largest El Niño/Southern Oscillation (ENSO) phenomenon observed last century during the period of June 1997 to May 1998 [<xref ref-type="bibr" rid="b20-remotesensing-04-00120">20</xref>,<xref ref-type="bibr" rid="b54-remotesensing-04-00120">54</xref>]. However, the relationship between NDVI anomalies and ENSO events requires further study to draw any firm conclusion. The multiple temporal scales of the impact of temperature and precipitation as well as extreme climate events (e.g., ENSO) on vegetation conditions could be further investigated with longer time series.</p></sec></sec>
<sec sec-type="conclusions">
<label>5.</label>
<title>Conclusions</title>
<p>The comparisons between Normalized Difference Vegetation Index (NDVI) and biomass indicate that Advanced Very High Resolution Radiometer (AVHRR) 1 km spatial resolution NDVI data are suitable for monitoring vegetation condition in Grasslands National Park. The mean temperature in the previous 10 day period shows the second greatest impact on NDVI variations. Precipitation has stronger effects on NDVI than temperature with a lag of 40 days. Temperature and precipitation account for 30% of inter-annual variations in NDVI. However, measured separately the influence of precipitation is statistically significant, while the effect of temperature is not. Trend analyses indicate that vegetation growing season had an increasing trend from 1985 to 2007 with an earlier green-up and later senescence. Concurrently, peak growth has a trend of starting later. Phenologically-tuned annual NDVI demonstrated an increasing trend. There was a significant increasing trend for both annual temperature and precipitation, which accounted for the increasing trend of annual NDVI. Monthly NDVI demonstrated an expanding trend in each month from April to October.</p>
<p>The annual AVHRR NDVI baselines range from 0.13 to 0.32. Under climate variation, annual NDVI in most years of 1985–2007 are within the baselines, and the only exception is 1999. Monthly NDVI baselines from April to October were also established and most monthly NDVI are within the baselines. The exceptions are monthly NDVI in April of 1986 and 2000, which are below the minimum baselines, and monthly NDVI in May to July in 1999, which are above the maximum baselines.</p>
<p>This study demonstrates the successful application of AVHRR NDVI products on climate change studies in northern mixed prairie. By comparing retrieved NDVI values from AVHRR composites to the created NDVI baselines, park managers are able to evaluate the climatic effects on vegetation in every month for any year, and thus adjust corresponding conservation plans (e.g., prescribed fire or grazing) to minimize the effects. The approaches used in this study can be applied to other areas to investigate vegetation response to climate variation.</p></sec></body>
<back>
<ack>
<p>This research was partially funded by the ISTP Canada-China Project on “Climate Affects Grasslands in Canadian Prairie and Tibet, China” and the NSERC Project titled “LAI Simulation and Parameterization”. The authors appreciate the instructive comments from the three anonymous reviewers. We thank Parks Canada for providing AVHRR/NDVI imagery and acknowledge Yuhong He at the University of Toronto for deriving vegetation phenology from the NDVI data.</p></ack>
<ref-list>
<title>References</title>
<ref id="b1-remotesensing-04-00120"><label>1.</label><citation citation-type="journal"><person-group person-group-type="author"><name><surname>Burke</surname><given-names>I.C.</given-names></name><name><surname>Yonker</surname><given-names>C.M.</given-names></name><name><surname>Parton</surname><given-names>W.J.</given-names></name><name><surname>Cole</surname><given-names>C.V.</given-names></name><name><surname>Flach</surname><given-names>K.</given-names></name><name><surname>Schimel</surname><given-names>D.S.</given-names></name></person-group><article-title>Texture, climate, and cultivation effects on soil organic matter content in US grassland sites</article-title><source>Soil Sci. Soc. Am. J</source><year>1989</year><volume>53</volume><fpage>800</fpage><lpage>850</lpage><pub-id pub-id-type="doi">10.2136/sssaj1989.03615995005300030029x</pub-id></citation></ref>
<ref id="b2-remotesensing-04-00120"><label>2.</label><citation citation-type="journal"><person-group person-group-type="author"><name><surname>Zhang</surname><given-names>C.</given-names></name><name><surname>Guo</surname><given-names>X.</given-names></name><name><surname>Wilmshurst</surname><given-names>J.F.</given-names></name><name><surname>Crump</surname><given-names>S.</given-names></name></person-group><article-title>Monitoring temporal heterogeneity in a protected mixed prairie ecosystem using 10-day NDVI composite</article-title><source>Prairie Forum</source><year>2008</year><volume>33</volume><fpage>145</fpage><lpage>166</lpage></citation></ref>
<ref id="b3-remotesensing-04-00120"><label>3.</label><citation citation-type="journal"><person-group person-group-type="author"><name><surname>Wang</surname><given-names>W.</given-names></name><name><surname>Fang</surname><given-names>J.</given-names></name></person-group><article-title>Soil respiration and human effects on global grasslands</article-title><source>Global Planet. Change</source><year>2009</year><volume>67</volume><fpage>20</fpage><lpage>28</lpage><pub-id pub-id-type="doi">10.1016/j.gloplacha.2008.12.011</pub-id></citation></ref>
<ref id="b4-remotesensing-04-00120"><label>4.</label><citation citation-type="journal"><person-group person-group-type="author"><name><surname>Lawton</surname><given-names>D.</given-names></name><name><surname>Leahy</surname><given-names>P.</given-names></name><name><surname>Keily</surname><given-names>G.</given-names></name><name><surname>Bryne</surname><given-names>K.A.</given-names></name><name><surname>Calanca</surname><given-names>P</given-names></name></person-group><article-title>Modeling of net ecosystem exchange and its components for a humid grassland ecosystem</article-title><source>J. Geophys. Res</source><year>2006</year><volume>111</volume><fpage>G04013</fpage><pub-id pub-id-type="doi">10.1029/2006JG000160</pub-id></citation></ref>
<ref id="b5-remotesensing-04-00120"><label>5.</label><citation citation-type="journal"><person-group person-group-type="author"><name><surname>Chimner</surname><given-names>R.A.</given-names></name><name><surname>Welker</surname><given-names>J.M.</given-names></name><name><surname>Morgan</surname><given-names>J.</given-names></name><name><surname>LeCain</surname><given-names>D.</given-names></name><name><surname>Reeder</surname><given-names>J.</given-names></name></person-group><article-title>Experimental manipulations of winter snow and summer rain influence ecosystem carbon cycling in a mixed-grass prairie, Wyoming, USA</article-title><source>Ecohydrology</source><year>2010</year><volume>3</volume><fpage>284</fpage><lpage>293</lpage><pub-id pub-id-type="doi">10.1002/eco.106</pub-id></citation></ref>
<ref id="b6-remotesensing-04-00120"><label>6.</label><citation citation-type="journal"><person-group person-group-type="author"><name><surname>Easterling</surname><given-names>D.R.</given-names></name><name><surname>Evans</surname><given-names>J.L.</given-names></name><name><surname>Groisman</surname><given-names>P.Y.</given-names></name><name><surname>Karl</surname><given-names>T.R.</given-names></name><name><surname>Kunkel</surname><given-names>K.E.</given-names></name><name><surname>Ambenje</surname><given-names>P.</given-names></name></person-group><article-title>Observed variability and trends in extreme climate events: A brief review</article-title><source>Bull. Am. Meteorol Soc</source><year>2000</year><volume>81</volume><fpage>417</fpage><lpage>425</lpage><pub-id pub-id-type="doi">10.1175/1520-0477(2000)081&lt;0417:OVATIE&gt;2.3.CO;2</pub-id></citation></ref>
<ref id="b7-remotesensing-04-00120"><label>7.</label><citation citation-type="book"><collab>IPCC</collab><source>Climate Change 2007: The Physical Science Basis-Contribution of Working Group I to the Fourth Assessment Report of the Intergovernmental Panel on Climate Change</source><person-group person-group-type="editor"><name><surname>Solomon</surname><given-names>S.</given-names></name><name><surname>Qin</surname><given-names>D.</given-names></name><name><surname>Manning</surname><given-names>M.</given-names></name><name><surname>Chen</surname><given-names>Z.</given-names></name><name><surname>Marquis</surname><given-names>M.</given-names></name><name><surname>Averyt</surname><given-names>K.B.</given-names></name><name><surname>Tignor</surname><given-names>M.</given-names></name><name><surname>Miller</surname><given-names>H.L.</given-names></name></person-group><publisher-name>Cambridge University Press</publisher-name><publisher-loc>Cambridge, UK</publisher-loc><year>2007</year><fpage>996</fpage></citation></ref>
<ref id="b8-remotesensing-04-00120"><label>8.</label><citation citation-type="book"><person-group person-group-type="author"><name><surname>Heady</surname><given-names>H.F.</given-names></name><name><surname>Bartolome</surname><given-names>J.W.</given-names></name><name><surname>Pitt</surname><given-names>M.D.</given-names></name><name><surname>Savelle</surname><given-names>G.D.</given-names></name><name><surname>Stroud</surname><given-names>M.C.</given-names></name></person-group><article-title>Mixed prairie</article-title><source>Natural Grasslands: Introduction and Western Hemisphere</source><person-group person-group-type="editor"><name><surname>Coupland</surname><given-names>R.T.</given-names></name></person-group><publisher-name>Elsevier</publisher-name><publisher-loc>Amsterdam, The Netherlands</publisher-loc><year>1992</year><volume>8A</volume><fpage>151</fpage><lpage>179</lpage></citation></ref>
<ref id="b9-remotesensing-04-00120"><label>9.</label><citation citation-type="journal"><person-group person-group-type="author"><name><surname>Mitchell</surname><given-names>S.W.</given-names></name><name><surname>Csillag</surname><given-names>F.</given-names></name></person-group><article-title>Assessing the stability and uncertainty of predicted vegetation growth under climatic variability: Northern mixed grass prairie</article-title><source>Ecol. Model</source><year>2001</year><volume>139</volume><fpage>101</fpage><lpage>121</lpage><pub-id pub-id-type="doi">10.1016/S0304-3800(01)00229-0</pub-id></citation></ref>
<ref id="b10-remotesensing-04-00120"><label>10.</label><citation citation-type="journal"><person-group person-group-type="author"><name><surname>Wang</surname><given-names>S.</given-names></name><name><surname>Davidson</surname><given-names>A.</given-names></name></person-group><article-title>Impact of climate variations on surface albedo of a temperate grassland</article-title><source>Agr. Forest Meteorol</source><year>2007</year><volume>142</volume><fpage>133</fpage><lpage>142</lpage><pub-id pub-id-type="doi">10.1016/j.agrformet.2006.03.027</pub-id></citation></ref>
<ref id="b11-remotesensing-04-00120"><label>11.</label><citation citation-type="journal"><person-group person-group-type="author"><name><surname>Davidson</surname><given-names>A.</given-names></name><name><surname>Csillag</surname><given-names>F.</given-names></name></person-group><article-title>A comparison of three approaches for predicting C<sub>4</sub> species cover of northern mixed grass prairie</article-title><source>Remote Sens. Environ</source><year>2003</year><volume>86</volume><fpage>70</fpage><lpage>82</lpage><pub-id pub-id-type="doi">10.1016/S0034-4257(03)00069-5</pub-id></citation></ref>
<ref id="b12-remotesensing-04-00120"><label>12.</label><citation citation-type="journal"><person-group person-group-type="author"><name><surname>Wylie</surname><given-names>B.K.</given-names></name><name><surname>Meyer</surname><given-names>D.J.</given-names></name><name><surname>Tieszen</surname><given-names>L.L.</given-names></name><name><surname>Mannel</surname><given-names>S.</given-names></name></person-group><article-title>Satellite mapping of surface biophysical parameters at the biome scale over the North American grasslands: A case study</article-title><source>Remote Sens. Environ</source><year>2002</year><volume>79</volume><fpage>266</fpage><lpage>278</lpage><pub-id pub-id-type="doi">10.1016/S0034-4257(01)00278-4</pub-id></citation></ref>
<ref id="b13-remotesensing-04-00120"><label>13.</label><citation citation-type="journal"><person-group person-group-type="author"><name><surname>He</surname><given-names>Y.</given-names></name><name><surname>Guo</surname><given-names>X.</given-names></name><name><surname>Wilmshurst</surname><given-names>J.</given-names></name></person-group><article-title>Studying mixed grassland ecosystems I: Suitable hyperspectral vegetation indices</article-title><source>Can. J. Remote Sens</source><year>2006</year><volume>32</volume><fpage>98</fpage><lpage>107</lpage><pub-id pub-id-type="doi">10.5589/m06-009</pub-id></citation></ref>
<ref id="b14-remotesensing-04-00120"><label>14.</label><citation citation-type="journal"><person-group person-group-type="author"><name><surname>Guo</surname><given-names>X.</given-names></name><name><surname>Wilmshurst</surname><given-names>J.</given-names></name><name><surname>McCanny</surname><given-names>S.</given-names></name><name><surname>Fargey</surname><given-names>P.</given-names></name><name><surname>Richard</surname><given-names>P.</given-names></name></person-group><article-title>Measuring spatial and vertical heterogeneity of grasslands using remote sensing techniques</article-title><source>J. Environ. Inform</source><year>2004</year><volume>3</volume><fpage>24</fpage><lpage>32</lpage><pub-id pub-id-type="doi">10.3808/jei.200400024</pub-id></citation></ref>
<ref id="b15-remotesensing-04-00120"><label>15.</label><citation citation-type="journal"><person-group person-group-type="author"><name><surname>Black</surname><given-names>S.C.</given-names></name><name><surname>Guo</surname><given-names>X.</given-names></name></person-group><article-title>Estimation of grassland CO<sub>2</sub> exchange rates using hyperspectral remote sensing techniques</article-title><source>Int. J. Remote Sens</source><year>2008</year><volume>29</volume><fpage>145</fpage><lpage>155</lpage><pub-id pub-id-type="doi">10.1080/01431160701253220</pub-id></citation></ref>
<ref id="b16-remotesensing-04-00120"><label>16.</label><citation citation-type="journal"><person-group person-group-type="author"><name><surname>Piwowar</surname><given-names>J.M.</given-names></name></person-group><article-title>An environmental normal of vegetation vigour for the Northern Great Plains</article-title><source>IEEE J. Sel. Top. Appl. Earth Obs</source><year>2011</year><volume>4</volume><fpage>292</fpage><lpage>302</lpage><pub-id pub-id-type="doi">10.1109/JSTARS.2010.2049988</pub-id></citation></ref>
<ref id="b17-remotesensing-04-00120"><label>17.</label><citation citation-type="journal"><person-group person-group-type="author"><name><surname>Amri</surname><given-names>R.</given-names></name><name><surname>Zribi</surname><given-names>M.</given-names></name><name><surname>Lili-Chabaane</surname><given-names>Z.</given-names></name><name><surname>Duchemin</surname><given-names>B.</given-names></name><name><surname>Gruhier</surname><given-names>C.</given-names></name><name><surname>Chehbouni</surname><given-names>A.</given-names></name></person-group><article-title>Analysis of vegetation behavior in a North African semi-arid region, using SPOT-VEGETATION NDVI data</article-title><source>Remote Sens</source><year>2011</year><volume>3</volume><fpage>2568</fpage><lpage>2590</lpage><pub-id pub-id-type="doi">10.3390/rs3122568</pub-id></citation></ref>
<ref id="b18-remotesensing-04-00120"><label>18.</label><citation citation-type="journal"><person-group person-group-type="author"><name><surname>Weiss</surname><given-names>J.L.</given-names></name><name><surname>Gutzler</surname><given-names>D.S.</given-names></name><name><surname>Coonrod</surname><given-names>J.E.A.</given-names></name><name><surname>Dahm</surname><given-names>C.N.</given-names></name></person-group><article-title>Seasonal and inter-annual relationships between vegetation and climate in central New Mexico, USA</article-title><source>J. Arid Environ</source><year>2007</year><volume>57</volume><fpage>507</fpage><lpage>534</lpage></citation></ref>
<ref id="b19-remotesensing-04-00120"><label>19.</label><citation citation-type="journal"><person-group person-group-type="author"><name><surname>Asrar</surname><given-names>G.</given-names></name><name><surname>Myneni</surname><given-names>R.B.</given-names></name><name><surname>Choudhury</surname><given-names>B.J.</given-names></name></person-group><article-title>Spatial heterogeneity in vegetation canopies and remote sensing of absorbed photosynthetically active radiation: A modeling study</article-title><source>Remote Sens. Environ</source><year>1992</year><volume>43</volume><fpage>85</fpage><lpage>103</lpage></citation></ref>
<ref id="b20-remotesensing-04-00120"><label>20.</label><citation citation-type="journal"><person-group person-group-type="author"><name><surname>Anyamba</surname><given-names>A.</given-names></name><name><surname>Tucker</surname><given-names>C.J.</given-names></name><name><surname>Eastman</surname><given-names>J.R.</given-names></name></person-group><article-title>NDVI anomaly patterns over Africa during the 1997/98 ENSO warm event</article-title><source>Int. J. Remote Sens</source><year>2001</year><volume>22</volume><fpage>1847</fpage><lpage>1859</lpage><pub-id pub-id-type="doi">10.1080/01431160010029156</pub-id></citation></ref>
<ref id="b21-remotesensing-04-00120"><label>21.</label><citation citation-type="journal"><person-group person-group-type="author"><name><surname>Anyamba</surname><given-names>A.</given-names></name><name><surname>Tucker</surname><given-names>C.J.</given-names></name><name><surname>Mahoney</surname><given-names>R.</given-names></name></person-group><article-title>From El Niño to La Nina: Vegetation response patterns over east and southern Africa during the 1997–2000 period</article-title><source>J. Climate</source><year>2002</year><volume>15</volume><fpage>3096</fpage><lpage>3130</lpage><pub-id pub-id-type="doi">10.1175/1520-0442(2002)015&lt;3096:FENOTL&gt;2.0.CO;2</pub-id></citation></ref>
<ref id="b22-remotesensing-04-00120"><label>22.</label><citation citation-type="journal"><person-group person-group-type="author"><name><surname>Lotsch</surname><given-names>A.</given-names></name><name><surname>Friedl</surname><given-names>M.A.</given-names></name><name><surname>Anderson</surname><given-names>B.T.</given-names></name><name><surname>Tucker</surname><given-names>C.J.</given-names></name></person-group><article-title>Coupled vegetation-precipitation variability observed from satellite and climate records</article-title><source>Geophys. Res. Lett</source><year>2003</year><volume>14</volume><fpage>1774</fpage><lpage>1777</lpage></citation></ref>
<ref id="b23-remotesensing-04-00120"><label>23.</label><citation citation-type="journal"><person-group person-group-type="author"><name><surname>Nicholson</surname><given-names>S.E.</given-names></name><name><surname>Farrar</surname><given-names>T.J.</given-names></name></person-group><article-title>The influence of soil type on the relationships between NDVI, rainfall, and soil moisture in semiarid Botswana. I. NDVI response to rainfall</article-title><source>Remote Sens. Environ</source><year>1994</year><volume>50</volume><fpage>107</fpage><lpage>120</lpage><pub-id pub-id-type="doi">10.1016/0034-4257(94)90038-8</pub-id></citation></ref>
<ref id="b24-remotesensing-04-00120"><label>24.</label><citation citation-type="journal"><person-group person-group-type="author"><name><surname>Wang</surname><given-names>J.</given-names></name><name><surname>Price</surname><given-names>K.P.</given-names></name><name><surname>Rich</surname><given-names>P.M.</given-names></name></person-group><article-title>Spatial patterns of NDVI in response to precipitation and temperature in the central Great Plains</article-title><source>Int. J. Remote Sens</source><year>2001</year><volume>22</volume><fpage>3827</fpage><lpage>3844</lpage><pub-id pub-id-type="doi">10.1080/01431160010007033</pub-id></citation></ref>
<ref id="b25-remotesensing-04-00120"><label>25.</label><citation citation-type="journal"><person-group person-group-type="author"><name><surname>Eklundh</surname><given-names>L.</given-names></name><name><surname>Olsson</surname><given-names>L.</given-names></name></person-group><article-title>Vegetation index trends for the African Sahel 1982–1999</article-title><source>Geophys. Res. Lett</source><year>2003</year><volume>30</volume><fpage>1430</fpage><lpage>1433</lpage><pub-id pub-id-type="doi">10.1029/2002GL016772</pub-id></citation></ref>
<ref id="b26-remotesensing-04-00120"><label>26.</label><citation citation-type="journal"><person-group person-group-type="author"><name><surname>Nemani</surname><given-names>R.R.</given-names></name><name><surname>Keeling</surname><given-names>C.D.</given-names></name><name><surname>Hashimoto</surname><given-names>H.</given-names></name><name><surname>Jolly</surname><given-names>W.M.</given-names></name><name><surname>Piper</surname><given-names>S.C.</given-names></name><name><surname>Tucker</surname><given-names>C.J.</given-names></name><name><surname>Myneni</surname><given-names>R.B.</given-names></name><name><surname>Running</surname><given-names>S.W.</given-names></name></person-group><article-title>Climate-driven increases in global terrestrial net primary production from 1982 to 1999</article-title><source>Science</source><year>2003</year><volume>300</volume><fpage>1560</fpage><lpage>1563</lpage><pub-id pub-id-type="doi">10.1126/science.1082750</pub-id><pub-id pub-id-type="pmid">12791990</pub-id></citation></ref>
<ref id="b27-remotesensing-04-00120"><label>27.</label><citation citation-type="journal"><person-group person-group-type="author"><name><surname>Tucker</surname><given-names>C.J.</given-names></name><name><surname>Slayback</surname><given-names>D.A.</given-names></name><name><surname>Pinzon</surname><given-names>J.E.</given-names></name><name><surname>Los</surname><given-names>S.O.</given-names></name><name><surname>Myneni</surname><given-names>R.B.</given-names></name><name><surname>Taylor</surname><given-names>M.G.</given-names></name></person-group><article-title>Higher northern latitude normalized difference vegetation index and growing season trends from 1982 to 1999</article-title><source>Int. J. Biometeorol</source><year>2001</year><volume>45</volume><fpage>184</fpage><lpage>190</lpage><pub-id pub-id-type="doi">10.1007/s00484-001-0109-8</pub-id><pub-id pub-id-type="pmid">11769318</pub-id></citation></ref>
<ref id="b28-remotesensing-04-00120"><label>28.</label><citation citation-type="journal"><person-group person-group-type="author"><name><surname>Al-Bakri</surname><given-names>J.T.</given-names></name><name><surname>Taylor</surname><given-names>J.C.</given-names></name></person-group><article-title>Application of NOAA AVHRR for monitoring vegetation conditions and biomass in Jordan</article-title><source>J. Arid Environ</source><year>2003</year><volume>54</volume><fpage>579</fpage><lpage>593</lpage><pub-id pub-id-type="doi">10.1006/jare.2002.1081</pub-id></citation></ref>
<ref id="b29-remotesensing-04-00120"><label>29.</label><citation citation-type="journal"><person-group person-group-type="author"><name><surname>Tucker</surname><given-names>C.J.</given-names></name><name><surname>Sellers</surname><given-names>P.J.</given-names></name></person-group><article-title>Satellite remote sensing of primary production</article-title><source>Int. J. Remote Sens</source><year>1986</year><volume>7</volume><fpage>1395</fpage><lpage>1416</lpage><pub-id pub-id-type="doi">10.1080/01431168608948944</pub-id></citation></ref>
<ref id="b30-remotesensing-04-00120"><label>30.</label><citation citation-type="journal"><person-group person-group-type="author"><name><surname>Yang</surname><given-names>X.</given-names></name><name><surname>Guo</surname><given-names>X.</given-names></name><name><surname>Fitzsimmons</surname><given-names>M</given-names></name></person-group><article-title>Assessing light to moderate grazing effects on grasslands production using satellite imagery</article-title><source>Int. J. Remote Sens</source><year>2011</year><comment>in press.</comment></citation></ref>
<ref id="b31-remotesensing-04-00120"><label>31.</label><citation citation-type="journal"><person-group person-group-type="author"><name><surname>Adair</surname><given-names>M.</given-names></name><name><surname>Cihlar</surname><given-names>J.</given-names></name><name><surname>Park</surname><given-names>B.</given-names></name><name><surname>Fedosejeves</surname><given-names>G.</given-names></name><name><surname>Erickson</surname><given-names>A.</given-names></name><name><surname>Keeping</surname><given-names>R.</given-names></name><name><surname>Stanley</surname><given-names>D.</given-names></name><name><surname>Hurlburt</surname><given-names>P.</given-names></name></person-group><article-title>GeoComp-n, an advanced system for generating products from coarse-and medium-resolution optical satellite data. Part 1: System characterization</article-title><source>Can. J. Remote Sens</source><year>2002</year><volume>28</volume><fpage>1</fpage><lpage>20</lpage><pub-id pub-id-type="doi">10.5589/m02-002</pub-id></citation></ref>
<ref id="b32-remotesensing-04-00120"><label>32.</label><citation citation-type="journal"><person-group person-group-type="author"><name><surname>Cihlar</surname><given-names>J.</given-names></name><name><surname>Chen</surname><given-names>J.</given-names></name><name><surname>Li</surname><given-names>Z.</given-names></name><name><surname>Latifovic</surname><given-names>R.</given-names></name><name><surname>Fedosejeves</surname><given-names>G.</given-names></name><name><surname>Adair</surname><given-names>M.</given-names></name><name><surname>Park</surname><given-names>W.</given-names></name><name><surname>Fraser</surname><given-names>R.</given-names></name><name><surname>Trishchencko</surname><given-names>A.</given-names></name><name><surname>Guindon</surname><given-names>B.</given-names></name><name><surname>Stanley</surname><given-names>D.</given-names></name><name><surname>Morse</surname><given-names>D.</given-names></name></person-group><article-title>GeoComp-N, an advanced system for the processing of coarse and medium resolution satellite data. Part 2: Biophysical products for northern ecosystems</article-title><source>Can. J. Remote Sens</source><year>2002</year><volume>28</volume><fpage>21</fpage><lpage>44</lpage><pub-id pub-id-type="doi">10.5589/m02-003</pub-id></citation></ref>
<ref id="b33-remotesensing-04-00120"><label>33.</label><citation citation-type="journal"><person-group person-group-type="author"><name><surname>Justice</surname><given-names>C.O.</given-names></name><name><surname>Eck</surname><given-names>T.F.</given-names></name><name><surname>Tanre</surname><given-names>D.</given-names></name><name><surname>Holben</surname><given-names>B.</given-names></name></person-group><article-title>The effect of water vapor on the normalized difference vegetation index derived for the Sahelian region from NOAA AVHRR data</article-title><source>Int. J. Remote Sens</source><year>1991</year><volume>12</volume><fpage>1165</fpage><lpage>1187</lpage><pub-id pub-id-type="doi">10.1080/01431169108929720</pub-id></citation></ref>
<ref id="b34-remotesensing-04-00120"><label>34.</label><citation citation-type="journal"><person-group person-group-type="author"><name><surname>Vermote</surname><given-names>E.</given-names></name><name><surname>Saleous</surname><given-names>N.E.</given-names></name><name><surname>Kaufman</surname><given-names>Y.J.</given-names></name><name><surname>Dutton</surname><given-names>E.</given-names></name></person-group><article-title>Data preprocessing: stratospheric aerosol perturbing effect on the remote sensing of vegetation: correction method for the composite NDVI after the Pinatubo eruption</article-title><source>Remote Sens. Rev</source><year>1997</year><volume>15</volume><fpage>7</fpage><lpage>21</lpage><pub-id pub-id-type="doi">10.1080/02757259709532328</pub-id></citation></ref>
<ref id="b35-remotesensing-04-00120"><label>35.</label><citation citation-type="journal"><person-group person-group-type="author"><name><surname>Farrar</surname><given-names>T.J.</given-names></name><name><surname>Nicholson</surname><given-names>S.E.</given-names></name><name><surname>Lare</surname><given-names>A.R.</given-names></name></person-group><article-title>The influences of soil type on the relationships between NDVI, rainfall, and soil moisture in semiarid Botswana. II. NDVI response to soil moisture</article-title><source>Remote Sens. Environ</source><year>1994</year><volume>50</volume><fpage>121</fpage><lpage>133</lpage><pub-id pub-id-type="doi">10.1016/0034-4257(94)90039-6</pub-id></citation></ref>
<ref id="b36-remotesensing-04-00120"><label>36.</label><citation citation-type="journal"><person-group person-group-type="author"><name><surname>Huete</surname><given-names>A.R.</given-names></name><name><surname>Tucker</surname><given-names>C.J.</given-names></name></person-group><article-title>Investigation of soil influences in AVHRR red and near-infrared vegetation index imagery</article-title><source>Int. J. Remote Sens</source><year>1991</year><volume>12</volume><fpage>1223</fpage><lpage>1242</lpage><pub-id pub-id-type="doi">10.1080/01431169108929723</pub-id></citation></ref>
<ref id="b37-remotesensing-04-00120"><label>37.</label><citation citation-type="journal"><person-group person-group-type="author"><name><surname>Kaufmann</surname><given-names>R.K.</given-names></name><name><surname>Zhou</surname><given-names>L.</given-names></name><name><surname>Knyazikhin</surname><given-names>Y.</given-names></name><name><surname>Shabanov</surname><given-names>N.</given-names></name><name><surname>Myneni</surname><given-names>R.</given-names></name><name><surname>Tucker</surname><given-names>C.J.</given-names></name></person-group><article-title>Effect of orbital drift and sensor changes on the time series of AVHRR vegetation index data</article-title><source>IEEE Trans. Geosci. Remote Sens</source><year>2000</year><volume>38</volume><fpage>2584</fpage><lpage>2597</lpage><pub-id pub-id-type="doi">10.1109/36.885205</pub-id></citation></ref>
<ref id="b38-remotesensing-04-00120"><label>38.</label><citation citation-type="journal"><person-group person-group-type="author"><name><surname>Zhang</surname><given-names>X.</given-names></name><name><surname>Friedl</surname><given-names>M.A.</given-names></name><name><surname>Schaaf</surname><given-names>C.B.</given-names></name><name><surname>Strahler</surname><given-names>A.H.</given-names></name><name><surname>Hodges</surname><given-names>J.C.F.</given-names></name><name><surname>Gao</surname><given-names>F.</given-names></name><name><surname>Reed</surname><given-names>B.C.</given-names></name><name><surname>Huete</surname><given-names>A.</given-names></name></person-group><article-title>Monitoring vegetation phenology using MODIS</article-title><source>Remote Sens. Environ</source><year>2003</year><volume>84</volume><fpage>471</fpage><lpage>475</lpage><pub-id pub-id-type="doi">10.1016/S0034-4257(02)00135-9</pub-id></citation></ref>
<ref id="b39-remotesensing-04-00120"><label>39.</label><citation citation-type="journal"><person-group person-group-type="author"><name><surname>Wang</surname><given-names>J.</given-names></name><name><surname>Rich</surname><given-names>P.M.</given-names></name><name><surname>Price</surname><given-names>K.P.</given-names></name></person-group><article-title>Temporal responses of NDVI to precipitation and temperature in the central Great Plains, USA</article-title><source>Int. J. Remote Sens</source><year>2003</year><volume>24</volume><fpage>2345</fpage><lpage>2364</lpage><pub-id pub-id-type="doi">10.1080/01431160210154812</pub-id></citation></ref>
<ref id="b40-remotesensing-04-00120"><label>40.</label><citation citation-type="journal"><person-group person-group-type="author"><name><surname>Hirsch</surname><given-names>R.M.</given-names></name><name><surname>Slack</surname><given-names>J.R.</given-names></name><name><surname>Smith</surname><given-names>R.A.</given-names></name></person-group><article-title>Techniques of trend analysis for monthly water quality data</article-title><source>Water Resour. Res</source><year>1982</year><volume>18</volume><fpage>107</fpage><lpage>112</lpage><pub-id pub-id-type="doi">10.1029/WR018i001p00107</pub-id></citation></ref>
<ref id="b41-remotesensing-04-00120"><label>41.</label><citation citation-type="book"><person-group person-group-type="author"><name><surname>Gliner</surname><given-names>J.A.</given-names></name><name><surname>Morgan</surname><given-names>G.A.</given-names></name></person-group><source>Research Methods in Applied Settings: An Integrated Approach to Design and Analysis</source><publisher-name>Lawrence Erlbaum Associates, Inc</publisher-name><publisher-loc>Mahwah, NJ, USA</publisher-loc><year>2000</year><fpage>135</fpage></citation></ref>
<ref id="b42-remotesensing-04-00120"><label>42.</label><citation citation-type="journal"><person-group person-group-type="author"><name><surname>Thaim</surname><given-names>A.K.</given-names></name></person-group><article-title>The causes and spatial pattern of land degradation risk in southern mauritania using multitemporal AVHRR-NDVI imagery and field data</article-title><source>Land Degrad. Dev</source><year>2003</year><volume>14</volume><fpage>133</fpage><lpage>142</lpage><pub-id pub-id-type="doi">10.1002/ldr.533</pub-id></citation></ref>
<ref id="b43-remotesensing-04-00120"><label>43.</label><citation citation-type="journal"><person-group person-group-type="author"><name><surname>Li</surname><given-names>J.</given-names></name><name><surname>Lewisa</surname><given-names>J.</given-names></name><name><surname>Rowland</surname><given-names>J.</given-names></name><name><surname>Tappan</surname><given-names>G.</given-names></name><name><surname>Tieszen</surname><given-names>L.L.</given-names></name></person-group><article-title>Evaluation of land performance in Senegal using multi-temporal NDVI and rainfall series</article-title><source>J. Arid Environ</source><year>2004</year><volume>59</volume><fpage>463</fpage><lpage>480</lpage><pub-id pub-id-type="doi">10.1016/j.jaridenv.2004.03.019</pub-id></citation></ref>
<ref id="b44-remotesensing-04-00120"><label>44.</label><citation citation-type="journal"><person-group person-group-type="author"><name><surname>Anyamba</surname><given-names>A.</given-names></name><name><surname>Eastman</surname><given-names>J.R.</given-names></name></person-group><article-title>Interannual variability of NDVI over Africa and its relationship to El Ninõ/Southern Oscillation</article-title><source>Int. J. Remote Sens</source><year>1996</year><volume>17</volume><fpage>2533</fpage><lpage>2548</lpage><pub-id pub-id-type="doi">10.1080/01431169608949091</pub-id></citation></ref>
<ref id="b45-remotesensing-04-00120"><label>45.</label><citation citation-type="journal"><person-group person-group-type="author"><name><surname>Kogan</surname><given-names>F.N.</given-names></name></person-group><article-title>Global drought watch from space</article-title><source>Bull. Am. Meteorol. Soc</source><year>1997</year><volume>78</volume><fpage>621</fpage><lpage>636</lpage><pub-id pub-id-type="doi">10.1175/1520-0477(1997)078&lt;0621:GDWFS&gt;2.0.CO;2</pub-id></citation></ref>
<ref id="b46-remotesensing-04-00120"><label>46.</label><citation citation-type="journal"><person-group person-group-type="author"><name><surname>Frank</surname><given-names>A.B.</given-names></name></person-group><article-title>Evapotranspiration from northern semiarid grasslands</article-title><source>Agron. J</source><year>2003</year><volume>95</volume><fpage>1504</fpage><lpage>1509</lpage><pub-id pub-id-type="doi">10.2134/agronj2003.1504</pub-id></citation></ref>
<ref id="b47-remotesensing-04-00120"><label>47.</label><citation citation-type="journal"><person-group person-group-type="author"><name><surname>Magagi</surname><given-names>R.D.</given-names></name><name><surname>Kerr</surname><given-names>Y.H.</given-names></name></person-group><article-title>Retrieval of soil moisture and vegetation characteristics by use of ERS-1 wind scatterometer over arid and semi-arid areas</article-title><source>J. Hydrol</source><year>1997</year><volume>188</volume><fpage>361</fpage><lpage>384</lpage><pub-id pub-id-type="doi">10.1016/S0022-1694(96)03166-6</pub-id></citation></ref>
<ref id="b48-remotesensing-04-00120"><label>48.</label><citation citation-type="journal"><person-group person-group-type="author"><name><surname>Bindlish</surname><given-names>R.</given-names></name><name><surname>Jackson</surname><given-names>T.J.</given-names></name><name><surname>Gasiewski</surname><given-names>A.</given-names></name><name><surname>Stankov</surname><given-names>B.</given-names></name><name><surname>Klein</surname><given-names>M.</given-names></name><name><surname>Cosh</surname><given-names>M.H.</given-names></name><name><surname>Mladenova</surname><given-names>I.</given-names></name><name><surname>Watts</surname><given-names>C.</given-names></name><name><surname>Vivoni</surname><given-names>E.</given-names></name><name><surname>Lakshmi</surname><given-names>V.</given-names></name><name><surname>Bolten</surname><given-names>J.</given-names></name><name><surname>Keefer</surname><given-names>T.</given-names></name></person-group><article-title>Aircraft based soil moisture retrievals under mixed vegetation and topographic conditions</article-title><source>Remote Sens. Environ</source><year>2008</year><volume>112</volume><fpage>375</fpage><lpage>390</lpage><pub-id pub-id-type="doi">10.1016/j.rse.2007.01.024</pub-id></citation></ref>
<ref id="b49-remotesensing-04-00120"><label>49.</label><citation citation-type="journal"><person-group person-group-type="author"><name><surname>Coughenour</surname><given-names>M.B.</given-names></name></person-group><article-title>Graminoid response to grazing by large herbivores: Adaptations, exaptations, and interacting processes</article-title><source>Ann. Missouri Bot. Gard</source><year>1985</year><volume>72</volume><fpage>852</fpage><lpage>863</lpage><pub-id pub-id-type="doi">10.2307/2399227</pub-id></citation></ref>
<ref id="b50-remotesensing-04-00120"><label>50.</label><citation citation-type="journal"><person-group person-group-type="author"><name><surname>Keeling</surname><given-names>C.D.</given-names></name><name><surname>Chin</surname><given-names>J.F.S.</given-names></name><name><surname>Whorf</surname><given-names>T.P.</given-names></name></person-group><article-title>Increased activity of northern vegetation inferred from atmospheric CO2 measurements</article-title><source>Nature</source><year>1996</year><volume>382</volume><fpage>146</fpage><lpage>149</lpage><pub-id pub-id-type="doi">10.1038/382146a0</pub-id></citation></ref>
<ref id="b51-remotesensing-04-00120"><label>51.</label><citation citation-type="journal"><person-group person-group-type="author"><name><surname>Randerson</surname><given-names>J.T.</given-names></name><name><surname>Field</surname><given-names>C.B.</given-names></name><name><surname>Fung</surname><given-names>I.Y.</given-names></name><name><surname>Tans</surname><given-names>P.P.</given-names></name></person-group><article-title>Increases in early season ecosystem uptake explain recent changes in the seasonal cycle of atmospheric CO<sub>2</sub> at high northern latitudes</article-title><source>Geophys. Res. Lett</source><year>1999</year><volume>26</volume><fpage>2765</fpage><lpage>2769</lpage><pub-id pub-id-type="doi">10.1029/1999GL900500</pub-id></citation></ref>
<ref id="b52-remotesensing-04-00120"><label>52.</label><citation citation-type="journal"><person-group person-group-type="author"><name><surname>Zhang</surname><given-names>X.</given-names></name><name><surname>Vincent</surname><given-names>L.A.</given-names></name><name><surname>Hogg</surname><given-names>W.D.</given-names></name><name><surname>Niitsoo</surname><given-names>A.</given-names></name></person-group><article-title>Temperature and precipitation trends in Canada during the 20th century</article-title><source>Atmos. Ocean</source><year>2000</year><volume>38</volume><fpage>395</fpage><lpage>429</lpage><pub-id pub-id-type="doi">10.1080/07055900.2000.9649654</pub-id></citation></ref>
<ref id="b53-remotesensing-04-00120"><label>53.</label><citation citation-type="journal"><person-group person-group-type="author"><name><surname>Akinremi</surname><given-names>O.O.</given-names></name><name><surname>McGinn</surname><given-names>S.M.</given-names></name><name><surname>Cutforth</surname><given-names>H.W.</given-names></name></person-group><article-title>Precipitation trends on the Canadian prairies</article-title><source>J. Climate</source><year>1999</year><volume>12</volume><fpage>2996</fpage><lpage>3003</lpage><pub-id pub-id-type="doi">10.1175/1520-0442(1999)012&lt;2996:PTOTCP&gt;2.0.CO;2</pub-id></citation></ref>
<ref id="b54-remotesensing-04-00120"><label>54.</label><citation citation-type="journal"><person-group person-group-type="author"><name><surname>McPhaden</surname><given-names>M.J.</given-names></name></person-group><article-title>Genesis and evolution of the 1997–98 El Ninõ</article-title><source>Science</source><year>1999</year><volume>283</volume><fpage>950</fpage><lpage>954</lpage><pub-id pub-id-type="doi">10.1126/science.283.5404.950</pub-id><pub-id pub-id-type="pmid">9974381</pub-id></citation></ref></ref-list>
<sec sec-type="display-objects">
<title>Figures and Tables</title>
<fig id="f1-remotesensing-04-00120" position="float">
<label>Figure 1.</label>
<caption>
<p>Current holding of the west block of GNP and the distribution of the centers of biomass sampling transects in 2003 to 2005. (The star in the Canada map marks the geographic location of GNP).
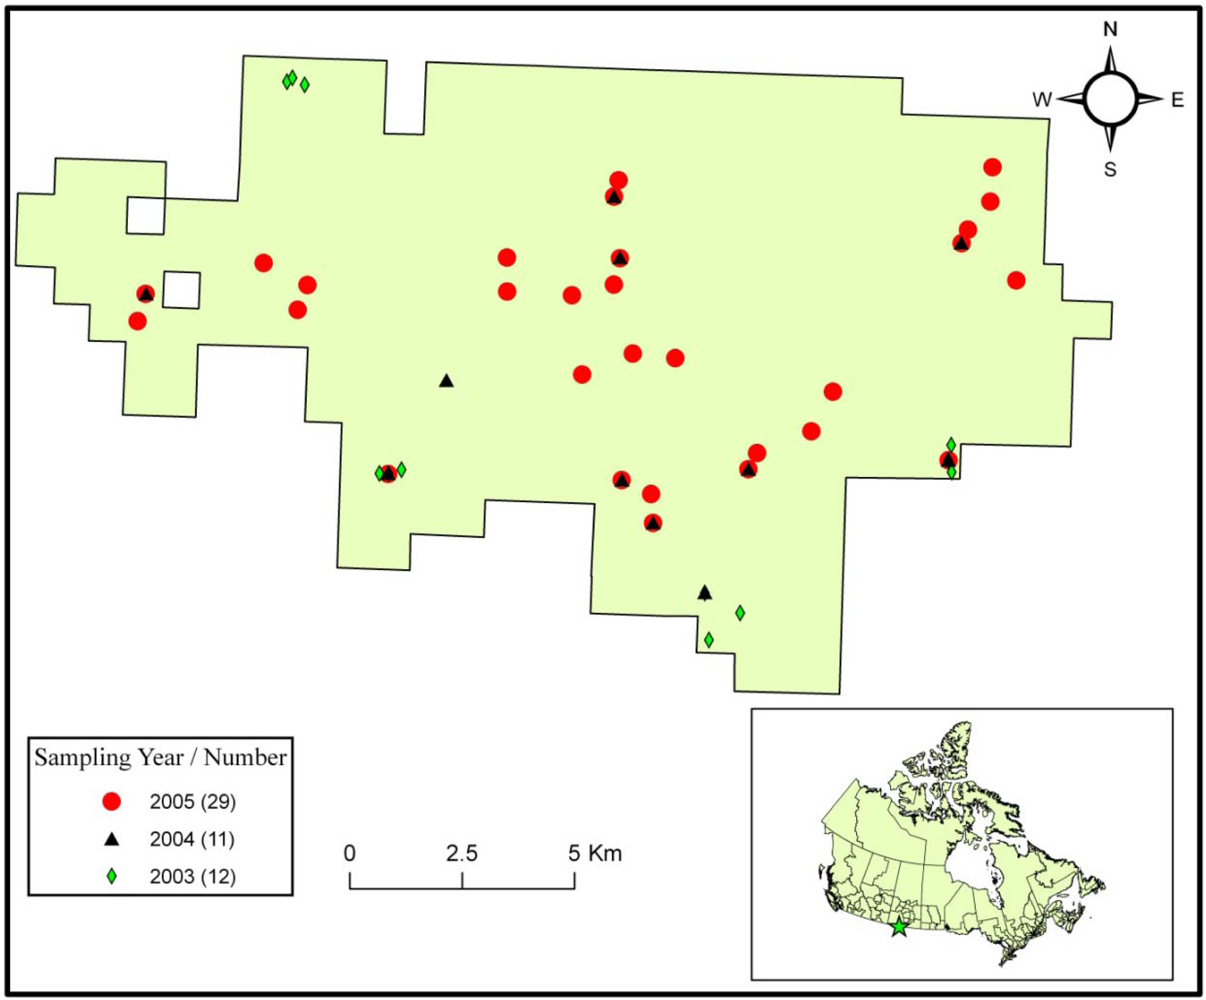
</p></caption>
<graphic xlink:href="remotesensing-04-00120f1.gif"/></fig>
<fig id="f2-remotesensing-04-00120" position="float">
<label>Figure 2.</label>
<caption>
<p>Biomass versus NDVI averaged across the specific sampling sites and the mean NDVI averaged across the entire west block of GNP from mid-June to mid-July in 2003, 2004, and 2005 (The error bars of NDVI are shown with 1 stand deviation).</p></caption>
<graphic xlink:href="remotesensing-04-00120f2.gif"/></fig>
<fig id="f3-remotesensing-04-00120" position="float">
<label>Figure 3.</label>
<caption>
<p>Intra-annual relationships between (<bold>a</bold>) NDVI and temperature, and (<bold>b</bold>) NDVI and precipitation.</p></caption>
<graphic xlink:href="remotesensing-04-00120f3.gif"/></fig>
<table-wrap id="t1-remotesensing-04-00120" position="float">
<label>Table 1.</label>
<caption>
<p>The time intervals during which precipitation is accumulated and temperature is averaged (0 indicates the current 10 day period, 1 indicates the first previous 10 day period, 2_1 indicates two periods prior to one period prior, <italic>etc</italic>.) (Adapted from [<xref ref-type="bibr" rid="b39-remotesensing-04-00120">39</xref>]).</p></caption>
<table frame="hsides" rules="groups">
<thead>
<tr>
<th align="center" valign="middle" rowspan="2"><bold>Duration</bold></th>
<th colspan="5" align="center" valign="middle"><bold>Lag</bold></th></tr>
<tr>
<th align="center" valign="middle"><bold>0</bold></th>
<th align="center" valign="middle"><bold>1</bold></th>
<th align="center" valign="middle"><bold>2</bold></th>
<th align="center" valign="middle"><bold>3</bold></th>
<th align="center" valign="middle"><bold>4</bold></th></tr></thead>
<tbody>
<tr>
<td align="center" valign="top">1</td>
<td align="center" valign="top">0</td>
<td align="center" valign="top">1</td>
<td align="center" valign="top">2</td>
<td align="center" valign="top">3</td>
<td align="center" valign="top">4</td></tr>
<tr>
<td align="center" valign="top">2</td>
<td align="center" valign="top">1_0</td>
<td align="center" valign="top">2_1</td>
<td align="center" valign="top">3_2</td>
<td align="center" valign="top">4_3</td>
<td align="center" valign="top">5_4</td></tr>
<tr>
<td align="center" valign="top">3</td>
<td align="center" valign="top">2_0</td>
<td align="center" valign="top">3_1</td>
<td align="center" valign="top">4_2</td>
<td align="center" valign="top">5_3</td>
<td align="center" valign="top">6_4</td></tr>
<tr>
<td align="center" valign="top">4</td>
<td align="center" valign="top">3_0</td>
<td align="center" valign="top">4_1</td>
<td align="center" valign="top">5_2</td>
<td align="center" valign="top">6_3</td>
<td align="center" valign="top">7_4</td></tr>
<tr>
<td align="center" valign="top">5</td>
<td align="center" valign="top">4_0</td>
<td align="center" valign="top">5_1</td>
<td align="center" valign="top">6_2</td>
<td align="center" valign="top">7_3</td>
<td align="center" valign="top">8_4</td></tr></tbody></table></table-wrap>
<table-wrap id="t2-remotesensing-04-00120" position="float">
<label>Table 2.</label>
<caption>
<p>The trends of green-up, peak growth, and senescence indicated by the <italic>Z</italic> values during the period of 1985–2007 in GNP.</p></caption>
<table frame="hsides" rules="groups">
<thead>
<tr>
<th align="center" valign="middle"><bold>Phenology</bold></th>
<th align="center" valign="middle"><bold>Green-up</bold></th>
<th align="center" valign="middle"><bold>Peak Growth</bold></th>
<th align="center" valign="middle"><bold>Senescence</bold></th></tr></thead>
<tbody>
<tr>
<td align="center" valign="top"><bold>Z value</bold></td>
<td align="center" valign="top">−0.79<xref ref-type="table-fn" rid="tfn1-remotesensing-04-00120">*</xref></td>
<td align="center" valign="top">1.75<xref ref-type="table-fn" rid="tfn1-remotesensing-04-00120">*</xref></td>
<td align="center" valign="top">0.16<xref ref-type="table-fn" rid="tfn1-remotesensing-04-00120">*</xref></td></tr></tbody></table>
<table-wrap-foot><fn id="tfn1-remotesensing-04-00120">
<label>*</label>
<p>indicates significance at the 0.10 level.</p></fn></table-wrap-foot></table-wrap>
<table-wrap id="t3-remotesensing-04-00120" position="float">
<label>Table 3.</label>
<caption>
<p>The trends of annual NDVI, temperature, and precipitation throughout the growing season, and monthly NDVI from April to October indicated by the <italic>Z</italic> values during the period of 1985–2007 in GNP.</p></caption>
<table frame="hsides" rules="groups">
<thead>
<tr>
<th align="center" valign="middle" rowspan="2"><bold>Variables</bold></th>
<th align="center" valign="middle" rowspan="2"><bold>Temperature</bold></th>
<th align="center" valign="middle" rowspan="2"><bold>Precipitation</bold></th>
<th colspan="8" align="center" valign="middle"><bold>NDVI</bold></th></tr>
<tr>
<th align="center" valign="middle"><bold>Annual</bold></th>
<th align="center" valign="middle"><bold>Apr</bold></th>
<th align="center" valign="middle"><bold>May</bold></th>
<th align="center" valign="middle"><bold>Jun</bold></th>
<th align="center" valign="middle"><bold>Jul</bold></th>
<th align="center" valign="middle"><bold>Aug</bold></th>
<th align="center" valign="middle"><bold>Sept</bold></th>
<th align="center" valign="middle"><bold>Oct</bold></th></tr></thead>
<tbody>
<tr>
<td align="center" valign="bottom"><bold>Z values</bold></td>
<td align="center" valign="bottom">0.03<xref ref-type="table-fn" rid="tfn2-remotesensing-04-00120">**</xref></td>
<td align="center" valign="bottom">0.08<xref ref-type="table-fn" rid="tfn2-remotesensing-04-00120">*</xref></td>
<td align="center" valign="bottom">0.18<xref ref-type="table-fn" rid="tfn2-remotesensing-04-00120">*</xref></td>
<td align="center" valign="bottom">0.03<xref ref-type="table-fn" rid="tfn2-remotesensing-04-00120">*</xref></td>
<td align="center" valign="bottom">0.08<xref ref-type="table-fn" rid="tfn2-remotesensing-04-00120">*</xref></td>
<td align="center" valign="bottom">0.18<xref ref-type="table-fn" rid="tfn2-remotesensing-04-00120">*</xref></td>
<td align="center" valign="bottom">0.13<xref ref-type="table-fn" rid="tfn2-remotesensing-04-00120">*</xref></td>
<td align="center" valign="bottom">0.08<xref ref-type="table-fn" rid="tfn2-remotesensing-04-00120">*</xref></td>
<td align="center" valign="bottom">0.03<xref ref-type="table-fn" rid="tfn2-remotesensing-04-00120">*</xref></td>
<td align="center" valign="bottom">0.03<xref ref-type="table-fn" rid="tfn2-remotesensing-04-00120">*</xref></td></tr></tbody></table>
<table-wrap-foot><fn id="tfn2-remotesensing-04-00120">
<p>** and * indicates significance at the 0.05 and 0.10 level respectively.</p></fn></table-wrap-foot></table-wrap>
<table-wrap id="t4-remotesensing-04-00120" position="float">
<label>Table 4.</label>
<caption>
<p>The baselines of monthly and annual NDVI and years out of baselines from 1985 to 2007.</p></caption>
<table frame="hsides" rules="groups">
<thead>
<tr>
<th align="center" valign="bottom"/>
<th colspan="2" align="center" valign="bottom"><bold>NDVI Baselines</bold></th>
<th colspan="2" align="center" valign="bottom"><bold>Years out of Baselines</bold></th></tr>
<tr>
<th align="center" valign="bottom"><bold>Time Period</bold></th>
<th align="center" valign="bottom"><bold>Low Limit</bold></th>
<th align="center" valign="bottom"><bold>Upper Limit</bold></th>
<th align="center" valign="bottom"><bold>Below Low Baseline</bold></th>
<th align="center" valign="bottom"><bold>Above Upper Baseline</bold></th></tr></thead>
<tbody>
<tr>
<td align="center" valign="top">April</td>
<td align="center" valign="top">0.02</td>
<td align="center" valign="top">0.22</td>
<td align="center" valign="top">1986, 2000</td>
<td align="center" valign="top">/</td></tr>
<tr>
<td align="center" valign="top">May</td>
<td align="center" valign="top">0.09</td>
<td align="center" valign="top">0.30</td>
<td align="center" valign="top">/</td>
<td align="center" valign="top">1999</td></tr>
<tr>
<td align="center" valign="top">June</td>
<td align="center" valign="top">0.12</td>
<td align="center" valign="top">0.40</td>
<td align="center" valign="top">/</td>
<td align="center" valign="top">1999</td></tr>
<tr>
<td align="center" valign="top">July</td>
<td align="center" valign="top">0.13</td>
<td align="center" valign="top">0.39</td>
<td align="center" valign="top">/</td>
<td align="center" valign="top">1999</td></tr>
<tr>
<td align="center" valign="top">August</td>
<td align="center" valign="top">0.08</td>
<td align="center" valign="top">0.34</td>
<td align="center" valign="top">/</td>
<td align="center" valign="top">/</td></tr>
<tr>
<td align="center" valign="top">September</td>
<td align="center" valign="top">0.07</td>
<td align="center" valign="top">0.27</td>
<td align="center" valign="top">/</td>
<td align="center" valign="top">/</td></tr>
<tr>
<td align="center" valign="top">October</td>
<td align="center" valign="top">0.06</td>
<td align="center" valign="top">0.20</td>
<td align="center" valign="top">/</td>
<td align="center" valign="top">/</td></tr>
<tr>
<td align="center" valign="top">Annual</td>
<td align="center" valign="top">0.13</td>
<td align="center" valign="top">0.32</td>
<td align="center" valign="top">/</td>
<td align="center" valign="top">1999</td></tr></tbody></table></table-wrap></sec></back></article>
