Review

Remote Sensing of Mangrove Ecosystems: A Review

1
German Remote Sensing Data Centre, DFD of the German Aerospace Centre, DLR, Oberpfaffenhofen, D-82234 Wessling, Germany
2
Geofaktur Geoconsulting, D-65195 Wiesbaden, Germany
3
Institute of Geography, Department of Remote Sensing, University of Wuerzburg, D-97074 Wuerzburg, Germany
4
Can Tho University, Can Tho, Vietnam
*
Author to whom correspondence should be addressed.
Remote Sens. 2011, 3(5), 878-928; https://doi.org/10.3390/rs3050878
Submission received: 18 February 2011 / Revised: 28 March 2011 / Accepted: 11 April 2011 / Published: 27 April 2011

Abstract

:
Mangrove ecosystems dominate the coastal wetlands of tropical and subtropical regions throughout the world. They provide various ecological and economical ecosystem services contributing to coastal erosion protection, water filtration, provision of areas for fish and shrimp breeding, provision of building material and medicinal ingredients, and the attraction of tourists, amongst many other factors. At the same time, mangroves belong to the most threatened and vulnerable ecosystems worldwide and experienced a dramatic decline during the last half century. International programs, such as the Ramsar Convention on Wetlands or the Kyoto Protocol, underscore the importance of immediate protection measures and conservation activities to prevent the further loss of mangroves. In this context, remote sensing is the tool of choice to provide spatio-temporal information on mangrove ecosystem distribution, species differentiation, health status, and ongoing changes of mangrove populations. Such studies can be based on various sensors, ranging from aerial photography to high- and medium-resolution optical imagery and from hyperspectral data to active microwave (SAR) data. Remote-sensing techniques have demonstrated a high potential to detect, identify, map, and monitor mangrove conditions and changes during the last two decades, which is reflected by the large number of scientific papers published on this topic. To our knowledge, a recent review paper on the remote sensing of mangroves does not exist, although mangrove ecosystems have become the focus of attention in the context of current climate change and discussions of the services provided by these ecosystems. Also, climate change-related remote-sensing studies in coastal zones have increased drastically in recent years. The aim of this review paper is to provide a comprehensive overview and sound summary of all of the work undertaken, addressing the variety of remotely sensed data applied for mangrove ecosystem mapping, as well as the numerous methods and techniques used for data analyses, and to further discuss their potential and limitations.

1. Introduction to the Methodology of Remote Sensing of Mangrove Ecosystems

Remote sensing has been widely proven to be essential in monitoring and mapping highly threatened mangrove ecosystems [1,2,3,4,5,6]. Many research studies on this subject have been carried out around the globe. Tropical and subtropical coastal mangroves are among the most threatened and vulnerable ecosystems worldwide [7]. The habitat area loss during the last two decades is estimated to be about 36% of the total global mangrove area [8]. Although the rate of decrease has slowed since the 1980s, the average annual loss rate of mangroves of −0.66% during the years 2000–2005 is still alarming [8].
Because mangrove ecosystems have an outstanding relevance ecologically and economically, there is an urgent demand for conservation and restoration measures. Therefore, retrieving up-to-date information with regard to the extent and condition of mangrove ecosystems is an essential aid to management and policy- and decision-making processes. Typical mangrove habitats are temporarily inundated and often located in inaccessible regions; consequently, traditional field observation and survey methods are extremely time-consuming and cost intensive. To address these issues, large-scale, long-term, cost-effective monitoring and mapping tools are required, which are available by means of remote-sensing technology [9,10,11,12,13,14,15].
Remote sensing of mangroves provides important information for:
  • Habitat inventories (determination of extent, species and composition, health status);
  • Change detection and monitoring (land use, land cover, conservation and reforestation success, silviculture, and aquaculture development);
  • Ecosystem evaluation support;
  • Productivity assessment (biomass estimation);
  • Regeneration capacity estimation;
  • Multiple management requests (fisheries, aquaculture activities, conservation management, management guidelines and strategies);
  • Field survey planning;
  • Water-quality assessment;
  • Prompt information supply for disaster management; and
  • Aid delivery to gain a better understanding of ecological and biological relations and processes, functions, and dynamics [4,9,13,16,17,18,19,20,21,22,23,24].
The aim of this paper is to provide a critical analysis and an overview of remote-sensing research activities published during the last two decades. A short overview of mangrove ecosystems and their benefits is followed by a description of remote-sensing applications in the field of mangrove analyses and monitoring categorized by their spatial resolution: aerial photography, high-resolution imagery (e.g., IKONOS, QuickBird), medium-resolution imagery (e.g., Landsat series, SPOT), hyperspectral imagery (e.g., Compact Airborne Spectrographic Imager (CASI)), and radar (Synthetic Aperture Radar [SAR]) data analyses. In this context, the different methodological approaches for remote-sensing data information extraction and the generation of value-added products are also investigated. A discussion on the difficulties and future challenges of remote sensing of mangroves follows, before this paper summarizes with conclusions.

1.1. Spatial Distribution of Mangrove Ecosystems

One hundred and twenty-four countries located between 30°N and 30°S are home to highly productive mangrove ecosystems [8]. They cover up to 75% of the tropical and subtropical shorelines (see Figure 1) [16,25]. The halophytic evergreen woody mangroves typically fringe the transition zone between land and sea in intertidal coastal regions, estuary, and reef environments, which are characterized by strong winds, varying inundation, high temperatures, and anaerobic muddy soil [26,27]. Mangroves growing within equatorial regions achieve their maximum biomass. These favorable conditions enable an optimal lush growth, with tree canopies reaching a height of 30–40 m [8,28]. Because of the lower temperature level, the amount of biomass declines with increasing latitude [29,30]. Under less favorable environmental conditions, mangroves form isolated patches of dwarf-stunted habitus, with canopies reaching a height of 1–2 m.
Figure 1. Generalized global distribution of mangroves and diversity of mangrove species per 15° of longitude (Source: adapted from Tomlinson 1986 [28]).
Remotesensing 03 00878 g001
It is assumed that the total area of mangroves covers between 167,000 km2 [7] and 181,000 km2 [25]. The largest amount of mangroves can be found in Southeast Asia, where they are best developed and have the highest species diversity (see Figure 1).

1.2. Characteristics of Mangroves and Mangrove Ecosystems

Mangroves are shrubs and trees of medium height that grow between 25–30°S up to 25–30°N (depending on investigator and definitions) and are able to survive in brackish water, sea water, and salty evaporation pools with up to twice the salinity of ocean water. Sometimes, the term “mangrove” is used for all species of trees and shrubs tolerating these salty conditions; other times, it is used only for the mangrove family (Rhizophoraceae) or trees of the genus Rhizophora. Of about 110 known mangrove species, about 54 species in 20 genera from 16 families constitute the group of “true mangroves” occurring only in mangrove habitats.
According to Tomlinson, the term “mangrove” describes the intertidal ecosystem or the highly adopted plant families that live in this coastal environment [28]. Most of the mangrove genera and families are not closely related to each other, but what they do have in common is their highly developed morphological, biological, physiological, and ecological adaptability to extreme environmental conditions [26,30]. The most important characteristics to achieve this kind of adaptability are pneumatophoric roots (Avicennia, Sonneratia species), stilt roots (Rhizophora, Brugueria, Ceriops species), salt-excreting leaves, and viviparous water-dispersed propagules [26]. Mangroves build communities parallel to the shoreline. The species composition and structure depend on their physiological tolerances and competitive interactions [31]. Distance from the sea or the estuary bank, frequency and duration of tidal inundation, salinity, and composition of soil are crucial environmental factors [8,27,28,29,30,32]. Mangroves exhibit a high degree of ecological stability with regard to their persistence and resilience [31]. However, they are highly sensitive to changes, especially within hydrological environments (e.g., water-quality changes), which go beyond their ecological range of tolerance; thus, the ecosystems act as change indicators on a broader scale [30].

1.3. Ecological and Economical Benefits of Mangrove Ecosystems

Mangroves are considered to behave like a natural barrier against ocean dynamics along the shoreline. Their ability to protect shoreline and inland areas from natural hazards (hurricanes, cyclones, tsunamis) was recently discussed [31,33,34,35,36,37,38,39]. They can break the force of waves and help to prevent coastal-erosion processes [40,41,42,43]. Mangrove ecosystems support aquatic food chains and form habitats for marine fauna, such as juvenile crabs, prawns, offshore fish, reef fish, and larvae [44,45,46,47]. Naylor et al. [47] assumed that about one third of the coastal and offshore adult fishes caught in Southeast Asia grow up in mangrove forests. Terrestrial fauna, such as birds, insects, mammals, and reptiles, and associated flora, such as fungi, algae, and sea grass, build rich communities with mangroves [26,45,46,48,49]. Mangroves are able to maintain the water quality by acting as biological filters, separating sediments and nutrients in polluted coastal areas [27,50,51]. Furthermore, mangroves are important for the carbon balance of the coastal zone [52,53].
Additionally, mangroves are most beneficial to humans and contribute to their livelihood in a crucial manner [31,51]. Any changes in their growth behavior correlate directly with the quality of local human life. Mangrove ecosystems provide important products and services that can be divided into four categories [25,26,27,44,46,49,51,54,55,56]:
  • Regulating: see above (e.g., shoreline protection);
  • Providing: fisheries, aquaculture, construction material, fuel, tannins, honey, traditional medicine, paper, and textiles;
  • Cultural: tourism and recreation, spiritual; and
  • Supporting: see section above (e.g., nursery habitats, nutrient cycling).
It was estimated that the annual economic value of mangrove ecosystems is US $9,990/ha [57]. Sathirathai and Barbier [58] rated the economic value much higher: between US $27,264 and $35,921/ha, calculated for mangroves in a local community in Thailand.

1.4. Need for Mangrove Protection and Reforestation

The globally determining factor of mangrove loss is affected by the conversion of mangrove areas into shrimp farms [11,47,59,60]. The share of aquaculture-based business is still very high in developing nations [5,21,29,58,61,62,63]. This portion accounts for a global mangrove loss of more than 50% [7,51]. Industrial lumber and wood chip operations [51], increasing human populations, industrialization, and agriculture have caused dramatic forest loss as well [61,64,65]. In addition to the natural progression and succession stages of the ecosystem, a significant amount of the loss is triggered by natural forces, such as tsunamis, cyclones [66], and the threat of global warming [29,31,64,67,68,69,70]. The related reduction in mangrove-related services and product delivery imposes serious limitations on the local residents [51,62].
Anthropogenic and natural threats have an effect on marine life and on terrestrial biological diversity, as well as on adjacent ecosystems, such as sea grass beds and coral reefs [23,62,64,70,71]. As a consequence of the loss of mangroves, the natural tidal system is altered or totally disturbed: tidal creeks are blocked, fisheries decline, sedimentation rates decrease, and toxic waste pollution, such as antibiotic impact from aquaculture, grows. Additional problems include salinization of coastal soils, increased erosion, land subsidence, land degradation, and extended exposure of coastlines to wave surges [21,29,35,49,61,62,72]. Reforestation and rehabilitation programs geared toward the sustainable use of mangroves have been successful to some extent [66,71,73,74]. One of the most important and global-acting programs is the Ramsar Convention on Wetlands. This is an intergovernmental treaty, which provides the framework for national action and international cooperation for the wise use of wetlands and their resources (http://www.ramsar.org/). Important sites, such as the Sundarbans, the world’s largest area of mangroves, are affiliated with this program.

2. Characteristics for Identifying Mangroves in Remotely Sensed Data

Mangroves grow at the land–sea interface. Therefore, the three major features contributing to the pixel composition in remotely sensed imagery are vegetation, soil, and water (see Figure 2). Any mixture of the individual surface appearance is also influenced by seasonal and diurnal intertidal interactions. These circumstances greatly affect the spectral characterization of the image components, and Blasco et al. [10] described them as the major obstacles to a rigorous radiometric characterization.
Figure 2. Mangroves in Ca Mau Province, Vietnam, January 2010.
Remotesensing 03 00878 g002
Additionally, the diversity of mangrove species in Asia is much higher than in the tropical or subtropical regions of the New World [75]. This is very important for remote-sensing applications, because such circumstances aggravate discrimination difficulties as the result of a higher amount of spectrally unique species. The most important species (the leading species) in the Indonesian and West Pacific region belong to the genera Rhizophora, Avicennia, Sonneratia, and Laguncularia. Single species dominating the mangroves in Africa and America are the red mangroves (Rhizophora mangle L.), the black mangroves (Avicennia germinans L.), and the white mangroves (Laguncularia racemosa).

2.1. Mangrove Characteristics in Optical Remotely Sensed Data

Textural and spectral characteristics of the canopy and leaves are the main features used to distinguish among mangrove communities [75]. Their structural appearance, partially more homogeneous or heterogeneous, depends on several factors, such as species composition, distribution pattern, growth form, density growth, and stand height. Meza Diaz and Blackburn [76] described the spectral variations of the canopy reflectance as a function of several optical properties, such as leaf area index (LAI), background reflectance, and leaf inclination. The spectral signature of a single species is defined by age, vitality, and phenological and physiological characteristics [10]. Periodic climatic changes that influence the leaf dynamics of foliation and leaf senescence may also have an impact on the spectral response [77]. Wang et al. [77] observed a flush of fresh red mangrove leaves after seasonal rainfalls during the early wet season in Panama. This led to the inference that imagery of the early wet season is very helpful because of the greater spectral distinction among species.
Spectrometer data of two variant mangrove species, acquired during a field campaign into the mangrove regions of Vietnam in 2010 (see Figure 3), showed that species differ because of their principal biophysical and chemical properties [78], such as water, cellulose, lignin, and protein content, as well as the key leaf pigments chlorophyll a and b and carotenoids. The spectral-response signal also depends on the internal leaf structure, mainly composed of palisade parenchyma and spongy mesophyll, as well as the number of cell layers, intercell spaces, air–water interfaces, and cell size.
Figure 3. Spectral characteristics and their influencing parameters of the mangrove species Avicennia marina and Rhizophora conjugate as measured with an field spectrometer in Ca Mau Province, Vietnam, January 2010. Stacks of at least eight layers of mangrove leaves were measured, filling the instantaneous field of view, IFOV, of the spectrometer to grant optimal leaf area index (LAI) conditions without background transmission.
Remotesensing 03 00878 g003
Discrimination in the 380- and 750-nm wavelength domain, based on the spectral response of the leaf pigments, is relatively weak (see Figure 3) because of the similar amounts of pigment across most of the species [22]. The near-infrared signal reveals different reflections in relation to the internal leaf structure and facilitates mangroves discrimination [78]. Furthermore, Vaiphasa et al. [22] hypothesized that the spectral distinction caused by other leaf components interacting with electromagnetic radiation at longer wavelengths in the near- and mid-infrared regions might work even better. These leaf components include salt, sugar, water, protein, oil, lignin, starch, and cellulose, as well as the leaf structure. However, additional comparable studies must be performed to confirm this assumption.
Additionally, intertidal effects and the soil type influence the spectral signal of plant communities [10,76]. Mangroves with lower-stand density are significantly affected by intertidal effects; the sparser the vegetation canopies, the greater the influence of the ground surface. For example, in medium-resolution imagery, the reflection of mudflats in the background may result in a spectral signal that can easily be confused with urban residential areas [79].

2.2. Expression of Mangrove Backscatter in Radar Data

Imagery derived from radar systems, especially SAR, is much more difficult to interpret than is optical imagery [80]. Here, the signal’s intensity is measured as a so-called “backscatter coefficient” (σ°) in decibels (dB). Because microwaves can be transmitted under various configurations, varying in wavelength, polarization of transmitted and received signals, and incidence angle, the same surface can yield different backscatter coefficients. The interactions between the radiation and the plant’s internal properties (e.g., moisture content influencing the dielectric constant of a material, cell structure, etc.) and external components (e.g., size, geometry, and orientation of leaves, trunks, branches, and aerial or stilt roots) result in a specific backscatter signal (see Figure 4).
Figure 4. Dominating backscatter mechanisms at different stages of mangrove growth depending on bandwidth of the radar beam.
Remotesensing 03 00878 g004
Mougin et al. [81] and Proisy et al. [82,83] investigated the relationships between airborne SAR data, for various polarization and multifrequency modes, and the structural components of mangroves for a study area in French Guiana. The following table (see Table 1) describes these interactions and the general relationships found by Wang and Imhoff [84], Aschbacher et al. [9], Kasischke et al. [80], Mougin et al. [81], Proisy et al. [82,83,85], Lucas et al. [86,87], and Kovacs et al. [88].

3. Review of Remote Sensing-Based Studies and Methods on Mangrove Ecosystems

For more than two decades, remotely sensed information has been used to obtain facts and data on the condition and extent of threatened mangrove ecosystems. Table 2 provides an overview of the most commonly used sensors and methodologies applied over the last 20 years.
Table 2 depicts the large variety in remote-sensing studies carried out during the past decades. However, because mangroves are difficult to differentiate, a basic prerequisite for any image-analyses approach is the realization of an intensive field campaign. A proper understanding of the local situation requires random-sampling ground-survey activities to verify and calibrate image-analyses results. However, such intensive field work is often hindered by the inaccessibility of areas within the mangrove ecosystem.
Table 1. Characteristics of the backscatter signal depending on mangrove structural components, biomass, and forest stand.
Polarization
FrequencyGeneral informationVVHHHV
C-band
-
Penetration into the upper part of the canopy, few meters within the crown
-
Interaction with leaves and small branches
-
Increase in backscatter is indicative of changing forest structures
-
Sensitive to crown characteristics (number, density, size, and leaf orientation) and canopy structure (architecture and heterogeneity)
-
Above-ground biomass saturation in SAR response at 50 t DM ha-1
-
High sensitivity to increasing biomass
-
Highest correlation with canopy parameters
-
Highest correlation for tree height and diameter
-
High sensitivity to increasing biomass
-
Related to variations in the canopy structure
-
Highest correlations for tree height and diameter
-
Significant relationship with LAI (greater at larger incidence angle)
-
High correlation between backscatter coefficient and mean stem height (larger coefficient at smaller incidence angle)
-
High coefficients for determination of mean DBH, tree height, and basal area
L-band
-
Deeper canopy penetration, involving scattering from trunks and ground surface
-
Volume scattering predominates by interaction with multiple branches of various sizes
-
Increase in backscatter is indicative of changing forest structures
-
Double-bounce scattering between trunks and ground
-
Sensitive for biomass
-
Above-ground biomass saturation in SAR response at 100 t DM ha-1
-
Soil–vegetation interaction and direct backscattering from soil surface
-
Domination of volume scattering with increasing biomass
-
Soil–vegetation interaction and direct backscatter from soil
-
Domination of volume scattering with increasing biomass
-
Mapping of flooding in forests, high specular backscatter signal of flooded surfaces
-
Double-bounce trunk-ground term is enhanced by the presence of water; the smaller the incidence angle, the more dominant this term
-
Canopy volume scattering dominates for stands under non-flooded ground
-
High correlation with forest parameters (zonation, basal area, height, biomass level, growth stages)
-
Best correlation for biomass
-
Backscatter coefficient of biomass is greater at smaller incidence angles
P-band
-
Penetration reaches underlying soil and water surface
-
Double-bounce effects
-
High sensitivity to forest parameters
-
Above-ground biomass saturation in SAR response at 150 t DM ha-1
-
High interaction with soil surface; intensity is dependent on soil moisture and roughness, as well as length and sizes of trunks
-
No correlation with total biomass
-
High correlation with total biomass
-
High correlation with total biomass, showing the largest sensitivity
-
Best correlation for biomass
Table 2. Overview of sensors and methods used for the assessment of mangrove ecosystems during the past 20 years (see “References” for exact source).
SensorVisual interpretation/on-screen digitizingVegetation IndicesLAIPixel-based classification (unsupervised, supervised)Neural network classificationDecision tree classifier (rule based)Object-based methodsSpectral unmixingSAM
In situ measurementsIn situ measurements[4,75,89,127,136,174]
Laboratory measurementsField spectrometer/spectroradiometer[15,22,141,175][75,76][76,139][139]
Aerial photography/videography and digital imageryCIR videography[92,94][92]
CIR photography, aerial photographs[11,23,74,96,97,98,99,100,103][13,86,90,91,93,95]
High-resolution imageryQuickBird[132,138] [2,24,125,132,133][24]
IKONOS[41,130,138][136][136,137][24,41,77,134,139][77][24,77,134,135][139]
SensorVisual interpretation/on-screen digitizingVegetation Indices (e.g., NDVI)LAIPixel-based classification (unsupervised, supervised)Neural network classificationDecision tree classifier (rule based)Object-based methodsSpectral unmixingSAM
Medium-resolution imageryASTER[6,110,122]
SPOT 1-4[9,19,32,40,89,105,116,120,129][75,89,124,126][75][1,9,16,19,21,72,79,89,103,105,118,122,123,125,129,150,177][89,109]
IRS 1C/1D LISS III/IV[20,113,115,120][108]
Landsat-7 ETM+[14][31][18,31,73,102,128]
Landsat-5 TM[20,89,97,113,117][3,5,75,89,112,124,176][3,9,13,89,106,110,111,112,119,121,123,125,177,178][5][89,107,114,128]
Landsat MSS[120][3,5][3,110][5][107,114]
Hyperspectral Data
AirborneAISA+[175][144][144][144]
CASI[89][4,89][4][4,12,89][12][89][12]
Hymap[141]
AVIRIS[143]
Dedalus[142]
SpaceborneEO-1 Hyperion[145][145]
RADAR Data
AirborneAIRSAR[81,82,83,85,87][12][12][12]
SpaceborneALOS PALSAR[147]
ERS-1/2[9,146][9,151][155][155]
JERS-1[9,87][9,129][155][155]
Envisat ASAR[88][88]
Radarsat-1 SAR[149][149]
SIR-C[150][150]
SIR-B[84]

3.1. Overview of Mangrove-Mapping Studies Based on Aerial Photography

For several decades, aerial photography has been the dominant remote-sensing technology applied to analyze surface events. Surprisingly, very few studies on mangroves have been published. Green et al. [17,89] remarked that the lack of appropriate publications or presentations makes it difficult to obtain an overview of realized studies. The dawn of spaceborne remote sensing during the 1970s and 1980s pushed aerial-imagery analyses into the background. However, since the beginning of the new millennium, new aerial-photography approaches have been used for mangrove observations. Seventeen studies undertaken in six countries (Australia [13,86,90,91,180]; Texas, US [92,93,94,95], Sri Lanka [23,96,97], Panama [98], Kenya [74,99], and Venezuela [100]) have been reviewed; most of them were conducted after 2000. In the 1990s, only Everitt and colleagues [92,93,94] conducted detailed studies on the Texas Gulf Coast using color-infrared (CIR) aerial imagery and airborne video imagery. They investigated the extent of damage on black mangroves (A. germinans L.) after a hard freeze in 1983 and 1989. Black mangroves in this temperate coastal region occur in major homogeneous concentrations and show a high spectral distinction from other forms of vegetation. They pointed out that video imagery is a very effective medium for mapping black mangroves [92], as are CIR aerial image datasets [93,94]. A comparable analysis of digitized aerial black-and-white photography over a period of two decades, published by Benfield et al. [98], assessed the extent of changes within the mangrove belt in Punta Mala Bay, Panama before and after road construction and water-treatment equipment were built in 1998.
Aerial photography seems to be very suitable for highly detailed mapping in very small and narrow coastal environments. Dahdouh-Guebas et al. [15] identified changes based on aerial photographs from 1956, 1974, and 1994 for Galle, Sri Lanka through visual interpretation of mangrove assemblages, which are dominated by different species. For this interpretation, they adopted an identification key developed by Verheyden et al. [23]. This key was the result of intensive preliminary field work carried out in Sri Lanka, with the main objective of developing a visual-interpretation method for the aerial photography to provide detailed maps on mangrove genus level. Color, texture, structure, and other image attributes were used for species identification [23]. The limitation of this jointly developed interpretation key lies in the inability to apply it to other mangrove regions with different species, compositions, and environmental conditions. Kairo et al. [101] worked out a discrimination key, solely developed for their own purpose of mapping mangrove forests in the Kiunga Marine National Reserve in Kenya, using aerial panchromatic photography. Their mangrove forest map accentuates productive and non-productive mangroves, including information about tree density and tree height on the species level. In addition, the mangrove forest maps deliver reliable contemporary information to support mangrove forest management.
In addition to the aforementioned application of visual-interpretation techniques for mangrove mapping and observation, further investigations using automated-classification methods were carried out. Lucas et al. [102] assessed the temporal dynamic of mangroves along the West Alligator River in Australia with an unsupervised ISODATA classification tool applied to digital ortho-mosaics, derived from black-and-white photos taken in 1950, and color stereo photography taken in 1991. They used the datasets to generate a mangrove canopy digital terrain model. It was difficult to obtain accurate estimations of the 1950s black-and-white digital elevation model, DEM, heights because of interpolation problems. The derived DTM height values obtained from the color-stereo imagery showed an overall correspondence with field-derived canopy height information with some over- and underestimations; however, in the end, they allowed an impressive insight into the mangrove canopy height structures [86].
Colour infrared aerial photos taken at a low altitude over Moreton Bay in Queensland, Australia were analyzed by Dale et al. [90]. They investigated the impact of changes in an altered mangrove habitat of 6 ha of tidal salt marsh exposed to human-induced modifications undertaken because of a mosquito-breeding problem. Furthermore, aerial color photography was used by Manson et al. [13] to estimate the extent of narrow fringe mangroves in two regions in northern Australia. They used image stacks of low-pass filtered bands and principal component bands to which they applied an unsupervised ISODATA-clustering algorithm. Verification based on field survey data indicated a high accuracy.
In the past, aerial images were, in most cases, the only information source on the extent and condition of mangroves. Therefore, they are often used to track temporal changes, as presented recently in the studies of Benfield et al. [98] and Calzadilla Pérez et al. [100]. An evaluation of mangrove dynamics (e.g., mangrove clearing, natural loss, newly planted mangroves) over 25 years (1973–1997) was carried out in a study by Manson et al. [180] in southeast Queensland, Australia. They assessed changes in mangrove distribution and extension using spatial-temporal pattern metrics and change-detection analyses. They concluded that pattern metrics were relatively insensitive to fine resolutions (<50 m) and, therefore, were more applicable to remotely sensed data with medium resolution. In a later study, Seto and Fragkias [5] successfully used pattern metrics to measure mangrove fragmentation on a Landsat MSS and TM dataset (see section 3.2). Aerial photography was also used for change-detection approaches in the Sinnamary Estuary in French Guiana by Fromard et al. [32]. The investigators created aerial-image time series from 1951 to 1999 to identify coastal changes that took place over the last five decades and to relate them to natural processes of turnover and replenishment of mangrove forests. The coastline changes and the mangrove dynamics from 1951 to 1999 were analyzed through the production of synthetic digital maps; they showed an alternation of net accretion (1951–1966) and erosion periods (1966–1991), followed by the present accretion phase. For mapping changes of land cover between 1968 and 2003 in the Ca Mau Province, Vietnam, Binh et al. [103] used 58 aerial photographs from 1968 and 154 images from 1992 assembled into a photographic overview mosaic to identify land cover changes over this long-term period. They identified a rapid increase in shrimp farming from 1997 onward, and a forest area decline (mainly mangroves) of 75%, of which 60% was due to demand for agricultural land, and 40% was due to the development of new shrimp farms. Today, shrimp farming has become the major source of mangrove loss in the Cai Nuoc district of Ca Mau province [103].
The particular properties of high spatial resolution provided by aerial photography allow the mapping of even narrow coastal areas with fringing stands, which are typical for these ecosystems. For this reason, aerial photography is an excellent source of local to regional information, if field data are not available. In this case, aerial photography can be essential for the accurate assessment of classification procedures performed on other, lower-resolution, data. However, the feasibility of obtaining appropriate images depends on flight conditions, local weather, and the occurrence of clouds, which are typical in tropical and subtropical latitudes.
Nevertheless, aerial photography is an indispensable technique, in particular for the local mapping of mangroves, local change detection, and habitat-management support.

3.2. Overview of Mangrove Mapping Studies Based on Medium-Resolution Data

Conventional spaceborne satellite sensors have played an important role in mapping mangroves over large geographical regions. More than 40 research studies applying medium-resolution imagery in more than 16 countries have been reviewed. The different sensors used, the number of different methodologies applied, the location of the research sites (which exhibit varying environmental conditions and plant biodiversities), and the purpose of each study make it extremely difficult to compare the success of the applied methods and their results.
Data most commonly used stems from Landsat-5 TM and SPOT. Also, data from Landsat MSS, Landsat-7 ETM+, the Indian Remote Sensing Satellite (IRS) 1C/1D LISS III, and the Advanced Spaceborne Thermal Emission and Reflection Radiometer (ASTER) were used by some investigators (see Table 2).

Applications

Medium-resolution imagery provides multispectral surface information on regional scale and serves a multitude of applications.
The availability of commercial spaceborne satellite data for approximately three decades is useful for change-detection applications. Change detection is a powerful tool to visualize, measure, and, thus, to better understand trends in mangrove ecosystems. It enables the evaluation of subtle changes over a long period of time (trends) as well as the identification of sudden changes due to natural or dramatic anthropogenic impacts (e.g., tsunami destruction or conversion to shrimp farms) [104]. Distribution, condition, and increase/decrease are, in general, the measured features often used in change-detection applications of mangrove forests [3,12,19,29,32,103,105,106,107,108,109,110,111,112,113,114,115] Change detection is also performed for most of the following application purposes.
The local variability of studies spans all continents. Aschbacher et al. [9] assessed the ecological status of mangroves discriminated by age, density, and species in Phangnga Bay, Thailand. In a similar environment, Thu and Populus [72] assessed the status and change of mangrove forests in Tra Vinh province in the Mekong Delta, Vietnam between 1965 and 2001. Rasolofoharinoro et al. [19] produced the first inventory map of a mangrove ecosystem in the Mahajamba Bay, Madagascar based on SPOT imagery. Gang and Agatsiva [116] successfully used visual interpretation for SPOT XS imagery in Mida Creek, Kenya to map the extent and status of mangroves, whereas Wang et al. [117] identified changes in the distribution and the total area occupied by mangroves along the Tanzanian coast using 1990 Landsat TM and 2000 Landsat-7 ETM+ scenes. Conchedda et al. [109] mapped the land cover in the mangrove ecosystem located in Low Casamance, Senegal by applying SPOT XS imagery from 1986 and 2006. Blasco et al. [1] and Blasco and Aizpuru [118] presented a mangrove-ecosystem mapping on a regional scale using SPOT multispectral imagery. They analyzed ecosystems along three major rivers in the tropical Bay of Bengal—the Ganges, the Irrawaddy, and the Mekong—and included criteria, such as phenology, physiognomy, and density of the mangrove stands.
Mangrove density is influenced by natural factors, as well as by humans, such as aquaculture occurrence and density (see also Figure 5). Tong et al. [21] assessed the impact of shrimp aquaculture on mangrove ecosystems in the Mekong Delta using SPOT scenes from 1995 and 2001. They identified five ecologically distinct landscape classes but had difficulty applying the same method in a second study area a few hundred kilometers away.
Figure 5. Example of a mangrove mapping result, based on a hybrid classification of SPOT 5 and TerraSAR-X data for Ca Mau Province in the Mekong Delta of Vietnam, 2010. Based on these two datasets, different species and different stand characteristics (mangroves only and mangroves mixed with aquaculture) can be differentiated.
Remotesensing 03 00878 g005
With regard to the impact of natural disasters, Blasco et al. [40] evaluated and mapped the magnitude of the flooding after two cyclones in the Sundarbans, Bangladesh with SPOT XS. They compared and analyzed SPOT XS datasets using visual interpretation before and several weeks after the floods. The result demonstrated the importance of wooden mangroves as a protective shield against floods. Temporal resolution proved to be a critical point: it took a long time (mean, 5–10 weeks) after the cyclone to acquire cloud-free optical images for flood-related damage assessment [40]. Also, after the disastrous tsunami on 26 December 2004, remote-sensing–based investigations along the coastlines of the Indian Ocean were initiated to measure the damage and evaluate the repercussions. Sirikulchayanon et al. [119] examined the impact of the 2004 tsunami on mangrove vegetation in Phangnga Bay, Thailand with regard to their function as wave barriers. A Landsat-7 ETM+ dataset provided data before the impact, whereas Landsat TM supplied similar data after the tsunami (on 30 December 2004). They proposed an approach that “provides a more reliable and accurate means than conventional methods to evaluate spatial patterns of damaged areas through different land characteristics along the coastline.” There was major damage (mean change of 26.87%) to land cover in their study area, in all four subregions, in those geographic locations with low mangrove coverage that were in close proximity to the coastline, whereas less damage (mean change of only 2.77%) was apparent in locations with high mangrove coverage [119]. According to these investigators, a mangrove belt of 1,000–1,500 m, parallel to the coast, would be optimal to weaken the destructive impacts of tsunami waves in the hinterland.
In contrast, the successful effect of restoration conditions and reforestation status on degraded areas was monitored by Selvam et al. [20]. They used Landsat TM and Indian Remote Sensing Satellite IRS 1D LISS III datasets acquired in 1986 and 2002, surveying the Pichavaram mangrove wetland in India. Their findings indicated that the mangrove forest cover increased about 90% over the 15-year time span, which they mainly attributed to the combined science-based, but community-centered, approach of reforestation, supported by the Tamil Nadu Government, as well as the mangrove-user communities themselves.
Remote-sensing–derived products have found an increased relevance to support local conservation-planning tasks. Seto and Fragkias [5] presented a methodology for systematic monitoring in the context of the Ramsar Convention on Wetlands. They analyzed a time-series of Landsat MSS and TM data from the Red River Delta, Vietnam between 1975 and 2002, calculating mangrove extent and density, extent of aquaculture, and landscape fragmentation to assess the land cover condition as a function of time. Based on the results of artificial neural network classification—characterization of the amount of fragmented landscapes—pattern metrics, such as patch size, patch density, fragmentation, and isolation pattern, have been calculated. Their findings indicated that the Ramsar Convention could not diminish aquacultural development, but that the total extent of mangroves remained unchanged as a result of the extensive reforestation efforts [5].

Methods

There is also great variation in image-processing methods and algorithms. The methods are applied exclusively or in combination (see Table 2).
An important mangrove-mapping method consists of visual-interpretation analyses and on-screen digitizing. Because of good results on the regional scale, particularly in combination with detailed ground information as reference input, visual-interpretation methods are used extensively to map complex ecosystems [20,40,116,117,120]. Also, simple unsupervised and supervised classification methodologies are frequently used for mangrove mapping [3,12,16,21,106,110,111,119,121].
Several studies have been carried out to investigate and compare the suitability of various classification algorithms for the spectral separation of mangroves [79,89,122]. In general, according to the literature, application of the supervised Maximum Likelihood Classifier (MLC) is the most effective and robust method for classifying mangroves based on traditional satellite remote-sensing data [9,19,21,79,89,122,123]. Classification results were improved by incorporating bands with transformed spectral information. For example, Green et al. [89] dramatically improved the classification accuracy differentiating between mangroves and other vegetation forms based on Landsat TM bands and bands derived from principal components analysis (PCA). Additional applications of PCA-generated bands were used by Binh et al. [103], Green et al. [124], and Kovacs et al. [111]. Béland et al. [106] and Green et al. [89] incorporated the use of Tasselled Cap-derived information. Rasolofoharinoro et al. [19] used the vegetation index (VI) and brightness index (BI) as additional bands to the multispectral-layer stack for a supervised classification of a SPOT scene. The BI clearly improved the discrimination of bare soils from mangrove vegetation [19].
Also, the NDVI is widely used in preclassification steps to separate vegetation from non-vegetation and mangrove from non-mangrove vegetation [21,72,89,103,125]. Jensen et al. [126] found that NDVI data derived from SPOT XS correlated to a high degree (r = 0.913) with the percentage of mangrove canopy closure. Canopy-closure charts or density maps provide additional information on the dynamics of mangrove vegetation and their health status [3,5,75,112,114]. The degree of canopy closure can be used for estimations of canopy structure, which can be described in terms of LAI, defined as total leaf surface area per unit ground surface [124,127]. Ramsey and Jensen [75] identified a strong relationship (R2 = 0.84) between LAI data derived from in situ mean values of canopy closure and the estimated NDVI for numerous satellite platforms, which was confirmed by the work of Green et al. [124]. LAI measurements are valuable input for modeling ecological processes, such as photosynthesis, transpiration, evapotranspiration, and net primary production, as well as gas, water, carbon, and energy interchange within a forest region [124,127].
In addition to these pixel-based approaches, several applications use spatial neighborhood properties for object-based classification. Ruiz-Luna and Berlanga-Robles [114] and Berlanga-Robles and Ruiz-Luna [107] performed a multitemporal landscape change detection on the Mexican Pacific coast with Landsat MSS and TM data from 1973 to 1997. The datasets were preprocessed by applying a supervised-classification analysis using the Extraction and Classification of Homogeneous Objects algorithm. However, the moderate classification accuracy achieved determined only the trend of changes, although the mangrove class was the most accurately classified one [107]. Conchedda et al. [109] mapped land cover in Low Casamance, Senegal using SPOT XS data and an object-based–classification method. Furthermore, they performed a change-detection analysis based on the object-oriented mappings as a second step. For their mapping, they applied a multiresolution segmentation and class-specific rules incorporating spectral properties and relationships between image objects [109]. The change-detection approach was performed by means of a region-growing algorithm on a multidate composite for the years 1986 and 2006. The classification results of SPOT data supplied in 2006 allowed a clear separation between the different land cover classes within the research area, as well as within the mangroves classes. Also, Myint et al. [128] applied an object-oriented approach with lacunarity-transformed bands of Landsat TM to map three mangrove species in Trang Province, Thailand. Lacunarity is a measure of how a fractal fills space. It is used to further classify fractals and textures which, although sharing the same fractal dimension, appear very visually different. The result demonstrated the superiority of such a procedure in comparison with the commonly used pixel-based Maximum-Likelihood classification approach.
The occurrence and distribution of species are strongly related to the prevailing ecological conditions, which can be exploited for mapping mangroves at a greater level of discrimination. Vaiphasa et al. [6] chose the pH value of soil as an ecological parameter that is strongly associated with the occurrence of certain mangrove species at Talumpuk Cape in the Pak Phanang District of Thailand. Thus, a soil pH map was fused with ASTER data using a Bayesian probability model in a postclassification step. The spectral distinction of different mangrove species was improved upon compared with the images from the previous classification. Different types of additional vector data are often used in combination with change-detection applications or the combination of environmental attributes and spectral information [6,9,72,119].
Medium-resolution satellite imagery is suitable for mapping mangrove areas on a regional scale. The spectral and spatial resolution of satellite data are sufficient for many purposes. On a regional mapping level, mangrove–non-mangrove vegetation classes [21,89,108,117], density differences [9,19,20,72,79,111,113,120,122,129], condition status [20,40,120,123], and, in some cases, mangrove community-dominating species [103,116], could be clearly discriminated.
The effects of spectral and spatial resolution were investigated by Gao [123] at Waitemata Harbour, New Zealand. The objective was to differentiate between lush and stunted mangrove areas. Landsat TM (30 m), SPOT XS (20 m), and SPOT XS, used with SPOT XP data having a 10-m resolution, were processed using Maximum Likelihood Classification. The Landsat TM data proved to be more suitable than were the SPOT XS data to distinguish among the mangrove classes. The higher spectral resolution provided by Landsat TM allows an enhanced interpretation of other vegetation classes, often incorrectly identified as mangroves (e.g., pasture, forest). Furthermore, Gao [123] stated that, even after the introduction of the 10-m panchromatic band for SPOT XS, the classification accuracy for the mangrove class was improved only slightly. The results of Green et al. [89] are comparable. They compared Landsat TM and SPOT XS datasets for their suitability on Turks and Caicos Islands of the British West Indies. They concluded that multispectral SPOT data were unsuitable for separating mangroves from other vegetation forms in the Eastern Caribbean. This result was independent from other methods applied in this study (e.g., visual interpretation, ISODATA classification, Maximum Likelihood Classification). They assumed that the low spectral resolution of SPOT XS data was responsible for the unsuccessful attempt to identify mangroves. At the same time, greater spatial resolution increases the number of surface objects that have similar spectral signals and hampers the ability to clearly distinguish mangroves [9,19,123]. Nevertheless, the spatial resolution of SPOT data still enables mangrove-zonation mapping [9]. Therefore, any vegetation adjacent to mangroves could play an important role in the proper subsequent discrimination. However, the application of Landsat TM imagery is also critical, taking into account the coarse spatial resolution of 30 m. Mangrove habitats fringe coastal zones in small strips that are often <50 m in cross-section. To ensure that Landsat TM imagery is applicable, the size of an inland mangrove field should be a multiple of the pixel size of 30 m [13,123].

3.3. Overview of Mangrove-Mapping Studies Based on High-Resolution Optical Data

The successful launch of IKONOS-2 in 1999 and QuickBird in 2001 made a new generation of high-resolution spaceborne sensors available for earth observation. This opened up new opportunities for the mapping of mangroves with improved discrimination and increased the differentiation between mangroves stands and other species assemblages. Relatively little research has been published using such high-resolution imagery to investigate mangrove ecosystems:
  • Spatial distribution and current state [130];
  • Species discrimination [2,77,131,132,133,134];
  • Biomass estimation [135];
  • Assessment of vegetation indices, LAI [136,137];
  • Change detection [125,130]; and
  • Assessment of the protective role of mangroves in coastal protection [138].
These investigations were carried out on mangrove sites in India [138], Taiwan [125], Sri Lanka [131], Malaysia [139], Kenya [132], Egypt [133], French Guiana [135], Panama [24,77,134], Belize [130], Mexico [136,137], and Texas [2].
Several data-interpretation methods and processing techniques have been used, including pixel-based, object-based, linear unmixing, and neural-network analyses. Further details are presented below. Olwig et al. [138] assessed the important protective role of woody coastal vegetation against the tsunami waves of 24 December 2004 based on visual interpretation of IKONOS and QuickBird imagery captured in the region of Tamil Nadu, India. They concluded, from analyzing the spatial distribution of damage relative to woody vegetation along the coast, as well as transects detailing the amount of damage behind the coastline and the coastal woody vegetation, that the mangrove forests and coastal shelterbelts definitely provided protection from the tsunami.
A two-step analysis of QuickBird imagery was applied by Lee and Yeh [125] for the Danshui River estuary in Taipei, Taiwan. They calculated the NDVI to create a vegetation mask and then they carried out Maximum Likelihood Classification to determine mangrove and non-mangrove areas. They obtained high accuracy for the two resulting classes. Using QuickBird imagery, Everitt et al. [2] compared ISODATA clustering and MLCs to discriminate black mangrove communities in the Texas Gulf Coast region. The obtained results for both classification methods were sufficiently accurate, but more acceptable results were gained through the supervised-classification approach.
The goal of using high-resolution satellite imagery is identification to the species level or of species associated with different conditions with regard to their location. It is of utmost importance to assess the variety of ecosystem functions, processes, and relationships concerning single species or assemblages to better understand the history of mangrove growth and diversity and to predict future developments [6,130,132,133]. The benefit of high-spatial resolution is the increasing variety and fineness of textural structures. Comparing the two most commonly used sensors for the same ground target area, IKONOS imagery captures a more detailed spectral reflectance [24]. Maximum Likelihood Classification results from IKONOS demonstrated better spectral discrimination of mangrove species than did analyses based on QuickBird data. In this case, the higher spatial resolution of QuickBird is not an asset; the ability to provide spectral discrimination is the essential factor [24].
Rodriguez and Feller’s [130] work focused on identification of the current distribution and land-cover changes caused by deforestation on the Twin Cays Archipelago, Belize. They used aerial black-and-white imagery (1986) and IKONOS datasets taken in 2001 and 2003. The vegetation on Twin Cays is dominated by red, black, and white mangroves [130]. To create boundary polygons and to facilitate vegetation classifications, PCA, NDVI calculation, and intensity, hue, and saturation (IHS) transformation were performed. By means of on-screen digitization using visual interpretation and ground-truth information, they distinguished seven main land-cover classes (black and red mangroves, mixed forest, and five other non-mangrove classes). On a more detailed level, they identified seven subclasses of black mangrove and eight subclasses of red mangrove, based on a classification scheme considering growth height and density of the forest structure, as well as tidal flow influences.
To test the applicability of IKONOS imagery for mapping mangroves on the assemblage and species level, Dahdouh-Guebas et al. [41] calculated various image composites (true- and false-color composite at 4-m resolution, pan-sharpened 1-m false-color composite) and transformations (Tasselled Cap transformation, PCA) and used unsupervised- (ISODATA algorithm) and supervised-classification algorithms (parallelepiped classifier, minimum distance, Bayesian classifier). The results were compared with on-screen digitized results gained by visual interpretation. Compared with the other approaches [131], the pan-sharpened false-color composite incorporates the greatest information quality, generating a high degree of spatial detail, texture, and structure. In combination with visual interpretation and ground-truth information, this method allows for the best discrimination of mangrove species assemblages and even distinguished between two mangrove species belonging to the same genus (Rhizophora apiculata and R. mucronata) in Pambala, Sri Lanka.
As mentioned above, using visual interpretation yields good results for high-resolution imagery for mangrove mapping on a detailed species level. Nevertheless, to really enable differentiation at the species level, detailed field information about habitat conditions and floristic characteristics of the existing mangroves is a basic prerequisite. However, misclassifications can still result because of the human eye’s inability to use the full multispectral information content simultaneously (only three bands at a time, displayed in R,G,B) and the general limitations of the human eye to distinguish between tonality and hue on a very fine level [132]. Thus, an additional aim is to generate mangrove maps on species level, applying automatic-classification approaches.
In current high-resolution data, the spectral value of a pixel is no longer sufficient for discrimination purposes. The increasing spatial resolution drives up the variability of values progressively, resulting in confusion and overlapping boundaries in the feature space [77]. This hinders the separation of spectral classes of objects. Therefore, the application of image-segmentation algorithms, as well as of textural and environmental features as discrimination parameters, is of increasing importance for mangrove mapping.
Wang et al. [24] underscored this idea in their research, performing a pixel- and object-based classification in a separated and a combined approach. Data from 1-m multispectral IKONOS was used to support the objective of discriminating different cover types, including mangroves of different species composition, at Punta Galeta, Panama. They investigated three classification methods: maximum likelihood as a pixel-based classifier, object-based classification, and a hybrid classification integrating both methods. The MLC and the object-based approach provided good results individually (88.9% and 80.4%, respectively); however, the combined approaches increased the accuracy to 91.4%. Also, confusion classes could be better discriminated using the hybrid methodology.
In addition to these combined approaches, the incorporation of texture bands stacked to the original spectral bands provided very good results. Although texture features derived from first-order statistics make only minor contributions to support the spectral distinction of mangrove species [24], texture features of second-order statistics (contrast, correlation, entropy) clearly improve the classification results. However, applying second-order textural information without considering spectral information leads to insufficient accuracy for IKONOS and QuickBird imagery [24].
Kanniah et al. [139] experienced similar effects in their investigation of mangrove species discrimination when interpreting 4-m multispectral IKONOS imagery from a research site in Malaysia. They compared maximum likelihood classification results using spectral bands individually and in combination with texture information, as well as the minimum distance classifier to characterize the mangrove extent. Determining the minimum distance achieved the poorest result, with 63.6% overall accuracy, whereas MLC showed a greater accuracy (68.2%). The greatest overall accuracy (81.8%) was achieved using all spectral bands jointly, with bands including synthetic information, such as contrast, entropy, and correlation, from second-order statistics of panchromatic bands. Additionally, they applied linear spectral unmixing on IKONOS 4-m imagery. The output images for each end member showed the proportion of the surface element contained in each pixel. As end members, they used two species of the same genus [131] ( Rhizophora apiculata, Rhizophora muscronata, a third species representing the class “other,” and a soil fraction). They inferred that the resulting proportion maps produced reliable results, especially for R. apiculata. The suitability of applying spectral unmixing on high-resolution four-bands data is addressed in the Discussion.
Also, neural-network approaches were tested to determine their efficiency on 4-m high-resolution multispectral IKONOS imagery for mangrove discrimination on the species level (red, black, and white mangroves). Wang et al. [77] compared three classification methods for a test site at Punta Galeta, Panama: a back-propagation, feed-forward neural-network classifier with two hidden layers of 24 and 12 neurons (BP:24:12); a newly developed clustering-based neural network classifier (CBNN); and a pixel-based MLC. CBNN and MLC applications achieved the best results for mangrove discrimination. In a second run, second-order texture information, such as contrast, entropy, and angular second moment from the gray-level co-occurrence matrix, was calculated based on the panchromatic band; thereafter, it was resampled to 4-m resolution and stacked with the multispectral input bands. After carrying out CBNN and MLC, the new classification results showed improved accuracy, especially for mangrove species discrimination, compared with the use of spectral bands only.
The usefulness of LAI estimation from high-resolution imagery was also tested for mangrove mapping. Kovacs et al. [136] investigated the suitability of 1-m multispectral IKONOS satellite data for biomass estimation of mangrove species, even those displaying degraded health. LAI in situ-measured data from 124 plots in the Agua Brava Lagoon System of Nayrit, Mexico were acquired using a hand-held LAI-2000 Plant Canopy Analyzer. The mean NDVI and simple ratio (SR) were calculated from IKONOS imagery for each plot. Applied regression analyses showed significant positive relationships between in situ LAI values and NDVI and SR, which was confirmed by further statistical tests. Next, Kovacs et al. [137] generated an estimated LAI map based on the NDVI. The estimated LAI values were separated into four classes: red, healthy white, poor condition white, and dead mangroves [137]. Their results were generally very satisfactory, but some difficulties remain. Different LAI values within a single mangrove tree or among mangroves of the same species occurred within these classes.
Proisy et al. [135] used a different methodology on IKONOS 1-m panchromatic and 4-m near-infrared data to estimate the total above-ground biomass based on canopy grain analysis in French Guiana. The Fourier-based Textural Ordination (FOTO) method combines two techniques: a Fourier transformation and a PCA of the Fourier spectra. These textural FOTO indices, derived from the first three main axes of principal components, capture the entire gradient of canopy grain, observed from youngest to decaying mangroves stages [135]. The amount of biomass has been estimated by multiple linear-regression models applied to the three main axes, which enables the estimation of total above-ground and trunk biomass. The advantage of this kind of imagery is that there is no signal saturation, as happens, for example, with SAR data (see section 3.5).
Various approaches have been tested and assessed; however, the application of high-resolution imagery for mapping mangroves species is still in its early stage and, therefore, suitable comparisons are very difficult to perform. The spectral resolution inherent in high-resolution imagery is very limited, and the bandwidth is too broad for complex goals, such as species discrimination. Confusion typically originates from single species (e.g., Rhizophora and Avicennia), because it is difficult to discriminate them spectrally [24]; however, it is possible to map on the species level. Even congeneric species are recognizable [131,139], but this depends on the ecosystem conditions, the species diversity, the composition of mangroves, and the analyst’s influence when visually interpreting the image.

3.4. Overview of Mangrove-Mapping Studies Based on Airborne Hyperspectral Data

Hyperspectral data provide new opportunities for mapping mangrove forests by providing a large number of very narrow bands (<10 nm) in the 0.38–2.5-µm range. This greatly increases the level of detail, because a characterization of the complete spectra of mangrove cover types is possible [4]. Measurements beyond the non-photosynthetic spectral range facilitate new possibilities to differentiate mangroves based on additional components, such as leaf water content, leaf chemistry in relation to ecosystem, and environmental changes [22,140]. The ability to detect physiological stress conditions by spectral reflectance and, especially, to support mangrove monitoring and management [178], is of great value.
Airborne HyMap imagery was used by Ong et al. [141] to measure the effects of iron ore dust on mangroves in Port Hedland, Australia. Iron ore dust (from nearby rock weathering, deflation, and mining activities) has a strong spectral effect on the green leaves. Thus, a distinct difference between clean and dusty leaves is expected. Iron oxide can be spectrally characterized by a broad absorption at 860 nm, and it is distinctive in the visible (iron oxide absorption band at 518 nm) and short-wave (1,700–2,500 nm) regions [141]. Therefore, simple band combinations within these spectral ranges could be used to distinguish between clean and dusty leaves.
The thermal infrared spectrum of airborne DEDALUS imagery was used as an indicator of the distribution of water beneath the canopy of mangroves [142]. The investigators did not adjust or calibrate the image data because they did not want to retrieve actual temperatures per se, but large-scale airborne scanning in the thermal band at 8.5–13 µm was obtained for a mangrove and salt marsh in subtropical eastern Australia. For open sites, the raw image values were strongly positively correlated with ground level temperatures, whereas for sites under mangrove canopy cover, image values indicated temperatures 2–4 °C lower than those measured on the ground. The raw image was useful in identifying water bodies under canopy and has the potential to identify channels of deeper water. According to Dale et al. [142], these findings “could facilitate modification to increase flushing in the system, thereby reducing mosquito larval survival.”
Hirano et al. [143] applied data acquired from the Airborne Visible/Infrared Imaging Spectrometer (AVIRIS), providing 224 bands and 20-m spatial resolution, to map the vegetation in Everglades National Park in Florida, USA. The mapping result was compared with a pre-existing detailed GIS wetland vegetation database compiled by manual interpretation of 1:40,000-scale CIR aerial photographs. They found that accuracies for single-vegetation classes differed greatly, ranging from 40% for scrub red mangroves (R. mangle) to 100% for spike rush (Eleocharis cellulosa) prairies. They attributed the low accuracies for mangroves to the relatively low spatial resolution, the complexity of image-processing procedures for their untrained personnel, and a lack of stereo views (e.g., useful for canopy differentiation).
Green et al. [89] performed a comparison of methods and sensors to assess their suitability for mapping mangroves (compare section 3.2). CASI data, with a configuration setting of eight spectral bands and a spatial resolution of 1 m, were used to study several image-processing methodologies to distinguish between nine mangrove habitats. A supervised classification of bands derived from PCA and band ratios provided highly accurate results for mangrove–non-mangrove discrimination (96% overall accuracy) and discrimination of nine habitats (85% overall accuracy). A simple supervised classification in the Turks and Caicos Islands enabled the distinction among stands of mangrove species [4]. NDVI values from CASI bands 7 and 6 showed the best relationship and prediction for canopy closure and LAI estimation, as well as a greater accuracy than the one derived from SPOT XS data [4,124]. CASI data could be used to distinguish between species of homogeneous mangrove stands; however, it was impossible to identify species within mixed mangrove assemblages, even when applying 1-m spatial resolution [4].
Four classification algorithms, including minimum distance, Mahalanobis distance, maximum likelihood, and Spectral Angle Mapper (SAM), were tested to evaluate 2.1-m Airborne Imaging Spectrometer for Applications (AISA+) hyperspectral data for black mangrove mapping within two research sites in Texas [144]. All of these methods were applied to noise-reduced hyperspectral imagery with 214 bands and to an inverse minimum noise fraction (MNF)-transformed dataset including only 20 bands. Mahalanobis distance and MLC were significantly better than minimum distance and SAM with respect to the overall classification accuracy [144]. Results obtained for SAM classification on the hyperspectral imagery showed the poorest accuracy. SAM and minimum distance methods were not suitable to spectrally separate mangrove species. The MLC was most successfully applied to the noise-reduced hyperspectral imagery and inverse MNF-transformed data.
Another application of SAM classification on hyperspectral data was used by Demuro and Chisholm [145] in the Minnamurra River estuary in New South Wales, Australia. They worked with spaceborne Hyperion imagery of 30-m spatial resolution and 105 selected noise-free bands. The resulting map includes nine non-vegetation classes, two aggregated mangrove species classes, and five other vegetation classes. With an accuracy of 76.74%, their result was lower than that of Yang et al. [144] (>84.0% for image types and sites). A second method was applied by Demuro and Chisholm [145]; they used the Mixture Tuned Matched Filtering (MTMF) technique, a hybrid method containing signal filtering and a linear spectral unmixing approach. The advantage of this technology is that there is no need to determine all spectral end members, only those of immediate interest. Initially, MNF was performed, primarily to minimize data correlation and to reduce noise. Additionally, the known end-member response of the mangrove species (Avicennia marina and Aegiceras corniculatum) was maximized, and the background was masked to unknown response [145]. The MTMF results obtained using both mangrove species end members showed nearly the same distribution as observed in the field.
The large number of narrow bands in hyperspectral imagery leads to time-intensive image-processing steps, as well as to highly correlated information. Consequently, searching for the most useful bands for mangrove discrimination is necessary. Those spectral bands that are able to deliver the greatest spectral distinction among mangroves species are the most appropriate for consecutive mapping activities.
To find these bands, Wang and Sousa [15] developed an optimal band-selection method to optimize the spectral separability of mangroves species at the leaf level. Their investigation was based on laboratory measurements of leaves derived from three mangroves species, red, black, and white mangroves, of Punta Galeta, Panama. They examined the discrimination ability on a reflectance continuum ranging from 250 to 2,500 nm and extracted six narrow bands at 780, 790, 800, 1,480, 1,530, and 1,550 nm, which provide good differentiation [15]. A ratio of the 695/420 nm bands provided the ability to distinguish between stressed and healthy mangrove vegetation. A similar study was conducted earlier by Vaiphasa et al. [22], using 16 mangrove species collected in Ao Sawi, in the province of Chumporn, Thailand. They found four spectral bands (720, 1,277, 1,415, and 1,644 nm) distinguishing these 16 mangroves species most clearly, with the exception of members of the Rhizophoraceae family. The spectral responses for these members have been spectrally too similar among themselves and in conjunction with other species. Therefore, it is likely that this will cause difficulties using hyperspectral imagery to separate mangrove classes.
In a later study, Vaiphasa et al. [78] tried a new separation method applied under laboratory conditions using the same spectral database. They used a genetic search algorithm as a selector to identify hyperspectral bands with the greatest spectral separability. Each selected spectral band was directly related to the principal physiochemical properties of plants (e.g., different leaf pigments, internal leaf structure, and water content).
In general, hyperspectral imagery is very promising for mapping mangroves on the species level. However, the investigations concentrate on little more than half a dozen researchers and countries. Hyperspectral mangrove-mapping research therefore is still in its initial stages, and the final goal is to develop a standardized methodology for mangrove-mapping applications. High hopes lie in the global and consistent availability of data of the future sensor EnMAP, a 30-m hyperspectral sensor with >200 spectral bands, whose launch is foreseen for 2014.

3.5. Overview of Mangrove-Mapping Studies and Methods Based on Radar Data

There are several reasons why spaceborne and airborne radar-imagery applications are advantageous. Because of persistent cloud cover in the tropical and subtropical regions, radar imagery is an appropriate option compared with optical remotely sensed data. Radar data deliver information that is useful for characterizing the cover extent of mangrove surfaces [146], structural parameters [9,81,82,83,85,87,102,147,148], flooding boundaries [84], health status [88,149], deforestation status [150], and the amount of total biomass [81,82,83,85]. Studies were performed at different locations in various countries based on different radar data (Mexico: RADARSAT-1 SAR, [149]; Mexico: ENVISAT ASAR [88]; Thailand: JERS-1 [129]; Thailand: ERS-1 SAR, JERS-1 SAR [9]; Bangladesh, SIR-B [84]; India and Bangladesh: ERS-1 SAR [151]; India: ERS-1 SAR [146]; India: ERS-1 [152]; Australia and South Americaaa; ALOS PALSAR [147]; Australia: AIRSAR [12]; Brazil, RADARSAT-1 [153,154]; Gabon: JERS-1, ERS-1 SAR [155]; and Madagascar: SIR-C [150]).
Several investigations were carried out to examine and describe the effects and relationships among mangrove canopy, stand structures, and the backscattering response of a SAR system, exemplified by the NASA/JPL airborne SAR (AIRSAR) system at different frequencies (C-, L-, P-band) and polarization modes (HH, VV, HV).
To improve understanding of the dominant mechanisms between incidence beams and mangrove canopy structures, experimental and theoretical basic research work, focusing on mangroves in French Guiana (compare Table 1 with section 2.2) and including laboratory measurements and simulation models, was executed by Mougin et al. [81] and Proisy et al. [82,83]. The selected research site offered an optimal cross-section of the life of healthy mangroves, comprising three main species at three different growth stages: homogeneous dense pioneer stage of gray mangroves, mature stands dominated by white mangroves, and heterogeneous open declining stands of white and red mangroves. Based on these findings, a comparative study using AIRSAR was carried out to investigate the applicability of these insights to a differently structured mangrove ecosystem on the West Alligator River, Australia, which consists of young and mature mangroves and shows a greater biodiversity than does the ecosystem at the research site in French Guiana [85,102].
Lucas et al. [86] found the greatest correlation for forest structure parameters by applying C-VV and C-HH data for the Australian site, whereas for the French Guiana site, the greatest correlations were found with cross-polarization using C-VV data.
Relationships between stand structures and backscatter responses were described by Proisy et al. [82,83] and Lucas et al. [86], including heterogeneous mature, open, declining, or regrowth stands. These stands showed an increased backscatter signal because of the degree of structural variability. Most dominant were volume scatter in C-band and double-bounce interactions at L-band. Stands with a homogeneous mature, closed canopy or dense pioneer stands deliver a lower response as a result of the smooth canopy surface. Changes in forest structure or successive zones, such as the transition from a homogeneous pioneer stage to a more heterogeneous mature stage with greater biomass, were accompanied by an increase in volume scattering in L- and C-band due to structural changes in leaf and branch dimensions [82,85]. Homogeneous stands of nearly the same height and density of different mangroves species could not be distinguished at the species level [129].
Results obtained with ALOS PALSAR (launched in January 2006) data for mangrove mapping was repeated using additional JERS-1 SAR and AIRSAR L-band applications on the West Alligator River [87]. The results were comparable to the earlier ones of Lucas et al. [86] and Proisy et al. [85] and indicated that mapping is most effective where mangroves border non-forested areas and where differences in structure, as a function of species, growth stage, and biomass distributions, occur between zones. They found that by using L-band SAR, biomass can be retrieved up to 100–140 Mg/ha, although retrieval is complicated by a noticeable decrease in L-band backscattering coefficient within higher (>200 Mg/ha) biomass stands, particularly those with extensive prop root systems [87].
With regard to biomass, there is a positive relationship between the backscatter coefficient (σ°) and the total above-ground biomass up to a biomass threshold, which causes σ° to saturate [81,82,85,155]. Low-frequency measurements are best suited for forest biomass estimations, with the largest sensitivity observed at cross-polarization mode for P- and L-bands [81,85]. Saturation values occurred at 70 t of dry matter per hectare (t DM ha−1) for C-band, 140 t DM ha−1 for L-band, and 160 t DM ha−1 for P-band [83]. Above 250 t DM ha−1, the correlation with total biomass decreases [85].
Stand and canopy structures, together with the underlying surface of water or soil and roots, are determinants of the character of the backscatter response.
The surface is very rough during the dry season or low tide with non-flooded ground, when the underlying soil contains only a minimum amount of water and the complex root system is exposed. Therefore, volume scatter dominates in L-band (HH) [84]. During the wet season or at phases of inundation, the invading water creates a smooth surface, and specular scatter dominates the data [84]. When the incident radar waves penetrate the canopy and interact with the underlying water surface and forest components, the magnitude of the returned signal may be amplified by a factor of 3–10 dB [156]. This double-bounce interaction term is more pronounced at smaller incidence angles and is slightly greater than the volume backscatter of the canopy [84]. Volume scattering dominates at larger incidence angles.
Kovacs et al. [149] examined the applicability of spaceborne SAR data using RADARSAT-1 fine beam mode with C-band (HH polarization) and two incidence angles and ENVISAT ASAR C-band with different polarization modes and varying incidence angles [88]. They monitored the health status, LAI, and other structural parameters (mean stem height, stem density, mean DBH, basal area) on a research site dominated by white mangroves in the Agua Brava Lagoon on the Mexican Pacific. A high degree of correlation between the backscatter coefficients and the estimated LAI and mean stem height was recorded for both datasets. ENVISAT ASAR achieved a similar correlation only using cross-polarized beam mode ascending at a larger incidence angle [88]. In contrast to the strong relationship between backscatter coefficients and structure components identified by Mougin et al. [81], Kovacs et al. [88,149] could not confirm such relationships using RADARSAT-1 or ENVISAT ASAR datasets. They suggested that the reason for this insufficient result may be the greater spatial resolution of the airborne SAR data, a greater range of parameters, or the degraded white mangroves themselves.
Simard et al. [155] assessed the suitability of complementary information from JERS-1 (L-band HH) and ERS-1 (C-band, VV) data. They applied a decision tree classifier and implemented texture maps to generate a land-cover map for West Gabon, including two mangrove classes. With this combined approach, they achieved an 18% improvement in mapping accuracy with respect to the single band-derived maps.
Various kinds of investigations were conducted, integrating radar data and optical remotely sensed imagery. Synergistic information on structure and composition derived from radar backscatter signals and the reflectance information from the optical imagery are most promising for vegetation-mapping applications [9,129]. Aschbacher et al. [9] used ERS-1 SAR data complementary to the classification previously done for SPOT data. The increase in the discrimination ability of the combined dataset facilitated a discrimination of different age stages in a homogeneous Rhizophora community. Also, Giri and Delsol [129] improved the number of separated classes for mangrove versus non-mangrove discrimination using SPOT XS and JERS-1 imagery. The complementary use of both datasets led to a successful separation between pure Rhizophora and Rhizophora-dominated communities, which could not be discriminated by SPOT data alone.
Further investigations using medium-resolution optical imagery in conjunction with radar (SAR) data were presented by Pasqualini et al. [150], using Space Shuttle Imaging Radar SIR-C SAR data and SPOT XS and ERS-1 radar data for mapping mangroves in Madagascar; Dwivedi et al. [151] applied ERS-1 SAR and IRS 1B LISS II data on the Sundarbans; Shanmugam et al. [152] performed a sensor fusion between IRS-1D LISS III and ERS-2 SAR imagery in Tamil Nadu, India; and Souza Filho and Paradella [153,154] worked with RADARSAT-1 fine mode C-band HH and Landsat-5 TM data in the Brazilian Amazon region. Lucas et al. [147] used the Advanced Land Observing Satellite (ALOS) Phased Array L-band SAR (PALSAR), with L-band and HH polarization, and in conjunction with other remotely sensed data, such as Landsat and Shuttle Radar Topography Mission height data. They investigated the operational capability of this data to support coastal ecosystem mapping and the monitoring of changes to promote the Japan Aerospace Exploration Agency’s (JAXA’s) Kyoto and Carbon Initiative (http://www.eorc.jaxa.jp/ALOS/en/kyoto/kyoto_index.htm), underscoring the beneficial characteristics of JAXA’s data. Figure 6 below for example shows the opportunity to discriminate between different mangrove densities based on Envisat ASAR and Terra-SAR-X data.
Figure 6. Mangrove density and class mixture information based on Envisat ASAR and TerraSAR-X data for the western tip of Ca Mau Province, Vietnam, December 2009.
Remotesensing 03 00878 g006
It is likely that the level of classification detail and mapping accuracies will increase further with an increasing number of studies facilitating SAR data and hyperspectral imagery. Held et al. [12] integrated NASA/JPL airborne polarimetric AIRSAR and hyperspectral imagery derived from CASI to map the very high biodiversity of the mangrove ecosystem at the Daintree River estuary in North Queensland, Australia. The data used contained 14 hyperspectral bands, with 2.5-m spatial resolution and three wavelengths (L- and P-bands) at full polarimetric mode, and C-band interferometric mode for the AIRSAR dataset. MLC and hierarchical neural network (HNN)-derived results showed that the integrated approach achieved greater classification accuracies for species communities based on dominant species than did those achieved by each individual sensor. HNN showed a slight improvement in overall classification accuracy of about 3% compared with the MLC result (76.5%). The application of such data allows subtle, long-term monitoring of changes [12].
Mangrove mapping is most effective where forests border non-forested areas, such as water, wetland, mudflats, and vegetation-free areas on the inland site. These structural changes are included in different backscatter responses and, therefore, they are easier to discriminate [87]. It makes a difference whether changes in the backscatter coefficient occur as a result of changing conditions within a species community or between different species communities [87]. Therefore, a priori knowledge, based on local surveys, additional optical data, or maps of zonation pattern and species communities, is essential for discrimination.

4. Discussion

Numerous studies on remote-sensing–based mapping of mangroves have been published over the last two decades. In this paper, they were divided into five sensor categories: airborne photography, optical medium-resolution, optical high-resolution, hyperspectral, and radar studies. The selection of the appropriate sensor depends mainly on the purpose of the investigation, the attainable final map scale, the discrimination level required, the time frame to be covered, special characteristics of the geographic region, and the funds and training level of personnel available for the envisioned study. Table 3, Table 4, Table 5, Table 6 and Table 7 compare the benefits and limitations of the five groups of remote-sensing data types for mangrove mapping: aerial photography, medium-resolution spaceborne multispectral imagery, high-resolution spaceborne multispectral imagery, hyperspectral imagery, and radar imagery.
Table 3. Benefits and limitations of aerial photography for mangrove mapping.
Aerial photographyBenefitsLimitations
1. Spectral resolutionRed–near-infrared spectral information with red-edge slopeNone at all or very low (R,G,B; near-infrared)
2. Spatial resolutionVery high (centimeter to meter range)Only small area is covered
3. Temporal resolutionAlways available on demandComplex acquisition of equipment and flight campaign planning is needed
4. CostsLow costs for small areasIncreasing costs with increasing spatial coverage; high costs if professional flight campaign planning and multispectral camera
5. Long-term monitoringData available for >50 years
6. PurposesLocal maps of mangrove ecosystems, parametrization, change detectionOnly local-scale studies
7. Discrimination levelSpecies communities, density parametersSometimes too much detail (hampering unbiased image processing)
8. MethodsVisual interpretation with on-screen digitizing and object-oriented approachesAutomatization usually not possible; considerable analyst bias and, thus, hampered transferability or comparability
9. OtherValuable additional information source to support field survey, image interpretation, or accuracy assessments. If overlapping pictures are acquired (stereo pairs), it is possible to derive canopy-elevation model
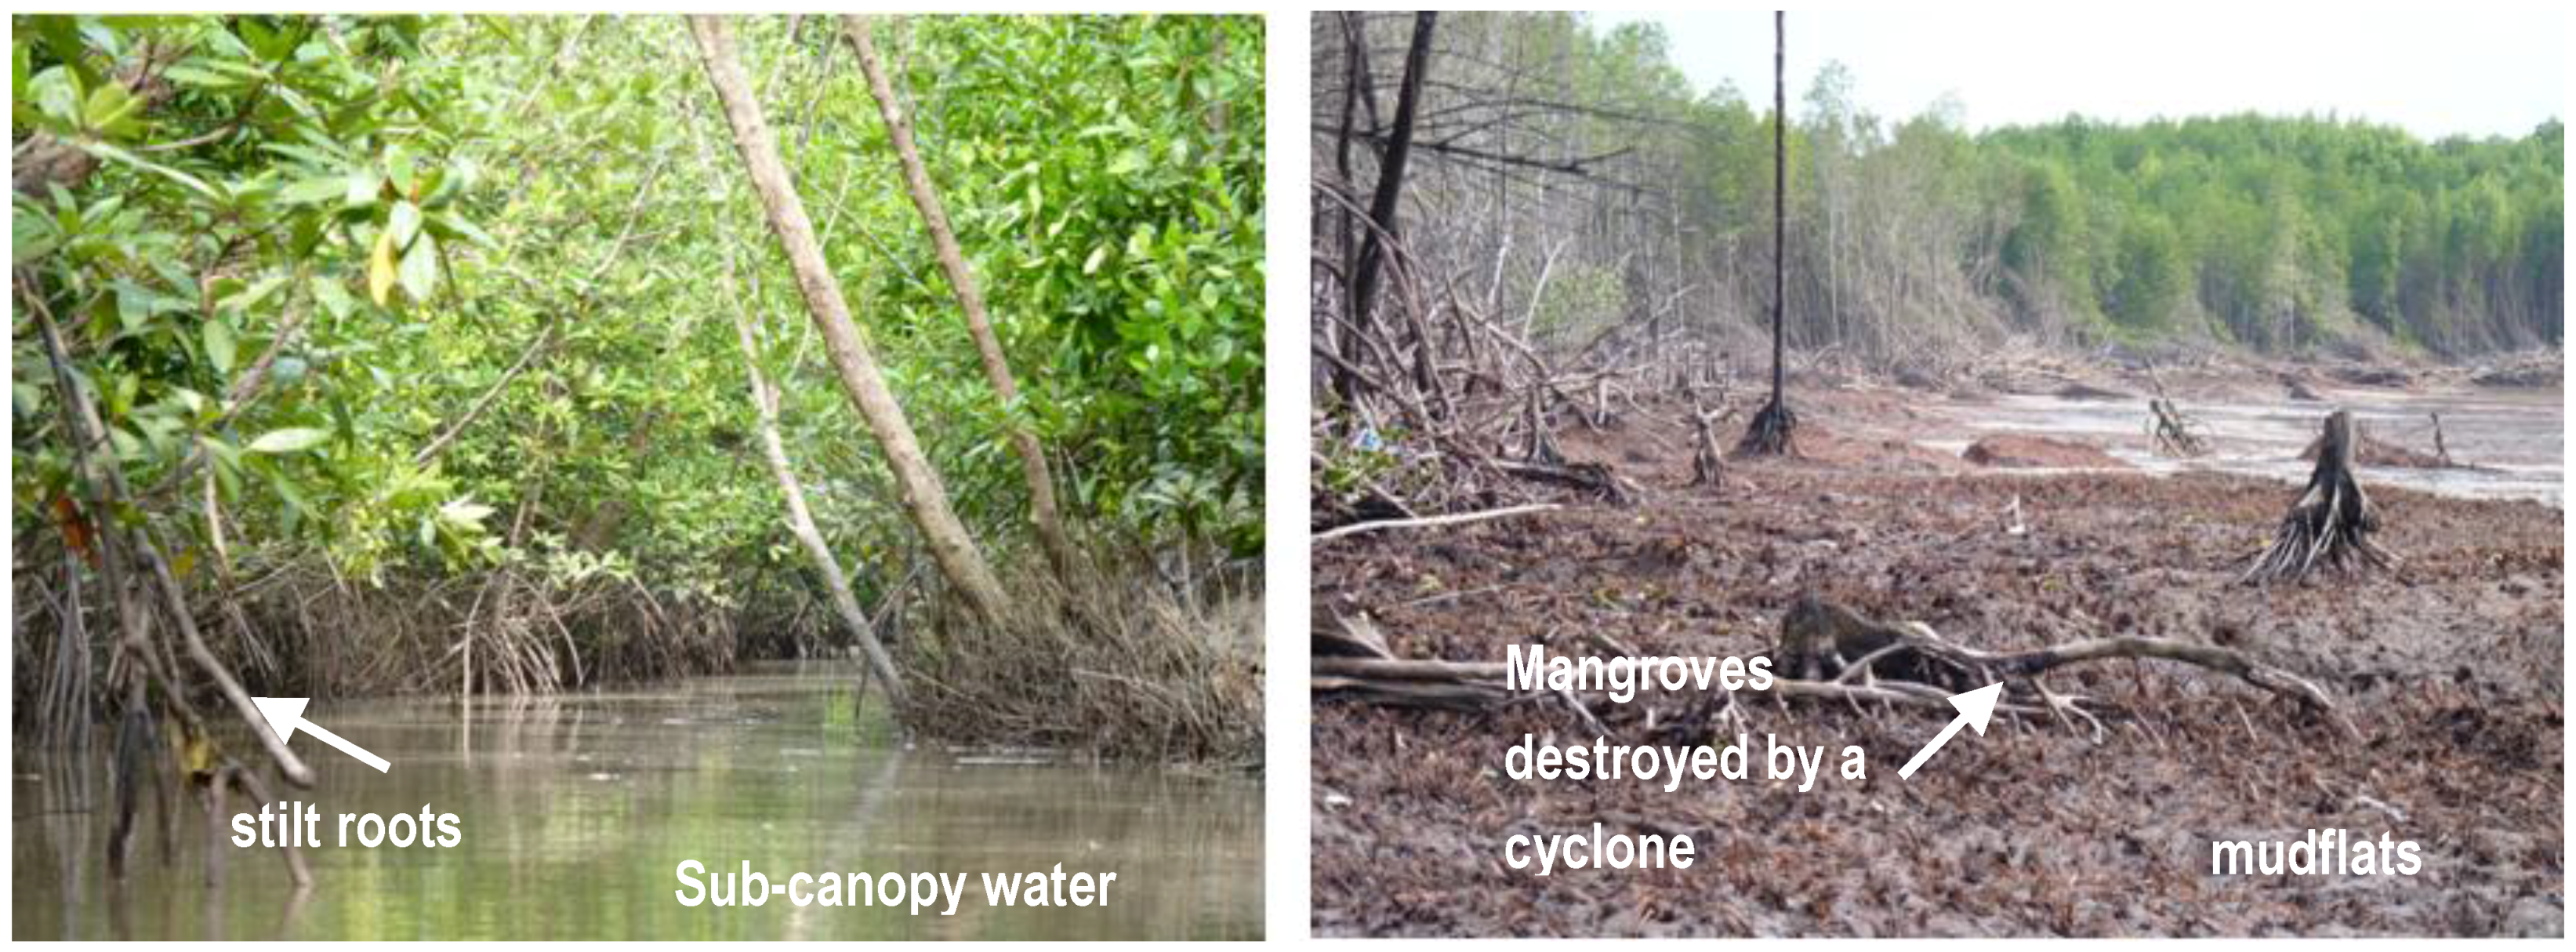
Although aerial imagery and high-resolution multispectral, hyperspectral, and radar data partially provide information with high spatial detail, which is suitable for detecting subtle changes in species composition and distribution, extent of subcanopy flooding, health condition, growth pattern, and more, which is of the utmost importance for local or regional agencies responsible for the protection and management of mangroves [157], some national agencies are more interested in updated overview information on a regional or even a country-wide scale, for their spatial planning and conservation-planning tasks, and the reporting of status and trends [157]. The advantages of using medium-resolution imagery, for example, are that it delivers appropriate coverage and information depth (see Table 4) in a cost-effective manner [9,12,75,97,123].
Table 4. Benefits and limitations of medium-resolution imagery for mangrove mapping.
Medium-resolution imageryBenefitsLimitations
1. Spectral resolutionSeveral multispectral bands, always including R,G,B; near-infrared; and oftentimes even mid-infrared; and thermal bandsSkilled trained personnel are required to best exploit the information content of the multiple bands (considering transformations, etc.)
2. Spatial resolutionIdeal for mapping on a large regional scaleToo coarse for local observations requiring in-depth species differentiation and parameterization
3. Temporal resolutionFrequent mapping (e.g., rainy season and dry season within 1 year; or repeated annual mapping) is possibleRepetition rate may be too low to record impact of extreme events (e.g., cyclones, floods, tsunamis); furthermore, very weather dependent (clouds) = critical in subtropical and tropical regions
4. CostsDepending on sensor, freely available (e.g., Landsat), very cost efficient (ASTER), or expensive (e.g., SPOT); but all are cost efficient compared with field surveys and airborne campaignsSoftware for image processing needed (common software, such as Erdas, ENVI, and ArcGIS, have high license fees), but usually not a real limitation
5. Long-term monitoringData availability over three decadesDepending on the future duration of the systems and subsequent comparable sensors
6. PurposesInventory and status maps; change detection, such as assessment of impact damages; assessment of reforestation and conservation successFor some species-oriented botany-focused studies, resolution may already be too coarse
7. Discrimination levelMangrove–non-mangrove, density variations, condition status, mangrove zonation, in rare cases also species discriminationHigh regional differences; classification Result depends highly on the ecosystem conditions, such as biodiversity, heterogeneity of forests, adjacent targets; species identification is rarely possible
8. MethodsVisual interpretation with on-screen digitizing, pixel-based, object based, and hybrid classification approaches; image transformation and analyses (PCA, TCT, IHS indices, etc.)To exploit the full potential of the data skilled analysts needed
9. OtherData easy to access or order; best explored data type and, thus, most literature available; long-term monitoring granted
Table 5. Benefits and limitations of high-resolution imagery for mangrove mapping.
High-resolution imageryBenefitsLimitations
1. Spectral resolutionRed–near-infrared spectral information with red-edge slope; usually panchromatic band allowing image fusion (pan-sharpening)Relatively few spectral bands
2. Spatial resolutionHigh resolution (0.5–4 m range) for mapping on a local scaleOnly a small area is covered
3. Temporal resolutionRegular mapping is possible on demandWeather dependent (clouds); cost intensive if repeated monitoring is requested
4. CostsModerate costs for single acquisitions (usually 2,000–10,000 Euro, depending on area)Very high costs if repeated monitoring is requested. Also, high costs of object-oriented image-processing software (e.g., Ecognition)
5. Long-term monitoringTheoretically possible, but usually not used because of expense. Sensors, such as IKONOS, QuickBird, etc., available since late 1990s/2000.Depending on the future duration of the systems and subsequent comparable sensors. Only back to the late 1990s.
6. PurposesDiscrimination of mangrove species, spatial distribution and variability, health status, parameterizationSingle-tree species discrimination usually not possible
7. Discrimination levelDown to species communities; detailed parameterizationRegional differences; classification result depends highly on the ecosystem conditions, such as biodiversity, heterogeneity of forests, adjacent targets
8. MethodsVisual interpretation with on-screen digitizing, pixel-based, object-based, and hybrid-classification approachesSkilled analysts needed to exploit the full potential of the data
9. OtherValuable information source to support field survey and accuracy assessment. Easy to close the scale gap to in situ investigationsIn some (developing/emerging) countries, data of the relevant sensors very difficult to purchase; few studies published based on the data type
In contrast to medium-resolution data, high-resolution imagery is very cost intensive. This requires a careful consideration of the reasons to apply such datasets. A further point concerns the data availability, because these data are collected according to customer-defined areas of interest. This may lead to difficulties, because the data provider might have different over-flight priorities than does the customer. Mumby et al. [14] pointed out that, for example, that IKONOS-based studies need to fulfill the following prerequirements to be cost-effective: extensive and detailed field data are available, the area of interest must be <500 km2 (only 22 × 22 km), and the monitoring of the habitat dynamics is requested at a scale <10 m.
Table 6. Benefits and limitations of hyperspectral imagery for mangrove mapping.
Hyperspectral imageryBenefitsLimitations
1. Spectral resolutionVery high, covering a broad range with narrow bandwidthsHigh data volume, bands with redundant information
2. Spatial resolutionUsually very high (centimeter to meter range)Very small area covered
3. Temporal resolutionSpaceborne: because of few sensors without long-term acquisition, maximum monthly; airborne: on demand if costs do not play a roleWeather dependent (clouds); complex acquisition of equipment is needed; very cost intensive
4. CostsNoneVery high costs for airborne campaigns and sensor operation; very high costs for personnel working in airborne or spaceborne data
5. Long-term monitoringTheoretically possible; practically not feasibleUnsuitable because of small areas covered and very high costs; will only be possible with a reliable spaceborne, operational sensor
6. PurposesMaps of mangroves on species level; highly detailed parameterization; detailed analyses of status (vigor, health, etc.)No major limitations
7. Discrimination levelSpecies communitiesNo major limitations
8. MethodsTypical hyperspectral data-analysis methods (spectral unmixing, SAM, MTMF, etc.); partially also paired with object-oriented analysesSpecialized knowledge is needed for data analysis; experience in sound hyperspectral data processing often not available; hyperspectral analyses often lead to only seemingly quantitative results (e.g., end member-fraction images)
9. OtherDetailed mapping of non-mangrove constituents also probably beneficial (e.g., different water classes, depending on sediment load, algae, etc.; or soil types)Relatively few studies have been conducted; still in a testing phase; very few spaceborne sensors available (Hyperion with questionable SNR, Sebas, etc.). See Table 3 for airborne sensor limitations
Hyperspectral imagery has similar limitations with regard to data availability. In general, it is airborne generated and, therefore, requires the coordination of a flight campaign, appropriate sensor equipment, and trained personnel. Costs are high. This challenge can be overcome in the future when spaceborne hyperspectral data of the planned sensor EnMap become available in 2014.
The wide variety of application options, available sensors, and processing methods used/performed globally on ecologically varying ecosystems is enormous. The large number of parameters involved leads to enormous difficulties in comparing data, methods, and results. Some well-accepted standards or definitions might be helpful to simplify the applied approaches for mangrove mapping and to allow better comparisons. Such standards are likely to facilitate a better understanding of the ecosystem processes and the assessment of technical investigations in a global context. The aspects suggested below might be considered an initial contribution toward simplifying the aforementioned difficulties.
Table 7. Benefits and limitations of radar imagery for mangrove mapping.
Radar (SAR) imageryBenefitsLimitations
1. Spectral resolutionActive microwave radiation; delivers alternative information about the surface structure; various wavelengths and polarizations are selectableNo spectral information
2. Spatial resolutionVariesUsually low, except TerraSAR-X
3. Temporal resolutionHigh; weather independentNone
4. CostsMany data types available at low cost in the context of science proposals (ESA, JAXA, DLR, etc.)Restricted access to data (certain number of scenes; also some data not sharable with certain developing countries (e.g., TSX)
5. Long-term monitoringGood; long-duration systemsNone
6. PurposesMangrove extent, condition, canopy properties, deforestation, biomass estimationNo information derivable from typical spectra (species differentiation not possible unless species vary in their structural appearance)
7. Discrimination levelAge structure, forest parameters, biomass estimationNo discrimination between mangroves and other vegetation forms without a priori knowledge; no separation among species
8. MethodsAnalyses of the backscatter signals using advanced image-processing techniques; very quantitative physics-based manner of image analysisExtremely skilled analysts with experience in radar-image processing needed (availability, costs)
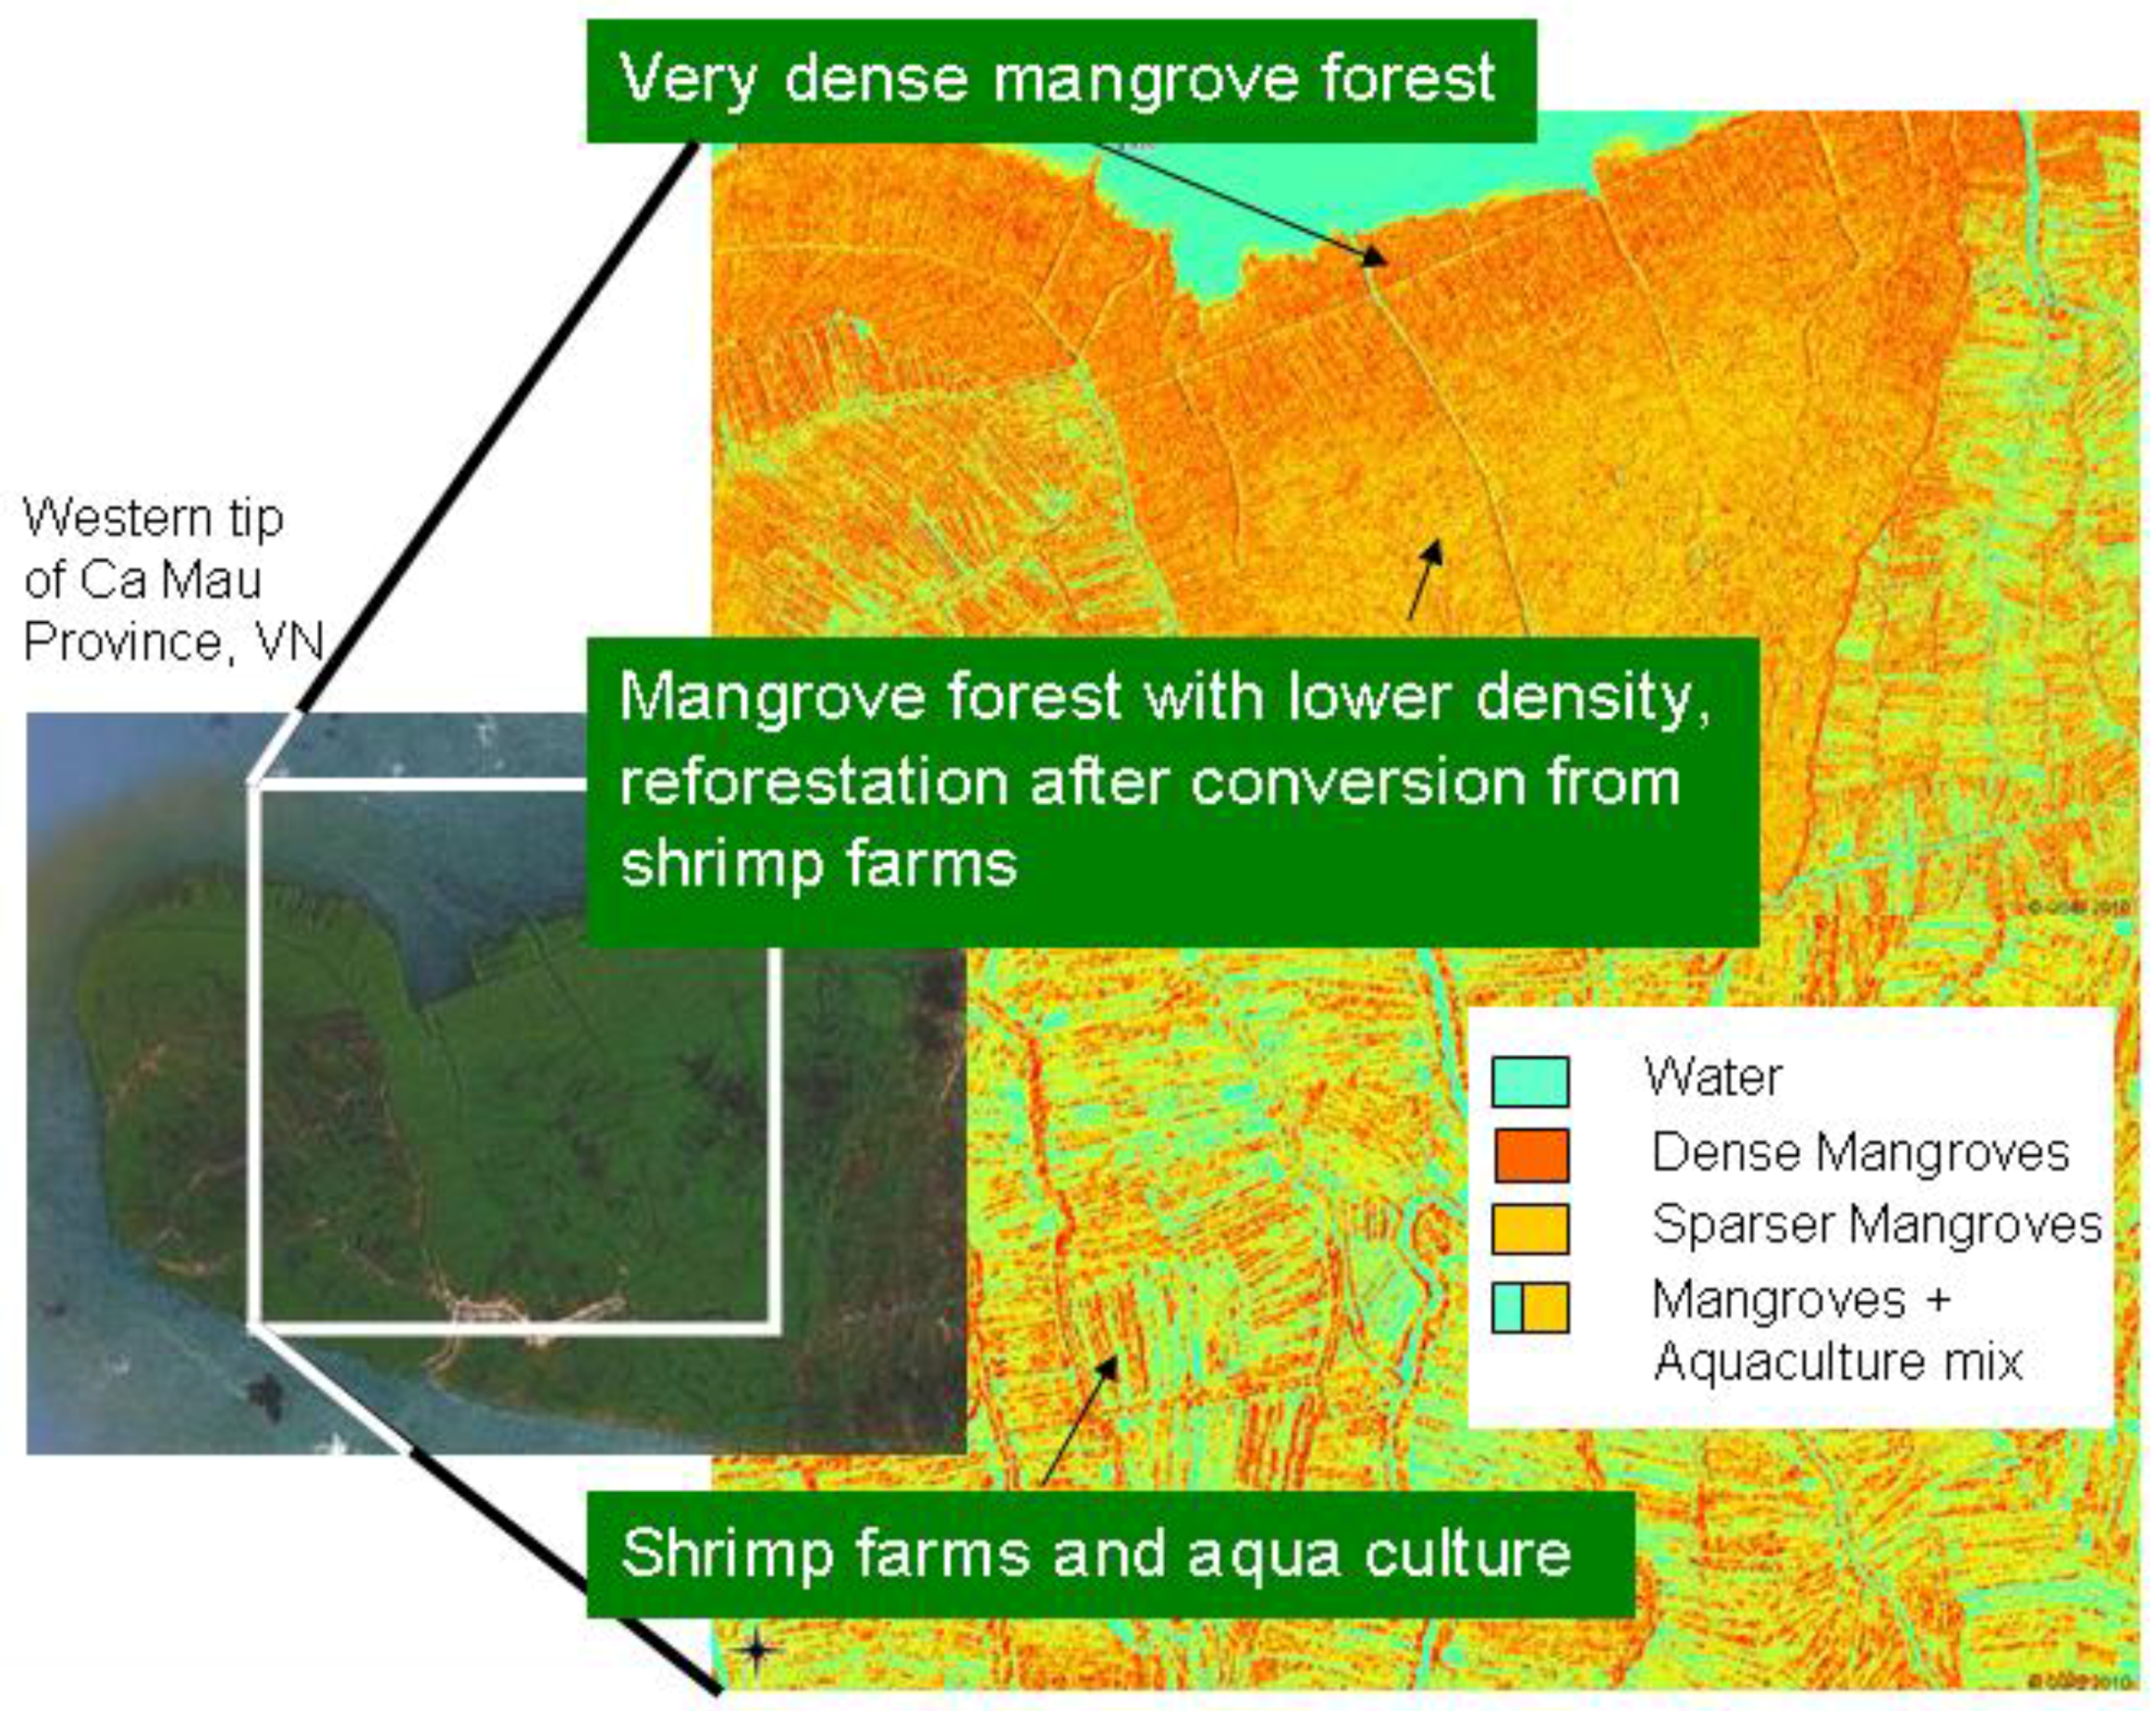
9. OtherMost promising results when SAR data combined with optical imagery (e.g., Figure 5)Relatively few studies have been conducted; special software or modules are needed for radar-image processing

Need for a Homogeneous Definition of the Term “Mangrove”

In remote-sensing literature, the term “mangrove” covers a broad range of meanings. For example, it is used to describe:
  • The mangrove ecosystem, with mangroves as leading plant families, but also containing other vegetation, open water surfaces, rivers, creeks, and open muddy soil surfaces;
  • An evergreen woody formation of shrubs or trees belonging to the mangrove family; or
  • A single mangrove tree
This lack of precision for the term “mangrove” was underscored >10 years ago by Blasco et al. [10], and it remains a current matter of discussion. Gaining a better understanding and comparison of international research studies through the use of an established definition for the term “mangrove” would be highly desirable.

Need for Homogenized Classification Schemes

Varying criteria were used to define the classification scheme in most of the studies. For example, in practice, this means that density growth can be classified as sparse or dense mangroves, as defined by the percentage of canopy closure. The percentages used for discrimination of different classes are usually chosen by the analysts individually, which leads to very inconsistent results that are very difficult to compare. It should be noted that the same classification scheme is applied consistently, at least for multitemporal mapping and monitoring tasks in the same area. However, depending on the knowledge of the analysts (physicists, geographers, environmentalists, biologists, local community experts) who perform the classification, completely different maps will result. Therefore, an urgent need exists for a uniform mangrove-classification scheme (or intersectable schemes) based on species differentiation, stand density, background surface, and additional criteria (e.g., biomass and vigor).

Need for Standardized Data-Processing Methods

The application of standardized techniques and analyses as routine tools is a future challenge for the consistent monitoring and mapping of mangroves [18]. Standardization would enhance the comparison of the suitability of methods for certain purposes on different datasets and locations. A greater transparency with regard to the processing steps (and preprocessing steps, including georectification and atmospheric correction, as well as image transformations) would also be beneficial for the transferability of a specific method to another research site. The development of techniques for the assessment of changes in mangrove areas requires a standardization of methods for the application to time-series of datasets [18], granting optimal comparability. However, the differences in environmental and atmospheric conditions and the high variability of mangrove ecosystems hinder the transferability of image-processing methods and analyses [21,137,158].
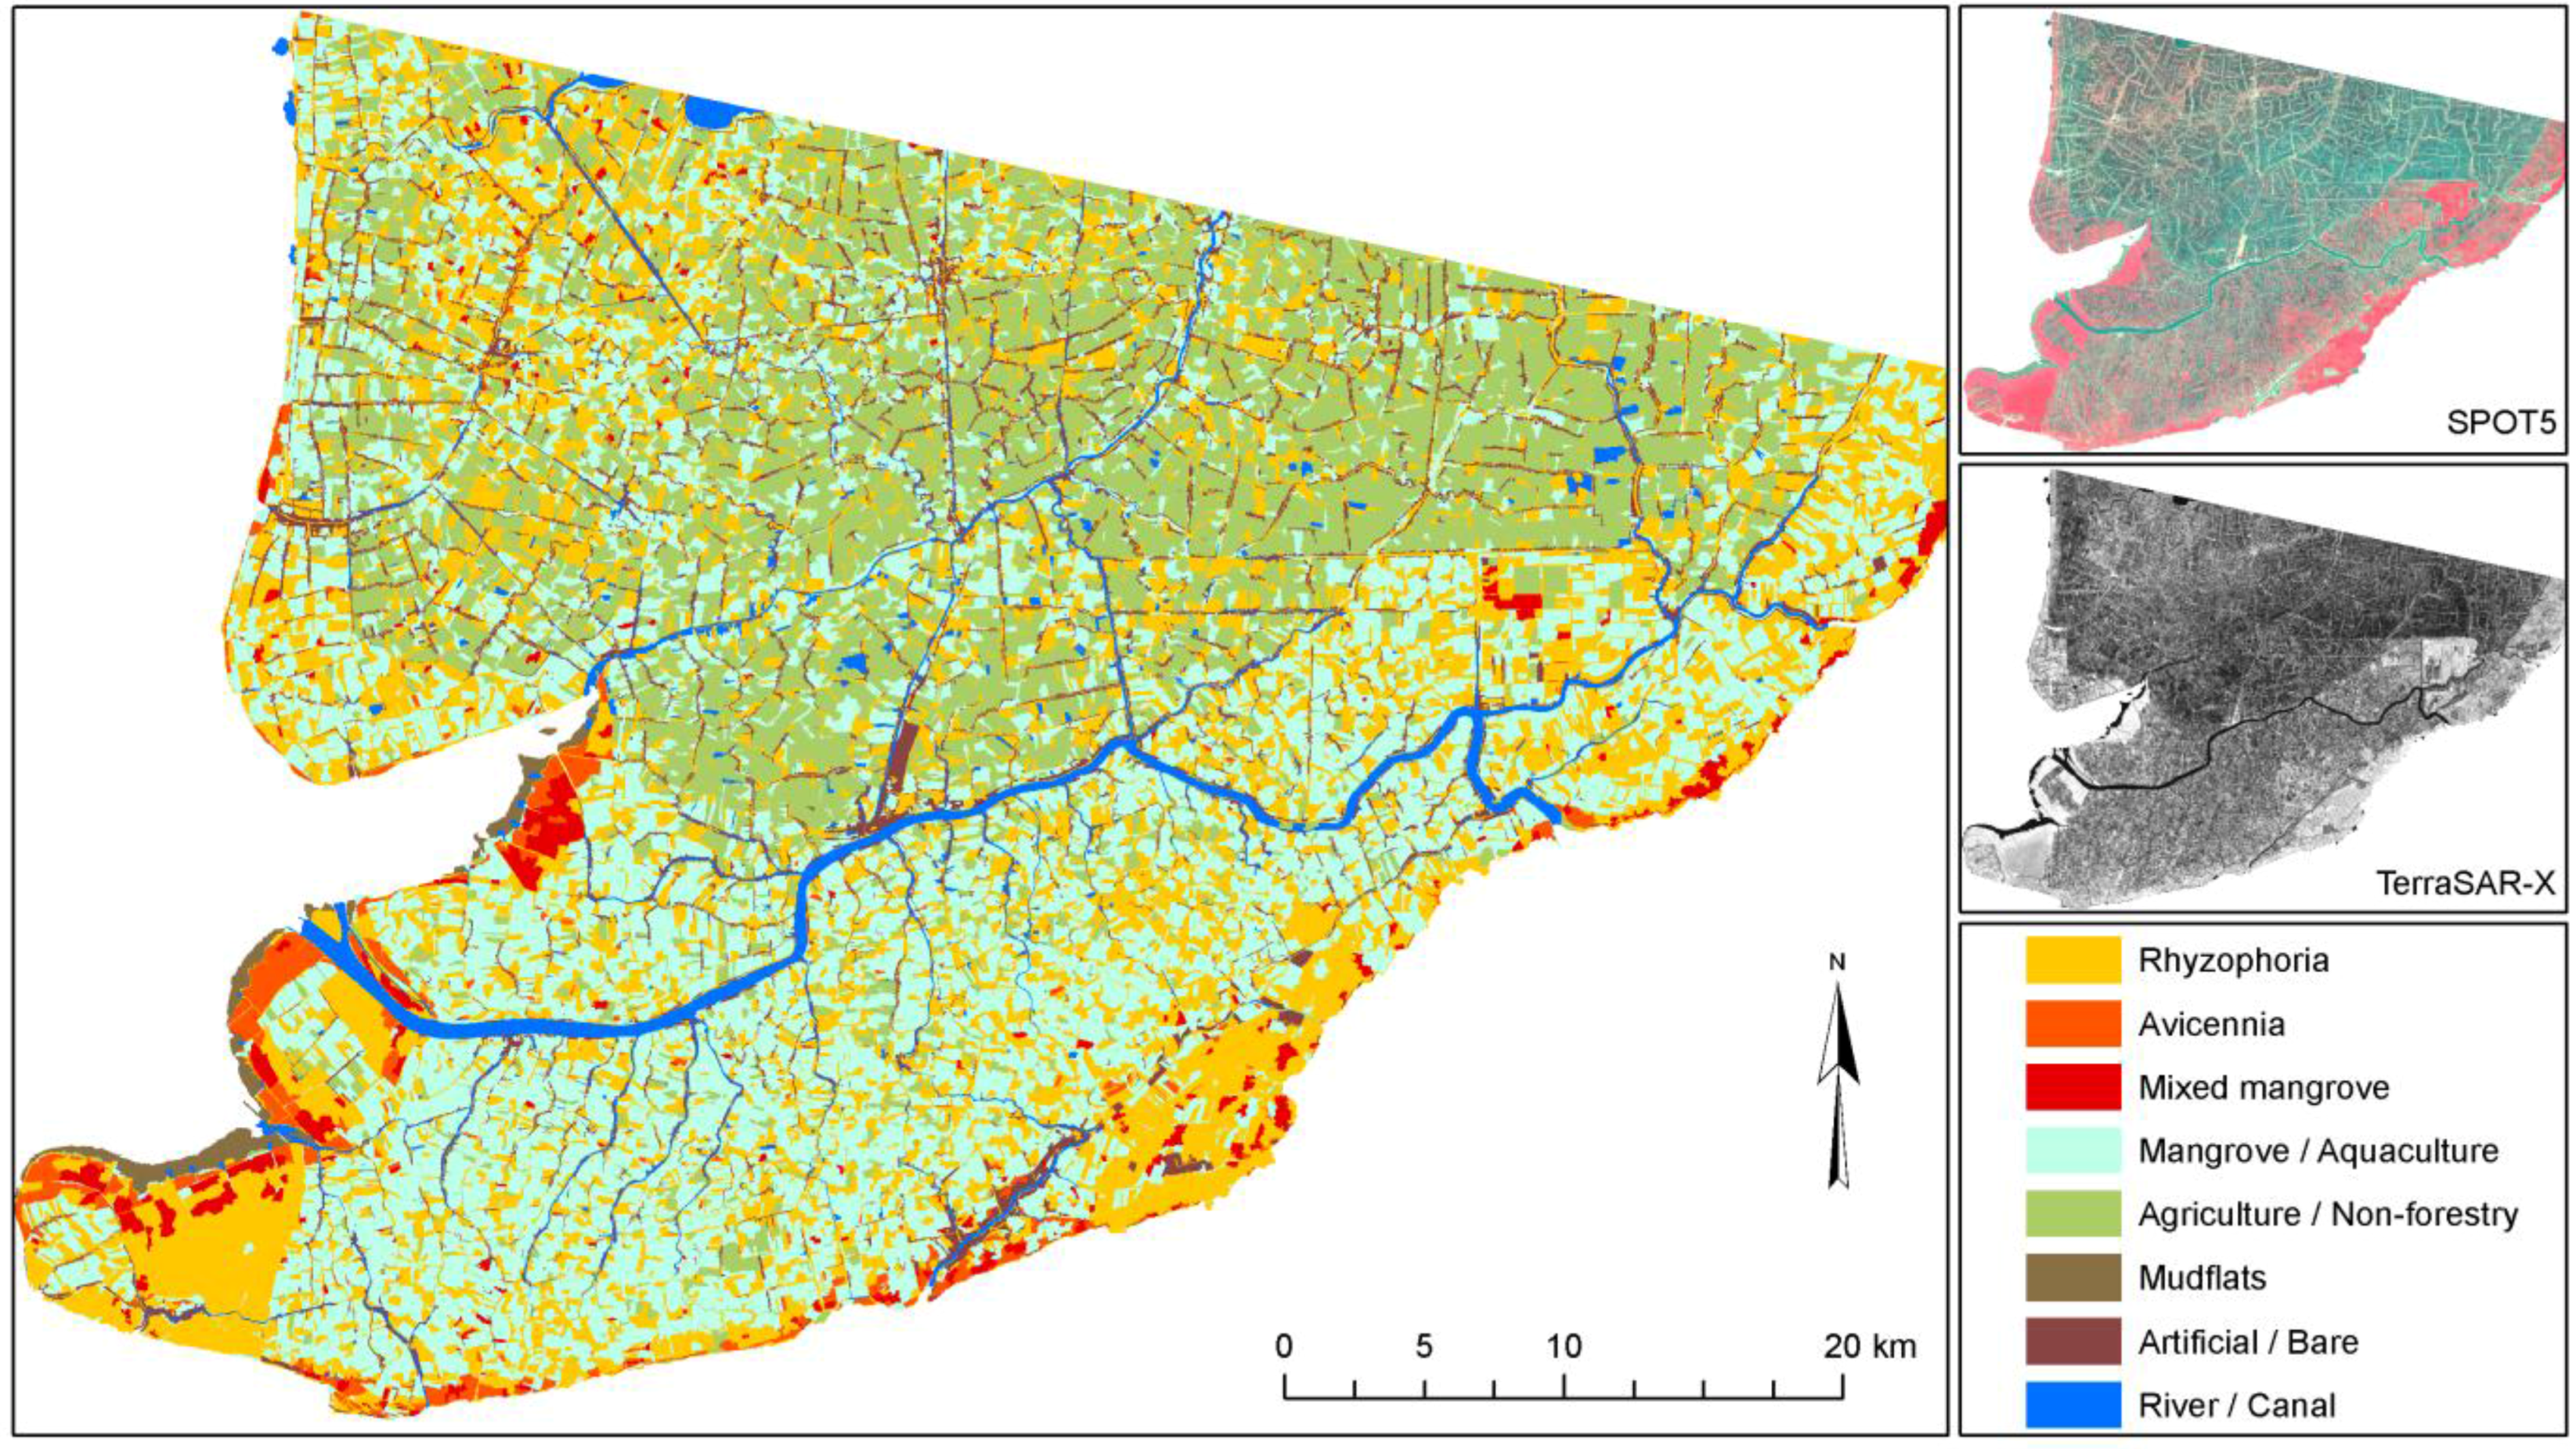
However, even in similar areas where transfer would theoretically be possible, the transferability and standardization of environmental projects are usually hindered by the lack of communication and homogenization efforts among different research groups. For example, three mangrove-mapping projects are ongoing in three coastal provinces (Ca Mau, Soc Trang, and Bac Lieu) of the Mekong Delta in Vietnam. All are being undertaken by the German Society for Technical Cooperation and have the goal to map current mangrove cover in the Mekong Delta. However, although one local project is simply digitizing the mangroves on screen, based on Google Earth QuickBird imagery (older data), another project is analyzing up-to-date SPOT scenes, and the third project is relying exclusively on field surveys by local untrained experts. The resulting mangrove maps created for the different provinces will be neither comparable nor complementary. Within the context of the current project RICEMAN, funded by the German Ministry of Education and Research, we aim to produce a homogenized mangrove map covering all mangrove areas of the Mekong Delta in Vietnam. For this purpose, SPOT data, Envisat ASAR data, TerraSAR-X data, and extensive field survey data are being used, and all data will be analyzed in a standardized repeatable way, with as little analyst influence as possible. The goal is an up-to-date Mekong Delta mangrove map representing the year 2009. The results of this mapping project (a first glimpse is Figure 5) will be reported in another paper.

Need for Homogenized, Transparent Accuracy Assessment

Scientists and users all over the world have different goals and requirements for their investigations. In many studies, accuracy assessment was not performed or was not considered necessary. Furthermore, accuracy assessments can be carried out using different methods and relying on different quality measures [18]. This is an additional factor that diminishes the comparability among studies. If management decisions depend on researchers’ results, an accuracy assessment is essential; otherwise, the findings could lead to inappropriate and cost-intensive actions for the user [17]. As for a standardized classification scheme, as well as for accuracy assessment, it is of the utmost importance that all steps are well documented.

Need for Further Investigations on Synergetic Data Use

Much remote sensing data exist that are promising for remote-sensing research, but they have not been exploited (i.e., no publications are available). In our opinion, this especially includes the joint analyses of multispectral and radar data, such as combined analyses based on high-resolution TerraSAR-X and QuickBird data, combined analyses based on TerraSAR-X and Rapid Eye data, combined analyses based on TerraSAR-X and SPOT data (ongoing), and combined analyses of Envisat ASAR and ASTER data, to name a few. Additional datasets that will greatly improve mangrove-mapping activities in the future include the TerraSAR-Tandem DEM dataset at 1-m resolution, which is foreseen to be available from 2013 onward (the Tandem Mission [the second Terra-SAR-X] is already in orbit); spaceborne hyperspectral 200 band; 30-m EnMAP data expected from 2014 onward; and technologies currently moving from airborne to spaceborne platforms, such as LIDAR-based mapping.

Need for Ecosystem Service Assessment

Numerous investigators have attempted to assess the monetary value of mangrove ecosystems worldwide, by trying to relate the services and values of natural ecosystems to economic parameters (e.g., de Groot and colleagues [159,160], Pearce [161], Turner et al. [162], Bingham et al. [163], Daily [164], Costanza et al. [57], Limburg and Folke [165], Wilson and Carpenter [166], Daily et al. [167], and Lal [179]). Recently, multinational gatherings, including the Convention on Biological Diversity, the Ramsar Convention on Wetlands and Migratory Species, and the Convention to Combat Desertification, have incorporated the concept of ecosystem services into their discussions and meetings. Also, major non-governmental organizations, including the Nature Conservancy, the World Wildlife Fund, and the World Resource Institute, have begun piloting ecosystem services programs, as have major intergovernmental agencies, including the United Nation Development Program and the World Bank [168]. The total economic value of the different ecosystem functions of mangroves (i.e., regulation functions, production functions, habitat functions, and information functions [57,160,167]) have been assessed by numerous investigators, including Lal [169], Ruitenbeck [170], Barbier [171], and Sathirathai [172]. Sathirathai and Barbier [173] concluded that the economic value for mangroves in a local community in Thailand ranges between US $27,264 and $35,921/ha. Especially in Thailand, it was demonstrated that the economic value estimation of an ecosystem in hard currency is much more eye opening to regional and national governments than is underscoring the threatening decline of a certain species. If governments learn to appreciate the ecosystem service functions and their real economic value, the willingness for protection (which costs money) usually increases [55]. In Thailand, the demonstration that several tens of thousands of US dollars are lost with each degraded hectare of mangroves has led to drastic reforestation programs and protection measures. However, for science to meet such a “real-world demand,” it is of utmost importance that, at least within a country, mapping procedures are homogenized, transferable, well-documented, conducted with local trained staff, and relatively cost efficient.

Need for Interdisciplinary and Well-Networked Research Teams

A broad range of experts in the field of mangrove mapping exists globally. However, when reviewing the articles, it became obvious that the topic of mangrove mapping is basically addressed by investigators with two or three different research backgrounds: biologists and ecologists with excellent biologic/botanic knowledge, environmentalists with excellent local knowledge of the ecosystem setting and its role in the local community, and remote sensors/physicists with excellent data-processing knowledge. Obviously, all three groups can have sound expertise in the other related fields; however, some papers revealed that this is not always the case. Thus, the optimal mangrove ecosystem-research group should include biologists focusing on mangrove botany, local environmental experts (ideally living in the area of investigation and speaking the local language), sound physicists, geographers and remote sensors, and socio-economists who can the transfer the research results to local decision- and policy-makers and planners. Research groups within the field should focus on international exchange and cooperation, rather than on isolation and competition.

5. Conclusions

The aim of this review paper was to provide a comprehensive overview of remote-sensing–based mangrove-mapping studies undertaken during last two decades and including studies in different regions of the world using different sensor data, emphasizing different research foci, and using different image-processing methods. Well over 100 studies were published during the last two decades, all focusing on the remote-sensing–based mapping of mangroves; the number of studies reflects the growing scientific interest in the topic. The majority of studies were conducted in Asia (Bangladesh, India, Thailand, Vietnam, Sri Lanka, Taiwan, and Malaysia); followed by Australia (including New Zealand); North, Central, and South America (Florida, Texas, Mexico, Brazil, Panama, French Guiana, British West Indies, and Belize); and Africa (Gabon, Kenya, Tanzania, Senegal, and Madagascar).
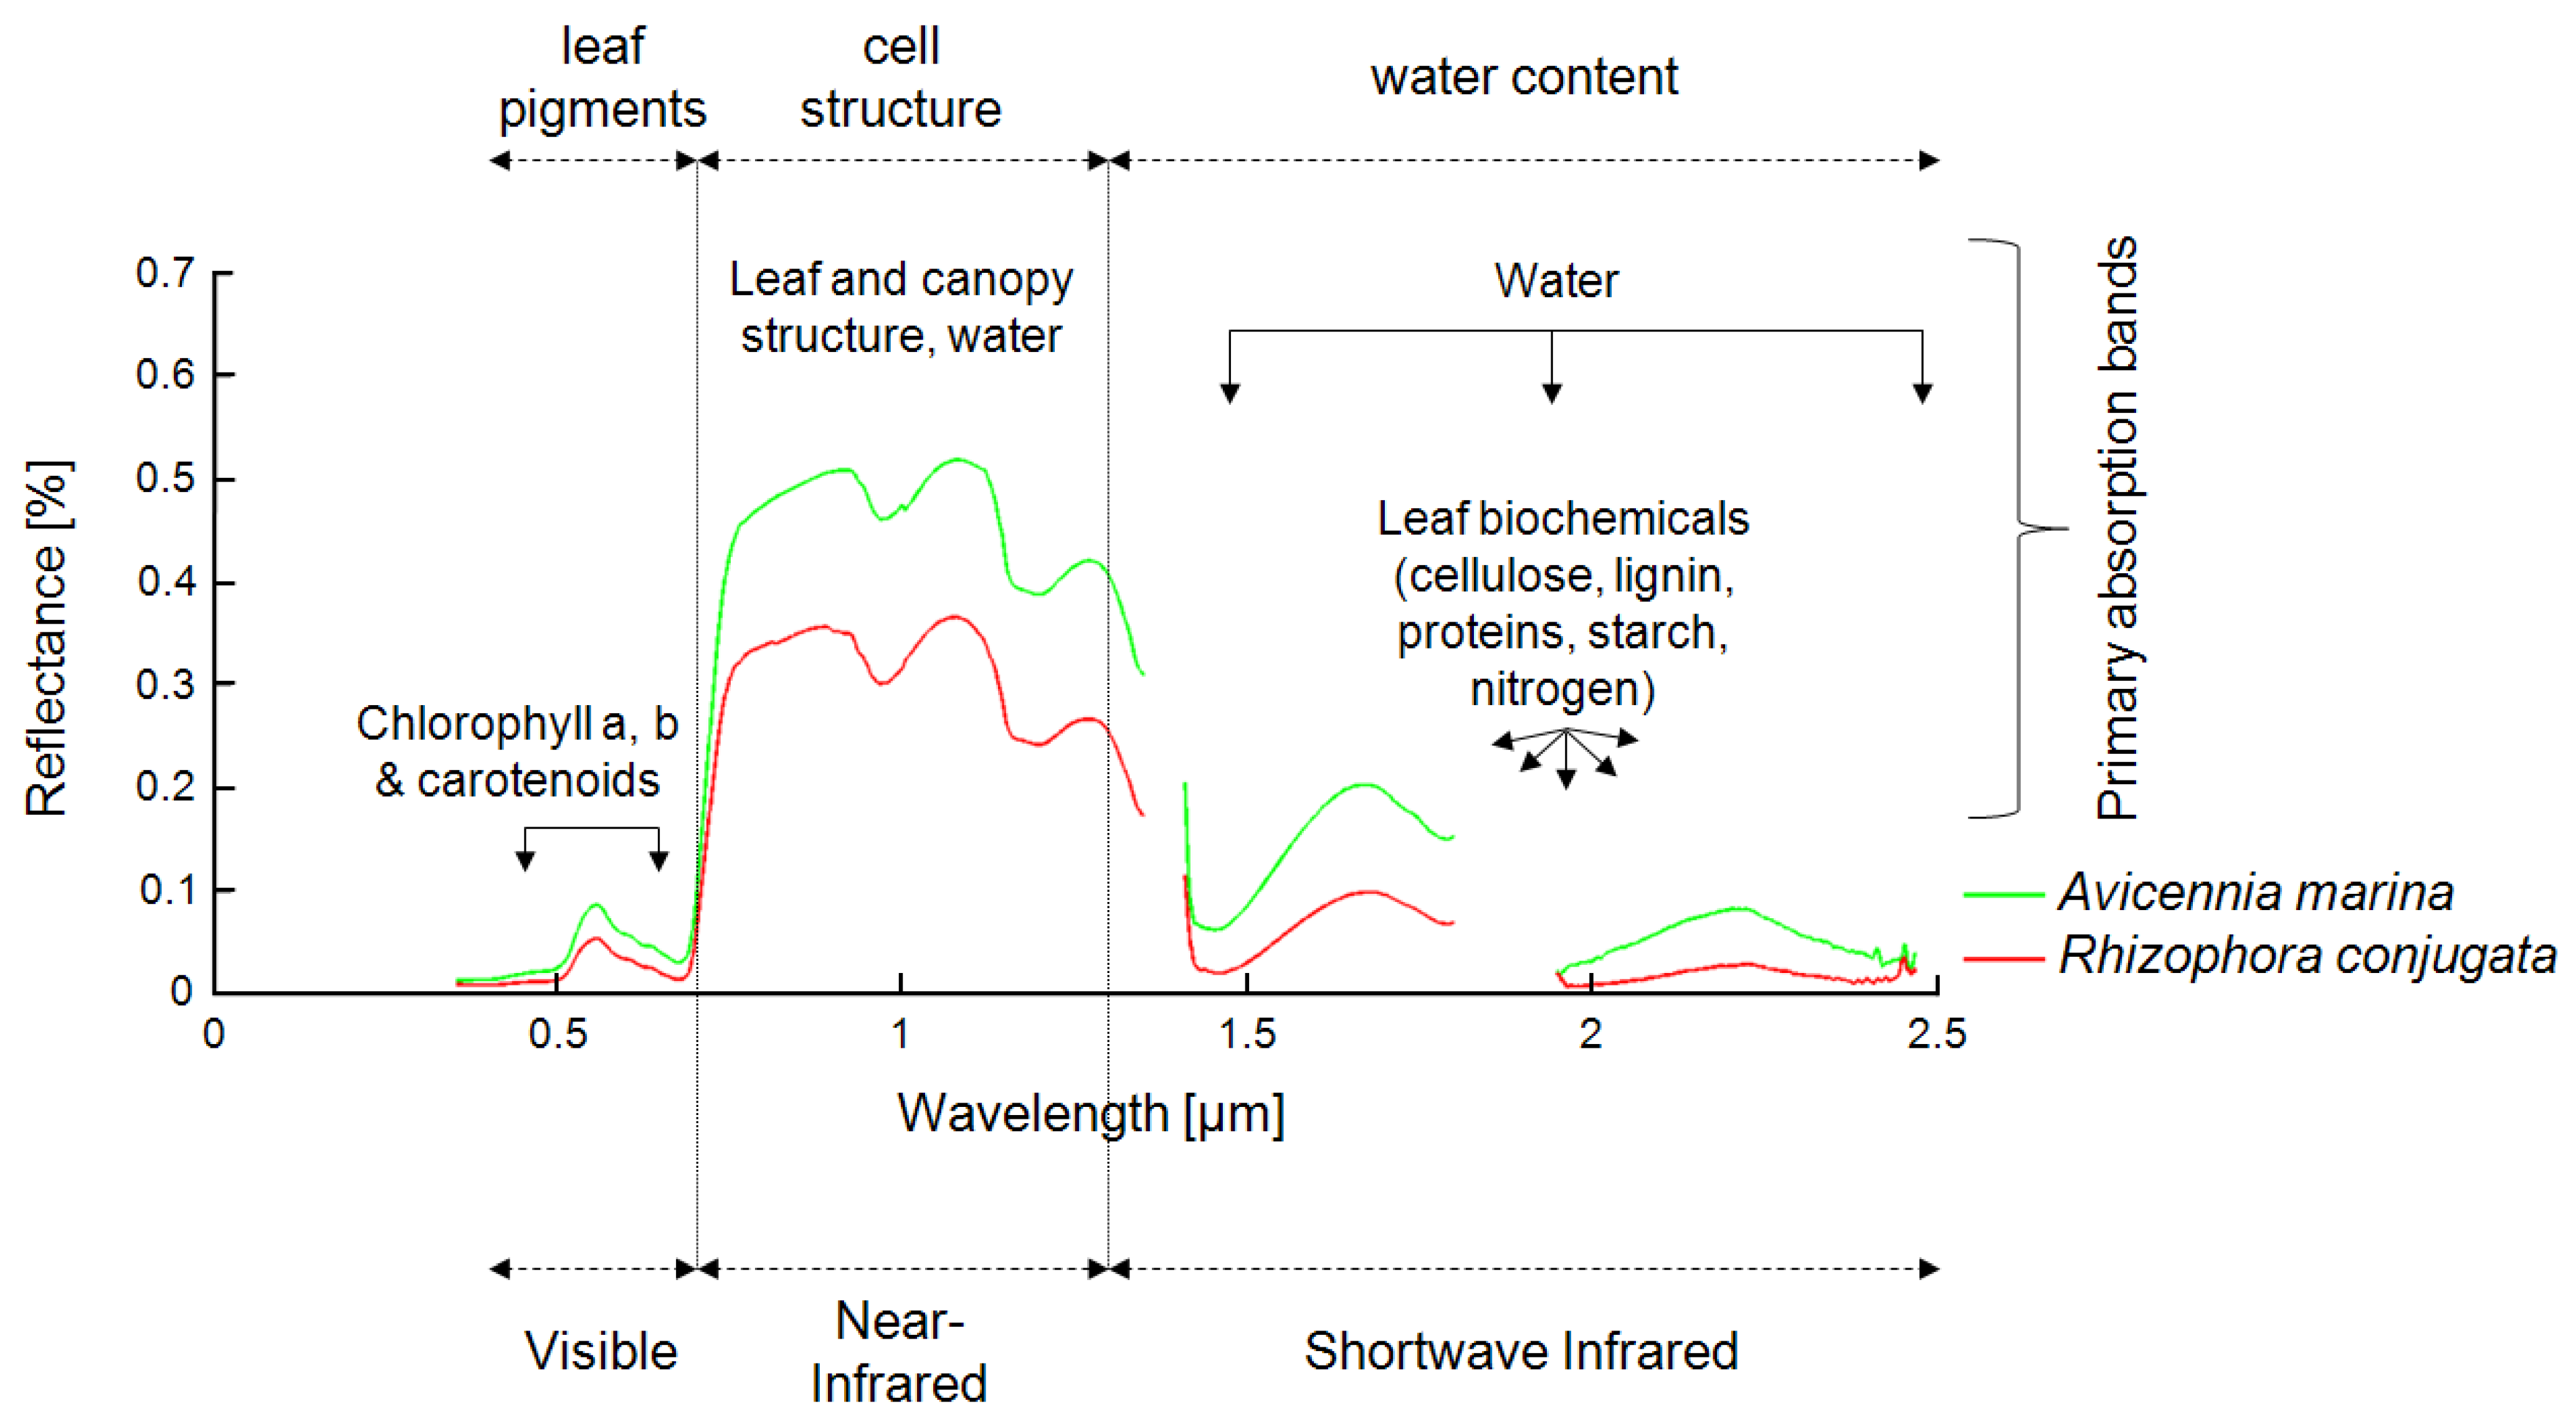
Mangrove mapping is one of the most demanding tasks in remote sensing, because the remotely sensed signal from mangrove ecosystems is composed of several components and is influenced by a large number of other parameters. In optical data, the spectrum of a pixel containing “mangrove” is usually influenced by pixel fractions of mangrove leaves, stems, and branches; underlying mudflats; soils; and water surfaces. All of these components differ depending on mangrove species, vigor, age, and season, as well as soil type and water turbidity and quality, among others. Other parameters influencing the spectral signal include plant and leaf geometry, LAI, stand density, and atmospheric conditions, to name a few. Furthermore, the spectral signal, its “mixing,” and its distinctiveness in optical data vary, depending on the spatial and spectral resolution of the sensors used, ranging from aerial photography (pixels in centimeter to meter range) to highest-resolution spaceborne multispectral data (pixel size in meter range) to multispectral data of medium resolution (10–30 m) to airborne or spaceborne hyperspectral data (pixel size in 1–30-m range, but up to 200 spectral bands).
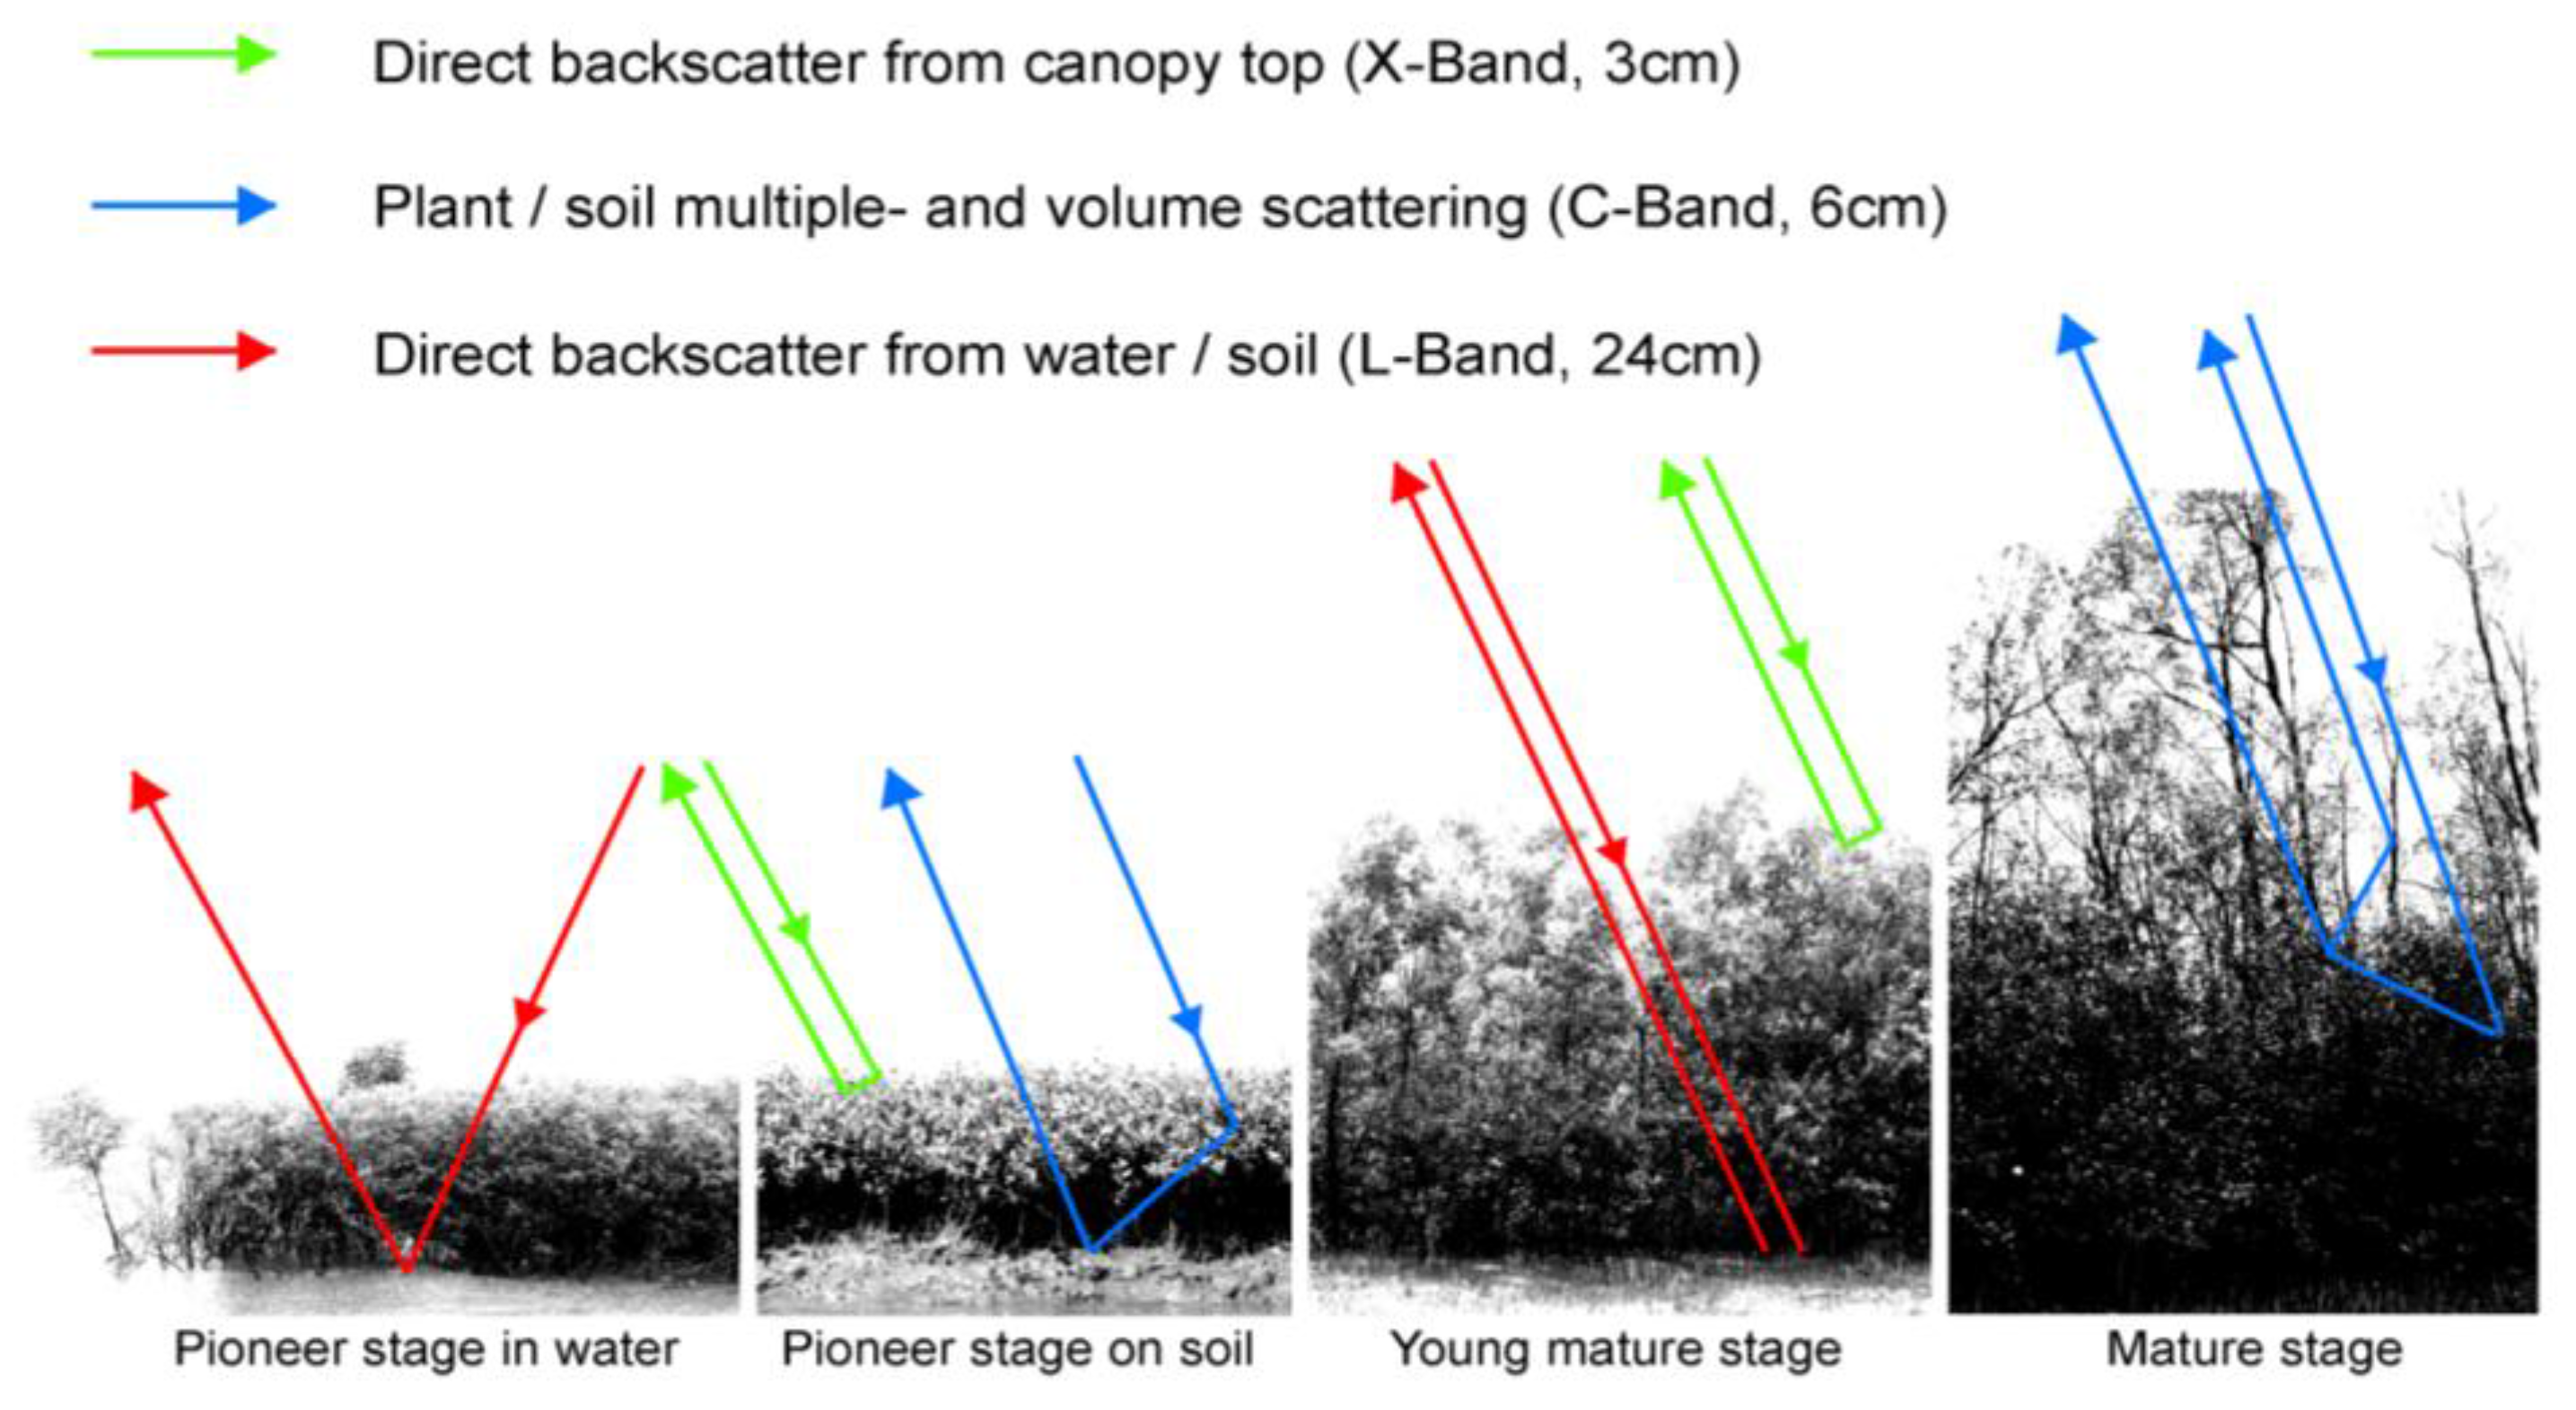
In SAR data, the backscatter signal of mangrove ecosystems is influenced by the geometric properties of the stand (canopy closure, canopy geometry, leaf structure, cell structure, stem structure, and the underlying surface component and its roughness: soil mudflats water) and dielectric properties, which vary, depending on the soil moisture, plant moisture, and underlying water surfaces. The responses of these different conditions vary, depending on the incidence wavelength (e.g., C-band, L-band, P-band), the polarization of the radar beams (HH, VV, HV, etc.), and the incidence angle of the radar waves, which makes the interpretation of radar data over mangrove ecosystems very complex. Furthermore, different sensors map different ground fractions, depending mainly on spatial resolution, varying from very high (airborne or TerraSAR-X [e.g., in the meter range]) to medium resolution (e.g., Envisat ASAR, ERS).
The data used for a mangrove-mapping campaign and the methods used for data analyses also depend on a variety of factors, such as goals and focus of the study (many purposes possible, such as mangrove versus non-mangrove mapping, species discrimination, stand vigor, density and age estimation, biomass retrieval, and change-detection studies, to name a few), size of the area to be mapped and available budget (defining the choice of sensor and the quantity of data), staff expertise needed for the mapping procedure (defining the complexity of image-analyses steps), mangrove-ecosystem accessibility (defining the amount of ground-truth data available), availability of additional GIS data on related ecosystem components (e.g., soil maps, in situ data), local labor prices (influencing the amount of manual interpretation and possible on-screen digitization), governmental restrictions (e.g., possibly hindering flight campaigns), and many more.
Thus, it is obvious that is it very difficult to compare the studies reviewed, because each research group faces different starting conditions. However, some similarities were found.
For >50 years, high spatial-resolution airborne data have been very valuable for mapping small coastal fringing areas of mangroves. Such images are usually classified by visual interpretation using on-screen digitization. The typical image information consists of tonality, surface texture, and structural arrangement. Species communities with dissimilar density and age structures can be easily differentiated; as a result of the small spatial coverage, aerial photography often plays a minor part in remote-sensing applications aiming at national or regional investigations. However, aerial survey is still the first choice for local-mapping campaigns. Aerial data is the only data source allowing time-series observation back to the 1950s and, compared with high-resolution spaceborne data, has the advantage that it can be acquired below the cloud cover, which often prevails in subtropical and tropical mangrove regions.
More than 40 published papers underscore the importance of medium-resolution imagery for mangrove-habitat mapping. Landsat TM and SPOT data have been used extensively, but Landsat MSS, ETM+, IRS, and ASTER data have also been analyzed. Medium-resolution imagery is best suited for applications on a national or regional scale. Visual interpretation followed by on-screen digitizing, as well as pixel-based classification approaches, are the most frequently applied methods. The Maximum Likelihood Classification algorithm has proven to be a particularly useful and robust classifier. Some investigators used hybrid-classification techniques combining pixel- and object-based approaches. This demonstrates that even at this (lower-resolution) level, mangrove-ecosystem mapping is a highly interactive, analyst-biased task. Medium-resolution techniques are excellent for the mapping of ecosystems (however, usually not at the species level), the monitoring of large-scale changes, the analyses of regional environmental relationships, and the assessment of the condition of mangroves (vigor, age, density, etc.). Global mangrove loss numbers have been derived solely from the analysis of medium-resolution data.
The highest-resolution sensors, such as IKONOS and QuickBird, offer the ability cover larger areas at high spatial resolution < 4 m, which is especially suitable for local mapping applications. Results from the few investigations performed to date showed that pixel-based, object-based, and neural network analytical approaches alone, as well as in combination, seem to be promising methods for diverse purposes. A strong degree of interactive, analyst-biased interpretation remains, which usually hinders the temporal and spatial transferability of results. In contrast to medium-resolution imagery, an increase in the level of detail, which can be discriminated, can be observed, and mapping approaches at the species level are feasible. Nevertheless, the suitability and limitations of image analyses based on these sensors (method wise and with respect to cost-benefit analyses) must be investigated more intensively to fill the current knowledge gap. Furthermore, new high-resolution sensors, such as the commercial GeoEye-1 (launched in 2008 with 0.41-m spatial resolution in the panchromatic band and 1.65-m resolution in the multispectral channels), need to be investigated. Based on these data, pilot studies have been undertaken in Belize, but the results have not been published. Also, data from the sensor Rapid Eye (5-m spatial resolution) should be exploited for mangrove mapping. The good spectral resolution and the frequent overpass of this new sensor make it an ideal tool that will probably enable analyses down to the species level. Last, but not least, most of the above-mentioned optical sensors (airborne and medium and high resolution) also have the potential for canopy DEM generation based on stereo data, but this has not been exploited fully. However, the soon-to-be-available TerraSAR Tandem DEM at 1-m resolution will be an invaluable asset for canopy investigations.
Studies based on hyperspectral imagery are rare, although the large number of bands enable very detailed mapping tasks, down to species discrimination and plant vigor assessment. Although the reported results (mainly derived based from airborne hyperspectral data) look very promising, it is difficult to evaluate the applied processing techniques, such as SAM, spectral unmixing, MTMF, and additional pixel- and object-based approaches, because of the limited availability of comparable studies. In general, hyperspectral flight campaigns are relatively expensive, and the analytical skills of image-processing personnel need to be profound. Thus, airborne hyperspectral analyses are only applied locally and are not an option for national or regional mapping endeavors or mapping campaigns with a limited budget. It is foreseen that upcoming spaceborne hyperspectral sensors will improve this situation.
About 25 publications have addressed the usefulness of SAR imagery for the mapping of mangroves. Several investigators carried out important fundamental research work to assess the relationship between the backscatter signals and mangrove structure components and stand parameters. These findings are important because the interpretation of microwave-derived vegetation information is much more complex to interpret than is that based on the visual-reflectance spectrum. SAR data are available at different resolutions (from airborne at meter scale to medium-resolution scale), and they are usually easily acquirable for a low cost (e.g., research proposals for Envisat ASAR data, ALOS Palsar data, or even TerraSAR-X data). However, trained image analysts and special software are required to exploit the full potential of these data. The benefit of weather-independent SAR data for mapping mangrove ecosystems is greatest when jointly analyzed with optical data.
For all of the above data sources, detailed in situ knowledge and field data are usually needed to correlate spectral signals or backscatter signals with geophysical parameters. Without any ground knowledge, it is not possible to differentiate mangroves at the species level or to derive quantitative parameters of the stand.
The biggest challenges for mangrove remote sensing lie in the still too-high degree of interactivity when analyzing data, which makes the comparison, as well as the temporal and spatial transferability, of study results nearly impossible. First, the mangrove remote-sensing community needs a common, well-defined understanding of the term “mangrove,” which is used to refer to an ecosystem, mangrove-related plant species in general, or single trees. Second, there is a high demand for homogenized classification schemes and standardized data-processing approaches (at least on a national level), which are indispensable if aiming at strongly needed ecosystem service (and economic ecosystem function) evaluation. These must be accompanied by thorough documentation and comparable, standardized accuracy assessment. Third, the exploitation of new sensors and new synergistic approaches will enable further in-depth mapping and allow a deeper understanding of the complex interactions between mangrove ecosystems and electromagnetic radiation. Finally, a strong research community, focusing on cooperation, exchange, and mutual support, can result in a more rapid advancement of the field. The goal of all remote-sensing–based mangrove mapping and monitoring activities should be the protection of these unique ecosystems, whose value cannot be overestimated. This is especially true with respect to climate change-related sea level rise scenarios globally. Sea level rise would have a severe impact on coastal communities in the tropics and subtropics. Natural mangrove ecosystems are a productive, extremely valuable shield against this threat.

Acknowledgements

We thank the International Bureau, IB, of the German Ministry of Education and Science, BMBF, for funding the RICEMAN project in Vietnam.

References

  1. Blasco, F.; Aizpuru, M.; Gers, C. Depletion of the mangroves of continential Asia. Wetlands Ecol. Manage. 2001, 9, 245–256. [Google Scholar] [CrossRef]
  2. Everitt, J.H.; Yang, C.; Sriharan, S.; Judd, F.W. Using high resolution satellite imagery to map black mangrove on the Texas Gulf Coast. J. Coast. Res. 2008, 24, 1582–1586. [Google Scholar] [CrossRef]
  3. Giri, C.; Pengra, B.; Zhu, Z.; Singh, A.; Tieszen, L.L. Monitoring Mangrove forest dynamics of the Sundarbans in Bangladesh and India using multi-temporal satellite data from 1973 to 2000. Estuar. Coast. Shelf Sci. 2007, 73, 91–100. [Google Scholar] [CrossRef]
  4. Green, E.P.; Mumby, P.J.; Edwards, A.J.; Clark, C.D.; Ellis, A.C. The assessment of mangrove areas using high resolution multispectral airborne imagery. J. Coast. Res. 1998, 14, 433–443. [Google Scholar]
  5. Seto, K.C.; Fragkias, M. Mangrove conversion and aquaculture development in Vietnam: A remote sensing-based approach for evaluating the Ramsar Convention on Wetlands. Glob. Environ. Change 2007, 17, 486–500. [Google Scholar]
  6. Vaiphasa, C.; Skidmore, A.K.; de Boer, W.F. A post-classifier for mangrove mapping using ecological data. ISPRS J. Photogramm. Remote Sens. 2006, 61, 1–10. [Google Scholar] [CrossRef]
  7. Valiela, I.; Bowen, J.L.; York, J.K. Mangrove forests: One of the world’s threatened major tropical environments. Bioscience 2001, 51, 807–815. [Google Scholar] [CrossRef]
  8. FAO. The World’s Mangroves 1980–2005; FAO Forestry Paper 153; FAO: Rome, Italy, 2007; Available online: ftp://ftp.fao.org/docrep/fao/010/a1427e/a1427e00.pdf (accessed on 30 October 2009).
  9. Aschbacher, J.; Ofren, R.; Delsol, J.P.; Suselo, T.B.; Vibulsresth, S.; Charrupat, T. An integrated comparative approach to mangrove vegetation mapping using advanced remote sensing and GIS technologies: Preliminary results. Hydrologica 1995, 295, 285–295. [Google Scholar]
  10. Blasco, F.; Gauquelin, T.; Rasolofoharinoro, M.; Denis, J.; Aizpuru, M.; Caldairou, V. Recent advances in mangrove studies using remote sensing data. Mar. Freshwater Res. 1998, 49, 287–296. [Google Scholar] [CrossRef]
  11. Dahdouh-Guebas, F. The use of remote sensing and GIS in the sustainable management of tropical coastal ecosystems. Environ. Develop. Sustain. 2002, 4, 93–112. [Google Scholar] [CrossRef]
  12. Hernández Cornejo, R.; Koedam, N.; Ruiz Luna, A.; Troell, M.; Dahdouh-Guebas, F. Remote sensing and ethnobotanical assessment of the mangrove forest changes in the Navachiste-San Ignacio-Macapule Lagoon Complex, Sinaloa, Mexico. Ecol. Soc. 2005, 10, art. 16. [Google Scholar]
  13. Manson, F.J.; Loneragan, N.R.; McLeod, I.M.; Kenyon, R.A. Assessing techniques for estimating the extent of mangroves: topographic maps; aerial photographs and Landsat TM images. Mar. Freshwater Res. 2001, 52, 787–792. [Google Scholar] [CrossRef]
  14. Mumby, P.J.; Green, E.P.; Edwards, A.J.; Clark, C.D. The cost-effectiveness of remote sensing for tropical coastal resources assessment and management. J. Environ. Manag. 1999, 55, 157–166. [Google Scholar] [CrossRef]
  15. Wang, L.; Sousa, W.P. Distinguishing mangrove species with laboratory measurements of hyperspectral leaf reflectance. Int. J. Remote Sens. 2009, 30, 1267–1281. [Google Scholar] [CrossRef]
  16. Giri, C.P.; Kratzschmar, E.; Ofren, R.S.; Pradhan, D.; Shrestha, S. Assessing Land Use/Land Cover Dynamics in Two Identified “Hot Spot” Areas: Oudomxay Province of Lao P.D.R. and Mekong Delta of Vietnam. In Proceeding of The 17th Asian Conference on Remote Sensing, Colombo, Sri Lanka, 4–8 November 1996.
  17. Green, E.P.; Mumby, P.J.; Edwards, A.J.; Clark, C.D. A review of remote sensing for the assessment and management of tropical coastal resources. Coast. Manage. 1996, 24, 1–40. [Google Scholar] [CrossRef]
  18. Malthus, T.J.; Mumby, P.J. Remote sensing of the coastal zone: An overview and priorities for future research. Int. J. Remote Sens. 2003, 24, 2805–2815. [Google Scholar] [CrossRef]
  19. Rasolofoharinoro, M.; Blasco, F.; Bellan, M.F.; Aizpuru, M.; Gauquelin, T.; Denis, J. A remote sensing based methodology for mangrove studies in Madagascar. Int. J. Remote Sens. 1998, 19, 1873–1886. [Google Scholar] [CrossRef]
  20. Selvam, V.; Ravichandran, K.K.; Gnanappazham, L.; Navamuniyammal, M. Assessment of community-based restoration of Pichavaram mangrove wetland using remote sensing data. Curr. Sci. 2003, 85, 794–798. [Google Scholar]
  21. Tong, P.H.; Auda, Y.; Populus, J.; Aizpura, M.; Habshi, A.A.; Blasco, F. Assessment from space of mangroves evolution in the Mekong Delta; in relation to extensive shrimp farming. Int. J. Remote Sens. 2004, 25, 4795–4812. [Google Scholar] [CrossRef]
  22. Vaiphasa, C.; Ongsomwang, S.; Vaiphasa, T.; Skidmore, A.K. Tropical mangrove species discrimination using hyperspectral data: A laboratory study. Estuar. Coast. Shelf Sci. 2005, 65, 371–379. [Google Scholar] [CrossRef]
  23. Verheyden, A.; Dahdouh-Guebas, F.; Thomaes, K.; De Genst, W.; Hettiarachchi, S.; Koedam, N. High-resolution vegetation data for mangrove research as obtained from aerial photography. Environ. Develop. Sustain. 2002, 4, 113–133. [Google Scholar] [CrossRef]
  24. Wang, L.; Sousa, W.P.; Gong, P.; Biging, G.S. Comparison of IKONOS and QuickBird imagery for mapping mangrove species on the Caribbean coast of Panama. Remote Sens. Environ. 2004, 91, 432–440. [Google Scholar] [CrossRef]
  25. Spalding, M. The global distribution and status of mangrove ecosystems. Int. NewsLett. Coast. Manage. 1997, 1, 20–21. [Google Scholar]
  26. Kathiresan, K.; Bingham, B. Biology of mangroves and mangrove ecosystems. Adv. Mar. Biol. 2001, 40, 81–251. [Google Scholar]
  27. Lugo, A.E.; Snedaker, S.C. The ecology of mangroves. Ann. Rev. Ecol. Systemat. 1974, 5, 39–64. [Google Scholar] [CrossRef]
  28. Tomlinson, P.B. The Botany of Mangroves; Cambridge University Press: Melbourne, VIC, Australia, 1986. [Google Scholar]
  29. Alongi, D.M. Present state and future of world’s mangrove forest. Environ. Conserv. 2002, 29, 331–349. [Google Scholar] [CrossRef]
  30. Blasco, F.; Saenger, P.; Janodet, E. Mangroves as indicators of coastal change. Catena 1996, 27, 167–178. [Google Scholar] [CrossRef]
  31. Alongi, D.M. Mangrove forests: Resilience; protection from tsunamis; and responses to global climate change. Estuar. Coast. Shelf Sci. 2008, 76, 1–13. [Google Scholar] [CrossRef]
  32. Fromard, F.; Vega, C.; Proisy, C. Half a century of dynamic coastal change affecting mangrove shorelines of French Guiana. A case study based on remote sensing data analyses and field surveys. Marine Geology 2004, 208, 265–280. [Google Scholar] [CrossRef]
  33. Barbier, E.B. Natural barriers to natural disasters: Replanting mangroves after tsunami. Front. Ecol. Environ. 2006, 4, 124–131. [Google Scholar] [CrossRef]
  34. Cochard, R.; Ranamukhaarachchi, S.L.; Shivakoti, G.P.; Shipin, O.V.; Edwards, P.J.; Seeland, K.T. The 2004 tsunami in Aceh and Southern Thailand: A review on coastal ecosystems; wave hazards and vulnerability. Perspect. Plant Ecol. Evol. Systemat. 2008, 10, 3–40. [Google Scholar] [CrossRef]
  35. Danielsen, F.; Sørensen, M.K.; Olwig, M.F.; Selvam, V.; Parish, F.; Burgess, N.D.; Hiraishi, T.; Karunagaran, V.; Rasmussen, M.S.; Hansen, L.B.; Quarto, A.; Suryadiputra, N. The Asian tsunami: A protective role for coastal vegetation. Science 2005, 310, 643. [Google Scholar] [CrossRef] [PubMed]
  36. Kathiresan, K.; Rajendran, N. Coastal mangrove forests mitigated tsunami. Estuar. Coast. Shelf Sci. 2005, 65, 601–606. [Google Scholar] [CrossRef]
  37. Kerr, A.M.; Baird, A.H.; Campbell, S.J. Comments on “Coastal mangrove forests mitigated tsunami” by Kathiresan K. and Rajendran N. Estuar. Coast. Shelf Sci. 2005, 65, 601-606. Estuar. Coast. Shelf Sci. 2006, 67, 539–541. [Google Scholar]
  38. Othman, M.A. Value of mangroves in coastal protection. Hydrobiologia 1994, 285, 277–282. [Google Scholar] [CrossRef]
  39. Vermaat, J.E.; Thampanya, U. Mangroves mitigate tsunami damage: A further response. Estuar. Coast. Shelf Sci. 2006, 69, 1–3. [Google Scholar] [CrossRef]
  40. Blasco, F.; Bellan, M.F.; Chaudhury, M.U. Estimating the Extent of Floods in Bangladesh—Using SPOT Data. Remote Sens. Environ. 1992, 39, 167–178. [Google Scholar] [CrossRef]
  41. Dahdouh-Guebas, F.; Jayatissa, L.P.; Di Nitto, D.; Bosire, J.O.; Lo Seen, D.; Koedam, N. How effective were mangroves as a defence against the recent tsunami? Curr. Biol. 2005, 15, R443–R447. [Google Scholar] [CrossRef] [PubMed]
  42. Mazda, Y.; Magi, M.; Kogo, M.; Hong, P.N. Mangroves as coastal protection from waves in the Tong King delta, Vietnam. Mangroves Salt Marshes 1997, 1, 127–135. [Google Scholar] [CrossRef]
  43. Mazda, Y.; Magi, M.; Nanao, H.; Kogo, M.; Toyohiko, M.; Kanazawa, N.; Kobashi, D. Coastal erosion due to long-term human impact on mangrove forests. Wetlands Ecol. Manage. 2002, 10, 1–9. [Google Scholar] [CrossRef]
  44. Manson, F.J.; Loneragan, N.R.; Skilleter, G.A.; Phinn, S.R. An evaluation of the evidence for linkages between mangroves and fisheries: A synthesis of the literature and identification of research directions. In Oceanography and Marine Biology: An Annual Review; Gibson, R.N., Atkinson, R.J.A., Gordon, J.D.M., Eds.; Taylor and Francis: London, UK, 2005; Volume 43, pp. 485–515. [Google Scholar]
  45. Mumby, P.J.; Edwards, A.J.; Arias-Gonzáles, E.; Lindeman, K.C.; Blackwell, P.G.; Gall, A.; Gorczynska, M.I.; Harborne, A.R.; Pescod, C.L.; Renken, H.; Wabnitz, C.C.; Llewellyn, G. Mangrove enhance the biomass of coral reef fish communities in the Caribbean. Nature 2004, 427, 533–536. [Google Scholar] [CrossRef] [PubMed]
  46. Nagelkerken, I.; Blaber, S.J.; Bouillon, S.; Green, P.; Haywood, M.; Kirton, L.G.; Meynecke, J.-O.; Pawlik, J.; Penrose, H.M.; Sasekumar, A.; Somerfield, P.J. The habit function of mangroves for terrestrial and marine fauna: A review. Aquat. Bot. 2008, 89, 155–185. [Google Scholar] [CrossRef]
  47. Naylor, R.L.; Goldburg, R.J.; Primavera, J.H.; Kautsky, N.; Beveridge, M.C.; Clay, J.; Folke, C.; Lubchenco, J.; Mooney, H.; Troell, M. Effect of aquaculture on world fish supplies. Nature 2000, 405, 1017–1024. [Google Scholar] [CrossRef] [PubMed]
  48. Cannicci, S.; Burrows, D.; Fratini, S.; Smith, T.J.; Offenberg, J.; Dahdouh-Guebas, F. Faunal impact on vegetation structure and ecosystem function in mangrove forests: A review. Aquat. Bot. 2008, 89, 186–200. [Google Scholar] [CrossRef]
  49. Primavera, J.H. Socio-economic impacts of shrimp culture. Aquac. Res. 1997, 28, 815–827. [Google Scholar] [CrossRef]
  50. Marshall, N. Mangrove conservation in relation to overall environmental considerations. Hydrobiologia 1994, 285, 303–309. [Google Scholar] [CrossRef]
  51. Walters, B.B.; Rönnbäck, P.; Kovacs, J.M.; Crona, B.; Hussain, S.A.; Badola, R.; Primavera, J.H.; Barbier, E.; Dahdouh-Guebas, F. Ethnobiology, socio-economics and management of mangrove forests: A review. Aquat. Bot. 2008, 89, 220–236. [Google Scholar] [CrossRef]
  52. Boullion, S.; Borges, A.V.; Castañeda-Moya, E.; Diele, K.; Dittmar, T.; Duke, N.C.; Kristensen, E.; Lee, S.Y.; Marchand, C.; Middelburg, J.J.; Rivera-Monroy, V.H.; Smith, T.J., III; Twilley, R.R. Mangrove production and carbon sinks: A revision of global budget estimates. Glob. Biochem. Cycles 2008, 22, GB 2013, 1-12. [Google Scholar]
  53. Kristensen, E.; Bouillon, S.; Dittmar, T.; Marchand, C. Organic carbon dynamics in mangrove ecosystems: A review. Aquat. Bot. 2008, 89, 201–219. [Google Scholar] [CrossRef]
  54. Bandaranayake, W.M. Traditional and medicinal uses of mangroves. Mangroves Salt Marshes 1998, 2, 133–148. [Google Scholar] [CrossRef]
  55. Xie, G.; Zhen, L.; Lu, C.; Xiao, Y.; Li, W. Applying Value Transfer Method for Eco-Service Valuation in China. J. Resour. Ecol. 2010, 1, 51–59. [Google Scholar]
  56. UNEP-WCMC. In the Front Line: Shoreline Protection and Other Ecosystem Services from Mangroves and Coral Reefs; UNEP-WCMC: Cambridge, UK, 2006; Available online: http://new.unep.org/pdf/infrontline_06.pdf (accessed on 30 October 2009).
  57. Costanza, R.; d’Arge, R.; de Groot, R.; Farber, S.; Grasso, M.; Hannon, B.; Limburg, K.; Naeem, S.; O’Neill, R.V.; Paruelo, J.; Raskin, R.G.; Sutton, P.; van den Belt, M. The value of the world’s ecosystem services and natural capital. Nature 1997, 387, 253–260. [Google Scholar] [CrossRef]
  58. Sathirathai, S.; Barbier, E.B. Valuing mangrove conservation in southern Thailand. Contemp. Economic Policy 2001, 19, 109–122. [Google Scholar] [CrossRef]
  59. Primavera, J.H. Mangroves, fishponds, and the quest for sustainability. Science 2005, 310, 57–59. [Google Scholar] [CrossRef] [PubMed]
  60. Primavera, J.H. Overcoming the impacts of aquaculture on the coastal zone. Ocean Coast. Manage. 2006, 49, 531–545. [Google Scholar] [CrossRef]
  61. Gilman, E.L.; Ellison, J.; Duke, N.C.; Field, C. Threats to mangroves from climate change and adaptation options: A review. Aquat. Bot. 2008, 89, 237–250. [Google Scholar] [CrossRef]
  62. EJF. Farming The Sea, Costing The Earth: Why We Must Green The Blue Revolution; Environmental Justice Foundation: London, UK, 2004. Available online: http://www.ejfoundation.org/pdf/farming_the_sea_costing_the_earth.pdf (accessed on 30 October 2009).
  63. Lebel, L.; Tri, N.H.; Saengnoree, A.; Pasong, S.; Buatama, U.; Thoa, L.K. Industrial transformation and shrimp aquaculture in Thaland and Vietnam: Pathways to ecological, social, and economic sustainability? Ambio 2002, 31, 311–323. [Google Scholar] [CrossRef] [PubMed]
  64. Farnsworth, E.J.; Ellison, A.M. The global conservation status of mangroves. Ambio 1997, 26, 328–334. [Google Scholar]
  65. Primavera, J.H. Development and conservation of Philippine mangroves: Institutional issues. Ecol. Economics 2000, 35, 91–106. [Google Scholar] [CrossRef]
  66. Chan, H.T.; Baba, S. Manual on Guidelines for Rehabilitation of Coastal Forests Damaged by Natural Hazards in the Asia-Pacific Region; International Society for Mangrove Ecosystems (ISME) and International Tropical Timber Organization (ITTO): Okinawa, Japan, 2009; p. 66. [Google Scholar]
  67. Field, C.D. Impact of expected climate change on mangroves. Hydrobiologia 1995, 295, 75–81. [Google Scholar] [CrossRef]
  68. Gilman, E.L.; Ellison, J.; Duke, N.C.; Field, C. Threats to mangroves from climate change and adaptation options: A review. Aquat. Bot. 2008, 89, 237–250. [Google Scholar] [CrossRef]
  69. Gilman, E.L.; Ellison, J.; Jungblut, V.; Van Lavieren, H.; Wilson, L.; Areki, F.; Brighouse, G.; Bungitak, J.; Dus, E.; Henry, M.; et al. Adapting to Pacific Island mangrove responses to sea level rise and climate change. Climate Res. 2006, 32, 161–176. [Google Scholar] [CrossRef]
  70. Krauss, K.W.; Lovelock, C.E.; Mckee, K.L.; Lopez-Hoffman, L.; Ewe, S.M.L.; Sousa, W.P. Environmental drivers in mangrove establishment and early development: A review. Aquat. Bot. 2008, 89, 105–127. [Google Scholar] [CrossRef]
  71. Bosire, J.O.; Dahdouh-Guebas, F.; Walton, M.; Crona, B.I.; Lewis III, R.R.; Field, C.; Kairo, J.G.; Koedam, N. Functionality of restored mangroves: A review. Aquat. Bot. 2008, 89, 251–259. [Google Scholar] [CrossRef]
  72. Thu, P.M.; Populus, J. Status and changes of mangrove forest in Mekong Delta: Case study in Tra Vinh, Vietnam. Estuar. Coast. Shelf Sci. 2007, 71, 98–109. [Google Scholar] [CrossRef]
  73. Field, C.D. Mangrove rehabilitation: Choice and necessity. Hydrobiologia 1999, 413, 47–52. [Google Scholar] [CrossRef]
  74. Kairo, J.G.; Dahdouh-Guebas, F.; Bosire, J.; Koedam, N. Restoration and management of mangrove systems—A lesson for and from the East African region. South Afr. J. Bot. 2001, 67, 383–389. [Google Scholar] [CrossRef]
  75. Ramsey, E.W., III; Jensen, J.R. Remote sensing of mangrove wetlands: Relating canopy spectra to site-specific data. Photogramm. Eng. Remote Sensing 1996, 62, 939–948. [Google Scholar]
  76. Meza Diaz, B.; Blackburn, G.A. Remote sensing of mangrove biophysical properties: Evidence from a laboratory simulation of the possible effects of background variation on spectral vegetation indices. Int. J. Remote Sens. 2003, 24, 53–73. [Google Scholar] [CrossRef]
  77. Wang, L.; Silván-Cárdenas, L.; Sousa, W.P. Neural network classification of mangrove species from multi-seasonal Ikonos imagery. Photogramm. Eng. Remote Sensing 2008, 74, 921–927. [Google Scholar] [CrossRef]
  78. Jones, J.; Dale, P.E.; Chandica, A.L.; Breitfuss, M.J. Changes in distribution of grey mangrove Avicennia marina (Forsk.) using large scale aerial color infrared photographs: Are changes related to habitat modification for mosquito control? Estuar. Coast. Shelf Sci. 2004, 61, 45–54. [Google Scholar] [CrossRef]
  79. Gao, J.A. Hybrid method toward accurate mapping of mangroves in a marginal habitat from SPOT Multispectral data. Int. J. Remote Sens. 1998, 19, 1887–1899. [Google Scholar] [CrossRef]
  80. Kasischke, E.S.; Melack, J.M.; Dobson, M.C. The Use of Imaging Radars for Ecological Applications—A Review. Remote Sens. Environ. 1997, 59, 141–156. [Google Scholar] [CrossRef]
  81. Mougin, E.; Proisy, C.; Marty, G.; Fromard, F.; Puig, H.; Betoulle, J.L.; Rudant, J.P. Multifrequency and multipolarization radar backscattering from mangrove forests. IEEE Trans. Geosci. Remote Sens. 1999, 37, 94–102. [Google Scholar] [CrossRef]
  82. Proisy, C.; Mougin, E.; Fromard, F.; Karam, M.A. Interpretation of polarimetric radar signatures of mangrove forests. Remote Sens. Environ. 2000, 71, 56–66. [Google Scholar] [CrossRef]
  83. Proisy, C.; Mougin, E.; Fromard, F.; Trichon, V.; Karam, M.A. On the influence of canopy structure on the radar backscattering mangrove forests. Int. J. Remote Sens. 2002, 23, 4197–4210. [Google Scholar] [CrossRef]
  84. Wang, Y.; Imhoff, M.L. Simulated and observed L-HH radar backscatter from tropical mangrove forests. Int. J. Remote Sens. 1993, 14, 2819–2828. [Google Scholar] [CrossRef]
  85. Proisy, C.; Mitchell, A.; Lucas, R.; Fromard, F.; Mougin, E. Estimation of Mangrove Biomass using Multifrequency Radar Data. Application to Mangroves of French Guiana and Northern Australia. In Proceedings of the Mangrove 2003 Conference, Salvador, Bahia, Brazil, 20–24 May 2003.
  86. Lucas, R.M.; Ellison, J.C.; Mitchell, A.; Donnelly, B.; Finlayson, M.; Milne, A.K. Use of stereo aerial photography for quantifying changes in the extent and height of mangroves in tropical Australia. Wetlands Ecol. Manage. 2002, 10, 161–175. [Google Scholar] [CrossRef]
  87. Lucas, R.M.; Mitchell, A.L.; Rosenqvist, A.; Proisy, C.; Melius, A.; Ticehurst, C. The potential of L-band SAR for quantifying mangrove characteristics and change: Case studies from the tropics. Aquat. Conserv. 2007, 17, 245–264. [Google Scholar] [CrossRef]
  88. Kovacs, J.M.; Vandenberg, C.V.; Wang, J.; Flores-Verdugo, F. The Use of multipolarized spaceborne SAR backscatter for monitoring the health of a degraded mangrove forest. J. Coast. Res. 2008, 24, 248–254. [Google Scholar] [CrossRef]
  89. Green, E.P.; Clark, C.D.; Mumby, P.J.; Edwards, A.J.; Ellis, A.C. Remote sensing techniques for mangrove mapping. Int. J. Remote Sens. 1998, 19, 935–956. [Google Scholar] [CrossRef]
  90. Dale, P.E.; Chandica, A.L.; Evans, M. Using image subtraction and classification to evaluate change in sub-tropical intertidal wetlands. Int. J. Remote Sens. 1996, 17, 703–719. [Google Scholar] [CrossRef]
  91. Jones, J.; Dale, P.E.; Chandica, A.L.; Breitfuss, M.J. Changes in distribution of grey mangrove Avicennia marina (Forsk.) unsing large scale aerial color infrared photographs: Are changes related to habitat modification for mosquito control? Estuar. Coast. Shelf Sci. 2004, 61, 45–54. [Google Scholar] [CrossRef]
  92. Everitt, J.H.; Escobar, D.E.; Judd, F.W. Evaluation of airborne video imagery for distinguishing black mangrove (Avicennia germinans) on the lower Texas Gulf Coast. J. Coast. Res. 1991, 7, 1169–1173. [Google Scholar]
  93. Everitt, J.H.; Judd, F.W. Using remote sensing techniques to distinguish and monitor black mangrove (Avicennia germinans). J. Coast. Res. 1989, 5, 737–745. [Google Scholar]
  94. Everitt, J.H.; Judd, F.W.; Escobar, D.E.; Davis, M.R. Integration of remote sensing and spatial information technologies for mapping black mangrove on the Texas Gulf Coast. J. Coast. Res. 1996, 12, 64–69. [Google Scholar]
  95. Everitt, J.H.; Yang, C.; Summy, K.R.; Judd, F.W.; Davis, M.R. Evaluation of color-infrared photography and digital imagery of map black mangrove on Texas Gulf Coast. J. Coast. Res. 2007, 23, 230–235. [Google Scholar] [CrossRef]
  96. Dahdouh-Guebas, F.; Zetterström, T.; Rönnbäck, P.; Troell, M.; Wickramasinghe, A.; Koedam, N. Recent changes in land-use in the Pambala-Chilaw Lagoon complex (Sri Lanka) investigated using remote sensing and GIS: Conservation of mangroves vs. development of shrimp farming. Environ. Develop. Sustain. 2002, 4, 185–200. [Google Scholar] [CrossRef]
  97. Sulong, I.; Mohd-Lokman, H.; Mohd-Tarmizi, K.; Ismail, A. Mangrove mapping using Landsat imagery and aerial photographs: Kemaman District; Terengganu; Malaysia. Environ. Develop. Sustain. 2002, 4, 135–152. [Google Scholar] [CrossRef]
  98. Benfield, S.L.; Guzman, H.M.; Mair, J.M. Temporal mangrove dynamics in relation to coastal developmentin Pacific Panama. J. Environ. Manage. 2005, 76, 263–276. [Google Scholar] [CrossRef] [PubMed]
  99. Dahdouh-Guebas, F.; Van Pottelbergh, I.; Kairo, J.G.; Cannicci, S.; Koedam, N. Human-impacted mangroves in Gazi (Kenya): predicting future vegetation based on retrospective remote sensing; social surveys; and distribution of trees. Mar. Ecol. Progr. Ser. 2004, 272, 77–92. [Google Scholar] [CrossRef]
  100. Calzadilla Pérez, A.; Damen, M.C.J.; Geneletti, D.; Hobma, T.W. Monitoring a recent delta formation in a tropical coastal wetland using remote sensing and GIS. Case study: Guapo River delta, Laguna de Tacarigua, Venezuela. Environ. Develop. Sustain. 2002, 4, 201–219. [Google Scholar] [CrossRef]
  101. Kairo, J.G.; Kivyatu, B.; Koedam, N. Application of remote sensing and GIS in the management of mangrove forests within and adjacent to Kiunga Marine Protected Area, Lamu, Kenya. Environ. Develop. Sustain. 2002, 4, 153–166. [Google Scholar] [CrossRef]
  102. Lucas, R.M.; Mitchell, A.; Proisy, C. The Use of Polarimetric AIRSAR (POLSAR) Data for Characterising Mangrove Communities. In Proceedings of AIRSAR Earth Science and Application Workshop, Pasadena, CA, USA, 4–6 March 2002.
  103. Binh, T.; Vromant, N.; Hung, N.T.; Hens, L.; Boon, E.K. Land cover changes between 1968 and 2003 in Cai Nuoc, Ca Mau Peninsula, Vietnam. Environ. Develop. Sustain. 2005, 7, 519–536. [Google Scholar] [CrossRef]
  104. Coppin, P.; Jonckheere, I.; Nackaerts, K.; Muys, B.; Lambin, E. Digital change detection methods in ecosystem monitoring: A review. Int. J. Remote Sens. 2004, 25, 1565–1596. [Google Scholar] [CrossRef]
  105. Almeida-Guerra, P. Use of SPOT images as a tool for coastal zone management and monitoring of environmental impacts in the coastal zone. Opt. Eng. 2002, 41, 2144–2151. [Google Scholar] [CrossRef]
  106. Béland, M.; Goïta, K.; Bonn, F.; Pham, T.T. Assessment of land-cover changes related to shrimp aquaculture using remote sensing data: A case in the Giao Thury District, Vietnam. Int. J. Remote Sens. 2006, 27, 1491–1510. [Google Scholar] [CrossRef]
  107. Berlanga-Robles, C.A.; Ruiz-Luna, A. Land use mapping and change detection in the coastal zone of northwest Mexico using remote sensing techniques. J. Coast. Res. 2002, 18, 514–522. [Google Scholar]
  108. Chatterjee, B.; Prowal, M.C.; Hussin, Y.A. Assessment of Tsunami Damage to Mangrove in India Using Remote Sensing and GIS. In Proceedings of XXI ISPRS Congress, Beijing, China, 3–11 July 2008; In IAPRS. ISPRS: Vienna, Austria, 2008; Volume 37. Part B8. [Google Scholar]
  109. Conchedda, G.; Durieux, L.; Mayaux, P. An object-based method for mapping and change analysis in mangrove ecosystems. ISPRS J. Photogramm. Remote Sens. 2008, 63, 578–589. [Google Scholar] [CrossRef]
  110. Giri, C.; Muhlhausen, J. Mangrove forest distribution and dynamics in Madagascar (1975–2005). Sensors 2008, 8, 2104–2117. [Google Scholar] [CrossRef]
  111. Kovacs, J.M.; Wang, J.; Blanco-Correa, M. Mapping disturbances in a mangrove forest using multi-date Landsat TM imagery. Environ. Manage. 2001, 27, 763–776. [Google Scholar] [CrossRef] [PubMed]
  112. Muttitanon, W.; Tripathi, N.K. Land use/land cover changes in coastal zone of Ban Don Bay, Thailand using Landsat 5 TM data. Int. J. Remote Sens. 2005, 26, 2311–2323. [Google Scholar] [CrossRef]
  113. Ramasubramanian, R.; Gnanappazham, L.; Ravishankar, T.; Navamuniyammal, M. Mangroves of Godavari—Analysis through remote sensing approach. Wetlands Ecol. Manage. 2006, 14, 29–37. [Google Scholar] [CrossRef]
  114. Ruiz-Luna, A.; Berlanga-Robles, C.A. Modifications in coverage patterns and land use around the Huizache-Caimanero lagoon system, Sinaloa, Mexico: A multi-temporal analysis using Landsat images. Estuar. Coast. Shelf Sci. 1999, 49, 37–44. [Google Scholar] [CrossRef]
  115. Singh, I.J.; Singh, S.K.; Kushwaha, S.P.; Ashutosh, S.; Singh, R.K. Assessment and monitoring of estuarine mangrove forests of Goa using satellite remote sensing. J. Ind. Soc. Remote Sens. 2004, 32, 167–174. [Google Scholar] [CrossRef]
  116. Gang, P.O.; Agatsiva, J.L. The current status of mangroves along the Kenyan coast: A case study of Mida Creek mangroves based on remote sensing. Hydrobiologia 1992, 247, 29–36. [Google Scholar] [CrossRef]
  117. Wang, Y.; Bonynge, G.; Nugranad, J.; Traber, M.; Ngusaru, A.; Tobey, J.; Hale, L.; Bowen, R.; Makota, V. Remote sensing of mangrove change along the Tanzania Coast. Marine Geodesy 2003, 26, 35–48. [Google Scholar] [CrossRef]
  118. Blasco, F.; Aizpuru, M. Mangroves along the coastal stretch of the Bay of Bengal: Present status. Ind. J. Mar. Sci. 2002, 31, 9–20. [Google Scholar]
  119. Sirikulchayanon, P.; Sun, W.; Oyana, T.J. Assessing the impact of the 2004 tsunami on magroves using remote sensing and GIS techniques. Int. J. Remote Sens. 2008, 29, 3553–3576. [Google Scholar] [CrossRef]
  120. Prasad, P.R.; Reddy, C.S.; Rajan, K.S.; Raza, S.H.; Dutt, C.B. Assessment of tsunami and anthropogenic impacts on the forest of the North Andaman Islands, India. Int. J. Remote Sens. 2009, 30, 1235–1249. [Google Scholar] [CrossRef]
  121. Vasconcelos, M.J.; Mussá Biai, J.C.; Araújo, A.; Diniz, M.A. Land cover change in two protected areas of Guinea-Bissau (1956–1998). Appl. Geogr. 2002, 22, 139–156. [Google Scholar] [CrossRef]
  122. Saito, H.; Bellan, M.F.; Al-Habshi, A.; Aizpuru, M.; Blasco, F. Mangrove research and coastal ecosystem studies with SPOT-4 HRVIR and TERRA ASTER in Arabian Gulf. Int. J. Remote Sens. 2003, 24, 4073–4092. [Google Scholar] [CrossRef]
  123. Gao, J.A. comparative study on spatial and spectral resolutions of satellite data in mapping mangrove forests. Int. J. Remote Sens. 1999, 20, 2823–2833. [Google Scholar] [CrossRef]
  124. Green, E.P.; Mumby, P.J.; Edwards, A.J.; Clark, C.D.; Ellis, A.C. Estimating leaf area index of mangroves from satellite data. Aquat. Bot. 1997, 58, 11–19. [Google Scholar] [CrossRef]
  125. Lee, T.-M.; Yeh, H.-C. Applying remote sensing techniques to monitor shifting wetland vegetation: A case study of Danshui River estuary mangrove communities, Taiwan. Ecol. Eng. 2009, 35, 487–496. [Google Scholar] [CrossRef]
  126. Jensen, J.R.; Lin, H.; Yang, X.; Ramsey III, E.W.; Davis, B.A.; Thoemke, C.W. The measurement of mangrove characteristics in southwest Florida using SPOT multispectral data. Geocarto Int. 1991, 6, 13–21. [Google Scholar] [CrossRef]
  127. Araújo, R.J.; Jaramillo, J.C.; Snedaker, S.C. LAI and leaf size differences in two red mangrove forest types in South Florida. Bull. Mar. Sci. 1997, 60, 643–647. [Google Scholar]
  128. Myint, S.W.; Giri, C.P.; Wang, L.; Zhu, Z.; Gillette, S.C. Identifiying mangrove species and their surrounding land use and land cover classes using an object-oriented approach with a lacunarity spatial measure. GISci. Remote Sens. 2008, 45, 188–208. [Google Scholar] [CrossRef]
  129. Giri, C.P.; Delsol, J.-P. Mangrove forest cover mapping in Phangnga Bay, Thailand, Using SPOT HRV and JERS-1 data in conjunction with GIS. In Proceedings of International Seminar on Remote Sensing for Coastal Zone and Coral Reef Applications, Bangkok, Thailand, 25 October–1 November 1993.
  130. Rodriguez, W.; Feller, I.C. Mangrove landscape characterization and change in Twin Cays, Belize using aerial photography and IKONOS satellite data. Atoll Res. Bull. 2004, 513, 1–22. [Google Scholar] [CrossRef]
  131. Dahdouh-Guebas, F.; van Hiel, E.; Chan, J.C.-W.; Jayatissa, L.P.; Koedam, N. Qualitative distinction of congeneric and introgressive mangrove species in mixed patchy forest assemblages using high spatial resolution remotely sensed imagery (IKONOS). Syst. Biodiver. 2005, 2, 113–119. [Google Scholar] [CrossRef]
  132. Neukermans, G.; Dahdouh-Guebas, F.; Kairo, J.G.; Koedam, N. Mangrove species and stand mapping in Gazi Bay (Kenya) using Quickbird satellite imagery. J. Spatial Sci. 2008, 53, 75–86. [Google Scholar] [CrossRef]
  133. Saleh, M.A. Mangrove vegetation on Abu Minqar island of the Red Sea. Int. J. Remote Sens. 2007, 28, 5191–5194. [Google Scholar] [CrossRef]
  134. Wang, L.; Sousa, W.P.; Gong, P. Integration of object-based and pixel-based classification for mangrove mapping with IKONOS imagery. Int. J. Remote Sens. 2004, 24, 5655–5668. [Google Scholar] [CrossRef]
  135. Proisy, C.; Couteron, P.; Fromard, F. Predicting and mapping mangrove biomass from canopy grain analoysis using Fourier-based tectural ordination of IKONOS images. Remote Sens. Environ. 2007, 109, 379–392. [Google Scholar] [CrossRef]
  136. Kovacs, J.M.; Flores-Verdugo, F.; Wang, J.; Aspden, L.P. Estimating leaf area index of a degraded mangrove forest using high spatial resolution satellite data. Aquat. Bot. 2004, 80, 13–22. [Google Scholar] [CrossRef]
  137. Kovacs, J.M.; Wang, J.; Flores-Verdugo, F. Mapping mangrove leaf area index at the species level using IKONOS and LAI-2000 sensors for the Agua Brava Lagoon, Mexican Pacific. Estuar. Coast. Shelf Sci. 2005, 62, 377–384. [Google Scholar] [CrossRef]
  138. Olwig, M.F.; Sørensen, M.K.; Rasmussen, M.S.; Danielsen, F.; Selvam, V.; Hansen, L.B.; Nyborg, L.; Vestergaard, K.B.; Parish, F.; Karunagaran, V.M. Using remote sensing to assess the protective role of coastal woody vegetation against tsunami waves. Int. J. Remote Sens. 2007, 28, 3153–3169. [Google Scholar] [CrossRef]
  139. Kanniah, K.D.; Wai, N.S.; Shin, A.L.; Rasib, A.W. Per-pixel and sub-pixel classifications of high-resolution satellite data for mangrove species mapping. Appl. GIS 2007, 3, 1–22. [Google Scholar]
  140. Green, R.O.; Eastwood, M.L.; Sarture, C.M.; Chrien, T.G.; Aronsson, M.; Chippendale, B.J.; Faust, J.A.; Pavri, B.E.; Chovit, C.J.; Solis, M.; Olah, M.R.; Williams, O. Imaging spectroscopy and the Airborne Visible/Infrared Imaging Spectrometer (AVIRIS). Remote Sens. Environ. 1998, 65, 227–248. [Google Scholar] [CrossRef]
  141. Ong, C.C.; Cudahy, T.J.; Caccetta, M.S.; Piggott, M.S. Deriving quantitative dust measurements related to iron ore handling from airborne hyperspectral data. Mining Tech. Trans. Inst. Min. Metall. A 2003, 112, 158–163. [Google Scholar] [CrossRef]
  142. Dale, P.E.; Knight, J.; Ritchie, S.A.; Kay, B.H. A practical tool to identify water bodies with potential for mosquito habitat under mangrove canopy: Large-scale airborne scanning in the thermal band 8–13 µm. Wetlands Ecol. Manage. 2005, 13, 389–394. [Google Scholar] [CrossRef]
  143. Hirano, A.; Madden, M.; Welch, R. Hyperspectral image data for mapping wetland vegetation. Wetland 2003, 23, 436–448. [Google Scholar] [CrossRef]
  144. Yang, C.; Everitt, J.H.; Fletcher, R.S.; Jensen, R.R.; Mausel, P.W. Evaluating AISA+ hyperspectral imagery for mapping black mangrove along the South Texas Gulf Coast. Photogramm. Eng. Remote Sensing 2009, 75, 425–435. [Google Scholar] [CrossRef]
  145. Demuro, M.; Chisholm, L. Assessment of Hyperion for Characterizing Mangrove Communities. In Proceedings of the 12th JPL AVIRIS Airborne Earth Science Workshop, Pasadena, CA, USA, 24–28 February 2003.
  146. Rao, B.R.; Dwivedi, R.S.; Kushwaha, S.P.; Bhattacharya, S.N.; Anand, J.B.; Dasgupta, S. Monitoring the spatial extent of coastal wetland using ERS-1 SAR data. Int. J. Remote Sens. 1999, 20, 2509–2517. [Google Scholar] [CrossRef]
  147. Lucas, R.M.; Carreiras, J.; Proisy, C.; Bunting, P. ALOS PALSAR Applications in the Tropics and Subtropics: Characterisation; Mapping and Detecting Change in Forests and Coastal Wetlands. In Proceedings of Second ALOS PI Symposium, Rhodes, Greece, 3–7 November 2008; Available online: http://amapmed.free.fr/AMAPMED_fichiers/Publications_fichiers/Lucas08.pdf (accessed on 30 October 2009).
  148. Simard, M.; Zhang, K.Q.; Rivera-Monroy, V.H.; Ross, M.S.; Ruiz, P.L.; Castañeda-Moya, E.; Twilley, R.R.; Rodriguez, E. Mapping height and biomass of mangrove forests in everglades national park with SRTM elevation data. Photogramm. Eng. Remote Sensing 2006, 72, 299–311. [Google Scholar] [CrossRef]
  149. Kovacs, J.M.; Vandenberg, C.V.; Flores-Verdugo, F. Assessing fine beam RADARSAT-1 backscatter from a white mangrove (Laguncularia racemosa (Gaertner)) canopy. Wetlands Ecol. Manage. 2006, 14, 401–408. [Google Scholar] [CrossRef]
  150. Pasqualini, V.; Iltis, J.; Dessay, N.; Lointier, M.; Guelorget, O.; Polidori, L. Mangrove mapping in North-Western Madagascar using SPOT-XS and SIR-C radar data. Hydrobiologica 1999, 413, 127–133. [Google Scholar] [CrossRef]
  151. Dwivedi, R.S.; Rao, B.R.; Bhattacharya, S. Mapping wetlands of the Sundaban Delta and its environs using ERS-1 SAR data. Int. J. Remote Sens. 1999, 20, 2235–2247. [Google Scholar] [CrossRef]
  152. Shanmugam, P.; Manjunath, A.S.; Ahn, Y.H.; Sanjeevi, S.; Ryu, J.H. Application of mulitsensor fusion techniques in remote sensing of coastal mangrove wetlands. Int. J. Geoinf. 2005, 1, 1–17. [Google Scholar]
  153. Souza Filho, P.W.; Paradella, W.R. Recognition of the main geobotanical features along the Braganca mangrove coast (Brazilian Amazon Region) from Landsat TM and RADARSAT-1 data. Wetlands 2002, 10, 123–132. [Google Scholar]
  154. Souza Filho, P.W.; Paradella, W.R. Use of RADARSAT-1 fine mode and Landsat-5 TM selective principal component analysis for geomorphological mapping in a macrotidal mangrove coast in the Amazon Region. Can. J. Remote Sens. 2005, 31, 214–224. [Google Scholar] [CrossRef]
  155. Simard, M.; De Grandi, G.; Saatchi, S.; Mayaux, P. Mapping tropical coastal vegetation using JERS-1 and ERS-1 radar data with a decision tree classifier. Int. J. Remote Sens. 2002, 23, 1461–1474. [Google Scholar] [CrossRef]
  156. Hess, L.L.; Melack, J.M.; Simonett, D.S. Radar detection of flooding beneath the forest canopy: A review. Int. J. Remote Sens. 1990, 11, 1313–1325. [Google Scholar] [CrossRef]
  157. MacKay, H.; Finlayson, C.M.; Fernández-Prieto, D.; Davidson, N.; Pritchard, D.; Rebelo, L.-M. The role of Earth Observation (EO) technologies in supporting implementation of the Ramsar Convention on Wetlands. J. Environ. Manage. 2009, 90, 2234–2242. [Google Scholar] [CrossRef] [PubMed]
  158. Souza Filho, P.W.; Paradella, W.R. Use of RADARSAT-1 fine mode and Landsat-5 TM selective principal component analysis for geomorphological mapping in a macrotidal mangrove coast in the Amazon Region. Can. J. Remote Sens. 2005, 31, 214–224. [Google Scholar] [CrossRef]
  159. de Groot, R. Function-analysis and valuation as a tool to assess land use conflicts in planning for sustainable, multi-functional landscapes. Landscape Urban Plan. 2006, 75, 175–186. [Google Scholar] [CrossRef]
  160. de Groot, R.S.; Wilson, M.A.; Boumans, R.M.J. A typology for the classification, description and valuation of ecosystem functions; goods and services. Ecol. Economics 2002, 41, 393–408. [Google Scholar] [CrossRef]
  161. Pearce, D. Economic Values and the Natural World; Earthscan Publications Limited: London, UK, 1993; p. 129. [Google Scholar]
  162. Turner, D.P.; Koerper, G.K.; Gucinski, H.; Peterson, C.; Dixon, R.K. Monitoring global change: Comparison of forest cover estimates using remote sensing and inventory approaches. Environ. Monitor. Assess. 1993, 26, 295–305. [Google Scholar] [CrossRef] [PubMed]
  163. Bingham, G.; Bishop, R.; Brody, M.; Bromley, B.; Clark, E.; Cooper, W.; Costanza, R.; Hale, T.; Hayden, G.; Kellert, S.; Norgaard, R.; Norton, B.; Payne, J.; Russell, C.; Suter, G. Issues in ecosystem valuation: improving information for decision making. Ecol. Economics 1995, 14, 73–90. [Google Scholar] [CrossRef]
  164. Daily, G.C. Introduction: What are ecosystem services. In Nature’s Services: Societal Dependence on Natural Ecosystems; Daily, G.C., Ed.; Island Press: Washington, DC, USA, 1997; pp. 1–10. [Google Scholar]
  165. Limburg, K.E.; Folke, C. The ecology of ecosystem services: Introduction to the special issue. Ecol. Economics 1999, 29, 179–182. [Google Scholar] [CrossRef]
  166. Wilson, M.A.; Carpenter, S.R. Economic valuation of freshwater ecosystem services in the United States, 1977–1997. Ecol. Appl. 1999, 9, 772–783. [Google Scholar]
  167. Daily, G.C.; Söderqvist, T.; Aniyar, S.; Arrow, K.; Dasgupta, P.; Ehrlich, P.R.; Folke, C.; Jansson, A.; Jansson, B.; Kautsky, N.; Levin, S.; Lubchenco, J.; Mäler, K.; Simpson, D.; Starrett, D.; Tilman, D.; Walker, B. The value of nature and the nature of value. Science 2000, 289, 395–396. [Google Scholar] [CrossRef] [PubMed]
  168. Tallis, H.; Kareiva, P.; Chang, M. An ecosystem services framework to support both practical conservation and economic development. Proc. Nat. Acad. Sci. USA 2008, 105, 9457–9466. [Google Scholar] [CrossRef] [PubMed]
  169. Lal, P.N. Conservation or Conversion of Mangroves in Fiji: An Ecological Economic Analysis; Occasional Paper No. 11; East-West Center, Environment and Policy Institute: Honolulu, HI, USA, 1990; p. 108. [Google Scholar]
  170. Ruitenbeck, J. The rainforest supply price: A tool for evaluating rainforest conservation expenditures. Ecol. Economics 1992, 6, 57–78. [Google Scholar] [CrossRef]
  171. Barbier, E.B. Valuing environmental functions: tropical wetlands. Land Economics 1994, 70, 155–173. [Google Scholar] [CrossRef]
  172. Sathirathai, S. Economic Valuation of Mangroves and the Roles of Local Communities in the Conservation of the Resources: Case Study of Surat Thani, South of Thailand; EEPSEA Research Report Series; Economy and Environment Program for Southeast Asia (EEPSEA): Singapore, 1998. [Google Scholar]
  173. Sathirathai, S.; Barbier, B. Valuing mangrove conservation in southern Thailand. Contemp. Economic Policy 2001, 19, 109–122. [Google Scholar] [CrossRef]
  174. Clough, B.F.; Ong, J.E.; Gong, W.K. Estimating leaf area index and photosynthetic production in canopies of the mangrove Rhizophora apiculata. Mar. Ecol. Progr. Ser. 1997, 159, 285–292. [Google Scholar] [CrossRef]
  175. Jusoff, K. Individual mangrove species identification and mapping in Port Klang using airborne hyperspectral imaging. J. Sustain. Sci. Manage. 2006, 1, 27–36. [Google Scholar]
  176. Chaudhury, M.U. Digital Analysis of Remote Sensing Data for Monitoring the Ecological Status of the Mangrove Forests of Sunderbans in Bangladesh. In Proceedings of the 23rd International Symposium on Remote Sensing of the Environmen, Bangkok, Thailand, 18–25 April 1990; pp. 493–497.
  177. Vibulsresth, S.; Downreang, D.; Ratanasermpong, S.; Silapathong, C. Mangrove Forest Zonation by Using High Resolution Satellite Data. In Proceedings of the 11th Asian Conference on Remote Sensing, Guangzhou, China, 15–21 November 1990. D-1-6.
  178. Long, B.G.; Skewes, T.D. A technique for mapping mangroves with Landsat TM satellite data and geographic information system. Estuar. Coast. Shelf Sci. 1996, 43, 373–381. [Google Scholar] [CrossRef]
  179. Lal, P. Economic valuation of mangroves and decision-making in the Pacific. Ocean Coast. Manage. 2003, 46, 823–844. [Google Scholar] [CrossRef]
  180. Manson, F.J.; Loneragan, N.R.; Phinn, S.R. Spatial and temporal variation in distribution of mangroves in Moreton Bay, subtropical Australia: A comparison of pattern metrics and change detection analyses based on aerial photographs. Estuar. Coast. Shelf Sci. 2003, 57, 653–666. [Google Scholar] [CrossRef]

