1. Introduction
Land-cover changes around large surface mines have caused serious environmental degradation in the landscape. In the north-western Czech Republic, rangelands were highly heterogeneous, with small-structured vegetation cover, often interwoven with cultivated areas. The studied areas originally served a variety of uses, including forage production, and have a very long land-use history. In the last few decades, widespread land-use transformations have affected quasi-equilibrium states of semi-natural ecosystems. Intensification processes in the surface mining industry have affected many sites, leading to a departure from this equilibrium. The resulting conflicts between environmental and economic priorities began to lead to land degradation processes that are aggravated by the specific climatic properties encountered in central Europe. In order to explore land-cover changes, the development of various projects such as CORINE [
1] is focused on the spatial distribution of habitats across Europe so that their actual extent can be determined and compared with the available historical data.
In addition to standard mapping, new satellite technology has become available over the past few decades [
2]. For instance, satellite image series are used for trend analysis of vegetation [
3], classification of large areas [
4], predictions for species and their habitat mapping [
5], forest mapping [
6], and detection of land use/cover changes [
7].
At the present time, remote sensing is also becoming an important tool for analysis of land-cover changes in an area with large surface mines, because ecological disasters caused by pollution by heavy metals are affecting our living environment [
8]. Thus, vegetation mapping and classification is used to enable prediction of potential pollution sources. Other research activities include mapping of primary succession in post-mining landscapes [
9]. More complex analyses are also provided in the framework of Geographic Information Systems (GISs) [
10] that mostly provide spatial processing and linking of the results with other data obtained by field exploration and automatic monitoring.
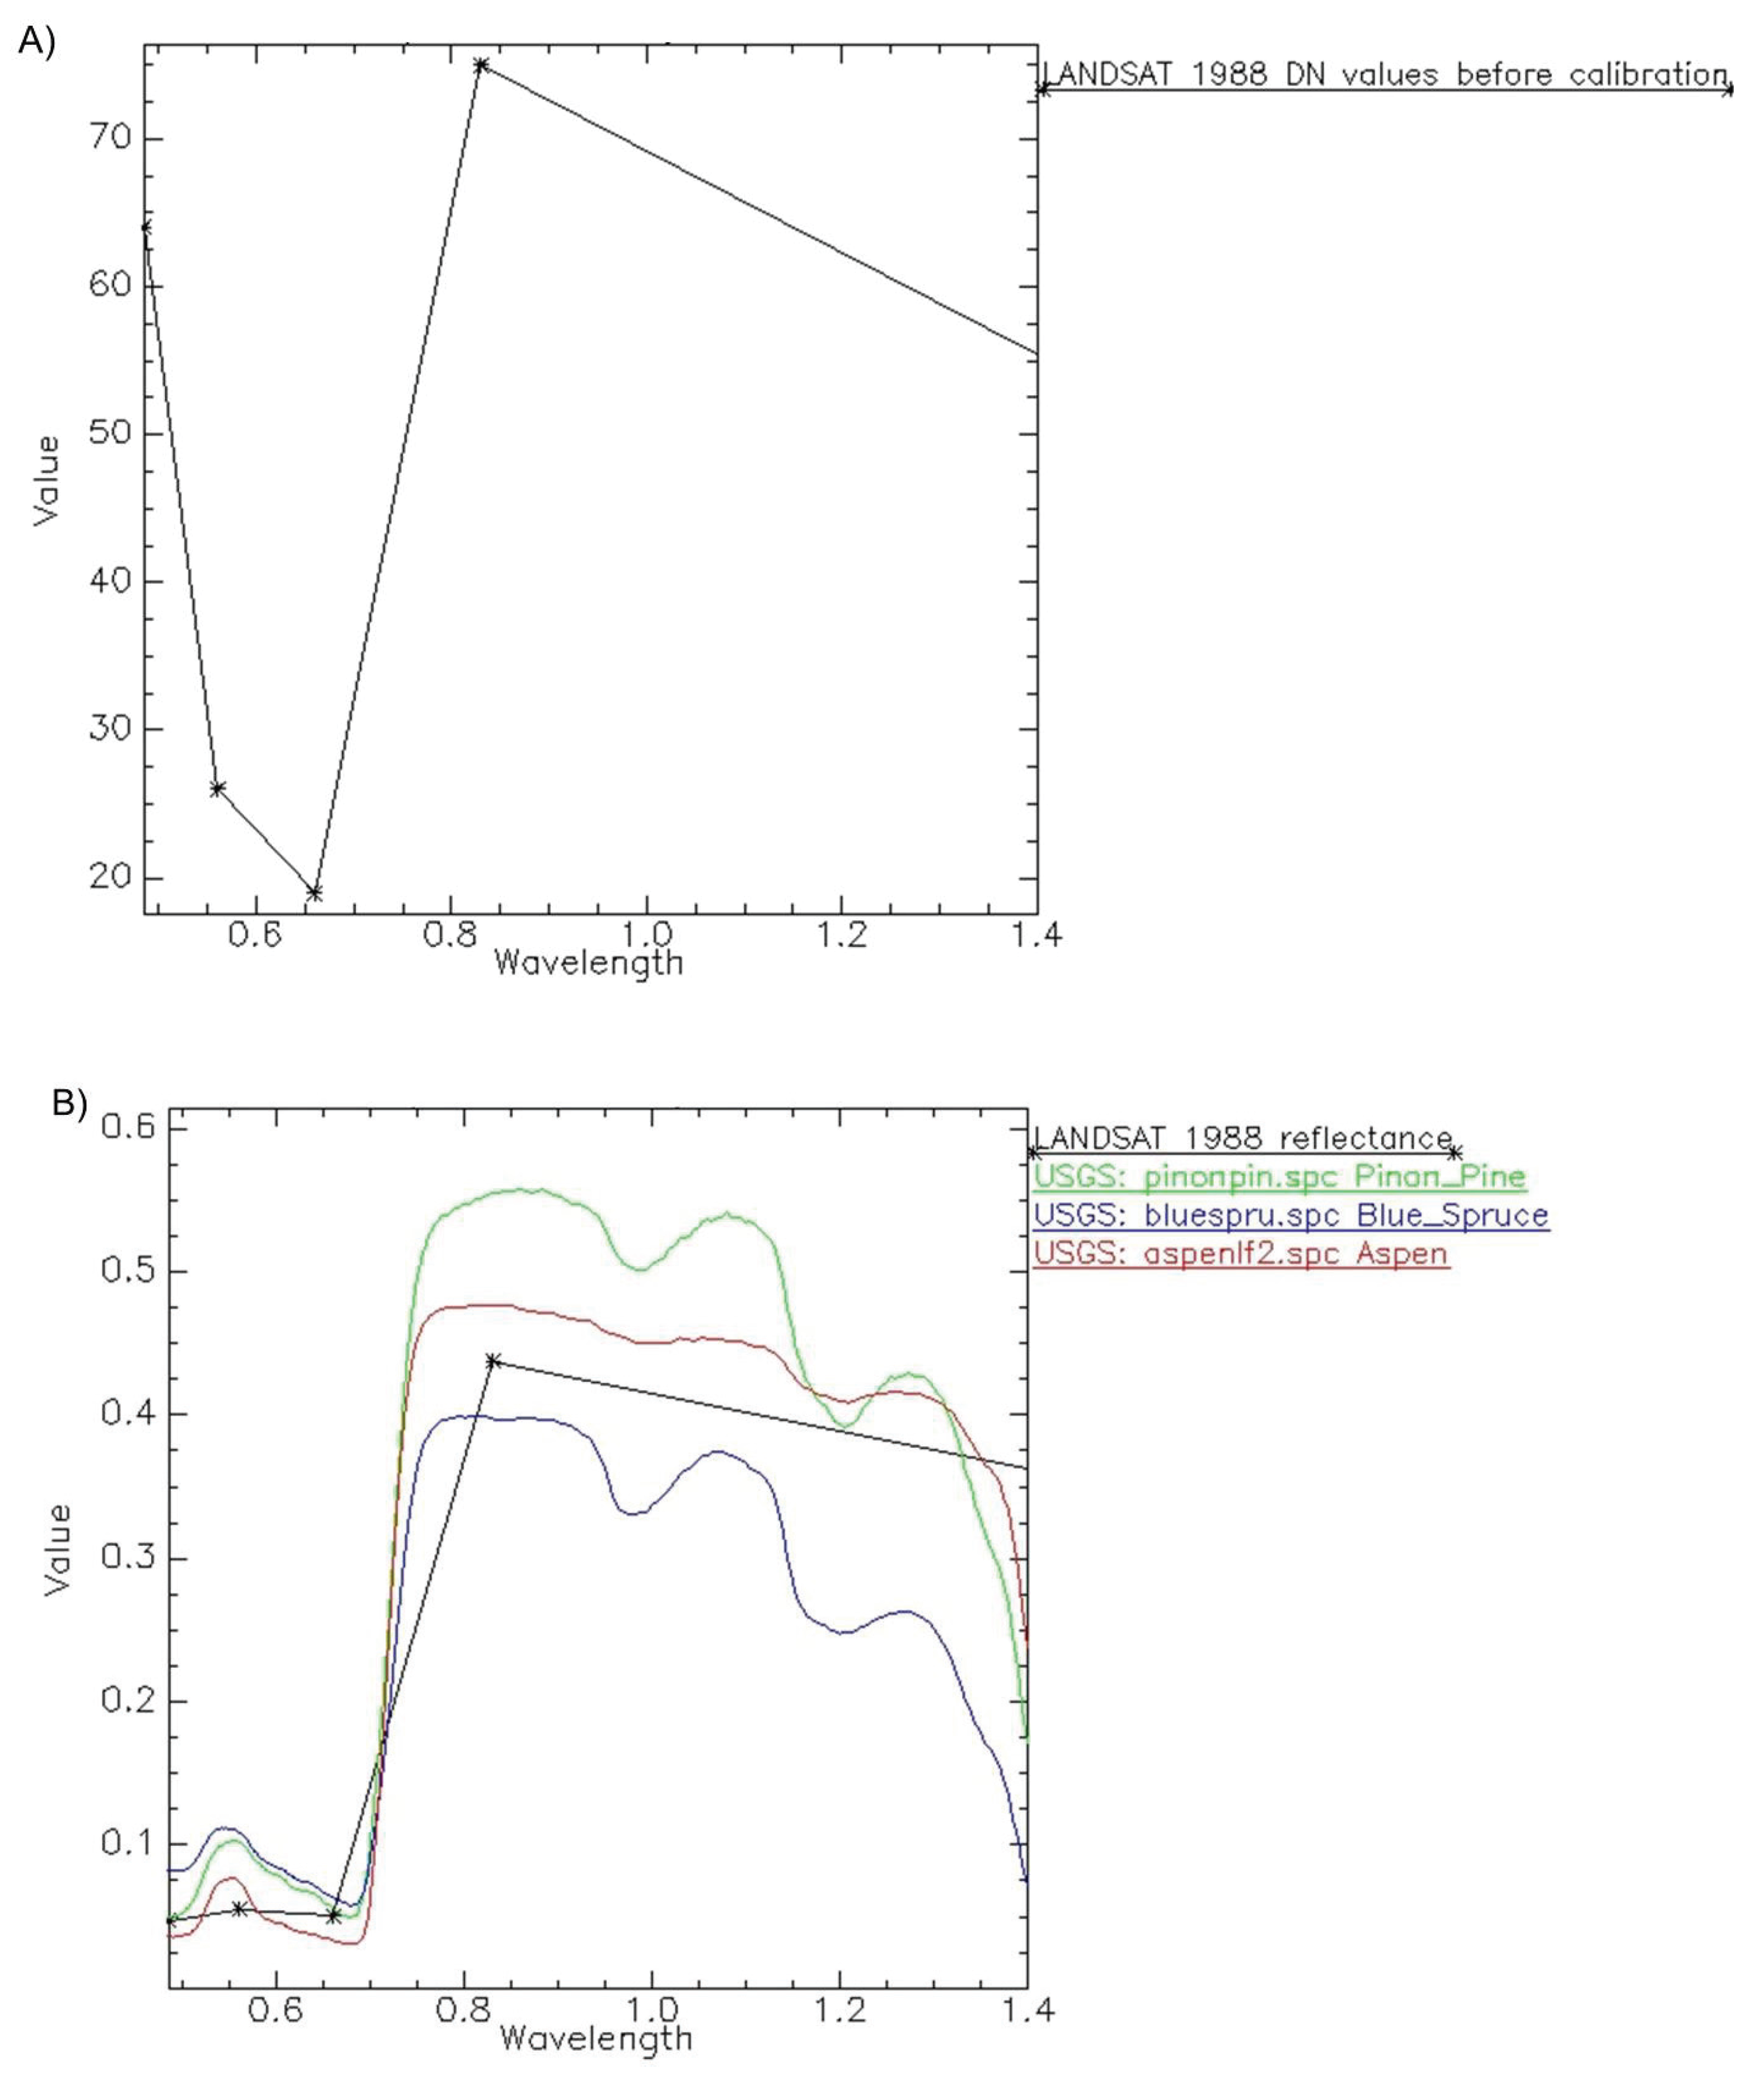
A great deal of satellite data is commercially available in the digital archives that offer a wide range of resolution scales and multispectral channels. However, the USGS Landsat archive containing records of the Earth’s surface and its availability over a number of decades and free-of-charge through electronic access via the Web represents an invaluable source for land-cover exploration. The downloaded pre-processed images at the 1T Level are terrain corrected with a 30/60 meter pixel size in the GeoTIFF output format. The map projection is the Universal Transverse Mercator (UTM). Due to an instrument malfunction on Landsat 7 on May 31, 2003, the ETM+ line of sight now traces a zig-zag pattern along the satellite ground track. It results in a deplication of the imaged area that increases toward the scene edge. However, these Landsat 7 ETM+ images are still capable of supporting land-cover analysis, particularly within the central portion of any given scene.
2. Methods
The numerous research projects based on remote sensing data for environmental monitoring indicate that land-cover explorations by processing of satellite images are becoming increasingly important tools for studying surface man-made activities on local, regional and global scales. Thus, it is evident that satellite-based images are widely accepted and used by many environmental disciplines for evaluation of environmental conditions, such as atmosphere, biosphere and hydrosphere exchanges. An approach for exploration of surface processes and their dynamics in the area of surface mines requires observation with frequent temporal coverage over a long period in order to identify natural changes from those associated with man-made activities. Although original observations in most surface mining areas are not available, remote sensing can be the only alternative to field observations when historical records are needed for studying middle-term land-cover changes.
2.1. Remote Sensing Data
In order to determine the patterns of land-cover variability and change, seasonal variations and distributions of various vegetation types have to be taken into account [
11]. Neighboring areas of surface coal mines in the Czech Republic indicate vegetation activities of herbaceous species, shrubs, forests and agricultural sites during the spring and summer [
12]. The peak activity for non-forest species mostly occurs in the spring. Forests exhibit higher activity in the summer. These seasonal variations must be taken into account in the framework of selection procedures for spatio-temporal analysis in order to capture satellite images on similar dates in different years. Thus, it is not possible to combine images obtained in different seasons of the selected years, as this can influence the temporal homogeneity of the final dataset for long-term temporal exploration.
The Landsat satellite images have been included in the data processing, based on the selected size for land-cover mapping and the temporal period for spatio-temporal analysis. Landsat images have become the most widely used data source for land-cover mapping because of the relatively long data record period and the high multispectral spatial resolution. Simultaneously, decreasing costs and the availability of free Landsat data offer opportunities for more complex spatio-temporal analysis.
For the presented land-cover change in an area of large surface mines, the study contains Landsat TM data from 1985, 1988, and 1990, together with Landsat ETM+ data from 2000, 2002, 2003, 2004, 2005, 2006, 2007, 2008, and 2009.
2.2. Study Area
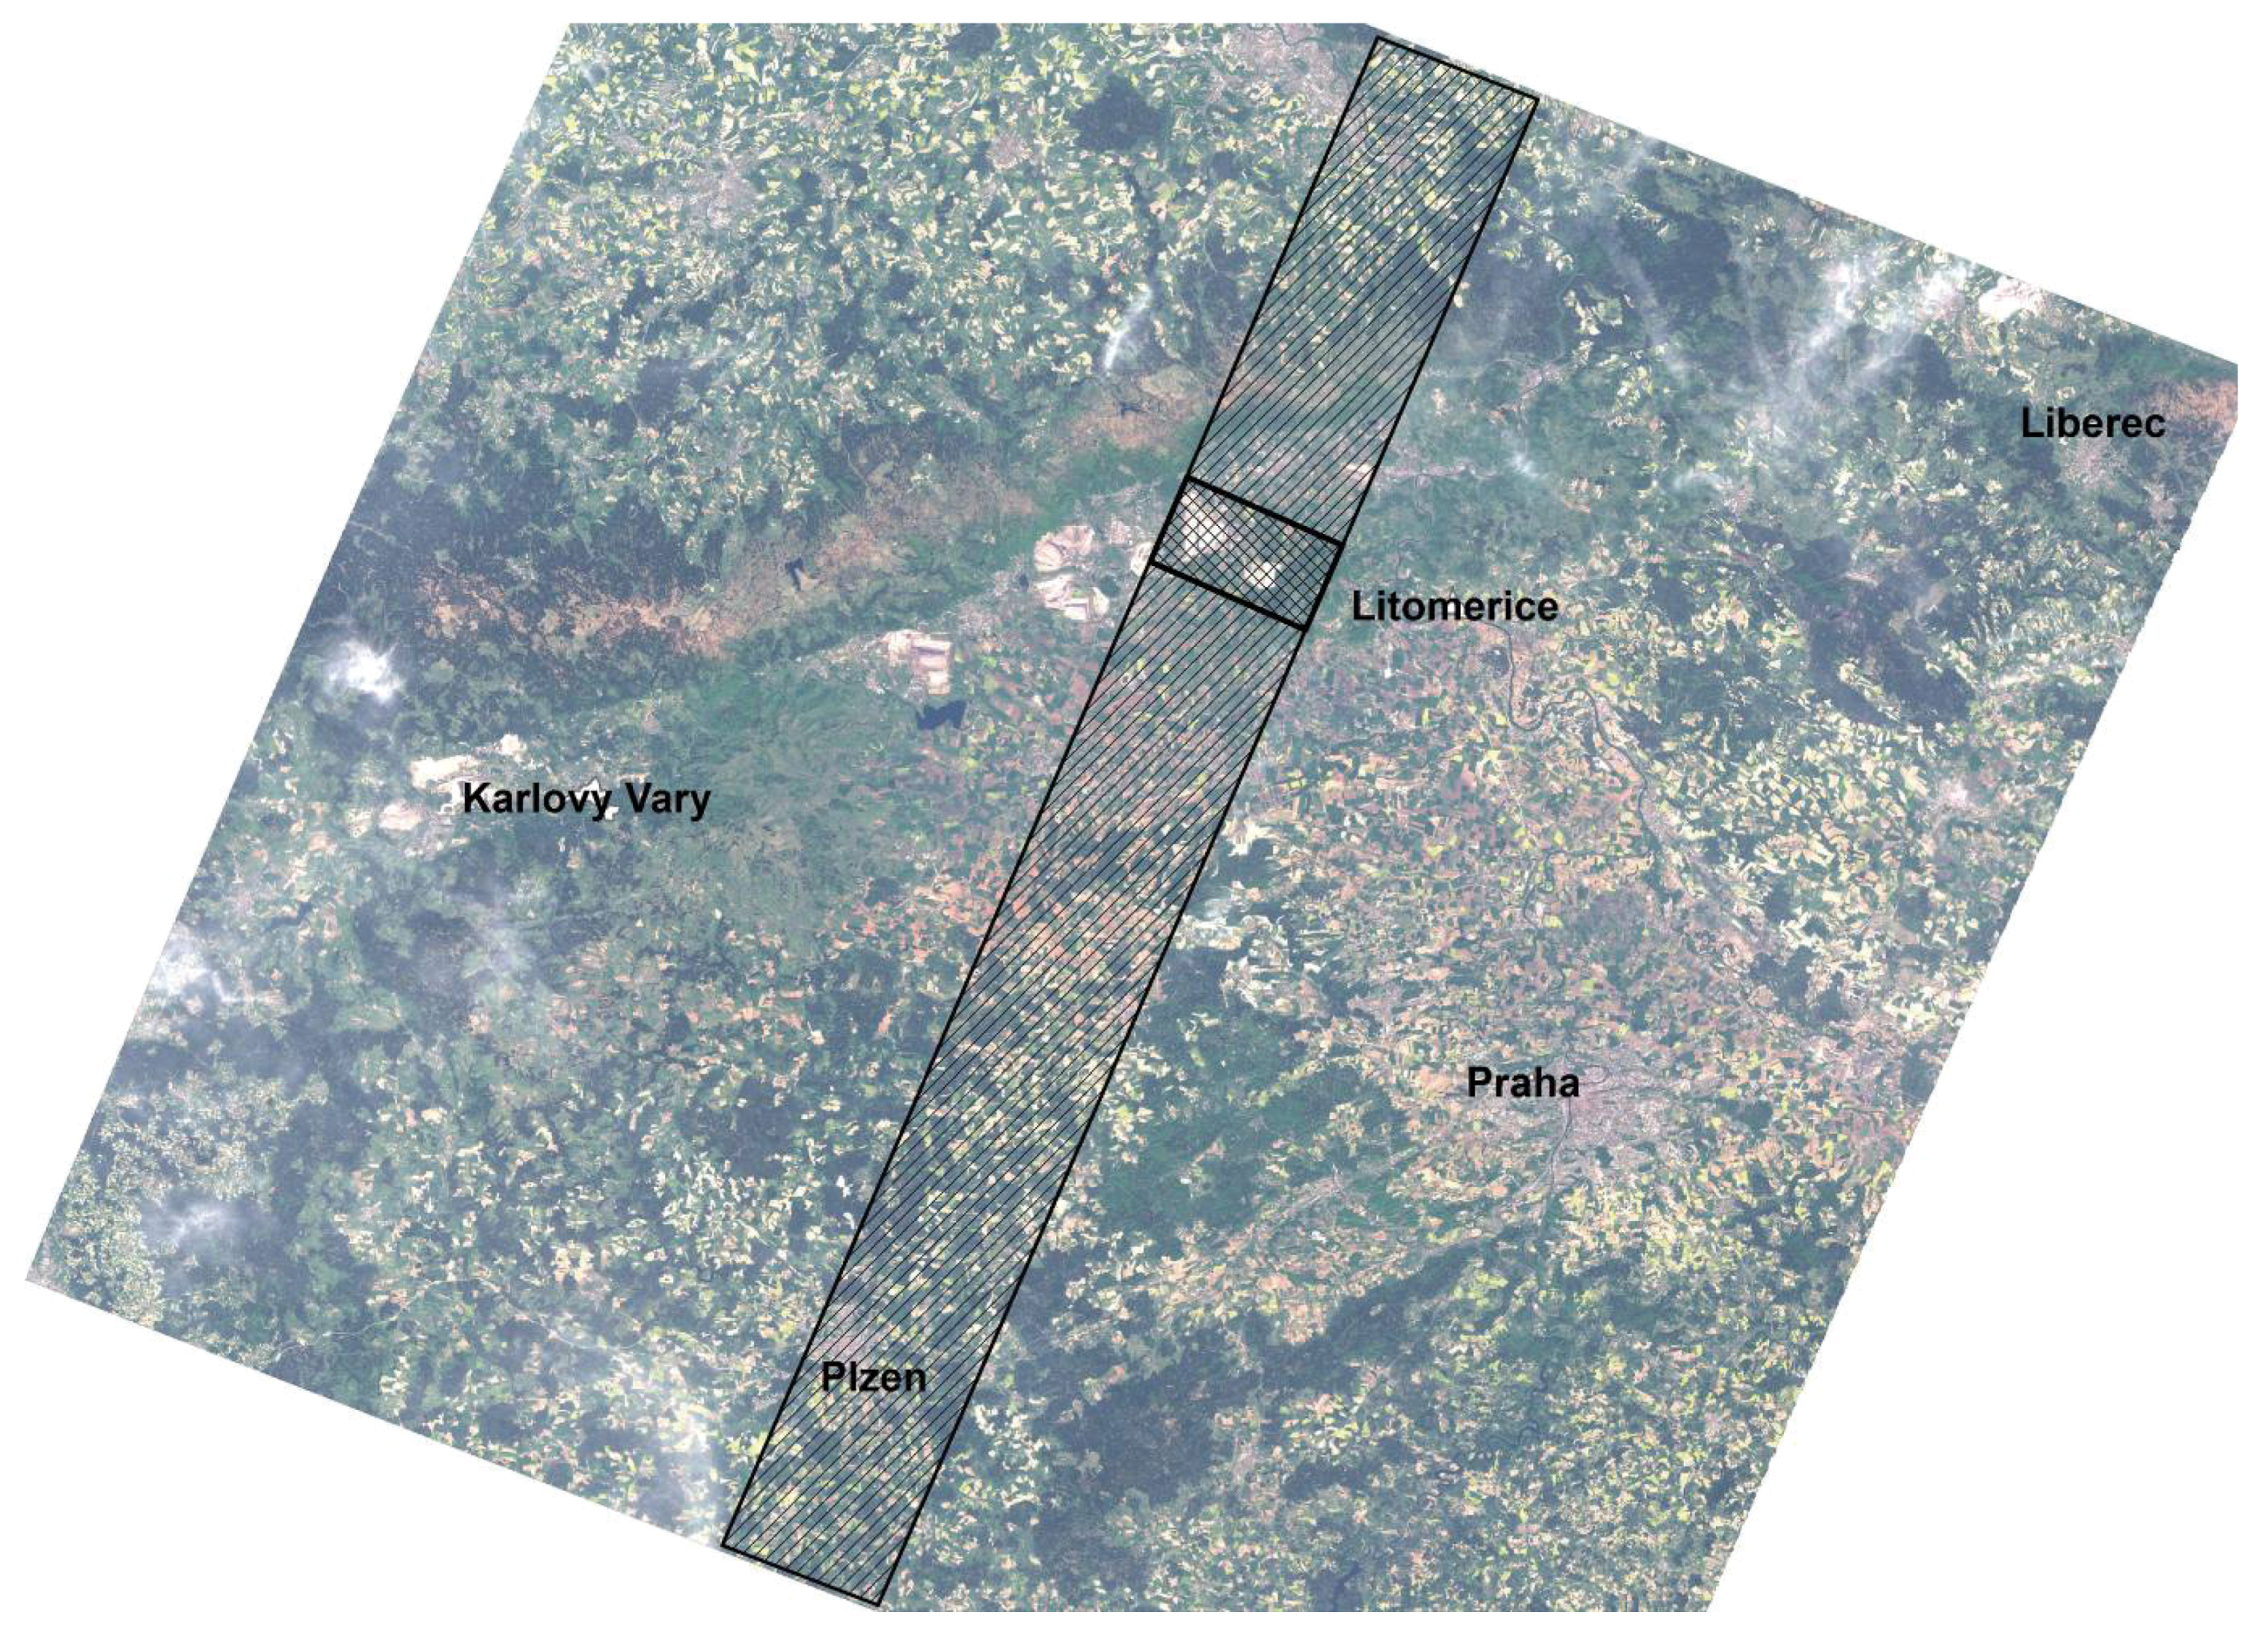
As the Landsat 7 instrument malfunction is most pronounced along the edge of the image and gradually diminishes toward the centre, selected surface mining sites in the central parts of the accessible Landsat 7 ETM+ scenes are not influenced by this imperfection. The selected study area covers approximately 184 km
2 and is located in the north-western part of the Czech Republic close to the German border within the strip that is clipped in the middle part of the Landsat 7 ETM+ scene and covers more than approximately 3,000 km
2,
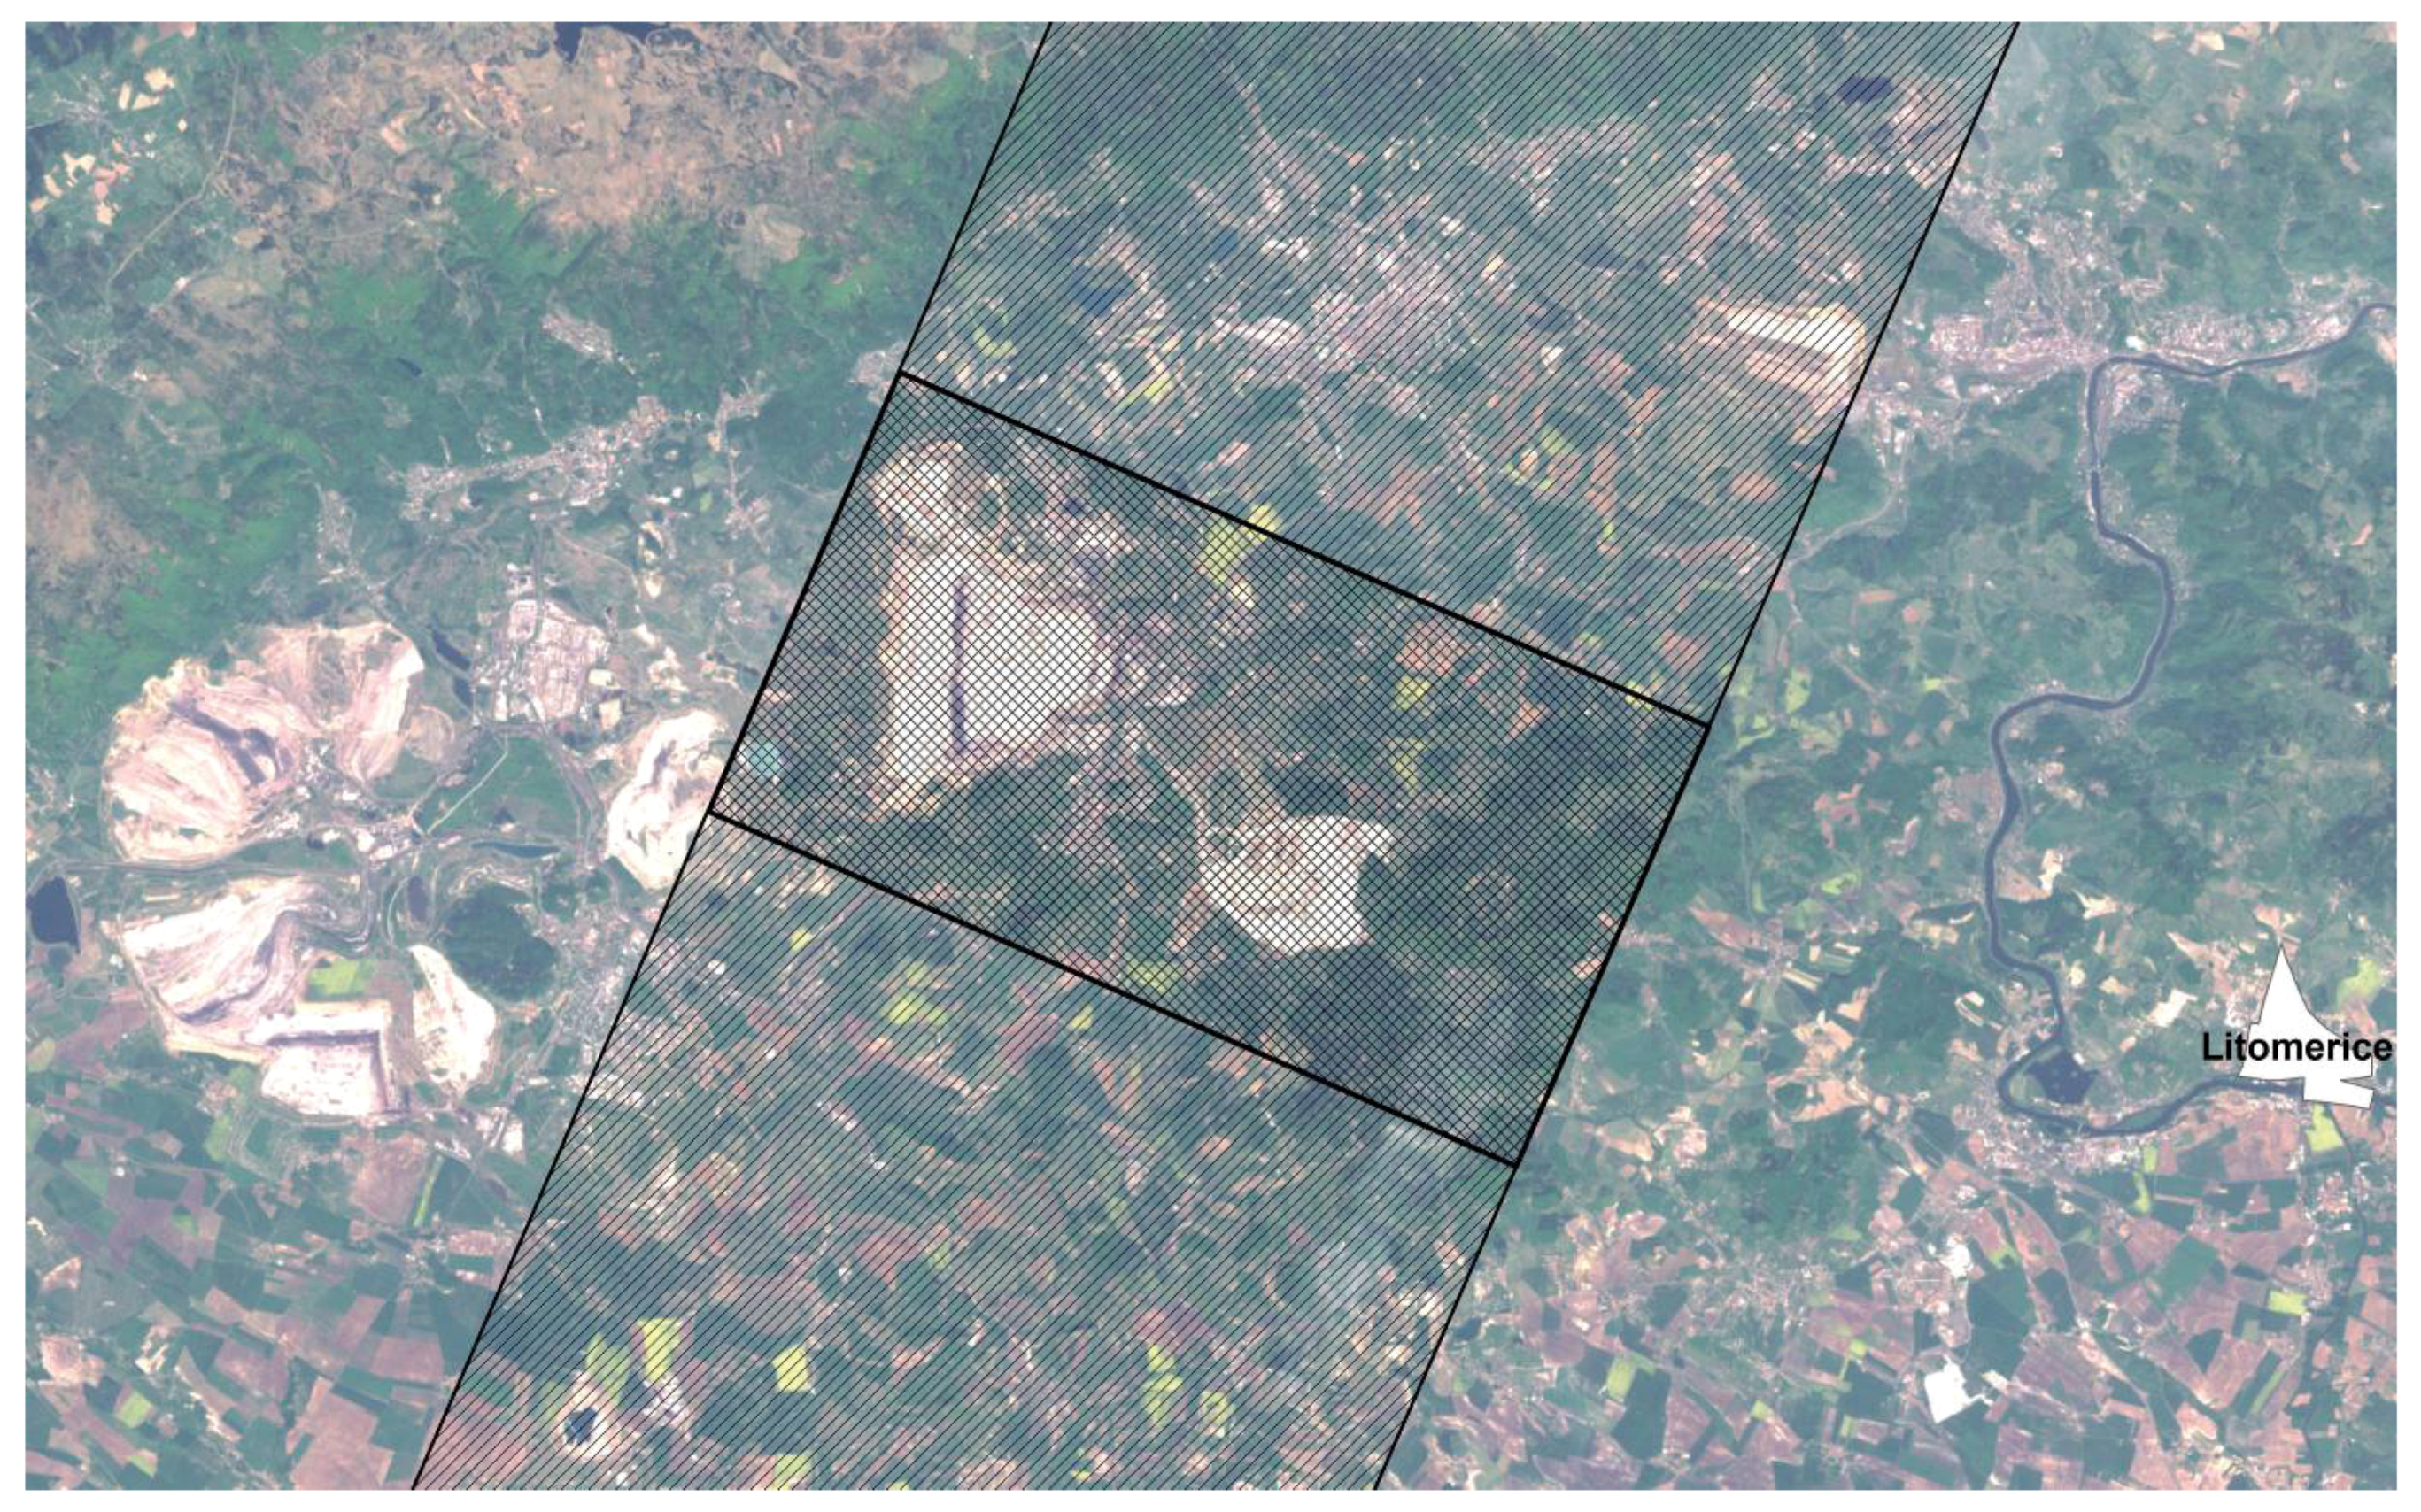
Figure 1. The satellite image in
Figure 2 shows the study area within the central portion. Both the images are based on the Landsat 7 scene from 2000.
Massive surface mining activities have been carried out regularly in the selected area since the early 1970s, playing an important role in power supply for this region of the Czech Republic. Many villages were demolished in order to open new surface mines and dumps. The post-mining sites, regarded as an extremely disturbed area, caused ecological and socioeconomic problems in this area. Thus, environmental remediation has been performed in selected sites since the 1990s. Mining activities are still continuing and new brown coal mining sites are still being opened. On the other hand, many post-mining sites are reserved for nature conservation. In order to provide for regional nature conservation, mining limits have been imposed by the Ministry of the Environment of the Czech Republic. In addition to the national implementation of strategies for sustainable development, the European Council adopted a comprehensive renewed European Union Strategy for Sustainable Development (EU SDS) for enlarged EU that is based on the one adopted in 2001 and resulted from extensive review processes during 2004–2006.
Figure 1.
A study area located in a strip of the Landsat 7 ETM+ scene that is not influenced by the imperfection due to the instrument malfunction on Landsat 7 on May 31, 2003.
Figure 1.
A study area located in a strip of the Landsat 7 ETM+ scene that is not influenced by the imperfection due to the instrument malfunction on Landsat 7 on May 31, 2003.
Figure 2.
A study area within a central portion of the scene in a strip of the Landsat 7 ETM+ image.
Figure 2.
A study area within a central portion of the scene in a strip of the Landsat 7 ETM+ image.
2.3. Spatial and Temporal Approach
An important goal in monitoring land-cover changes is to obtain suitable characteristics that can indicate incremental effects resulting from the combined influences of various land-cover processes. Long-term impacts on the surface can be caused, not only by mining activities, but also by the combined effects of successive natural processes. Thus, the overall estimates of incremental effects by selected characteristics may be significant despite decreased mining. For the monitored surface-mining sites, large-scale surface mining and processing operations in the north-west part of the Czech Republic have significant cumulative effects on the regional ecosystem, which are indicated by the land cover. In addition to large surface mining interventions, potential mining impacts on vegetation were formerly caused by acidification of soils and leaf exposure. The long-term combined effects of soil acidification and vegetation exposure to inorganic compounds are not sufficiently explained in order to predict their effects on land cover. To provide the spatio-temporal analysis based on satellite images from Landsat 5 TM and Landsat 7 ETM+, appropriate characteristics have to be selected for detection of land-cover changes. Of the many indices and indicators derived directly from multispectral images, vegetation indices, widely used in remote sensing, offer approximate estimates of growth conditions for vegetation that is damaged by surface mining. Consecutively, approximate changes in croplands as a result of large-scale mining and the associated impact of food security can be derived from the selected time-series Landsat images.
2.4. Vegetation Index NDVI
Multispectral vegetation indices are represented by algebraic combination of remotely sensed spectral bands that can indicate the state of the vegetation cover, such as leaf density and distribution, leaf water content, age, mineral deficiencies, anthropogenic activities and parasitic attacks [
13,
14]. For the state of the vegetation, the different sensitivity of the mentioned electromagnetic spectra can be used to estimate the amount of green biomass dependent on the chlorophyll content, and canopy water stress.
A widely known index, the normalized difference vegetation index (NDVI), is used to detect the land-cover changes. NDVI is based on surface reflectance in the near-infrared, and the red bands. It is created by calculating the ratio on a pixel-by-pixel basis:
where ρ
n and ρ
r represent the reflectance of the near-infrared and red bands, respectively. The resulting index value of a pixel typically ranges from around 0.1 to 0.6 for vegetation [
13].
The described vegetation index can be extended by other indices and computation methods [
15,
16], but more data are mostly needed in order to test the results and to provide interpretations. Thus, in case of the limited archive data sources, NDVI has been selected as an example of a widely known index that can be compared with the results of other similar studies.
2.5. The GIS Approach
Geographic information systems (GISs) can provide a spatial framework to support spatio-temporal analysis of Landsat data. The GIS geoprocessing tools permit analysis of the information based on vegetation indices and other spatial data. They deal with a framework of data transformation that takes input datasets, performs an operation on those input datasets, and returns the results as an output dataset. All the datasets are included together with processing operations in data models that are managed by GIS. In the last few years, major software systems have been developed for implementation of advanced processing tools in object data models [
17].
3. Results and Discussion
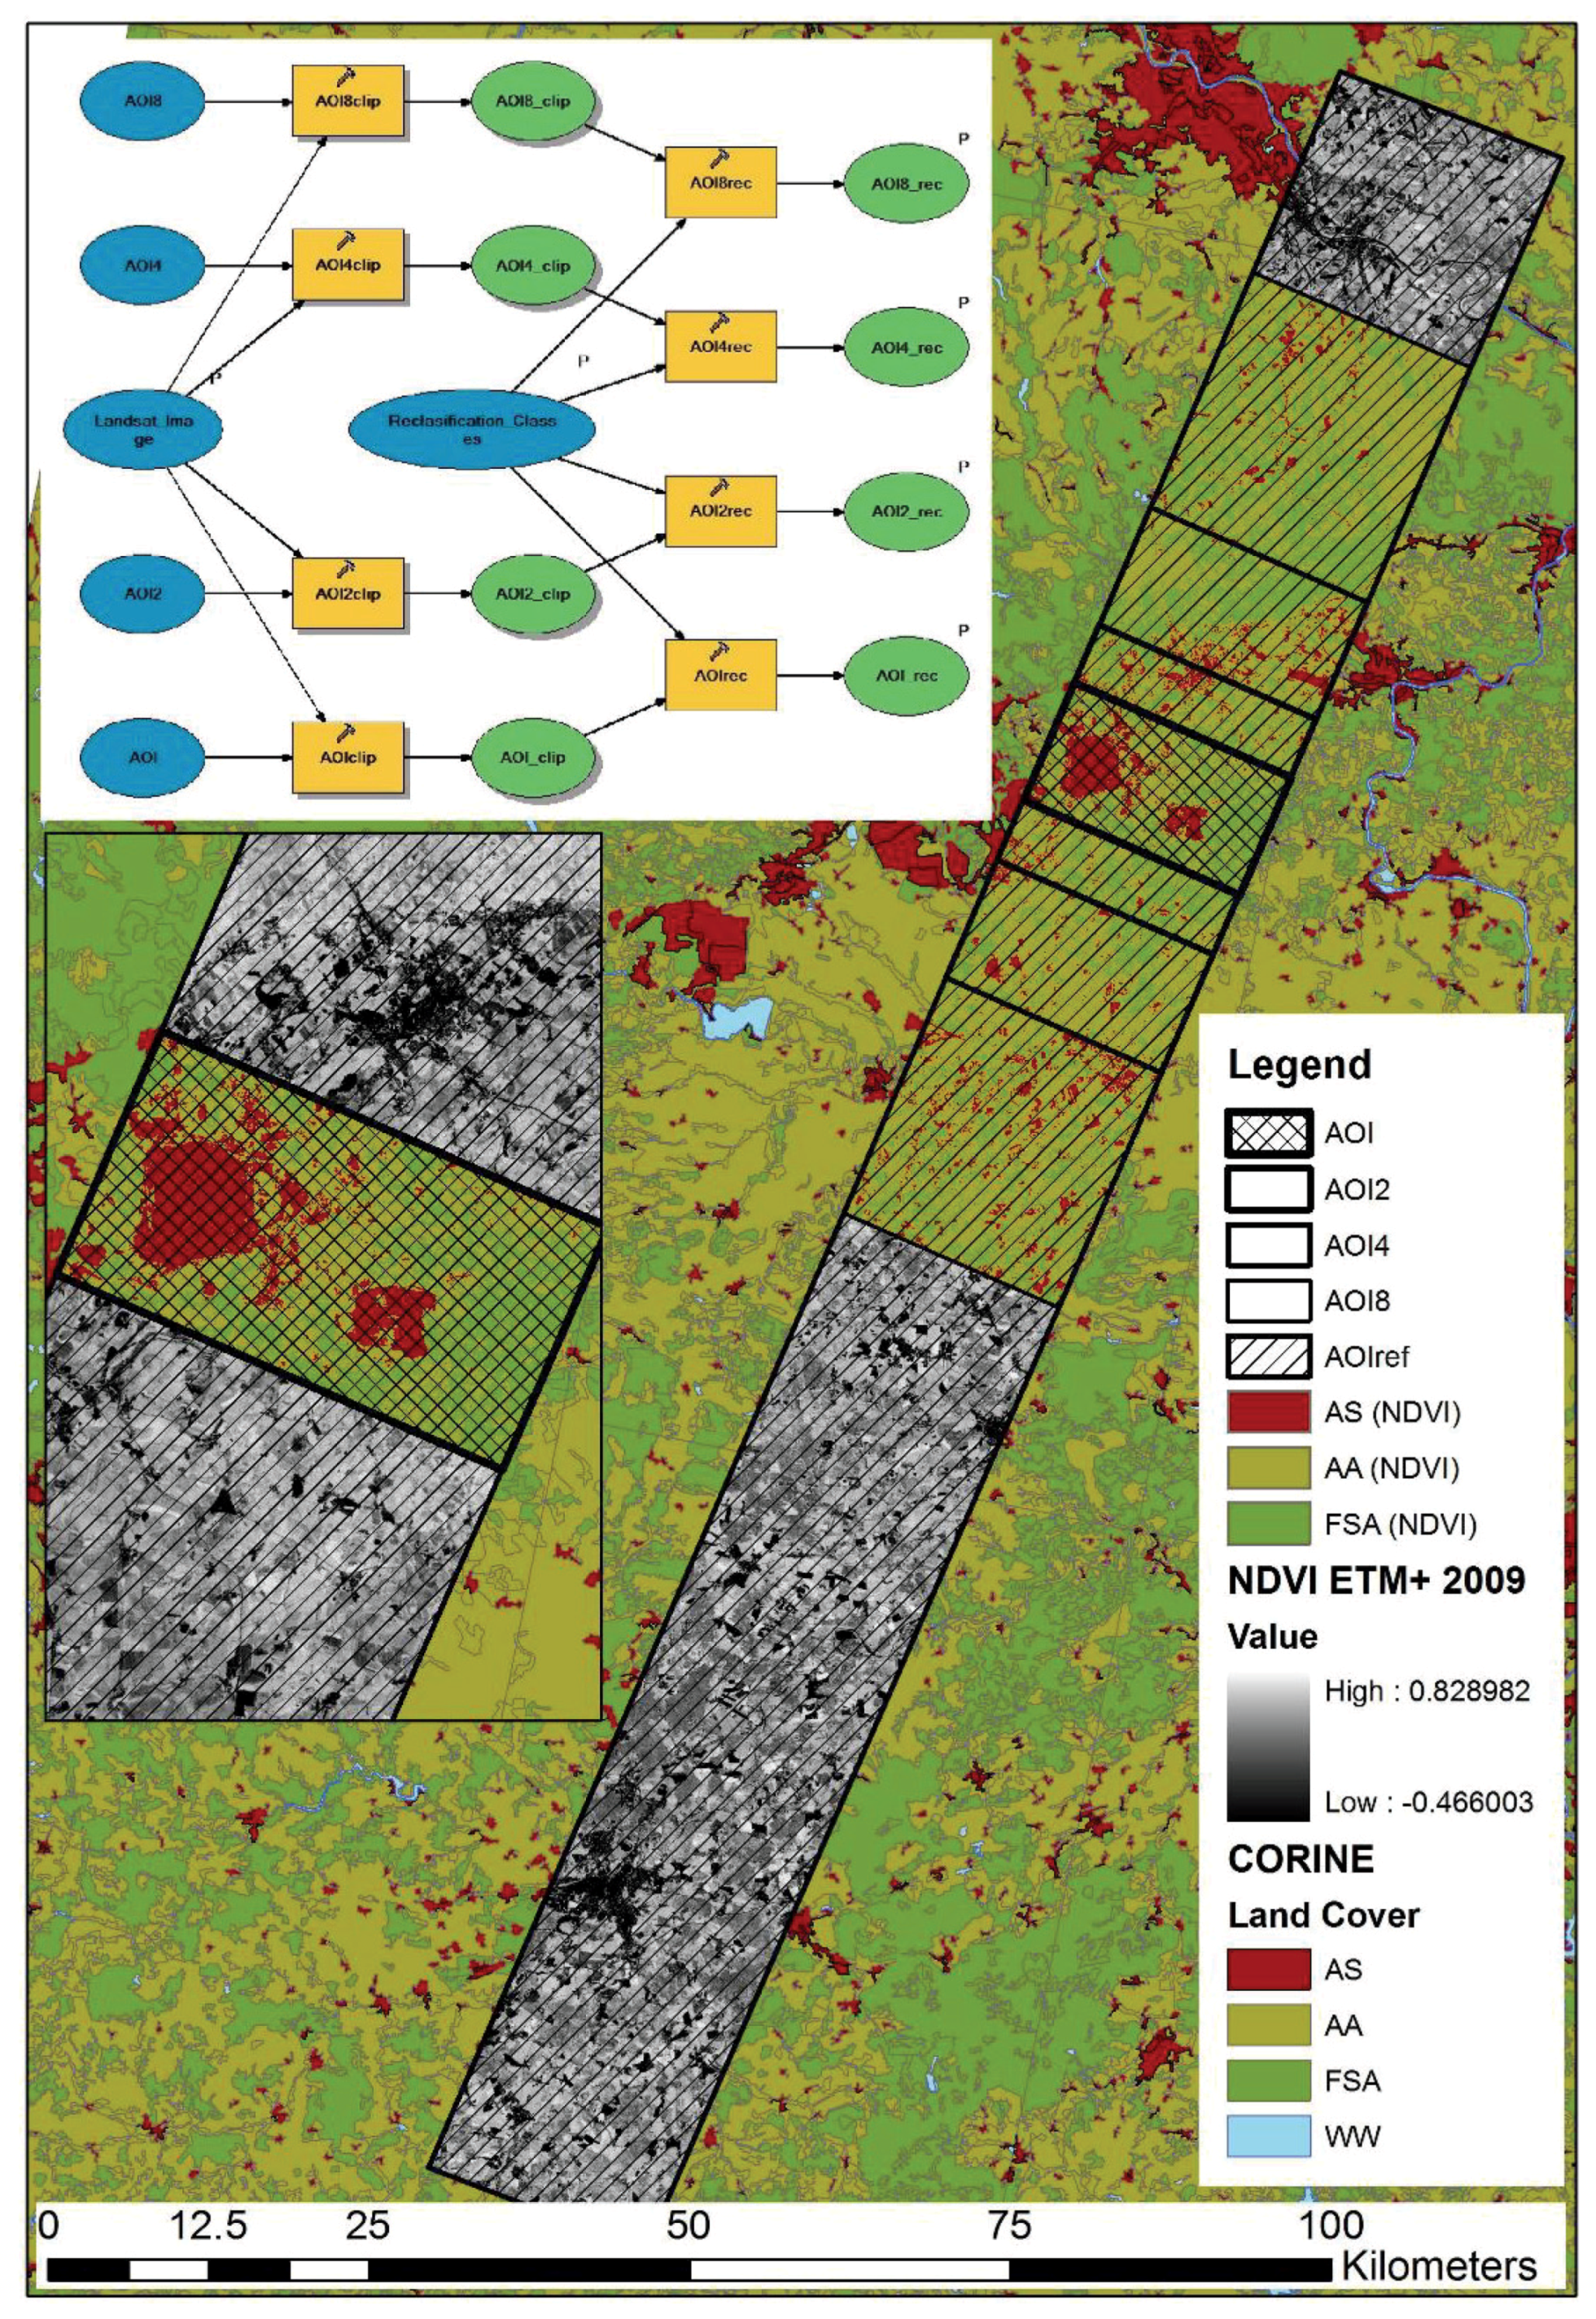
The Landsat images represented by NDVI layers are clipped by a few areas of interest (AOIs), as illustrated in
Figure 3. The output values are reclassified into classes that indicate the quantity, and activity of vegetation. In order to make the time series images comparable, the CORINE Land Cover 2000 data [
1] are used to estimate basic land-cover classes according to NDVI levels. In this case, the classes are represented by three main types: artificial surfaces (AS), agricultural areas (AA), and forest-seminatural areas (FSA). While the large areas show high stability of land-cover classes, the local sites influenced by mining activities indicate high disturbances of land-cover classes. Thus, the same NDVI class levels based on quantiles in 2000 are used for a whole strip and AOIs in the middle part of each Landsat image are used to estimate NDVI levels in other years. Then the relative changes of NDVI levels in the local sites are interpreted as changes in basic land-cover classes.
Figure 3.
A few areas of interest, AOIs, selected for exploration of land-cover classes in a Landsat strip, AS: artificial surfaces, AA: agricultural areas, FSA: forest-seminatural areas, WW: wetlands-water bodies.
Figure 3.
A few areas of interest, AOIs, selected for exploration of land-cover classes in a Landsat strip, AS: artificial surfaces, AA: agricultural areas, FSA: forest-seminatural areas, WW: wetlands-water bodies.
AOI2, AOI4, and AOI8 are approximately twice, four-times, and eight-times the size of the original AOI, respectively. AOIref represents the whole strip of the Landsat scene. Each Landsat image (captured in 1985, 1988, 1990, 2000, 2002, 2003, 2004, 2005, 2006, 2007, 2008, and 2009) was clipped by these AOIs. Thus, 60 images (12 × 5 AOIs) are used for NDVI processing and land-cover class estimates. The relative size for each land-cover class (AS, AA, FSA) is dependent on AOI (AOI, AOI2, AOI4, and AOI8) and the year (1985, 1988, 1990, 2000, 2002, 2003, 2004, 2005, 2006, 2007, 2008, and 2009) based on the NDVI level is given in
Table 1.
Table 1.
Rates of the NDVI classes in the areas of interest AOI, AOI2, AOI4 and AOI8.
Table 1.
Rates of the NDVI classes in the areas of interest AOI, AOI2, AOI4 and AOI8.
| Land cover classes | AOI | AOI2 | AOI4 | AOI8 | AOIref |
|---|
| 2000 | AS | 0.26 | 0.19 | 0.15 | 0.10 | 0.09 |
| CORINE | AA | 0.39 | 0.51 | 0.55 | 0.60 | 0.61 |
| | FSA | 0.35 | 0.30 | 0.30 | 0.30 | 0.30 |
| 1985 | AS | 0.12 | 0.08 | 0.06 | 0.05 | 0.09 |
| | AA | 0.46 | 0.48 | 0.52 | 0.54 | 0.61 |
| | FSA | 0.42 | 0.43 | 0.41 | 0.41 | 0.30 |
| 1988 | AS | 0.24 | 0.19 | 0.16 | 0.11 | 0.09 |
| | AA | 0.55 | 0.63 | 0.67 | 0.66 | 0.61 |
| | FSA | 0.21 | 0.18 | 0.17 | 0.23 | 0.30 |
| 1990 | AS | 0.23 | 0.18 | 0.16 | 0.09 | 0.09 |
| | AA | 0.55 | 0.54 | 0.52 | 0.52 | 0.61 |
| | FSA | 0.22 | 0.28 | 0.32 | 0.39 | 0.30 |
| 2002 | AS | 0.14 | 0.10 | 0.09 | 0.08 | 0.09 |
| | AA | 0.49 | 0.55 | 0.57 | 0.56 | 0.61 |
| | FSA | 0.36 | 0.35 | 0.34 | 0.37 | 0.30 |
| 2003 | AS | 0.12 | 0.09 | 0.07 | 0.07 | 0.09 |
| | AA | 0.58 | 0.62 | 0.64 | 0.64 | 0.61 |
| | FSA | 0.30 | 0.29 | 0.29 | 0.29 | 0.30 |
| 2004 | AS | 0.13 | 0.10 | 0.09 | 0.08 | 0.09 |
| | AA | 0.59 | 0.63 | 0.62 | 0.59 | 0.61 |
| | FSA | 0.28 | 0.28 | 0.29 | 0.33 | 0.30 |
| 2005 | AS | 0.11 | 0.08 | 0.07 | 0.06 | 0.09 |
| | AA | 0.52 | 0.56 | 0.59 | 0.59 | 0.61 |
| | FSA | 0.37 | 0.36 | 0.34 | 0.35 | 0.30 |
| 2006 | AS | 0.19 | 0.12 | 0.09 | 0.09 | 0.09 |
| | AA | 0.51 | 0.56 | 0.57 | 0.56 | 0.61 |
| | FSA | 0.30 | 0.32 | 0.34 | 0.35 | 0.30 |
| 2007 | AS | 0.11 | 0.08 | 0.08 | 0.08 | 0.09 |
| | AA | 0.45 | 0.50 | 0.53 | 0.55 | 0.61 |
| | FSA | 0.44 | 0.42 | 0.39 | 0.37 | 0.30 |
| 2008 | AS | 0.13 | 0.09 | 0.11 | 0.09 | 0.09 |
| | AA | 0.49 | 0.55 | 0.55 | 0.54 | 0.61 |
| | FSA | 0.38 | 0.36 | 0.35 | 0.36 | 0.30 |
| 2009 | AS | 0.21 | 0.15 | 0.11 | 0.09 | 0.09 |
| | AA | 0.47 | 0.52 | 0.57 | 0.59 | 0.61 |
| | FSA | 0.32 | 0.34 | 0.32 | 0.32 | 0.30 |
The classes range from areas containing bare soil and man-made objects (mining sites and disrupted neighbor sites, heavy industrial zones, and agricultural reclaimed sites) to areas with dense vegetation (permanent crops, pastures, heterogeneous agricultural sites), and forests (mostly coniferous and mixed forests). Wetlands and water bodies are not included in the final estimates due to their negligible effects in the selected areas in the Czech Republic. The proportion of the land-cover class AS decreases as the size of the AOIs increases. It also corresponds with the national land-use records in the Czech Republic that show decreasing mining and industrial activities far away from the selected original AOI. The land-cover changes in the AS also indicate mining activities that include opening of new mining sites and remediation of old mining areas in the initial stage. A number of remediation projects have been started since the 1990s. Other more complex remediation activities are performed in the framework of EU projects. Thus, many processes affect vegetation in the selected AOIs. However, since 1989, political and economic changes started transformation processes that led to changes in farming, which affected vegetation structure and consequently land cover.
Based on NDVI classes and the size of the AOI and year of observation, other objectives can be brought forward in order to explore changes in croplands as a result of large-scale mining and the associated impact of food security.
3.1. Objective A: How Much Cropland Has Changed to Other Land Use as a Result of Large Scale Mining from 1985 to 2009?
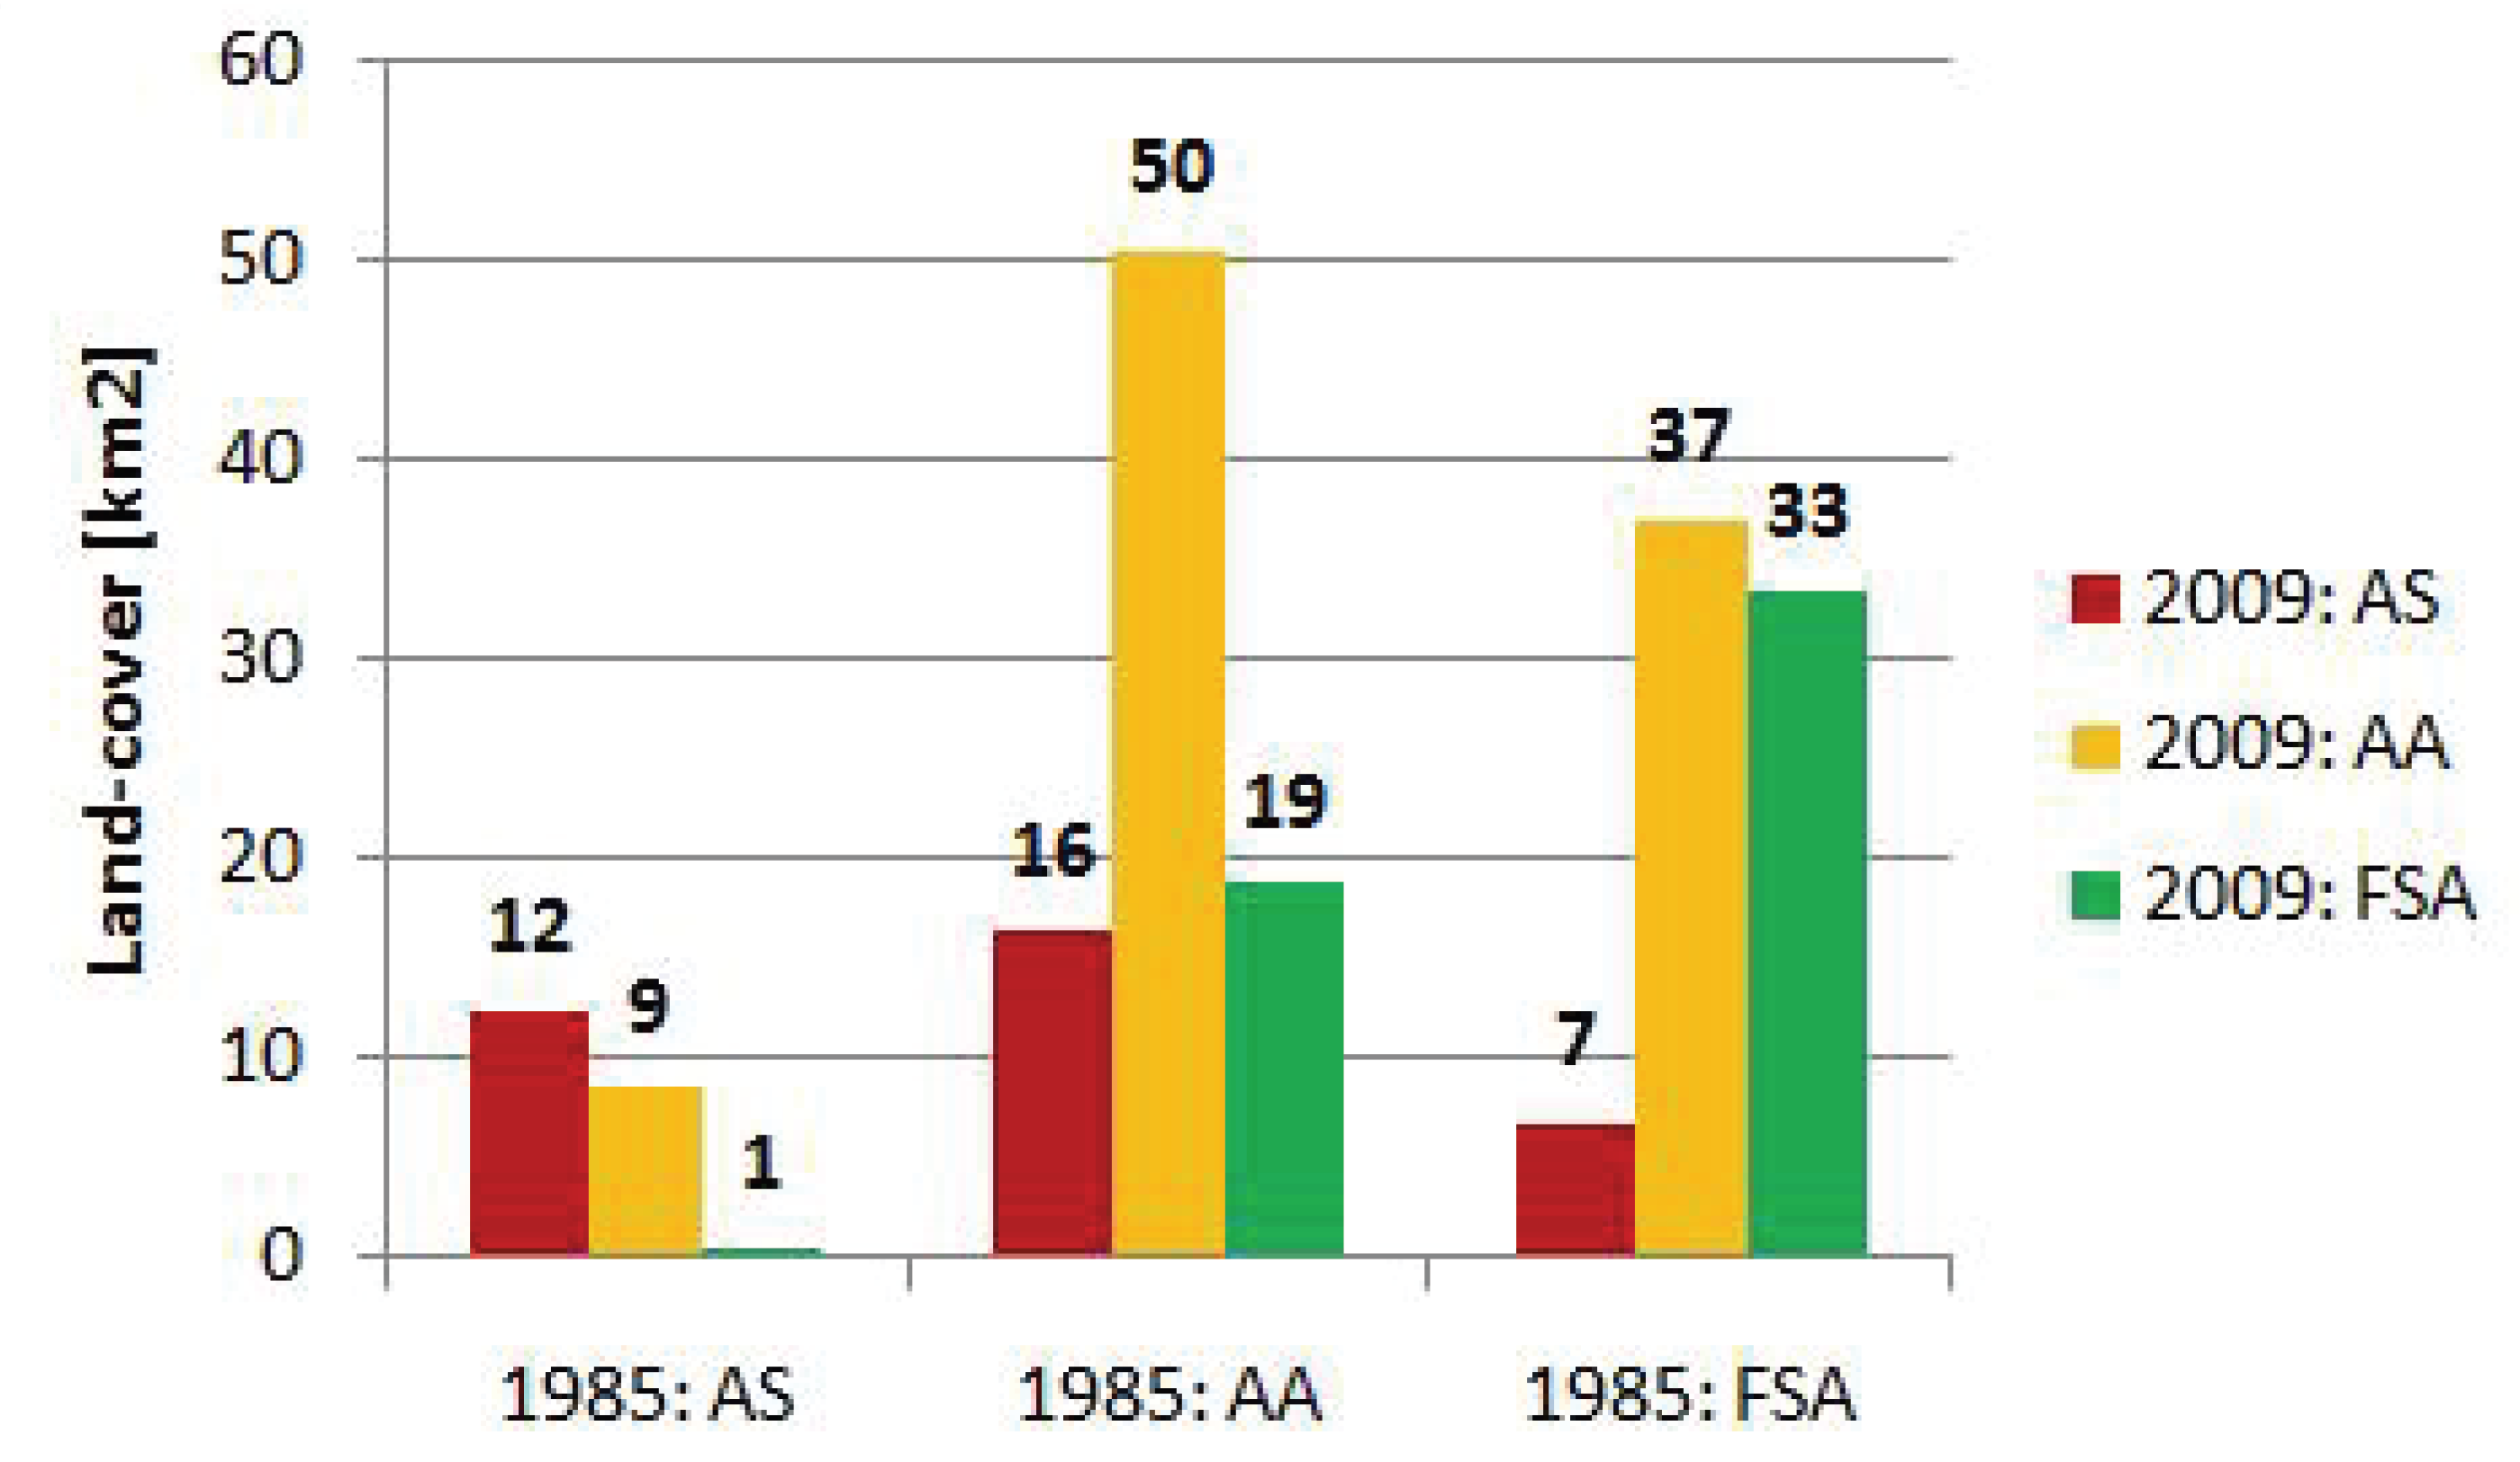
Processing of the thematic land-cover classes derived from NDVI classes for AA, AS, and FSA resulted in cropland changes represented by the AA in
Figure 4. The AA retained during the whole 1985–2009 period covered 50 km
2. An AA of 16 km
2 was converted to artificial surfaces and an area of 19 km
2 was converted to FSA, which can correspond to the remediation of surface mines and dumps. On the other hand, some of the AA were transformed to AS (9 km
2), and to FSA. Conversion of land-cover classes at the sites of large-scale mining (184 km
2) is illustrated in
Figure 5. It depicts the expansion of surface mines into neighboring areas at the expense of AA and FSA. However, many sites exhibit the opposite processes, which can indicate successful remediation procedures.
Figure 4.
Land-cover changes in AOI as a result of large-scale mining 1985–2009 (km2).
Figure 4.
Land-cover changes in AOI as a result of large-scale mining 1985–2009 (km2).
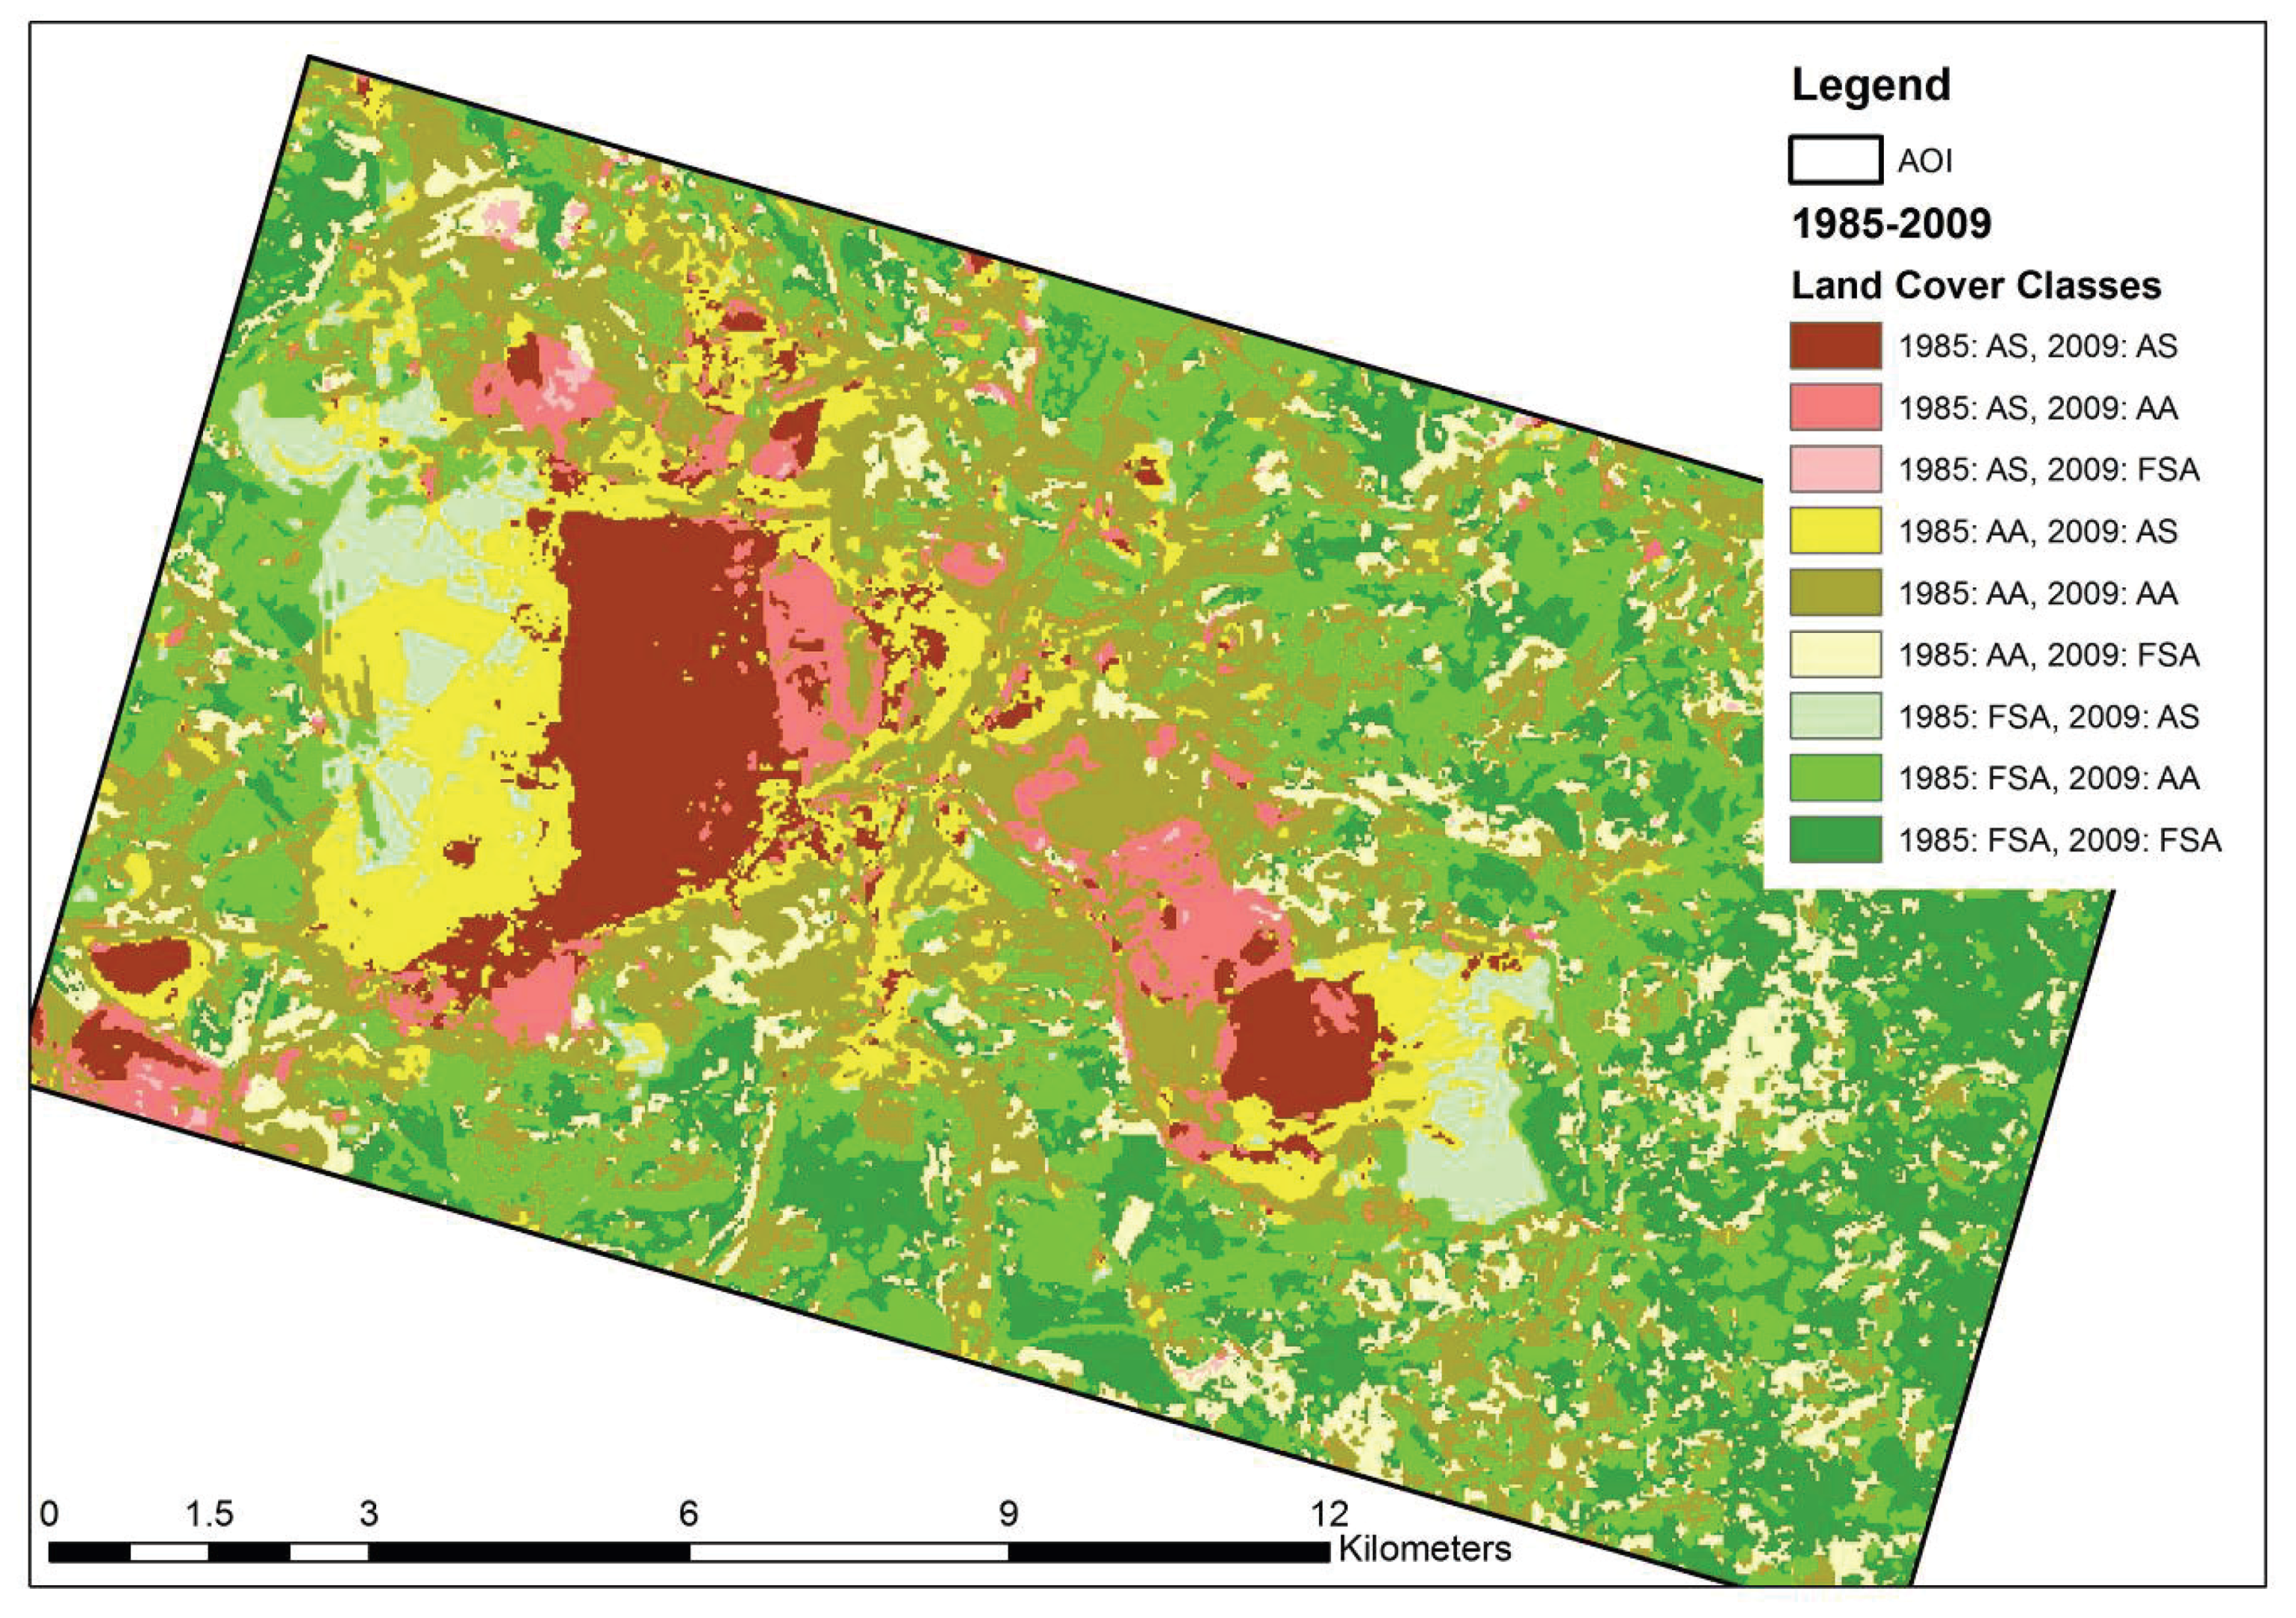
Figure 5.
Land-cover changes in the AOI as a result of large-scale mining from 1985 to 2009.
Figure 5.
Land-cover changes in the AOI as a result of large-scale mining from 1985 to 2009.
3.2. What Changes in Terms of Crop Area, Crop Type, and Cropping Patterns Are Observed over Time?
Spatio-temporal processing of the land cover classes derived from NDVI classes resulted in successive changes, as outlined in
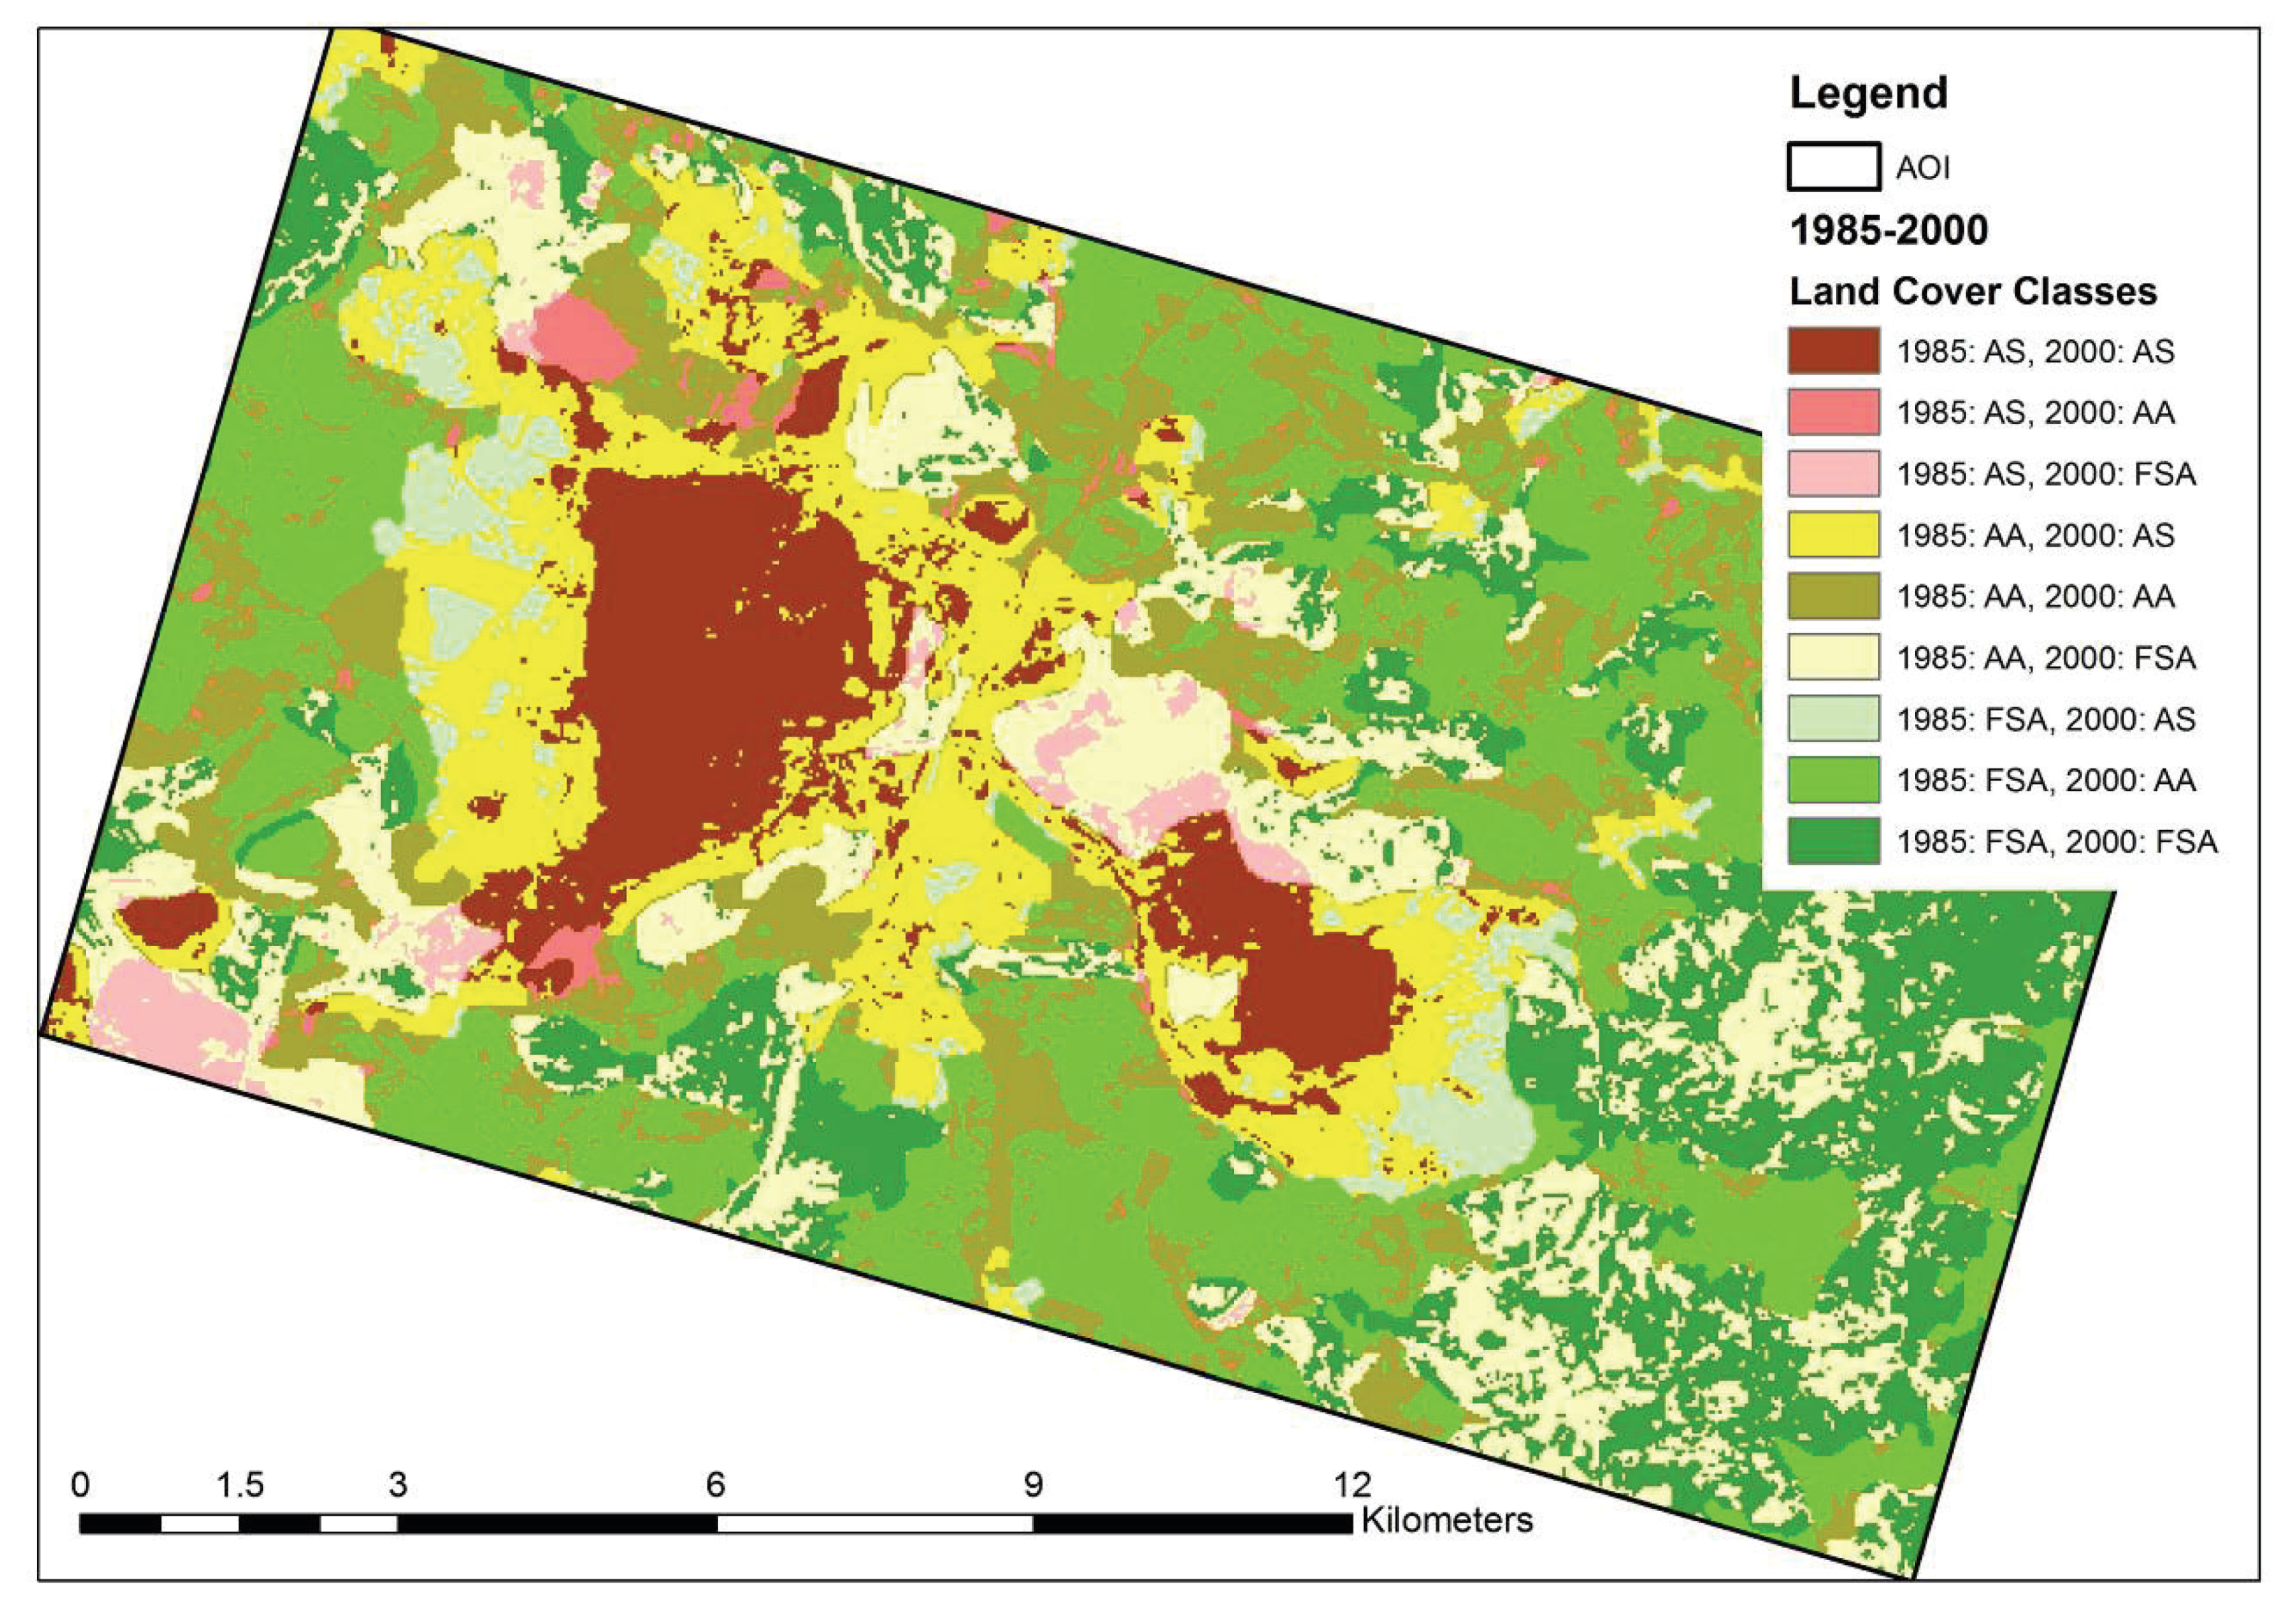
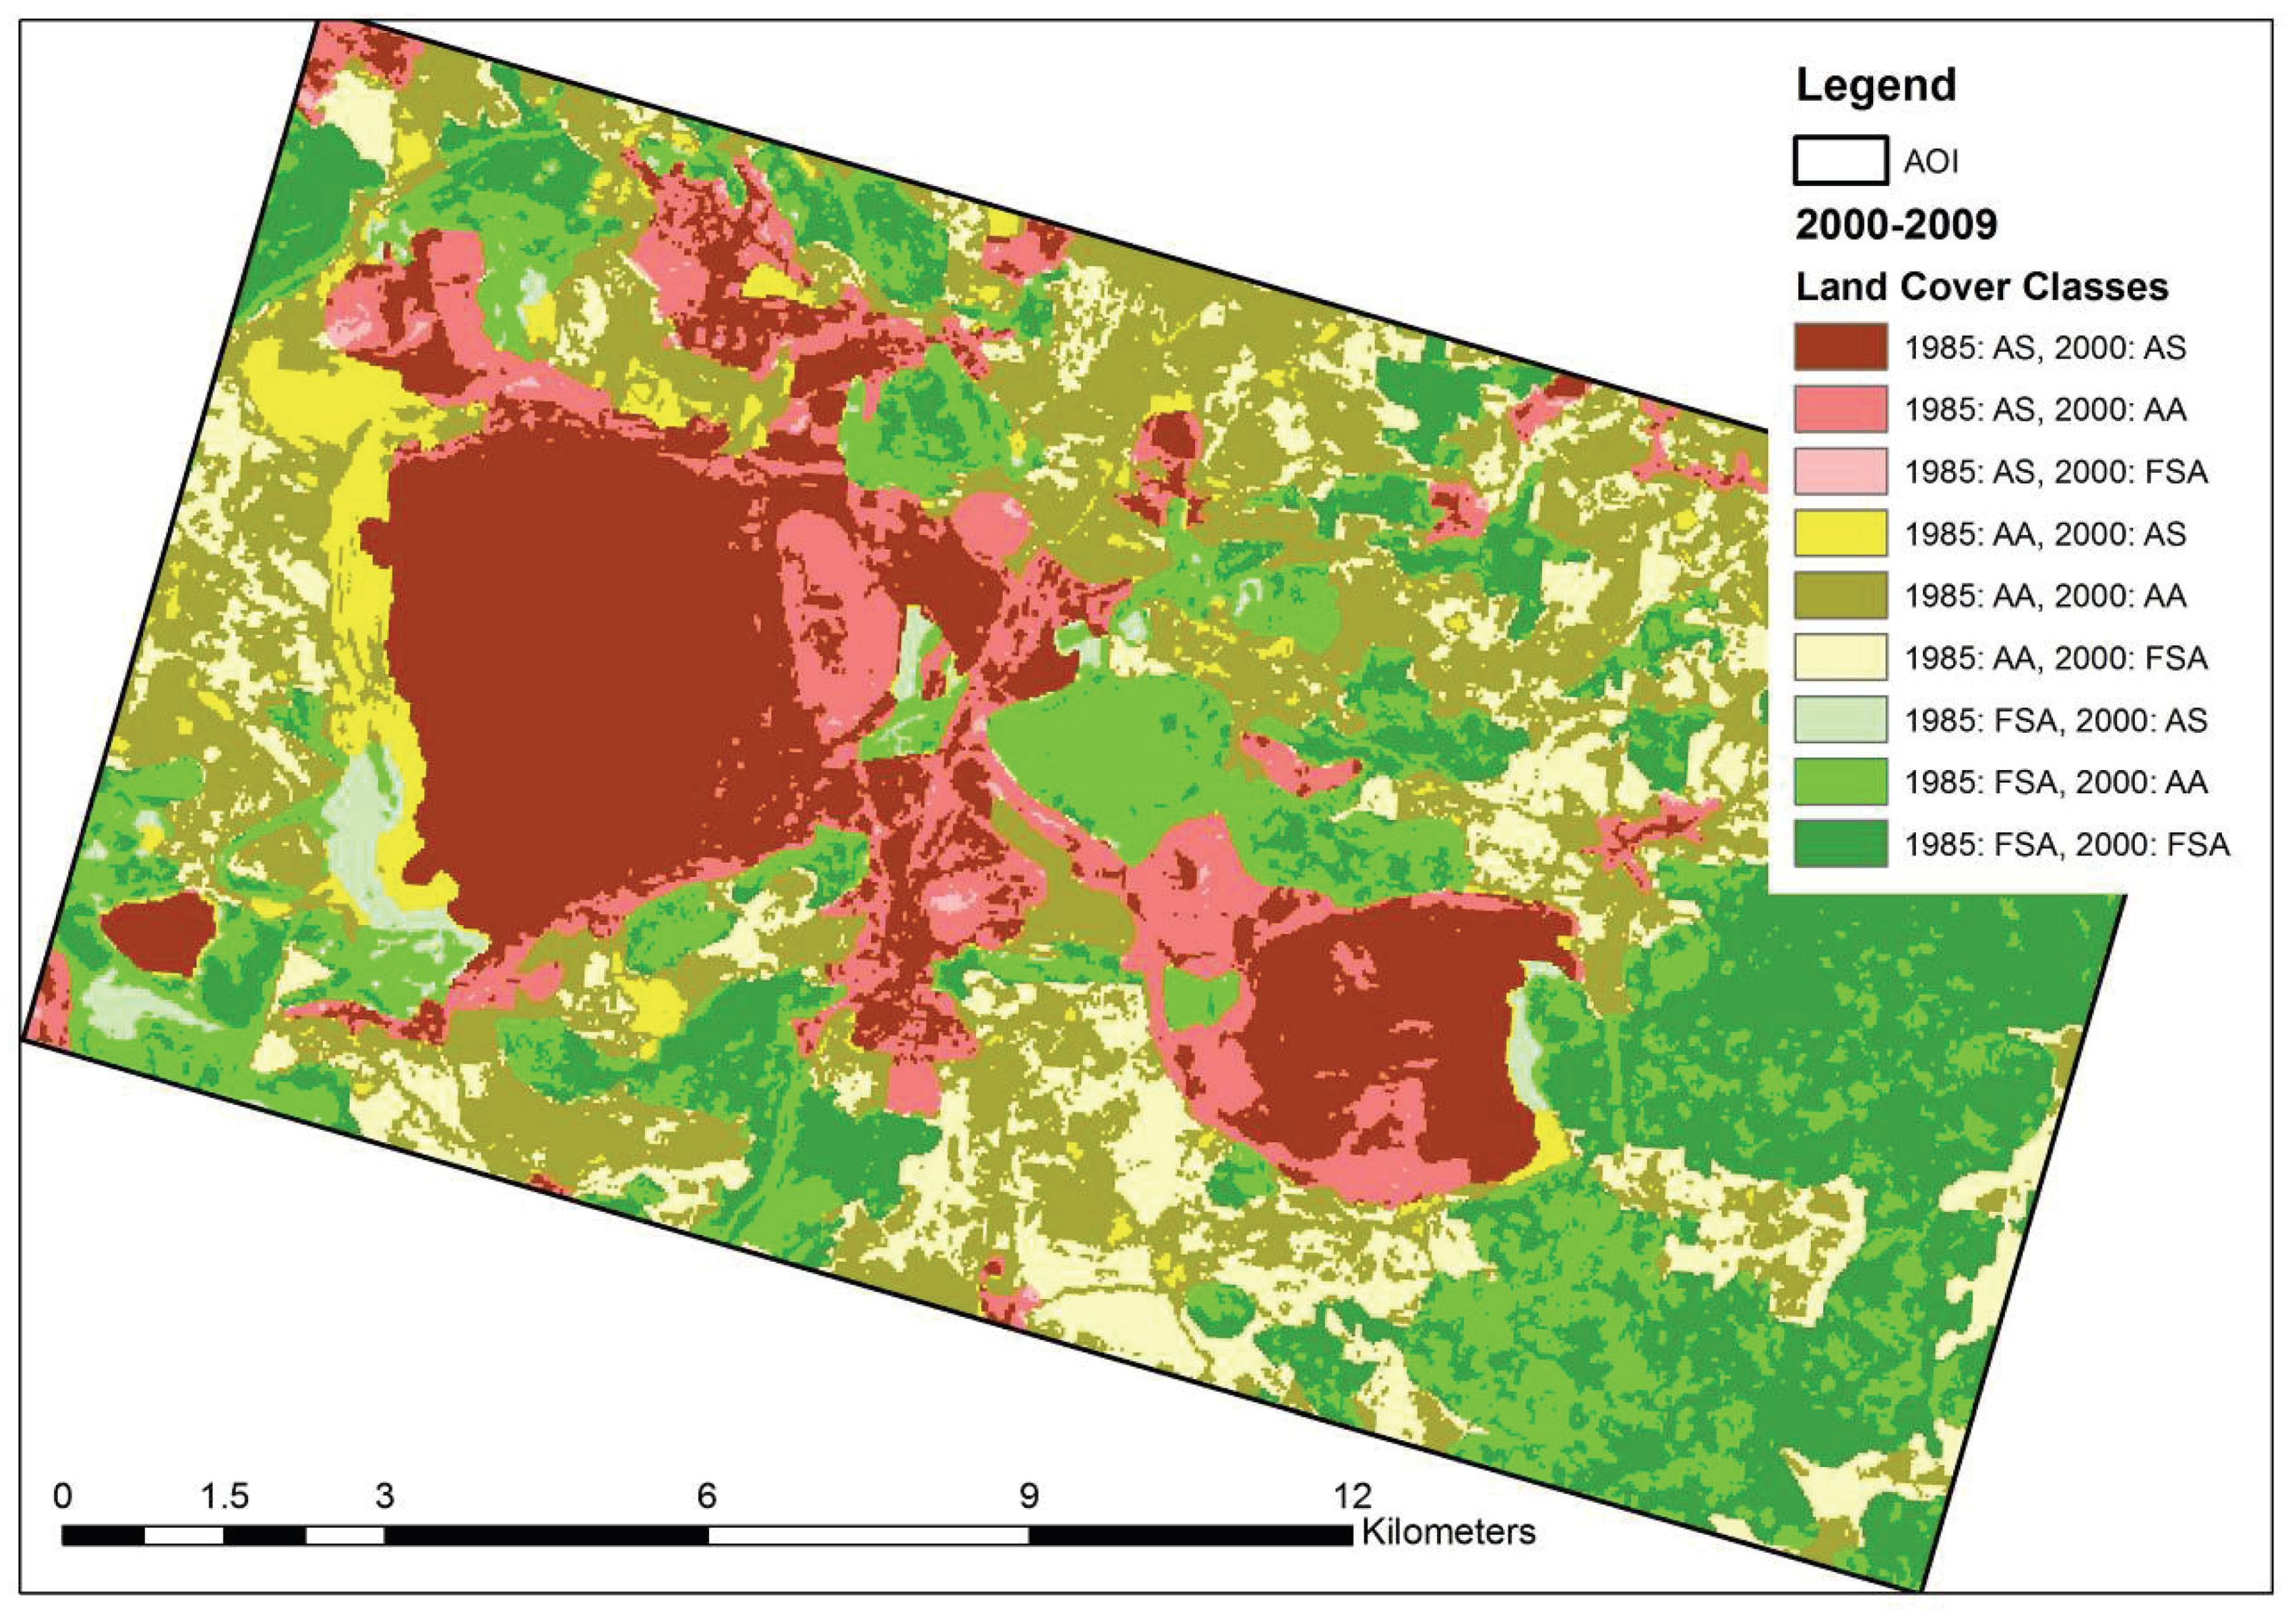
Table 2. The changes in terms of cropped areas are presented for each local period bounded by the captured Landsat data in 1985, 1988, 1990, 2000, 2002, 2003, 2004, 2005, 2006, 2007, 2008, and 2009. In order to explore patterns of agriculture areas and other areas based on CORINE Land Cover 2000 data, land cover changes in the AOI as a result of large scale mining 1985–2000 and 2000–2009 are in
Figure 6 and in
Figure 7.
Table 2.
Local land-cover changes in the AOI over time in the period 1985–2009 (km2).
Table 2.
Local land-cover changes in the AOI over time in the period 1985–2009 (km2).
| AOI: km2 | 1985–1988 | 1988–1990 | 1990–2000 | 2000–2002 | 2002–2003 | 2003–2004 | 2004–2005 | 2005–2006 | 2006–2007 | 2007–2008 | 2008–2009 |
|---|
| AS to AS | 18 | 30 | 27 | 19 | 15 | 15 | 18 | 19 | 18 | 17 | 19 |
| AS to AA | 3 | 11 | 5 | 22 | 11 | 6 | 5 | 1 | 14 | 3 | 4 |
| AS to FSA | 0 | 2 | 7 | 1 | 0 | 0 | 1 | 1 | 2 | 0 | 1 |
| AA to AS | 17 | 10 | 15 | 4 | 7 | 8 | 3 | 14 | 1 | 6 | 19 |
| AA to AA | 58 | 72 | 39 | 45 | 76 | 88 | 86 | 70 | 60 | 72 | 60 |
| AA to FSA | 11 | 20 | 40 | 17 | 8 | 11 | 19 | 11 | 33 | 5 | 11 |
| FSA to AS | 4 | 3 | 2 | 1 | 1 | 0 | 0 | 2 | 1 | 1 | 0 |
| FSA to AA | 48 | 19 | 22 | 16 | 19 | 14 | 4 | 22 | 9 | 15 | 23 |
| FSA to FSA | 24 | 17 | 13 | 42 | 47 | 41 | 48 | 43 | 46 | 66 | 47 |
Figure 6.
Land-cover changes in the AOI as a result of large-scale mining from 1985 to 2000.
Figure 6.
Land-cover changes in the AOI as a result of large-scale mining from 1985 to 2000.
Figure 7.
Land-cover changes in the AOI as a result of large-scale mining from 2000 to 2009.
Figure 7.
Land-cover changes in the AOI as a result of large-scale mining from 2000 to 2009.
3.3. Objective C: How Have Issues A and B Impacted Food Security?
Both the aspects explored in the framework of objective A and objective B show that large-scale mining significantly influenced food security in the selected region bounded by the AOI. The Landsat images covered only a part of the whole period, because massive surface-mining activities have been carried out regularly since the early 1970s. However, during the observed period, the AA and FSA continuously decreased, causing other ecological and socioeconomic problems in this area. Although environmental remediation has been performed in selected sites since the 1990s, the region is losing its food self-sufficiency. Consequently, major support in terms of food security will be required, because it is anticipated that surface coal mines will still play an important role in power supply for the neighboring regions in the Czech Republic.
3.4. Objective D: How Have the Areas Changed in Comparison with Larger Areas of Interest?
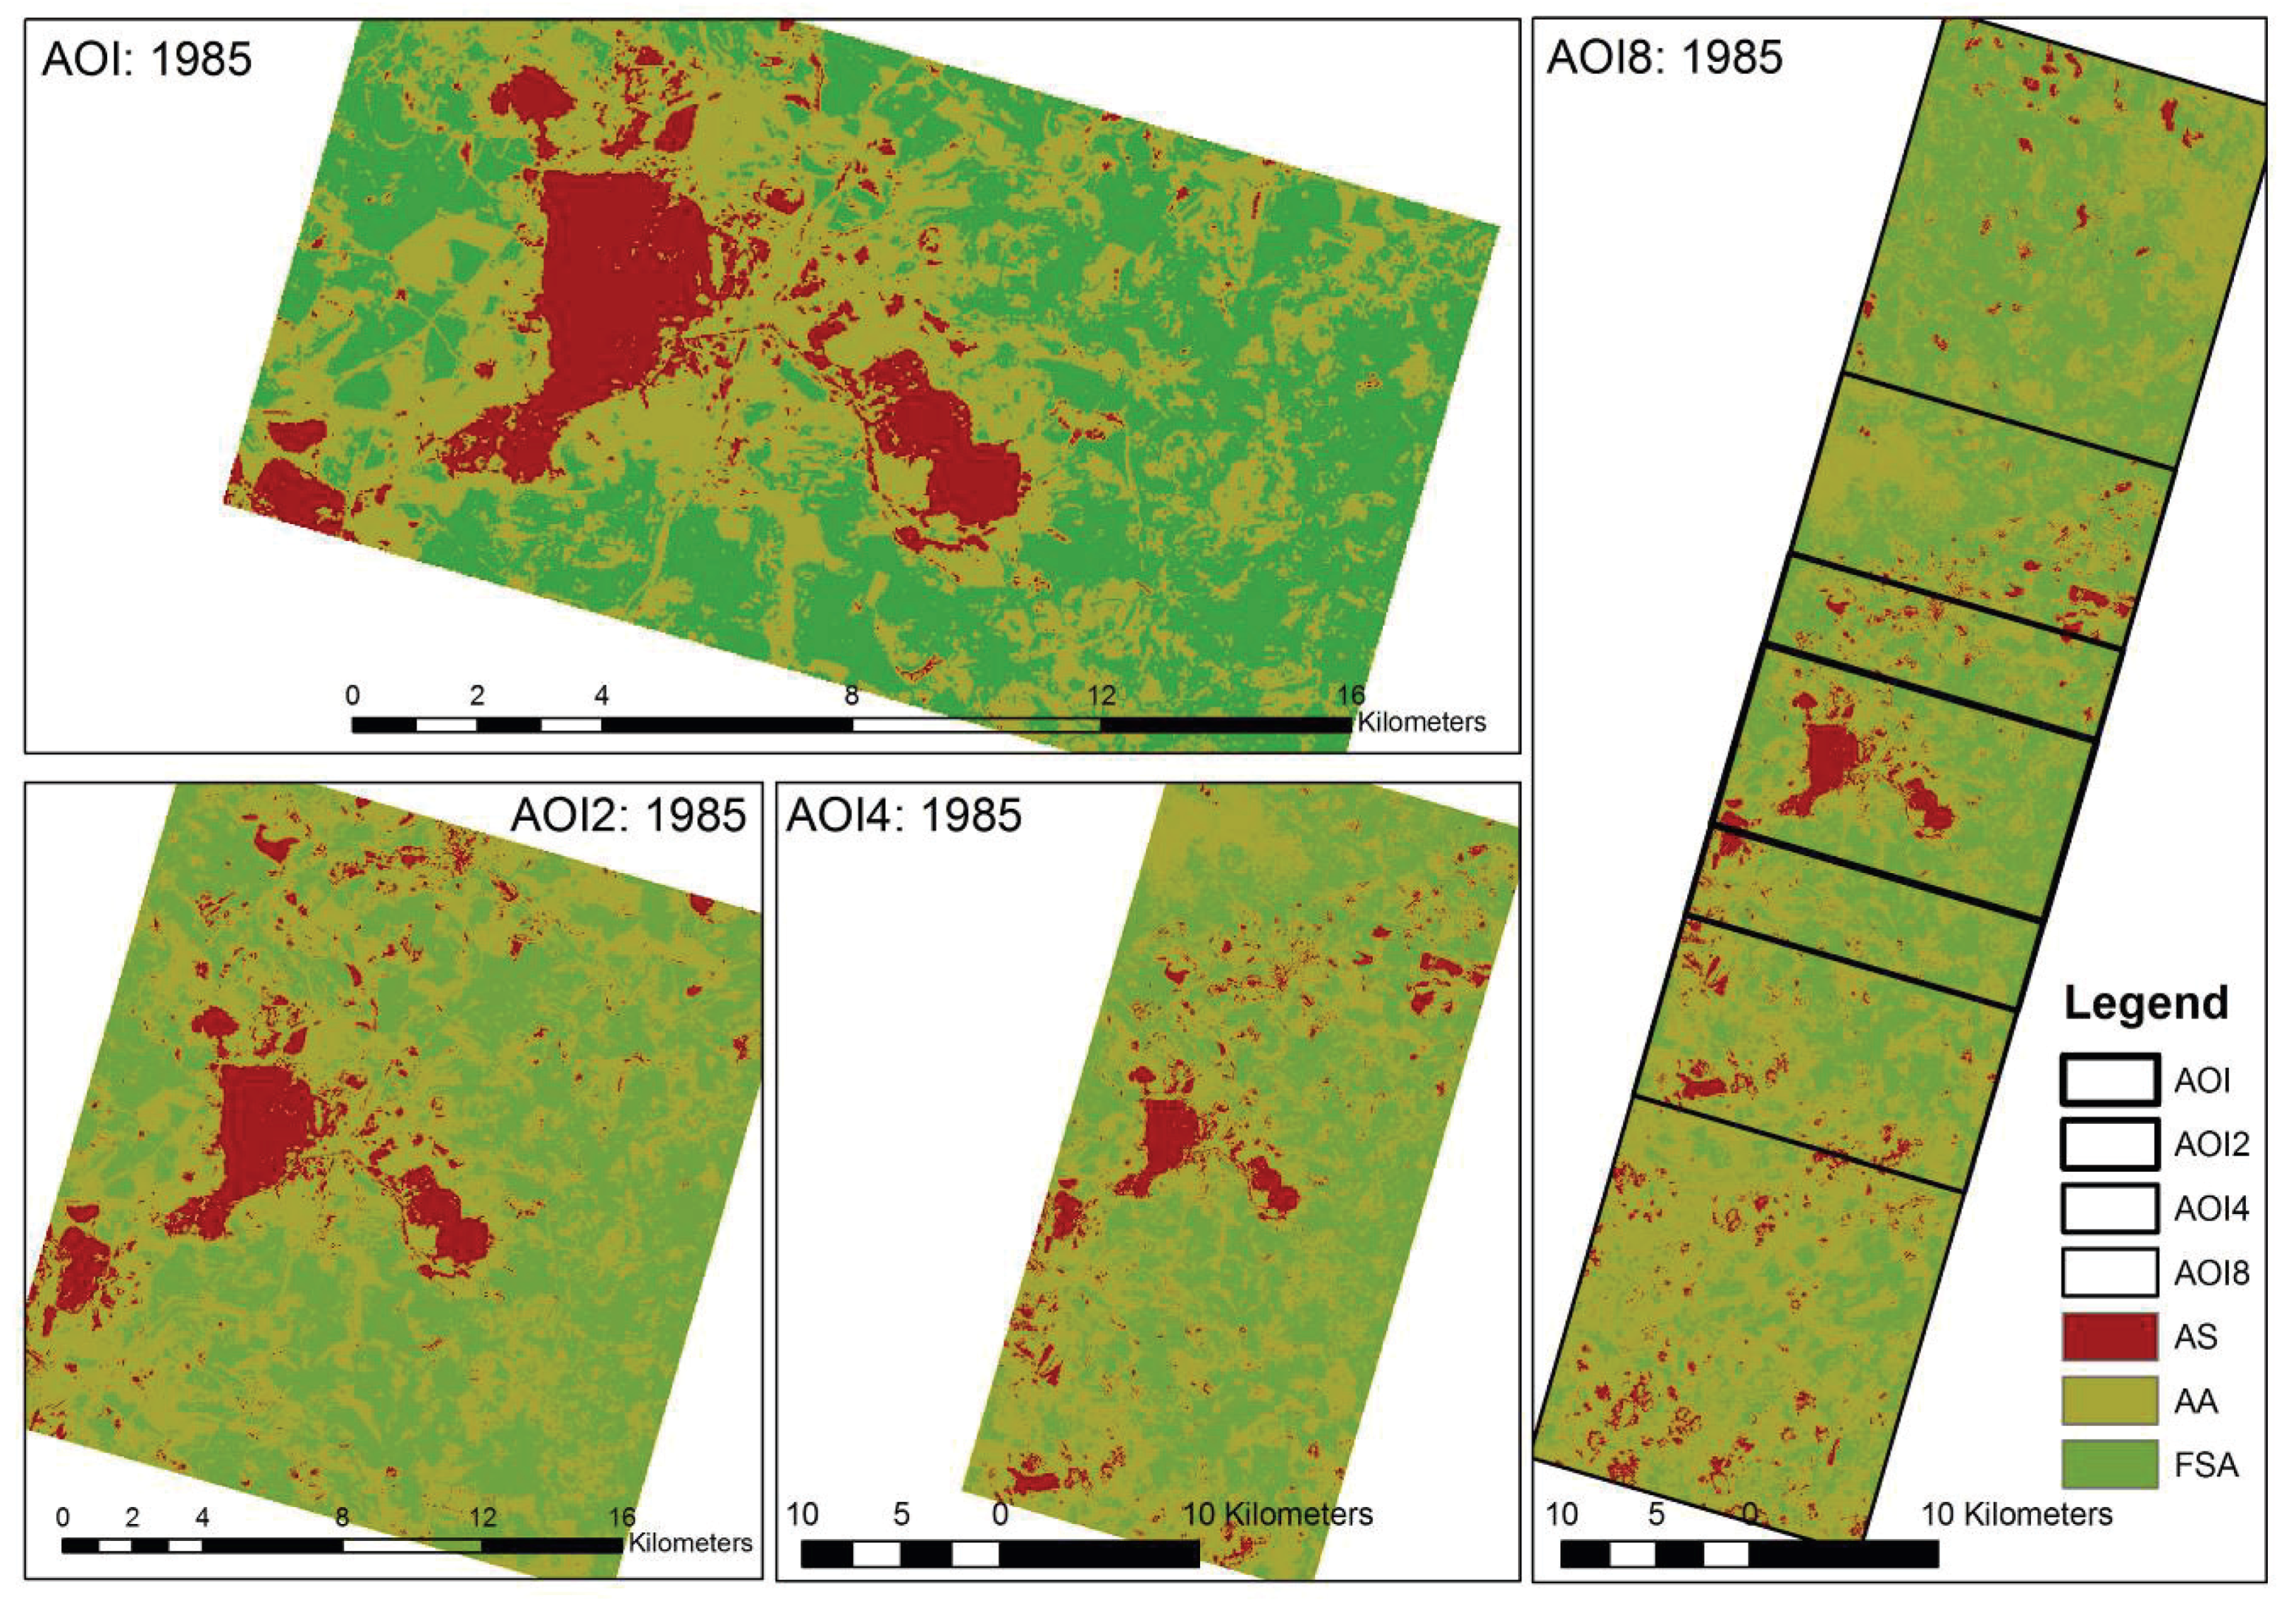
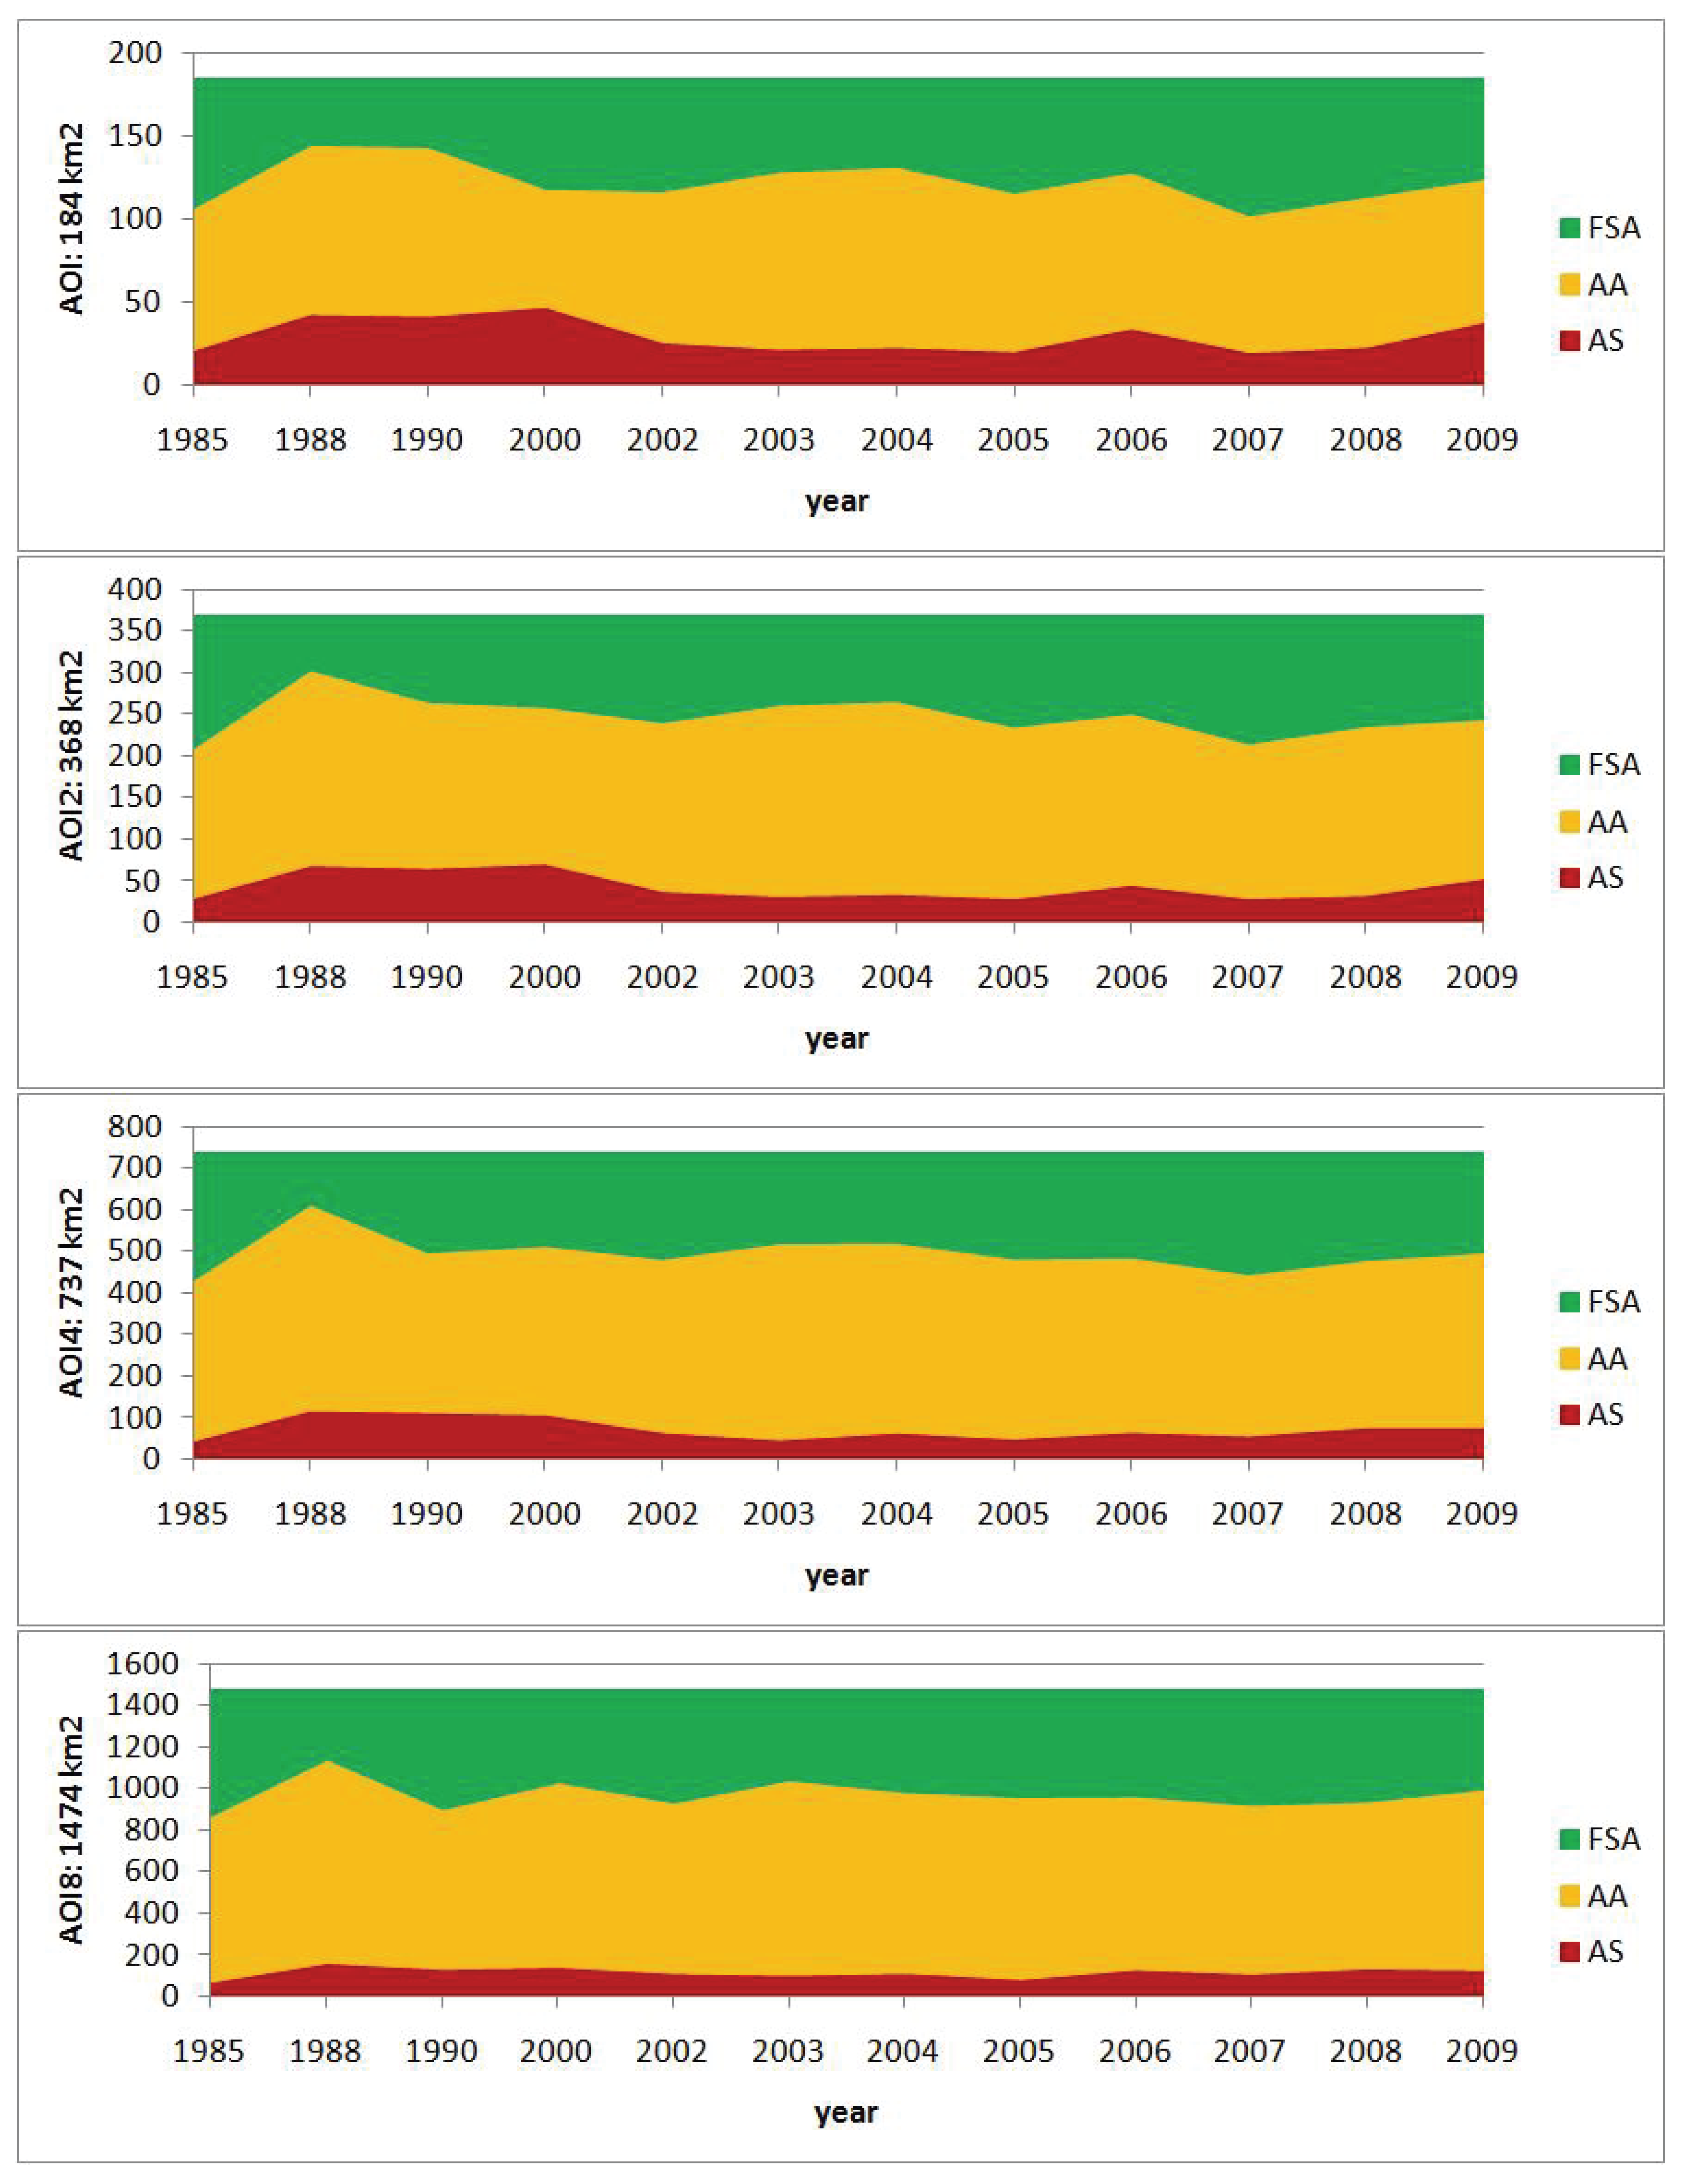
As described earlier, the NDVI classes are linked to the land-cover classes: AS, AA, and FSA. The initial state of the land-cover classes in 1985 for selected AOIs (AOI: 184 km
2, AOI2: 368 km
2, AOI4: 737 km
2, and AOI8: 1,474 km
2) is depicted in
Figure 8. The land-cover changes are in
Figure 9. The final state of the land-cover classes in 2009 is in
Figure 10.
Figure 8.
Initial land cover in the AOIs for spatio-temporal analysis (1985–2009) in 1985.
Figure 8.
Initial land cover in the AOIs for spatio-temporal analysis (1985–2009) in 1985.
Figure 9.
Land-cover changes in the AOIs (AOI, AOI2, AOI4, and AOI8) as a result of large scale mining in the 1985–2009 period; land changes in the local scale of mining areas (AOI) show higher disturbances of crop lands represented by agricultural areas.
Figure 9.
Land-cover changes in the AOIs (AOI, AOI2, AOI4, and AOI8) as a result of large scale mining in the 1985–2009 period; land changes in the local scale of mining areas (AOI) show higher disturbances of crop lands represented by agricultural areas.
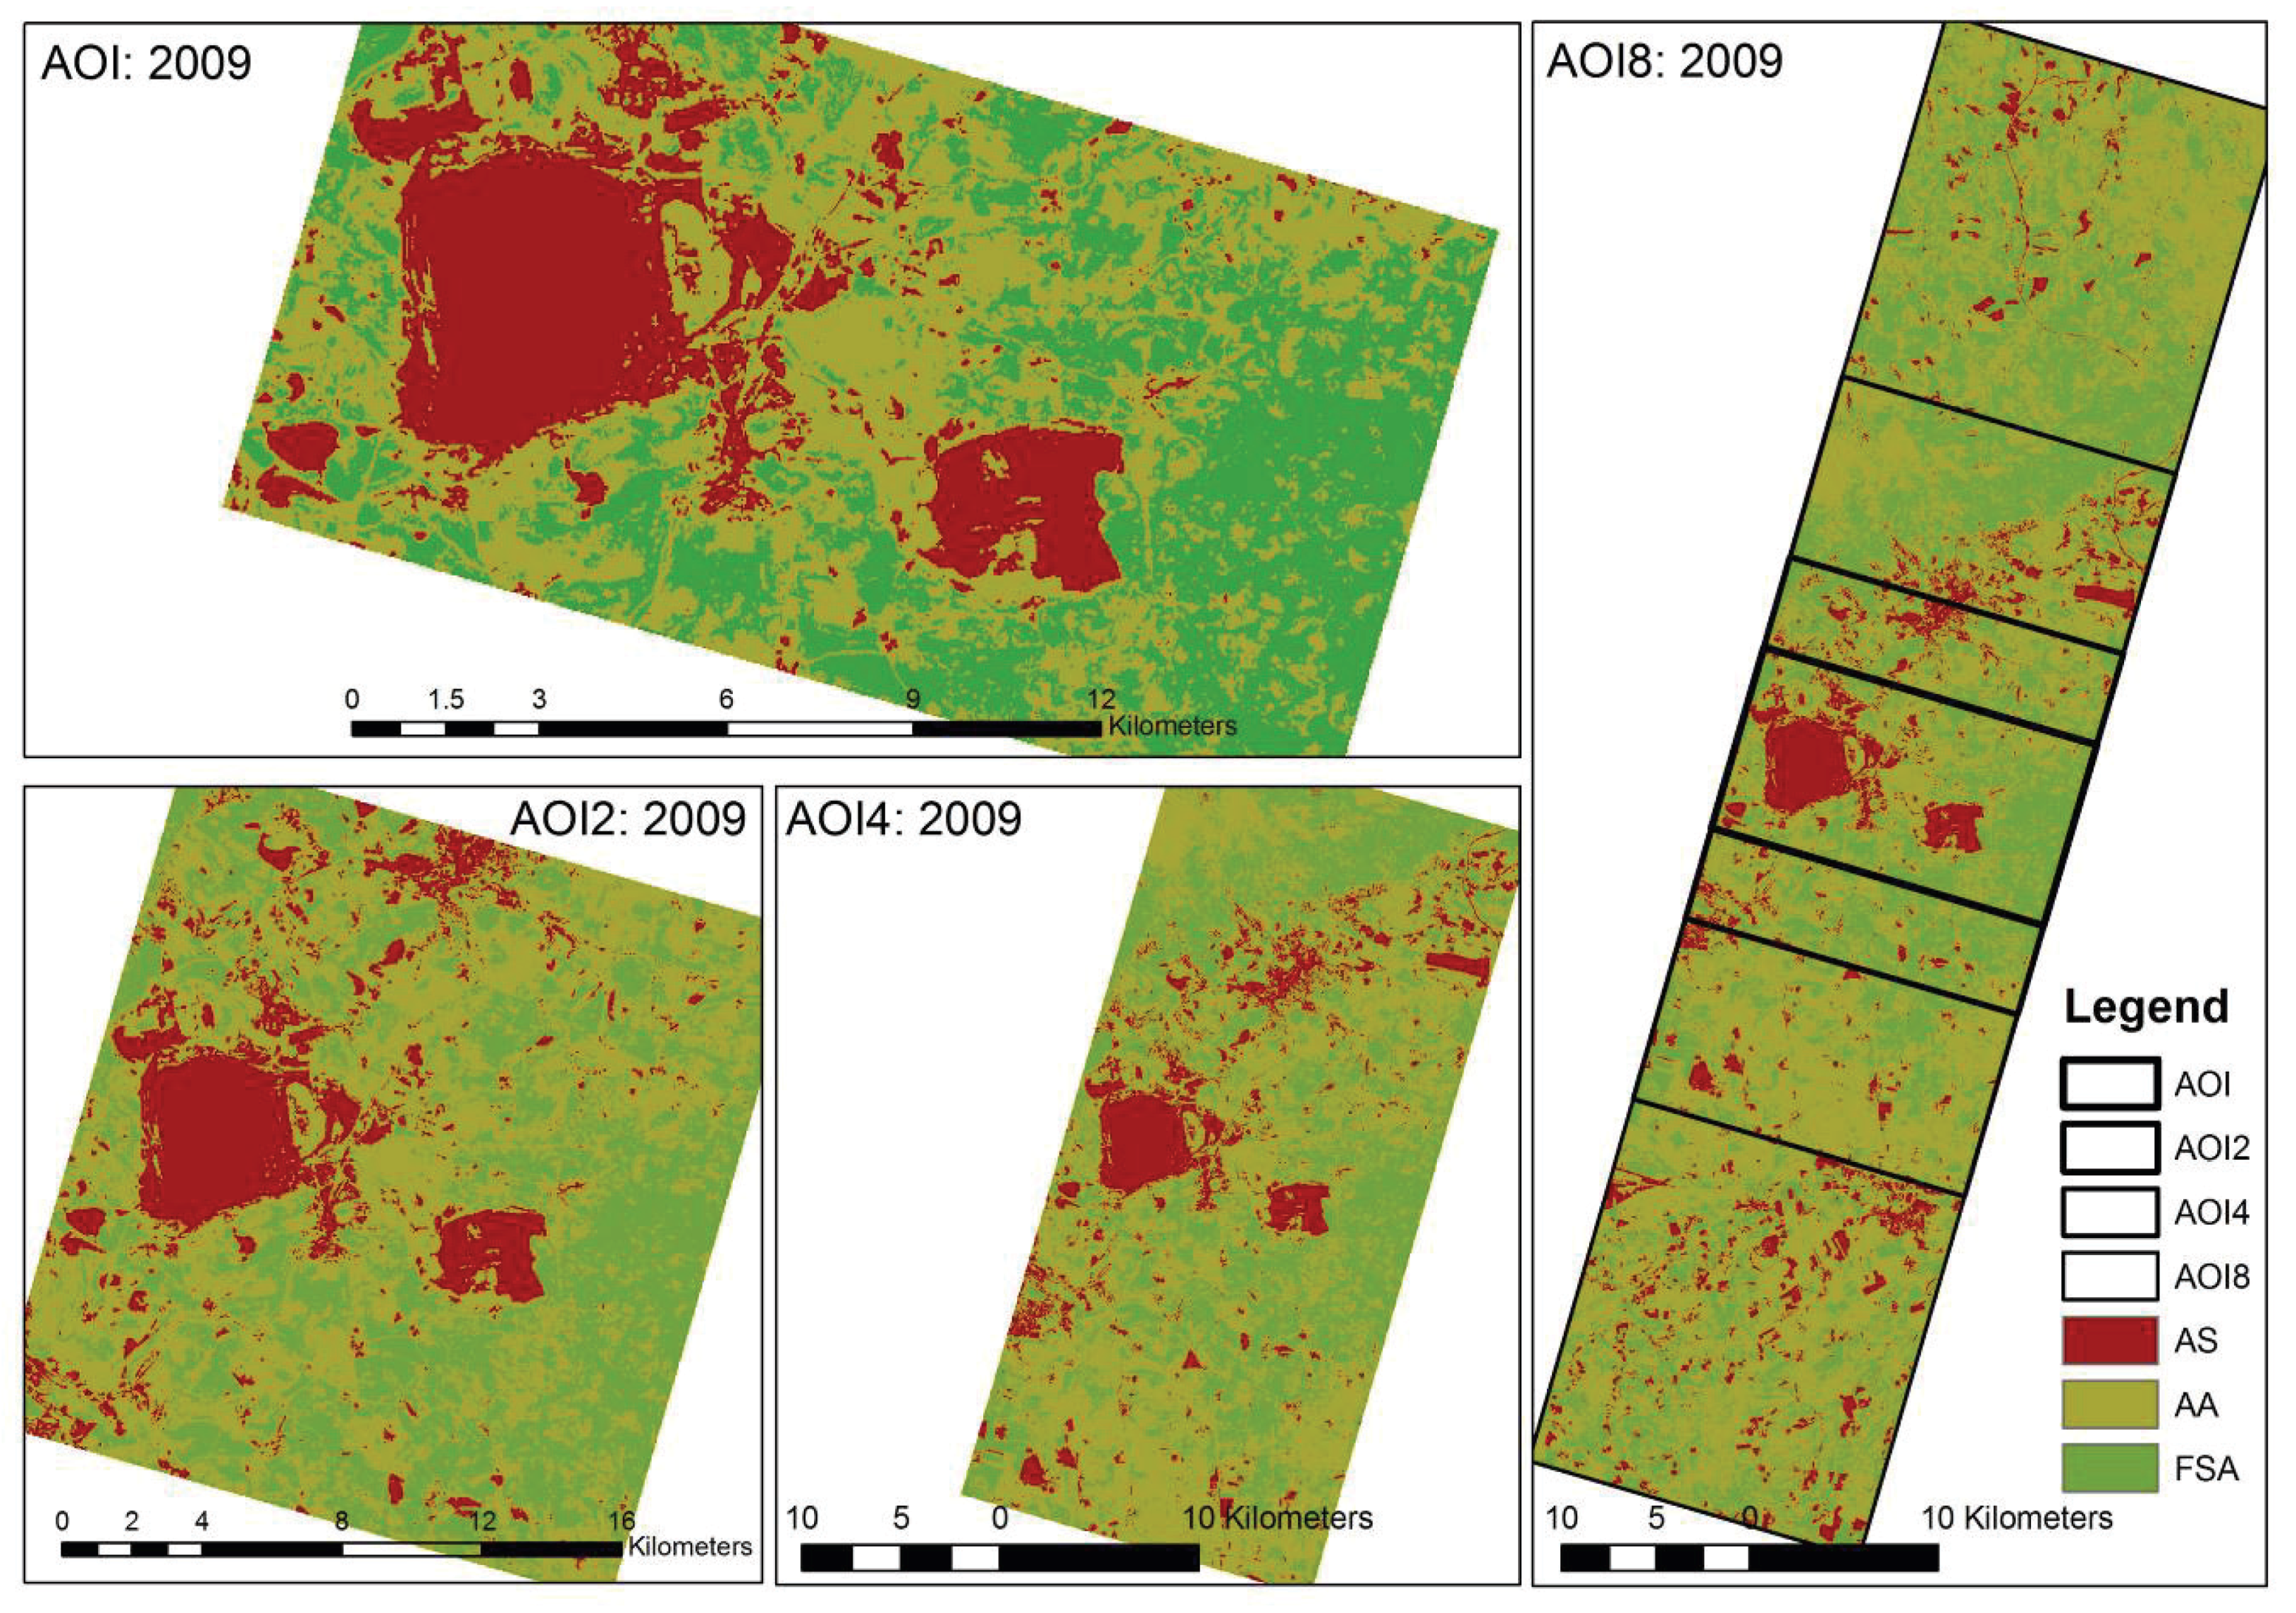
Figure 10.
Final land cover in the AOIs for spatio-temporal analysis (1985–2009) in 2009.
Figure 10.
Final land cover in the AOIs for spatio-temporal analysis (1985–2009) in 2009.
3.5. Objective E: How Have NDVI Magnitudes Changed?
There are many indices in remote sensing for classification of vegetation density. In order to compare the previous results included in papers, reports and various projects [
12,
14,
15,
16], NDVI was selected to explore changes in croplands as a result of large-scale mining. However, the goals of assessing land-cover changes in an area of selected large surface mines based on NDVI were only partially accomplished. Although 12 Landsat images captured over a long term period (1985–2009) were processed, seasonal vegetation effects (during May and June), and local meteorological conditions can cause high data variations. In addition, the levels of NDVI values could not be directly related to selected vegetation structures, land-cover types, or land use categories. In order to compare values among the selected AOIs, and consecutively, across all the images, the values were adjusted and classified on a common scale (three basic classes for NDVI with their levels estimated by CORINE Land Cover 2000 data). The Landsat images represented by NDVI layers were clipped by a few areas of interest. The NDVI values were reclassified into three classes that indicate the quantity and activity of vegetation. Based on the CORINE Land Cover 2000 data [
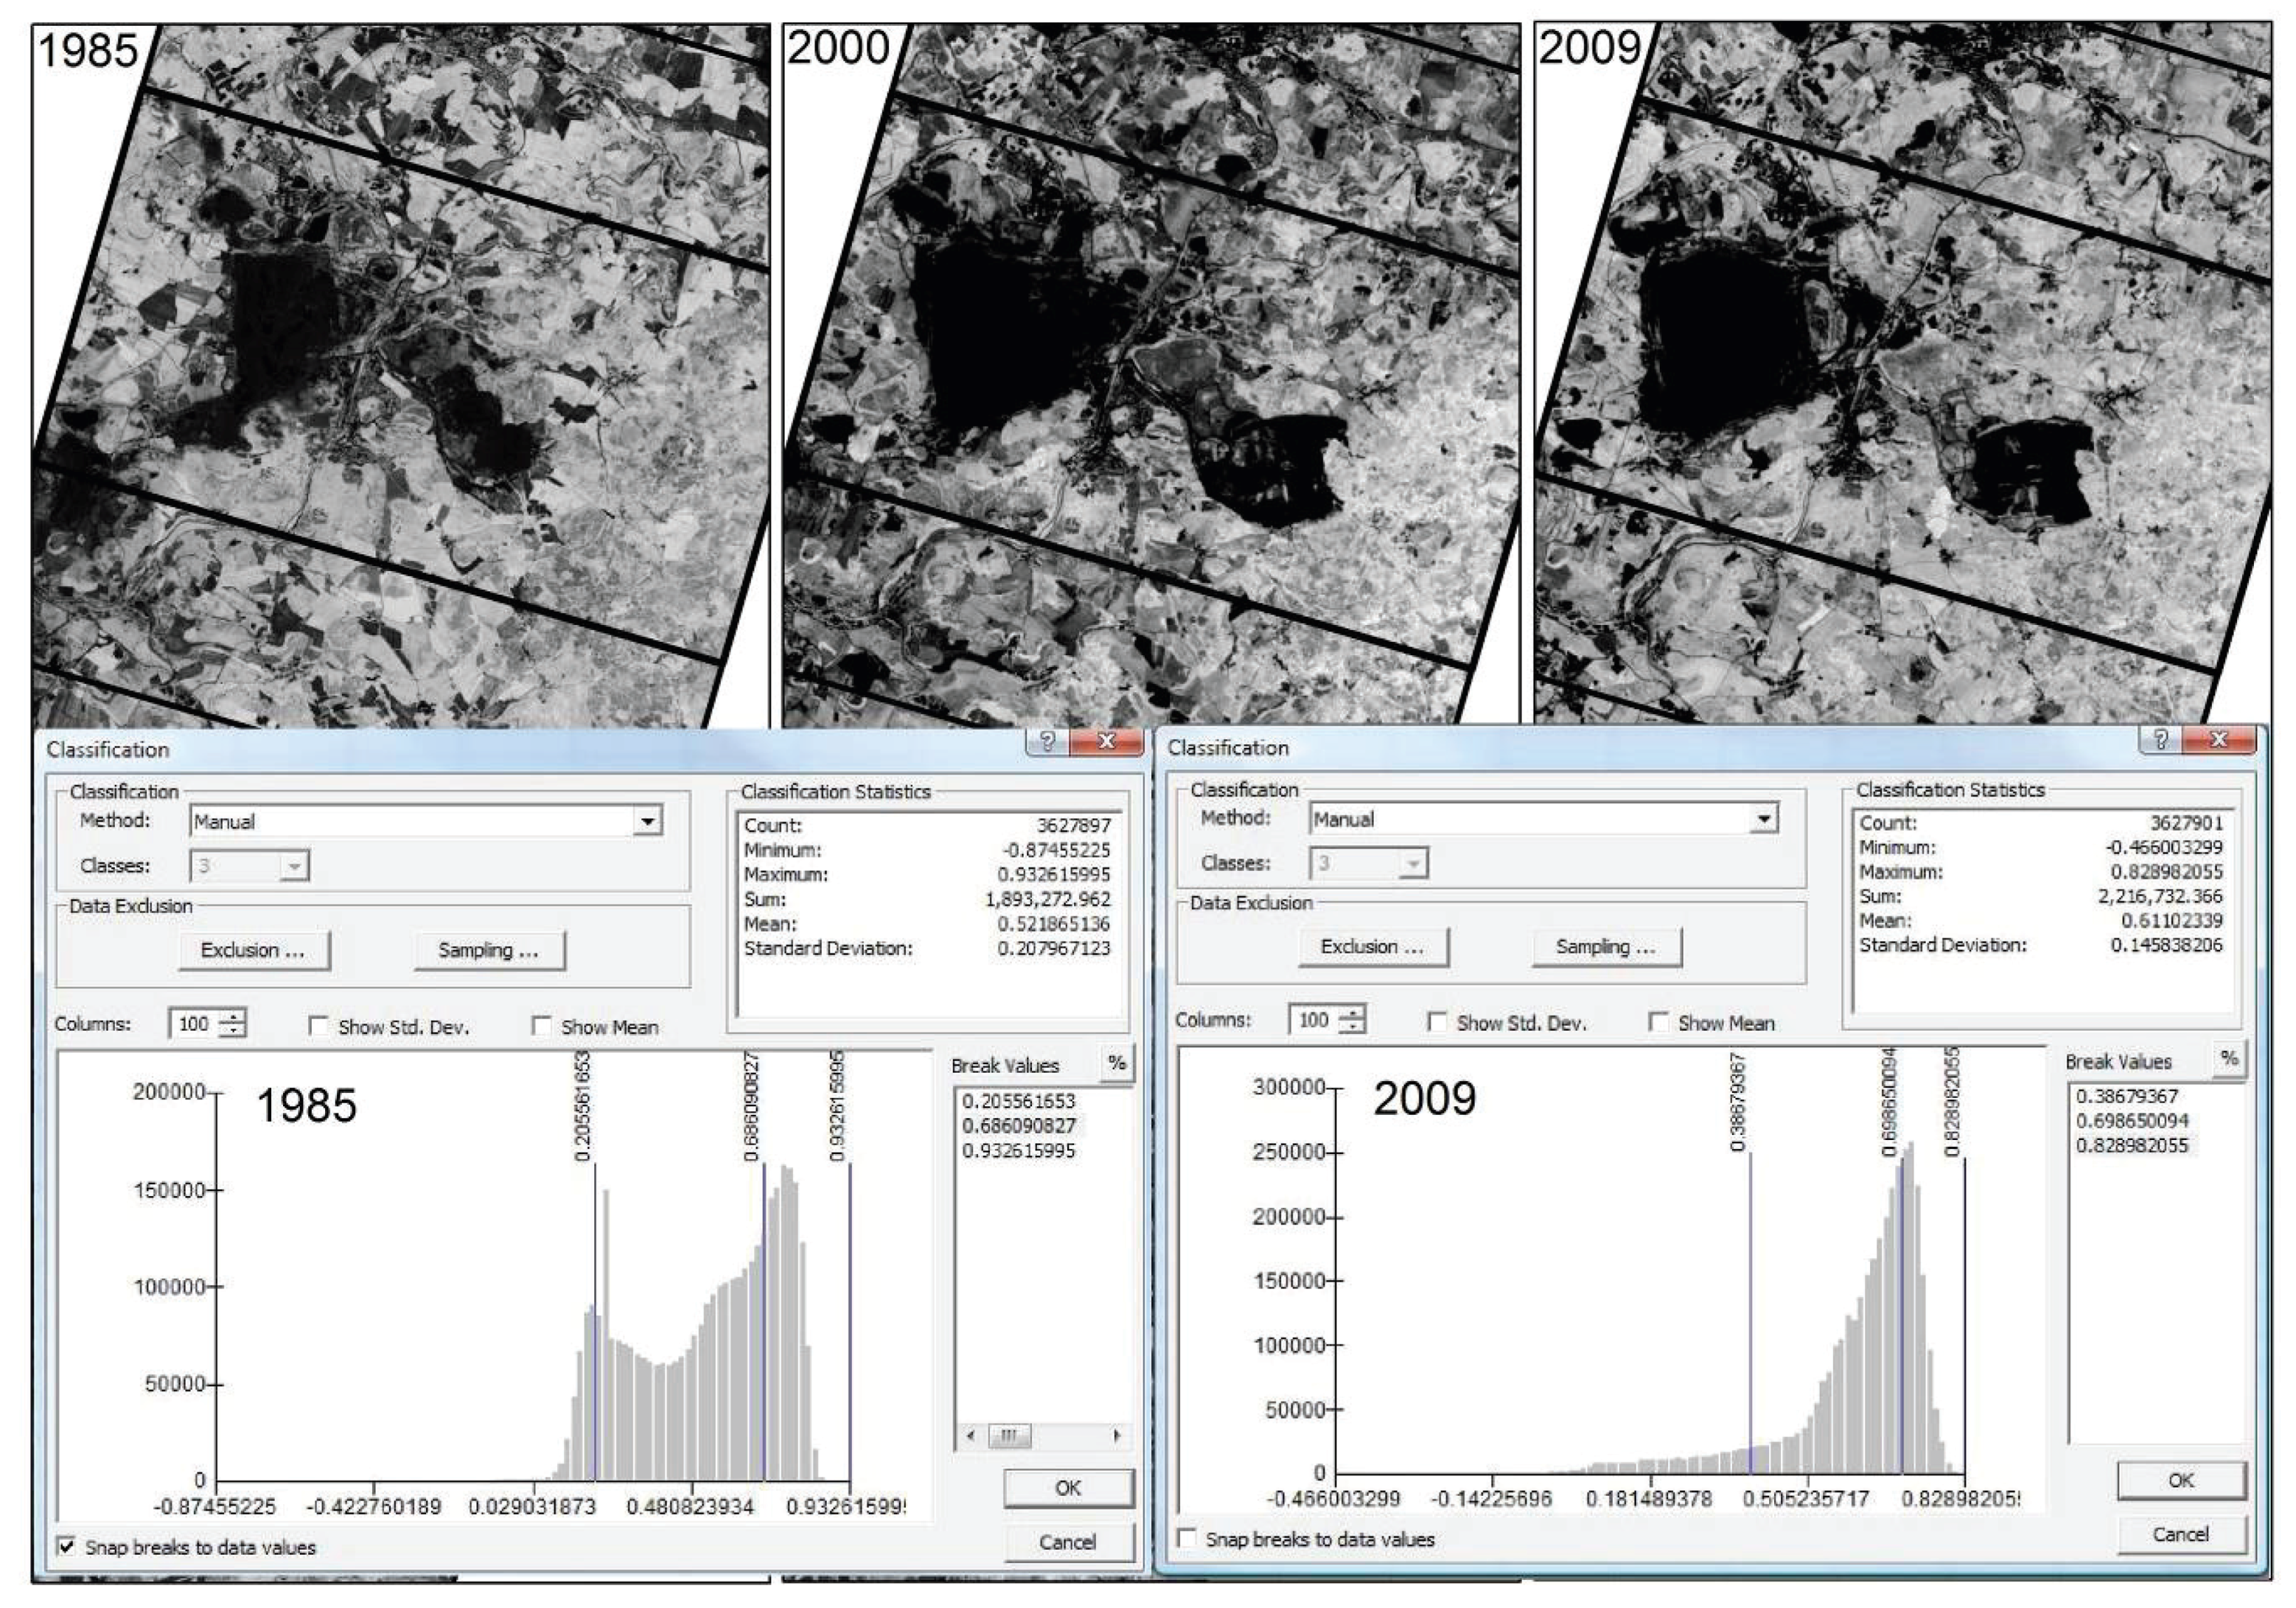
1], the NDVI classes are linked to AS, AA, and FSA. The same NDVI class levels based on quantiles in 2000 are used for a whole strip and AOIs in the middle part of each Landsat image are used for setting NDVI levels in other years,
Figure 11. The relative changes in NDVI levels in the local sites are interpreted as changes in basic land-cover classes.
Figure 11.
NDVI magnitudes for the Landsat strips for 1985 and 2009 complemented by histograms that show setting the quantiles based on CORINE Land Cover data from 2000.
Figure 11.
NDVI magnitudes for the Landsat strips for 1985 and 2009 complemented by histograms that show setting the quantiles based on CORINE Land Cover data from 2000.


