1. Introduction
Urbanisation is a worldwide trend in the 21st century. The United Nations Population Division (UNPD) estimates that most population growth in the next 30 years will occur in urban agglomerations. Already today approximately 50 % of the human population is living in urban areas. While the most rapid growth is predicted for cities in less developed countries, it is also expected that small and middle sized urban areas will absorb most of this growth [
1].
Yemen is a southwest Asian country characterised by rapid urbanisation. According to the Yemeni Statistical Yearbook 2006 [
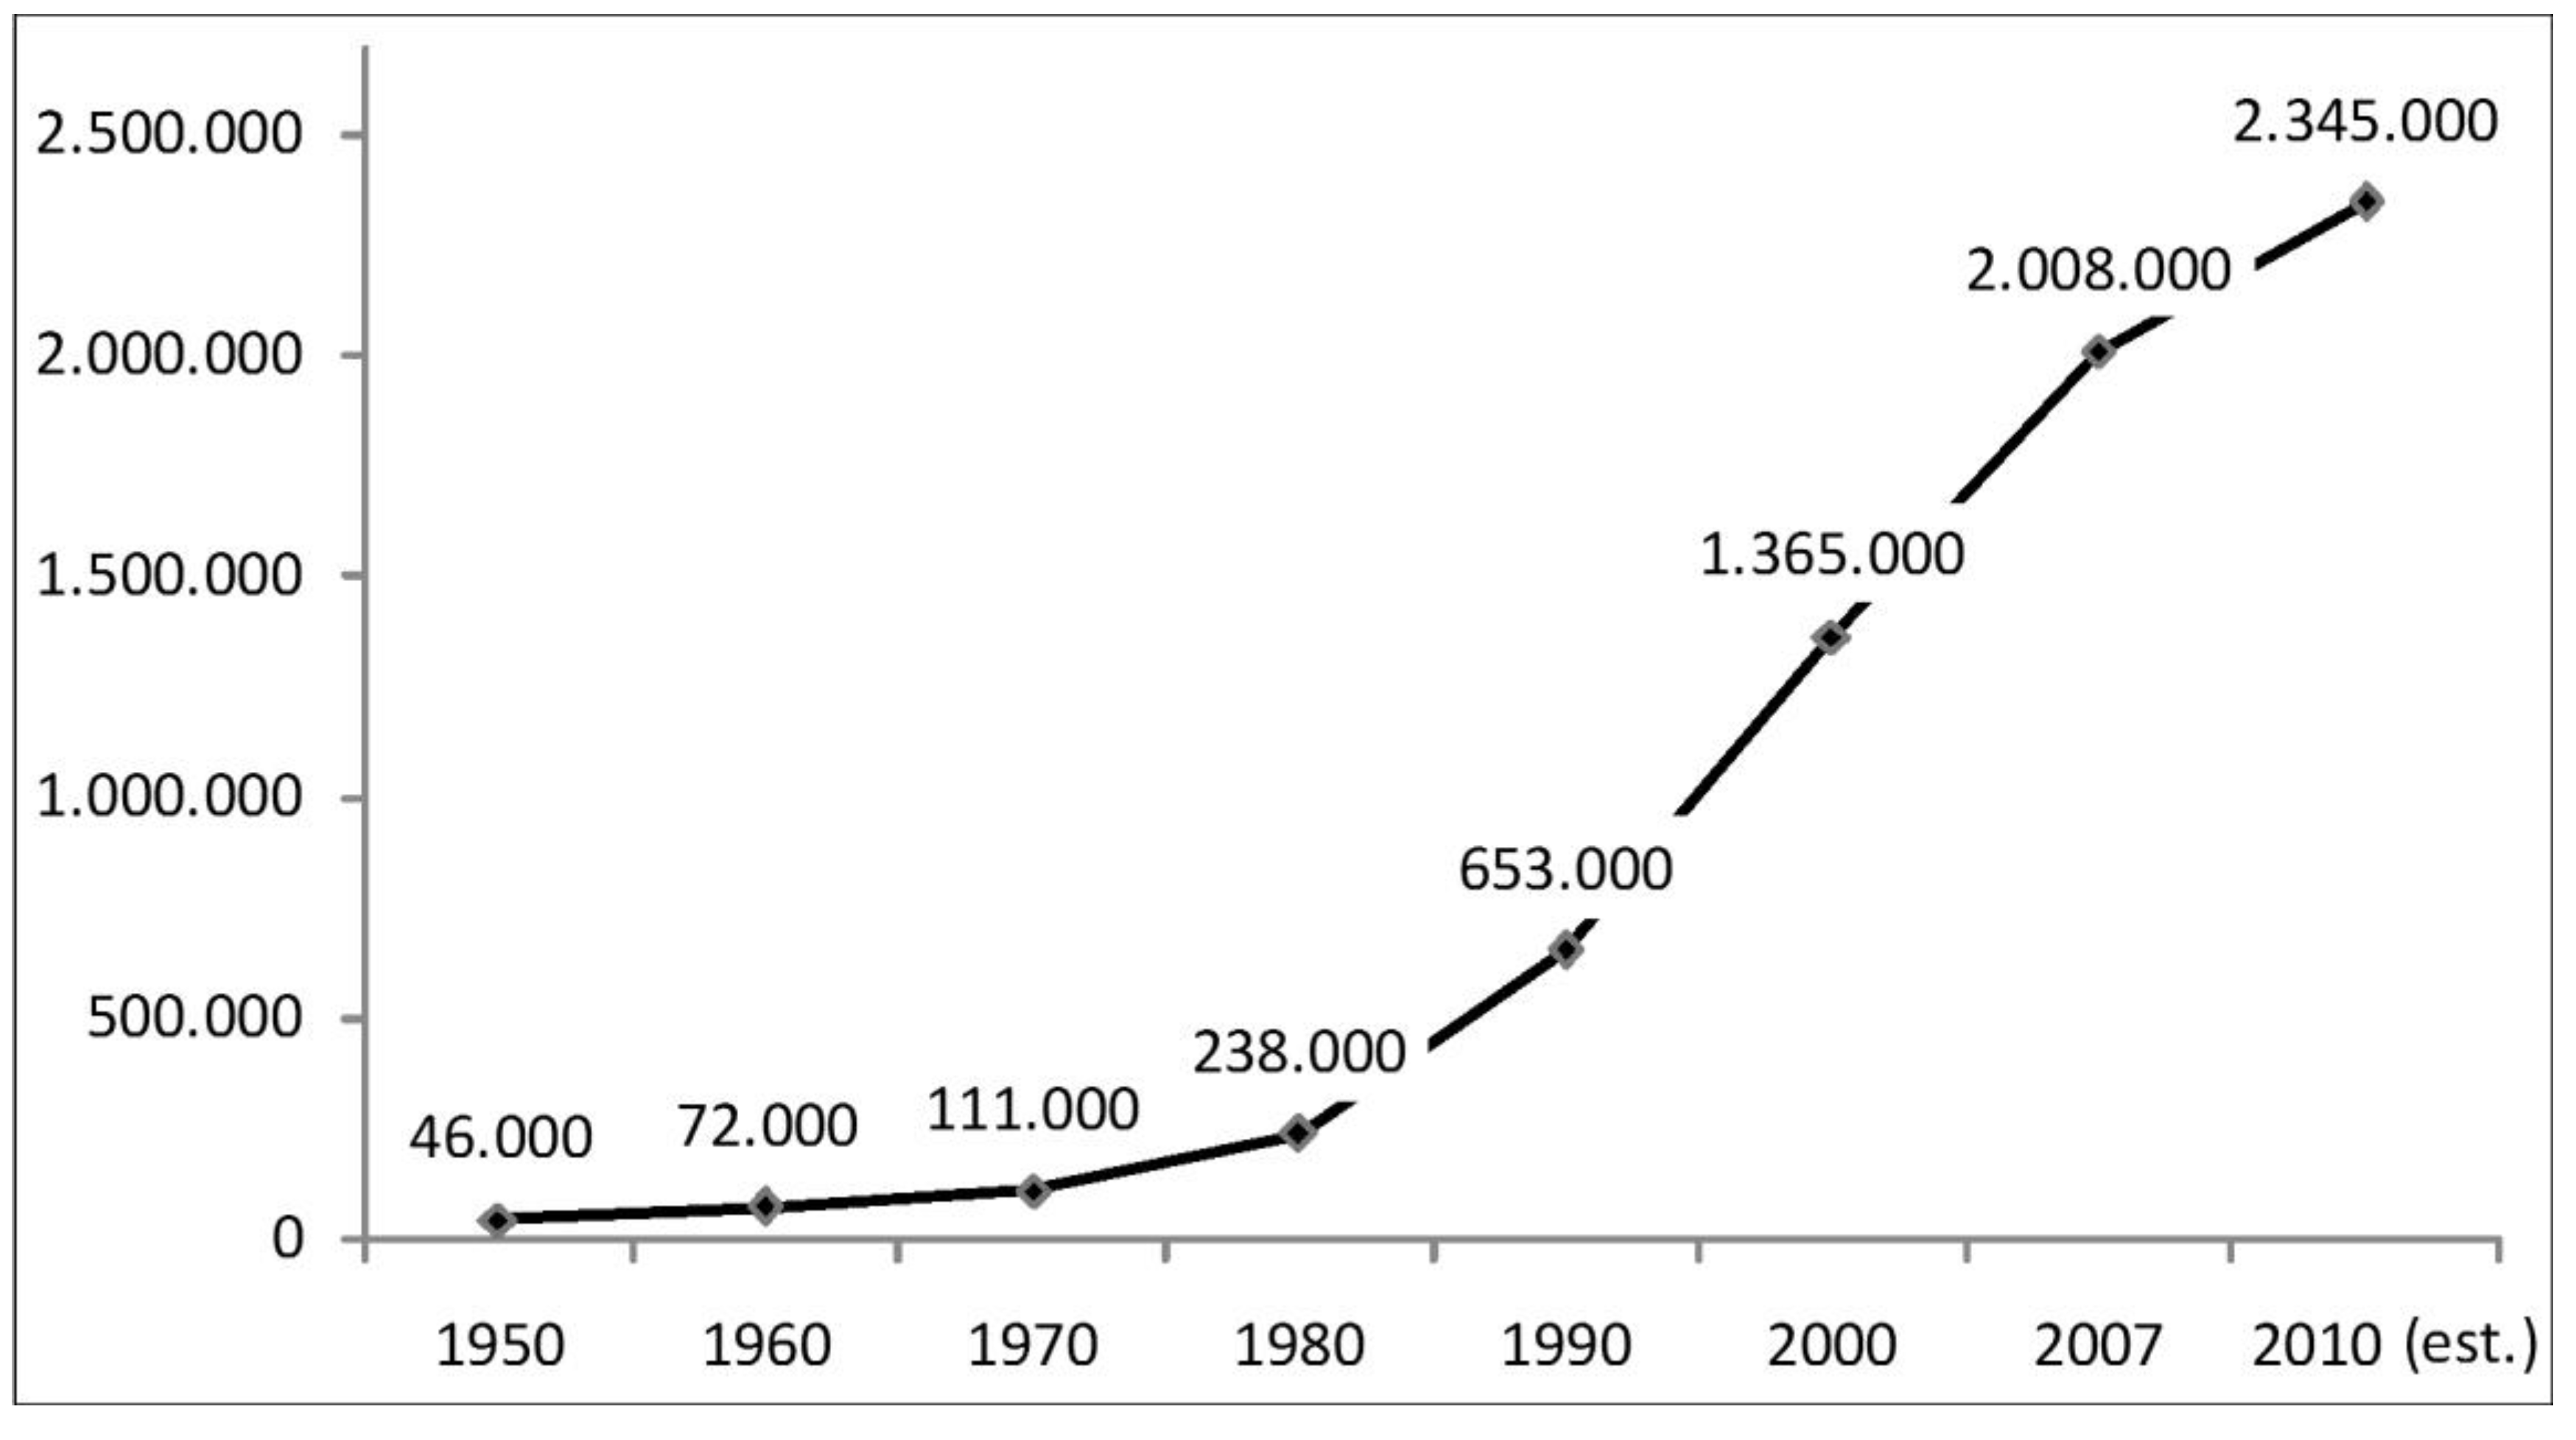
2], almost 9 % of the country’s population lives in the capital, Sana’a, and between 1994 and 2006 the number of inhabitants almost doubled, from 1,003,627 to 1,947,139 which corresponds to a compound annual growth of around 7%. Sana’a is an example of a middle sized city and is Yemen’s largest urban agglomeration, the political and administrative capital, and the most important cultural centre of the country. This ancient city’s historic transformation is closely related to the growth of the city and its population. Historical figures confirm that the population has doubled approximately every 10 years since the 1950s (
Figure 1), making Sana’a one of the fastest growing cities in the world [
3].
The following explanations for the city’s extreme population growth have been reported in the literature:
- •
The city’s economic emergence is leading to increasing rural-urban migration [
4].
- •
In 1990, the Northern Yemen Arab Republic and the Southern People’s Democratic Republic of Yemen united. The declaration of Sana’a as the capital created new working opportunities in government and administration. It is estimated that around 130,000 new inhabitants from Southern Yemen moved to Sana’a during this period [
4].
- •
The Gulf States were a popular destination for Yemeni migrant workers. Due to the unclear position of the young Republic of Yemen during the first Gulf War in 1990, Saudi Arabia and other Gulf States withdrew the working privileges of Yemeni workers. As a result, approximately one million Yemenites had to return home within a few months. Approximately 85,000 of them returned to Sana’a [
5].
- •
Yemen has a high natural growth rate of 3 % [
2].
- •
Yemen is a destination for refugees leaving Somalia and crossing the Red Sea. More than 74,000 refugee arrivals were recorded by the United Nations High Commissioner for Refugees (UNHCR) [
6] for the year 2009. The organisation estimates there are 20,262 refugees living in Sana’a [
7].
Figure 1.
Population growth of Sana’a from 1950 to 2010 [
8].
Figure 1.
Population growth of Sana’a from 1950 to 2010 [
8].
Rapid urbanisation poses considerable social and environmental challenges to city authorities and planners. Uncontrolled population growth, increasing social inequality, economic disparities and poverty all increase the potential of conflict. Poor urban planning and housing development lead to construction of informal settlements that lack access to basic infrastructure and provide poor living conditions. Consequently, increases in unregulated traffic, noise, and underdeveloped sewage and waste management cause further environmental degradation. Close monitoring of rapid urbanisation is crucial for the creation of sustainable urban environments.
The present paper used multisensor and multitemporal satellite imagery to analyse the spatial expansion of the urban area of Sana’a since 1978, together with rapid population growth. The urban built-up areas were delineated from the available imagery using an anisotropic textural procedure. We define urban built-up areas as regions which contain structural information about the urban domain, including buildings and open space. These areas are also often referred to as “impervious surfaces” [
9]. It was possible to quantify changes within these regions at the district level.
Population figures were obtained from the latest census report and interpolated for intermediate years. The district was the smallest area used for measuring population distribution and population growth. Changes in population density per urban district area in time were investigated based on the population figures and image data.
Furthermore, the relationships between both types of information were explored to study their similarities. The resulting urban and population growth patterns of Sana’a are useful information for sustainable urban planning in order to provide the necessary urban service infrastructure and water supply. This is important considering the alarming statistic on water shortage and increasing population growth in Sana’a [
10].
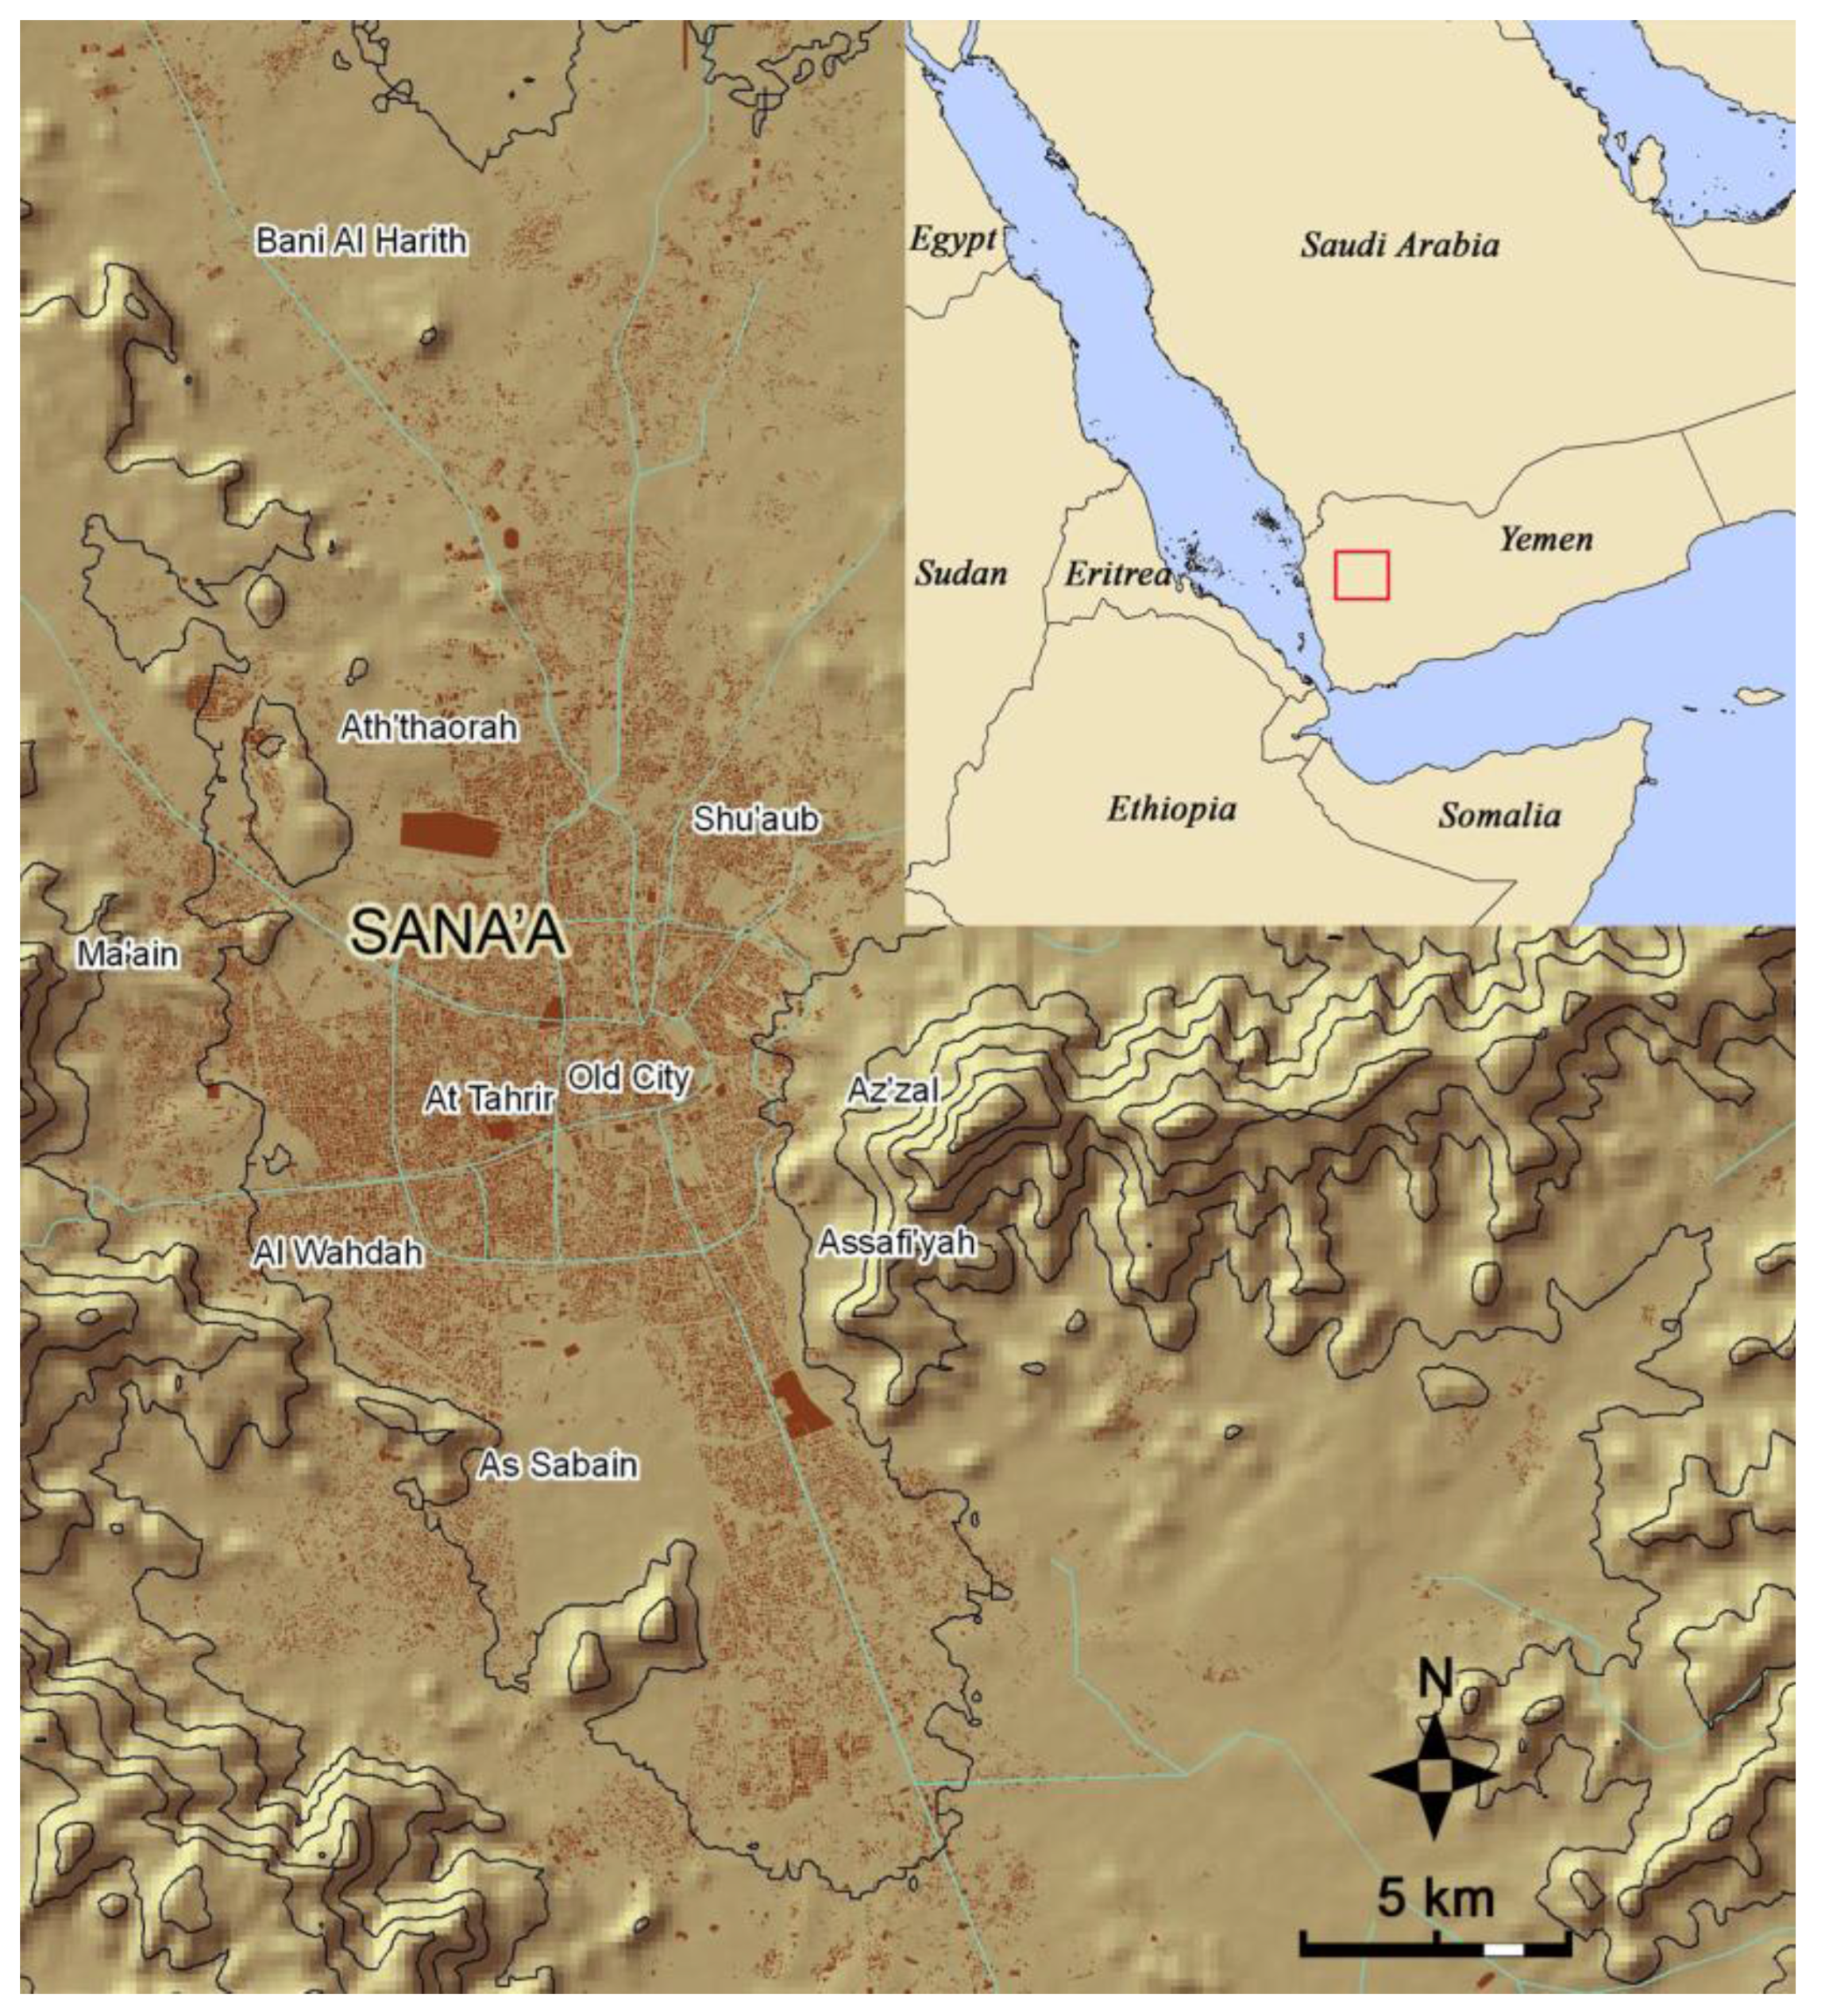
Figure 2 presents the location of the study area.
Figure 2.
Location of the study area.
Figure 2.
Location of the study area.
2. Applying Remote Sensing Imagery for Urban and Population Studies
Remote sensing has been used to investigate urban environments, urban land cover changes and city growth in particular. Many publications illustrate the automatic or semi-automatic spectral analysis of medium to high spatial resolution data, e.g., Landsat TM, SPOT HRV. Spectrally derived land cover classifications are further enhanced by visual interpretation of either airphoto, or more recently, of very fine spatial resolution (VHR) optical satellite imagery, e.g., IKONOS or Quickbird [
11,
12,
13,
14,
15,
16]. Other methodologies have made use of vegetation indices or developed built-up indices derived from multispectral Landsat TM data [
17,
18,
19].
Recently available VHR imagery provides very fine spatial but coarse spectral resolution data, by comparison with medium and fine spatial and spectral resolution satellite data. This has led to new challenges in successful extraction and classification of urban areas. Single buildings, roads, gardens and lawns that make up the complex heterogeneous urban fabric [
20] are now visible in detail and VHR imagery provides an opportunity for their classification and delineation. Consequently, new approaches were required for efficient VHR optical satellite data mining by integrating the newly available structural and textural information acquired by VHR data to discriminate different settlement patterns and components. Image segmentation prior to classification has proven to be a valuable solution. Carleer and Wolff [
21] combined spectral information on VHR imagery together with spectral, textural and morphological features for the improvement of urban land cover classification. The features were calculated after previously segmenting the image into meaningful objects. Herold
et al. [
22] conducted a similar segmentation or object based classification of an urban area in California based on IKONOS data.
Another approach is the use of image textural information to discriminate built-up structures. Zhang
et al. [
23] successfully merges spectral and textural information for improving urban recognition by analysing SPOT panchromatic data. Another methodology was developed by Pesaresi [
24] and is based on a fuzzy rule-based composition of anisotropic textural measures, based on the gray-level co-occurrence matrix (GLCM). This method was successfully applied in two studies dealing with built-up area discrimination in urban and suburban areas [
25,
26] and was also used in this study.
The link between remote sensing and population data is addressed in many different ways in earth observation studies. One important field of research is the estimation of population numbers by means of remote sensing [
27,
28]. Other studies focus on the spatial disaggregation of census data to subdivide homogeneous allocation over administrative units into smaller units taking into consideration the environmental factors influencing population distribution [
29,
30]. The existence of a relationship between urban built-up areas and population sizes is not new [
31]. This knowledge was applied, for example, to assess the extent of urbanisation from the Defense Meteorological Satellite Program Operational Linescan System (DMSP-OLSv) [
32]. Investigations into the correlation between census data and residential density were conducted by Chen [
33]. Furthermore Yin
et al. [
15] analysed changes in built-up surface with respect to census data from different years.
3. Data
Map and satellite data were used to estimate built-up areas (
Table 1). Vector-based road data were used to refine the delineated built-up patterns, and vector features of building footprints were available for validation purposes. Both vector data sets were from 2004 and provided by the Al-Saylah-Project, Capital Secretariat of Sana’a. Population figures for 1994 and 2004 were obtained from the latest census reports provided by the Central Statistical Organization [
2]. A point layer of settlements including population figures, as well as census and administrative boundaries were obtained from the Ministry of Public Health & Population [
34]. The United Nations Population Division Population Database [
1] was the primary source of historic population figures for Sana’a.
Table 1.
The following data were used in this study and included satellite imagery and a map.
Table 1.
The following data were used in this study and included satellite imagery and a map.
| Acquisition date/ Year | Sensor | Scale/ Resolution |
|---|
| 1978 | Soviet Military City Plan/ Topographic map | 1: 50,000 |
| 20/09/1989 | Landsat TM | 30 m |
| 27/12/1994 | SPOT 3 | 10 m (PAN)/ 20 m (MS) |
| 30/06/2004 | Quickbird | 0.6 m (PAN) /2.4 m (MS) |
| 06/06/2007 | SPOT 5 | 2.5 m (PAN) /10 m (MS) |
4. Methodology
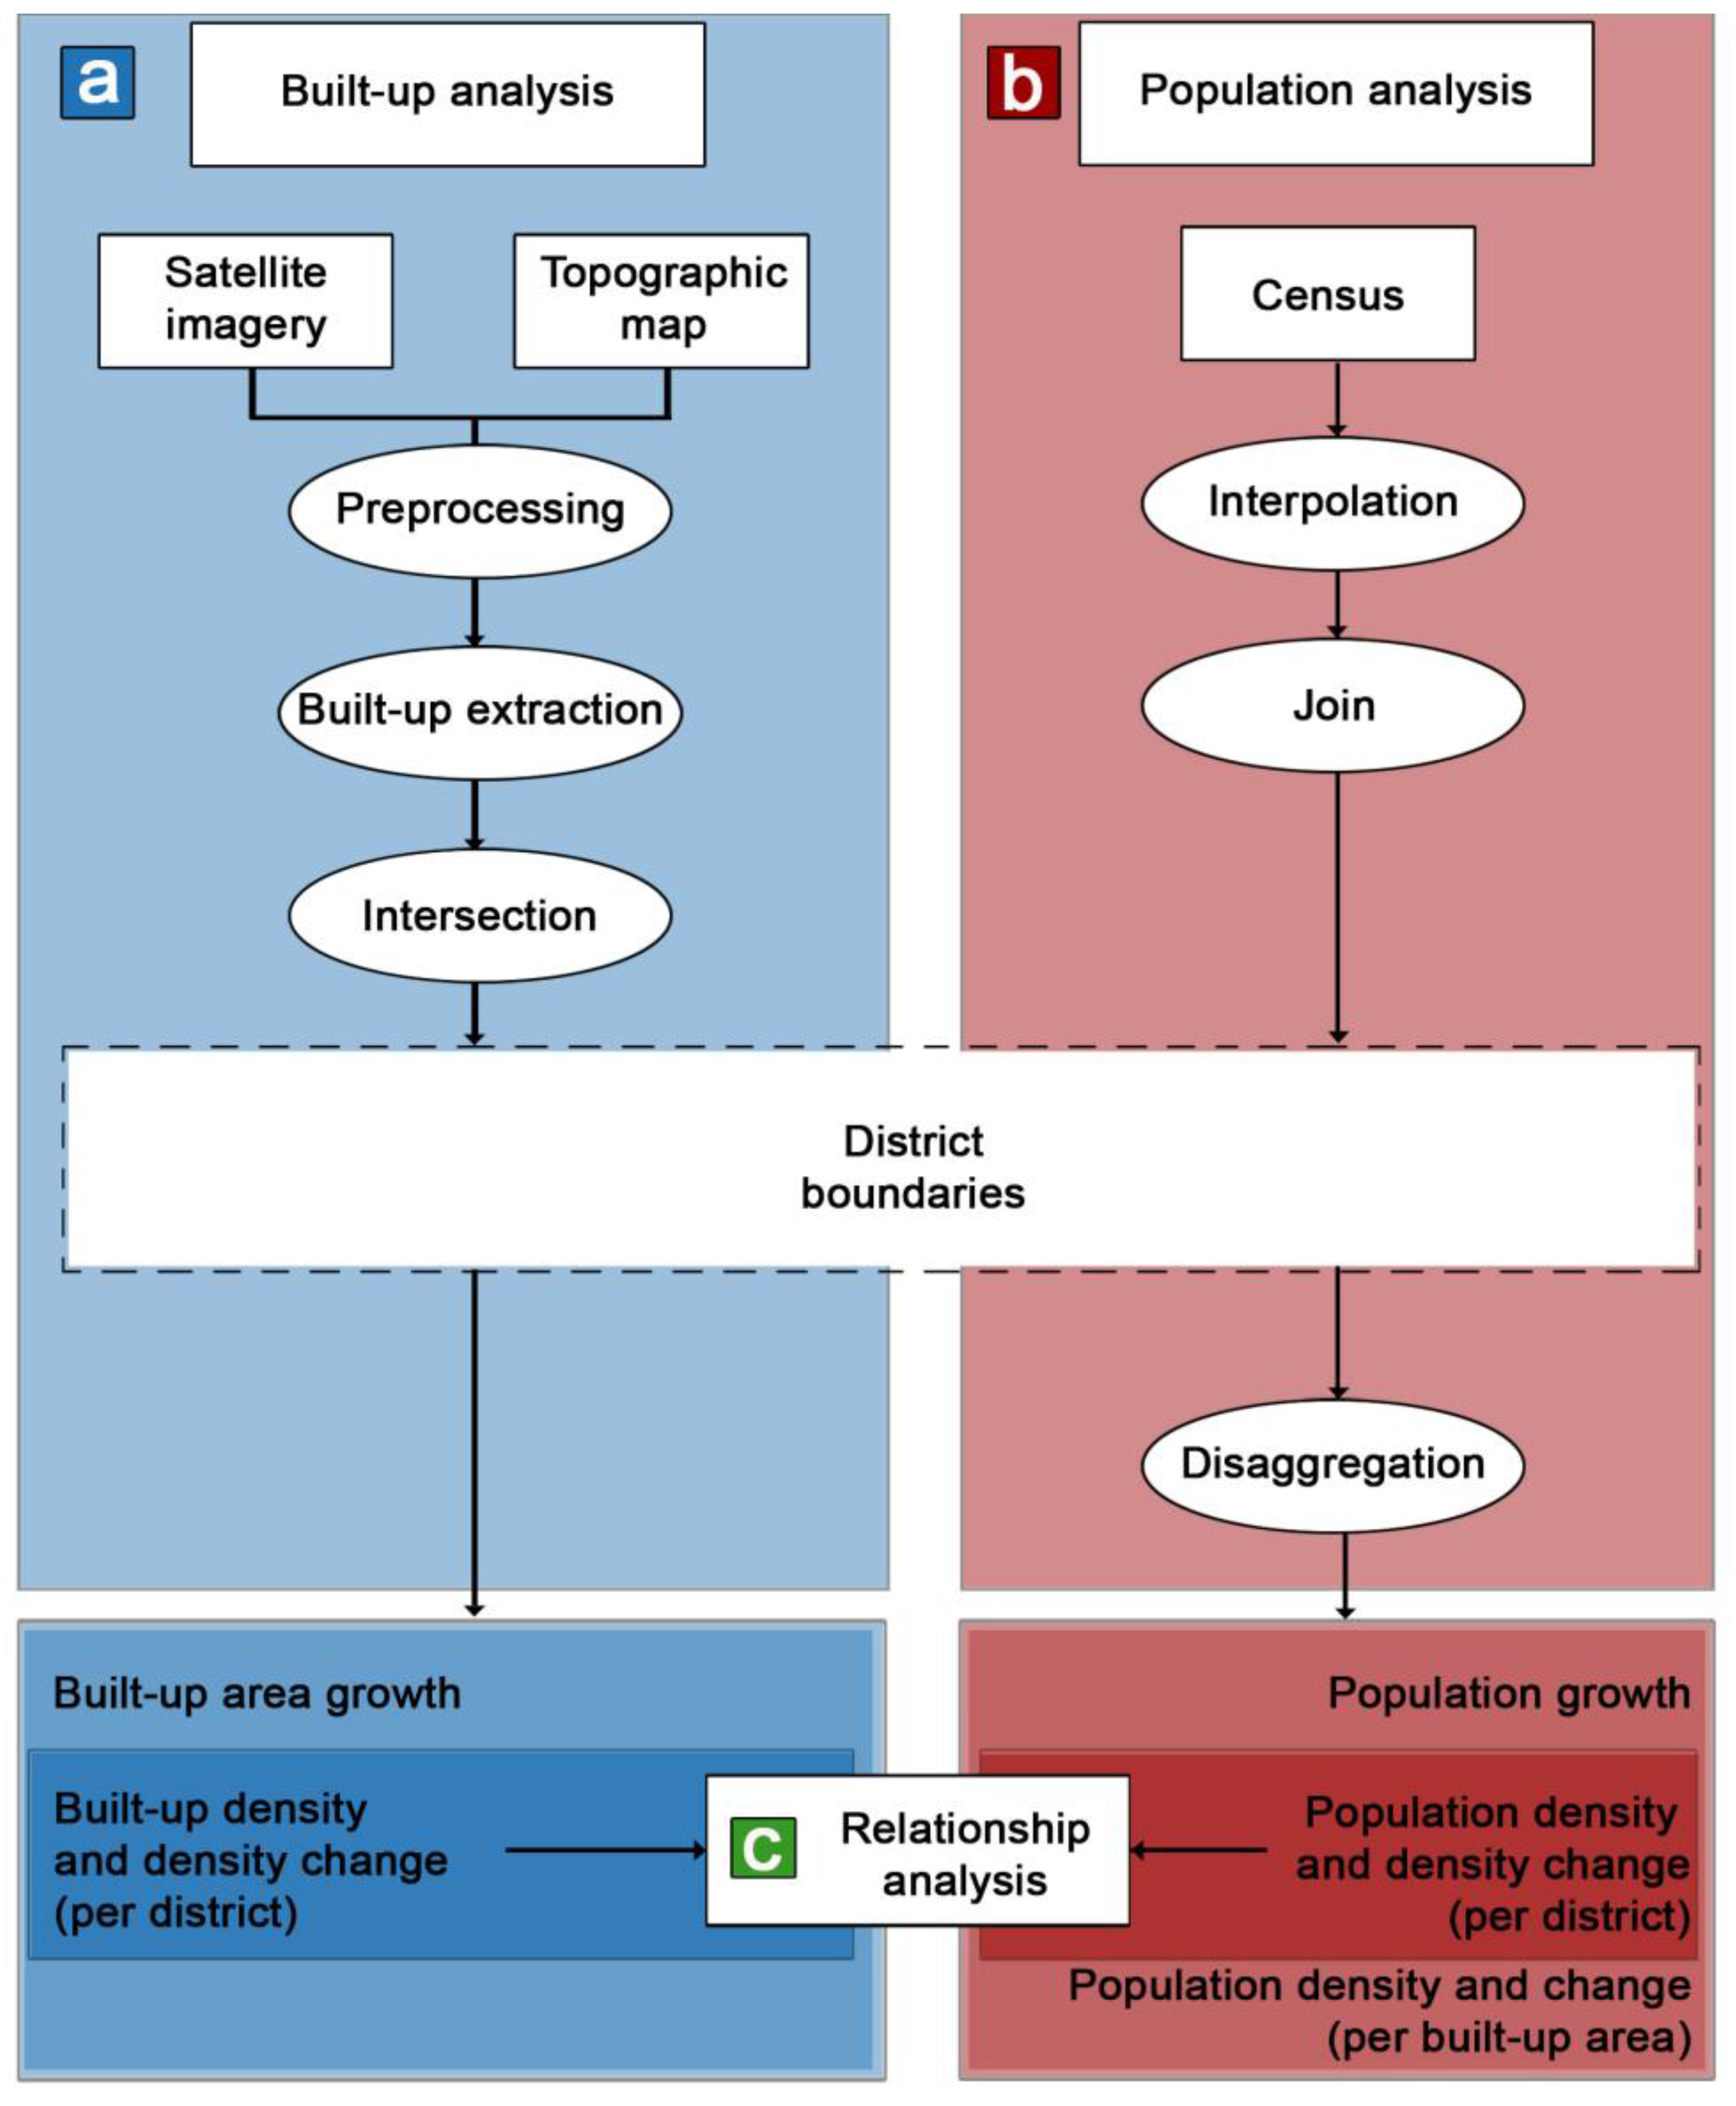
The analysis was conducted in three steps, as depicted in
Figure 3. Step one (
Figure 3a) produced the layer of urban built-up areas based on the satellite images and the topographic map. By intersecting those with the available district boundaries, the spatial patterns of urban growth were extracted. The second step (
Figure 3b) derived the population figures for Sana’a for the period under investigation. By joining the population figures with the districts, the changing population distribution over the years could be examined for each district. By linking population figures to the built-up areas, an improved population density figure was computed, taking into account only the inhabited area instead of the administrative unit area. The third step (
Figure 3c) investigated the relationship between built-up areas and population change for the period under investigation. The methodologies are described in detail in the next sections.
Figure 3.
The processing and analysis workflow. (a) Delineation of built-up areas and change analysis. (b) Population distribution and change analysis. (c) Spatial population change analysis related to built-up expansion.
Figure 3.
The processing and analysis workflow. (a) Delineation of built-up areas and change analysis. (b) Population distribution and change analysis. (c) Spatial population change analysis related to built-up expansion.
4.1. Data Pre-Processing
All satellite imagery was georeferenced using 21 high-precision GPS points collected during a field campaign in February, 2008. The Quickbird data was georeferenced using the rational polynomials delivered with the data in combination with the GPS points with a maximum root mean squared error in x- and y-direction of 1.6 m. The SPOT and Landsat data was georeferenced using rigorous models with resulting geometric accuracies below pixel size. All data was resampled by the cubic convolution resampling method. The imagery was subset to cover the districts under investigation. Based on previous experience using the
Figure 3a methodology [
25,
35], all VHR imagery was resampled to 5 m spatial resolution which is considered optimal for the discrimination of the built-up areas using the proposed textural approach. The advantages of degrading the spatial resolution of VHR data are faster image processing and easier data management. No resampling was applied to the coarser spatial resolution imagery,
i.e., the SPOT 3 HRV and Landsat TM scenes.
A texture-based image processing approach was applied to the satellite data for 1994, 2004 and 2007 to extract the areas of Sana’a where buildings are present [
26]. The different datasets,
i.e., coarse spatial resolution imagery, VHR imagery and topographic map, were processed differently because their information contents are different.
4.2. Delineating Regions of Built-Up Structures and Urban Growth Analysis
A scanned 1:50,000 scale Soviet military topographic map provided the reference data for the year 1978. The raster map was vectorised and topologically corrected. Polygons of built-up regions were visually selected. To delineate the built-up areas for 1989 the blue-NIR-SWIR (TM channels 1-4-5) bands of the Landsat TM image were assigned to a Red Green Blue (RGB) colour composite display. To enhance the representation of the urban areas the RGB image was interactively stretched (stretch ranges: R = 110/146, G = 65/96, B = 131/164). A built-up mask was then derived applying a region growing algorithm as implemented in ERDAS Imagine software. Several seeding pixels representing urban classes were selected manually to capture the urban built-up areas. Built-up areas were delineated based on texture statistics using VHR satellite imagery from 1994 (SPOT 3 HRV), 2004 (Quickbird) and 2007 (SPOT 5 HRG PAN). The anisotropic rotation-invariant built-up presence index (PanTex) [
26] was applied to delineate urban and non-urban regions. The main component of the PanTex workflow computes the contrast textural statistic based on the grey-level co-occurrence matrix (GLCM) as introduced by Haralick
et al. [
36]. The PanTex method is based on image texture and therefore is advantageous for multisensor and multitemporal image analysis. The efficiency of this method to delineate built-up areas has been shown to work for optical panchromatic images [
26] as well as SAR images [
37]. Pesaresi [
25,
35] has shown that the GLCM contrast statistic is the most efficient at discriminating between built-up and non-built-up areas. To determine good contrast statistics between building roofs, shadows and background, the input imagery must have a spatial resolution that is equal to or better than the dimensions of the discernable built-up objects [
26]. Different displacement vectors are used to compute the contrast statistic to take advantage of the anisotropic nature of the urban texture [
26]. The directional components of the contrast statistic are used to produce a single texture layer using the intersection and union operators.
The result provides structural information on the urban regions, including buildings, open spaces and, partially, roads. The final binary built-up mask is produced by interactively choosing a threshold value that delineates the image into built-up and non built-up areas. These thresholds were chosen by comparing the PanTex image result with the natural colour input imagery to maximise urban area overlap. The binary result was converted to polygons and imported into a geographic information system (GIS) (
Figure 4).
Figure 4.
Input and output of the PanTex workflow. (a) Quickbird (2004) panchromatic image resampled to 5 m spatial resolution. (b) Built-up area contours (red) delineated using the PanTex workflow. Grey areas represent high contrast statistics (built-up), and dark areas represent low contrast statistics (non built-up).
To analyse the spatial patterns of urban growth, the built-up masks were refined by intersecting road vectors in order to reduce some areas originally classified as built-up. The roads, available as line features, were buffered assuming a mean road width of 6 m for side roads and 20 m for main roads. These sizes were chosen based on information gathered during the field campaign in February, 2008. For growth analysis, the built-up mask for every single year was disaggregated by intersecting it with district boundaries. With no information about their possible modification it was assumed that the districts did not change during the observed period. After calculating the polygon areas, absolute and annual growth rates were calculated for each district in square kilometres and percentage, respectively. Furthermore, built-up density and built-up density change were also investigated.
4.3. Population Distribution and Population Growth Analysis
Census figures from 1994 and 2004 were used to compare the overall population growth and population growth per district. Based on the information provided in
Figure 1, geometric growth was assumed in determining population figures for 1989 and 2007, respectively. To achieve this, the compound annual growth rate (CAGR) for the period 1994–2004 was calculated for each district. The computed CAGR values were taken to compute the population figures for 1989 and 2007 on district level as well. The results were used to determine the absolute population growth and the growth in percentage.
Spatial analysis was made by joining district boundaries with the census data, which allowed the analysis of the population distribution, and the population density per district for each year under investigation. Population density is a common measure of urbanisation and provides population figures per unit area [
38]. However, the definition does not exclude areas with no inhabitants from the calculation. Residential or settlement density, which refers to the number of people per unit area of built-up surface, produces a more meaningful measure of the urban living environment by taking into account the dynamics of both population and urban land use change [
15]. To derive the residential population density, the district population figures were linked to the appropriate built-up masks for each district. Finally, the spatial patterns of population distribution, population density by total area of the district, and by urban built-up area were compared for the full period observed.
5. Results
5.1. Validating the Delineated Urban Area Maps
The reference for the urban built-up area validation was based on the building outlines provided by the Al-Saylah-Project, Capital Secretariat of Sana’a, produced in 2004. This vector data were produced in the same year that the Quickbird scene was acquired. In order to account for sealed areas around the buildings (e.g., parking lots) and the off-nadir acquisition angle of the Quickbird data leading to slightly larger building areas than the digitized building footprints from a near-nadir view, the dataset was buffered by 5 m. This distance was defined after visual examination in ArcGIS.
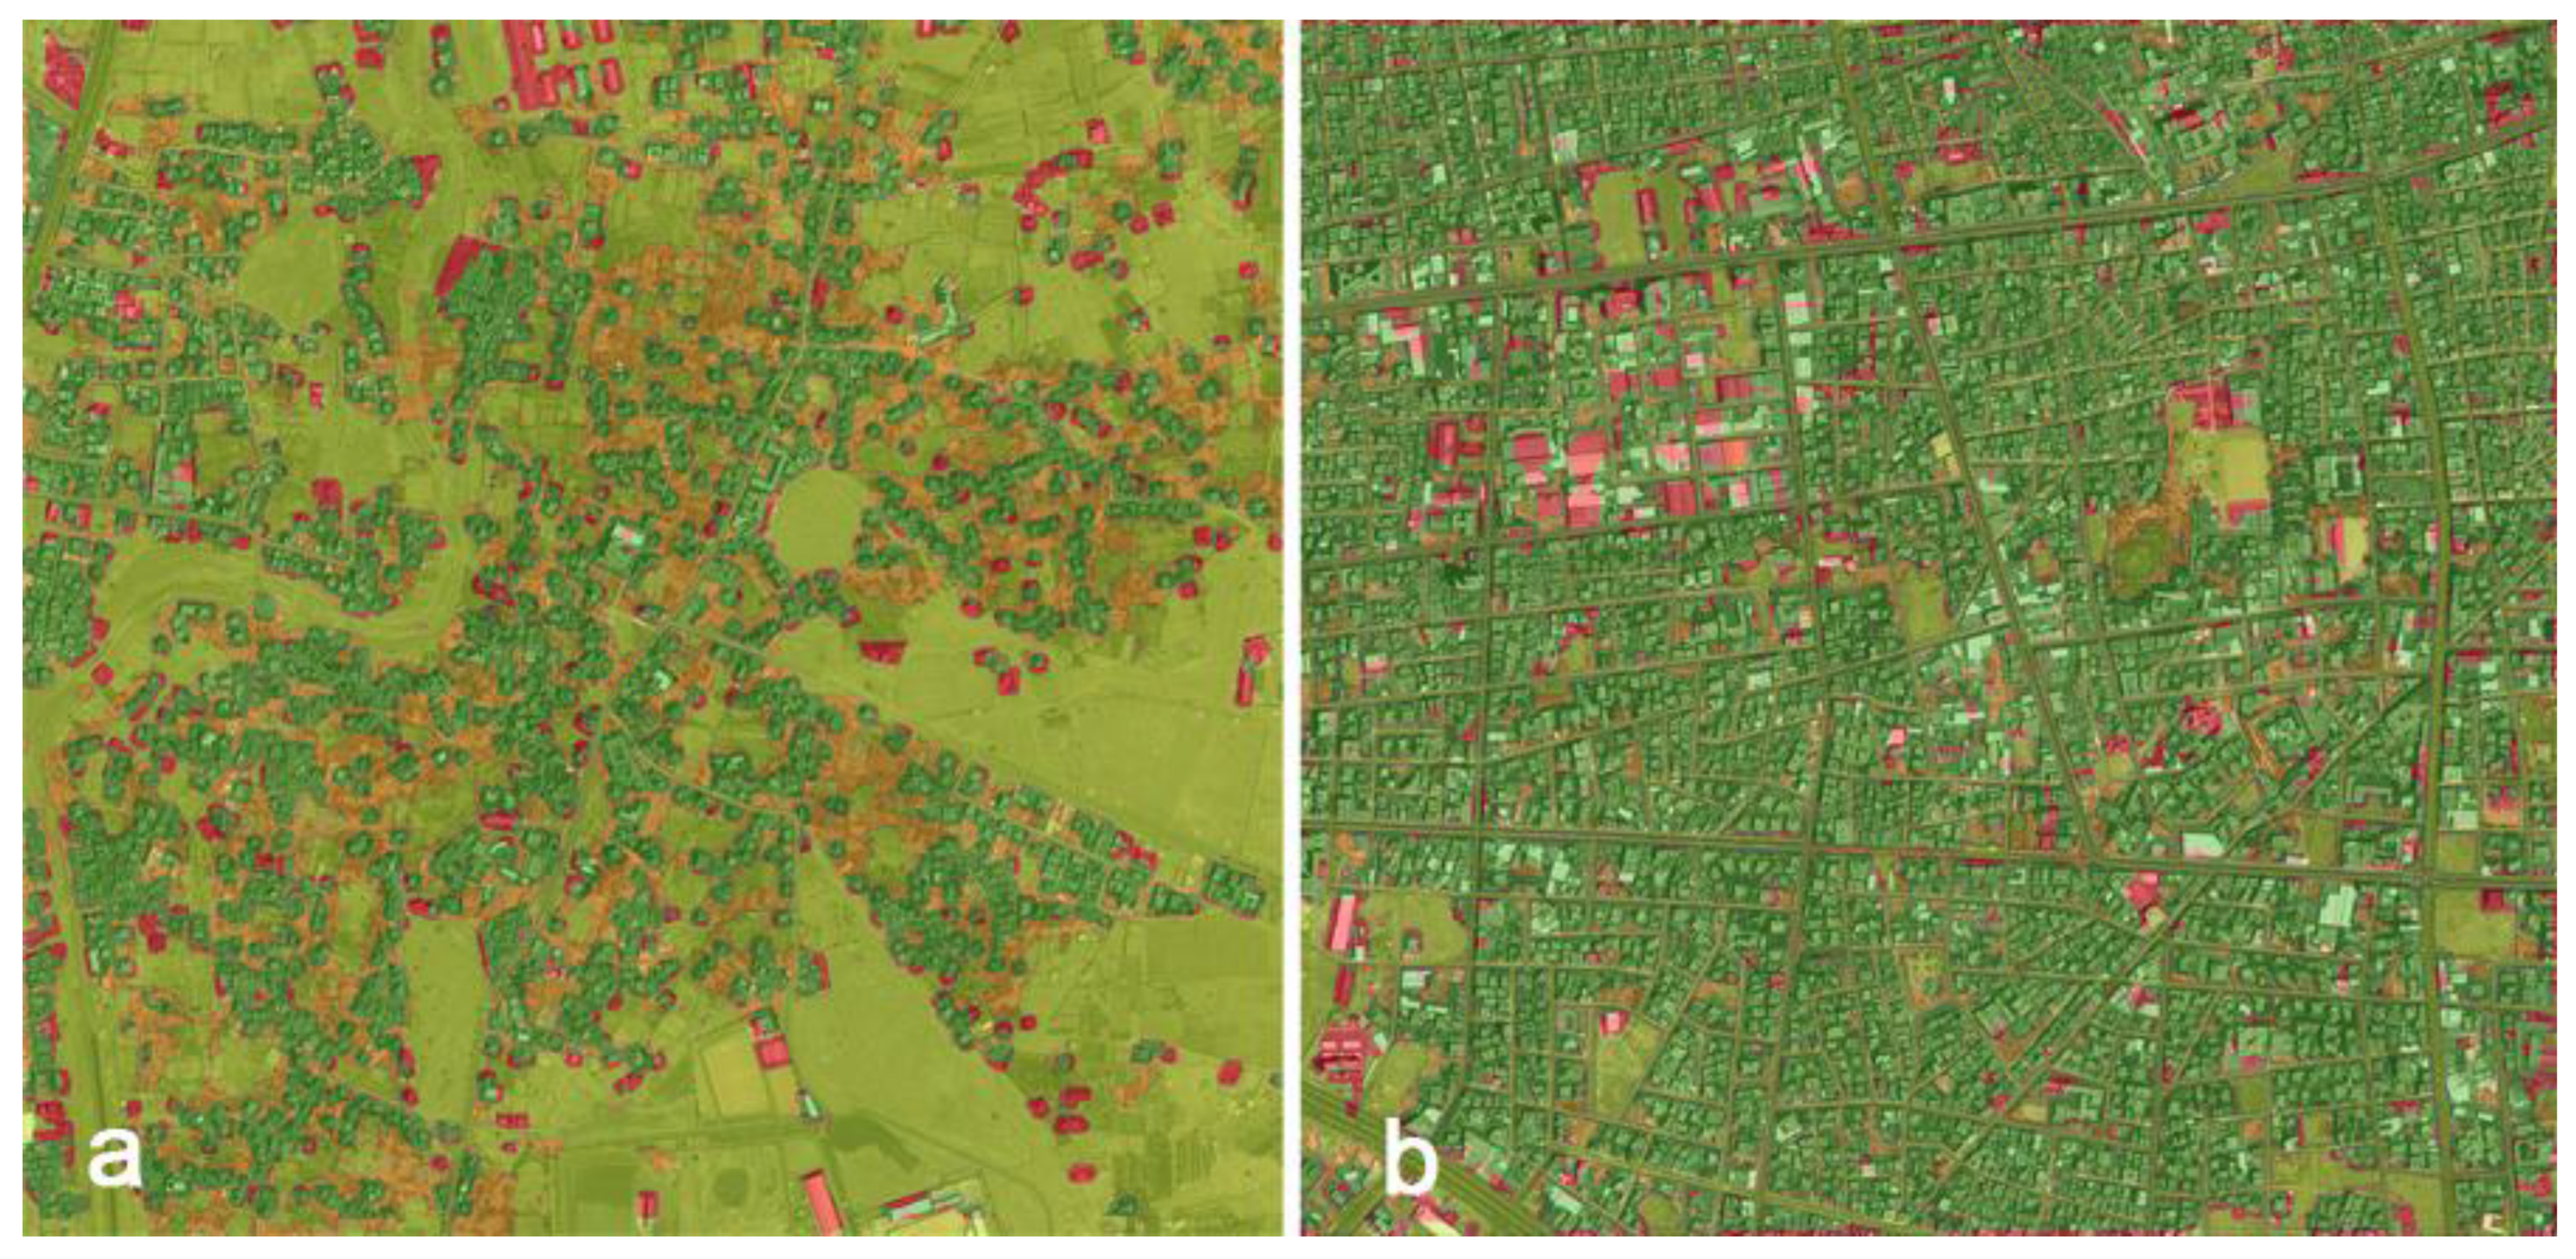
Figure 5 illustrates the reference data as well as the classification result for the two subset areas together with the satellite data showing the built-up areas in the background. The validation was based on two 2 × 2 km regions: (a) a dense urban area in the city centre and (b) a rapidly growing area in the suburbs of Sana’a with a lower built-up density.
Table 2 presents the computed accuracies for the 2004 built-up information.
Table 2.
Validation results for the suburban and urban subset and overall for built-up (BU) and non-built-up (NBU) urban classes, extracted from the Quickbird imagery of 2004.
Table 2.
Validation results for the suburban and urban subset and overall for built-up (BU) and non-built-up (NBU) urban classes, extracted from the Quickbird imagery of 2004.
| | Suburban Subset | Urban Subset | Total |
|---|
| | NBU | BU | NBU | BU | NBU | BU |
|---|
| Overall Accuracy [%] | 76.27 | 90.11 | 82.04 |
| Kappa Coefficient | 0.51 | 0.78 | 0.64 |
| Producer Accuracy [%] | 90.39 | 59.44 | 75.82 | 99.12 | 85.48 | 78.88 |
| User Accuracy [%] | 72.65 | 83.85 | 98.19 | 86.67 | 78.77 | 85.57 |
The classification accuracy of the Quickbird scene varied by area (
Table 2), with the suburban subset having a high omission error of 40.56 % (
Figure 5a), while the urban built-up area had the highest classification accuracy (
Figure 5b,
Table 2).
The overall computed classification accuracy of 82.04 % and a kappa coefficient of 0.64 for the two urban areas for the Quickbird scene are considered to be in moderate agreement.
These accuracy measures must be considered when analysing the development of population density per built-up region, especially for the suburban areas. High errors of omission would increase population density values, whereas high errors of commission would reduce the population density respectively.
Figure 5.
Suburban (a) and urban (b) subsets from Quickbird (2004) showing correctly classified built-up (BU) (dark green) and non-built-up (NBU) (light green) areas. Errors of omission are presented in (red) and errors of commission in (orange).
Figure 5.
Suburban (a) and urban (b) subsets from Quickbird (2004) showing correctly classified built-up (BU) (dark green) and non-built-up (NBU) (light green) areas. Errors of omission are presented in (red) and errors of commission in (orange).
5.2. Urban Expansion and Changes in Building Density
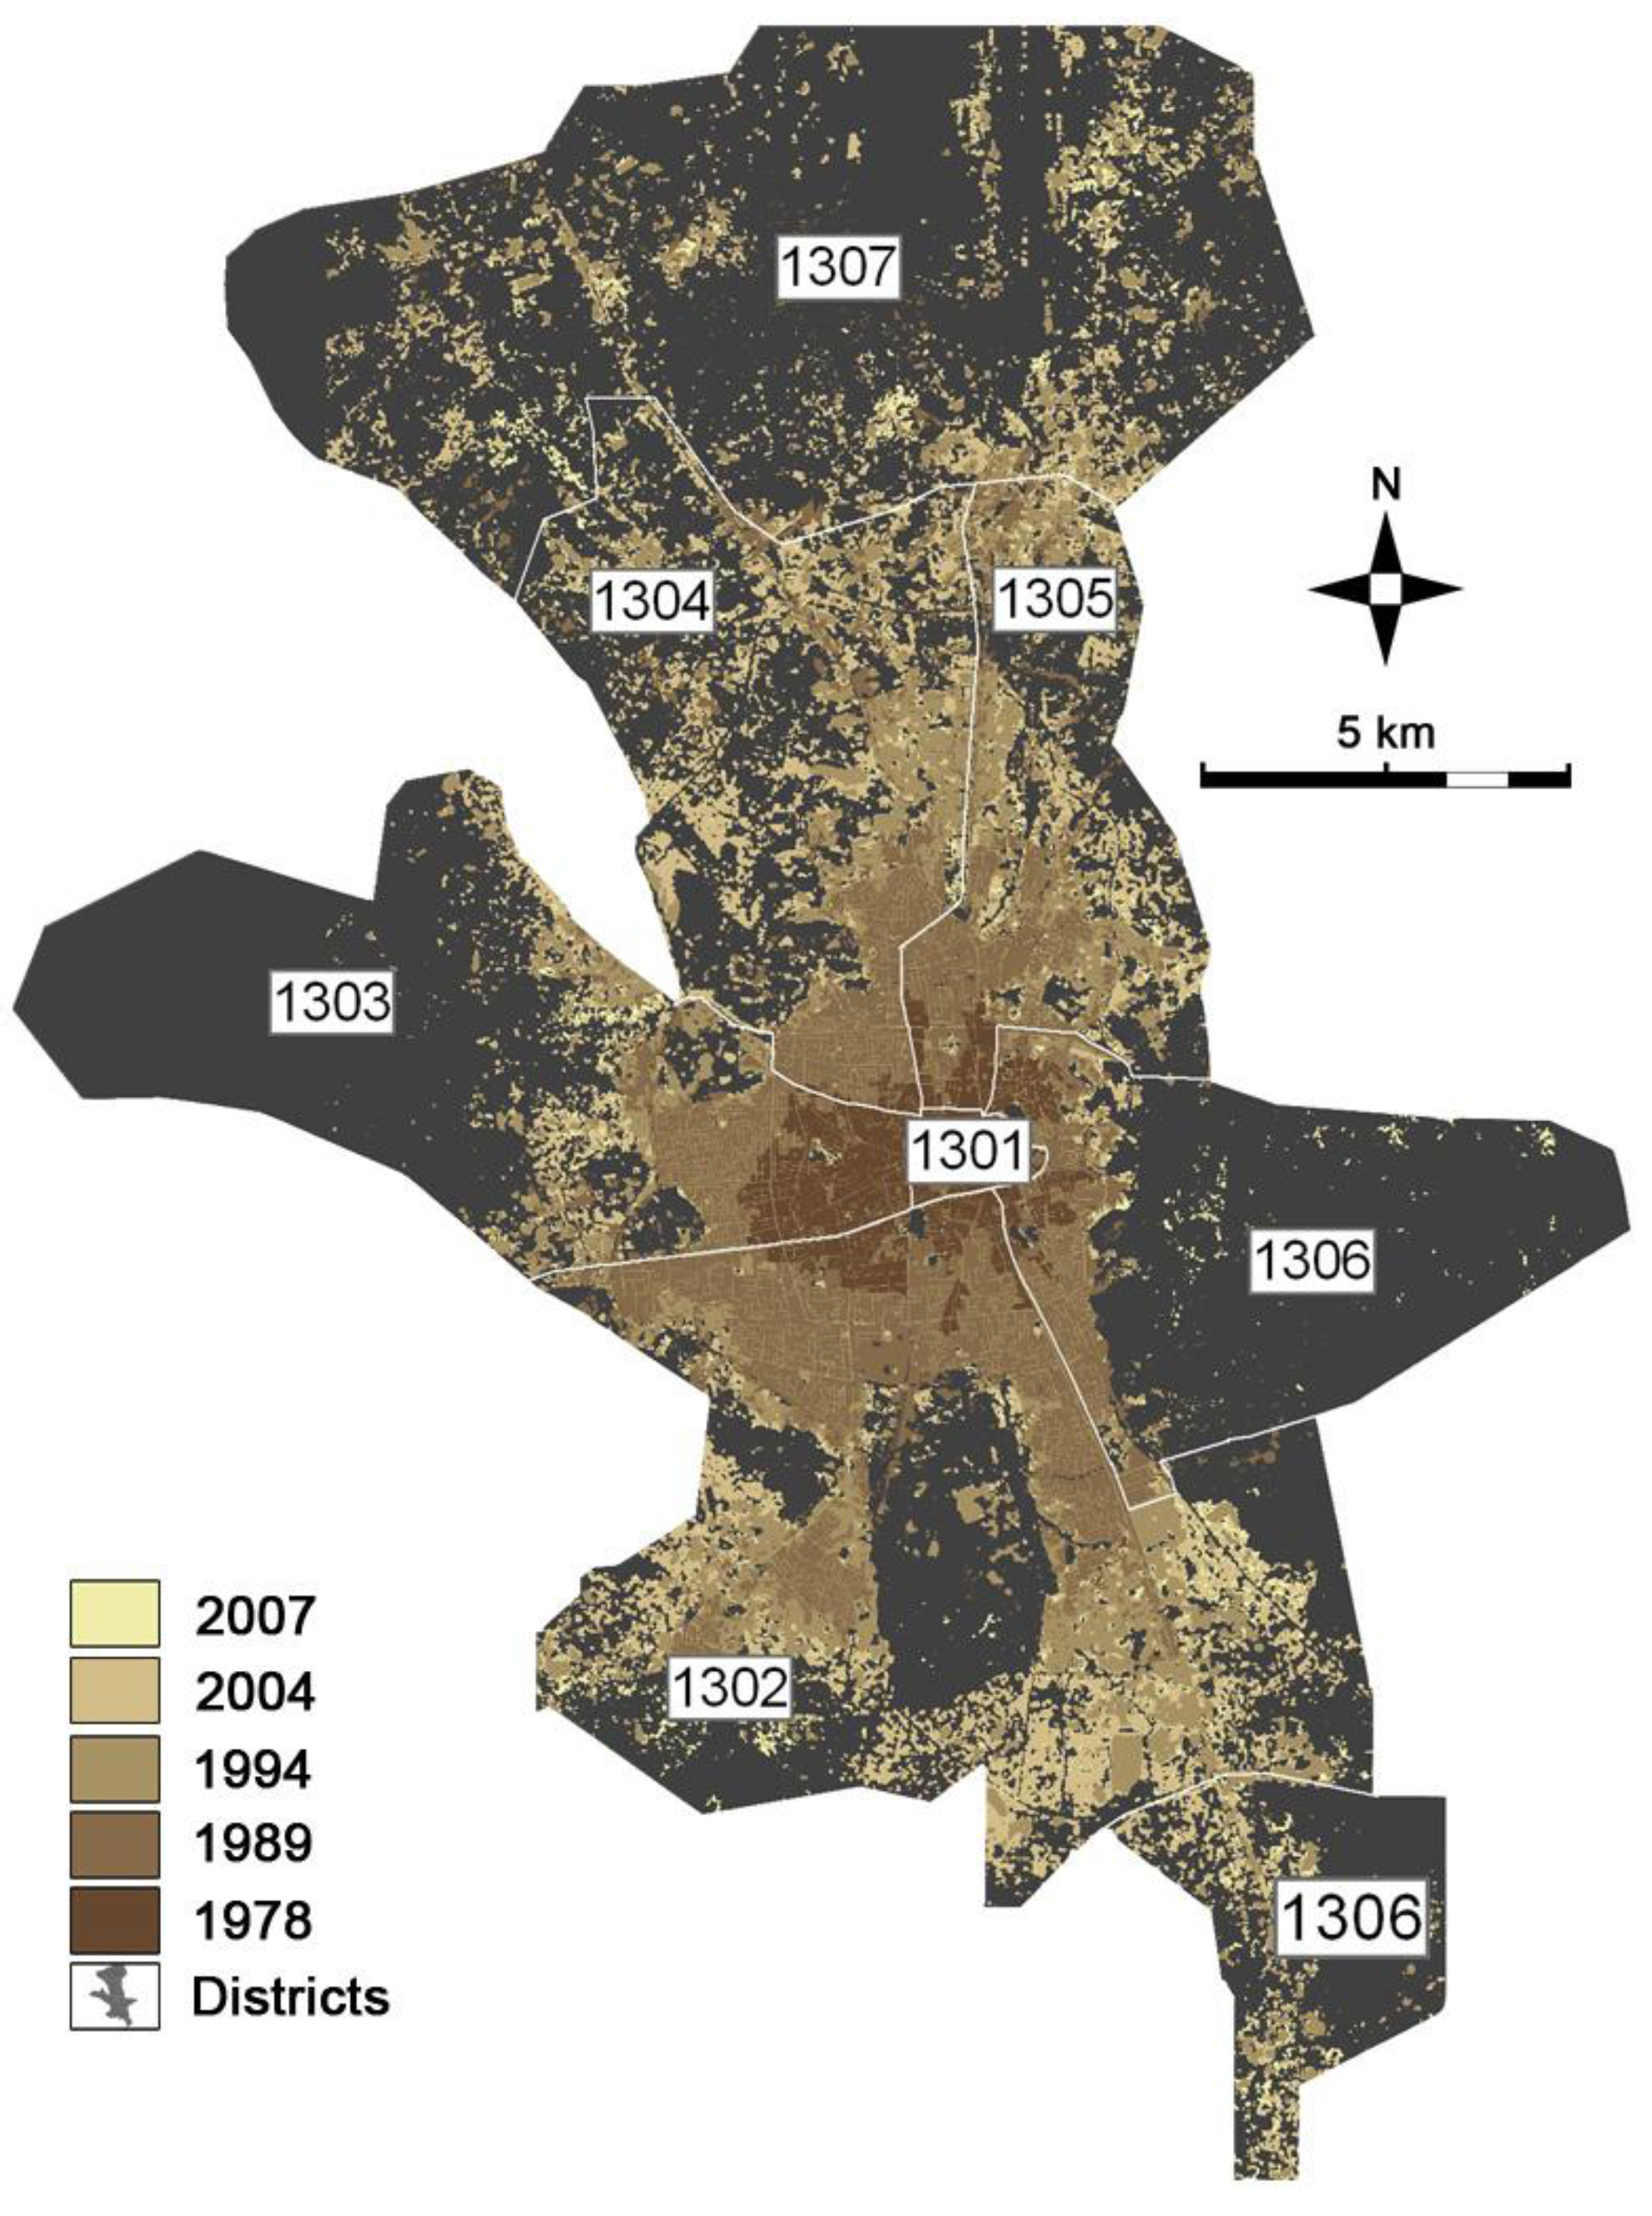
Urban expansion from 1978 through 2007 occurred in all districts (
Figure 6). Changes in urban expansion were only measured on the remotely sensed images acquired in 1994 (SPOT 3), 2004 (Quickbird), and 2007 (SPOT 5) because the same urban area mapping method was used in all cases.
Table 3 presents the computed statistics for urban expansion and population growth in Sana’a. Values for the built-up area of 1989 and the built-up growth between 1989 and 1994 are approximated. As described in
Section 4.2, the urban built-up area mask was computed by interactively stretching the composite image. The stretching thresholds were set so that the built-up mask corresponded best to the urban area of the underlying image. From 1994 to 2007, the city’s urban expanse increased from 49 km
2 to 65 km
2 which is equal to a 30 % increase over thirteen years.
City expansion was restricted in the East and West of Sana’a due to mountain ranges and consequently, construction of new buildings is being forced onto the unstable hills to the East and West of the city (see also
Figure 2 and
Figure 6). The city has expanded in all districts, except the Old City (district 1301) (
Table 4). This is most likely because the district is already very compact, leaving little space for new developments. The minor differences in the urban areas in the Old City district are more likely due to computational uncertainty of the PanTex statistics, given the different remotely sensed input images. These differences resulted in negative urban expansion for this district but the differences are slight and rather point towards issues with the applied methodology that must be accounted for when analysing urban expansion. The consistent urban area measures for the Old City are contrary to the increasing population figures obtained for the years under study (see
Table 5).
Table 3.
Summary statistics of built-up and population growth for Sana’a. The baseline year is 1989. The built-up area of 1989 and built-up growth between 1989 and 1994 are approximated. Due to a different method for computing the urban areas, values cannot be compared directly.
Table 3.
Summary statistics of built-up and population growth for Sana’a. The baseline year is 1989. The built-up area of 1989 and built-up growth between 1989 and 1994 are approximated. Due to a different method for computing the urban areas, values cannot be compared directly.
| Year | Built-up Area (km2) | Built-up Growth (%) | Annual Built-up Growth (%) | Population | Population Growth (%) | Annual Population Growth (%) |
|---|
| 1989 | 35 (approx.) | - | - | 559,584 | - | - |
| 1994 | 49.6 | 42 (approx.) | 7 (approx.) | 782,506 | 39.8 | 6.9 |
| 2004 | 55.9 | 12.7 | 1.2 | 1,557,002 | 98.9 | 7.1 |
| 2007 | 65.4 | 16.9 | 5.4 | 1,922,266 | 23.46 | 7.3 |
Table 4.
Sana’a urban expansion statistics (1994–2007).
Table 4.
Sana’a urban expansion statistics (1994–2007).
| | | Built-up Area Per District [km2] |
|---|
| Sensor | Year | 1301 | 1302 | 1303 | 1304 | 1305 | 1306 | 1307 | Total |
|---|
| SPOT 3 | 1994 | 1.41 | 18.44 | 6.85 | 7.8 | 7.5 | 4.02 | 3.57 | 49.59 |
| Quickbird | 2004 | 1.31 | 20.27 | 7.07 | 9.2 | 8.4 | 5.51 | 4.21 | 55.97 |
| SPOT 5 | 2007 | 1.32 | 25.47 | 8.44 | 10.42 | 8.6 | 6.8 | 4.41 | 65.46 |
| abs. growth [km2] | 1994–2007 | −0.1 | 7.03 | 1.59 | 2.62 | 1.1 | 2.78 | 0.84 | 15.87 |
| perc. growth [%] | 1994–2007 | −6.38 | 38.12 | 23.22 | 33.59 | 14.67 | 69.15 | 25.53 | 32.0 |
Figure 6.
Urban expansion (1978–2007) and district map. Note that district 1306 consists of two sub-districts.
Figure 6.
Urban expansion (1978–2007) and district map. Note that district 1306 consists of two sub-districts.
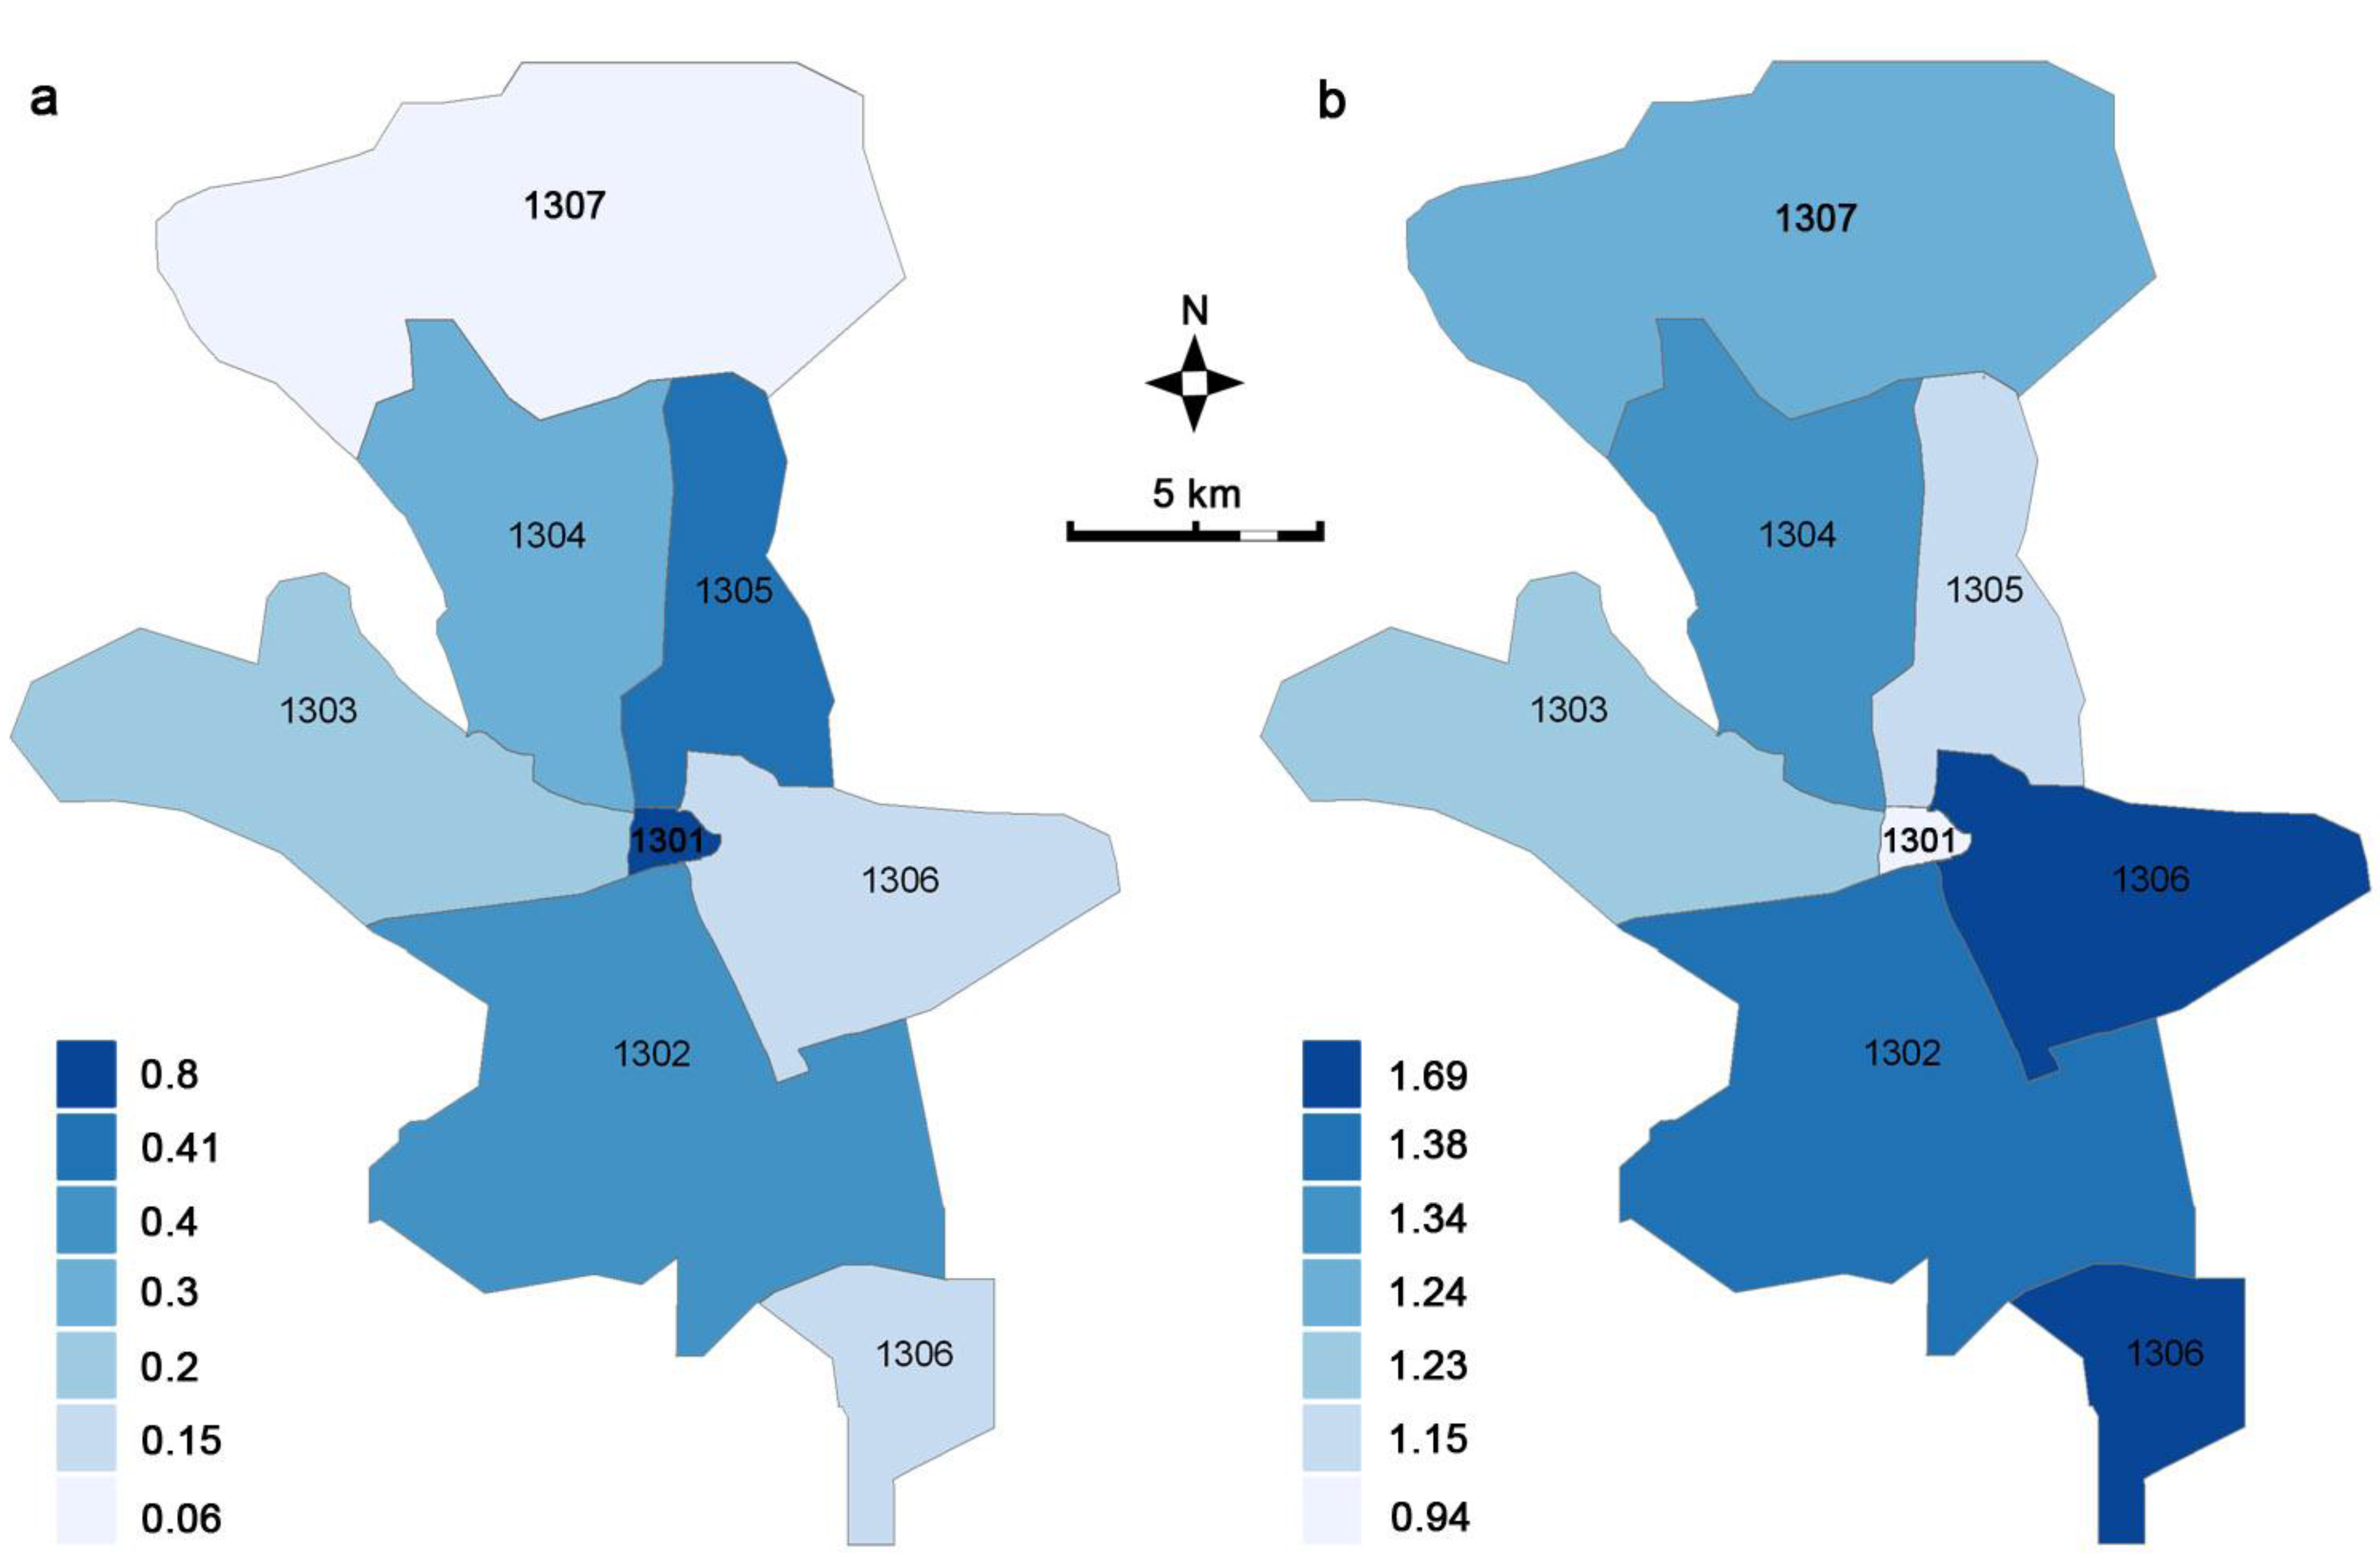
Figure 7.
Urban density [km2/district] in 2007, (a) changes in urban density by district between 1994 and 2007, (b) displayed as a ratio.
Figure 7.
Urban density [km2/district] in 2007, (a) changes in urban density by district between 1994 and 2007, (b) displayed as a ratio.
The density of built-up land in 2007 was highest in the Old City district (
Figure 7a), while the change in density from 1994 to 2007 was lowest in the Old City district, where little construction had occurred because of space restrictions. High expansion rates (change in density) occurred in the districts east and south of the Old City district (
Figure 7b).
5.3. Population Distribution and Urban Expansion
Census figures show that the total population within the selected areas of interest (districts ID 1301, ID 1302, ID 1303, ID 1304, ID 1305, ID 1306, ID 1307, see
Figure 6) grew by 774,496 people (98 %) between 1994 and 2004. Assuming average geometric growth, the population for the years 1989 and 2007 was computed as 559,584 and 1,922,266 people, respectively. This results in growth of 240 % over 18 years. For a better understanding of the computed population figures, analysis was also done per district.
In
Table 5, population numbers for each district and their change over time are listed. For 2007, the most populated district was found in the south (ID 1302) with 532,524 inhabitants, followed by ID 1303 towards the north-west of the city with 404,950 people. The least populated district was in the Old City centre (ID 1301), with 66,853 people. Compared to 1989, these population numbers have changed significantly. In 1989, most of the city’s population (137,329) was found to the south of the Old City (ID 1302), followed by the eastern and southern districts of ID 1306 (121,590) and the western district of ID 1303 (121,378). The lowest population figures were found in the very north, with only 14,763 inhabitants (ID 1307).
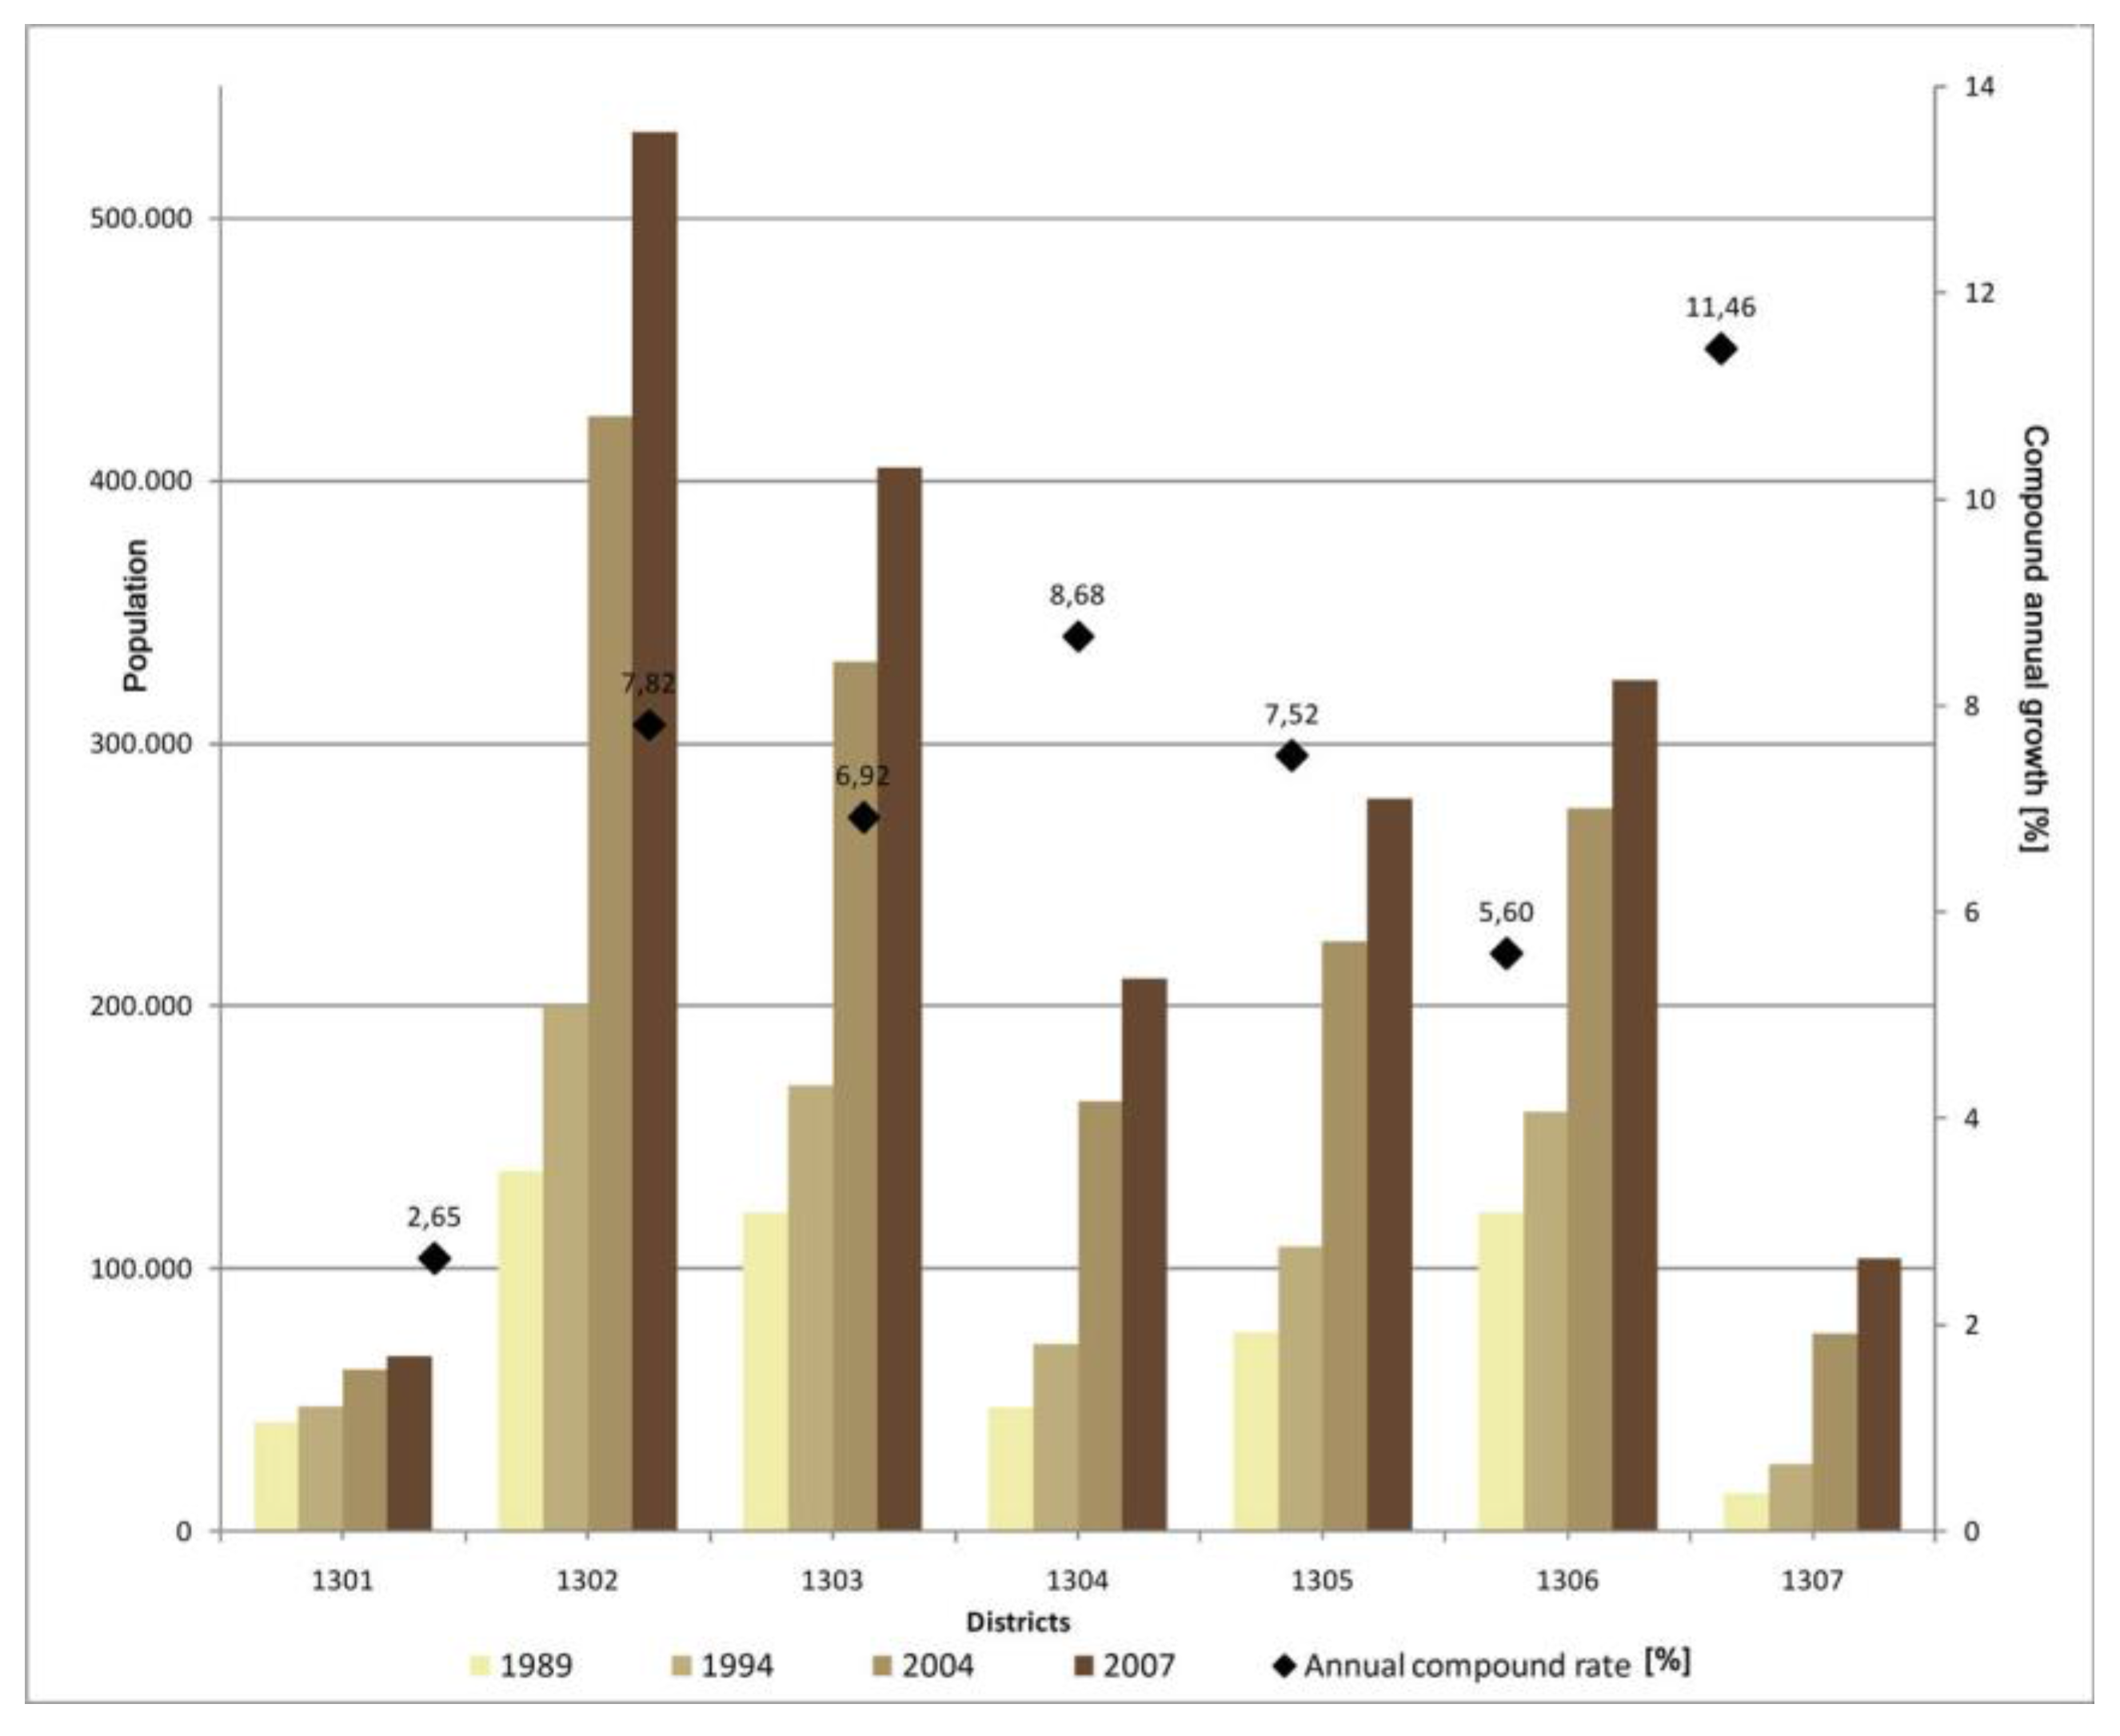
Based on these observations, a distinct movement of people between 1989 and 2007 from the centrally located districts towards the peripheral districts in the North (ID 1307) (cumulative growth of 605 %), the North-West (cumulative growth of 347%), South-West (cumulative growth of 287%) and the North-East (cumulative growth of 268%) can be identified. This spatial trend was also influenced by major economic growth and infrastructure developments in the peripheral areas of Sana’a in recent years. The least population growth was observed in the Old City (60%). The population changes for the different districts of Sana’a between 1989 and 2007, together with the compound annual growth rates, are illustrated in
Figure 8.
Table 5.
Population growth and urban expansion rates for the districts of interest between 1989 and 2007.
Table 5.
Population growth and urban expansion rates for the districts of interest between 1989 and 2007.
| | Districts |
|---|
| | 1301 | 1302 | 1303 | 1304 | 1305 | 1306 | 1307 | Total |
|---|
| 1989 | 41,782 | 137,329 | 121,378 | 47,049 | 75,690 | 121,590 | 14,763 | 559,584 |
| 1994 | 47,610 | 200,105 | 169,626 | 71,327 | 108,760 | 159 678 | 25,400 | 782,506 |
| 2004 | 61,816 | 424,858 | 331,278 | 163,928 | 224,558 | 275,383 | 75,181 | 1,557,002 |
| 2007 | 66,853 | 532,524 | 404,950 | 200,383 | 279,117 | 324,298 | 104,109 | 1,922,266 |
abs. Growth
1989–2007 | 25,070 | 395,194 | 283,572 | 163,363 | 203,427 | 202,708 | 89,345 | 1,362,681 |
cum. Growth [%]
1989–2007 | 60.0 | 287.77 | 233.63 | 347.22 | 268.76 | 166.71 | 605.17 | 243.52 |
| Compound Annual Growth Rate [%] | 2.65 | 7.82 | 6.92 | 8.67 | 7.52 | 5.60 | 11.46 | 7.12 |
Figure 8.
Population growth between 1989 and 2007 per district together with the compound annual growth rates.
Figure 8.
Population growth between 1989 and 2007 per district together with the compound annual growth rates.
5.4. Population Density
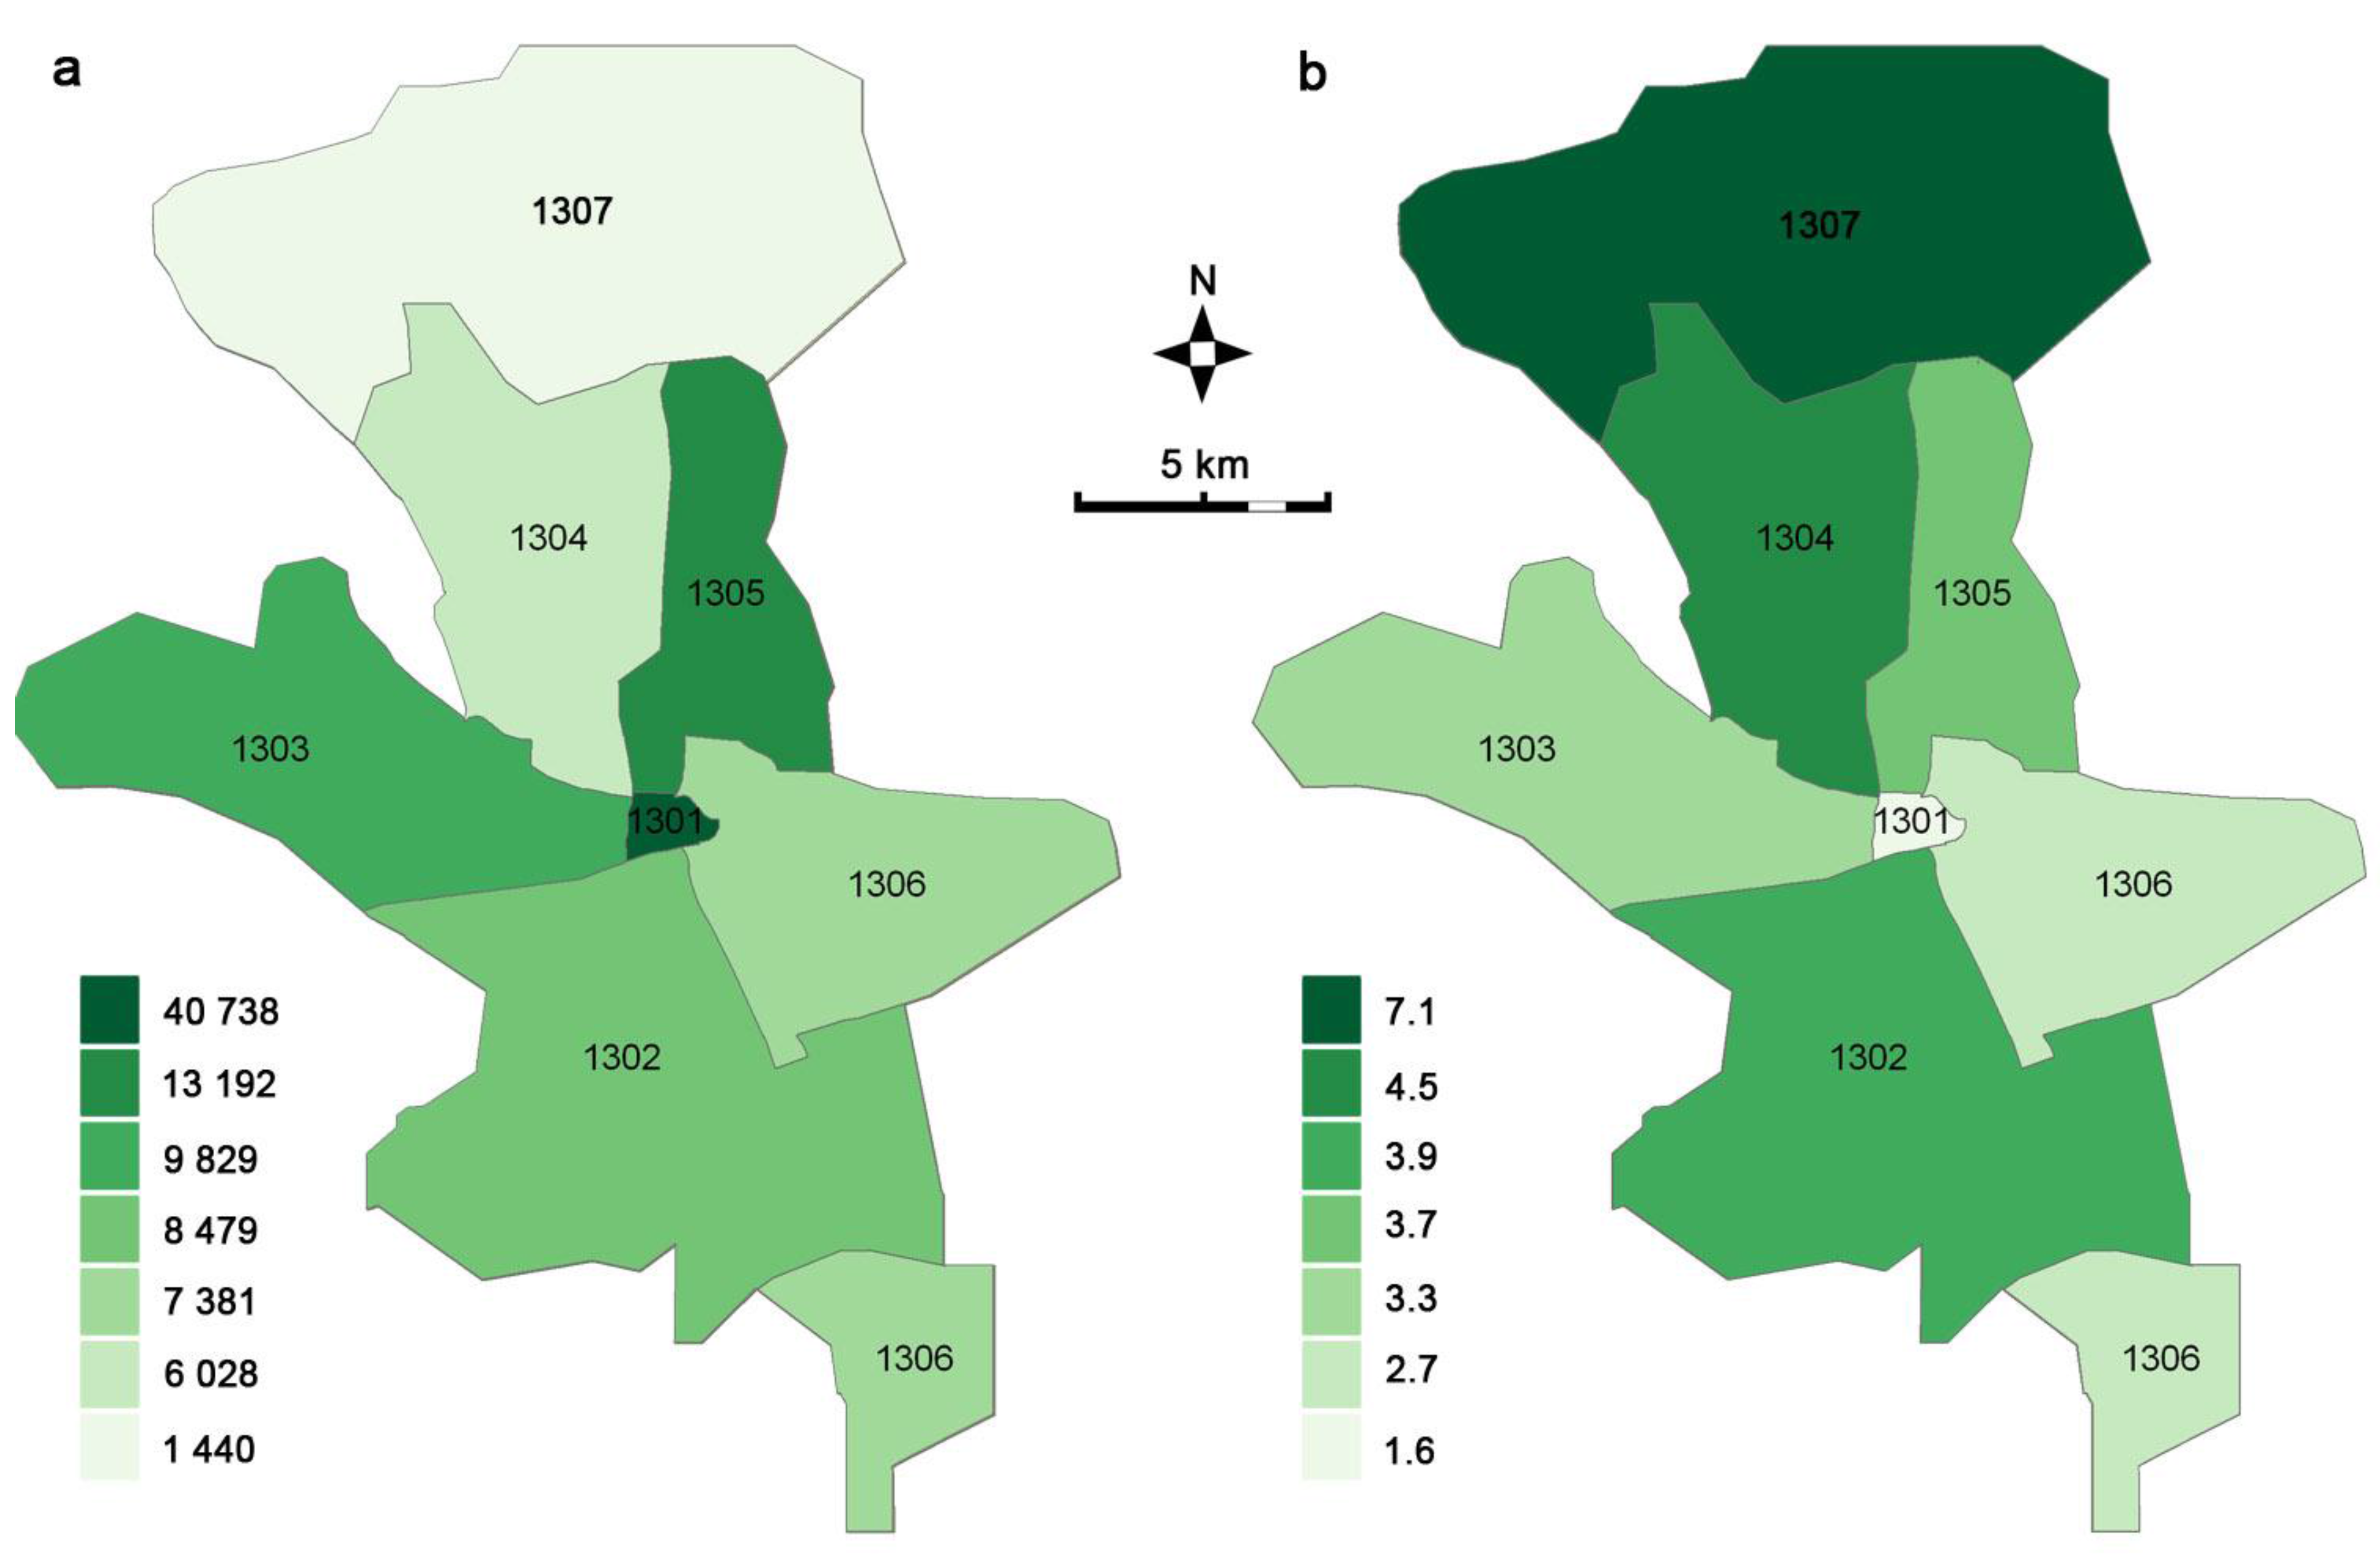
Population density per district (
Figure 9a) and the changes in population density per district (
Figure 9b) were analysed for the time period between 1994 and 2007. Sequential coding of the population densities ranges from light green (low) to dark green (high). As illustrated in
Table 6, the highest population density in 2007 was found in the city centre (ID 1301), with 40,738 people per km
2, followed by ID 1305 in the North-East with 13,192 people per km
2 and ID 1303 towards the West (9,829 people per km
2). The lowest population density was found in the very North (ID 1307) with 1,440 people per km
2.
All city districts saw an increase in population density for the period between 1994 and 2007.
Figure 9b presents this data as a ratio between 1994 and 2007, which shows that the biggest change in population density took place in the least populated area in the very North (ID 1307), followed by the North-west (ID 1304), and the South (ID 1302), both districts with average population densities. The least population density growth occurred in the East and South of ID 1306 and the West (ID 1303).
Figure 9.
Population density per district [Population / km2] for 2007 (a) and changes of population density per district between 2007 and 1994, displayed as ratio (b).
Figure 9.
Population density per district [Population / km2] for 2007 (a) and changes of population density per district between 2007 and 1994, displayed as ratio (b).
Table 6.
Population density per district and population density per built-up area of each district for the years 1994 and 2007.
Table 6.
Population density per district and population density per built-up area of each district for the years 1994 and 2007.
| Districts | Population density per district [Pop/km2] | Population density per built-up area of district [Pop/km2] |
|---|
| | 1994 | 2007 | 1994 | 2007 |
| 1301 | 29,030 | 40,738 | 33,765 | 50,646 |
| 1302 | 3,186 | 8,479 | 10,851 | 20,907 |
| 1303 | 4,117 | 9,829 | 24,765 | 47,979 |
| 1304 | 2,043 | 6,028 | 9,144 | 20,193 |
| 1305 | 5,130 | 13,192 | 14,501 | 32,455 |
| 1306 | 3,637 | 7,381 | 39,720 | 47,690 |
| 1307 | 351 | 1,440 | 7,114 | 23,607 |
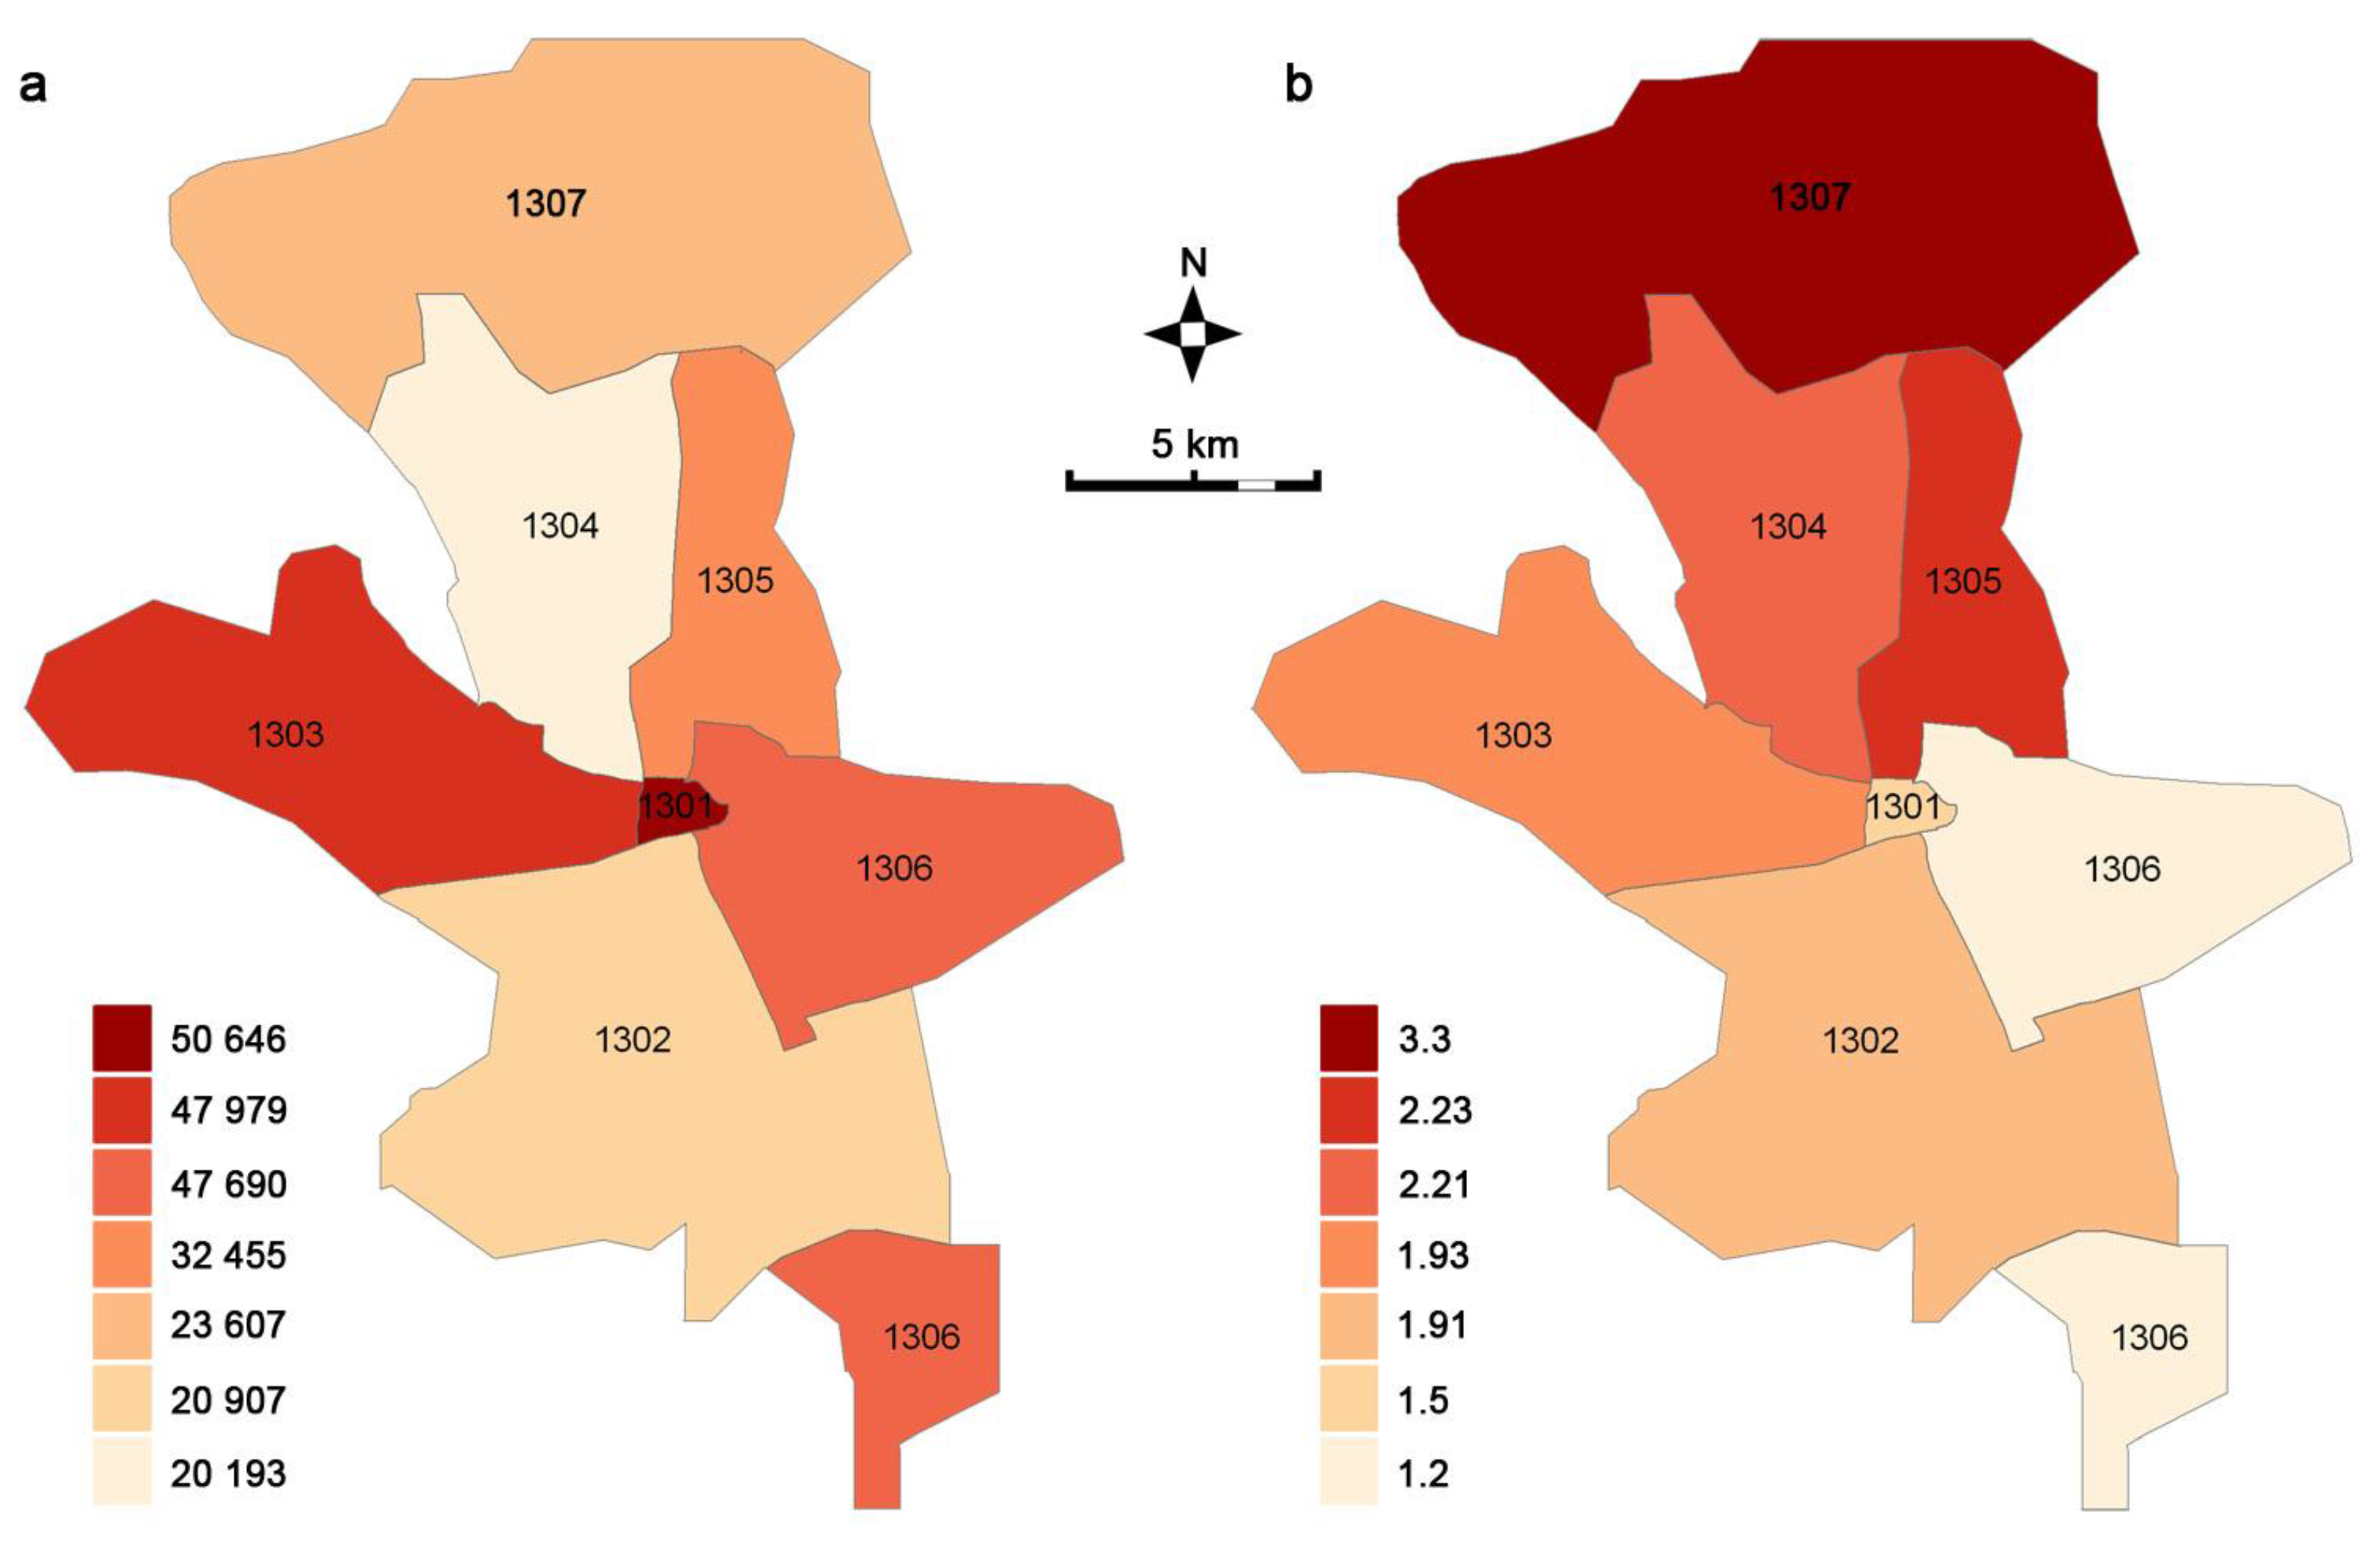
As explained in the methodology section, population density per administrative unit area is normally calculated taking into consideration uninhabited land such as open spaces. An improved population density can be computed regarding only the places where people actually live,
i.e., the population density based on inhabited area. This was taken into account when the city’s population densities were re-calculated based on the built-up areas. Thus the highest population density per built-up area is found in the Old City (ID 1301), with 50,646 people per km
2 built-up land, followed by the western district (ID 1303), with 47,979 people per km
2 built-up land. Lowest population numbers per km
2 built-up land are found in the north-western district (ID 1304) (see also
Figure 10a).
Figure 10.
Population density per built-up area of each district [Population / km2] for 2007 (a), and changes of population density per built-up area of each district between 2007 and 1994 displayed as ratio (b).
Figure 10.
Population density per built-up area of each district [Population / km2] for 2007 (a), and changes of population density per built-up area of each district between 2007 and 1994 displayed as ratio (b).
The dynamics of density changes between 1994 and 2007 are shown in
Figure 10b. The highest increase in population density can be found again in the northern periphery (ID 1307) followed by the two other northern districts (ID 1304 and ID 1305). The Old City (ID 1301), the East and the South-East (ID 1306, ID 1302) experienced the least changes in population density.
5.5. Analysing the Relationship between Changes to Urban Expanse and Population
The relationship between changes to urban expanse and population has been known for some time [
30] and is a logical conclusion considering the fact that an increasing population within an urban environment requires space for living.
Figure 11 and
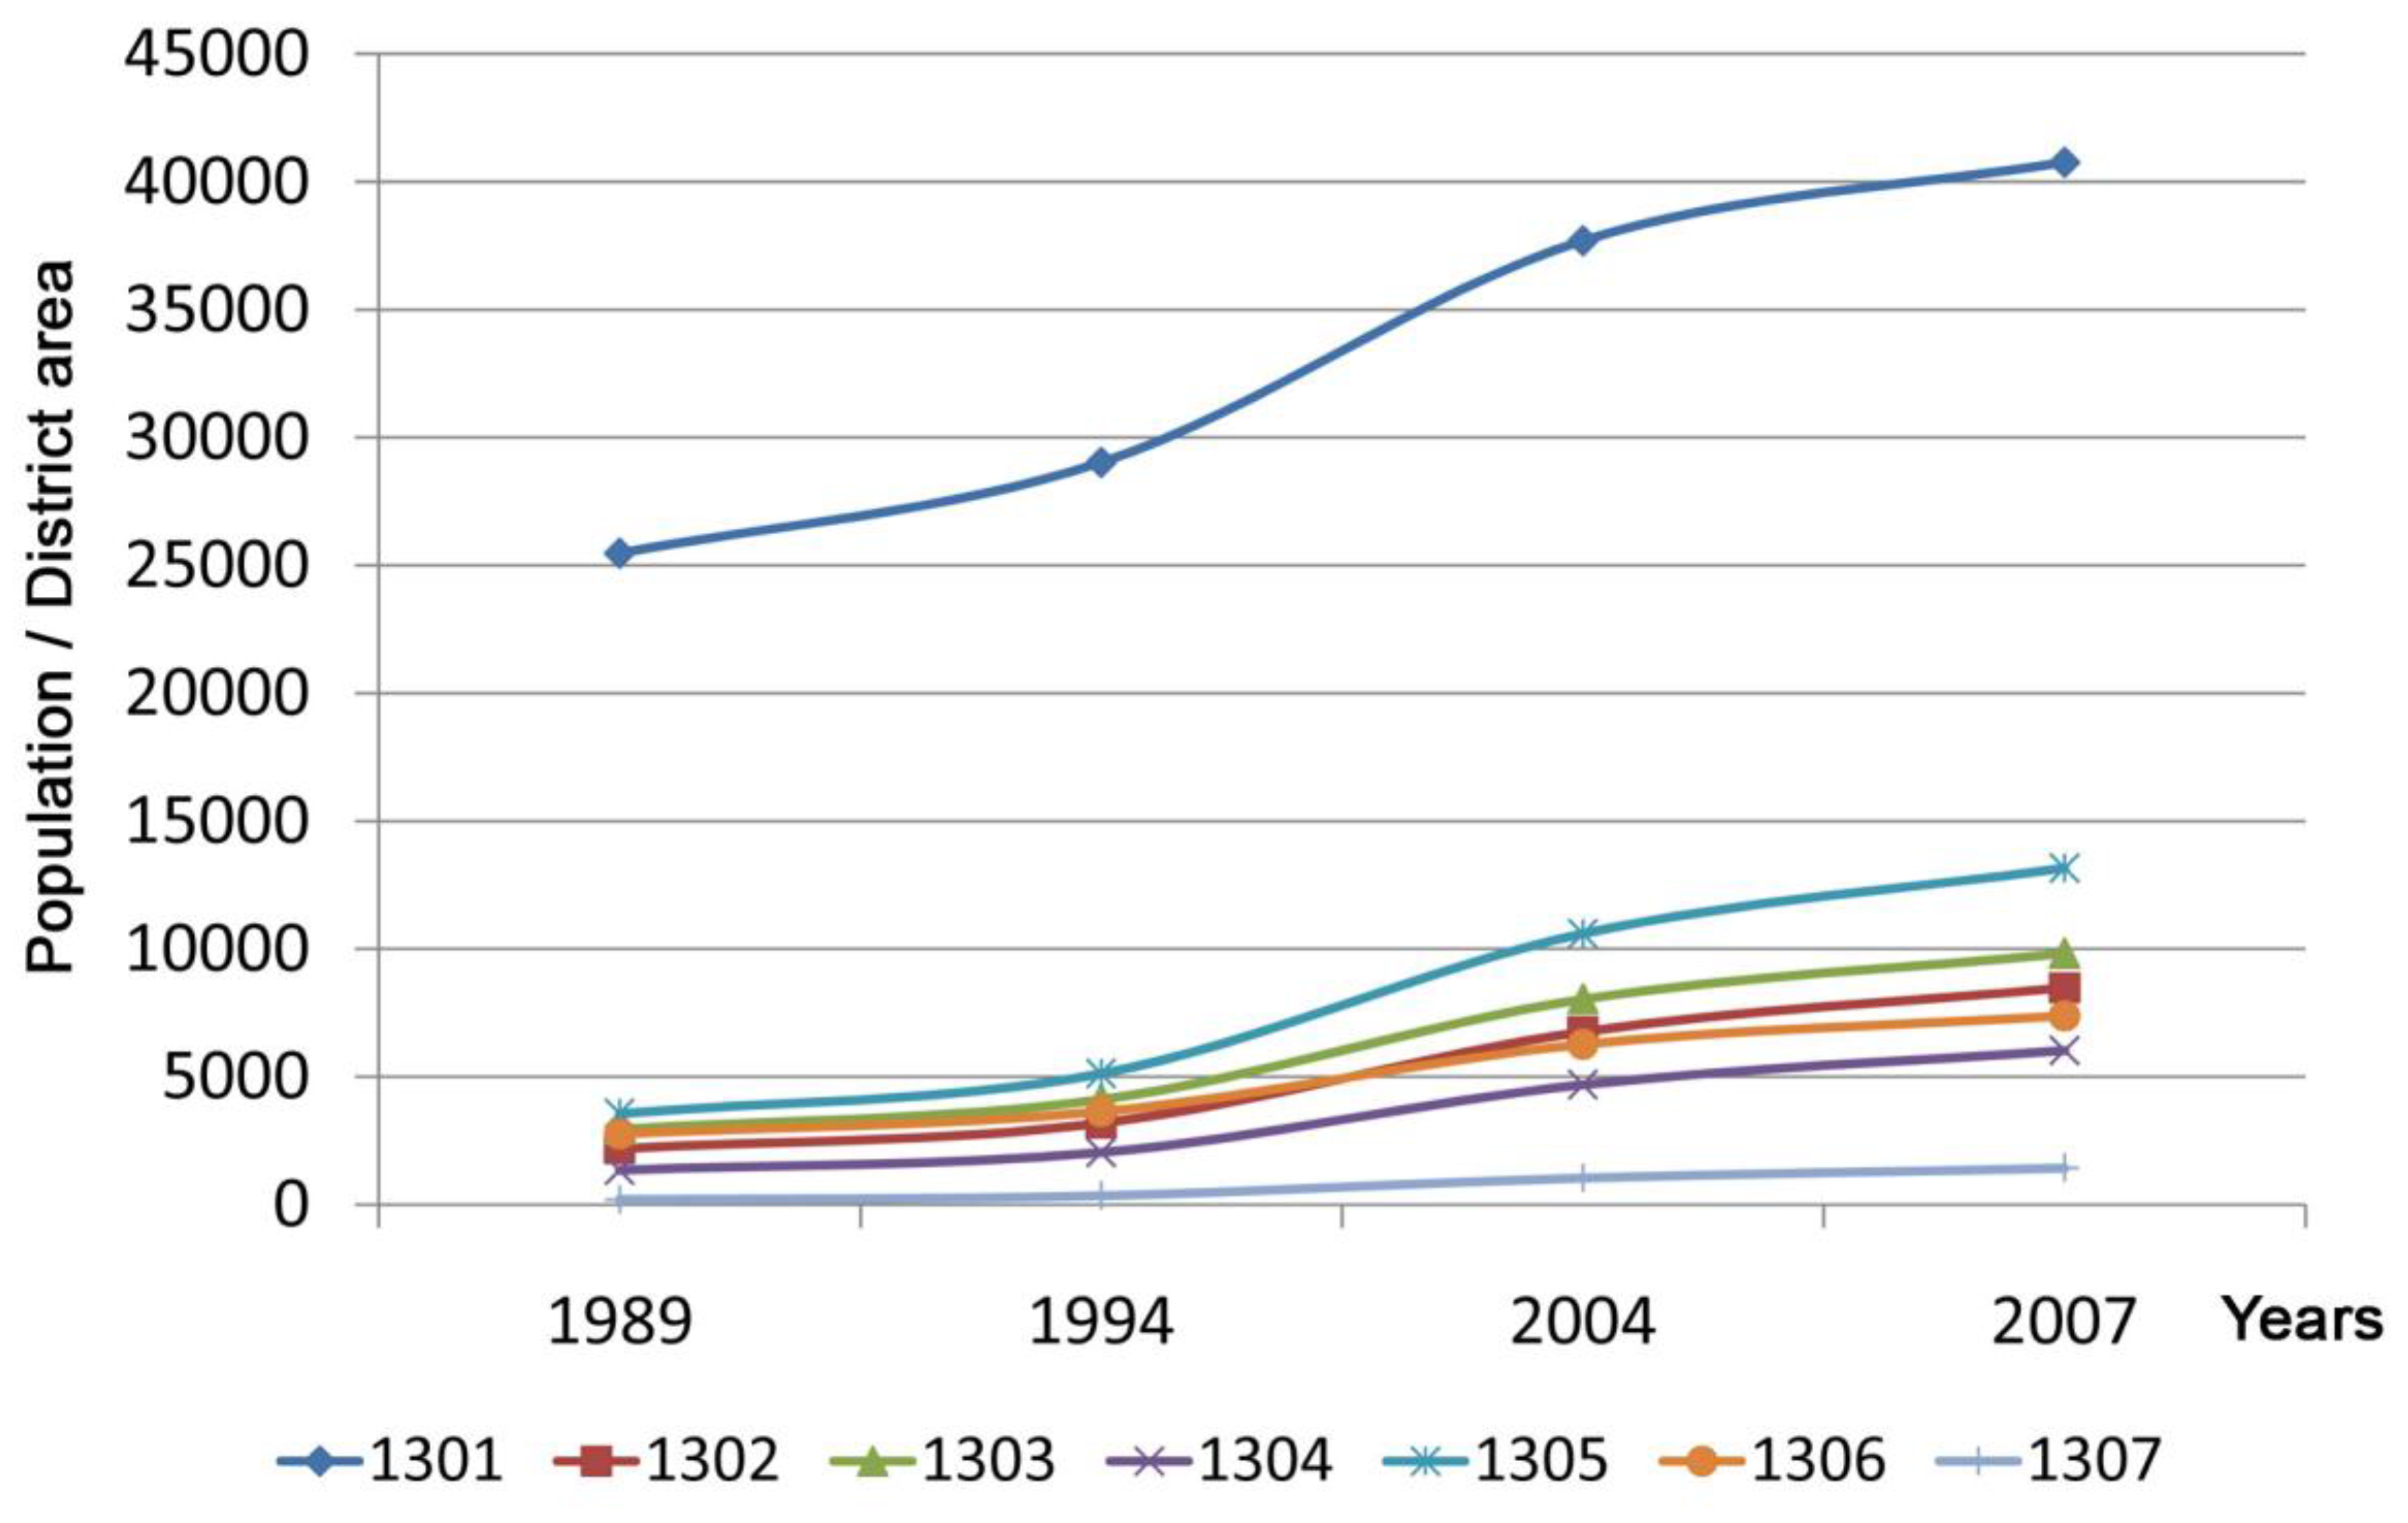
Figure 12 present two scatterplots illustrating the changes of built-up area and population numbers, normalised by the district areas of Sana’a.
Figure 11.
Comparison of population densities and density change during the observed period per district. Each curve represents a district. The ordinate shows the observed period from 1989 to 2007. The abscissa indicates the number of people per district area [km2].
Figure 11.
Comparison of population densities and density change during the observed period per district. Each curve represents a district. The ordinate shows the observed period from 1989 to 2007. The abscissa indicates the number of people per district area [km2].
The computed population figures showed similar behaviour in all city districts. After a moderate population increase between 1989 and 1994, a period of strong growth was observed between 1994 and 2004. This period was followed by a reduction in population growth after 2004. Whereas the population evolution was similar within all city districts, the urban built-up expansion shows different patterns than population growth. As mentioned previously, the built-up area of the Old City (ID 1301) does not show significant differences in size, and the slight decrease in urban expanse could be explained by the different thresholds used in the PanTex methodology. The districts of ID 1302 and ID 1303 showed behaviour similar to the overall urban expansion trends. Until 1994, an increase was observed, followed by a flattening of urban growth until 2004 and another increase until 2007. The two districts found in the southern and western part of the city have a range of land uses, including both industrial and residential buildings. The reduced urban growth in ID 1303 could also be associated with the natural barrier of the western mountain ranges. The return to positive urban growth from 2004 onward could be explained by an increase in economic development and thus construction of industrial buildings in the western part of the city. The districts to the North-East and North (ID 1304, ID 1305 and ID 1307) show a similar growth pattern. All three districts have strong growth, which started to slow down from 2004 on. Very strong growth is observed for ID 1307 during the period from 1989 to 1994. As described above, the built-up area values for 1989 are approximated due to a different computing method of the built-up regions.
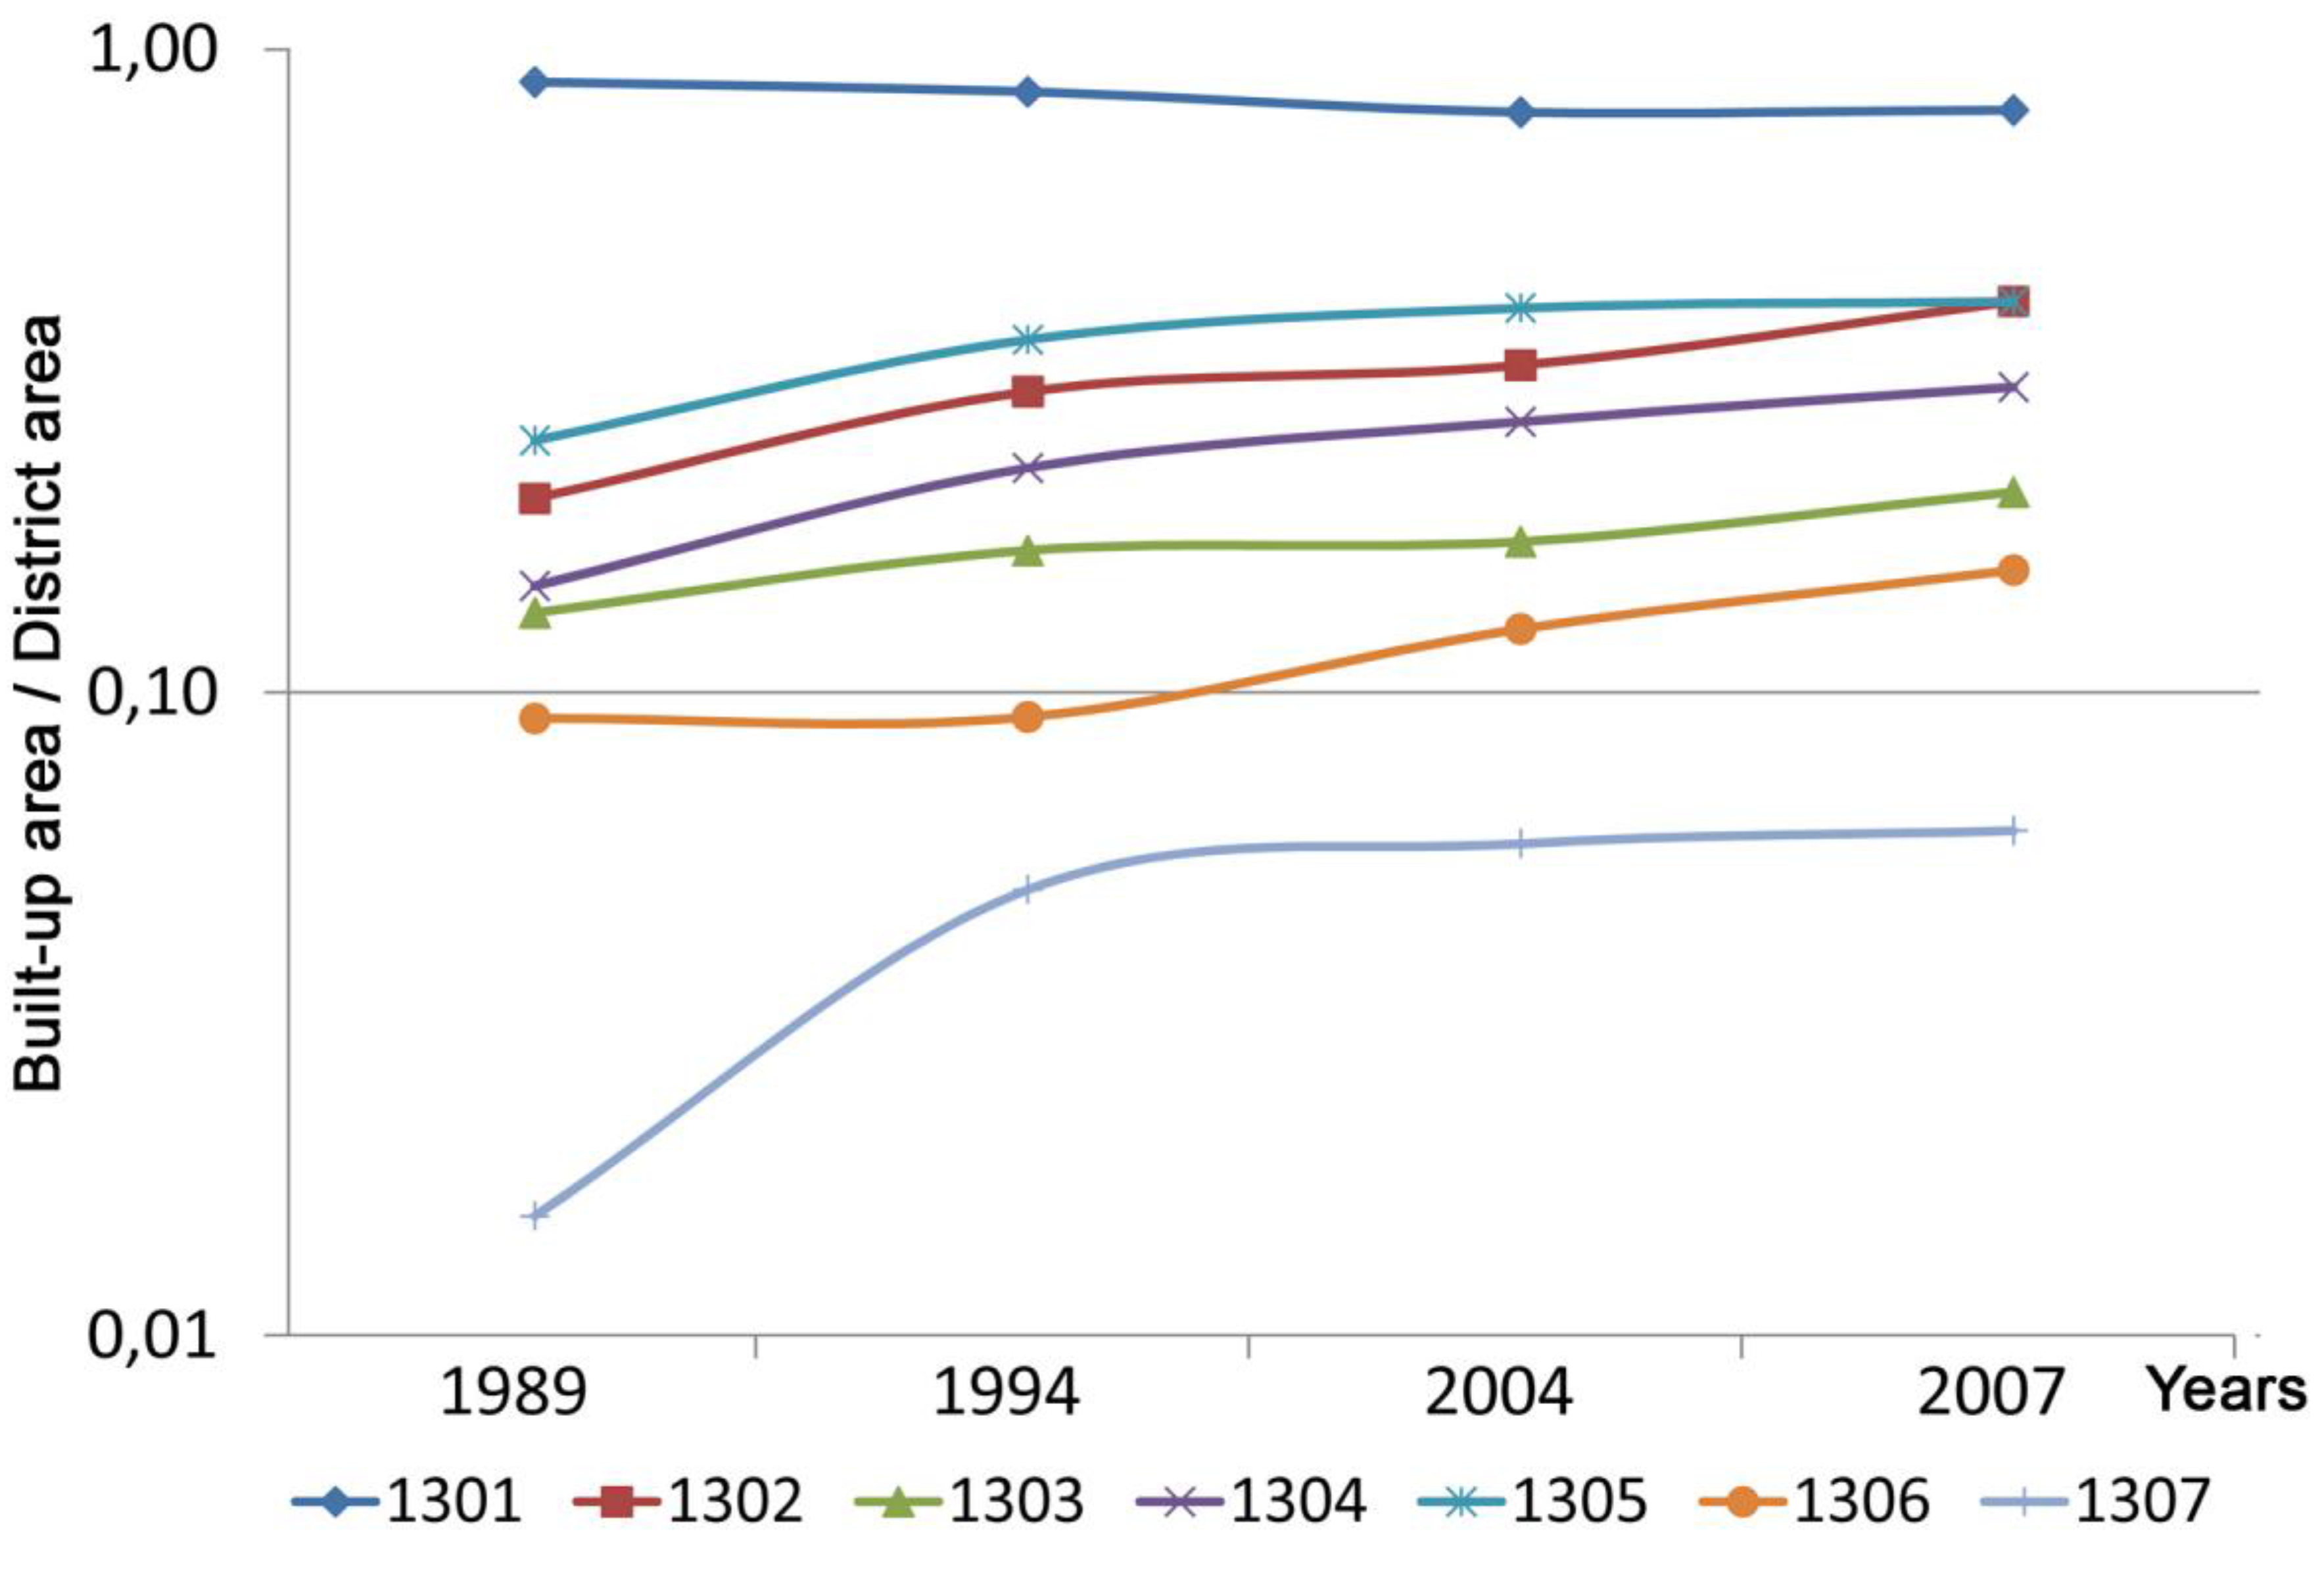
Figure 12.
Comparison of built-up densities and density change during the observed period per district. Each curve represents a district. The ordinate shows the observed period from 1989 to 2007. The abscissa indicates the built-up area per district area. A logarithmic scale was chosen to allow for a proportional comparison.
An exception to the above general trends was found in the East and South-East (ID 1306). For the first years investigated (see
Table 4), very little growth was observed. This increases substantially from 1994 to 2007. To properly interpret ID 1306, one must remember that it is subdivided into two sub-districts. The eastern part is adjacent to the high mountains. The most significant growth of ID 1306 took place in the south-eastern part of the district. To the south of the city, the landscape flattens and becomes the southern offshoot of the Sana’a plain, with more space for settlements. Another reason for the little population growth in that area during the first period under investigation is the difficulty to reach the city centre from that part of the city.
Explosive population growth puts pressure on a city and the demand for living space and therefore urban expansion is a normal consequence. However, during the period of strongest population growth in Sana’a, urban expansion actually slowed down. The European Environment Agency (EEA) [
39] reports many potential reasons for such a result for European cities, and many of these reasons can also be applied to the case of Sana’a. For example, an important construction period provides new living spaces that are first occupied before any further living space is constructed. Another possible reason for the observations made in the case of Sana’a could be the addition of floors to buildings. Other potential reasons include non-existent land use planning and/or insufficient infrastructure developments to the peripheral areas, or the high price of land. However, since more information is required to make such conclusions, in the context of the city of Sana’a they remain speculative and thus will not be examined further.
Based on the overall figures from the years 1989 to 2007, the amount of built-up land grew by almost 90 %, while population in the city grew by more than 240 %,
i.e., around 2.6 times the rate of built-up growth (
Figure 6 and
Table 3). This implies that the land is being urbanised at a slower rate than would be expected on the basis of population growth only, and indicates increasing population density and pressure.
6. Discussion and Conclusions
In this study the spatial expansion of the built-up area of the city of Sana’a from 1989 was analysed by means of remote sensing, GIS, and statistical data. An anisotropic textural procedure (PanTex) was successfully applied to a variety of very fine spatial resolution optical satellite imagery to delineate the built-up surface patterns. Statistical data were linked to the resulting built-up information using GIS. The PanTex method is robust to radiometric variances of the satellite data. Thus it can be applied to imagery from a variety of modern VHR sensors. For the successful delineation of a built-up mask based on the contrast between roofs, shadows, and background, satellite imagery is required with a spatial resolution that is equal or better than the dimensions of the discernable built-up objects. The definition of the final built-up mask is produced interactively, which is the only manual step in the processing sequence. However, as seen for district ID 1301, different thresholds can also lead to slightly deviating results when changes are subtle. Thus, ways of automatically choosing the threshold must be investigated in future research.
The resulting built-up masks represent areas with a high contrast to their surroundings. These contain not only buildings but also roads and lawns. In calculating population density figures, it has to be considered that the actual built-up area is smaller. Furthermore, being able to distinguish between business-, industrial- and residential buildings would also help improve the results. The PanTex method, however, is suitable for an overall delineation of urban sprawl.
This research investigated both the urban expansion as well as the population growth of the city of Sana’a, and the most affected areas were identified. The analysis showed significant increases in built-up land and population for all districts during the last 30 years. Spatial expansion generally took place along the main roads towards the North and South of Sana’a, then to the East and West because the mountains acted as natural barriers. By linking population and built-up data, it was possible to identify a variety of interrelations and dependencies between population and built-up area growth.
A detailed view shows different dynamics and patterns of built-up growth in the city districts. Investigating the relationship between population and built-up areas at such a fine spatial resolution shows that increases in population are not necessarily immediately followed by increases in built-up areas. Moreover, the different graphs in
Figure 11 and
Figure 12 demonstrated that a city such as Sana’a is a heterogeneous complex entity and its development is dependent on a variety of influencing factors. This research also shows the need for better socio-economic information on a per-district basis to properly interpret the observations and gain a comprehensive understanding of the relationships between population and built-up growth.
This study has demonstrated that remote sensing can be successfully used to monitor urban expansion. By integrating the latest available census data, urban population development can be monitored and linked to this valuable spatial context, providing a detailed and large-scale analysis of urban development and the fluctuations of a city’s inhabitants. The results provide detailed and important information on city and population growth and accordingly on growing densities and pressures. They may be a valuable tool for urban planning which can help provide sustainable livelihoods. Given increasing urban population figures worldwide, not only in the city of Sana’a but in many other cities, this information is badly needed.


