Article

Crop Type Mapping and Winter Wheat Yield Prediction Utilizing Sentinel-2: A Case Study from Upper Thracian Lowland, Bulgaria

1
Department of Remote Sensing and GIS, Space Research and Technology Institute, Bulgarian Academy of Sciences, 1113 Sofia, Bulgaria
2
Institute of Plant Genetic Resources “Konstantin Malkov”—Agricultural Academy, 4122 Sadovo, Bulgaria
3
State Key Laboratory of Remote Sensing Science, Aerospace Information Research Institute, Chinese Academy of Sciences, Beijing 100101, China
4
Department of Remote Sensing, Flemish Institute of Technological Research, 2400 Mol, Belgium
*
Author to whom correspondence should be addressed.
Remote Sens. 2024, 16(7), 1144; https://doi.org/10.3390/rs16071144
Submission received: 9 February 2024 / Revised: 17 March 2024 / Accepted: 22 March 2024 / Published: 25 March 2024
(This article belongs to the Special Issue Remote Sensing of Land Surface Phenology II)

Abstract

:
The aim of this study is to predict and map winter wheat yield in the Parvomay municipality, situated in the Upper Thracian Lowland of Bulgaria, utilizing satellite data from Sentinel-2. The main crops grown in the research area are winter wheat, rapeseed, sunflower, and maize. To distinguish winter wheat fields accurately, we evaluated classification methods such as Support Vector Machines (SVM) and Random Forest (RF). These methods were applied to satellite multispectral data acquired by the Sentinel-2 satellites during the growing season of 2020–2021. In accordance with their development cycles, temporal image composites were developed to identify suitable moments when each crop is most accurately distinguished from others. Ground truth data obtained from the integrated administration and control system (IACS) were used for training the classifiers and assessing the accuracy of the final maps. Winter wheat fields were masked using the crop mask created from the best-performing classification algorithm. Yields were predicted with regression models calibrated with in situ data collected in the Parvomay study area. Both SVM and RF algorithms performed well in classifying winter wheat fields, with SVM slightly outperforming RF. The produced crop maps enable the application of crop-specific yield models on a regional scale. The best predictor of yield was the green NDVI index (GNDVI) from the April monthly composite image.

Graphical Abstract

1. Introduction

The agricultural sector is one of the economic sectors with the greatest impact on land use worldwide, with around 1.2–1.5 billion hectares currently occupied by agricultural crops [1]. To meet the projected human population growth and increasing food demand, the historical rates of increase in production must continue [2]. However, the increase in agricultural production must be accompanied by a sustainable management of agricultural areas, which will stop or at least slow down the negative environmental impacts on water and soil resources, greenhouse gas emissions and biodiversity losses [3]. It is worth noting that agriculture is among the main drivers of climate change and environmental pollution, but it is also the most vulnerable economic sector to climate change itself [4]. Since the end of the last century, with the development of earth observation and information technology, methods for obtaining and evaluating crop growth information based on remote sensing, geographic information system (GIS), and crop growth models have become increasingly popular in scientific studies and are useful in the decision-making process in agriculture [5,6,7]. Agricultural fields can be identified and monitored using crop-specific spectral, temporal and spatial features derived from satellite imagery [7,8].
The necessity for crop type mapping and yield prediction is paramount in the context of global food security and sustainable agricultural practices. These tasks play a crucial role in several areas: (1) Food security: Accurate and timely crop yield predictions are essential for ensuring food security. They allow for effective planning of food production, distribution, and consumption, and enable proactive measures against potential food shortages [9]. (2) Agricultural management: Crop type mapping and yield prediction inform decision making in the agricultural sector, from choosing which crops to grow for maximum yield considering factors like temperature, rainfall, and area, to managing resources efficiently [10]. (3) Environmental sustainability: these tasks contribute to sustainable agricultural practices by enabling the monitoring of crop health and growth, which can lead to the optimization of resource use and minimization of environmental impact [11].
Satellite imaging has proven to be a highly effective tool for crop type mapping and yield prediction. Recent studies have demonstrated the value of this technology in these areas: (1) Wide coverage: satellite images provide extensive geographical coverage and high temporal frequency, making them a convenient choice for monitoring and forecasting at both national and regional scales [12]. (2) Advanced techniques: the use of deep learning techniques with remote sensing data has shown remarkable success in crop mapping and yield estimation [11]. (3) High accuracy: studies have shown that satellite imagery, combined with machine learning algorithms, can predict crop yields with high accuracy [13,14]. (4) Time-series analysis: satellite imagery allows for time-series analysis, which is robust regarding irregular imaging intervals and can substantially help yield prediction at large scales [14].
GIS has the function of processing and analyzing geographic data and is widely applied in many fields, including agriculture [7,15,16]. Crop growth models provide an important means of quantifying agricultural production. They can simulate physiological processes such as crop growth stage, organ formation, biomass accumulation, yield, and the relationship between physiological processes and the environment [7,17]. Land cover and land use analysis has been identified as a key component in global climate change research, as well as in various environmental and agricultural research applications [18]. The extraction of such information increasingly relies on satellite-borne remote sensing, primarily because it offers a cost-effective means of surveying vast land areas with varying spatial and temporal resolutions to meet specific research requirements. One of the primary approaches for extracting such information via remote sensing is the classification of multispectral satellite images. In recent decades, satellite image classification, especially non-parametric approaches (machine-learning-based algorithms), has gained increasing importance in remote-sensing-based applications [19]. Classifiers using neural networks also represent a non-parametric approach and avoid some of the problems faced by the parametric methods. Another non-parametric approach is Support Vector Machines (SVM). The theoretical basis and mathematical formulation of the method can be found in Vapnik [20]. It has shown its effectiveness for land cover classification tasks with high accuracy. A non-technical overview of SVM and an in-depth review of its remote sensing applications are provided in the work of Mountrakis et al. [21]. The Random Forest (RF) classification algorithm is a non-parametric machine learning algorithm widely used in remote sensing in recent years [22]. The RF method is an ensemble classifier that uses a set of classification trees to make a prediction [23]. Depending on the number of variables used at each stage, there are univariate and multivariate decision trees. One-dimensional decision trees have been used to develop global-scale land cover classifications [24]. Although multidimensional decision trees are often more compact and can be more accurate than unidimensional decision trees, they involve more complex algorithms and, as a result, are affected by a range of algorithm-related factors [24]. In recent decades, the integration of remote sensing observations and crop growth models has been recognized as a promising approach for crop growth monitoring and yield estimation [25]. The use of accurate and timely information to monitor crop growth and to predict yield through earth observation helps farmers to adapt farm operations and optimize work processes, thus reducing the risk of crop loss and production costs [26,27]. Timely information on yields and production is critical for optimizing agricultural processes. Due to its large coverage and temporal resolution, Sentinel-2 satellite images have been a source of valuable information for forecasting and yield assessment at national and regional scales. Sentinel-2 enables data acquisition every 3–5 days [28,29], therefore providing good capability for timely spatial and temporal assessments of different crop variables, being essential for effective and precise crop management [30]. For example, vegetation indices derived from Sentinel-2 imagery allowed for the development of several winter wheat yield assessment/forecast models with good accuracy [31].
Crop type mapping and yield prediction, while seemingly distinct, are intrinsically linked and mutually informative in the context of precision agriculture. Crop type mapping provides essential information about the spatial distribution of different crops within a field or region [32]. This information is crucial for yield prediction as different crops have different growth patterns, resource needs, and yield potentials [33]. On the other hand, yield prediction models often rely on crop-specific parameters that are derived from crop type mapping. For instance, the spectral signatures of different crops captured in satellite images, which are used for crop type mapping, can also indicate crop health and growth stage, which are key inputs for yield prediction [32,33]. Therefore, combining these two tasks can lead to more accurate and comprehensive insights for agricultural management [11,32,33].
The aim of this study is to predict and map the winter wheat yield in the Parvomay municipality, located in the Upper Thracian Lowland, utilizing satellite data from Sentinel-2. This yield map will be further used as input data for the calculation and analysis of the water productivity on a regional level. In order to create a yield map, the following research stages were carried out:
  • Classifying and mapping the main crop types in the study area. For that purpose, different classification algorithms were built, and their performance was compared over different crop growth seasons.
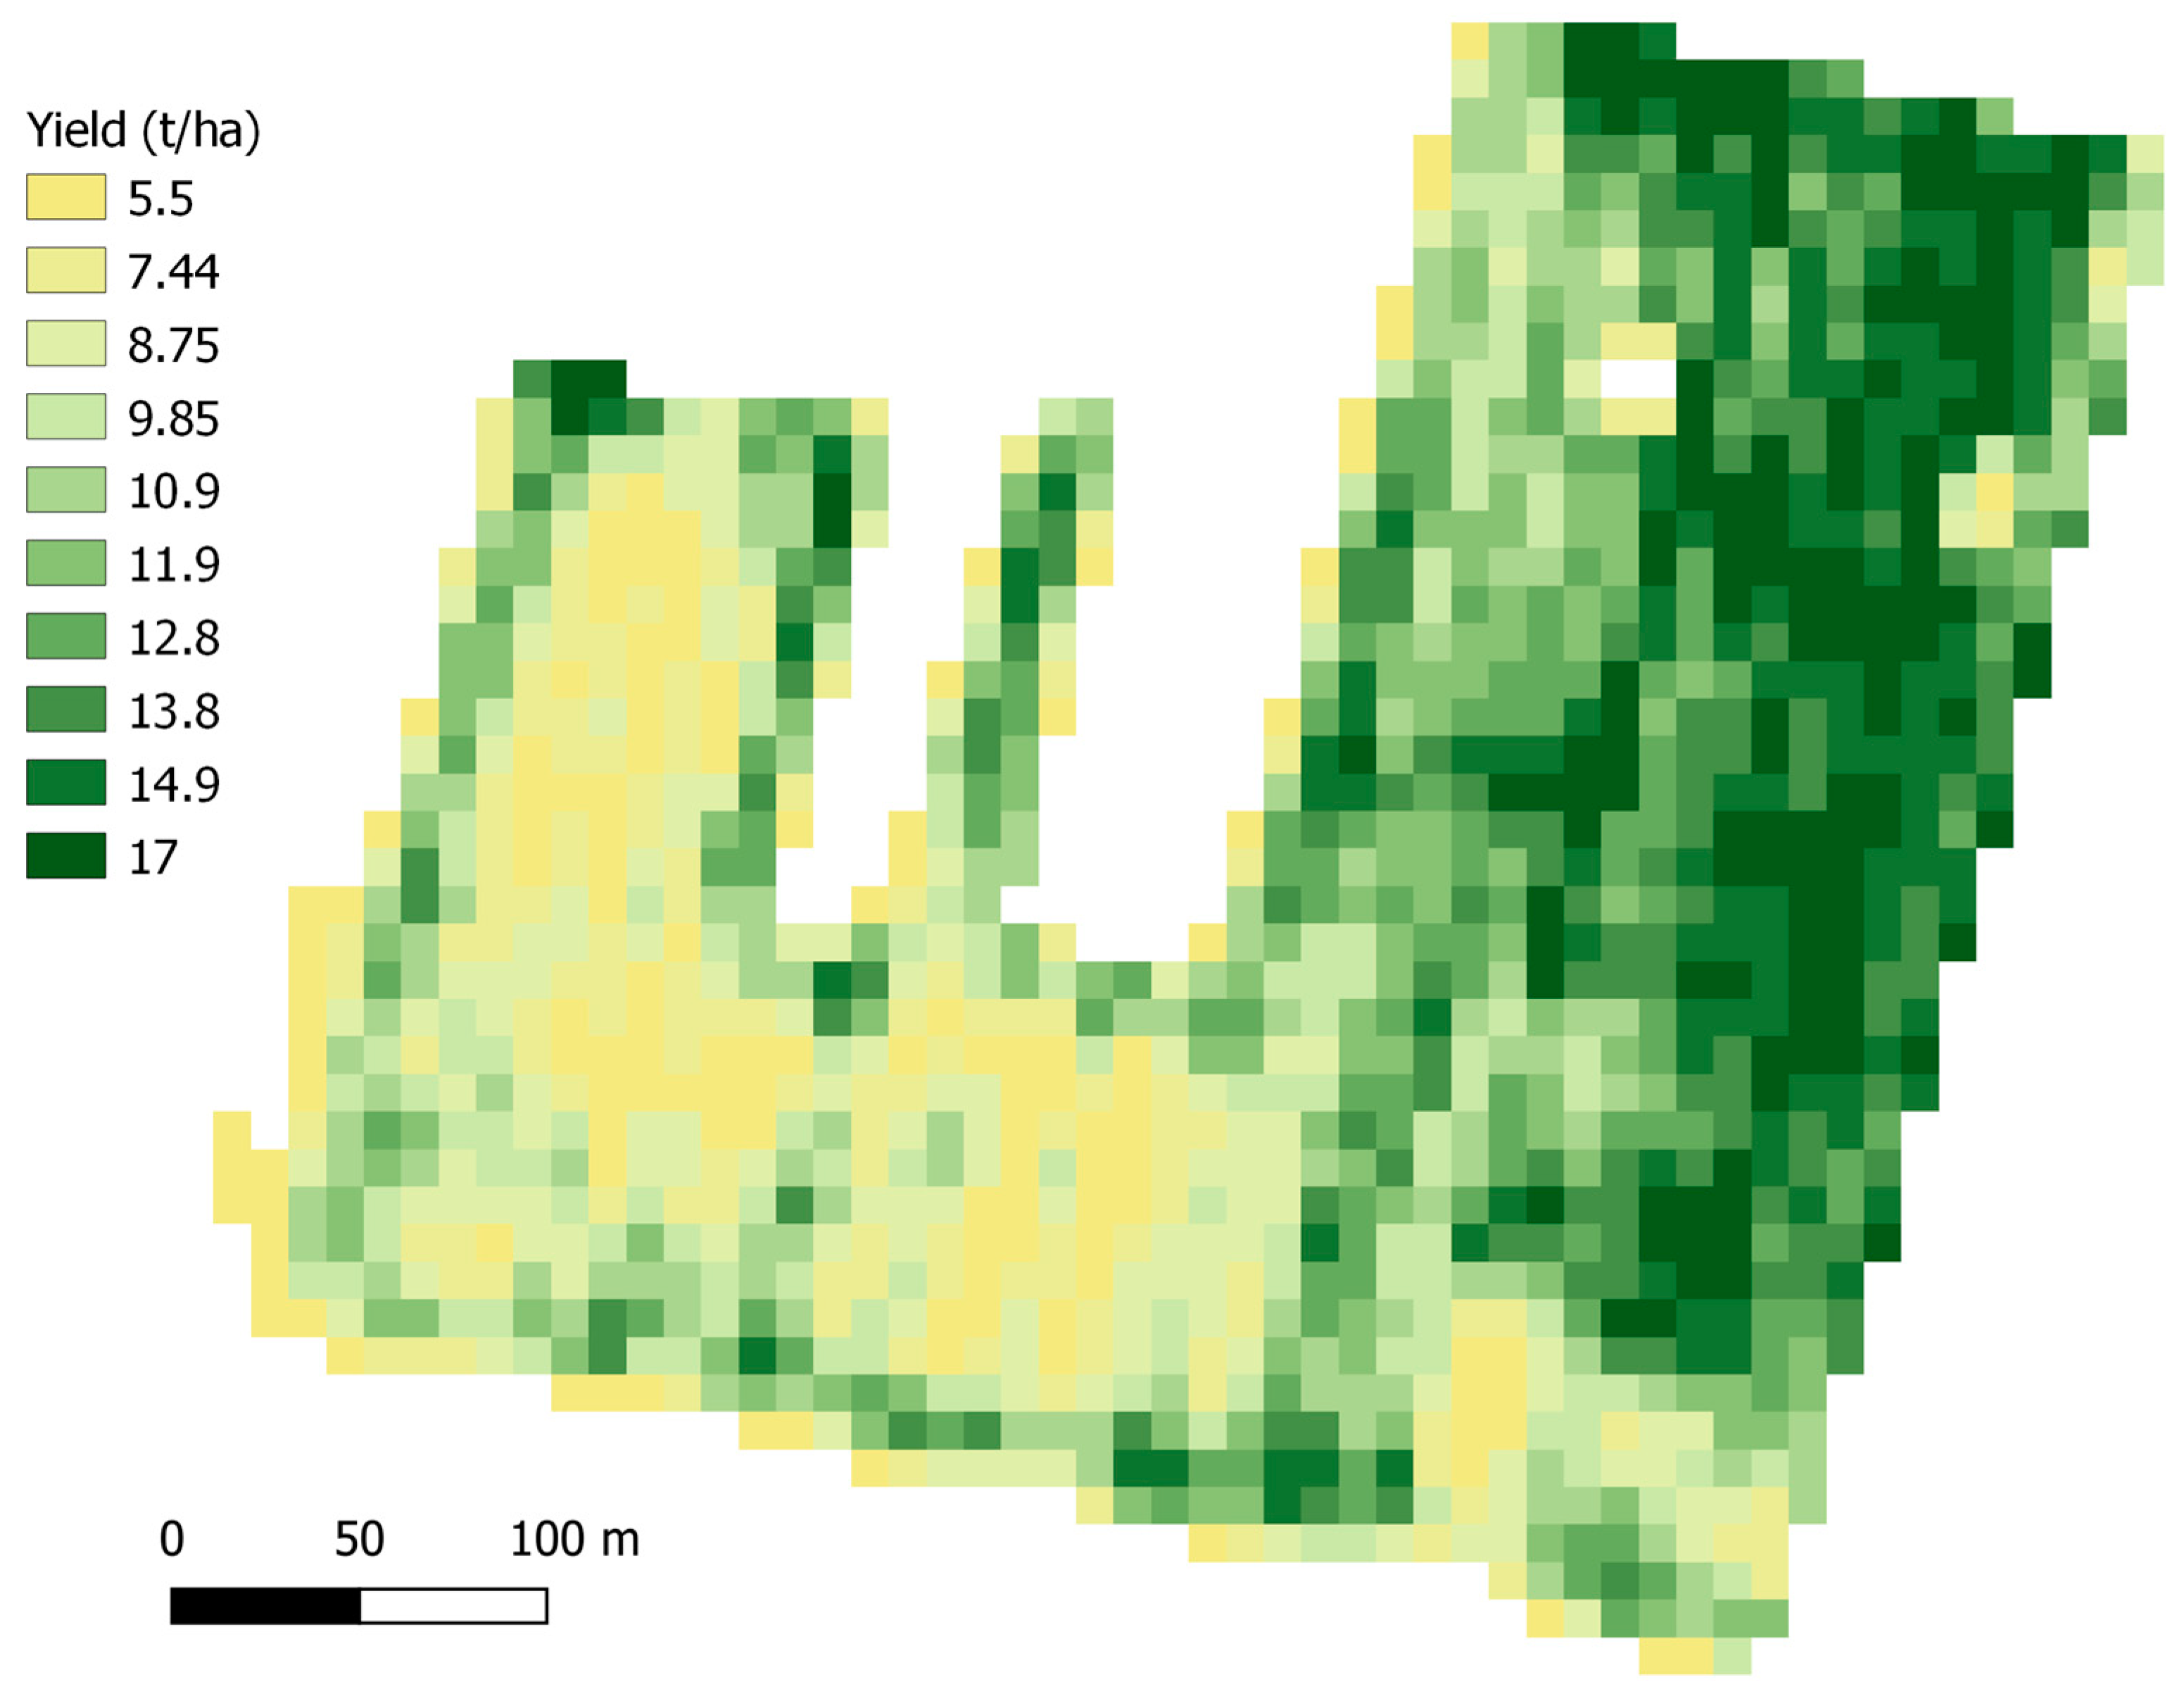
  • Modeling and mapping winter wheat yields in the study area. The winter wheat fields were identified using the crop mask created from the best-performing classification algorithm. Yields were predicted with regression models calibrated with in situ data collected in the Parvomay study area.

2. Materials and Methods
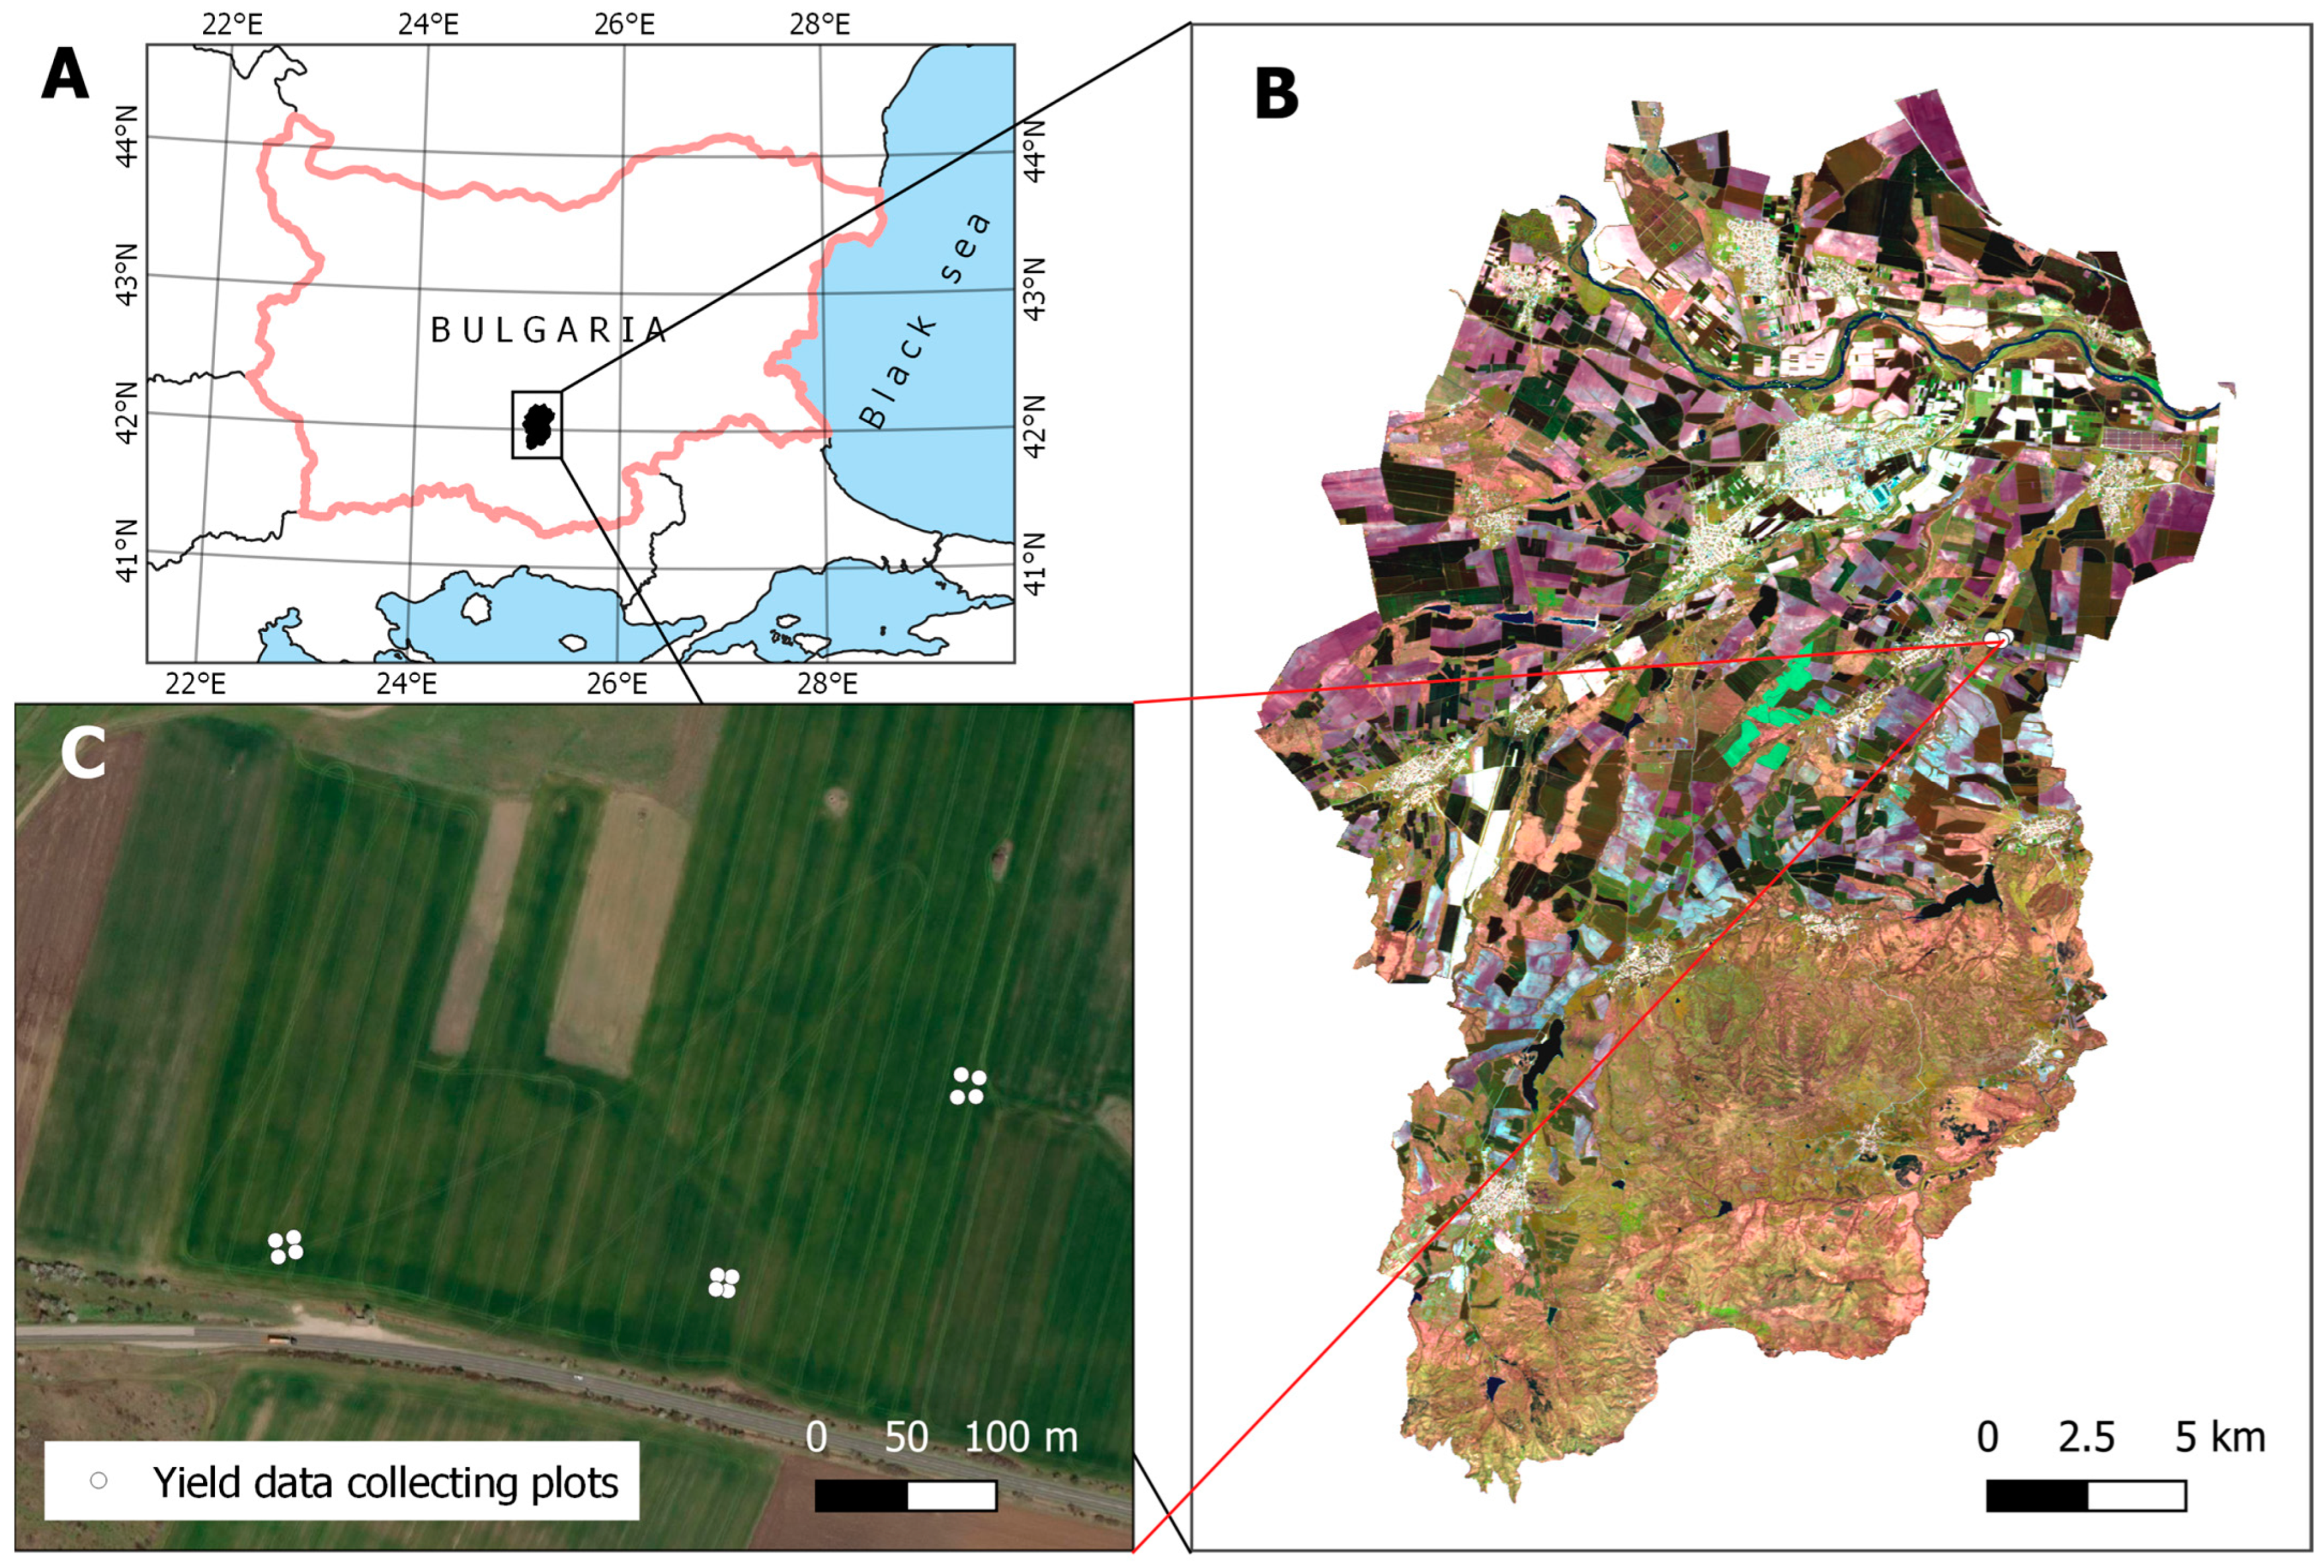
2.1. Study Area

The municipality of Parvomay is situated in the southern part of Bulgaria (Figure 1). The area falls within the catchment basin of the Maritsa River, which crosses the northern part of the municipality. In this part of its course, the Maritsa River flows through the Upper Thracian Lowland. Most of the study area is characterized by low relief and an altitude of 120–300 m above sea level. The elevation increases to 800 m above sea level towards the Rhodope Mountains in the south of the study area. The municipality of Parvomay falls into the transitional continental climate subzone of the temperate climate zone. The average annual temperature is 12.7 °C, with positive values even in the coldest month of January. The annual rainfall is averaged around 518 mm. The greatest share of rainfall is in the spring–summer period, followed by rainfall periods in the autumn months. The major soil types observed in the territory according to the WRBSR 2002 soil classification are Fluvisols, Planosols, Vertisols, Chromic Luvisols, and Salic soils. The territory of the municipality has a surface of 534 km2 and more than two thirds are occupied by agricultural fields. Agricultural vegetation is dominated by winter wheat, sunflower, alfalfa, grasslands and maize. Other crops, such as vegetables, industrial crops, perennial crops, and vineyards, occupy smaller surfaces and contribute to the diversity of the agricultural landscape.

2.2. Crop Type Identification

2.2.1. Crops Reference Dataset

Reference data for the crops sown in the study area in 2021 were obtained from the Integrated Administration and Control System (IACS) and its Land Parcel Identification System (LPIS). The IACS/LPIS dataset is an annually updated crop layer generated by the Bulgarian Ministry of Agriculture, Food, and Forestry. It is a vector dataset containing the borders of agricultural parcels (arable fields, grasslands, and permanent crops) accompanied by attributive information about the crop/land cover type in each parcel according to the declarations submitted by farmers.

2.2.2. Satellite Imagery Dataset and Pre-Processing

In this study, for the purpose of crop type identification, the Sentinel-2 surface reflectance (Level-2A) dataset was used. This dataset is available in Google Earth Engine (GEE) platform [34] and it includes images that have been corrected for atmospheric effects using the Sen2Cor Version 2.10 atmospheric correction software [35]. Two temporal composites were created for the months of April and June 2021, covering the Parvomay municipality. Additionally, a single multitemporal image was generated by stacking these composites together. These time periods were set because of the image availability and because of the crop phenology in the transitional continental climate subzone, where winter wheat and rapeseed are the first crops to emerge among other crops in March–April. Sunflower and maize are developing later in May–June, respectively; the April composite targets the identification of winter crops and the June composite targets the summer crops’ identification.
Images with a cloud cover of less than 10% were chosen for the analysis and creation of image composites. Clouds, cloud shadows, and saturated or defective pixels were masked using the information from the scene classification map (band ‘SCL’ of the GEE dataset). The 20 m resolution SCL band was available following the Sen2Cor Level-2A pre-processing. Pixels classified as vegetation, bare soils, water, or dark areas in the ‘SCL’ band were selected for subsequent processing. The spectral bands ‘B2’, ‘B3’, ‘B4’, ‘B5’, ‘B6’, ‘B7’, ‘B8’, ‘B11’, and ‘B12’ were retained for further analysis, with their original resolutions of either 10 or 20 m. To create a cloud-free and data-gap-free image mosaic over the defined area, the median of available observations within each pixel was calculated for each one-month period. This compositing approach was widely applied in recent research [36,37,38,39,40]. These two 9-band monthly composite images were then exported in 16-bit unsigned integer GeoTIFF format with a 10 m resolution and an “EPSG:32635” reference system. A single 18-band multitemporal image was generated by stacking these two composites together.

2.2.3. Classification Procedure

Three classification scenarios were investigated to analyze the potential for mapping crops in different phonological periods during the growing season and to examine the utility of multitemporal satellite data. These scenarios were numbered 1 to 3 according to the input dataset for classification, namely the monthly composites of April, and June, as well as the stacked 18-band multitemporal composite image. The classification schemes for the three scenarios are shown in Table 1. The classes in each scheme differ because of the different crops present in the field at different times during the growing season.
In Scenario 1, the classification was focused on the main winter crops in the study area, ‘winter wheat’ and ‘winter rapeseed’, as well as two grassland classes, ‘alfalfa’ and ‘pastures/meadows’. These classes represented the main agricultural land covers in April when all other fields, which have to be sown with summer crops, were still in bare soil conditions with minimum vegetation cover. The ‘alfalfa’ and ‘pastures/meadows’ were considered permanent land covers through the growing season, similarly to the other two scenarios.
The analysis conducted under Scenario 2 involves employing the monthly composite of June as input. It adopts a similar legend to that used previously, with a shift in focus from winter crops to the primary summer crops, such as ‘sunflower’ and ‘maize’. Since winter crops are not harvested in June and their canopies have typically matured and dried by this time, distinguishing between different types of winter crops based on spectral information becomes challenging. Consequently, a broader class labeled as ‘other crops’ was introduced to encompass all types of winter crops.
Finally, the analysis under Scenario 3 explored the feasibility of mapping both winter and summer crops in a unified classification process by integrating spectral data from both April and June. The multitemporal classification approach, where two or more images registered during the growing season are classified as a single dataset, has been utilized before [41,42], yielding good results due to the ability of such data to capture phenological variations of crops. The same reasoning was applied to Scenario 3, but we tested the possibility of using monthly composite images rather than single images. Table 1 provides details on the classes considered for each of the three classification scenarios, along with the corresponding numbers of pixels used for training the classifiers (see the text for details regarding the generation of the training samples).
For each scenario, training and validation datasets were prepared based on the IACS/LPIS database. The procedure for each case involved the following steps. Initially, utilizing the existing attributive information from LPIS for crops, each polygon was re-labeled according to the legend specified in the respective classification scenario. Subsequently, the polygons were randomly split into equal portions for training and validation purposes. To eliminate mixed pixels at field boundaries, a 20 m inward buffer was applied to the training polygons. Random points within the training polygons were generated using QGIS software version 3.47, with a minimum distance of 20 m between each point, and a target of 1000 points per class was set. In most instances, the desired number of points was achieved; however, in a few cases, particularly due to the small area of training polygons, this target could not be met. The actual numbers of training points utilized for each scenario and class are detailed in Table 1. Finally, the vector files containing the training dataset (comprising points) and the validation dataset (comprising polygons) were rasterized with the same geo-referencing system. A raster, aligned with the satellite imagery, was acquired, maintaining a resolution of 10 m and matching the projection, extent, and coordinates of the origin vector point. Likewise, a validation raster was created by rasterizing the validation polygons.
The classifications were conducted using EnMap-Box v3.5. [43,44]. Two supervised machine learning algorithms were applied, namely Random Forest (RF) and Support Vector Machine (SVM). Both methods are supervised machine learning algorithms which can deal with both regression and classification problems [20,45]. They were extensively reported in recent years for classification of land cover/land use in the context of remote sensing [21,22,23,46]. The machine learning python package Scikit-learn was used to perform the classifications [47]. The following settings were used for the SVM classifications: the kernel type was radial basis function (‘rbf’); and the values of kernel coefficient Gamma and the regularization parameter C were optimized using a grid search 5-fold cross validation with the following tested values C [0.01, 0.1, 1, 10, 100, 1000, 10,000] and Gamma [0.0001, 0.001, 0.01, 0.1, 1, 10, 100]. Five folds were selected for the cross validation, as this value was recommended by James et al. [48].
The default parameter values were used for parameterization of the RF except for the number of trees, which was set to 500 [23]. We did not tune the number of trees parameter because a study by Kwak and Park [49] has shown that the error rate stabilizes far before the value of 500. In addition, the RF classifier does not overfit as more trees are added [45]. During the classification process, the IACS/LPIS dataset served as a mask to restrict the analysis solely to areas representing agricultural fields. The accuracy assessment was also performed based on the information from all the pixels within the randomly selected validation polygons. A confusion matrix was produced expressing the number of pixels assigned to a particular class by the classifier relative to the actual class as indicated by the validation raster [50]. Overall accuracy (OA) was used as a measure of the general classification performance. The F1 score was used to indicate the accuracy of individual classes,
F 1 = 2   ×   UA   ×   PA UA   +   PA ,
where UA is the user’s accuracy and PA is producer’s accuracy for a specific class. Details about the calculation of OA, UA, and PA based on the confusion matrix can be found in Congalton’s work [50], among others.

2.3. Winter Wheat Yield Modeling

2.3.1. Yield Data

Yield data collection was performed on 25 June 2021, when the winter wheat was in technological maturing stage BBCH 99 [51]. Field samples were collected from 12 plots in an industrial agricultural field in the borders of the study area, according to the methodology of Shanin [52]. The sample locations are chosen after a preliminary visual examination of the field, using NDVI images to distinguish the within-field variation. In each test plot, plants were cut from a 0.5 × 0.5 m area. The plants in each sample were counted. The following indicators were recorded for 25 randomly selected plants: plant height (cm); spike length (cm); grains in the class (number); mass of the grain in the class (g); and physical properties of grain. Using the measurements from the sampled plants, the biological yield (t/ha) was calculated. The mass of 1000 grains (g) was determined according to the ISO [53].

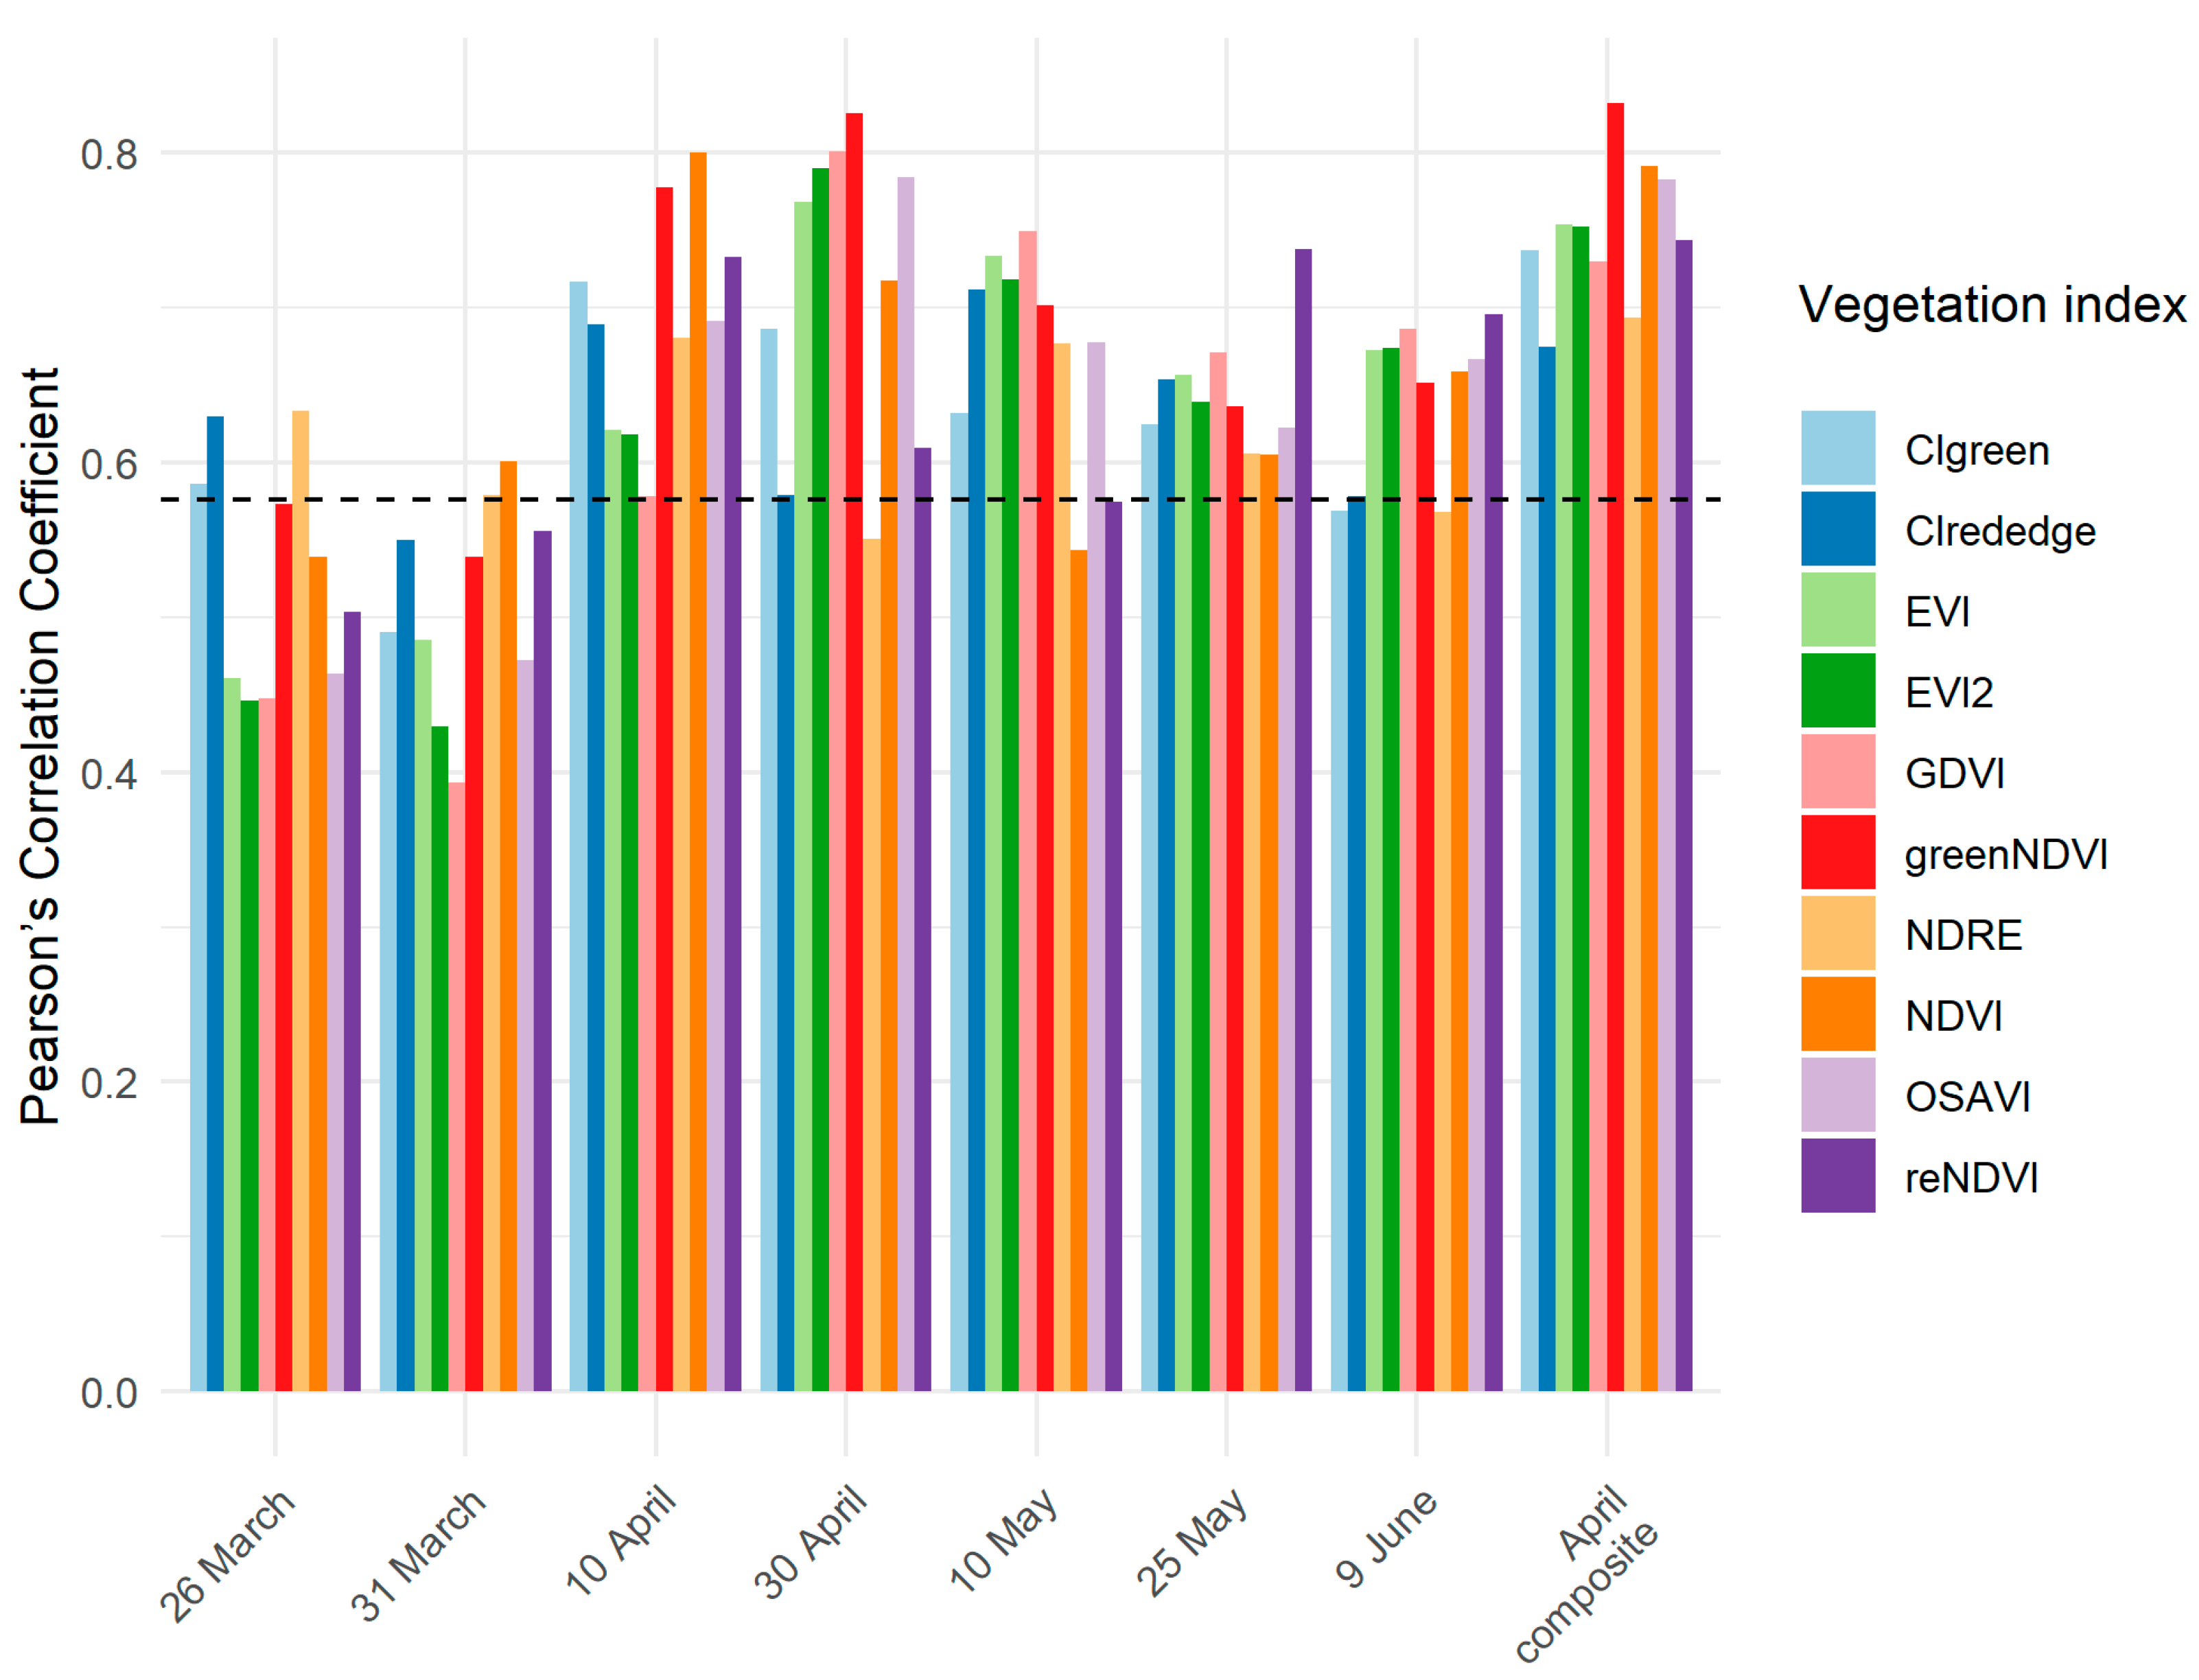
2.3.2. Vegetation Indices and Yield Modeling

To address one of the research objectives in this study, specifically the generation of a prediction model for winter wheat yield, a simple regression modeling approach was adopted. For that purpose, vegetation indices (VI) were utilized as a predictor variable. The VIs were calculated from Sentinel-2 images registered at the following dates: 26 March, 31 March, 10 April, 30 April, 10 May, 25 May, 9 June, and the monthly composite for April. These images were selected because of the absence (or only minimal presence) of clouds over the study area. A systematic shift in one-pixel was observed over the winter wheat field in the original image from 10th of May in GEE. Therefore, this image (subset) was exported and corrected using the ‘gdal_translate’ program [54] before extracting the band data. To find an optimal predictor, we tested a set of VIs (Table 2) generated from Sentinel-2 imagery.
The reflectance values of the spectral bands were extracted from the imagery at each of the 12 sample plots together with the corresponding yield measurements based on the GPS coordinates recorded on the field. This was performed in GEE using the ‘sampleRegions’ method, with the ‘scale’ argument set to 10 m (thus, all bands are resampled to 10 m before sampling). The spectral band data were then exported and analyzed in a spreadsheet, where the VIs and their correlation with field data for crop yield were computed.
The combination of image registration date and VI (Table 2) producing the highest Pearson’s correlation coefficient with yield was selected as a predictor and used to fit a linear regression model. Due to the small-yield dataset, the model was validated through a leave-one-out cross-validation (LOOCV). The LOOCV Root Mean Square Error (RMSEcv) was calculated as follows:
R M S E c v = 1 n i = 1 n y i y ^ i 2 ,
where y i and y ^ i are the true and predicted yield for the i-th observation, respectively, and n is the number of observations. The predicted value for each observation y ^ i was obtained by applying a model fit to the remaining n − 1 observations. Therefore, a total of n models are generated each using n − 1 observations for training and the remaining observation for validation [48]. A relative error, rRMSEcv, was calculated as the percent of RMSEcv relative to the mean yield measured in the field plots.

3. Results and Discussion

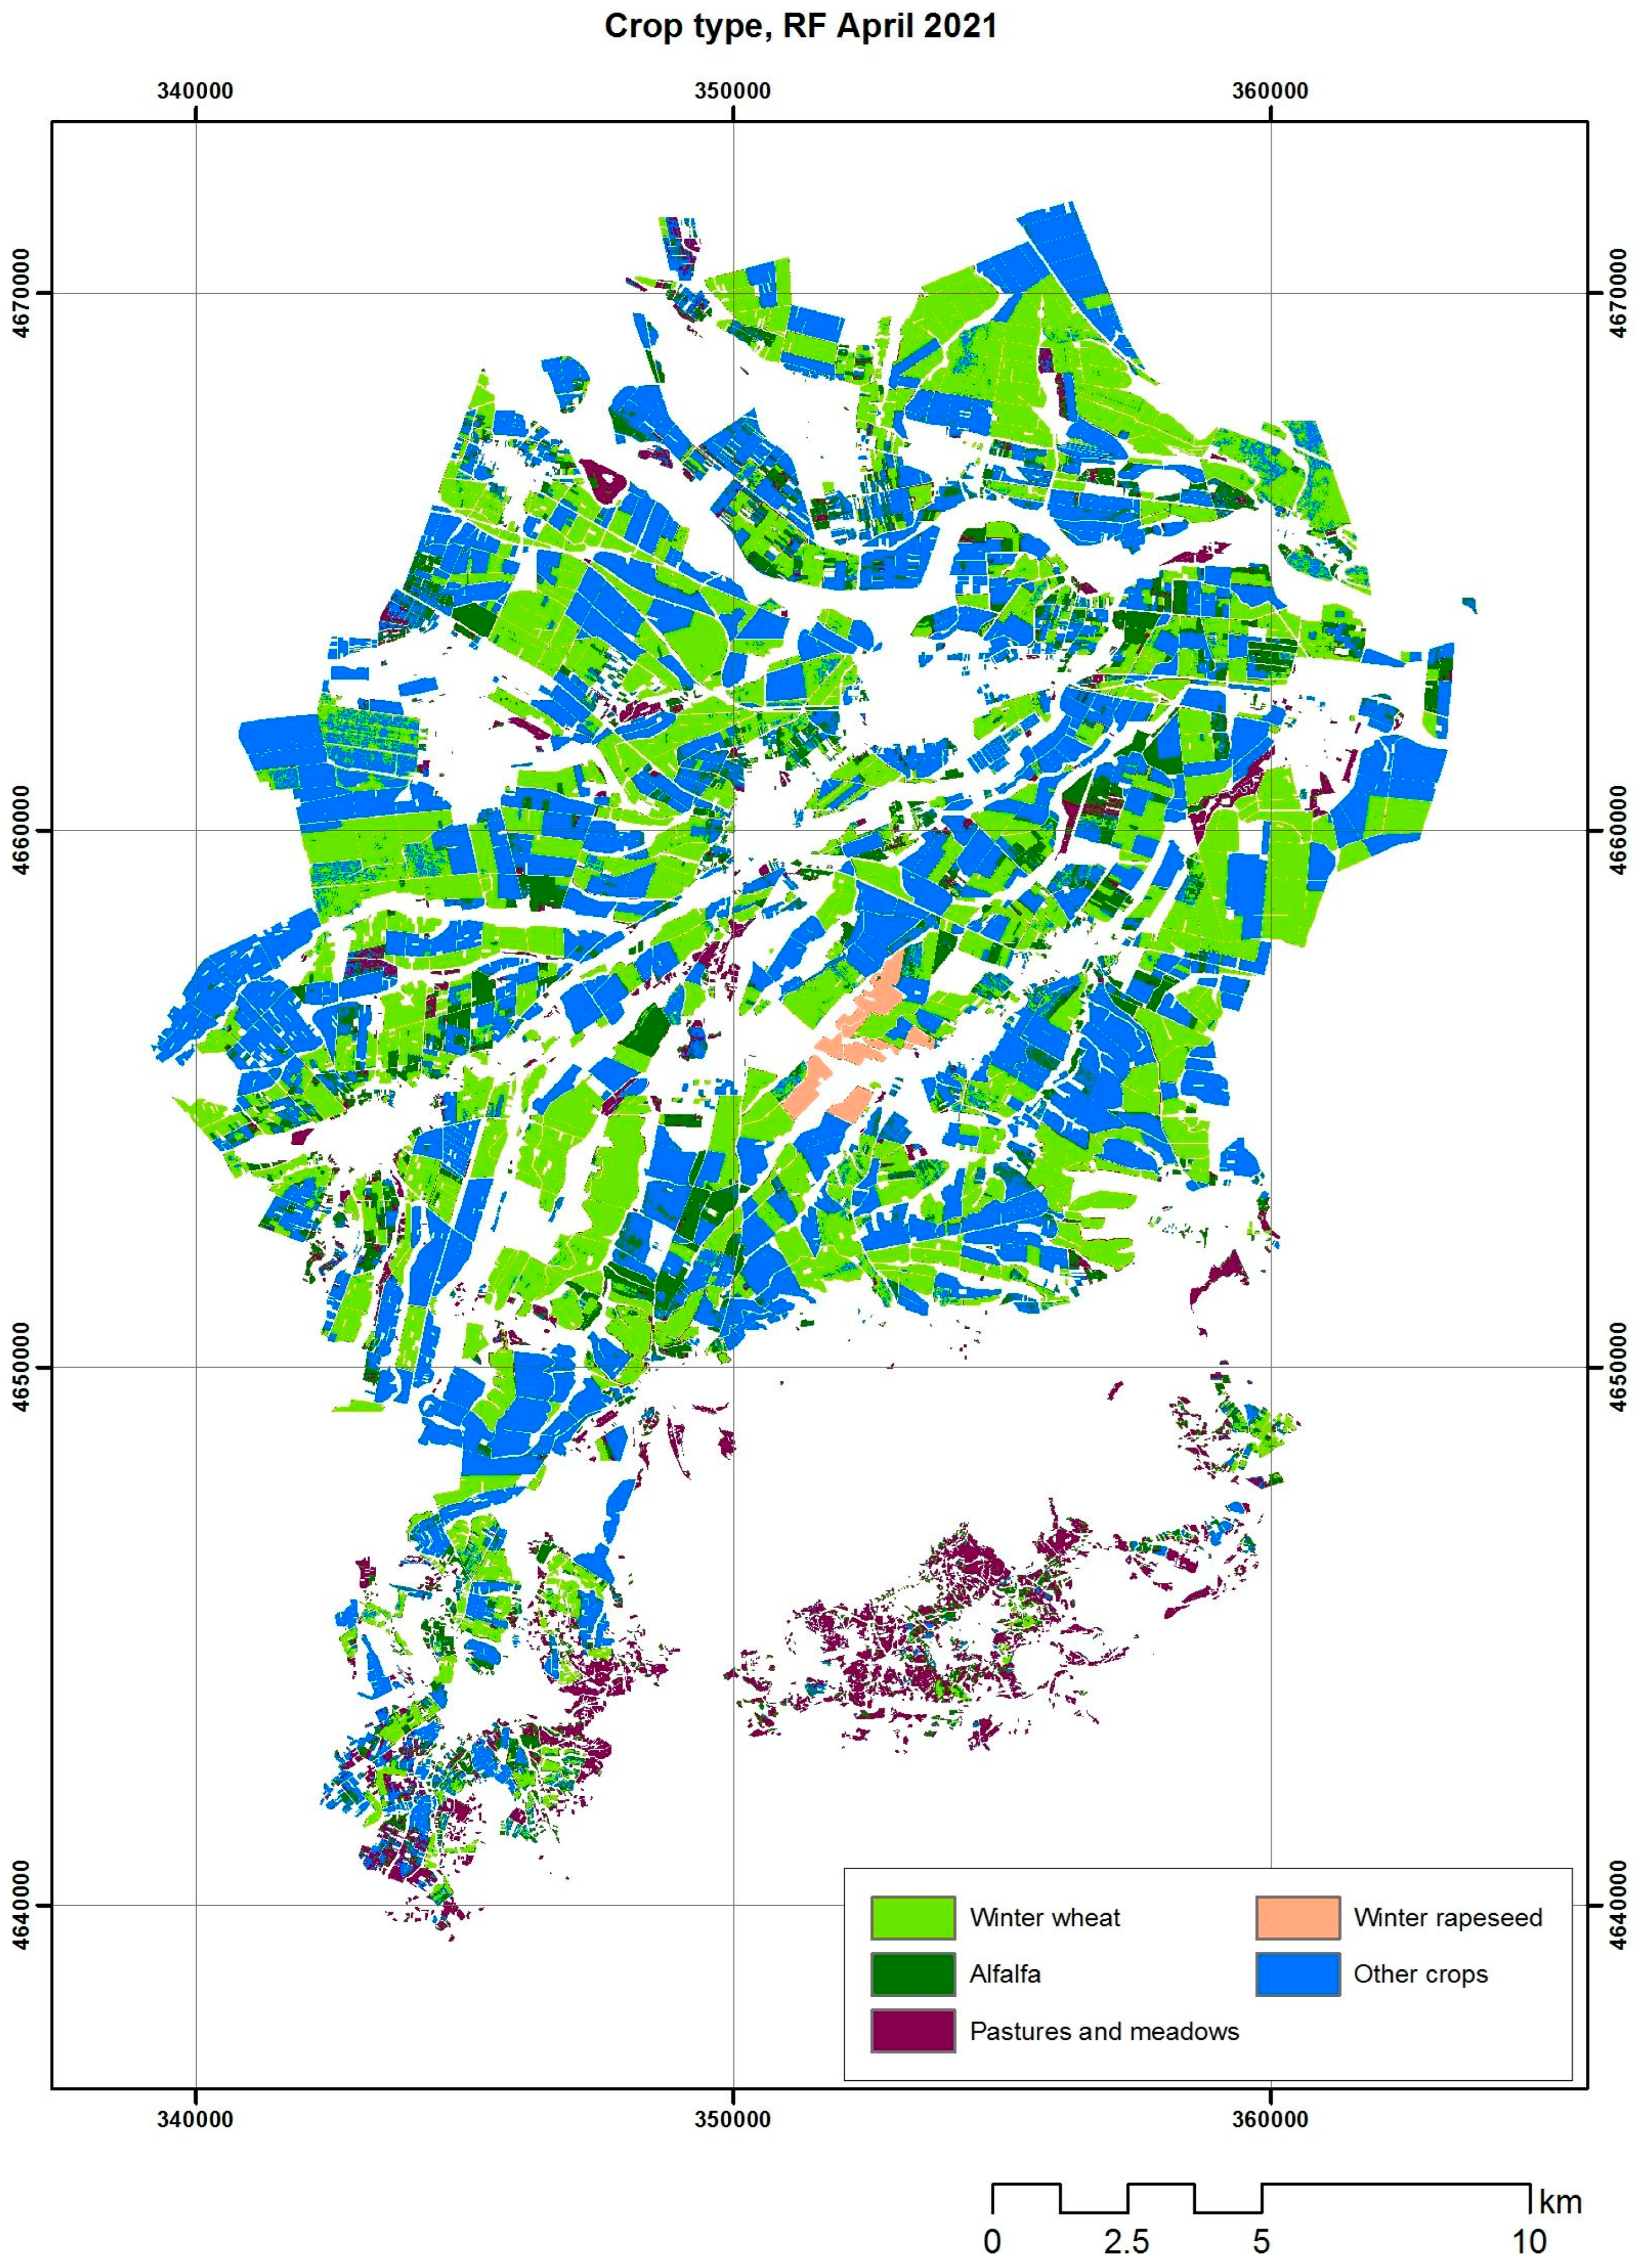
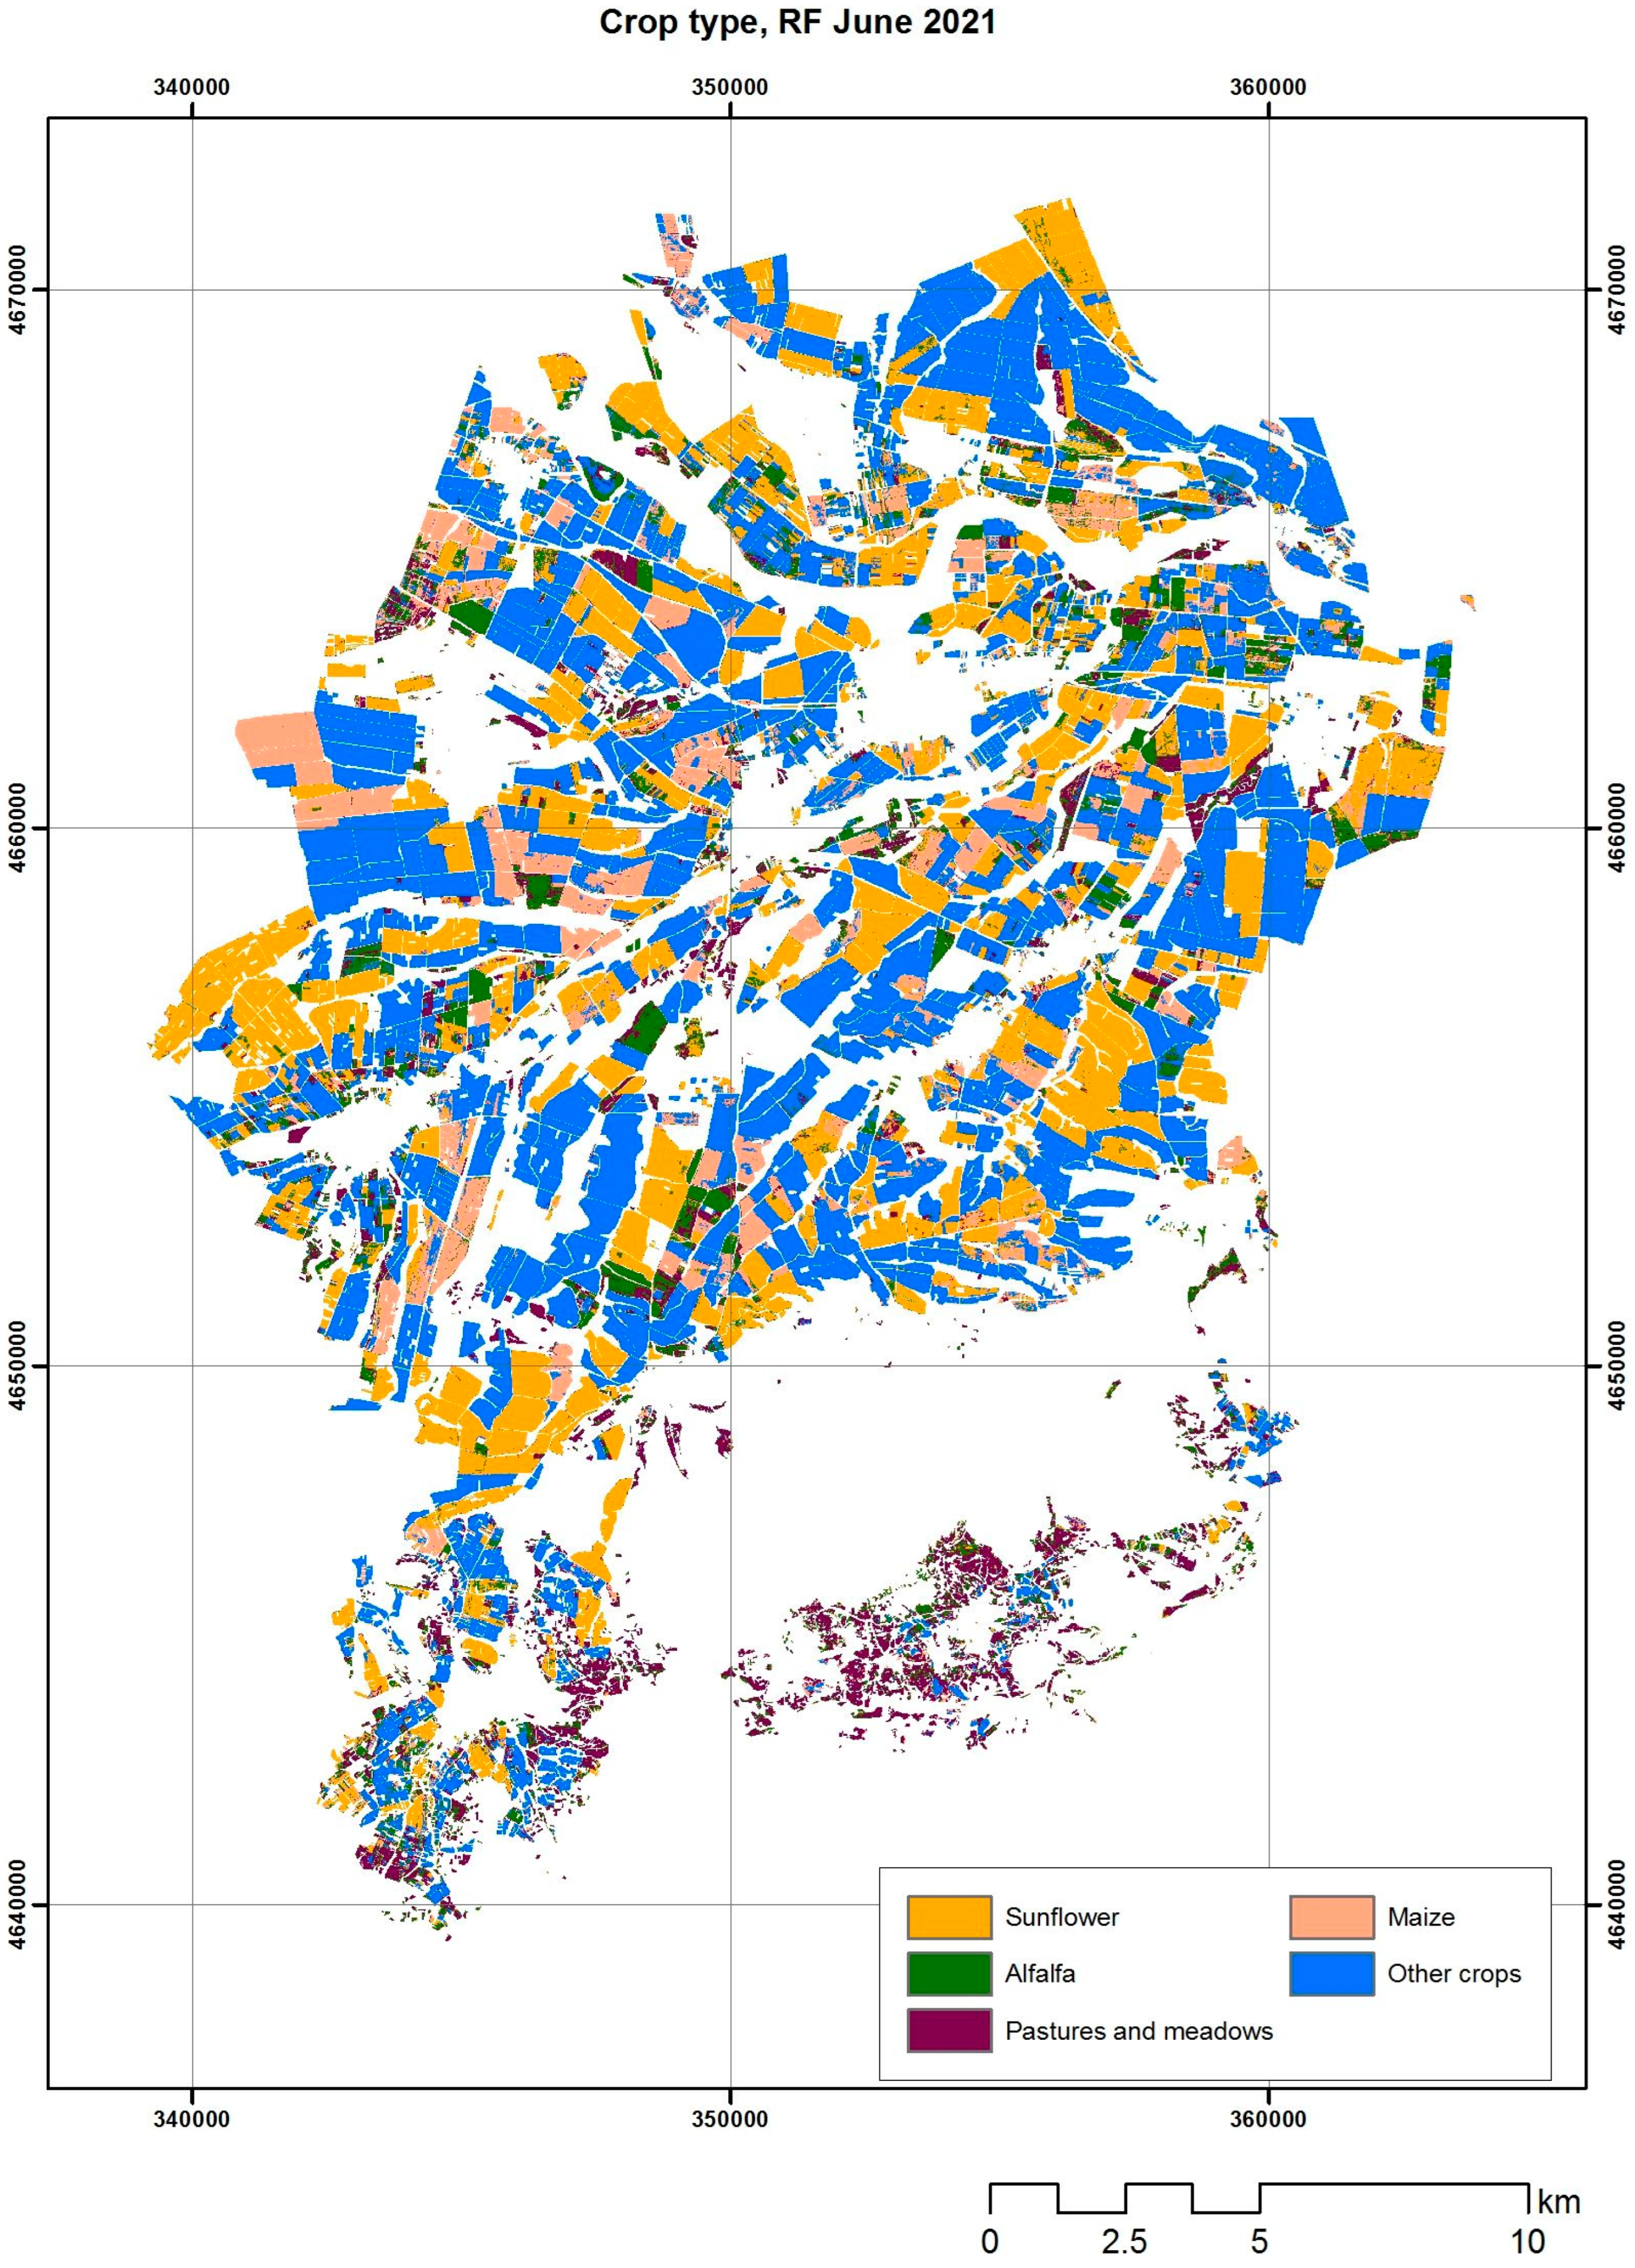
3.1. Crop Type Identification

The optimal values of the parameters C and Gamma of the SVM classifier were determined by searching among pre-defined sets of values. The results of the grid search procedure are shown in Figure 2, which presents the classification accuracy (F1 score) for different combinations of parameter values. The accuracy was estimated through a 5-fold cross validation on the training data. The best combination of Gamma and C was the same for Scenario 1 and Scenario 3 and differed slightly for Scenario 2. The variation in the model parameters strongly affected classification performance in all scenarios. Overall, the accuracy varied between 0.04 and 0.91. The optimal parameter search was therefore critically important for the SVM classifier, which was also demonstrated by Kwak and Park [49].
Both classification methods, SVM and RF, performed well in the identification of major crop types, achieving an overall accuracy over 80% in all three scenarios. Slightly higher accuracy was achieved by SVM, which outperformed RF with up to 3.1% in Scenario 3. The class-wise accuracies (F1 scores) were also higher for SVM in the general case. Accordingly, the results from the SVM classifications are discussed.
The crop type classification based on the April composite (Scenario 1) is shown in Figure 3. The two main winter crops in the study area, wheat and rapeseed, were mapped with high accuracy (F1 = 91.4% and 98.3%, respectively, Table 3), which indicates that April is a suitable time to distinguish between these crops.
As shown in Figure 1B, winter rapeseed has a distinct spectral appearance in the April composite (the bright green fields at the center of the image) due to the flowering of the crop. This phenological feature explains the good separability between the two crops at this time of the growing season. The low accuracy of the ‘alfalfa’ class (F1 score of 44.7%), was led by an overestimation of the crop area at the expense of the class ‘other crops’ as indicated by the error matrix (Table 4). A further investigation in the IACS/LPIS dataset showed that most of the land, wrongly classified as alfalfa, was actually covered by einkorn wheat, winter peas, vineyards, and orchards. The ‘pastures/meadows’ class is also partially misclassified as class ‘other crops’ but to a lesser extent, leading to a moderate F1 score of 74.3%.
Figure 4 illustrates the crop type classification according to Scenario 2, using the monthly composite of June. Sunflower, which is the most important summer crop in the study area, was classified with fair accuracy (F1 score of 88.9%, Table 5). The accuracy for maize, the other main summer crop, was lower (F1 score of 72.3%). This crop was overestimated at the expense of class ‘other crops’ (Table 6). Summer crop mapping seemed to be a more difficult task than winter crop mapping using a single monthly composite, especially when a single June composite was used. Most of the area, misclassified as maize, represented vineyards and orchards, but also other crops such as vegetables, cotton, and tobacco. Similarly to Scenario 1, the classes ‘alfalfa’ and ‘pastures/meadows’ represented a major challenge to the classification. The first is overestimated at the expense of class ‘other crops’. Part of the pastures and meadows are incorrectly classified as ‘alfalfa’ and vice versa (Table 6).
Among the three scenarios, the classification in Scenario 3 had the highest overall accuracy (Table 7, Figure 5). The classification was performed on the multitemporal dataset (April and June), as this approach has the advantage that both winter and summer crops are mapped through a single processing operation. Moreover, the accuracy for the winter crops remained high and that for the summer crops increased in comparison with Scenario 2. The increase in accuracy was more important for the ‘maize’ class, which had a 13.3% higher F1 score in Scenario 3 compared with Scenario 2. The two grassland classes, ‘alfalfa’ and ‘pastures/meadows’, also increased their accuracy. However, the ‘alfalfa’ remained poorly recognized (F1 score of 65.5%) even though an increase of 10.4% compared with Scenario 2 was observed. The reason, as in the other scenarios, was the overestimation at the expense of class ‘other crops’ (Table 8). The high classification accuracy achieved using the multitemporal data is in agreement with previous studies which demonstrated the utility of using monthly Sentinel-2 composites. For instance, a study by Hernanedez et al. [63] mapped 31 land cover and crop classes with good accuracy using 12 monthly composites in a 1.2 Mil. ha study area in Portugal. Similarly, Khuong et al. [64] used seven intra-annual median monthly composites from Sentinel-2 to map land cover and crop classes in two study areas in the USA, achieving an overall accuracy of 83% and 94%, respectively.
The two machine learning methods used in the present study have become the standard choice when classifying remote sensing imagery in recent years as they are relatively simple and implemented in many software packages. However, other methods, like deep learning, are under constant development and have shown promising results [65]. Such models may lead to further increases in crop mapping accuracy; however, their complexity may be forbidding. Alternative approaches, such as hierarchical classification, may also be considered for crop mapping. For instance, a first level of classification may extract winter and perennial crops in the study area, while other agricultural areas may be classified in a second level of classification discriminating between summer crops.
Both the SVM and RF classification methods demonstrated strong performance in distinguishing major crop types, although SVM notably achieved slightly higher accuracy compared to RF, in terms of higher class-wise accuracies (F1 scores) and overall accuracies in all three scenarios. In Scenario 1, the winter crops are distinguished with very high accuracy (F1 score for winter rapeseed > 98%). In early spring, the winter crops are in the early development phase and their identification with high accuracy during this period is of crucial importance because it allows farmers to make early season management decisions in the event of possible disturbances, which can be detected with remote sensing methods [11]. While many classification methods prioritize prediction accuracy, it is equally crucial to consider the timeliness of predictions. Making decisions early can significantly impact time-sensitive activities, such as agricultural management. [66]. European countries utilize land parcel identification systems (LPISs) based on remote sensing data and farmers declarations for crop distribution data. However, most developing nations lack similar systems, hindering precision agriculture development. Establishing parcel-level crop mapping systems is crucial for timely adjustments and an accurate allocation of agricultural resources [67].

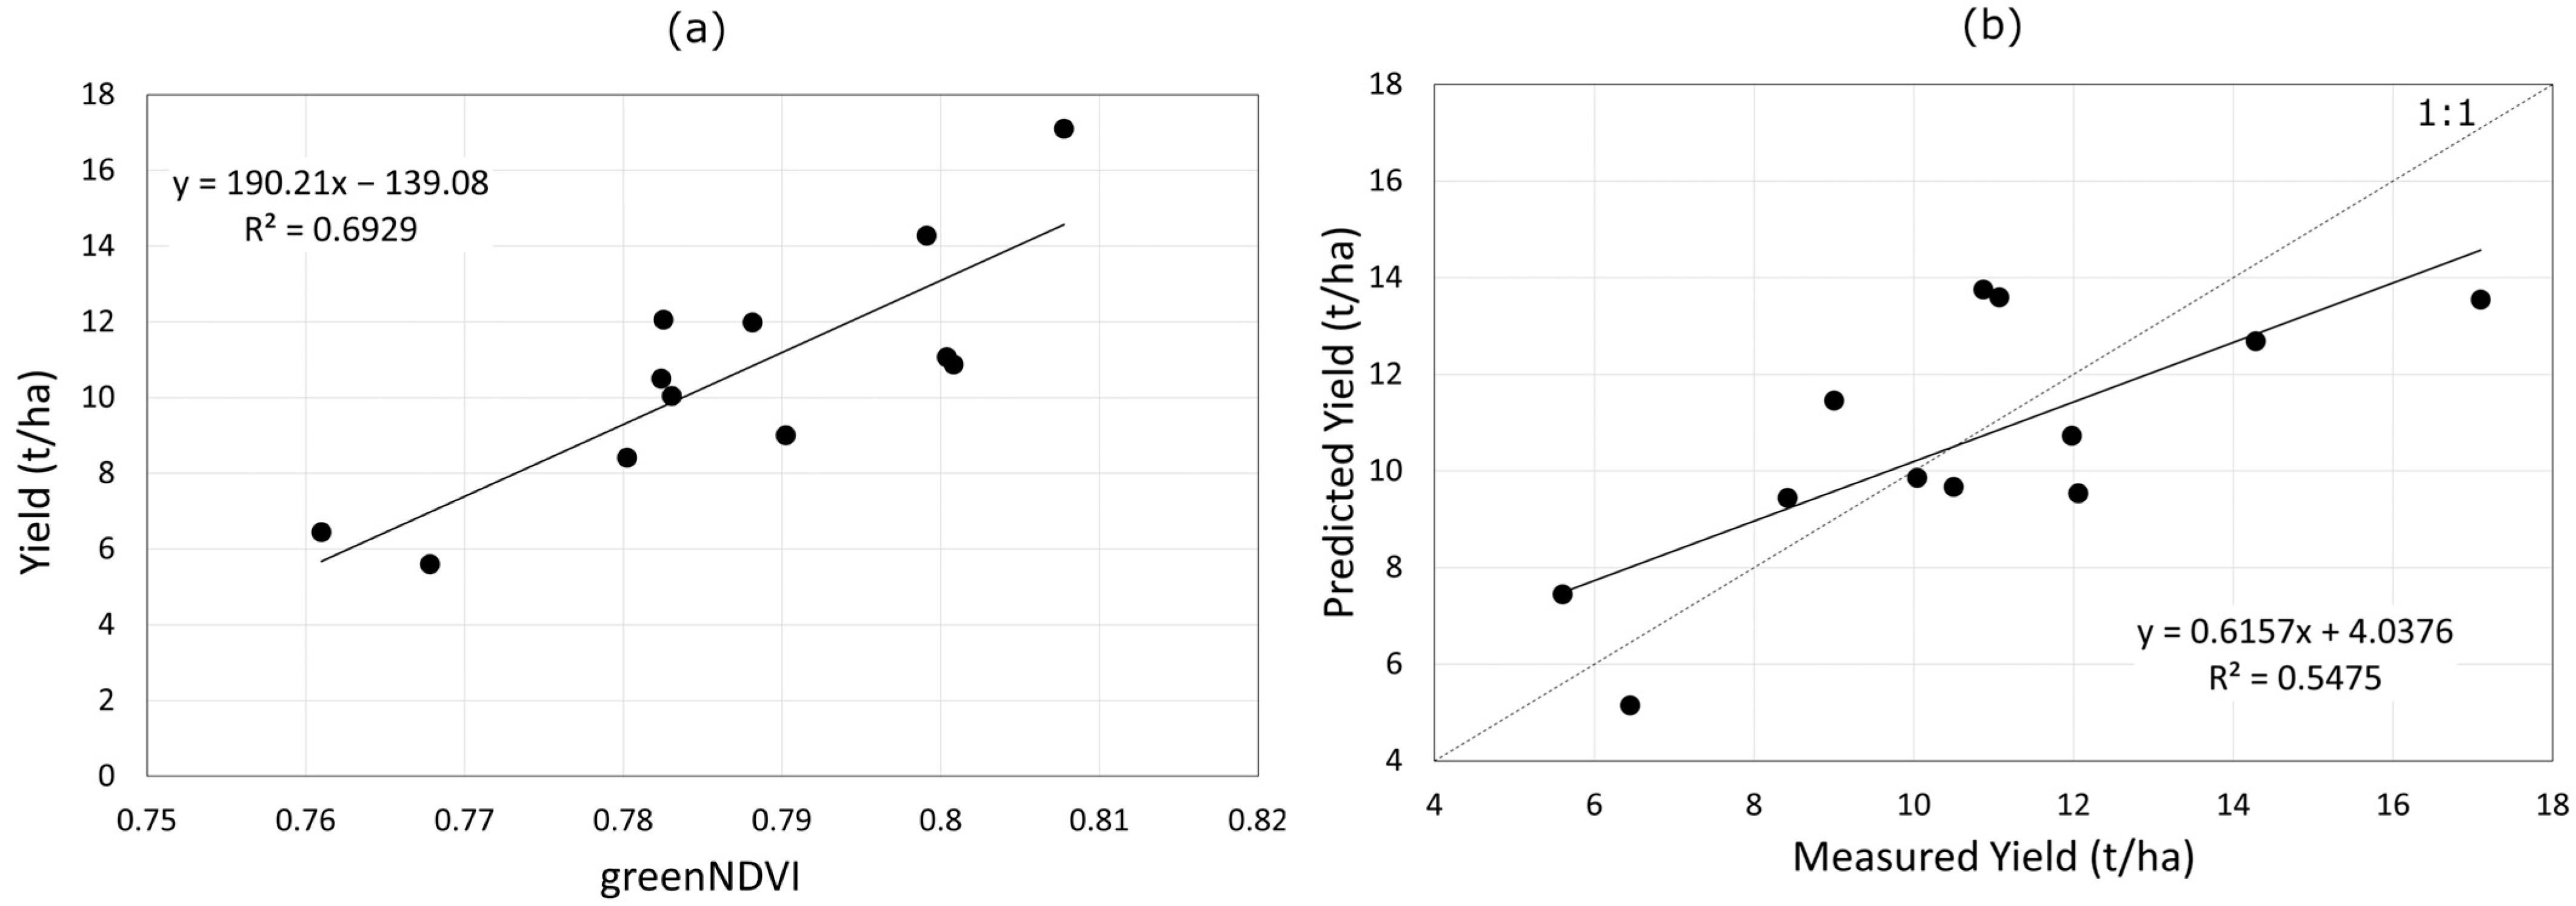
3.2. Winter Wheat Yield Modeling

The correlations between yield and VIs were strongly dependent on the time of image acquisition (dates of registration) throughout the growing season, as observed in Figure 6. With few exceptions, the tested VIs were not significantly (α = 0.05) correlated with yield for the images collected on 26 and 31 March. This is not unexpected because winter wheat was still in a tillering growth stage at that period in time. The correlations became significant starting from registration on 10 April. The highest correlations were observed for the registration on 30 April (up to r = 0.82 for greenNDVI). The correlation coefficients started to decrease gradually from May and the beginning of June. Figure 6 also shows the correlation coefficients for the monthly composite of April. It is interesting to note that the correlations for that composite are comparable to those based on the 10 April and 30 registrations. This consistency suggests that one can use VIs computed from a monthly composite instead of single-date registration without losing prediction capability. This can be of particular importance for application over larger areas where a single cloud-free image covering the entire study area may not be available, thus making temporal compositing the only solution. Notably, the highest correlation for the April composite was achieved again by using the index greenNDVI (GNDVI).
The data from Figure 6 reflect the agro-climatic conditions and winter wheat growth situations through vegetation indices for the period, as the average daily temperatures for the month of March were close to the multi-annual values for the area. An exception was observed for the last decade (10 days) of the month, when a strong cooling started to persist until the second decade of April. This cooling led to a delay in the crop development, until the middle of April, when a sharp warming began, which led to a rapid crop development and recovery.
At the beginning of May, due to the lower volume of rainfall (54% lower than the norm for the period), the crop began to experience temperature stress, therefore straining its development. Abundant precipitation occurred in the last decade of May, which helped the crop development and the crop recovery from the temperature stress and the grain filling. A favorable temperature regime in June in addition to the rainfall at the end of May helped the crop to enter the final stage of development, wax maturity, which is reflected by the good correlation between yield and VIs based on the data from 9 June (Figure 6).
Based on the results from the correlation analysis, greenNDVI computed from the April composite was selected for constructing a yield prediction model. Figure 7a shows the fitted linear regression model where greenNDVI is the predictor. The RMSEcv of the model was 2.1 t/ha, and the rRMSEcv was 19.4%. Figure 7b presents the measured yield against that predicted through the LOOCV. The predicted yield was generally in good agreement with the true yield. Figure 8 shows the map of the biological yield estimated for the entire test field. The yield is calculated using the regression model with greenNDVI (Figure 7a). The range of the predicted yield values showed a good agreement with the field yield samples.
We can deduce that the Sentinel-2 data are suitable to provide accurate estimates of within-field yield variation, provided that ground-based yield data could be used to calibrate the model. Also, for a better interpretation of the results, an eventual integration of Sentinel-2 data with meteorological and soil data into the model would certainly improve the model’s prediction capability. It should also be noted that the regression model was calibrated with a limited number of field samples from a single test field and, therefore, the model may generate less accurate estimates in agricultural fields with higher green NDVI values than the calibration dataset. In the future, the model will be further calibrated with a larger amount of data representative of the entire study area. Cavalaris et al. [31] used Sentinel-2 satellite data to forecast and estimate yield using vegetation indices: NDVI, EVI NDWI and NMDI. They found that the model utilizing vegetation index EVI performed with the highest accuracy when the input data were collected between 20 April and 31 May. In the present study, the best results were achieved when the input data between April and May were provided. Also, when Cavalaris et al. [31] used models based on a single date, as well as models based on maximum seasonal vegetation index values, the achieved results showed similar accuracy.
As water content in wheat plays a role in grain filling and yield formation, some authors use this variable to predict yield due to its role in grain filling [68]. They use NDVI to predict yields. Also, NDVI is a sensitive index to specific phenological developments and it is suitable for predicting and estimating the yields not only of wheat but also of other autumn cereal crops [69]. Skakun et al. [29] also used NDVI to estimate yields. Both NDVI and EVI2 have been found to be useful for yield modeling and perform well. Furthermore, to improve yield estimation and prediction models, Zhao et al. [70] used a combination of the peak values of several vegetation indices obtained during the growing season. In a multivariate analysis determining the best combination for wheat yields’ prediction at the field level, “PeakOSAVI + PeakCI” and “PeakNDVI + PeakCI” were found to be the two combinations showing the highest correlations with the yields [70].
Yield monitoring is essential to inform and develop national food security policies and production management strategies [71]. In addition, this type of open access data can be used by the public sector to limit the insurance risk for insurance companies [72,73], making the service more accessible to farmers. Satellite technologies provide opportunities for a timely signaling of problems in crops and, accordingly, for predicting yields both at the field level and for the whole farm. They enable farmers to make timely decisions to counter potential problems that would have an impact on yields. Unfortunately, a large number of farmers still do not apply this type of technology due to gaps in knowledge about their sufficiency, expediency and the economic effect they will have on the farms [74,75]. It is necessary for farmers to be adequately trained on how to use these technologies to improve their productivity and income, and improve the state of the environment [76].

4. Conclusions

This study considered some important aspects in agricultural area monitoring, namely crop and yield mapping. Both aspects of this research were successfully carried out using Sentinel-2 data. First, crop mapping was performed at different times of the growing season using monthly composites. An April composite was found suitable as input data for mapping the two main winter crops in the study area—wheat and rapeseed—achieving an F1 score over 90% for both crops. Using a June composite, sunflower was classified with high accuracy, while the other summer crop, maize, was more difficult to be recognized. A multitemporal approach combining the April and June composites proved to be advantageous for maize mapping, resulting in 85.6% accuracy for this crop. In contrast to identifying the main winter and summer crops, the grasslands, represented in the study area by alfalfa and pastures/meadows, were more challenging to accurately classify. The multitemporal approach was useful to increase the accuracy of these two classes but the accuracy of alfalfa identification was still low. Both machine learning algorithms used for classification performed well, although SVM provided slightly better results than RF. The produced crop maps allowed crop-specific yield models to be set up in order to map the yield on a regional scale.
Moreover, this study showed that under the agro-climatological conditions in the Upper Thracian Lowland, the data collected during the tillering growth stage were not suitable for yield modeling. The correlation between yield and VIs increased in April and reached its maximum for the input data collected around 30 April, when the crop entered the phonological stage of stem elongation. For the whole study period from March to June, GNDVI proved to be the best-performing index for yield prediction. The highest correlation using a linear regression model was found when an April monthly GNDVI composite was used as input data, allowing us to estimate the winter wheat yield at the municipality level two months before the harvest.

Author Contributions

The general concept and methodology of this study were proposed by I.K., P.D. and M.C.; preprocessing and GEE analysis were performed by P.D. and I.K.; SVM and RF classifications data analyses were performed by P.D. and I.K.; M.C. and B.B. collected and pre-processed the field yield data; the first draft was written by I.K. with major contributions from P.D. and Q.D.; all authors reviewed and edited the text; mentorship and funding acquisition by Q.D., L.F. and L.Z. All authors have read and agreed to the published version of the manuscript.

Funding

This work was supported under contract No. 4000137730/22/I-NB with the European Space Agency as part of the program “Support to European Senior & Young Scientists within the Dragon 5 Cooperation”, Dragon-5 project “Monitoring water productivity in crop production areas from food security perspectives” (No. 57160). This work is partially supported by the Bulgarian Ministry of Education and Science under the National Research Programme “Young scientists and postdoctoral students-2” approved by DCM 206/07.04.2022. China Scholarship (2022.77) approved by China Scholarship Council Fund.

Data Availability Statement

The data used in this study are partially available on request due to restrictions.

Acknowledgments

This study was carried out within the Dragon 5 project ID.57160: Monitoring water productivity in crop production areas from food security perspectives. This work is also partially supported by the National Research Programme “Young scientists and postdoctoral students -2” approved by DCM 206/07.04.2022. We thank the State Fund “Agriculture” at the Bulgarian Ministry of Agriculture, Food, and Forestry for the IACS/LPIS dataset provided. We express our gratitude to Borislav Slavchev, a farmer in the village of Byala Reka, Parvomai municipality, for the access granted to the field from which the wheat yield data were collected.

Conflicts of Interest

The authors declare no conflicts of interest. The funders had no role in the design of the study; in the collection, analyses, or interpretation of data; in the writing of the manuscript; or in the decision to publish the results.

References

  1. FAO. World Food and Agriculture—Statistical Yearbook 2023; FAO: Rome, Italy, 2023. [Google Scholar] [CrossRef]
  2. Godfray, H.C.J.; Beddington, J.R.; Crute, I.R.; Haddad, L.; Lawrence, D.; Muir, J.F.; Pretty, J.; Robinson, S.; Thomas, S.M.; Toulmin, C. Food Security: The Challenge of Feeding 9 Billion People. Science 2010, 327, 812–818. [Google Scholar] [CrossRef] [PubMed]
  3. Gomiero, T.; Pimentel, D.; Paoletti, M.G. Environmental Impact of Different Agricultural Management Practices: Conventional vs. Org. Agric. 2011, 30, 95–124. [Google Scholar] [CrossRef]
  4. Agovino, M.; Casaccia, M.; Ciommi, M.; Ferrara, M.; Marchesano, K. Agriculture, Climate Change and Sustainability: The Case of EU-28. Ecol. Indic. 2019, 105, 525–543. [Google Scholar] [CrossRef]
  5. Xu, X.; Conrad, C.; Doktor, D. Optimising Phenological Metrics Extraction for Different Crop Types in Germany Using the Moderate Resolution Imaging Spectrometer (MODIS). Remote Sens. 2017, 9, 254. [Google Scholar] [CrossRef]
  6. Lollato, R.P.; Edwards, J.T.; Ochsner, T.E. Meteorological Limits to Winter Wheat Productivity in the U.S. Southern Great Plains. F. Crop. Res. 2017, 203, 212–226. [Google Scholar] [CrossRef]
  7. Lang, T.; Yang, Y.; Jia, K.; Zhang, C.; You, Z.; Liang, Y. Estimation of Winter Wheat Production Potential Based on Remotely-Sensed Imagery and Process-Based Model Simulations. Remote Sens. 2020, 12, 2857. [Google Scholar] [CrossRef]
  8. Meng, S.; Zhong, Y.; Luo, C.; Hu, X.; Wang, X.; Huang, S. Optimal Temporal Window Selection for Winter Wheat and Rapeseed Mapping with Sentinel-2 Images: A Case Study of Zhongxiang in China. Remote Sens. 2020, 12, 226. [Google Scholar] [CrossRef]
  9. Shook, J.; Gangopadhyay, T.; Wu, L.; Ganapathysubramanian, B.; Sarkar, S.; Singh, A.K. Crop Yield Prediction Integrating Genotype and Weather Variables Using Deep Learning. PLoS ONE 2021, 16, e0252402. [Google Scholar] [CrossRef]
  10. Venugopal, A.S.A.; Mani, J.; Mathew, R.; Williams, V. Crop Yield Prediction Using Machine Learning Algorithms. Int. J. Eng. Res. Technol. 2021, 9, 1466–1470. [Google Scholar]
  11. Joshi, A.; Pradhan, B.; Gite, S.; Chakraborty, S. Remote-Sensing Data and Deep-Learning Techniques in Crop Mapping and Yield Prediction: A Systematic Review. Remote Sens. 2023, 15, 2014. [Google Scholar] [CrossRef]
  12. Rembold, F.; Atzberger, C.; Savin, I.; Rojas, O. Using Low Resolution Satellite Imagery for Yield Prediction and Yield Anomaly Detection. Remote Sens. 2013, 5, 1704–1733. [Google Scholar] [CrossRef]
  13. Sabini, M.; Rusak, G.; Stanford, B.R. Understanding Satellite-Imagery-Based Crop Yield Predictions. Available online: http://cs231n.stanford.edu/reports/2017/pdfs/555.pdf (accessed on 16 March 2024).
  14. ETH Zurich Yield Prediction with Satellite Images and Machine Learning—Photogrammetry and Remote Sensing|ETH Zurich. Available online: https://prs.igp.ethz.ch/research/current_projects/yield_prediction_with_satellite_images.html (accessed on 16 March 2024).
  15. Thakkar, A.K.; Desai, V.R.; Patel, A.; Potdar, M.B. Post-Classification Corrections in Improving the Classification of Land Use/Land Cover of Arid Region Using RS and GIS: The Case of Arjuni Watershed, Gujarat, India. Egypt. J. Remote Sens. Sp. Sci. 2017, 20, 79–89. [Google Scholar] [CrossRef]
  16. Sharma, R.; Kamble, S.S.; Gunasekaran, A. Big GIS Analytics Framework for Agriculture Supply Chains: A Literature Review Identifying the Current Trends and Future Perspectives. Comput. Electron. Agric. 2018, 155, 103–120. [Google Scholar] [CrossRef]
  17. Boote, K.J.; Prasad, V.; Allen, L.H.; Singh, P.; Jones, J.W. Modeling Sensitivity of Grain Yield to Elevated Temperature in the DSSAT Crop Models for Peanut, Soybean, Dry Bean, Chickpea, Sorghum, and Millet. Eur. J. Agron. 2018, 100, 99–109. [Google Scholar] [CrossRef]
  18. Samaniego, L.; Schulz, K. Supervised Classification of Agricultural Land Cover Using a Modified K-NN Technique (MNN) and Landsat Remote Sensing Imagery. Remote Sens. 2009, 1, 875–895. [Google Scholar] [CrossRef]
  19. Noi, P.; Kappas, M. Comparison of Random Forest, k-Nearest Neighbor, and Support Vector Machine Classifiers for Land Cover Classification Using Sentinel-2 Imagery. Sensors 2018, 18, 18. [Google Scholar] [CrossRef]
  20. Vapnik, V.N. The Nature of Statistical Learning Theory. Nat. Stat. Learn. Theory 1995, 38, 409. [Google Scholar] [CrossRef]
  21. Mountrakis, G.; Im, J.; Ogole, C. Support Vector Machines in Remote Sensing: A Review. ISPRS J. Photogramm. Remote Sens. 2011, 66, 247–259. [Google Scholar] [CrossRef]
  22. Lary, D.J.; Alavi, A.H.; Gandomi, A.H.; Walker, A.L. Machine Learning in Geosciences and Remote Sensing. Geosci. Front. 2016, 7, 3–10. [Google Scholar] [CrossRef]
  23. Belgiu, M.; Drăgu, L. Random Forest in Remote Sensing: A Review of Applications and Future Directions. ISPRS J. Photogramm. Remote Sens. 2016, 114, 24–31. [Google Scholar] [CrossRef]
  24. Hansen, M.; Dubayah, R.; Defries, R. Classification Trees: An Alternative to Traditional Land Cover Classifiers. Int. J. Remote Sens. 2007, 17, 1075–1081. [Google Scholar] [CrossRef]
  25. Zhuo, W.; Huang, J.; Li, L.; Zhang, X.; Ma, H.; Gao, X.; Huang, H.; Xu, B.; Xiao, X. Assimilating Soil Moisture Retrieved from Sentinel-1 and Sentinel-2 Data into WOFOST Model to Improve Winter Wheat Yield Estimation. Remote Sens. 2019, 11, 1618. [Google Scholar] [CrossRef]
  26. Setiyono, T.; Nelson, A.; Holecz, F. Remote Sensing Based Crop Yield Monitoring and Forecasting. Int. Rice Res. Inst. 2014, 25, 711–716. [Google Scholar]
  27. Campoy, J.; Campos, I.; Villodre, J.; Bodas, V.; Osann, A.; Calera, A. Remote Sensing-Based Crop Yield Model at Field and within-Field Scales in Wheat and Barley Crops. Eur. J. Agron. 2023, 143, 126720. [Google Scholar] [CrossRef]
  28. Veloso, A.; Mermoz, S.; Bouvet, A.; Le Toan, T.; Planells, M.; Dejoux, J.F.; Ceschia, E. Understanding the Temporal Behavior of Crops Using Sentinel-1 and Sentinel-2-like Data for Agricultural Applications. Remote Sens. Environ. 2017, 199, 415–426. [Google Scholar] [CrossRef]
  29. Skakun, S.; Vermote, E.; Roger, J.-C.; Franch, B.; Skakun, S.; Vermote, E.; Roger, J.-C.; Franch, B. Combined Use of Landsat-8 and Sentinel-2A Images for Winter Crop Mapping and Winter Wheat Yield Assessment at Regional Scale. AIMS Geosci. 2017, 3, 163–186. [Google Scholar] [CrossRef]
  30. Revill, A.; Florence, A.; MacArthur, A.; Hoad, S.P.; Rees, R.M.; Williams, M. The Value of Sentinel-2 Spectral Bands for the Assessment of Winter Wheat Growth and Development. Remote Sens. 2019, 11, 2050. [Google Scholar] [CrossRef]
  31. Cavalaris, C.; Megoudi, S.; Maxouri, M.; Anatolitis, K.; Sifakis, M.; Levizou, E.; Kyparissis, A. Modeling of Durum Wheat Yield Based on Sentinel-2 Imagery. Agronomy 2021, 11, 1486. [Google Scholar] [CrossRef]
  32. Ravirathinam, P.; Ghosh, R.; Khandelwal, A.; Jia, X.; Mulla, D.; Kumar, V. Combining Satellite and Weather Data for Crop Type Mapping: An Inverse Modelling Approach. arXiv 2024, arXiv:2401.15875. [Google Scholar]
  33. Cen, H.; Wan, L. Crop Yield Estimation and Prediction. In Encyclopedia of Smart Agriculture Technoogies; Zhang, Q., Ed.; Springer: Cham, Switzerland, 2023; pp. 1–13. ISBN 978-3-030-89123-7. [Google Scholar]
  34. Gorelick, N.; Hancher, M.; Dixon, M.; Ilyushchenko, S.; Thau, D.; Moore, R. Google Earth Engine: Planetary-Scale Geospatial Analysis for Everyone. Remote Sens. Environ. 2017, 202, 18–27. [Google Scholar] [CrossRef]
  35. GEE Google Earth Engine, Harmonized Sentinel-2 MSI Dataset. Available online: https://developers.google.com/earth-engine/datasets/catalog/COPERNICUS_S2_SR_HARMONIZED (accessed on 21 March 2024).
  36. Noi Phan, T.; Kuch, V.; Lehnert, L.W. Land Cover Classification Using Google Earth Engine and Random Forest Classifier—The Role of Image Composition. Remote Sens. 2020, 12, 2411. [Google Scholar] [CrossRef]
  37. Svoboda, J.; Štych, P.; Laštovička, J.; Paluba, D.; Kobliuk, N. Random Forest Classification of Land Use, Land-Use Change and Forestry (LULUCF) Using Sentinel-2 Data—A Case Study of Czechia. Remote Sens. 2022, 14, 1189. [Google Scholar] [CrossRef]
  38. Simonetti, D.; Pimple, U.; Langner, A.; Marelli, A. Pan-Tropical Sentinel-2 Cloud-Free Annual Composite Datasets. Data Br. 2021, 39, 107488. [Google Scholar] [CrossRef]
  39. Kollert, A.; Bremer, M.; Löw, M.; Rutzinger, M. Exploring the Potential of Land Surface Phenology and Seasonal Cloud Free Composites of One Year of Sentinel-2 Imagery for Tree Species Mapping in a Mountainous Region. Int. J. Appl. Earth Obs. Geoinf. 2021, 94, 102208. [Google Scholar] [CrossRef]
  40. Praticò, S.; Solano, F.; Di Fazio, S.; Modica, G. Machine Learning Classification of Mediterranean Forest Habitats in Google Earth Engine Based on Seasonal Sentinel-2 Time-Series and Input Image Composition Optimisation. Remote Sens. 2021, 13, 586. [Google Scholar] [CrossRef]
  41. Kussul, N.; Skakun, S.; Shelestov, A.; Lavreniuk, M.; Yailymov, B.; Kussul, O. Regional Scale Crop Mapping Using Multi-Temporal Satellite Imagery. Int. Arch. Photogramm. Remote Sens. Spat. Inf. Sci. 2015, XL-7/W3, 45–52. [Google Scholar] [CrossRef]
  42. Vaudour, E.; Noirot-Cosson, P.E.; Membrive, O. Early-Season Mapping of Crops and Cultural Operations Using Very High Spatial Resolution Pléiades Images. Int. J. Appl. Earth Obs. Geoinf. 2015, 42, 128–141. [Google Scholar] [CrossRef]
  43. Jakimow, B.; Janz, A.; Thiel, F.; Okujeni, A.; Hostert, P.; van der Linden, S. EnMAP-Box: Imaging Spectroscopy in QGIS. SoftwareX 2023, 23, 101507. [Google Scholar] [CrossRef]
  44. Van der Linden, S.; Rabe, A.; Held, M.; Jakimow, B.; Leitão, P.J.; Okujeni, A.; Schwieder, M.; Suess, S.; Hostert, P. The EnMAP-Box—A Toolbox and Application Programming Interface for EnMAP Data Processing. Remote Sens. 2015, 7, 11249–11266. [Google Scholar] [CrossRef]
  45. Breiman, L. Random Forests. Mach. Learn. 2001, 45, 5–32. [Google Scholar] [CrossRef]
  46. Huang, C.; Davis, L.S.; Townshend, J.R.G. An Assessment of Support Vector Machines for Land Cover Classification. Int. J. Remote Sens. 2002, 23, 725–749. [Google Scholar] [CrossRef]
  47. Pedregosa, F.; Varoquaux, G.; Gramfort, A.; Michel, V.; Thirion, B.; Grisel, O.; Blondel, M.; Prettenhofer, P.; Weiss, R.; Dubourg, V.; et al. Scikit-Learn: Machine Learning in Python. J. Mach. Learn. Res. 2011, 12, 2825–2830. [Google Scholar]
  48. James, G.; Witten, D.; Hastie, T.; Tibshirani, R. Introduction; Springer: New York, NY, USA, 2013; Volume 103, pp. 1–14. [Google Scholar]
  49. Kwak, G.H.; Park, N.W. Impact of Texture Information on Crop Classification with Machine Learning and UAV Images. Appl. Sci. 2019, 9, 643. [Google Scholar] [CrossRef]
  50. Congalton, R.G. A Review of Assessing the Accuracy of Classifications of Remotely Sensed Data. Remote Sens. Environ. 1991, 37, 35–46. [Google Scholar] [CrossRef]
  51. Lancashire, P.; Bleiholder, H.; van den Boom, T.; Langelüddeke, P.; Stauss, R.; Weber, E.; Witzenberger, A. A Uniform Decimal Code for Growth Stages of Crops and Weeds. Ann. Appl. Biol. 1991, 119, 561–601. [Google Scholar] [CrossRef]
  52. Shanin, J. Methodology of Field Experiment; BAS—Bulgarian Acadaemy of Sciences: Sofia, Bulgaria, 1977. [Google Scholar]
  53. ISO Cereals and Legumes. Determination of the Mass of 1000 Grains (БДC EN ISO 520:2010). Available online: https://bds-bg.org/bg/project/show/bds:proj:81894 (accessed on 21 March 2024).
  54. GDAL/OGR Contributors GDAL/OGR Geospatial Data Abstraction Software Library. Open Source Geospatial Foundation. Available online: https://gdal.org/index.html (accessed on 21 March 2024).
  55. Rouse, J.W.; Hass, R.H.; Schell, J.A.; Deering, D.W. Monitoring Vegetation Systems in the Great Plains with ERTS. Third Earth Resour. Technol. Satell. Symp. 1973, 1, 309–317. [Google Scholar]
  56. Rondeaux, G.; Steven, M.; Baret, F. Optimization of Soil-Adjusted Vegetation Indices. Remote Sens. Environ. 1996, 55, 95–107. [Google Scholar] [CrossRef]
  57. Huete, A.; Didan, K.; Miura, T.; Rodriguez, E.; Gao, X.; Ferreira, L. Overview of the Radiometric and Biophysical Performance of the MODIS Vegetation Indices. Remote Sens. Environ. 2002, 83, 195–213. [Google Scholar] [CrossRef]
  58. Daughtry, C.S.; Walthall, C.; Kim, M.; de Colstoun, E.B.; McMurtrey, J. Estimating Corn Leaf Chlorophyll Concentration from Leaf and Canopy Reflectance. Remote Sens. Environ. 2000, 74, 229–239. [Google Scholar] [CrossRef]
  59. Gitelson, A.A.; Vina, A.; Arkebauer, T.J.; Rundquist, D.C.; Keydan, G.; Leavitt, B. Remote Estimation of Leaf Area Index and Green Leaf Biomass in Maize Canopies. Geophys. Res. Lett. 2003, 30, 1248. [Google Scholar] [CrossRef]
  60. Gitelson, A.A.; Gritz, Y.; Merzlyak, M.N. Relationships between Leaf Chlorophyll Content and Spectral Reflectance and Algorithms for Non-Destructive Chlorophyll Assessment in Higher Plant Leaves. J. Plant Physiol. 2003, 160, 271–282. [Google Scholar] [CrossRef]
  61. Gitelson, A.; Merzlyak, M.N. Spectral Reflectance Changes Associated with Autumn Senescence of Aesculus hippocastanum L. and Acer platanoides L. Leaves. Spectral Features and Relation to Chlorophyll Estimation. J. Plant Physiol. 1994, 143, 286–292. [Google Scholar] [CrossRef]
  62. Gitelson, A.A.; Kaufman, Y.J.; Merzlyak, M.N. Use of a Green Channel in Remote Sensing of Global Vegetation from EOS-MODIS. Remote Sens. Environ. 1996, 58, 289–298. [Google Scholar] [CrossRef]
  63. Hernandez, I.; Benevides, P.; Costa, H.; Caetano, M. EXPLORING SENTINEL-2 FOR LAND COVER AND CROP MAPPING IN PORTUGAL. Int. Arch. Photogramm. Remote Sens. Spat. Inf. Sci. 2020, XLIII-B3-2020, 83–89. [Google Scholar] [CrossRef]
  64. Tran, K.H.; Zhang, H.K.; McMaine, J.T.; Zhang, X.; Luo, D. 10 m Crop Type Mapping Using Sentinel-2 Reflectance and 30 m Cropland Data Layer Product. Int. J. Appl. Earth Obs. Geoinf. 2022, 107, 102692. [Google Scholar] [CrossRef]
  65. Zhao, H.; Duan, S.; Liu, J.; Sun, L.; Reymondin, L. Evaluation of Five Deep Learning Models for Crop Type Mapping Using Sentinel-2 Time Series Images with Missing Information. Remote Sens. 2021, 13, 2790. [Google Scholar] [CrossRef]
  66. Rußwurm, M.; Courty, N.; Emonet, R.; Lefèvre, S.; Tuia, D.; Tavenard, R. End-to-End Learned Early Classification of Time Series for in-Season Crop Type Mapping. ISPRS J. Photogramm. Remote Sens. 2023, 196, 445–456. [Google Scholar] [CrossRef]
  67. Defourny, P.; Bontemps, S.; Bellemans, N.; Cara, C.; Dedieu, G.; Guzzonato, E.; Hagolle, O.; Inglada, J.; Nicola, L.; Rabaute, T.; et al. Near Real-Time Agriculture Monitoring at National Scale at Parcel Resolution: Performance Assessment of the Sen2-Agri Automated System in Various Cropping Systems around the World. Remote Sens. Environ. 2019, 221, 551–568. [Google Scholar] [CrossRef]
  68. Han, D.; Liu, S.; Du, Y.; Xie, X.; Fan, L.; Lei, L.; Li, Z.; Yang, H.; Yang, G. Crop Water Content of Winter Wheat Revealed with Sentinel-1 and Sentinel-2 Imagery. Sensors 2019, 19, 4013. [Google Scholar] [CrossRef] [PubMed]
  69. Harfenmeister, K.; Itzerott, S.; Weltzien, C.; Spengler, D.; Liao, C.; Huang, X.; Zhang, M.; Shang, J. Detecting Phenological Development of Winter Wheat and Winter Barley Using Time Series of Sentinel-1 and Sentinel-2. Remote Sens. 2021, 13, 5036. [Google Scholar] [CrossRef]
  70. Zhao, Y.; Potgieter, A.B.; Zhang, M.; Wu, B.; Hammer, G.L. Predicting Wheat Yield at the Field Scale by Combining High-Resolution Sentinel-2 Satellite Imagery and Crop Modelling. Remote Sens. 2020, 12, 1024. [Google Scholar] [CrossRef]
  71. Huang, J.; Gómez-Dans, J.L.; Huang, H.; Ma, H.; Wu, Q.; Lewis, P.E.; Liang, S.; Chen, Z.; Xue, J.H.; Wu, Y.; et al. Assimilation of Remote Sensing into Crop Growth Models: Current Status and Perspectives. Agric. For. Meteorol. 2019, 276–277, 107609. [Google Scholar] [CrossRef]
  72. Brock Porth, C.; Porth, L.; Zhu, W.; Boyd, M.; Tan, K.S.; Liu, K. Remote Sensing Applications for Insurance: A Predictive Model for Pasture Yield in the Presence of Systemic Weather. N. Am. Actuar. J. 2020, 24, 333–354. [Google Scholar] [CrossRef]
  73. Benami, E.; Jin, Z.; Carter, M.R.; Ghosh, A.; Hijmans, R.J.; Hobbs, A.; Kenduiywo, B.; Lobell, D.B. Uniting Remote Sensing, Crop Modelling and Economics for Agricultural Risk Management. Nat. Rev. Earth Environ. 2021, 2, 140–159. [Google Scholar] [CrossRef]
  74. Khanal, S.; Kushal, K.C.; Fulton, J.P.; Shearer, S.; Ozkan, E. Remote Sensing in Agriculture—Accomplishments, Limitations, and Opportunities. Remote Sens. 2020, 12, 3783. [Google Scholar] [CrossRef]
  75. Weiss, M.; Jacob, F.; Duveiller, G. Remote Sensing for Agricultural Applications: A Meta-Review. Remote Sens. Environ. 2020, 236, 111402. [Google Scholar] [CrossRef]
  76. Seelan, S.K.; Baumgartner, D.; Casady, G.M.; Nangia, V.; Seielstad, G.A. Empowering Farmers with Remote Sensing Knowledge: A Success Story from the US Upper Midwest. Geocarto Int. 2007, 22, 141–157. [Google Scholar] [CrossRef]
Figure 1. (A) Study area location, Parvomay municipality, in Bulgaria. (B) Sentinel-2 April 2021 composite image over Parvomay municipality (band combination = B11, B5, B4). (C) High-resolution image (from Bing Maps) of the winter wheat field where yield data were collected showing the locations of the sampling plots.
Remotesensing 16 01144 g001
Figure 2. Results of the grid search procedure for selection of the best combination of the SVM parameters, C and Gamma. The combination with the best accuracy is underlined: (a) Scenario 1—April 2021; (b) Scenario 2—June 2021; and (c) Scenario 3—Multitemporal (April and June 2021).
Remotesensing 16 01144 g002
Figure 3. Crop type map of Parvomay municipality produced using the Support Vector Machines method and an April 2021 composite image from Sentinel-2.
Remotesensing 16 01144 g003
Figure 4. Crop type map of Parvomay municipality produced using the Support Vector Machines method and a June 2021 composite image from Sentinel-2.
Remotesensing 16 01144 g004
Figure 5. Crop type map of Parvomay municipality produced using the Support Vector Machines method and a multitemporal image from Sentinel-2 (stack of two composites, April and June).
Remotesensing 16 01144 g005
Figure 6. Pearson’s correlation coefficients between winter wheat yield and the vegetation indices derived from Sentinel-2 data during the growing season. Dashed line indicates the critical value at the level of significance α = 0.05 (df = 10, two-tailed test).
Remotesensing 16 01144 g006
Figure 7. (a) Linear regression model for predicting winter wheat yield based on the greenNDVI from a Sentinel-2 temporal composite imagery of April. (b) Leave-one-out validation of the model.
Remotesensing 16 01144 g007
Figure 8. Predicted crop yield (kg/ha) map at the test field.
Remotesensing 16 01144 g008
Table 1. Lists of the classes considered for each of the three classification scenarios and the corresponding numbers of pixels used for training of the classifiers (see the text for details regarding the generation of the training samples).
Scenario 1—April 2021Scenario 2—June 2021Scenario 3—Multitemporal
(April and June 2021)
ClassPixelsClassPixelsClassPixels
Winter wheat1000Sunflower1000Winter wheat1000
Alfalfa1000Alfalfa669Sunflower1000
Pastures/meadows415Pastures/meadows400Alfalfa1000
Winter rapeseed835Maize1000Pastures/meadows532
Other crops1000Other crops1000Maize1000
Winter rapeseed1000
Other crops1000
Table 2. Vegetation indices used for yield prediction in this study.
Vegetation IndexFormulaReference
NDVI(B8 − B4)/(B8 + B4)Rouse et al. [55]
OSAVI(1 + 0.16) × (B8 − B4)/(B8 + B4 + 0.16)Rondeaux et al. [56]
EVI2.5 × (B8 − B4)/(B8 + 6 × B4 − 7.5 × B2 + 1)Huete et al. [57]
EVI22.5 × (B8 − B4)/(B8 + 2.4 × B4 + 1)Daughtry et al. [58]
GDVIB8 − B3Gitelson et al. [59]
CIrededgeB7/B5 − 1Gitelson et al. [60]
CIgreenB7/B3 − 1Gitelson et al. [60]
reNDVI(B8 − B6)/(B8 + B6)Gitelson and Merzlyak [61]
greenNDVI(B8 − B3)/(B8 + B3)Gitelson et al. [62]
NDRE(B6 − B5)/(B6 + B5)Gitelson and Merzlyak [61]
Table 3. Accuracy measures of the Scenario 1 classification (April 2021). Accuracies reported are for the validation set.
SVMRF
F1 Accuracy (%)
Winter wheat91.490.4
Alfalfa44.744.0
Pastures and meadows74.370.2
Winter rapeseed98.398.2
Other crops83.284.4
Overall Accuracy (%)
82.482.1
Table 4. Error matrix of the SVM classification for Scenario 1 (April 2021) composed using the validation set.
Reference
ClassificationWinter WheatAlfalfaPastures and MeadowsWinter RapeseedOther CropsUA (%)
Winter wheat432,22730131069851,87688.5
Alfalfa11,95849,80715,55916879,06931.8
Pastures and meadows2434242560,6251919,42071.4
Winter rapeseed8410213,9181999.2
Other crops11,06511,0391056170429,65094.8
PA (%)94.475.177.497.474.1
OA (%)82.4
Table 5. Accuracy measures of the Scenario 2 classification (June 2021). Accuracies reported are for the validation set.
SVMRF
F1 Accuracy (%)
Sunflower88.987.9
Alfalfa55.148.4
Pastures and meadows69.654.4
Maize72.364.9
Other crops89.188.5
Overall Accuracy (%)
83.280.3
Table 6. Error matrix of the SVM classification for Scenario 2 (June 2021) composed using the validation set.
Reference
ClassificationSunflowerAlfalfaPastures and MeadowsMaizeOther CropsUA (%)
Sunflower295,24759351489348429,52288.0
Alfalfa17,60459,59619,436368934,31744.3
Pastures and meadows95912,55556,56022010,75969.8
Maize9311151892780,73439,01561.4
Other crops5477225531293746525,47397.3
PA (%)89.972.869.487.982.2
OA (%)83.2
Table 7. Accuracy measures of the Scenario 3 classification (multitemporal). Accuracies reported are for the validation set.
SVMRF
F1 Accuracy (%)
Winter wheat92.191.1
Sunflower91.290.8
Alfalfa65.556.6
Pastures and meadows78.068.7
Maize85.681.6
Winter rapeseed98.098.4
Other crops68.763.1
Overall Accuracy (%)
85.682.5
Table 8. Error matrix of the SVM classification for Scenario 3 (multitemporal) composed using the validation set.
Reference
ClassificationWinter WheatSunflowerAlfalfaPastures and MeadowsMaizeWinter RapeseedOther CropsUA (%)
Winter wheat430,920369012938717133225,51593.1
Sunflower10,940325,6793141996382019861792.2
Alfalfa422611,27051,7839789201924614,72055.1
Pastures and meadows1358730292056,7533621110,05378.6
Maize4222636141310885,8660570683.6
Winter rapeseed16310010,7362899.6
Other crops21,19913,07345014765511776124,19271.8
PA (%)91.190.380.877.487.796.565.8
OA (%)85.6
Disclaimer/Publisher’s Note: The statements, opinions and data contained in all publications are solely those of the individual author(s) and contributor(s) and not of MDPI and/or the editor(s). MDPI and/or the editor(s) disclaim responsibility for any injury to people or property resulting from any ideas, methods, instructions or products referred to in the content.

