Article

Integrating Machine Learning Ensembles for Landslide Susceptibility Mapping in Northern Pakistan

1
State Key Laboratory of Geomechanics and Geotechnical Engineering, Institute of Rock and Soil Mechanics, Chinese Academy of Sciences, Wuhan 430071, China
2
University of Chinese Academy of Sciences, Beijing 100049, China
3
China-Pakistan Joint Research Center on Earth Sciences, Islamabad 45320, Pakistan
4
Hubei Key Laboratory of Geo-Environmental Engineering, Wuhan 430071, China
5
School of Mathematical Science, Zhejiang Normal University, Jinhua 321004, China
6
School of Computer Science, China University of Geosciences, Wuhan 430074, China
7
Badong National Observation and Research Station of Geohazards, China University of Geosciences, Wuhan 430074, China
8
Department of Computer Science, Prince Sattam Bin Abdulaziz University, Al-Kharj 11942, Saudi Arabia
9
Faculty of Computing and Information Technology, King Abdulaziz University, Jeddah 21589, Saudi Arabia
*
Author to whom correspondence should be addressed.
Remote Sens. 2024, 16(6), 988; https://doi.org/10.3390/rs16060988
Submission received: 9 January 2024 / Revised: 26 February 2024 / Accepted: 27 February 2024 / Published: 12 March 2024

Abstract

:
Natural disasters, notably landslides, pose significant threats to communities and infrastructure. Landslide susceptibility mapping (LSM) has been globally deemed as an effective tool to mitigate such threats. In this regard, this study considers the northern region of Pakistan, which is primarily susceptible to landslides amid rugged topography, frequent seismic events, and seasonal rainfall, to carry out LSM. To achieve this goal, this study pioneered the fusion of baseline models (logistic regression (LR), K-nearest neighbors (KNN), and support vector machine (SVM)) with ensembled algorithms (Cascade Generalization (CG), random forest (RF), Light Gradient-Boosting Machine (LightGBM), AdaBoost, Dagging, and XGBoost). With a dataset comprising 228 landslide inventory maps, this study employed a random forest classifier and a correlation-based feature selection (CFS) approach to identify the twelve most significant parameters instigating landslides. The evaluated parameters included slope angle, elevation, aspect, geological features, and proximity to faults, roads, and streams, and slope was revealed as the primary factor influencing landslide distribution, followed by aspect and rainfall with a minute margin. The models, validated with an AUC of 0.784, ACC of 0.912, and K of 0.394 for logistic regression (LR), as well as an AUC of 0.907, ACC of 0.927, and K of 0.620 for XGBoost, highlight the practical effectiveness and potency of LSM. The results revealed the superior performance of LR among the baseline models and XGBoost among the ensembles, which contributed to the development of precise LSM for the study area. LSM may serve as a valuable tool for guiding precise risk-mitigation strategies and policies in geohazard-prone regions at national and global scales.

1. Introduction

Natural disasters, particularly landslides, pose significant threats at various social and economic levels [1]. Landslides occur due to many environmental factors, such as complex topography, seismic activity, weather, etc. Moreover, anthropogenic activity driven by population expansion also results in slope instability, particularly in landslide-prone areas [2]. Landslides mostly result in fatalities, and data reveal that the global mortality rate is approximately one thousand individuals per annum [3]. In this context, the northern area of Pakistan, specifically Gilgit-Baltistan, is prone to the phenomena of landslides. Because more than 90% of Gilgit-Baltistan comprises hills and mountains with severe weather conditions, this region has a higher susceptibility to landslides compared to other regions [4]. Complicated geomorphological structures, including steep slopes, complex geological formations, and soil features, lead to the heightened risk of landslides in this region [4]. According to the Gilgit-Baltistan Disaster Management Authority (GBDMA), in the year 2022, twenty-three people lost their lives, four people went missing, and the Karakoram Highway, a trans-national logistic route, faced severe disruption [5]. The closure of routes at various locations disrupted trade and logistics, regressing economics and mounting social pressure. The most affected areas were the districts of Ghizar, Nagar, Diamer, Ghanche, and Astore, with four hundred and twenty homes being destroyed and seven hundred and forty being damaged [6]. Such facts and figures indicate the vulnerability of the region to landslides, and it becomes imperative to identify locations that are prone to landslides in the region to mitigate their adverse effects [7]. The development and incorporation of landslide susceptibility mapping (LSM) is necessary to mitigate disaster risks through strategic disaster management policies [8].
LSM refers to the probability of the occurrence of a landslide in a given region depending on multiple factors [9]. It requires comprehensive data collection regarding influencing factors, focusing not only on historical sites but also environmental conditions and rendering the probability of occurrences and re-occurrences [10]. In this regard, along with compulsory information, the utilization of cutting-edge mathematical models also remains pivotal to obtaining precise results. The prediction of landslide risk entails the application of different models, for instance, weight of evidence (WOE) [11], frequency ratio (FR) [12], the analytic hierarchy process (AHP) [13], and fuzzy logic (FL) [14], which are among the most elementary and widely used approaches. Contemporarily, these approaches are considered conventional and are being replaced by machine learning (ML) models.
In the past few years, there has been an upward pattern in the application of ML techniques, for instance, support vector machines (SVMs) for identifying landslide-prone locations [15,16,17], logistic model trees (LMTs) [18,19], artificial neural networks (ANNs) [20,21,22], and decision trees (DTs) [23,24,25]. Most scholars claim that ML techniques are comparatively more efficient and effective than conventional approaches. For example, Duan, Gong Hao et al. (2023) documented that a support vector machine outperformed the AHP for the prediction of landslides [26]. Other researchers have also suggested integrating various distinct models into more sophisticated hybrid algorithms with the aim of improving the outcomes and predictive ability of such methods [27]. The research conducted by Chinh Luu et al. (2023) strengthens this claim by demonstrating that the hybrid combination of the multiboost algorithm and naive Bayes tree outperformed both multilayer perceptron and support vector machine models [28]. However, as noted by Wolpert and David H (1996), there is no single technique that will produce the best results across all regions [29]. Every area exhibits diverse features of geomorphology, topography, hydrology, and anthropological activities [30]. Consequently, it is necessary to investigate and evaluate alternative methods to determine the most effective one.
Against this backdrop, the primary goal of this study was to train baseline and ensemble models to assess the LSM of the current study area and pinpoint the most efficient model. In the current investigation, the authors employed three baseline algorithms, namely logistic regression (LR), K-nearest neighbors (KNN), and a support vector machine (SVM), and six ensemble algorithms, namely random forest (RF), a Light Gradient-Boosting Machine (LGBM), Extreme Gradient Boosting (XGBoost), Adaptive Boosting (AdaBoost), Dagging ensemble, and Cascade Generalization (CG) ensemble. The results of these models were verified using the Kappa index, accuracy (%), and the “receiver operating curve (ROC)” to determine their validity. This research aimed to fuse ML models for LSM, as only traditional approaches have been implemented previously.

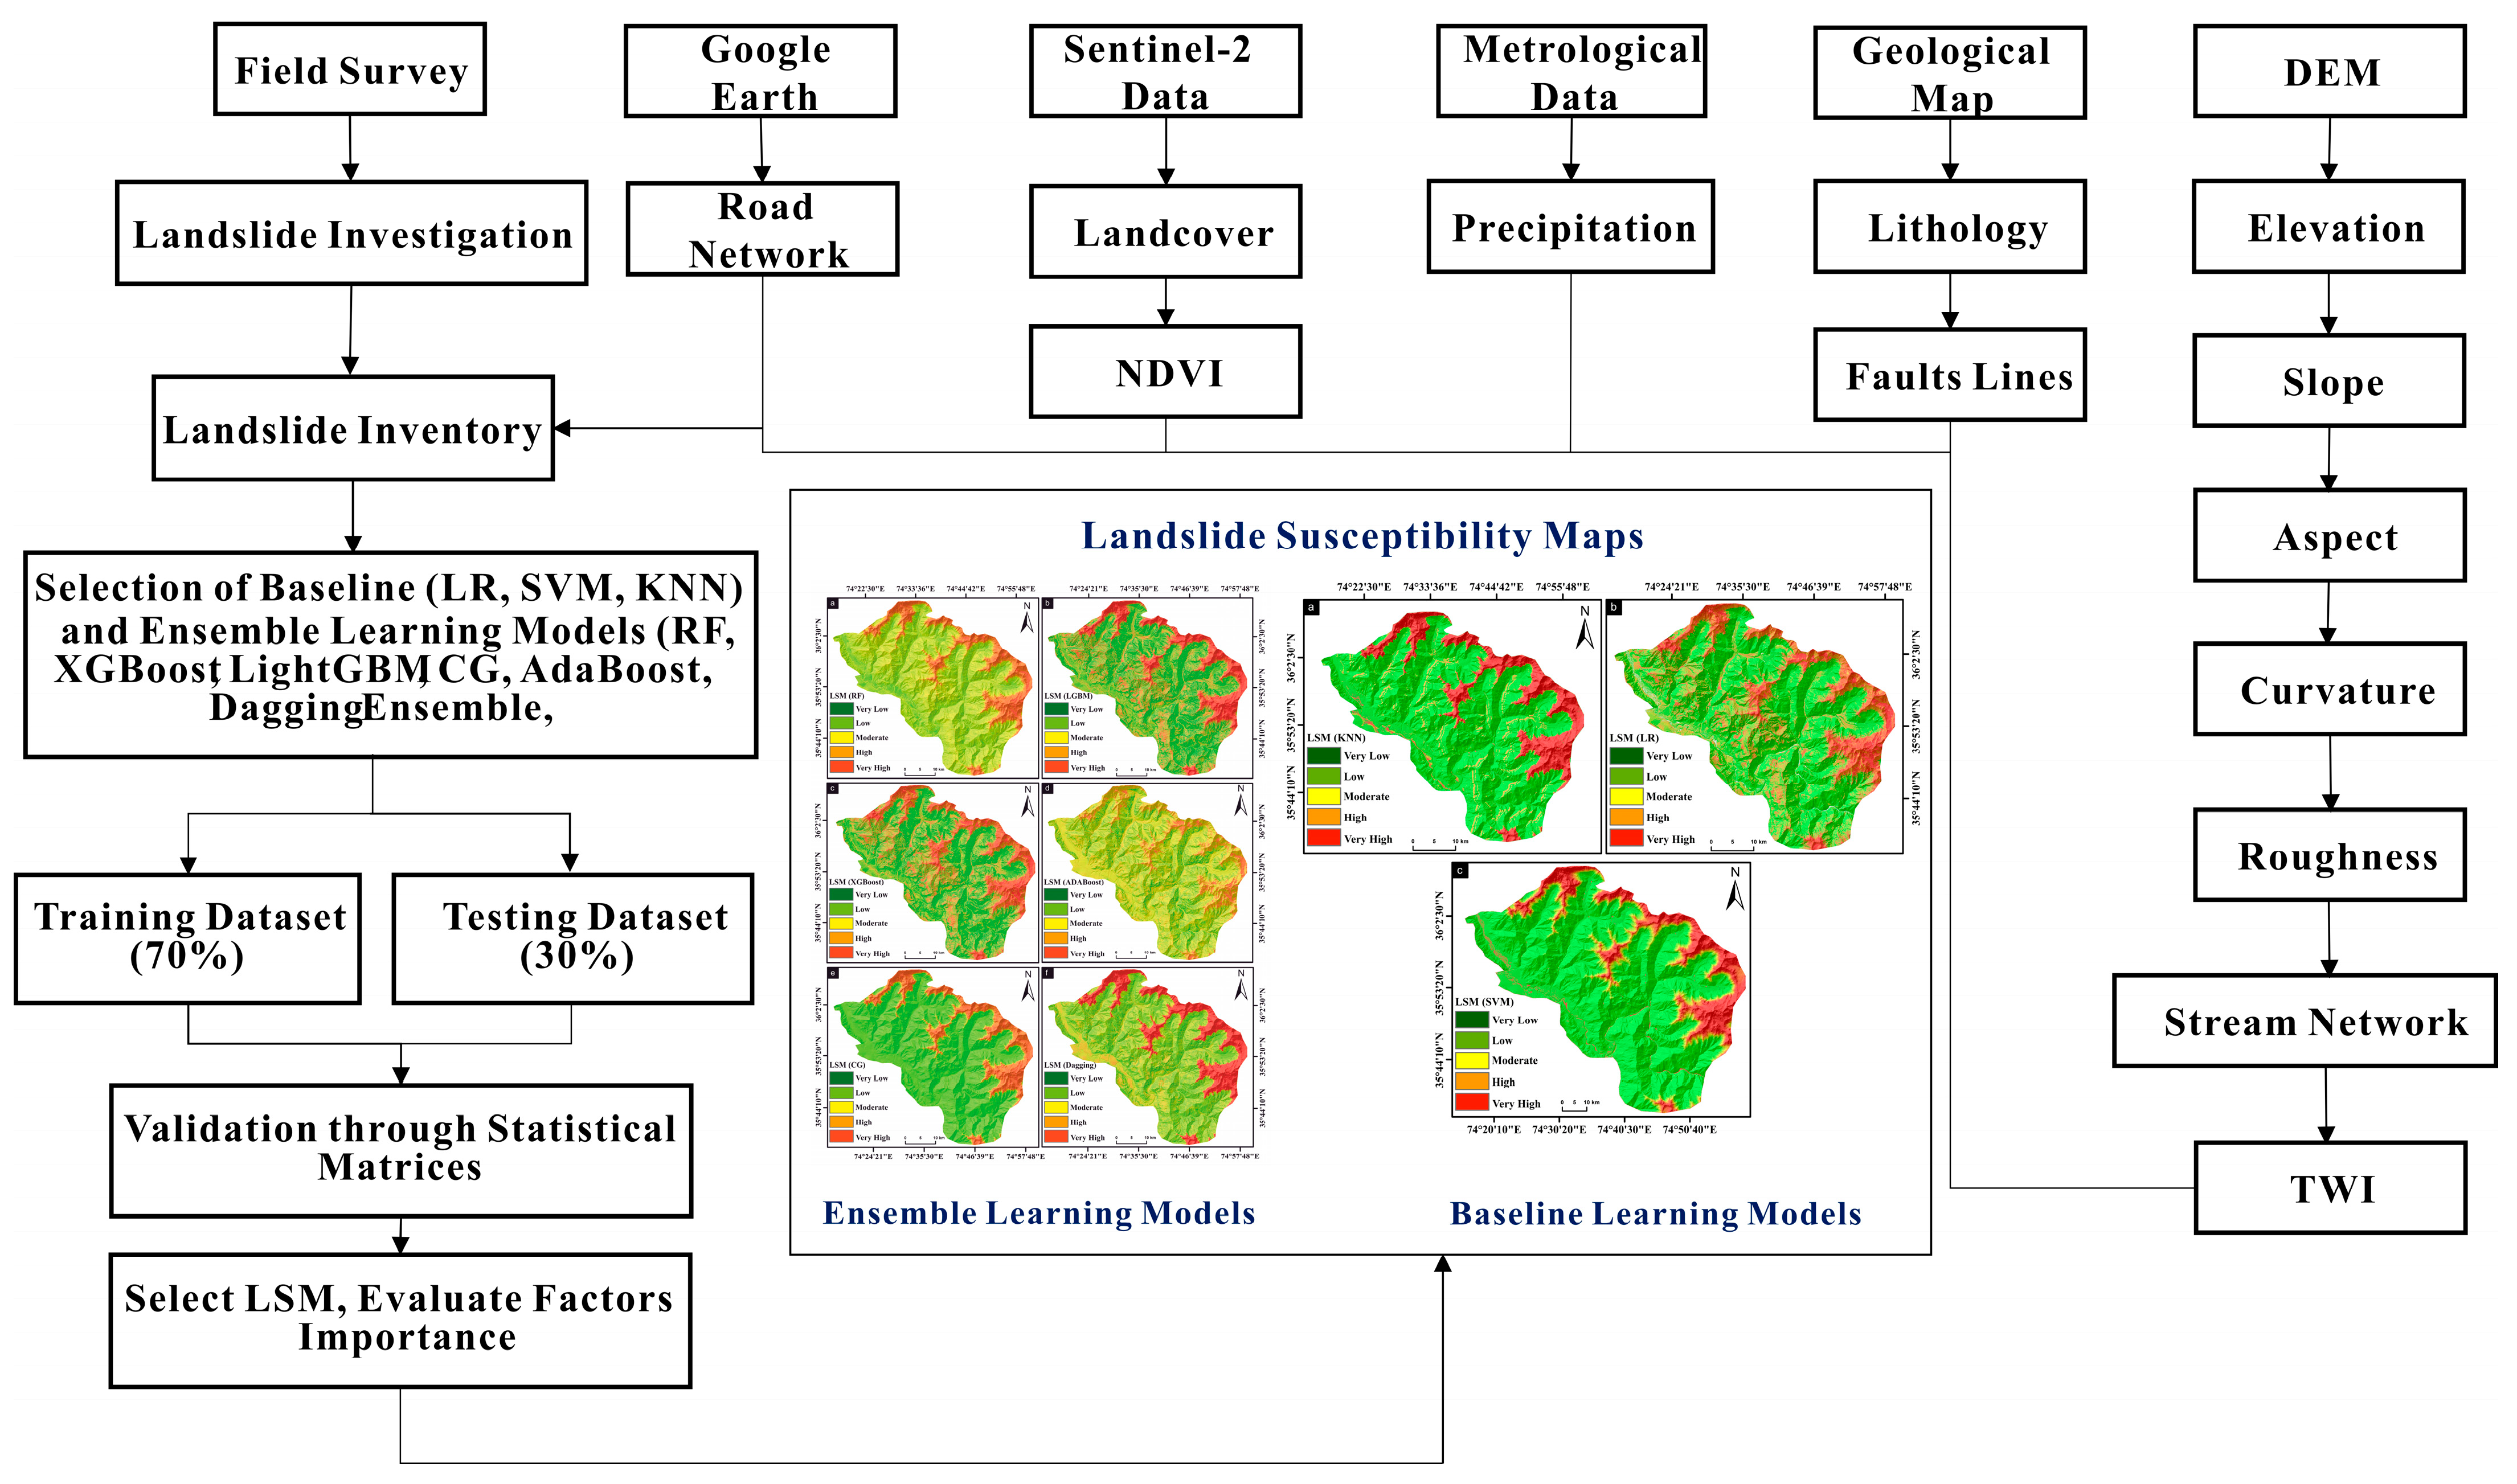
2. Materials and Methods

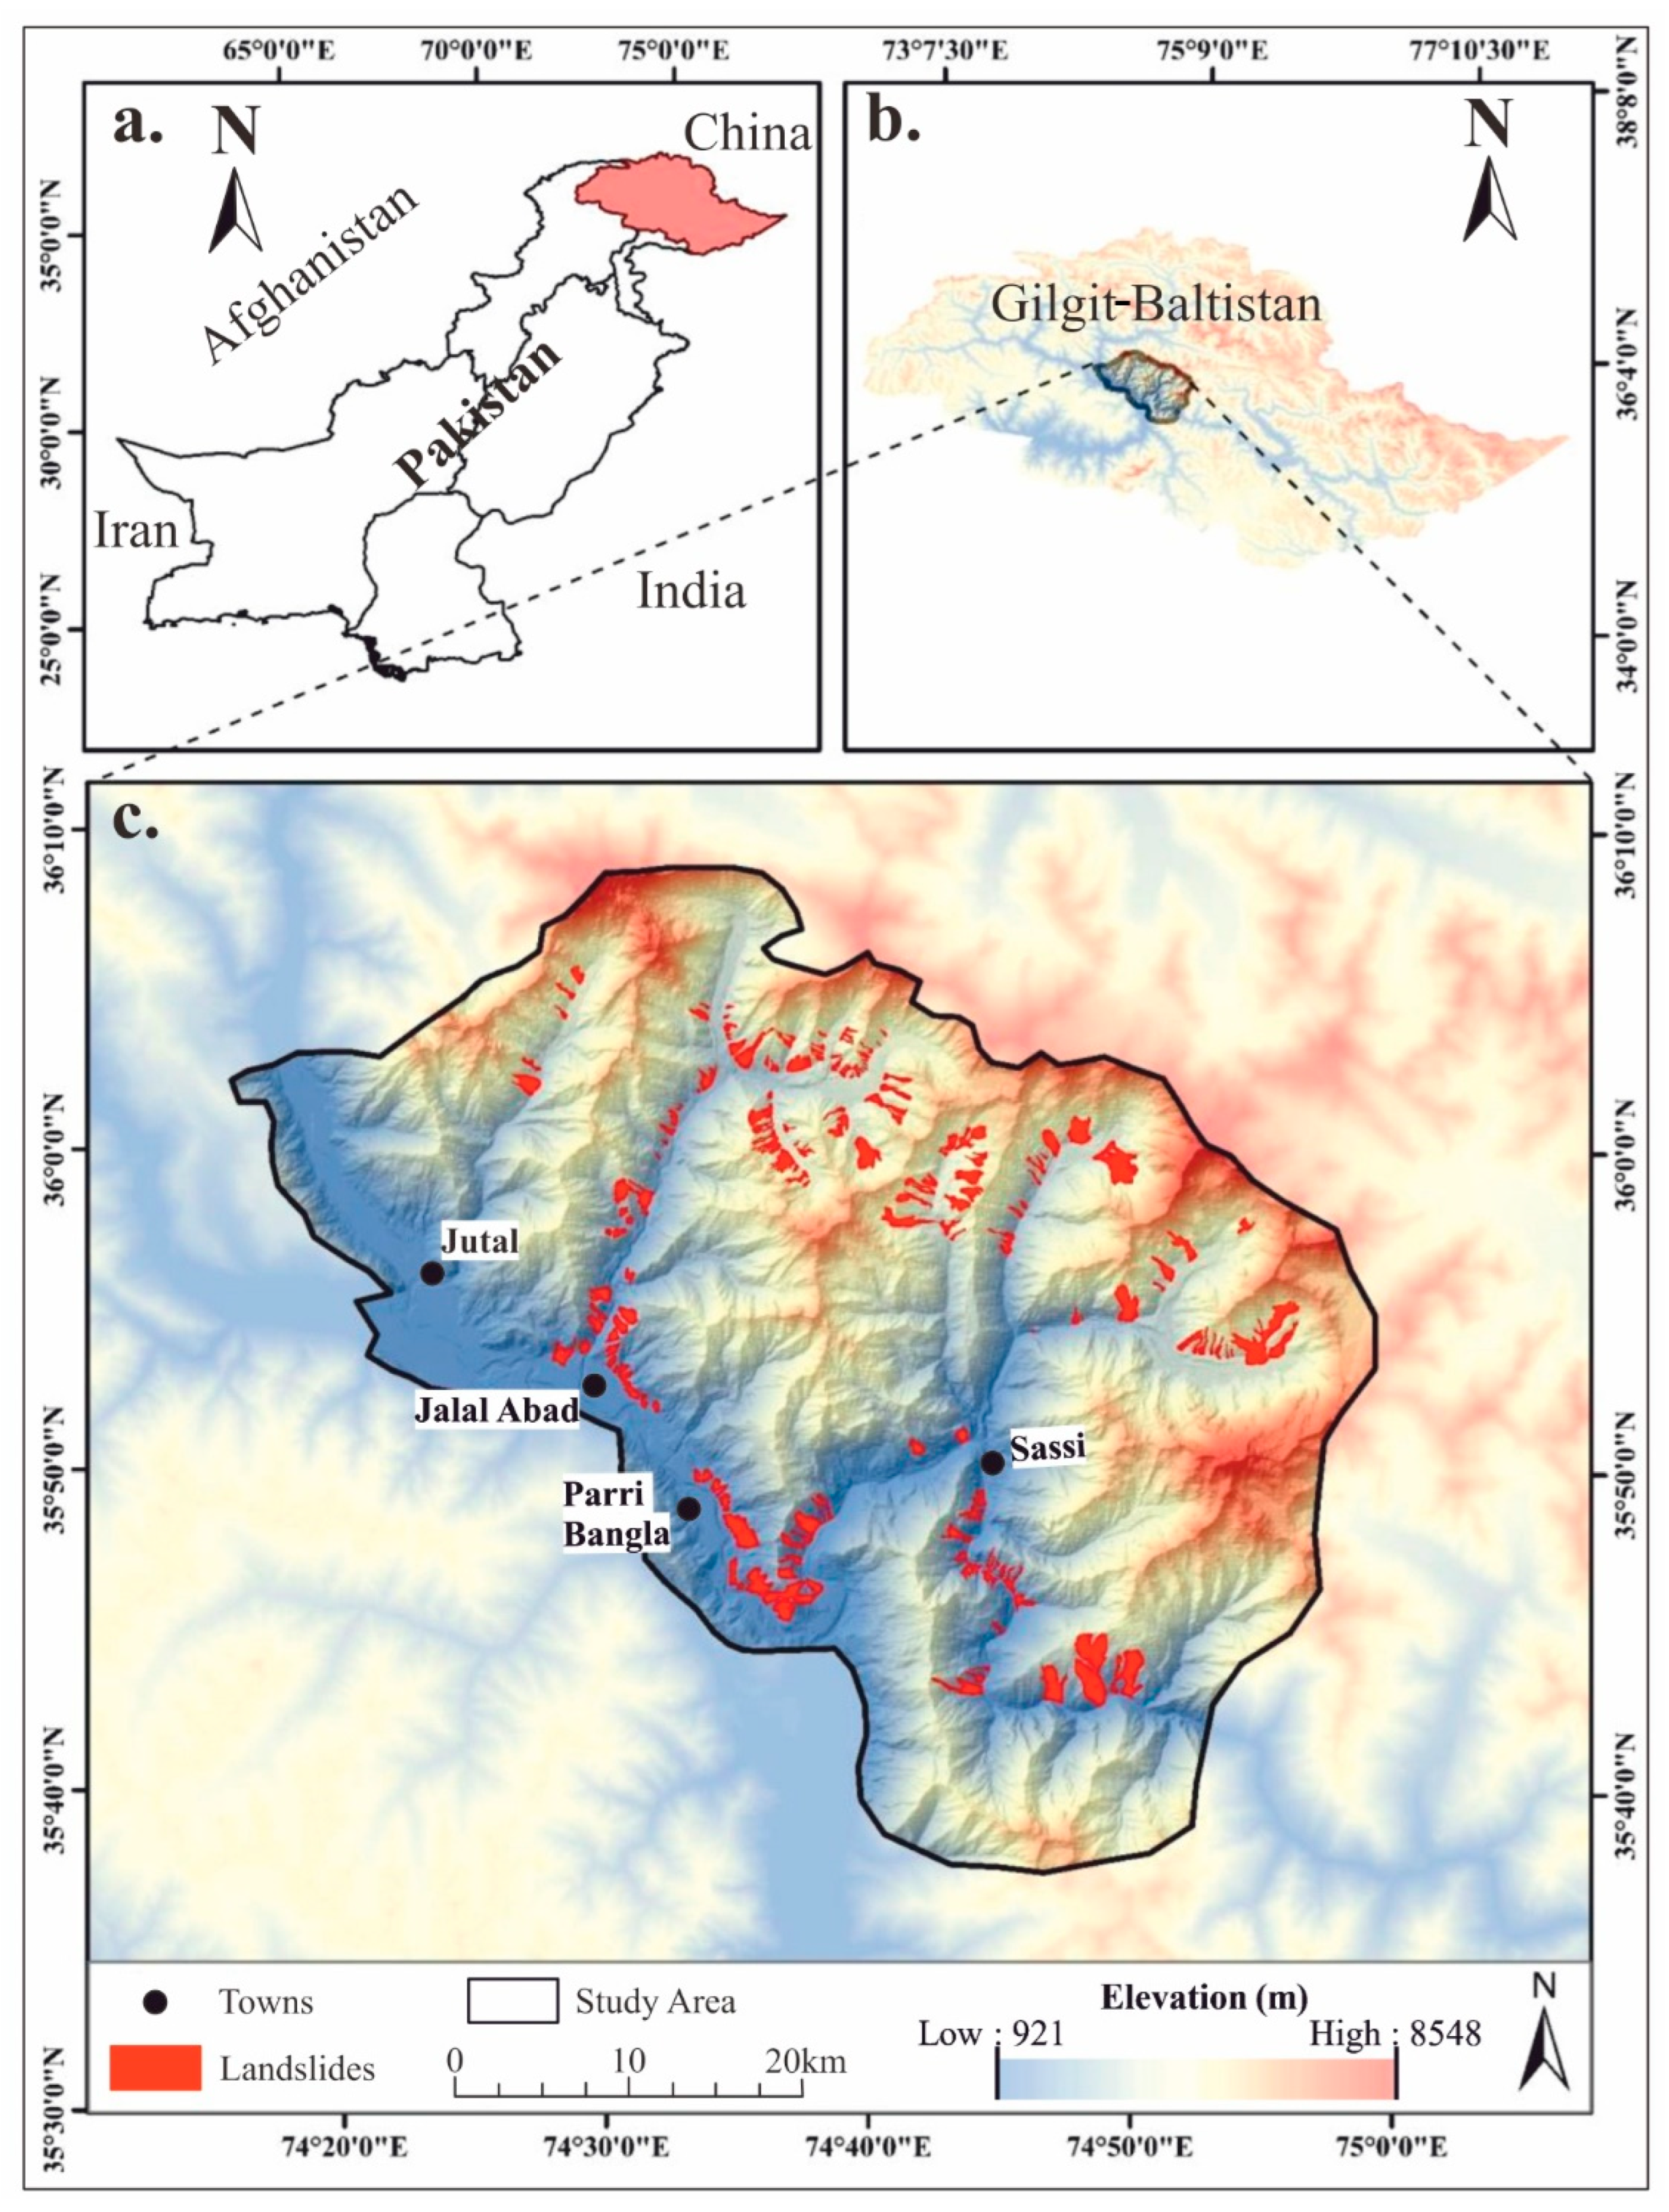
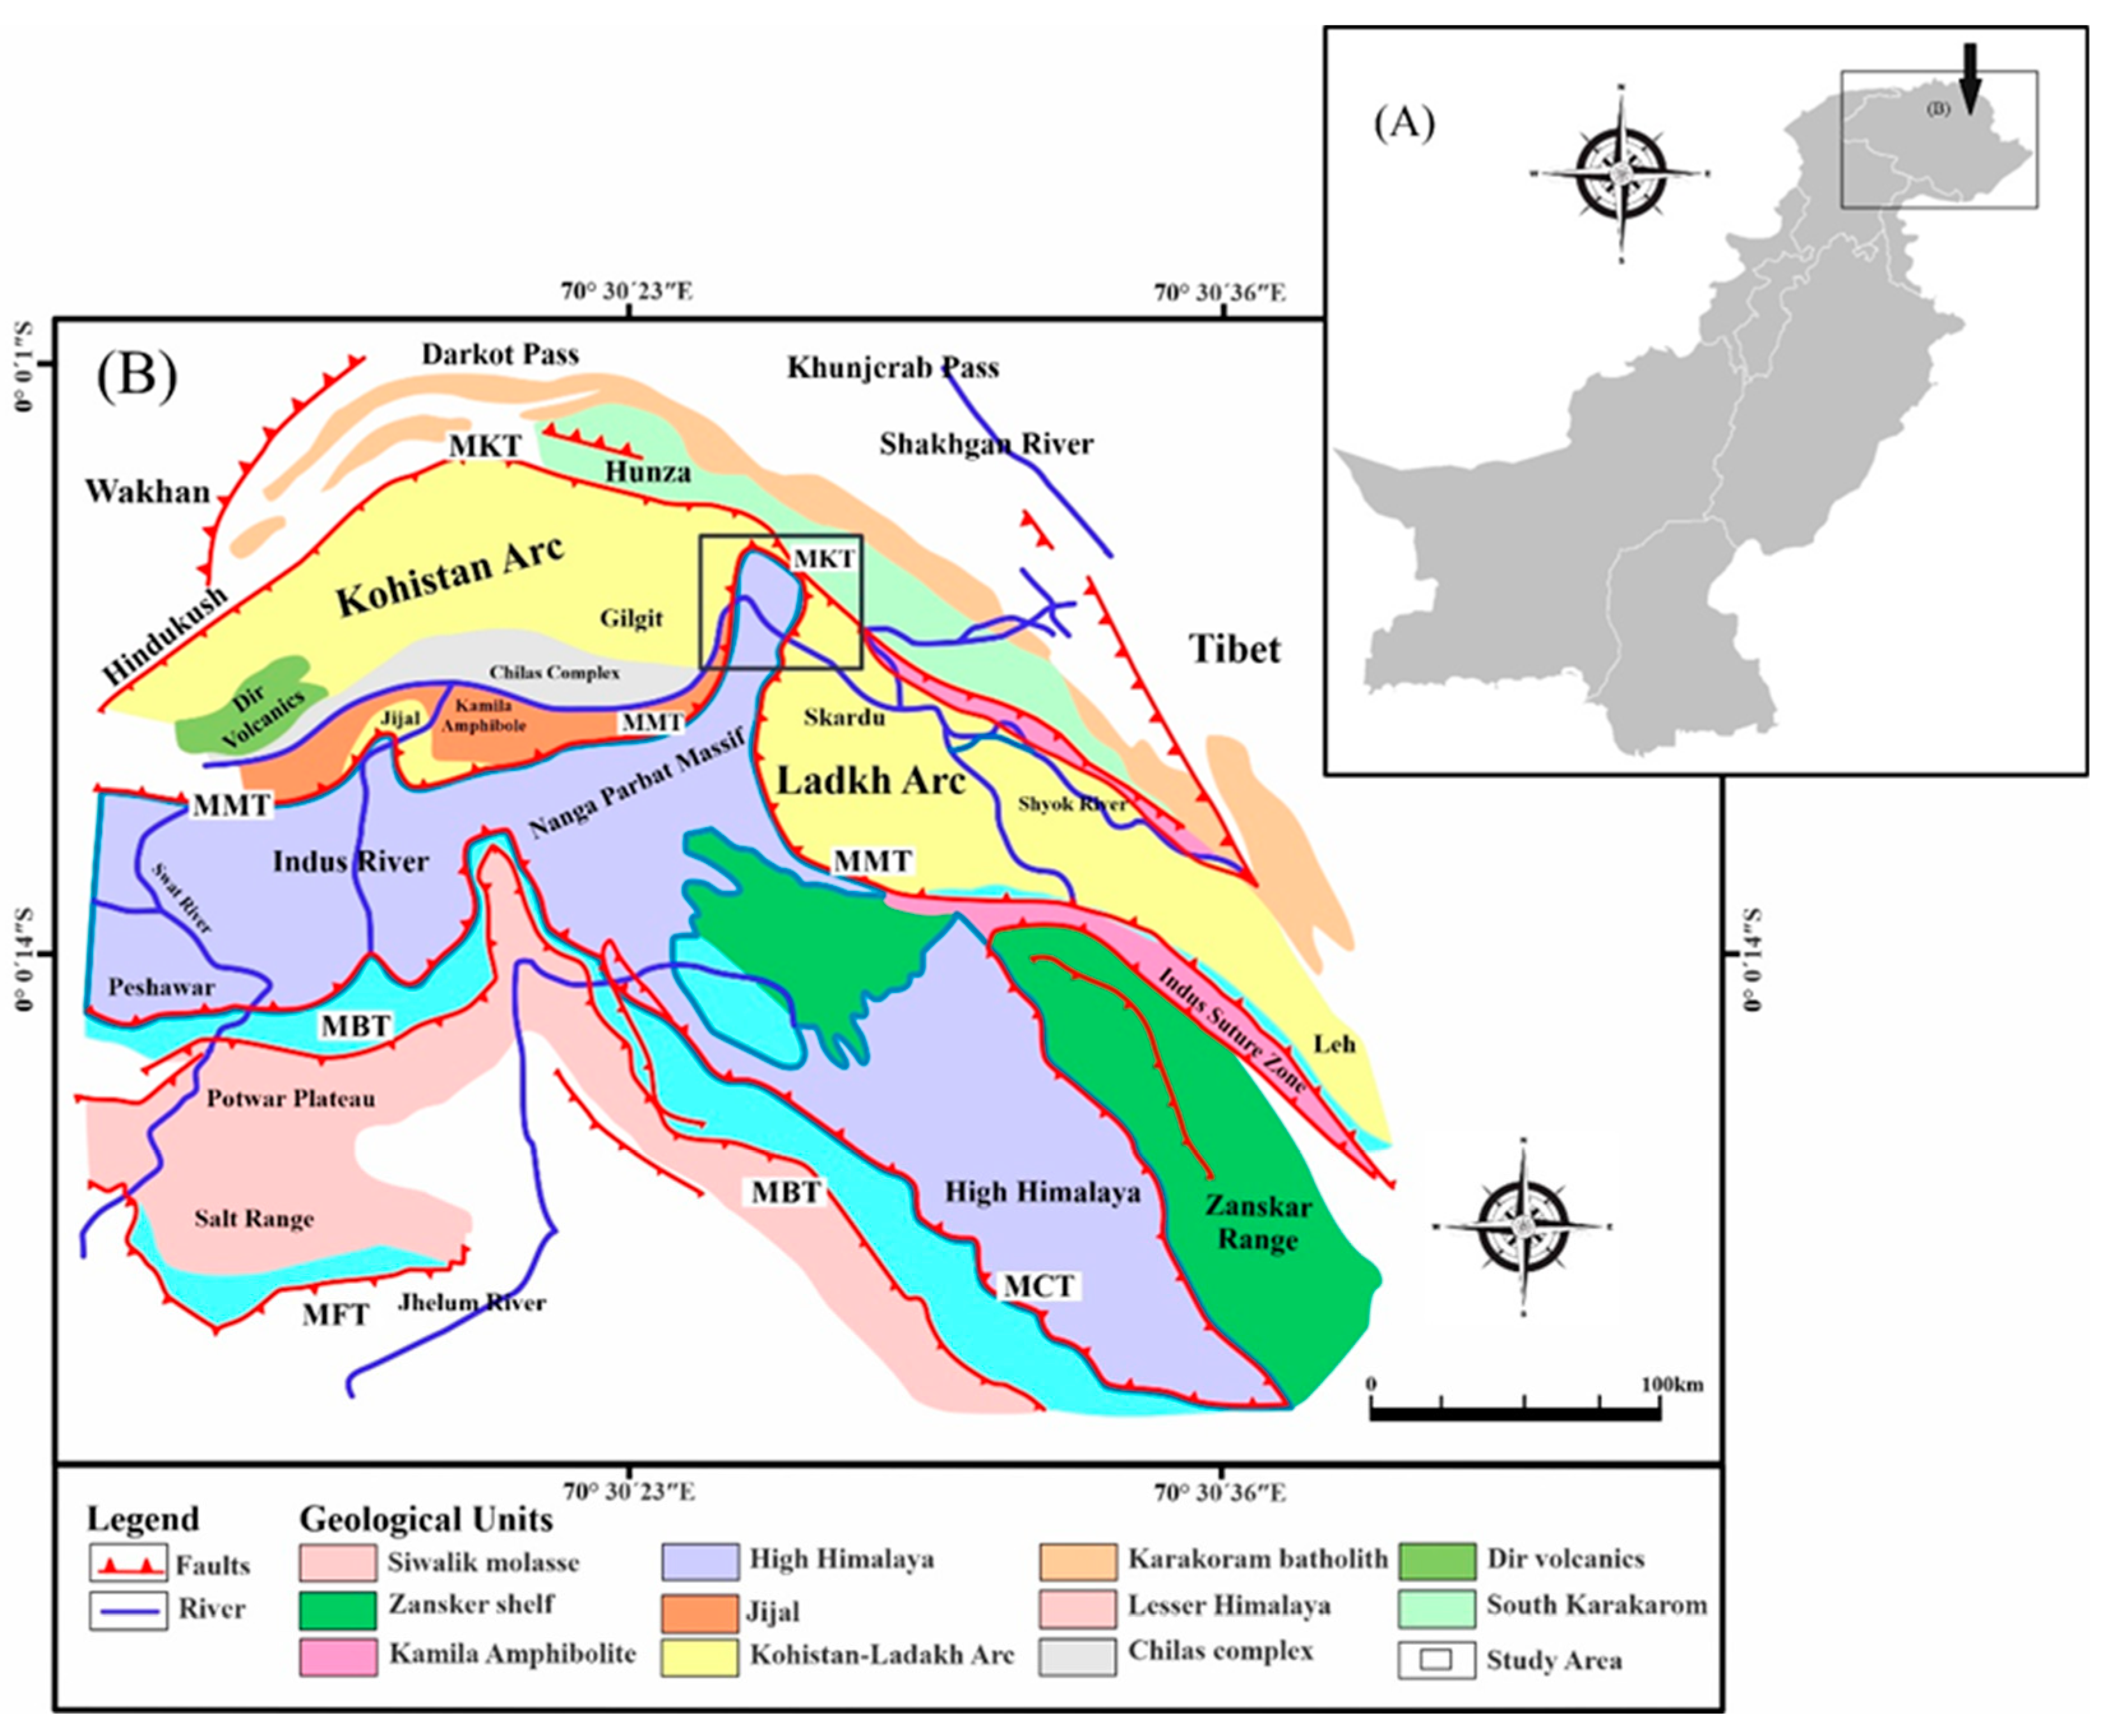
2.1. Study Area and Geological Setting

The proposed study area is situated in the Central Karakoram National Park within Gilgit-Baltistan, Pakistan, encompassing the Haramosh Valley, the Bagrote Valley, and sections of the Nagar Valley (Figure 1). Covering approximately 10,000 km2, the Central Karakoram National Park stands as one of Gilgit-Baltistan’s foremost protected areas, boasting a wealth of natural resources [31]. Dominated by extensive glaciers settled in alpine regions and freshwater sourced from high mountain glaciers, the park features slopes ranging from 50 to 70 degrees and elevations spanning 1400 to 7788 m above sea level. Despite monthly winter temperatures dropping below 0 °C in the prominent valleys above 2300 m in altitude, the maximum temperature in the summertime can surpass 40 °C. The research area is positioned within one of the most seismically active zones globally, flanked by active mountainous ranges to the north in the Himalayas, northwest in the Hindu Kush Mountains, and southwest in the Suleiman Mountains [32,33]. The northward movement of the Indian tectonic plate at a rate of 31 mm per year, subducting beneath the Eurasian continent, escalates seismic risks in Pakistan, India, and Afghanistan [34].
The geological narrative of the region unfolds with the prevalence of an ancient Orthogneiss complex, identified as the Nanga Parbat Gneiss and further categorized into Shengus and Iskere gneisses by Madin and Lawrence [35]. The origination dates back to the Proterozoic era; the gneisses went through significant alterations before the establishment of Himalayan tectonics. Within this complex geological framework, the Kohistan Sequence takes the central stage, characterized by diverse and distinct types of metabasic rock featuring the Shuta Gabbro, and standing out with the presence of sediments and volcanic rocks along the northern boundary [36]. Noteworthy characteristics—for example, lamprophyres and biotite granite sheets—contribute to the formation of the Main Mantle Thrust in the Indus Gorge [37]. The Sassi area of the Indus Gorge, especially along the Main Mantle Thrust, is particularly dominated by landslides. Here, significant structural discontinuities are exhibited in overlapping units from the Kohistan and Indian continental sequences, which render the region highly susceptible to landslides (Figure 2). As the geological makeup of the Bagrote area is explored, the Chalt Group dominates, exhibiting diverse volcanic and sedimentary rocks. Datuchi serves as a main location illustrating the interface between the Kohistan arc series and the Chalt Group [36]. Intrusions by diorites and granites, representing younger igneous stages, add to the geological complexity. The Dobani-Dasau ultramafic lineament strip in this area, encompassing ultramafic rocks, increases the susceptibility to landslides (Figure 2). Further south, the Terigeneous Formation in the Nagar Valley, characterized by conglomerates and phibolites, is prone to landslides due to numerous structural discontinuities [36]. Across the entire study region, Quaternary deposits amplify the risk of landslides, creating a geological landscape where various rock types, structural intricacies, and the influence of Quaternary deposits collectively contribute to the heightened susceptibility to landslides in specific formations [36].

2.2. Dataset

In conformity with the current research objectives, a topographic assessment within the research region was performed. For this, we employed a digital elevation model (DEM) with a resolution of 12.5 m rooted in the Alaska Satellite Facility (ASF) datasets derived from ALOS-PALSAR. The data were accessed on 29 June 2023 through https://search.asf.alaska.edu/. DEM provided detailed illustrations of the terrain. However, we utilized high-resolution SPOT-5 imagery for landslide inventory generation. Acquired from the SPOT-5 satellite, this imagery offered detailed coverage of the research area, facilitating the accurate identification and mapping of landslides [39]. The assessment benefitted from the enhanced capabilities of SPOT-5, ensuring a thorough examination of landslide occurrences. Creating a land-cover map involved using Sentinel-2 imagery from the Copernicus dataset featuring a spatial resolution of 10 m (accessed on 30 August 2023). To explore the geological features in the research area, ArcGIS software version 10.8 was used for processing geological maps and fault lines [40]. To evaluate the correlation between precipitation and landslides, we obtained annual precipitation data from the GIOVANNI online database system (https://giovanni.gsfc.nasa.gov/giovanni/, accessed on 19 September 2023). This step was grounded in the recognized direct proportional relationship between rainfall and landslide events. The geographic coordinate of WGS84 Datum in the UTM-Zone 43 system was employed throughout the analysis. Figure 3 illustrates a flowchart outlining the current research, and afterward, a concise explanation of the steps is provided.
Step 1 involved creating a map of landslides by verifying a total of 228 landslide polygons. Consistent with previous work, a corresponding sample of 228 non-landslide sites was developed concerning the landslide locations [41].
In Step 2, the correlation-based feature selection technique and random forest classifier were employed to select 12 landslide predictors for the subsequent analysis. The approximate contribution of each predictor was then calculated based on landslide susceptibility [42].
In Step 3, aiming to model landslide susceptibility in the research field, three baseline algorithms (LR, KNN, SVM) and six ensemble algorithms (RF, LightGBM, XGBoost, AdaBoost, Dagging, CG) were selected.
Step 4 involved creating the training and validation datasets. The 228 landslide sites were randomly divided, with 70% allocated for training the models and the remaining 30% for validating the models.
In Step 5, nine models were established and executed using the training dataset, consisting of landslide sites and 12 predictors. Simultaneously, statistical indices such as ROC-AUC, ACC%, and the Kappa index were calculated using both the training and validation datasets to assess the models’ performance.
In Step 6, the most accurate model was used to assess landslide susceptibility, which was determined by statistical metrics.
In Step 7, to produce the landslide susceptibility map, the landslide predictors were utilized in the GIS environment. The significance was determined by the best model. The map was stratified into five levels utilizing the natural breaks technique in ArcGIS software, and the stratifications were very low, low, medium, high, and very high susceptibility [43].

2.3. Landslide Inventory

An integral aspect of LSM consists of the generation of inventory maps exhibiting detailed landslide occurrences [44]. Landslide inventory maps have several objectives, ranging from the documentation of diverse landslide types to identifying geographical locations within a specific region. These play a significant role in supplying fundamental data for the formulation of models related to landslide risk or susceptibility [44,45]. Moreover, these maps quantify the limits of mass movements, determine statistical indexes for the frequency and spatial distribution of failures of a slope, and regress the consequences of particular landslide-triggering events, i.e., intense rainfall, rapid snowmelt, seismic activity, etc. [46]
In this research, a landslide inventory was established utilizing visual image categorization techniques while employing SPOT-5 images. Additionally, field verification was conducted for the confirmation of identified landslides, and necessary adjustments were made. The generation of a precise inventory map incorporating cutting-edge information on recent landslide occurrences is a crucial element of LSM through ML methodologies [44]. In this context, a comprehensive dataset interrelated to landslide occurrences over the last decade was gathered. Consequently, the present study area generated a total of 228 landslides, which were detected and derived from obtainable reports and field surveys. Subsequently, an equivalent number of non-landslide locations were randomly distributed and divided in a ratio of 70/30 for the training and validation of the models using the ‘Create random point tool’ [47,48,49].

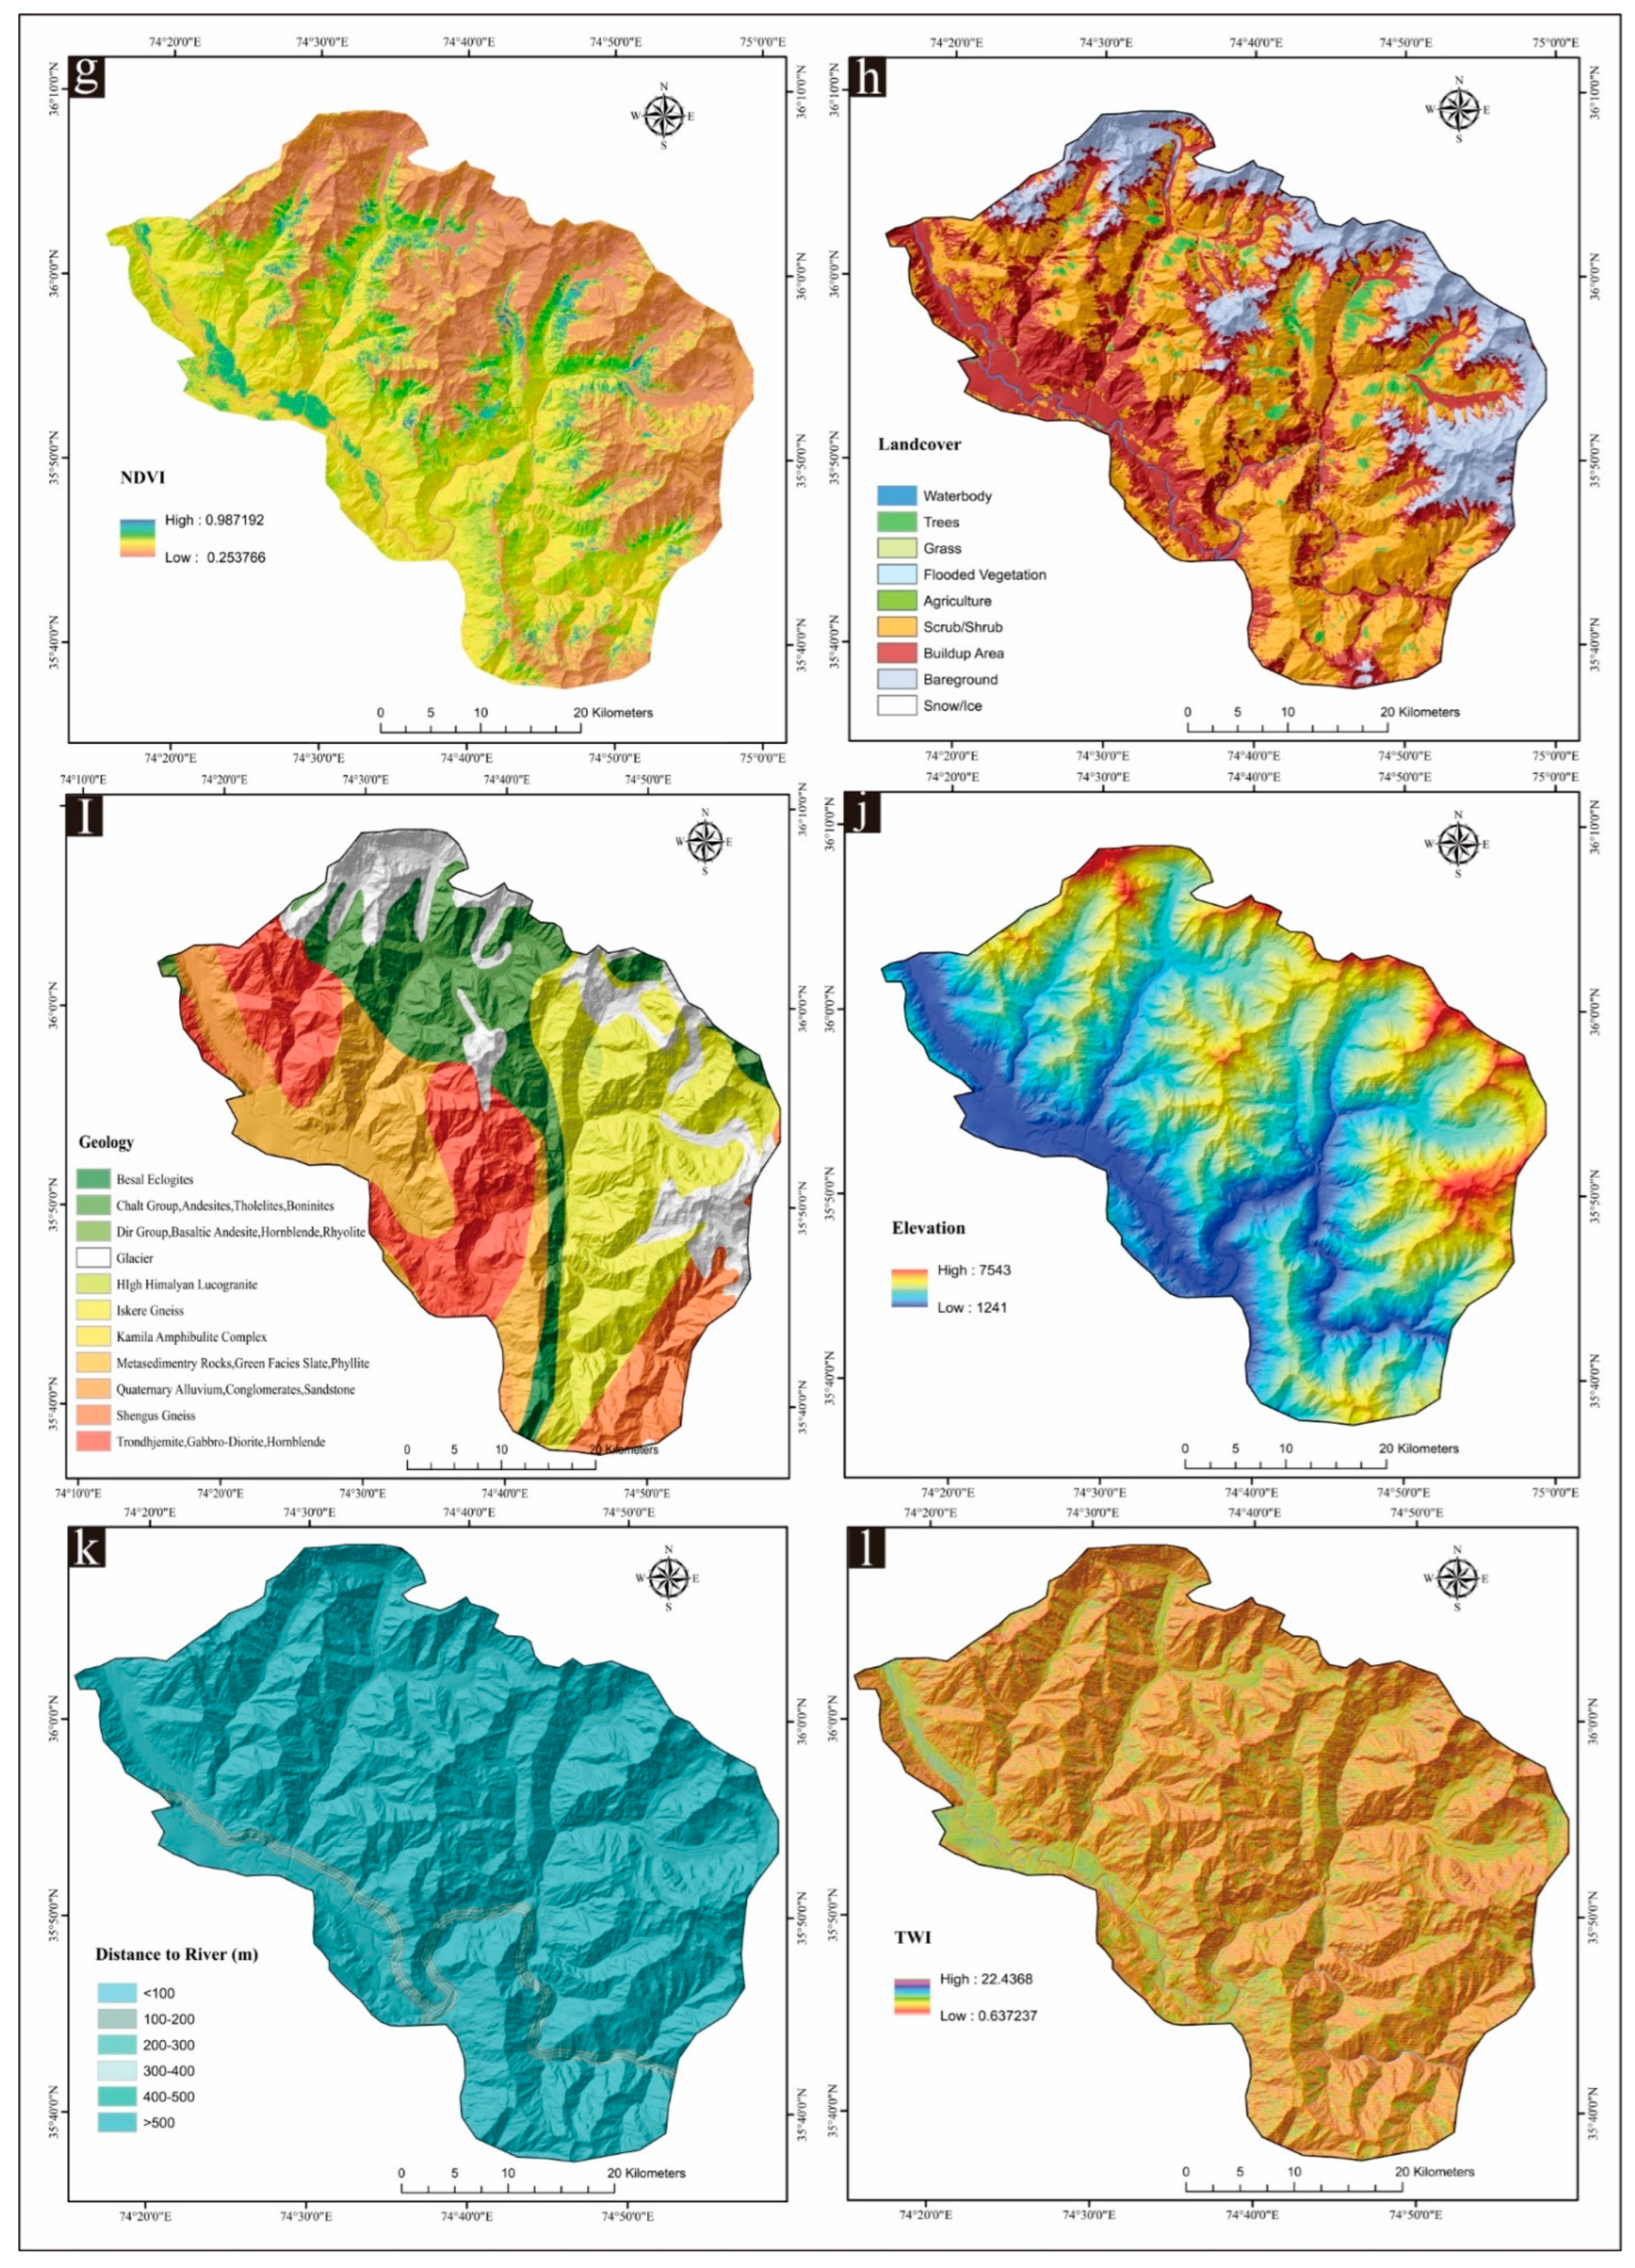
2.4. Landslide Causative Factors (LCFs)

Several elements influence the distribution and severity of landslides within a given area [50]. To fully grasp the mechanisms behind landslides, it is essential to evaluate their combined impact on spatial distribution [51]. This study integrated diverse geospatial data sources, as outlined in Table 1. The effectiveness of LSM in predicting susceptible areas hinges on the precise selection and thorough preparation of the LCF dataset [52]. Because there is no universally accepted framework for determining independent variables in LSM, the choice of LCFs was guided by a comprehensive review of the relevant literature, study-area-specific data, and field investigations [53]. The current study employed twelve LCFs featuring a range of variables, including elevation, land use/land cover (LULC), lithology, distance to faults, rivers, and roads, curvature, “topographic wetness index (TWI)”, aspect, rainfall, and slope [54,55,56] (refer to Table 1). Figure 4 and Figure 5 depict the creation of thematic layers with 12.5 × 12.5 m pixel size conducted within the WGS84 Datum and UTM-Zone 43 coordinate system.

2.5. Baseline Learning Algorithms

Baseline algorithms play a fundamental role in ML, serving as essential models that offer a basic yet crucial benchmark for comparison. These straightforwardly designed models set an initial performance standard, enabling the evaluation of more advanced ensemble methods.

2.5.1. Logistic Regression

The binary nature of data means that they are typically subjected to analysis through logistic regression, which aligns well with procedures involving binary classification due to its inherent structure [58]. While the underlying concept of logistic regression is similar to that of linear regression, the use of the ‘sigmoid function’ or ‘logistic function’ in logistic regression adds a significant level of sophistication [59]. In the context of regional-scale landslide susceptibility modeling, logistic regression is widely recognized as one of the most commonly employed algorithms [53].
To objectively assess the models’ effectiveness, the acquired data underwent partitioning into training and testing sets [60]. The models were developed and trained utilizing the training data. The performance of the models was consequently validated and tested against the testing data [61]. Here, data stratification lacked universal standards. The dataset was dissected into two subsets: one for training purposes, which encompassed 70%, and one for testing, which encompassed 30%. The division of the training and testing sets utilized a stratified after-class method to ensure an even distribution of landslide samples versus non-landslide samples [61]. Moreover, to ensure model repeatability, a random state was set.

2.5.2. K-Nearest Neighbors (KNN)

K-nearest neighbors (KNN) is a widely recognized algorithm that is effectively employed for identifying patterns in both classification and regression tasks [62]. It belongs to the category of unsupervised ML algorithms and is commonly referred to as a lazy learning algorithm [63]. The considered principles of KNN involve computing the distances among a single test observation and all observations in a training dataset, subsequently identifying the K-nearest neighbors [64].
In the current study, the said procedure was repeatedly performed for all the test observations to reveal and detect common variables in the dataset; for measuring distances, KNN was used with other metrics such as Euclidean or Manhattan distance, etc. [65].

2.5.3. Support Vector Machine

Support vector machines (SVM) have been effective in numerous real-world scenarios historically [66]. An SVM is a kind of supervised ML that employs hyperplanes to describe different categories while using training data for predictions and generalizations [67]. This algorithm calculates a hyperplane to enhance the gap, i.e., the distance amongst the nearest possible training data points on each side of the hyperplane [68]. SVMs, regardless of their potential for estimating resource consumption during the variable selection process, are characterized by and capable of resolving complex problems through kernel techniques [69].

2.6. Ensemble Learning Algorithms

In contrast to baseline algorithms, ensemble models utilize the cooperative potential of various base models by mixing them to enhance predictive efficiency. Ensemble algorithms aim to achieve superior accuracy, generalization, and robustness compared to conventional ML models by using the diverse and mutually reinforced attributes of individual models.

2.6.1. Random Forest (RF)

Random forest (RF) is an extensively assumed technique in regression as well as the stratification of tasks, exploiting an amalgamation of various decision trees for the sake of predictive analysis [70,71]. For classifications, RF utilizes majority voting to calculate class. However, during regression, the process estimates the average of the predicted values [72]. The primary strength of RF remains in its capability to effectively handle both continuous and categorical variables at subjective and objective scales. The process efficiently handles the regression and classification scenarios at the same time while showing superior performance in contrast to the other two classification algorithms. Even though the procedure is efficient, there are certain challenges with RF arising from the potential variability in outcomes across individual trees [12,73].
The alleviation of such challenges was tackled through a strategic approach. This approach involved the use of various decision trees; each tree was randomized with a distinct selection of parameters and data-driven base classifiers. Furthermore, by combining the predictions through these diverse trees, RF improved the calculation and also discussed the complications of changes and assortments amongst the trees, strengthening the reliability and accuracy of the outcomes [12].

2.6.2. LightGBM

The LightGBM gradient-boosting context stands out due to its exceptional tactics when framing decision trees [74]. LightGBM uses a leaf-wise strategy for tree growth as opposed to traditional level-wise methods, which results in improved arithmetic performance [74,75]. The technique involves training trees in a manner where the growth of each leaf is emphasized. To enhance performance as well as promote the efficient management of large datasets, LightGBM implements particular components into its architecture [76,77,78,79]. For instance, it implies gradient-driven single-side sampling, a procedure that focuses on the utmost valuable data points throughout tree establishment. Additionally, LightGBM employs exclusive feature grouping performances, optimizing the preparation of features to boost competence and predictive accuracy [76].

2.6.3. Extreme Gradient Boosting (XGBoost)

The XGBoost model stands out as a vigorous supervised classification method grounded in the Gradient Tree Boosting method [80]. It was documented by Chen and Guestrin. XGBoost has gained worldwide acceptance in the field of ML [81]. XGBoost is designed to exploit multiple processing cores; XGBoost progresses in catching and learning from non-linear forms within a dataset. The performance is further improved via the utility of standardized boosting, an approach that avoids overfitting, consequently enhancing model accuracy and discriminating it from over-boosting methods [82,83]. One prominent benefit of XGBoost fibs is its scalability, which makes it appropriate for several use cases with lower computational resource requirements. The model portrays performance with speed, handles extensive data, and characterizes a comprehendible implementation process [84]. The training methods of XGBoost use an additive approach and maintain a reasonable success rate in numerous data science contests. The usage of the XGBoost model demands a cautious approach to certain fundamental frameworks for ideal performance [84,85]. In this regard, three fundamental hyperparameters perform a pivotal role in the training model: ‘nrounds’, regulates the maximum number of boosting repetitions; ‘subsamples’, depict the ratio of training occurrences applied for each iteration; and ‘colsample bytree’, signifies the column ratio of the subsample while consolidating every tree [86].

2.6.4. AdaBoost

Adaptive Boosting, termed AdaBoost, is an ensemble method documented by Freund and Schapire [87]. It is distinguished as a highly popular boosting technique that involves the sequential creation of independent classifiers. Each classifier in the ensemble is designed to appropriately categorize and summarize the training data [87]. The training samples utilized by the classifier are calculated through an adaptive resampling method [88]. To enhance the performance of a new classifier on a dataset, the common practice is to favor a dataset incorrectly classified by a previous classifier over a correctly classified one [89]. In each iteration, a weight is assigned to the dataset, focusing subsequent integrations on adjusted datasets that were initially misclassified [87]. The final model is derived by calculating the weighted total of all the fundamental models of the classifier [90]. Additionally, AdaBoost allows the assessment of variable significance by analyzing the frequency of selection by weak learners [90].

2.6.5. Dagging Ensemble

Ting and Witten pioneered the Dagging algorithm in 1997, intending to fundamentally enrich classification accuracy [91]. The Dagging model stratifies the improved accuracy by means of the resampling technique, which merges components of both majority voting and classification diversity [92]. Moreover, this technique uses the ratio of disjoint variables, develops basic samples, and exchanges the bootstrap samples [91,93]. Other advantages are the efficacy and efficiency in processing noisy data; here, the Dagging model surpasses the boosting method in such scenarios [94].

2.6.6. Cascade Generalization (CG) Ensemble

Cascade Generalization (CG) is extensively applied in various research fields. It is possible that the method is sensitive to the quality of output data [95]. CG exploits the output data as the primary samples and enhances the range of input data [96,97]. CG integrates diverse sample stratifications via a parallel or stacking strategy [98]. One benefit of CG is the nature of intermediate categorization, which enables the capture of original characteristics [98]. In the conventional application of CG, the combination of real-world information is a common practice; the method adds new characteristics to enhance the performance of the machine. As a result, CG improves the classification accuracy as the fallacy of bias is removed across the training variables [96].
In this study, models were built using the Python programming language. Machine learning libraries such as Scikit-learn, XGBoost, LGBM, TensorFlow, and Keras were employed. Other libraries, including NumPy, Matplotlib, Seaborn, Rasterio, Geopandas, and Shapely, were also utilized. The specific computer used was a ThinkPad laptop with a 12th Gen Intel(R) Core(TM) i7-1260P processor running at 2.10 GHz, equipped with 32.0 GB of RAM, and operating on a 64-bit system.

2.7. Validation Methods

The ROC curve is the assessment criterion for the validation of most of the algorithms [99]. The model’s accuracy is efficiently demonstrated via the Area Under the Curve (AUC). AUC values near 1 attain higher model reliability. The AUC is determined by the following equation:
A U C = T P + T N P + N
In Equation (1), TP is the total of correctly classified landslide polygons and TN encompasses the total number of correctly classified non-landslide polygons. Here, P is the number of pixels in landslides, and N is the count of non-landslides. The performance of landslide prediction models is calculated via success and prediction rates. These values can be achieved through the following procedure: The X-axis illustrates the total percentage of landslide susceptibility, and the Y-axis shows the percentage of landslide pixels [100]. The Kappa index estimates the relationship between the two evaluators stratifying landslide and non-landslide locations [101]. The Kappa statistic is higher than or equal to 0 if the ratio of two assessors is higher than or equal to the predicted agreement ratio. However, these ratios are intrinsic to the anticipated proportions [102]. The formula for determining the Kappa index is provided below:
k = P 0 P e 1 P e
where P 0 represents Observed Landslide Pixels and P e represents Calculated Landslide Pixels.

2.8. Determining Key Factors with Correlation-Based Features and a Random Forest Classifier

The identification of landslide predictors is a crucial step that must precede the implementation of any data-mining techniques in the process of estimating susceptibility to landslides [103]. However, specific criteria for this task are not well defined [104]. One of the main objectives of predictor selection procedures is to analyze the effect of each factor on the landslide prediction phase and to filter the modeling procedures by cancelling and eliminating noise, overadjustments, and irrelevant data [105]. This initial step majorly enhances the model’s predictive ability [106]. Various methods used in prior research to identify variables with the best predictive capacity include Information Gain [107], One Rule Attribute Evaluation (ORAE) [105], and correlation-based feature selection (CFS) [23].
In the present study, the appropriate factors for the construction of LSM were identified via the application of correlation-based feature selection (CFS) and a random forest (RF) classifier. The CFS technique handles the statement that a robust correlation exists between landslide susceptibility and specific subgroups of features. Variables showing a strong link with landslide locations but a relatively weaker link with other predictors are assigned high CFS values [23]. The estimation of CFS scores can be gained using the following equation [108].
C F S = k r c f k + k ( k 1 ) r f f
CFS presents the relationship between each landslide predictor and landslide/non-landslide pixels. k is the percentage of landslide predictors. Here, rcf is the correlation amongst landslide predictors in the areas prone to landslides, while rff refers to the average value of the inter-correlations between landslide predictors.
After the identification of primary predictors through CFS, this study extends to refine and quantify the significance of these factors to predict landslide susceptibility via the RF classifier [109]. As the RF classifier is specified for the analysis of complex and non-linear interactive relationships, a stratified sampling strategy was utilized to over-carefully curate the dataset to train the RF algorithm [110]. During the process, a proper distinction was established between the representative distributions of landslides and non-landslide instances [111]. So, the algorithm used a bootstrapped subset and produced an ensemble of decision trees. The RF classifier considered a random subset of characteristics at each node during the training process. Consequently, the RF algorithm resulted in a mean decrease in the Gini impurity metric for the evaluation of the significance of each predictor or variable [111]. Because the said metric measures the rate at which any variable could split the nodes in the decision tree, it calculates and quantifies the contribution of variables, and as a result, this whole process improves the model accuracy substantially. This approach characterizes the impact of each variable in accordance with landslide susceptibility analysis. The collective insights from the CFS and RF classifier intimated the last selection of variables for the construction of the LSM. This ensured a robust and accurate display of the factors making contributions to LSM in the research region.
The formula for calculating the mean decrease in Gini impurity for a variable V is:
M e a n   D e c r e a s e   i n   G i n i   I m p u r i t y C = t r e e s G i n i   D e c r e a s e ( , t r e e s ) N u m b e r   o f   T r e e s
where
Gini Decrease (V, tree) is the decrease in Gini impurity for variable V in a specific tree.
The sum is taken from all trees in the random forest.

3. Results

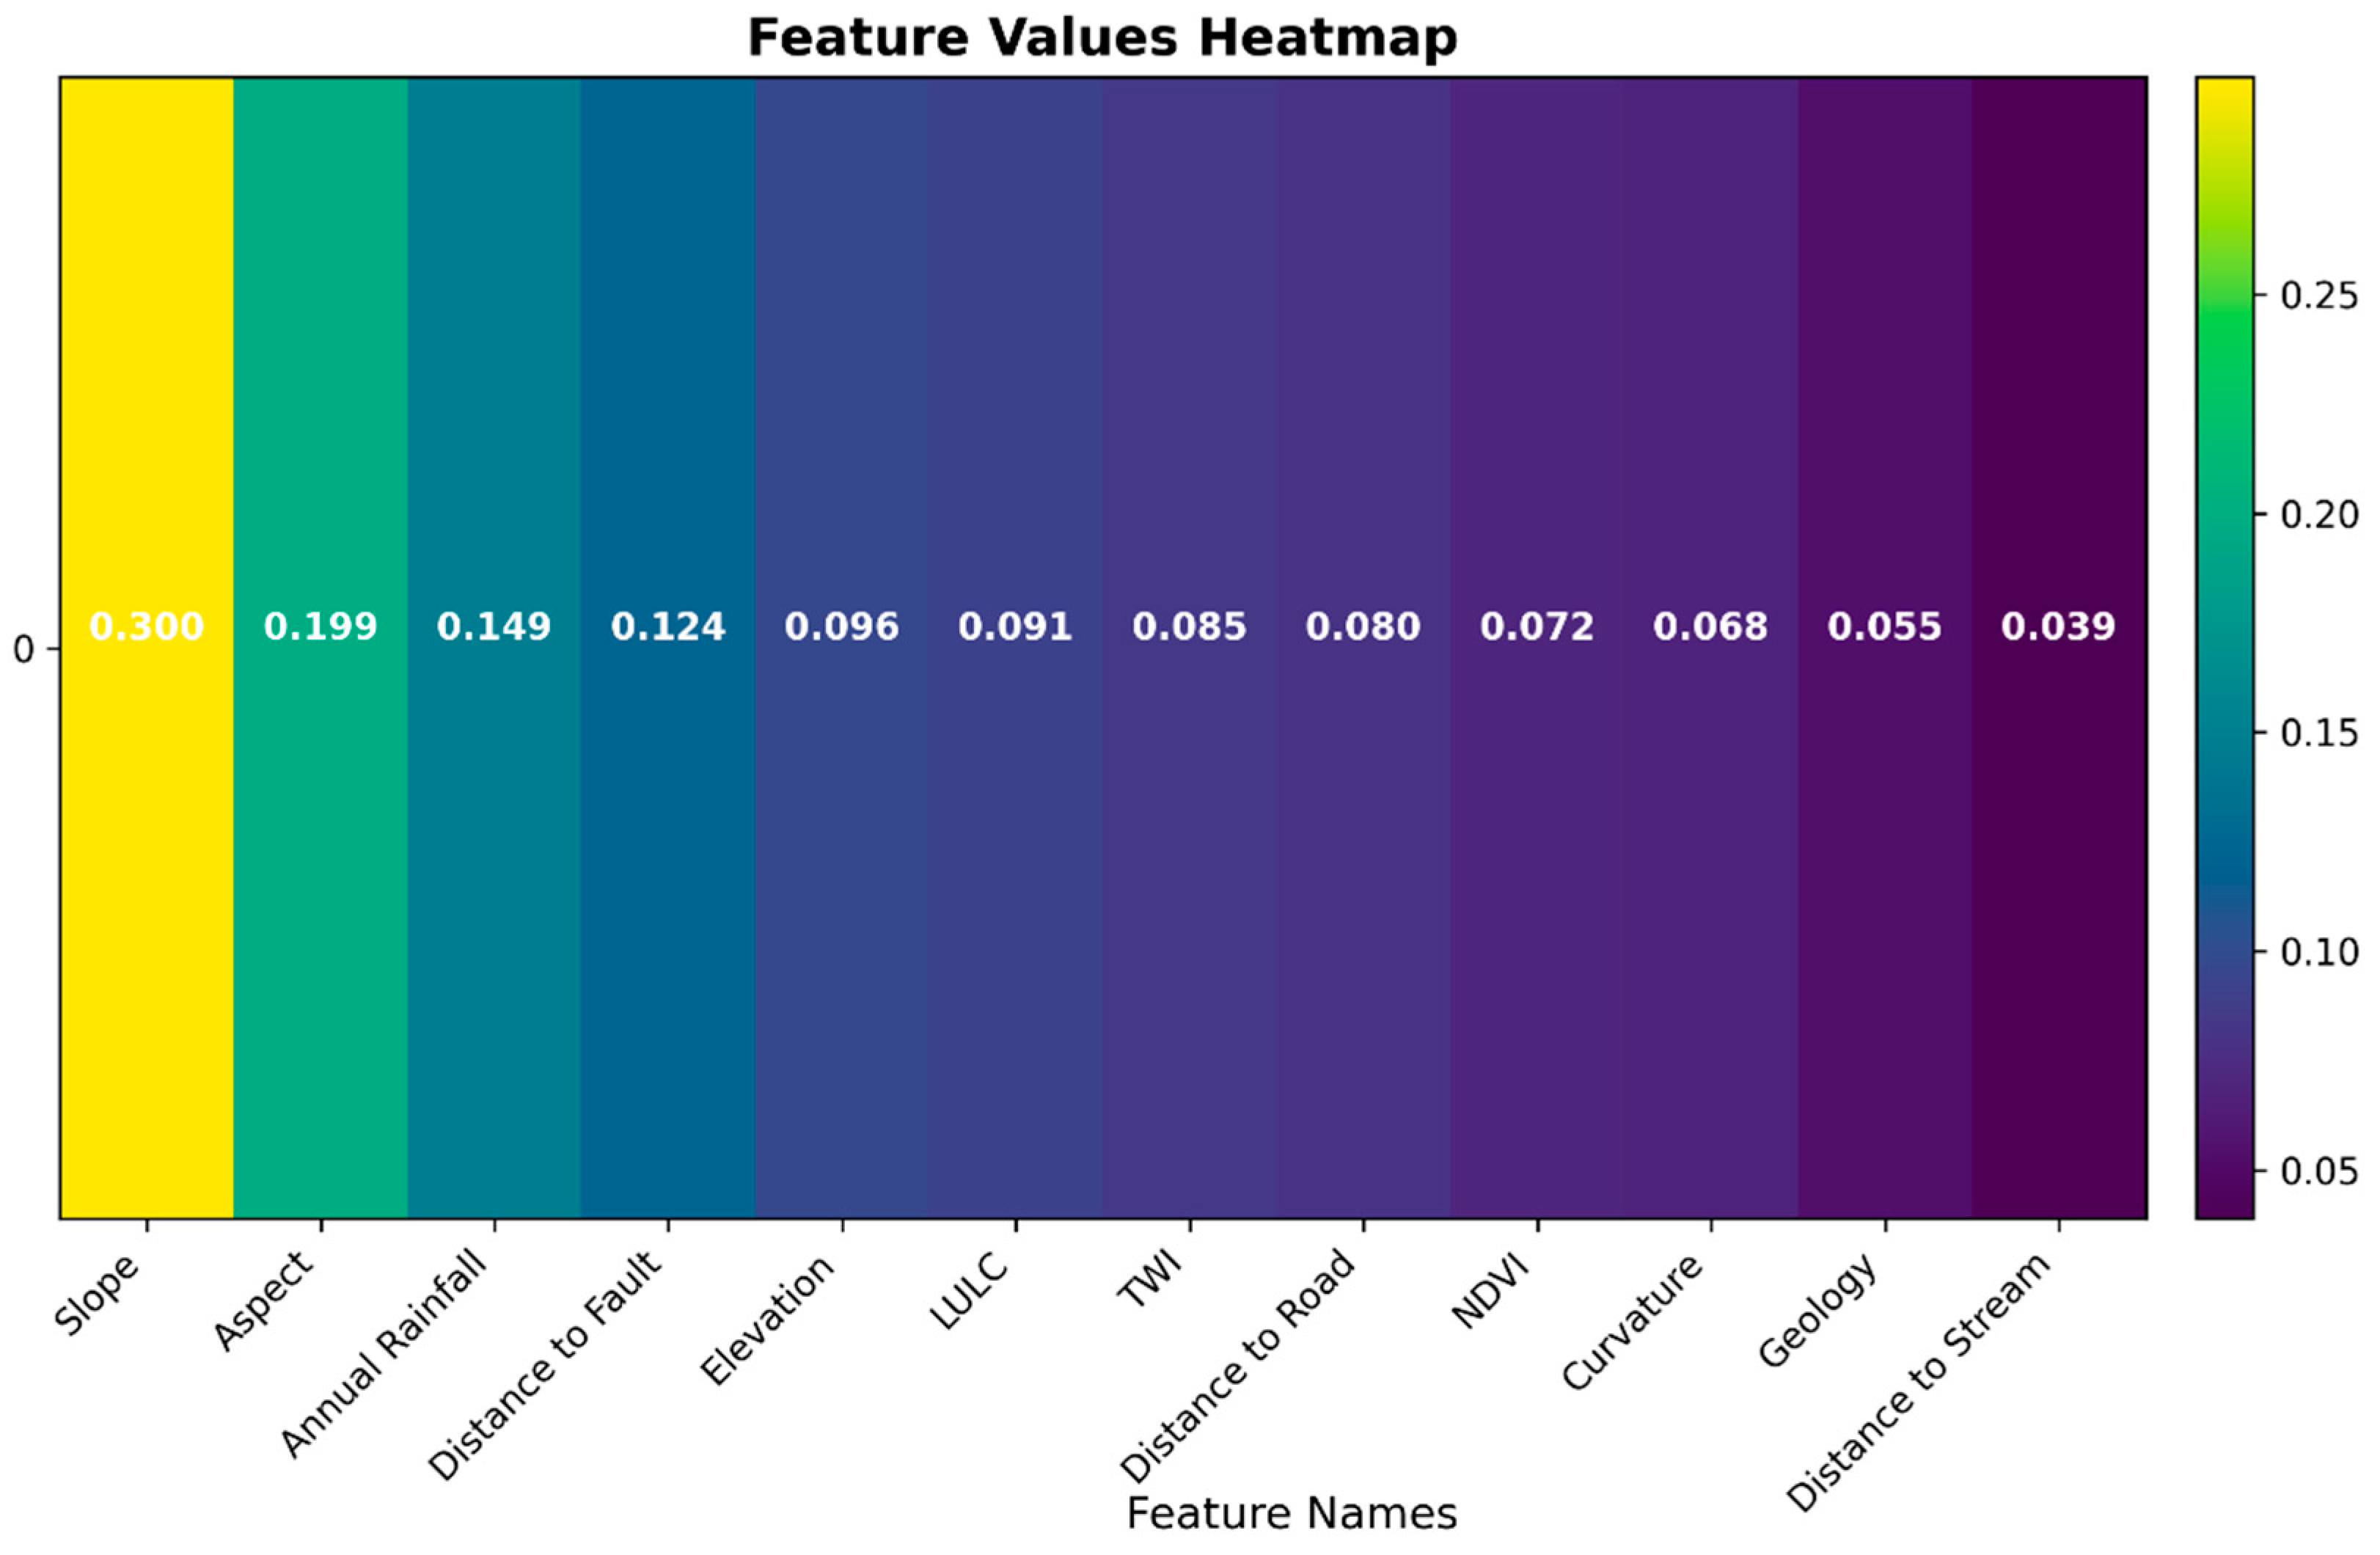
3.1. Feature Importance Evaluation with Correlation-Based Feature Selection and Random Forest Classifier

Based on the findings presented in Table 2, it is observed that the implementation of CFS yielded Average Merit (AM) values greater than 0 for all the landslide predictors. Table 2 displays the results of our CFS analysis, which aimed to identify the most relevant predictors for LSM. Notably, all 12 predictors exhibited positive AM values, indicating their potential significance in influencing landslide occurrences. The attribute with the maximum AM value was a slope, and the minimum was the distance to the stream. In addition to AM values, Table 2 offered intuitions into the ranking of these predictors, signified by the Average Rank (AR) values. Detailed information on the Error (AR) values is also obtainable in the table, further assisting our understanding of the predictive competencies of each factor.
Moreover, the variable importance analysis from the random forest classifier cultivated our understanding of the crucial determinants of landslide susceptibility in our research area. Notably, slope stood out as the most influential factor, underscoring the significant role of terrain slope in predicting landslide occurrences. However, distance to streams showed lower importance, indicating a comparatively weaker influence on landslide susceptibility in this analysis (see Figure 6). The outcomes of the CSF and random forest classifiers exhibited remarkable consistency, with minor variations observed in both variable importance categories. This underscores the reliability of both methods employed in assessing landslide causative factors. These findings provide a nuanced understanding of the relative contributions of different LCFs to landslide occurrences in our study region, offering valuable insights for effective LSM.

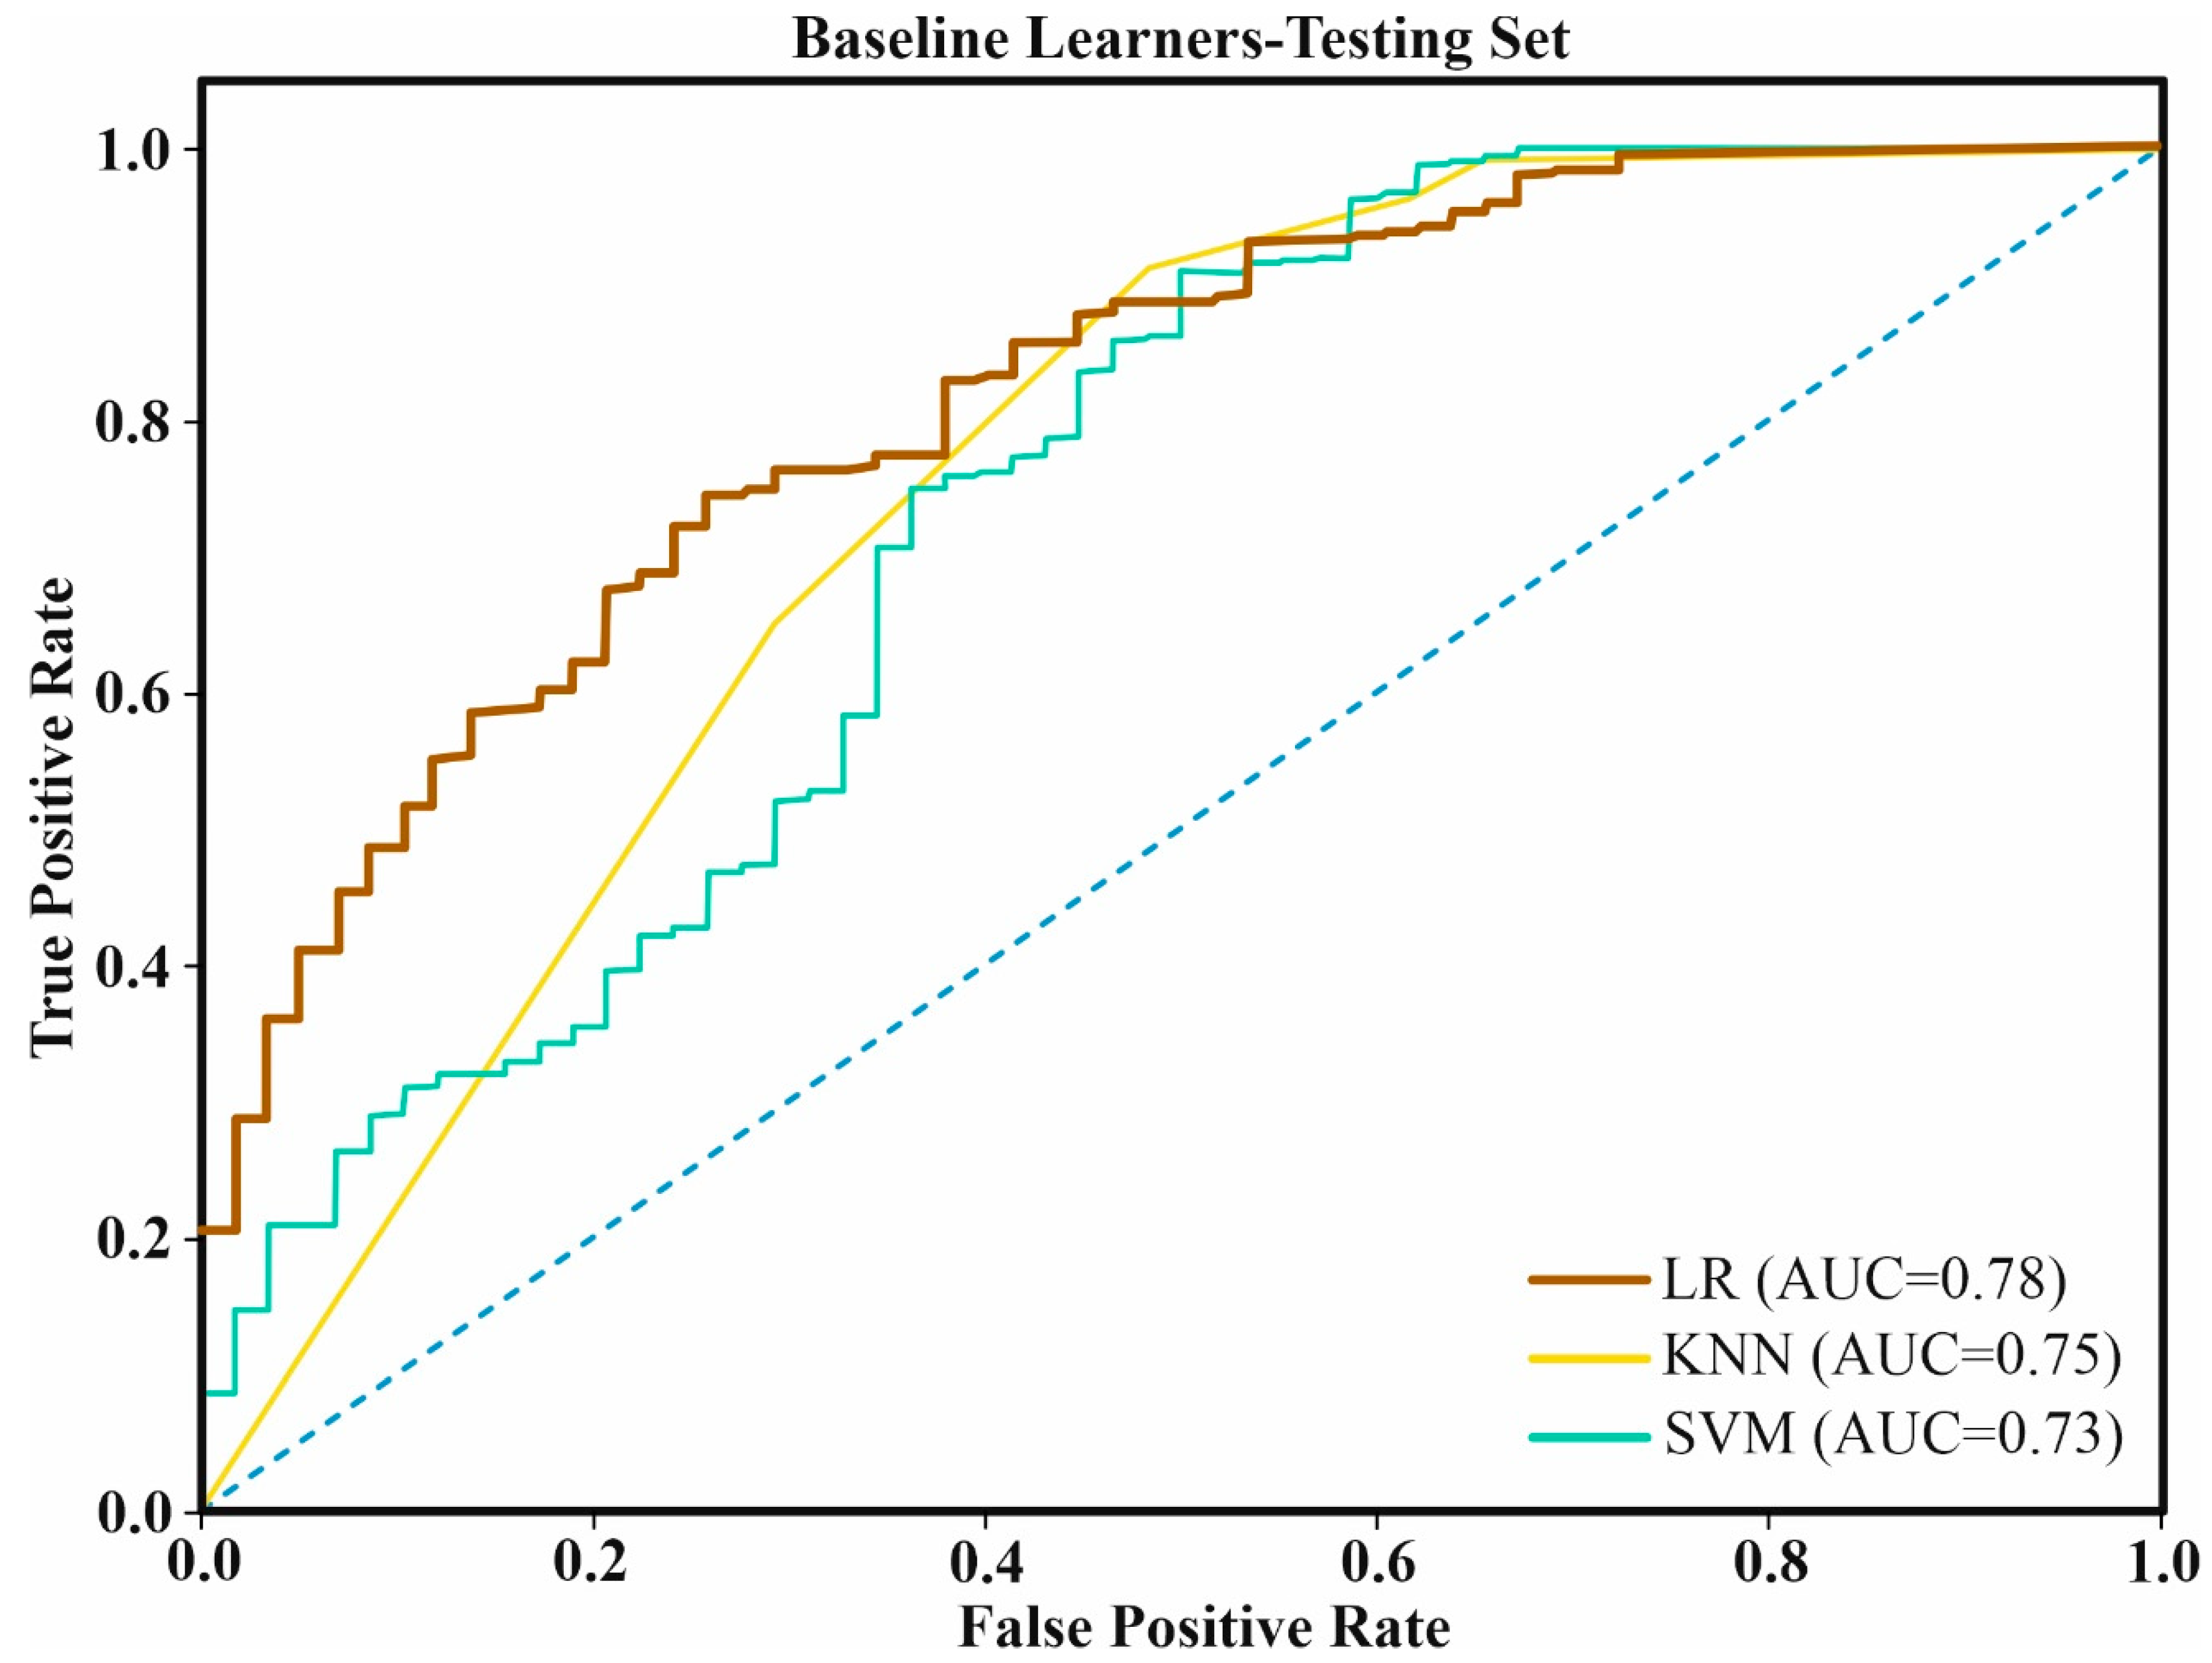
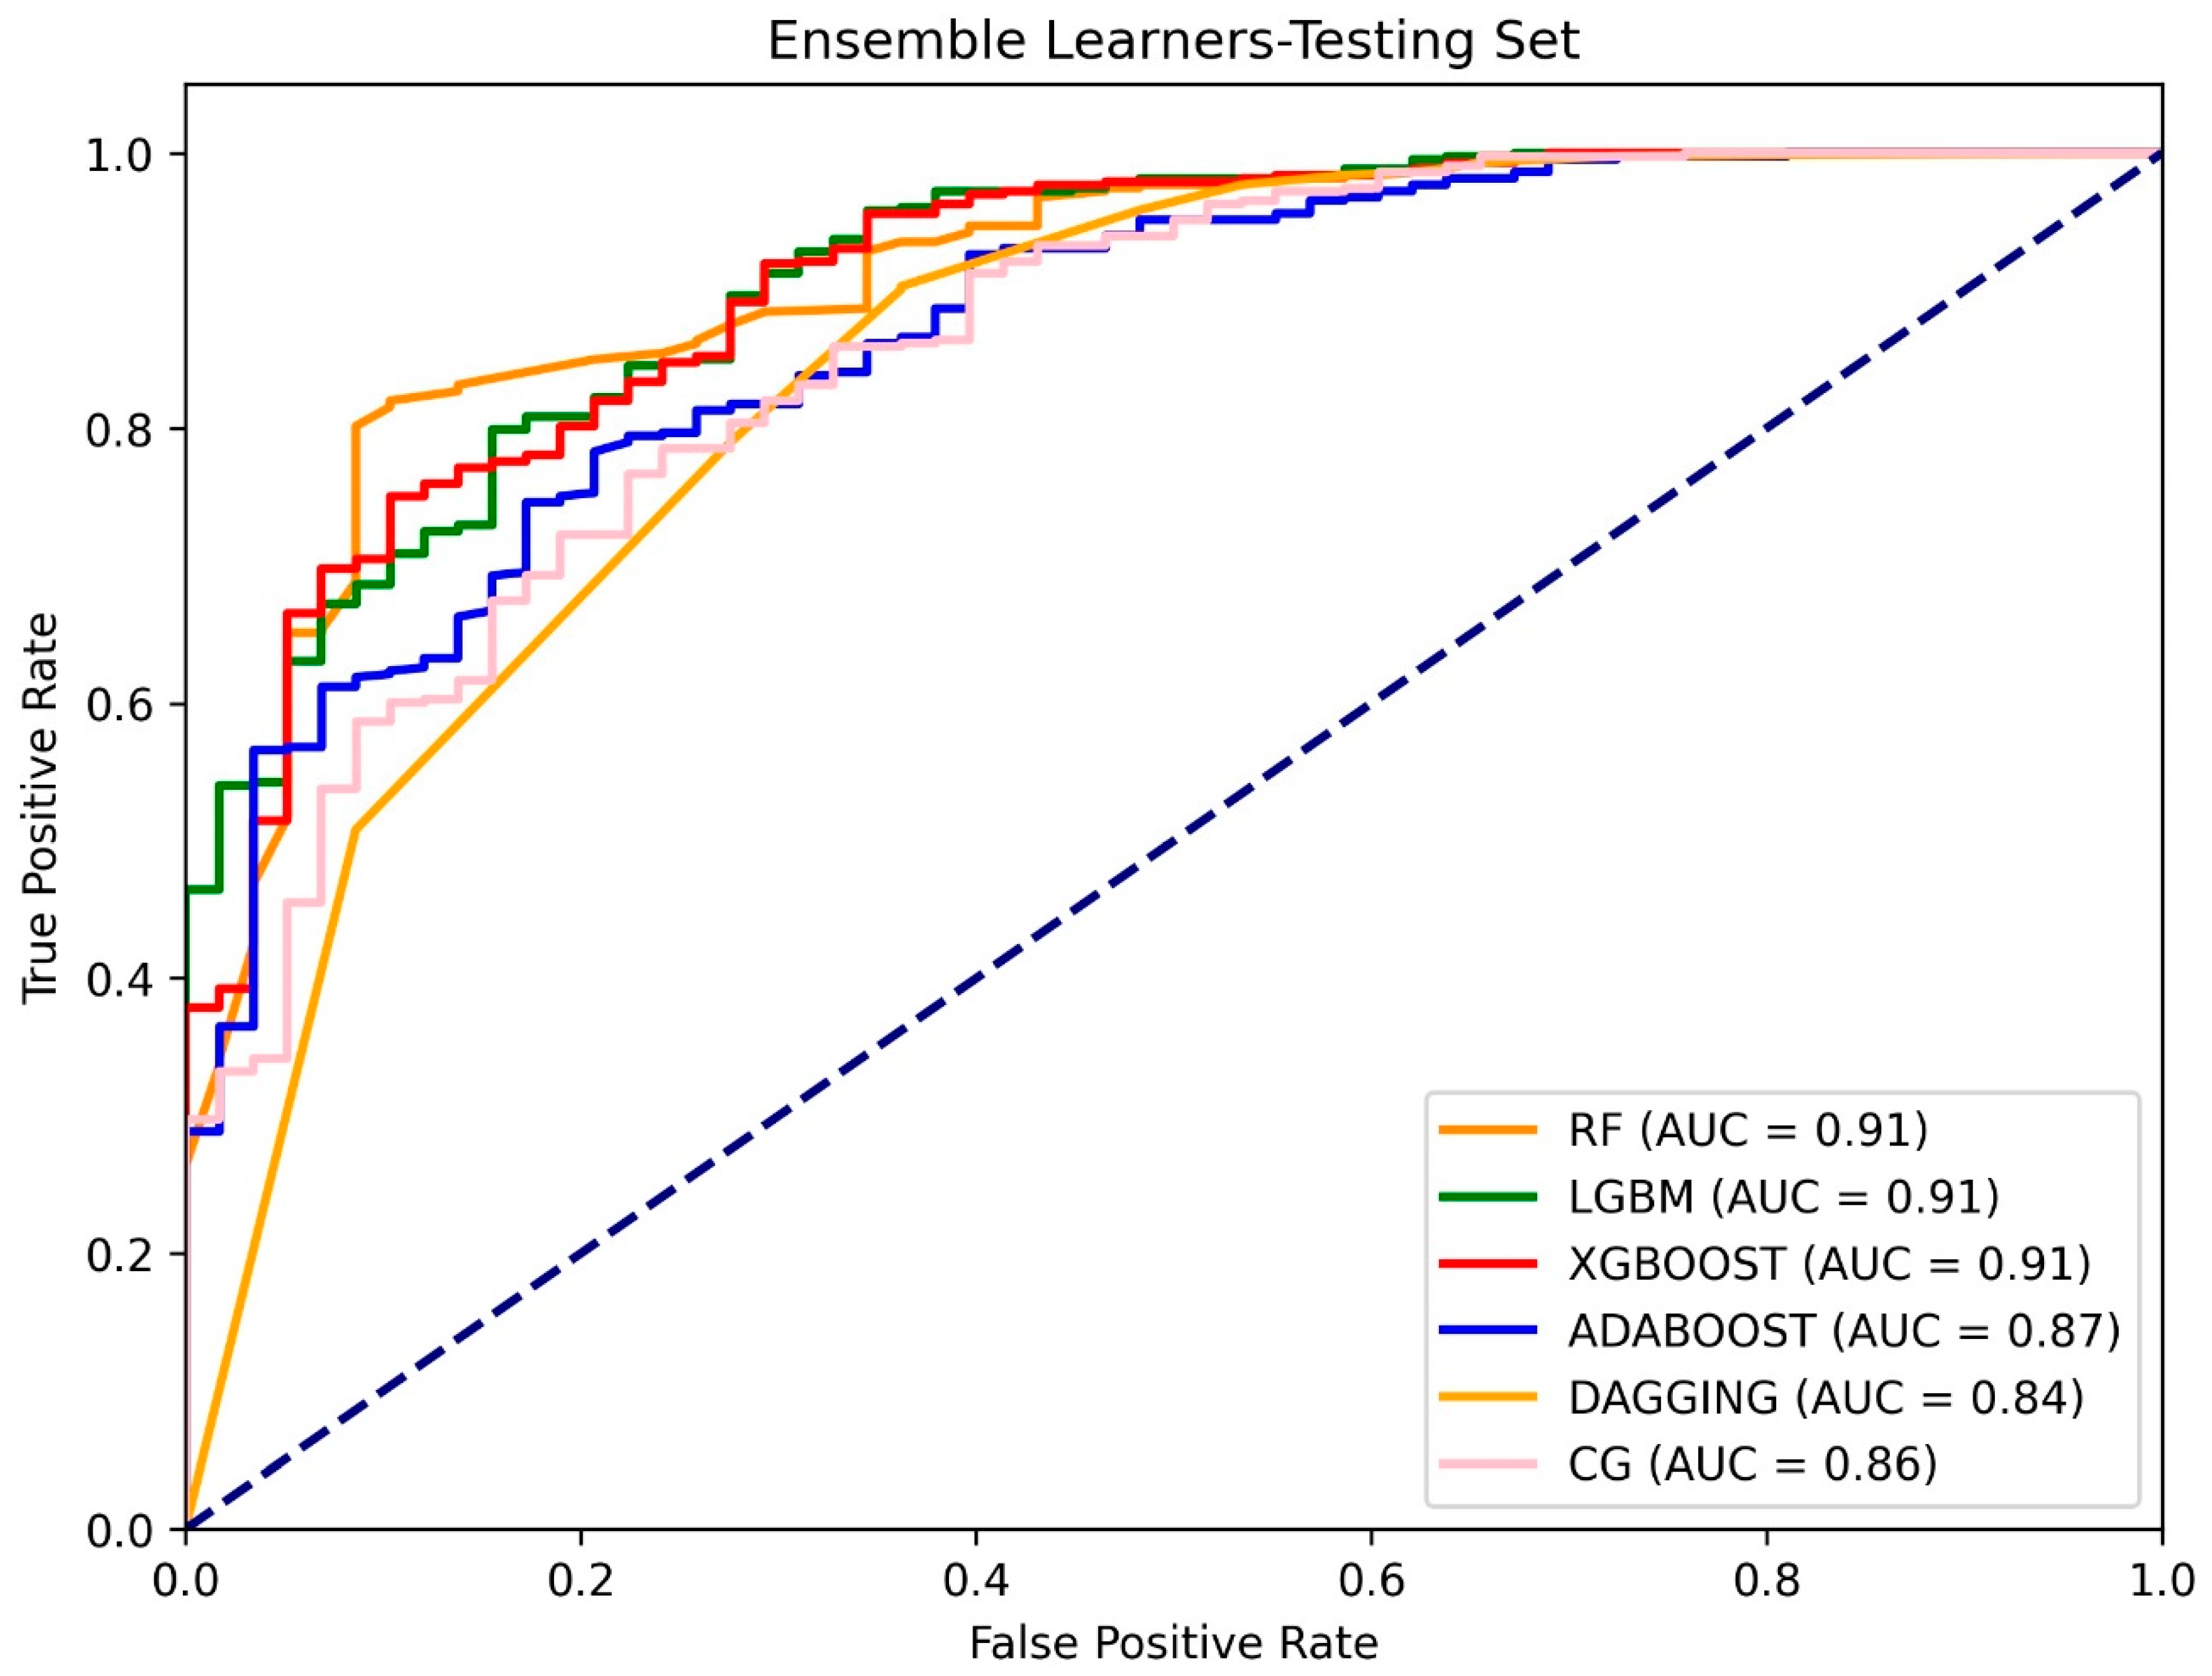
3.2. Model Validation and Comparison for Landslide Susceptibility

The 12 predictors were integrated into the training process of nine distinct baseline and ensemble models. Table 3 presents the evaluation outcomes for the baseline algorithms on the testing set. LR exhibited the highest accuracy (ACC = 0.912), followed closely by SVM (ACC = 0.910), and KNN (ACC = 0.896). In terms of the ‘Area Under the Curve (AUC)’, LR again led with a value of 0.784, outperforming both SVM (AUC = 0.734) and KNN (AUC = 0.750). The Kappa index (K) also favored LR (K = 0.394), with KNN (K = 0.409) and SVM (K = 0.359) following in the respective order (Figure 7). This suggested that LR was the most accurate and discriminative among the baseline algorithms on the testing dataset. Table 4 presents the evaluation outcomes for ensemble algorithms on the testing set. XGBoost emerged as the top-performing algorithm with the highest accuracy (ACC = 0.927), followed by LGBM (ACC = 0.925), and RF (ACC = 0.914). In terms of AUC, XGBoost led the ensemble algorithms with a value of 0.910, closely followed by LGBM (AUC = 0.907) and RF (AUC = 0.909) (Figure 8). The Kappa index revealed that XGBoost achieved the highest discriminative power (K = 0.620), followed by LGBM (K = 0.579) and RF (K = 0.481). This indicated that XGBoost was the most accurate and discriminative among the ensemble algorithms on the testing dataset. The validation results highlighted LR as the top-performing baseline algorithm, while XGBoost stood out as the superior ensemble algorithm based on accuracy, AUC, and the Kappa index. These findings provide valuable insights into the comparative performance of the evaluated models on the testing dataset.

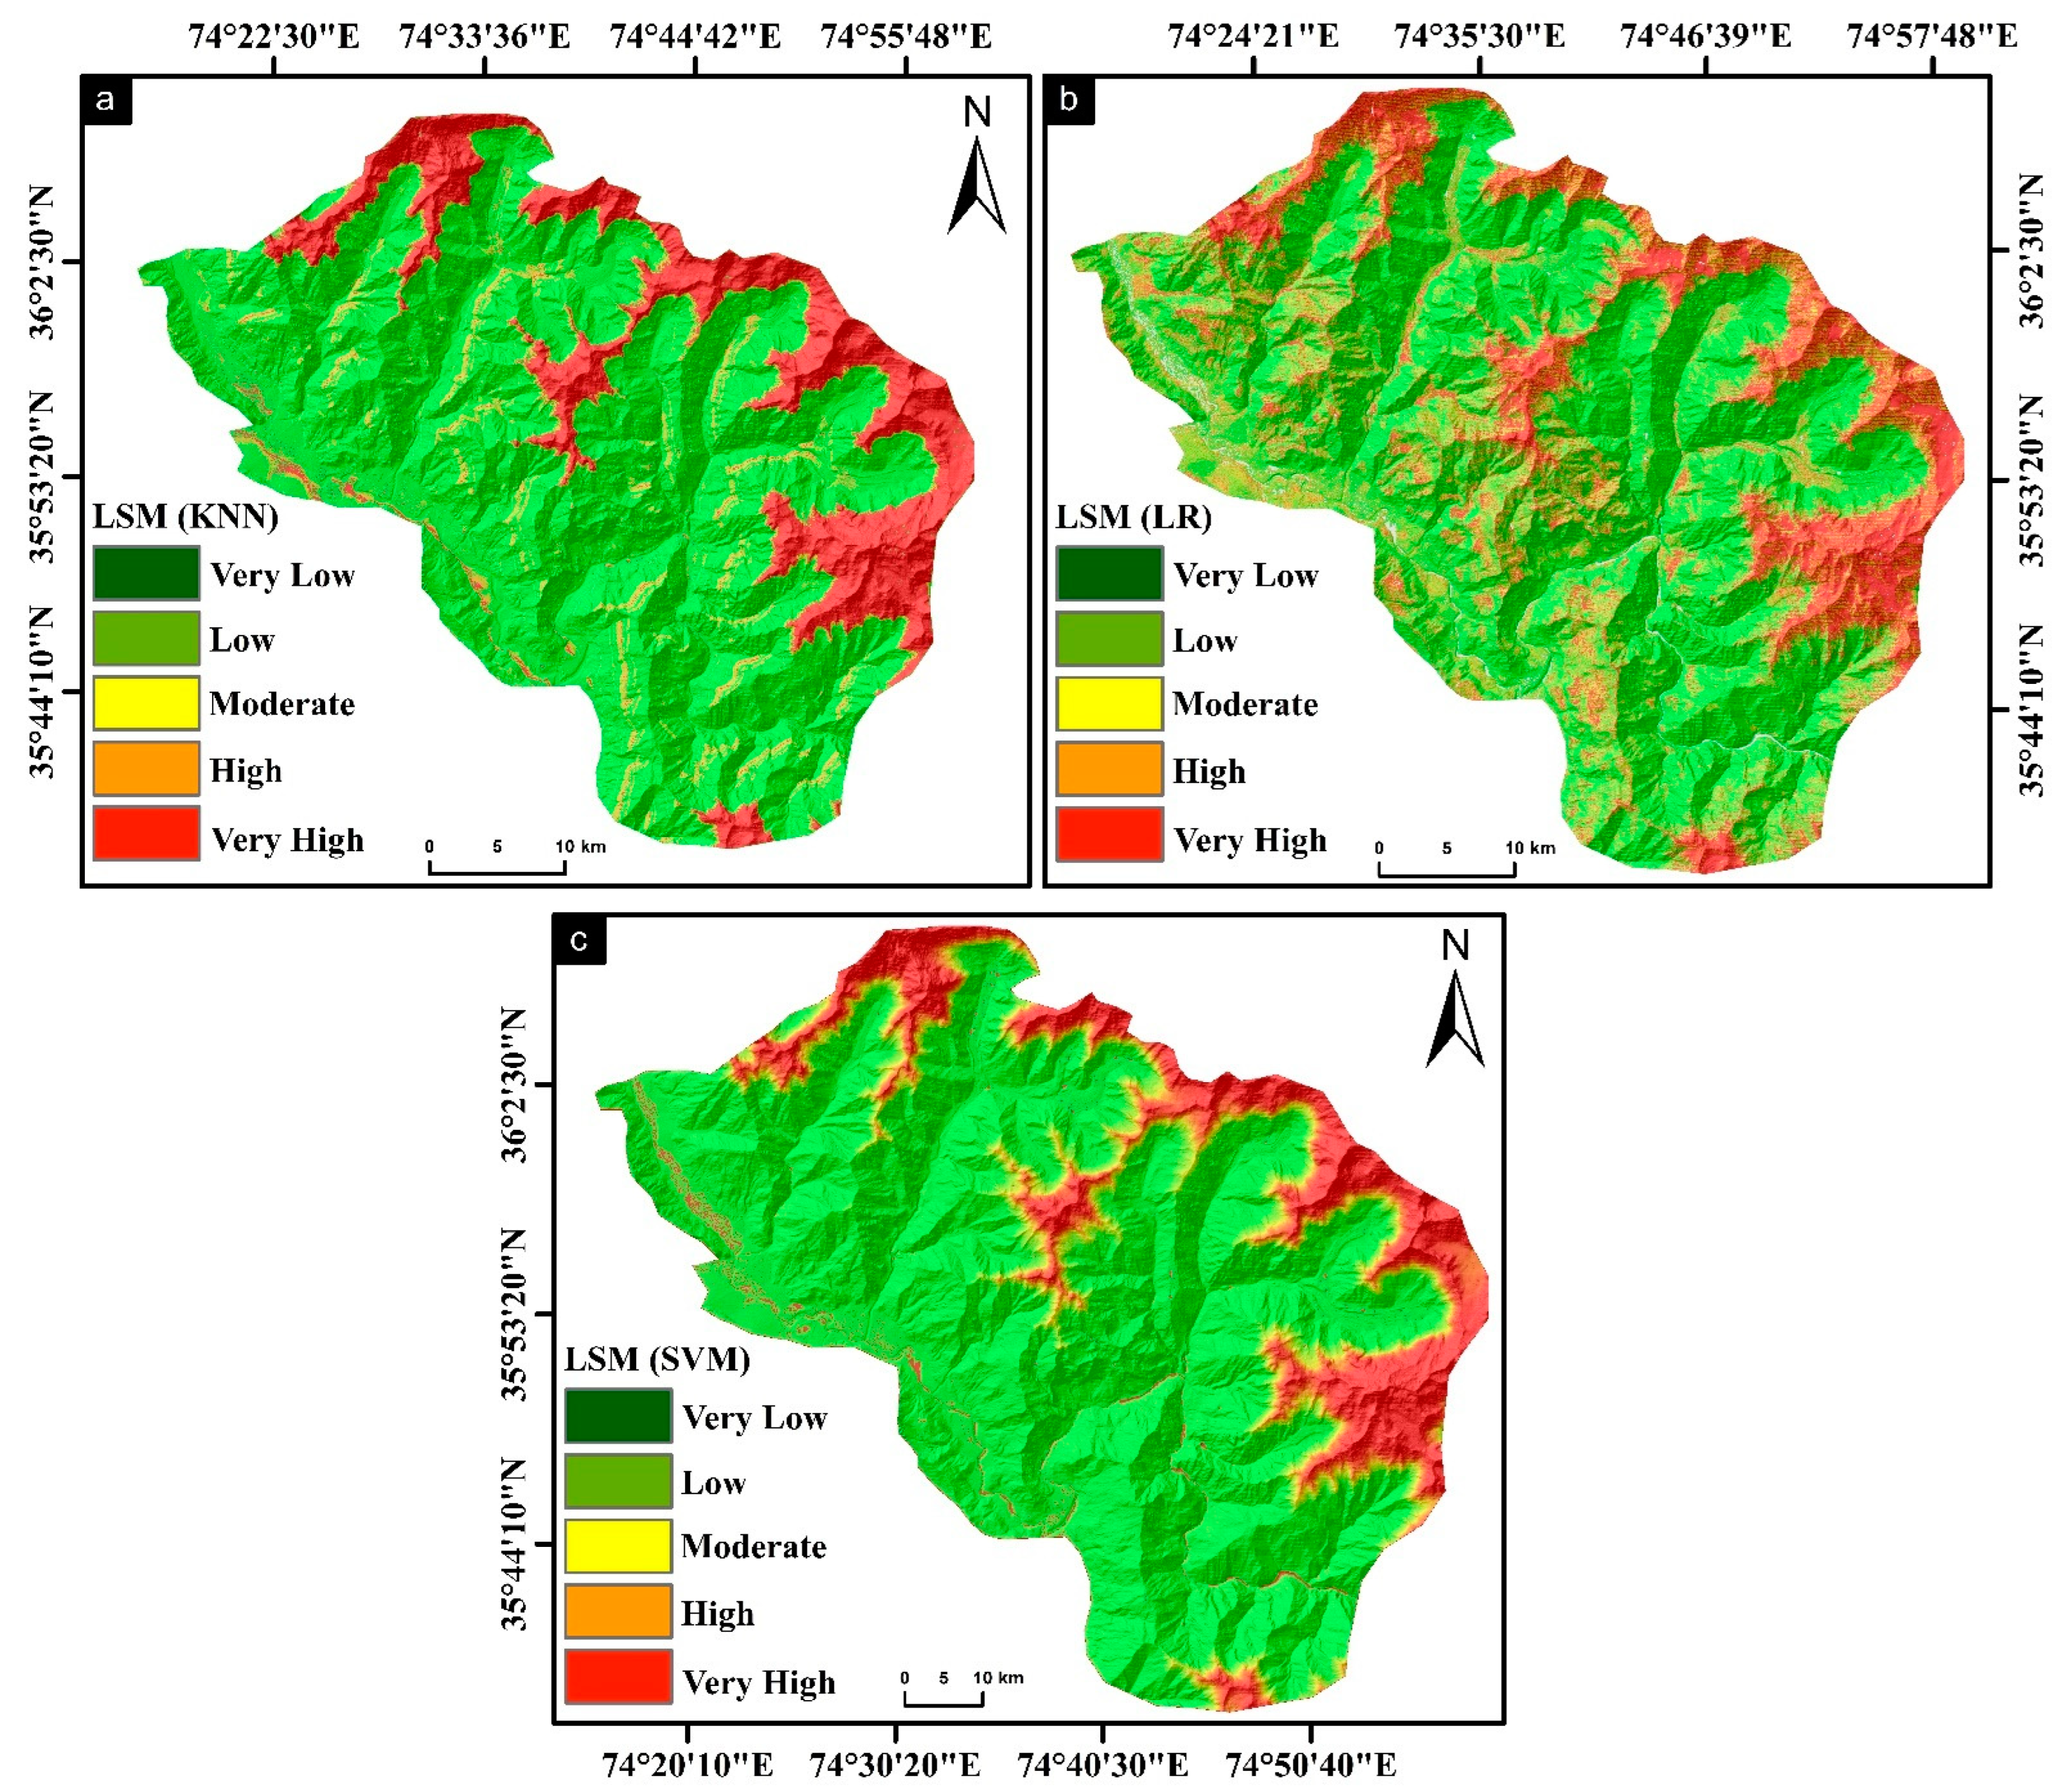
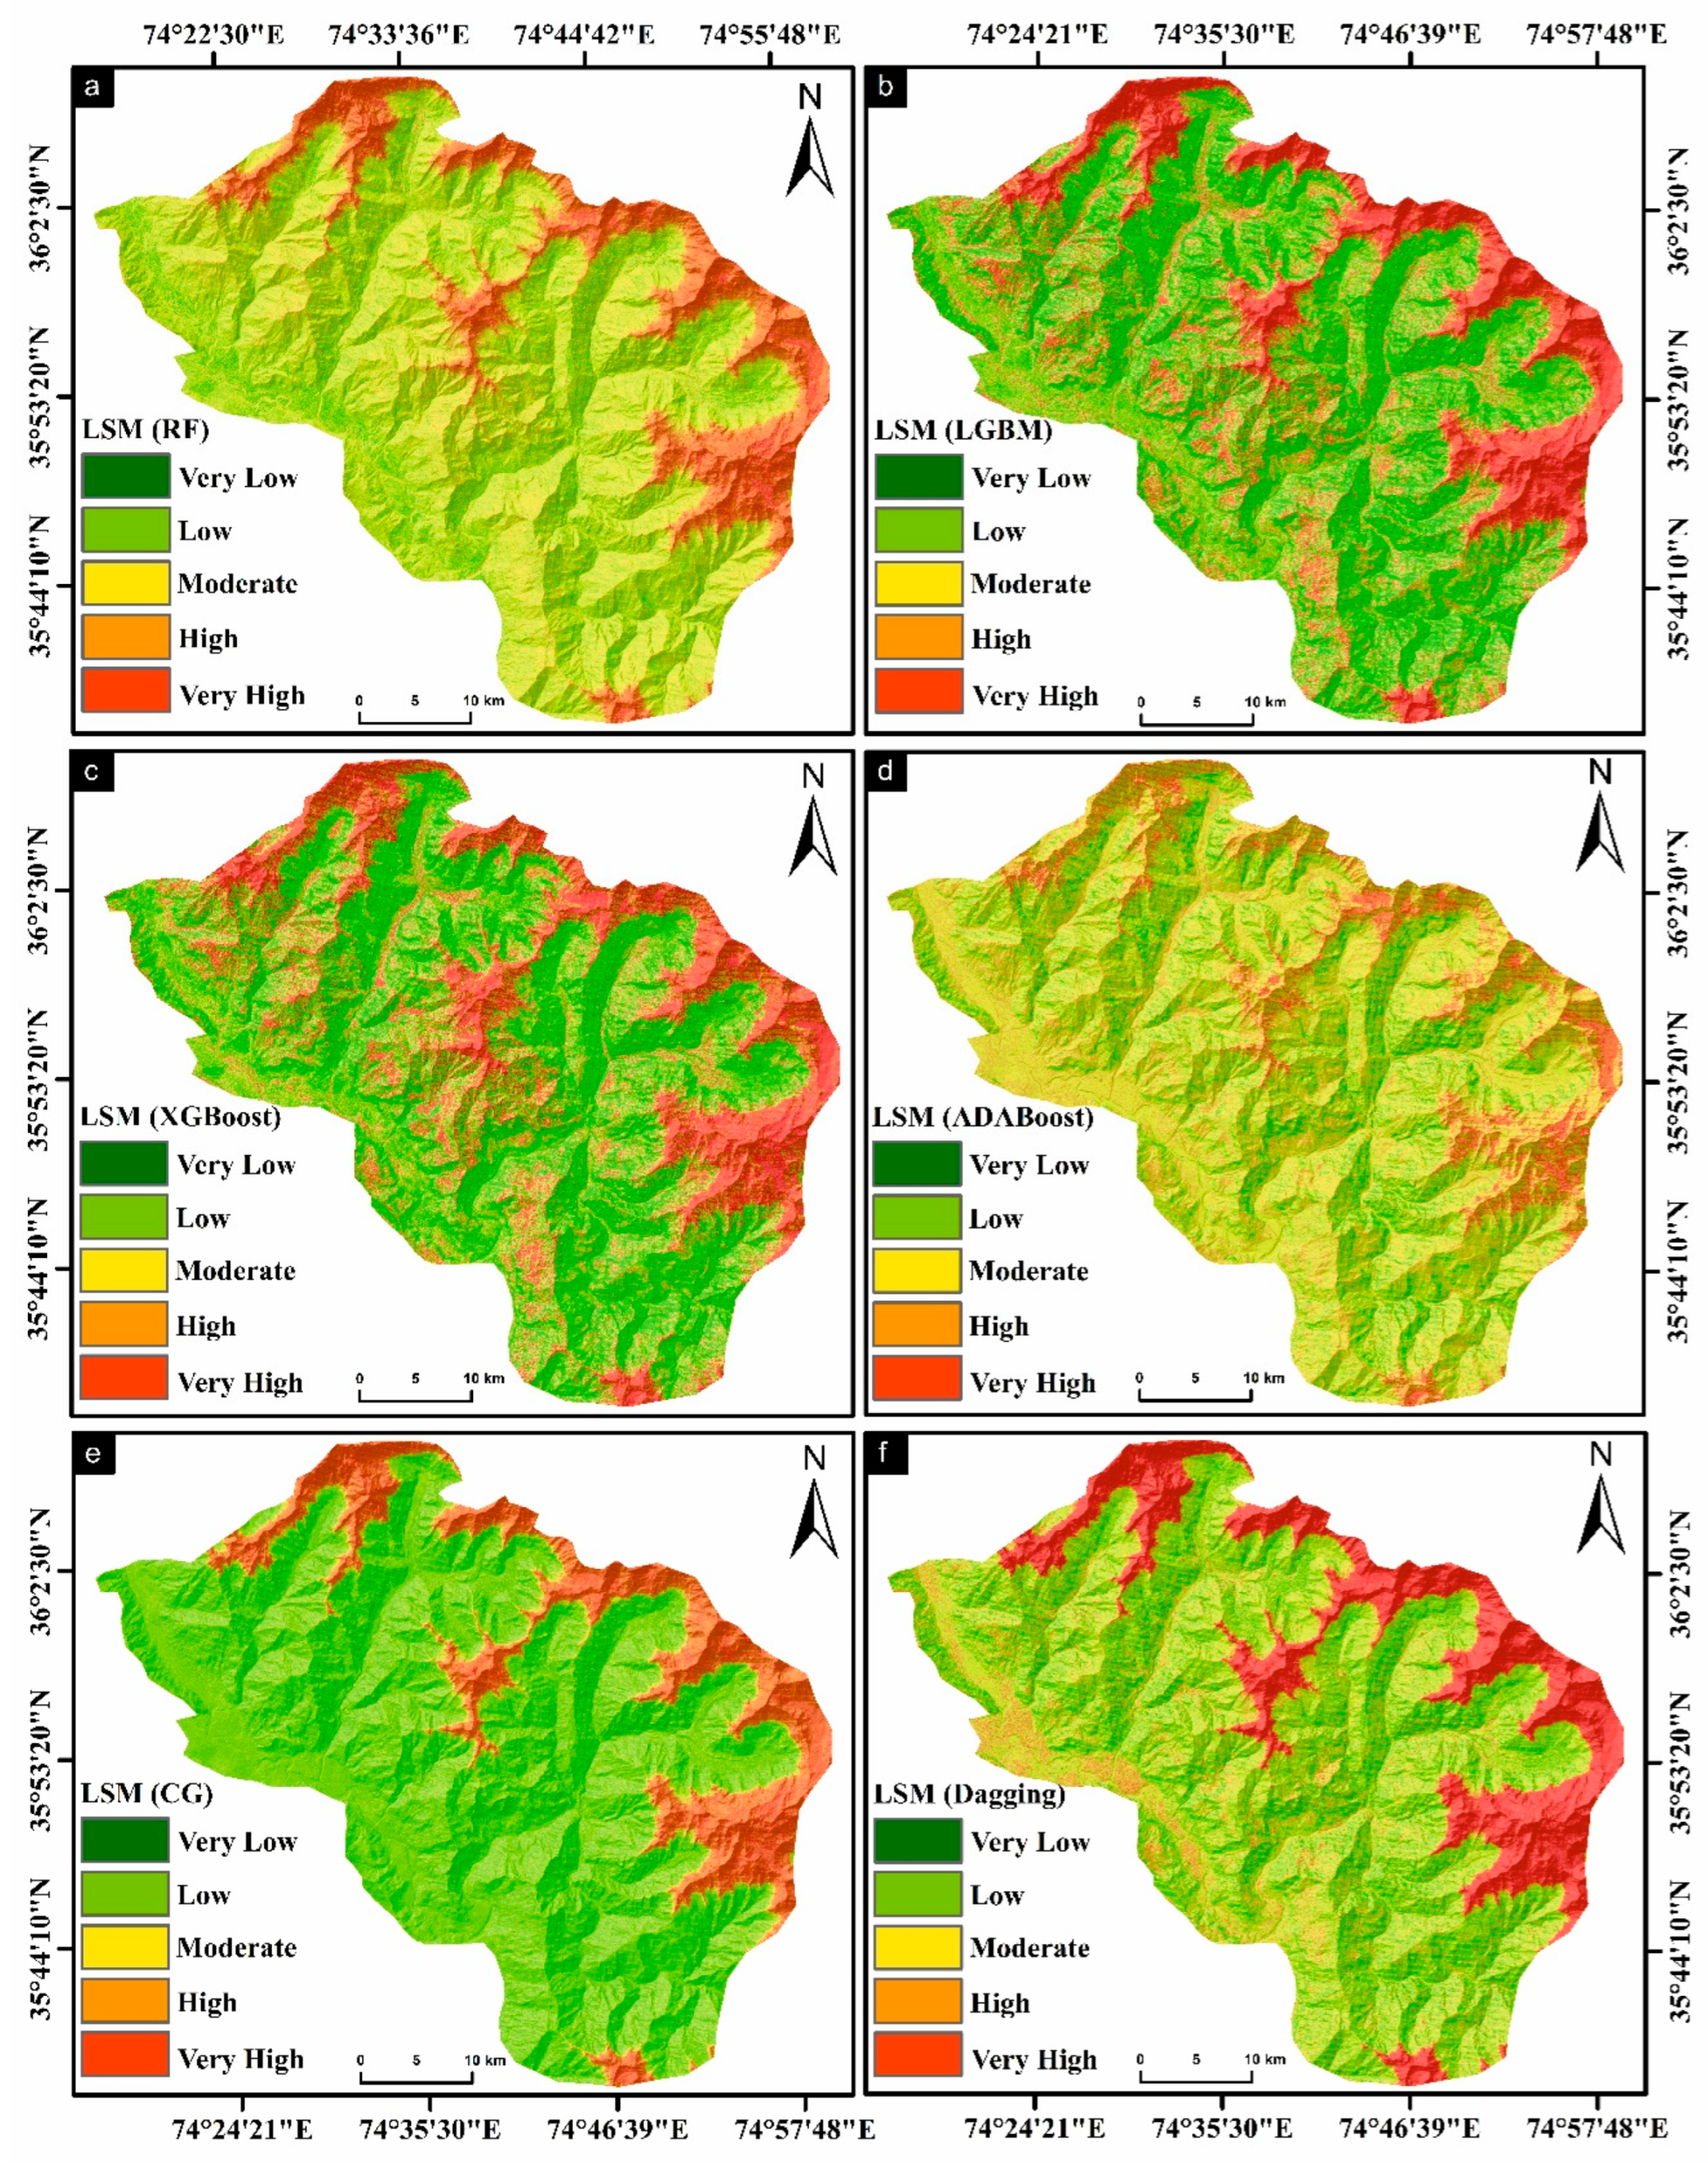
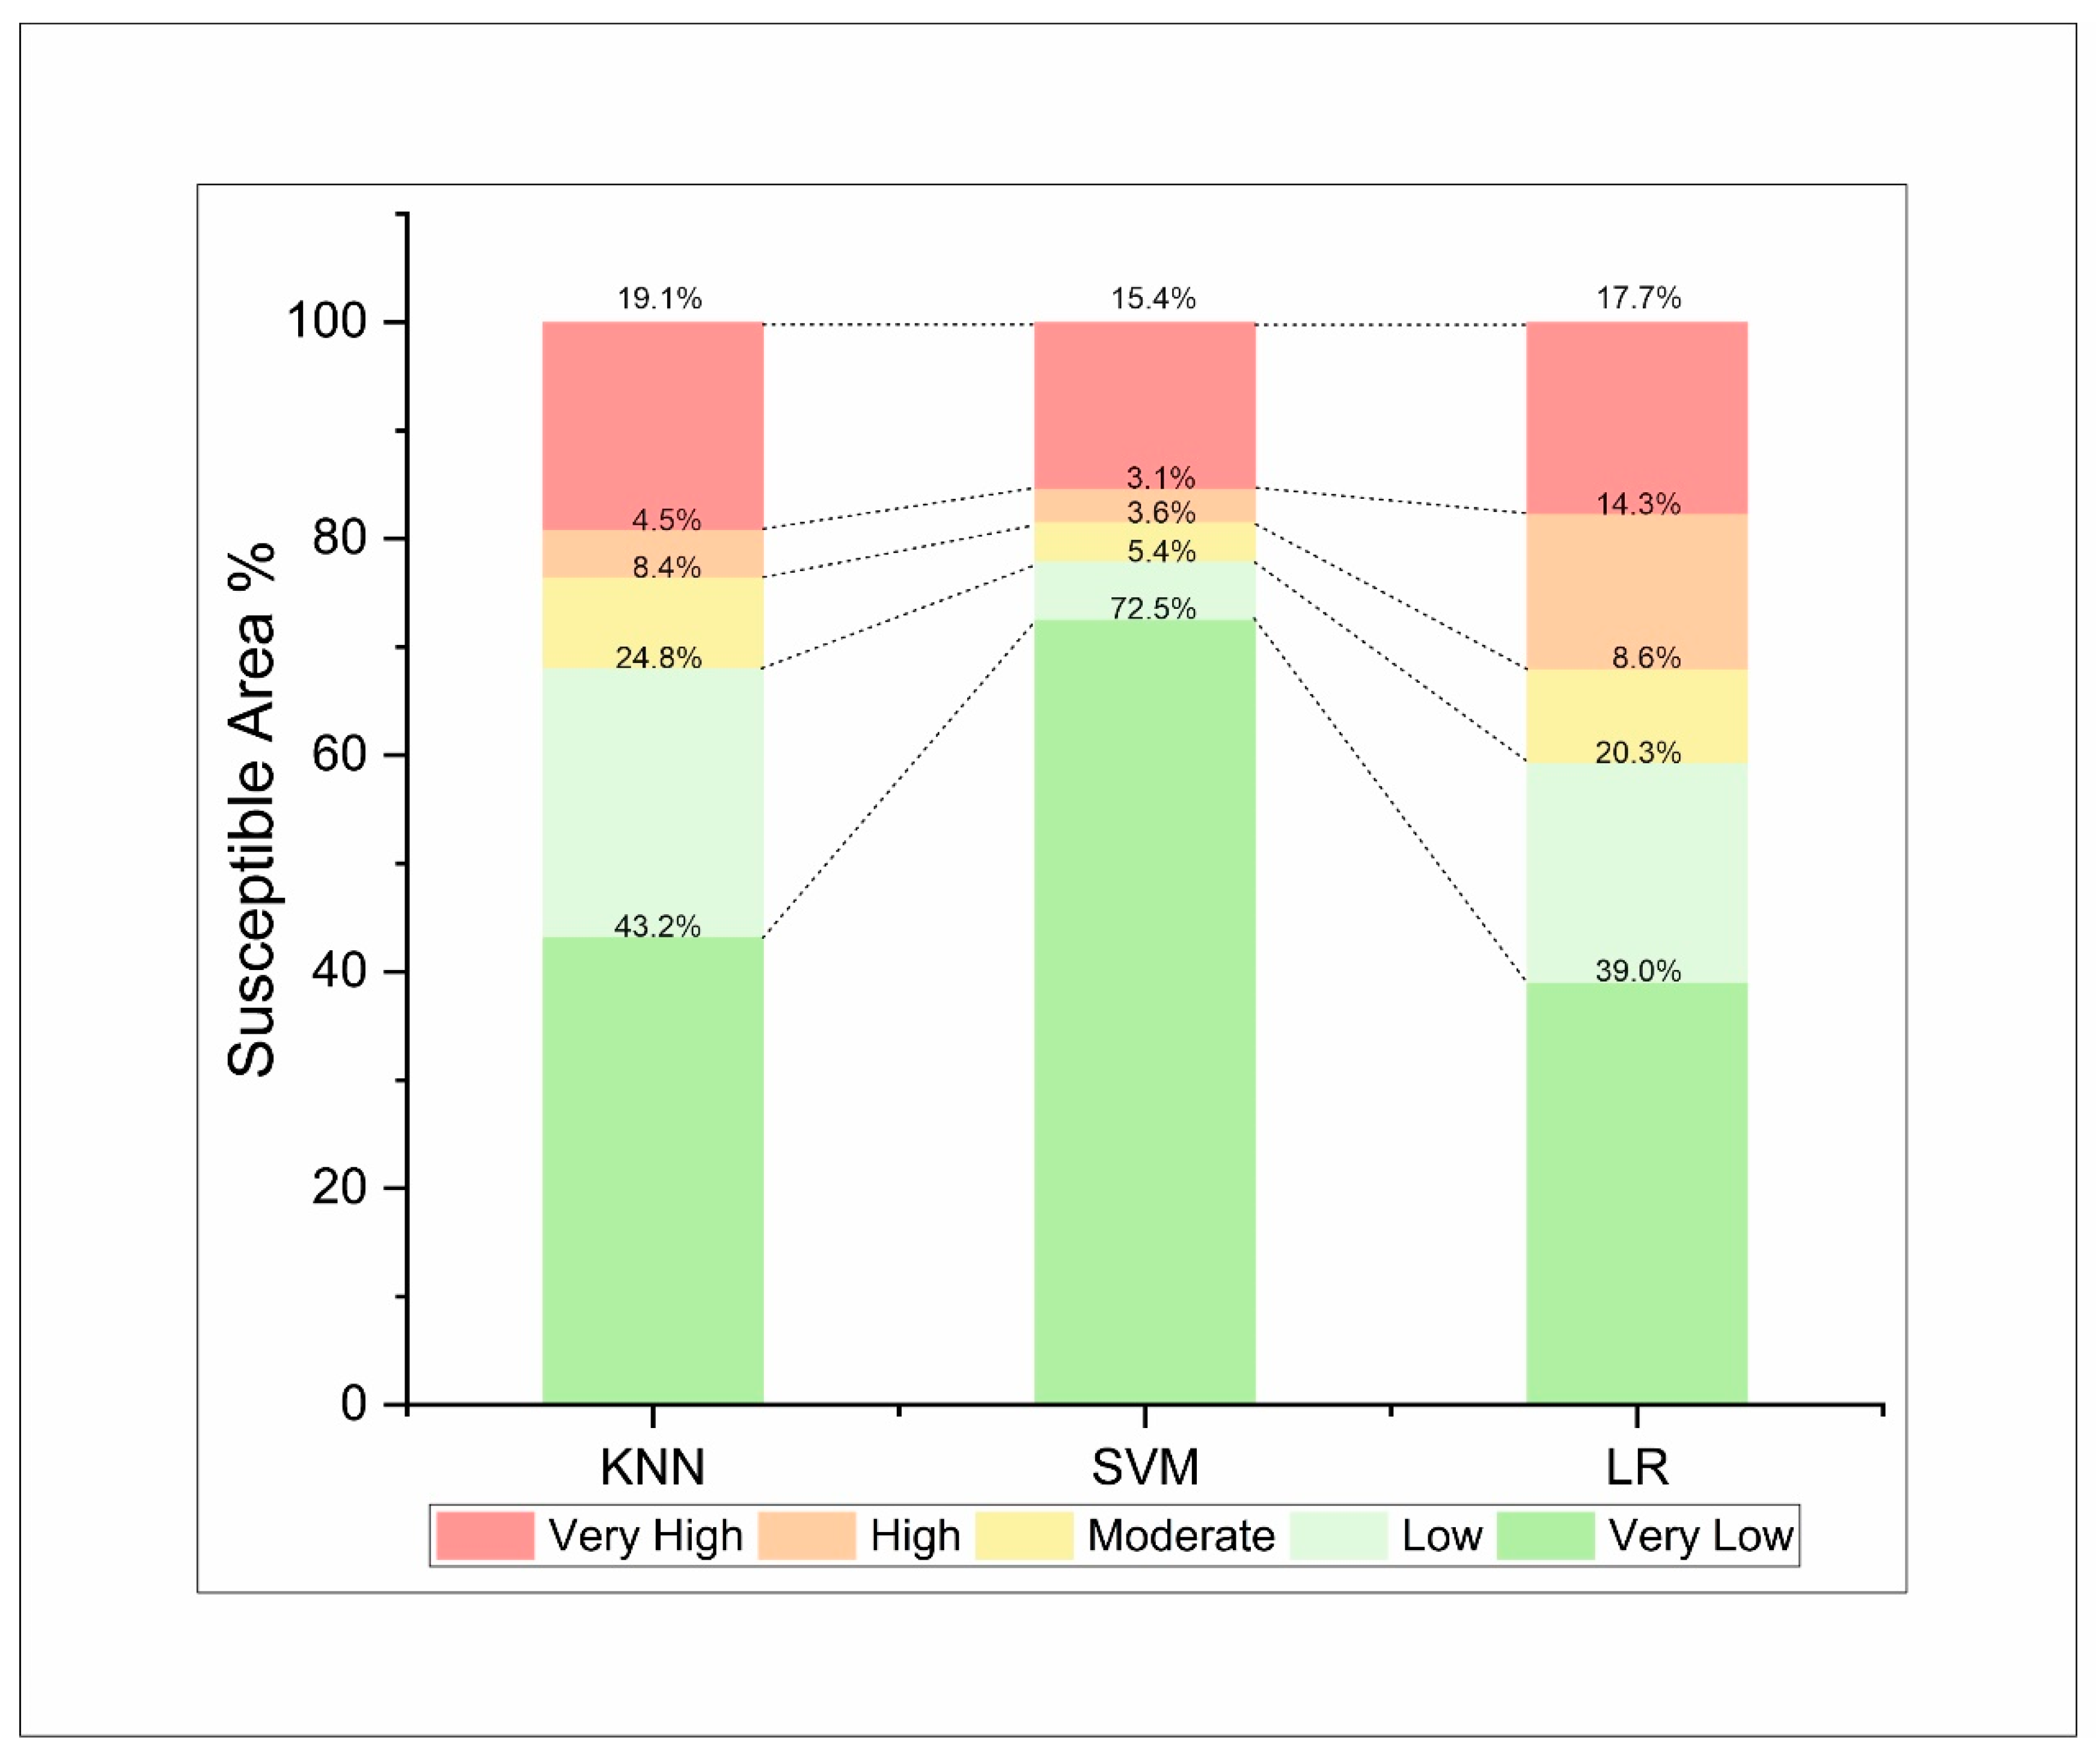
3.3. Construction and Validation of LSM

After a comprehensive analysis of the statistical indicators, it became evident that logistic regression (LR) stood out as the most accurate baseline model, while the XGBoost model excels among the ensemble learning algorithms. The intricate topography and varied environmental factors were seamlessly integrated into the maps, providing a comprehensive overview of susceptibility levels. Figure 9 and Figure 10 showcase graphical representations of the LSM generated through the application of different algorithms. The ultimate LSM was portrayed and segmented into five susceptibility categories using the natural break technique: very low, low, moderate, high, and very high levels of susceptibility. The selection of LR as the top-performing baseline model and XGBoost as the optimal ensemble learning algorithm underscores their effectiveness in LSM. However, among all the ML models, XGBoost was the top-performing model.

4. Discussion

4.1. Feature Selection

In our investigation of variable importance using a random forest classifier and CFS, a remarkable alignment in the order of significance was discerned among the key predictor variables. Both methodologies consistently identified slope, aspect, annual rainfall, distance to fault, elevation, land use/land cover (LULC), topographic wetness index (TWI), distance to road, normalized difference vegetation index (NDVI), curvature, geology, and distance to stream as influential factors. The noteworthy similarity in the order of variable importance reaffirmed the robustness of our findings and fortified the credibility of the identified factors.
Specifically, the top-ranked variables in both analyses, such as slope, aspect, and annual rainfall, consistently emerged as primary drivers in predicting outcome. The results concur with the outcomes of prior research [62], where researchers concluded that slope was the primary predictor of landslide occurrence [65]. Landslide probability increased with an increase in terrain gradient; however, the weight diminished for slopes exceeding 70 degrees. Cliffs devoid of colluvium cover are likely attributed to the reduced frequency of landslides at slope angles of more than 70 degrees. Geological map indications signified the influential role of lithological sections in landslide distribution. Terrigenous formations and Quaternary deposits, identified as loose materials, were revealed to be the geological units that were most susceptible [112]. Road networks, too, emerged as a significant and extensive factor determining landslide spatial distribution, which is attributed to frequent landslides being due to unregulated blasts and excavation activities during road construction on sensitive slopes [113].
This concurrence in the hierarchy of importance suggests a consensus regarding the dominant role that the variables demonstrated while shaping the observed patterns. The preservation of order across a range of environmental, topographic, and anthropogenic variables further improved the comprehension of their respective impacts on the studied phenomenon. The comparative analysis demonstrated the strength of CFS in identifying clear, linear connections; however, RF unveiled hidden, non-linear relationships. Established factors like slope and elevation dominate with linear relationships; contrarily, geological characteristics gain prominence due to RF’s ability to capture complex interactions. The current research enriches the discourse on landslide prediction by not only reaffirming the significance of conventional predictors, but also advocating for a dynamic modeling approach.
The variable importance order between the RF and CFS methods, which highly concur, implied a degree of internal validation as two independent approaches converge on similar conclusions. This robust correlation in the ranking of variables not only provides a more comprehensive understanding of their relative significance, but also lends additional support to the overall reliability and generalizability of the results of this study. While subtle variances might exist in the exact rankings, the overarching concurrence in variable importance undermines the continuous influence of particular factors across both analytical techniques.

4.2. Validation of the Models

ML approaches have achieved global recognition among scientific academics as effective tools for addressing various real-world problems and challenges, exploiting both fundamental and specific information [114]. However, an ongoing debate continues within the scientific community regarding the optimal ML models capable of providing significantly precise predictions for landslides, i.e., landslide susceptibility [115]. Precision can be calculated and evaluated based on a diverse set of factors [116], leading to a noticeable increase in the quantity of models used for accuracy assessment [117].
This research investigated and integrated a range of baseline and ensemble ML models, encompassing KNN, SVM, LR, RF, XGBoost, CG, LGBM, AdaBoost, and Dagging. Prominently, the geomorphological scientific community has invested a substantial amount of effort and time in the development and testing of new models [118]. However, the distinction between baseline and ensemble algorithms is highlighted in predictive performance. Logistic regression (LR) resulted in an ACC of 0.912 and AUC of 0.784, although SVM and KNN also exhibited competitive accuracy. The accuracy of the LR algorithm aligns with the results of the research conducted by Bahareh Kalantara, who examined the predictive competencies of three discrete algorithms for landslide prediction: LR, SVM, and ANN. This further highlights the robustness of linear models in such circumstances, as LR outperforms SVM and ANN in terms of overall accuracy [119]. Contrarily, ensemble algorithms, specifically XGBoost, LGBM, and (RF), surpassed the baseline models with higher ACC and AUC values. XGBoost remained distinctive, with an ACC of 0.927 and an AUC of 0.910, showcasing its efficacy in classification. The precision of the XGBoost algorithm matches with the conclusions of the study led by Isma Kulsoom, who explored the predictive capabilities of five dissimilar algorithms for landslide prediction: Naïve Bayes, KNN, RF, XGBoost, and ANN,. Additionally, it also emphasizes the strength of ensemble models in such scenarios, as XGBoost outperforms the distinct models in terms of overall accuracy [120].
The ensemble models exceeded the baseline models in terms of accuracy (ACC) and Kappa (K). Through all metrics, ensemble models attained higher average scores, with XGBoost reaching the highest accuracy. This suggested that the amalgamation of multiple learning models can result in more robust and accurate predictions compared to individual models. The AUC metric demonstrated a similar performance for both groups. While ensembles have a minor edge in AUC as well, the differences were not significant compared to ACC and Kappa. This could indicate that both groups were effective at distinguishing among positive and negative classes, but ensembles might be advantageous at correctly classifying borderline cases.
The cumulative robustness of the ensemble methods, combining diverse model capabilities, proved superior for improved predictive accuracy. This emphasizes the potential of ensemble methods and techniques over individual models, with the choice depending on the specific application needed and considerations of accuracy, AUC, and Kappa statistics. Nevertheless, it was notable that all the distinct ensemble models examined in the current study illustrated adequate performance, highlighting the promising potential and efficacy of the hybrid approach in enhancing model performance [117].
In general, ML models offer various advantages when compared to alternative methods. Automated data analysis techniques, specifically, provide an efficient and streamlined identification of trends and patterns. These eliminate the need for human intervention, which improves productivity while reducing the potential for errors. Moreover, automated data analysis facilitates continuous progress, as it can be performed regularly with minor time and resource limitations. These techniques aid the progression of processing multidimensionally complex data while establishing an enhanced and comprehensive analysis. Lastly, automated data analysis contributes to and provides users with a diverse set of tools and functionalities.

4.3. Use of LSM in Landslide Management

LSM is one of the primary resources in the management of landslide-prone landscapes. Governments and policy-making institutions may have a choice to use high-performance predictive models to determine landslide-vulnerable areas [121]. In this regard, the current research illustrated the different classes of landslide susceptibility via the natural breaks (NB) model [98]. LSM, ranging from minimal susceptibility to maximum susceptibility, was derived from the ensemble and baseline models, which consisted of five different susceptibility levels. These models’ classes were categorized in the following pattern: LR—very low susceptibility with a probability range of 39.0%; low susceptibility with a probability range of 20.3%; moderate susceptibility with a probability range of 8.6%; high susceptibility with a probability range of 14.3%; and very high susceptibility, with a probability range of 17.7% (Figure 11). RF—very low susceptibility with a probability range of 7.7%; low susceptibility with a probability range of 24.4%; moderate susceptibility with a probability range of 35.8%; high susceptibility with a probability range of 14.8%; and very high susceptibility with a probability range of 17.4% (Figure 12).
This research identified very low to very high landslide-prone regions with distinct variations in landslide susceptibility rate. The susceptibility levels generated a diverse mosaic, and irregular patterns of dispersion were found across the research area. This irregular pattern further added to the complexity of the interplay of factors. It further undermined the comprehension of local terrain intricacies to apprehend the development of effective and efficient strategies for landslide risk mitigation. The utilization of LSM, generated through advanced predictive models, proved instrumental in effective landslide management. This detailed mapping will not only aid government entities in pinpointing high-risk areas, but also serve as a foundational tool for implementing targeted mitigation strategies.

5. Conclusions

The accurate identification of landslide-prone locations necessitates the application of cutting-edge ML methods for the precise tracking and assessment of landslides. In this study, nine advanced ML techniques were employed to assess landslide risks in the research region.
Using ROC curve analysis, ACC%, and Kappa techniques, we compared already-established LSM to actual landslide events, completing the evaluation procedure. Among the models tested, the ensemble learning algorithm XGBoost and the baseline learning algorithm LR outperformed all other ML models. However, among all the ML models, XGBoost was the top-performing model. Analyzing the elements influencing landslide risk in the research area revealed that slope was the most crucial factor. This research underscores the value of employing the most suitable ML methods for measuring landslide susceptibility, as these methods require less time to learn and produce more accurate findings.
This study pinpoints the significant advantage of ML approaches and their capacity to handle both continuous and categorical data without necessitating the classification of continuous parameters. Land-use planning, early warning system development, foundation planning, and scientific infrastructure evaluation can all benefit from the approach adopted in this research.
Moreover, future research should focus on integrating deep learning models and InSar techniques to enhance the accuracy and precision of LSM. This dynamic duo has the potential to propel research forward, offering improved insights for more effective and detailed analyses in future studies. Though the present study has yielded significant results, the deficiency of the available landslide dataset provides room for future prospects. With improved datasets, the accuracy and potency of the presented ML models can be enhanced. Furthermore, the accurate selection of non-landslide points during the delineation process can improve the rigor and validity of the study.

Author Contributions

N.A., conceptualization, formal analysis, methodology, software, visualization, writing—original draft; J.C., funding acquisition, investigation, project administration, supervision, writing—review and editing; X.F., resources, supervision, validation, writing—review and editing; R.A., data curation, software, writing—review and editing; M.A.H., formal analysis, software, writing—review and editing; H.D., data curation, methodology, visualization, writing—review and editing; J.H., data curation, methodology, formal analysis, writing—review and editing, grammar checking; A.A., data curation, funding acquisition, review and editing. All authors have read and agreed to the published version of the manuscript.

Funding

The authors extend their appreciation to Prince Sattam bin Abdulaziz University for funding this research work through the project number (PSAU/2024/01/78918).

Data Availability Statement

The study data can be obtained by contacting the first and corresponding authors. However, they are not currently public due to their use in an ongoing thesis.

Acknowledgments

The authors would like to thank the editors and the anonymous referees for their insightful and constructive comments that have led to an improved version of this paper. The authors extend their appreciation to Prince Sattam bin Abdulaziz University for funding this research work through the project number (PSAU/2024/01/78918). Nafees Ali is an awardee for the ANSO Scholarship 2021-PhD. Javed Hussain is an awardee for the ANSO Scholarship 2023-PhD.

Conflicts of Interest

The authors declare no conflicts of interest.

References

  1. Guo, J.; Cui, Y.; Xu, W.; Yin, Y.; Li, Y.; Jin, W. Numerical Investigation of the Landslide-Debris Flow Transformation Process Considering Topographic and Entrainment Effects: A Case Study. Landslides 2022, 19, 773–788. [Google Scholar] [CrossRef]
  2. Xiong, H.; Ma, C.; Li, M.; Tan, J.; Wang, Y. Landslide Susceptibility Prediction Considering Land Use Change and Human Activity: A Case Study under Rapid Urban Expansion and Afforestation in China. Sci. Total Environ. 2023, 866, 161430. [Google Scholar] [CrossRef] [PubMed]
  3. Gómez, D.; García, E.F.; Aristizábal, E. Spatial and Temporal Landslide Distributions Using Global and Open Landslide Databases. Nat. Hazards 2023, 117, 25–55. [Google Scholar] [CrossRef]
  4. Khan, A.; Shitao, Z.; Khan, G. Comparative Analysis and Landslide Susceptibility Mapping of Hunza and Nagar Districts, Pakistan. Arab. J. Geosci. 2022, 15, 1644. [Google Scholar] [CrossRef]
  5. Sökefeld, M. The Power of Lists: IDPs and Disaster Governmentality after the Attabad Landslide in Northern Pakistan. Ethnos 2022, 87, 365–383. [Google Scholar] [CrossRef]
  6. Cheema, A.R. Disaster Management in Pakistan. In The Role of Mosque in Building Resilient Communities; Springer: Berlin/Heidelberg, Germany, 2022; pp. 51–93. [Google Scholar]
  7. Sestras, P.; Bilașco, Ștefan; Roșca, S.; Veres, I.; Ilies, N.; Hysa, A.; Spalević, V.; Cîmpeanu, S.M. Multi-Instrumental Approach to Slope Failure Monitoring in a Landslide Susceptible Newly Built-Up Area: Topo-Geodetic Survey, UAV 3D Modelling and Ground-Penetrating Radar. Remote Sens. 2022, 14, 5822. [Google Scholar] [CrossRef]
  8. Yu, H.; Arabameri, A.; Costache, R.; Anca, C.; Arora, A. Land Subsidence Susceptibility Assessment Using Advanced Artificial Intelligence Models. Geocarto Int. 2022, 37, 18067–18093. [Google Scholar] [CrossRef]
  9. Goswami, A.; Sen, S.; Sanyal, R. Delineation of Landslide Hazard Zones of a Part of Sutlej Basin in Himachal Pradesh through Frequency Ratio Model. In Convergence of Deep Learning and Artificial Intelligence in Internet of Things; CRC Press: Boca Raton, FL, USA, 2022; pp. 211–229. ISBN 100335596X. [Google Scholar]
  10. Arabameri, A.; Chandra Pal, S.; Rezaie, F.; Chakrabortty, R.; Saha, A.; Blaschke, T.; Di Napoli, M.; Ghorbanzadeh, O.; Thi Ngo, P.T. Decision Tree Based Ensemble Machine Learning Approaches for Landslide Susceptibility Mapping. Geocarto Int. 2022, 37, 4594–4627. [Google Scholar] [CrossRef]
  11. Naceur, H.A.; Abdo, H.G.; Igmoullan, B.; Namous, M.; Almohamad, H.; Al Dughairi, A.A.; Al-Mutiry, M. Performance Assessment of the Landslide Susceptibility Modelling Using the Support Vector Machine, Radial Basis Function Network, and Weight of Evidence Models in the N’fis River Basin, Morocco. Geosci. Lett. 2022, 9, 39. [Google Scholar] [CrossRef]
  12. Mao, Z.; Shi, S.; Li, H.; Zhong, J.; Sun, J. Landslide Susceptibility Assessment Using Triangular Fuzzy Number-Analytic Hierarchy Processing (TFN-AHP), Contributing Weight (CW) and Random Forest Weighted Frequency Ratio (RF Weighted FR) at the Pengyang County, Northwest China. Environ. Earth Sci. 2022, 81, 86. [Google Scholar] [CrossRef]
  13. Eitvandi, N.; Sarikhani, R.; Derikvand, S. Landslide Susceptibility Mapping by Integrating Analytical Hierarchy Process, Frequency Ratio, and Fuzzy Gamma Operator Models, Case Study: North of Lorestan Province, Iran. Environ. Monit. Assess. 2022, 194, 600. [Google Scholar] [CrossRef] [PubMed]
  14. Shen, H.; Huang, F.; Fan, X.; Shahabi, H.; Shirzadi, A.; Wang, D.; Peng, C.; Zhao, X.; Chen, W. Improving the Performance of Artificial Intelligence Models Using the Rotation Forest Technique for Landslide Susceptibility Mapping. Int. J. Environ. Sci. Technol. 2023, 20, 11239–11254. [Google Scholar] [CrossRef]
  15. Sahin, E.K. Implementation of Free and Open-Source Semi-Automatic Feature Engineering Tool in Landslide Susceptibility Mapping Using the Machine-Learning Algorithms RF, SVM, and XGBoost. Stoch. Environ. Res. Risk Assess. 2023, 37, 1067–1092. [Google Scholar] [CrossRef]
  16. Hong, H.; Pradhan, B.; Jebur, M.N.; Bui, D.T.; Xu, C.; Akgun, A. Spatial Prediction of Landslide Hazard at the Luxi Area (China) Using Support Vector Machines. Environ. Earth Sci. 2016, 75, 40. [Google Scholar] [CrossRef]
  17. Chen, W.; Chai, H.; Zhao, Z.; Wang, Q.; Hong, H. Landslide Susceptibility Mapping Based on GIS and Support Vector Machine Models for the Qianyang County, China. Environ. Earth Sci. 2016, 75, 474. [Google Scholar] [CrossRef]
  18. Zhao, Q.; Chen, W.; Peng, C.; Wang, D.; Xue, W.; Bian, H. Modeling Landslide Susceptibility Using an Evidential Belief Function-Based Multiclass Alternating Decision Tree and Logistic Model Tree. Environ. Earth Sci. 2022, 81, 404. [Google Scholar] [CrossRef]
  19. Abedini, M.; Ghasemian, B.; Shirzadi, A.; Bui, D.T. A Comparative Study of Support Vector Machine and Logistic Model Tree Classifiers for Shallow Landslide Susceptibility Modeling. Environ. Earth Sci. 2019, 78, 560. [Google Scholar] [CrossRef]
  20. SS, V.C.; Shaji, E. Landslide Identification Using Machine Learning Techniques: Review, Motivation, and Future Prospects. Earth Sci. Inform. 2022, 15, 2063–2090. [Google Scholar] [CrossRef]
  21. Pradhan, B.; Lee, S. Landslide Risk Analysis Using Artificial Neural Network Model Focusing on Different Training Sites. Int. J. Phys. Sci. 2009, 3, 1–15. [Google Scholar]
  22. Zhao, Z.; Xu, Z.; Hu, C.; Wang, K.; Ding, X. Geographically Weighted Neural Network Considering Spatial Heterogeneity for Landslide Susceptibility Mapping: A Case Study of Yichang City, China. Catena 2024, 234, 107590. [Google Scholar] [CrossRef]
  23. Pham, B.T.; van Phong, T.; Nguyen-Thoi, T.; Parial, K.; Singh, S.K.; Ly, H.-B.; Nguyen, K.T.; Ho, L.S.; van Le, H.; Prakash, I. Ensemble Modeling of Landslide Susceptibility Using Random Subspace Learner and Different Decision Tree Classifiers. Geocarto Int. 2022, 37, 735–757. [Google Scholar] [CrossRef]
  24. Park, I.; Lee, S. Spatial Prediction of Landslide Susceptibility Using a Decision Tree Approach: A Case Study of the Pyeongchang Area, Korea. Int. J. Remote Sens. 2014, 35, 6089–6112. [Google Scholar] [CrossRef]
  25. Tsangaratos, P.; Ilia, I. Landslide Susceptibility Mapping Using a Modified Decision Tree Classifier in the Xanthi Perfection, Greece. Landslides 2016, 13, 305–320. [Google Scholar] [CrossRef]
  26. Duan, G.; Hu, J.; Deng, L.; Fu, J. Landslide Susceptibility Prediction by Gray Wolf Optimized Support Vector Machine Model under Different Factor States. J. Appl. Remote Sens. 2023, 17, 44510. [Google Scholar] [CrossRef]
  27. Ballabio, C.; Sterlacchini, S. Support Vector Machines for Landslide Susceptibility Mapping: The Staffora River Basin Case Study, Italy. Math. Geosci. 2012, 44, 47–70. [Google Scholar] [CrossRef]
  28. Luu, C.; Ha, H.; Bui, Q.D.; Luong, N.-D.; Khuc, D.T.; Vu, H.; Nguyen, D.Q. Flash Flood and Landslide Susceptibility Analysis for a Mountainous Roadway in Vietnam Using Spatial Modeling. Quat. Sci. Adv. 2023, 11, 100083. [Google Scholar] [CrossRef]
  29. Wolpert, D.H. The Lack of a Priori Distinctions between Learning Algorithms. Neural Comput. 1996, 8, 1341–1390. [Google Scholar] [CrossRef]
  30. Sharma, B.; Pandey, A. Mapping of Erosion Hazard in and around Kharagpur Hills, Bihar Using Hydrological Indices. In MOL2NET’22, Conference on Molecular, Biomed., Comput. & Network Science and Engineering, 8th ed.; MDPI: Basel, Switzerland, 2022. [Google Scholar]
  31. Zafar, S.; Zafar Khan, M.; Mehmood, T.; Begum, F.; Sadiq, M. Role of Community-Based Conservation and Natural Resource Management in Building Climate Resilience among Vulnerable Mountain Societies. Clim. Dev. 2022, 15, 608–621. [Google Scholar] [CrossRef]
  32. Hussain, J.; Zhang, J.; Saleem, A.; Luo, Y.; Afaq Hussain, M.; Hussain, J.; Fitria, F.; Akram, W.; Arifullah; Hussain, H. Suitability Assessment Constraints of Potential Aggregate Resources Using an Integrated GIS Approach. J. Mater. Civ. Eng. 2023, 35, 4023307. [Google Scholar] [CrossRef]
  33. Hussain, J.; Zhang, J.; Iqbal, S.M.; Hussain, J.; Fitria, F.; Lina, X.; Ali, N.; Hussain, S.; Akram, W.; Ali, M. Exploring the Potential of Late Permian Aggregate Resources for Utilization in Engineering Structures through Geotechnical, Geochemical and Petrographic Analyses. Sci. Rep. 2023, 13, 5088. [Google Scholar] [CrossRef]
  34. Bahram, I. Analysis of Seismicity and Related Seismic Risk in Muslim Countries: Case Studies from Afghanistan and Pakistan. Ph.D. Thesis, University of Arkansas, Fayetteville, AR, USA, 2022. [Google Scholar]
  35. Madin, I.P.; Lawrence, R.D.; Ur-Rehman, S. The Northwestern Nanga Parbat–Haramosh Massif: Evidence for Crustal Uplift at the Northwestern Corner of the Indian Craton. Tecton. West. Himalayas Geol. Soc. Am. Spec. Pap. 1989, 232, 169–182. [Google Scholar]
  36. Searle, M.P.; Khan, M.A.; Fraser, J.E.; Gough, S.J.; Jan, M.Q. The Tectonic Evolution of the Kohistan-Karakoram Collision Belt along the Karakoram Highway Transect, North Pakistan. Tectonics 1999, 18, 929–949. [Google Scholar] [CrossRef]
  37. Petterson, M.G.; Windley, B.F. RbSr Dating of the Kohistan Arc-Batholith in the Trans-Himalaya of North Pakistan, and Tectonic Implications. Earth Planet. Sci. Lett. 1985, 74, 45–57. [Google Scholar] [CrossRef]
  38. Khan, H.; Shafique, M.; Khan, M.A.; Bacha, M.A.; Shah, S.U.; Calligaris, C. Landslide Susceptibility Assessment Using Frequency Ratio, a Case Study of Northern Pakistan. Egypt. J. Remote Sens. Sp. Sci. 2019, 22, 11–24. [Google Scholar] [CrossRef]
  39. Scaioni, M.; Longoni, L.; Melillo, V.; Papini, M. Remote Sensing for Landslide Investigations: An Overview of Recent Achievements and Perspectives. Remote Sens. 2014, 6, 9600–9652. [Google Scholar] [CrossRef]
  40. Su, X.; Zhang, Y.; Meng, X.; Yue, D.; Ma, J.; Guo, F.; Zhou, Z.; Rehman, M.U.; Khalid, Z.; Chen, G.; et al. Landslide Mapping and Analysis along the China-Pakistan Karakoram Highway Based on SBAS-InSAR Detection in 2017. J. Mt. Sci. 2021, 18, 2540–2564. [Google Scholar] [CrossRef]
  41. Deng, N.; Li, Y.; Ma, J.; Shahabi, H.; Hashim, M.; de Oliveira, G.; Chaeikar, S.S. A Comparative Study for Landslide Susceptibility Assessment Using Machine Learning Algorithms Based on Grid Unit and Slope Unit. Front. Environ. Sci. 2022, 10, 1009433. [Google Scholar] [CrossRef]
  42. Hall, M.A. Correlation-Based Feature Selection for Machine Learning. Ph.D. Thesis, The University of Waikato, Hamilton, New Zealand, 1999. [Google Scholar]
  43. Jaafari, A.; Zenner, E.K.; Panahi, M.; Shahabi, H. Hybrid Artificial Intelligence Models Based on a Neuro-Fuzzy System and Metaheuristic Optimization Algorithms for Spatial Prediction of Wildfire Probability. Agric. For. Meteorol. 2019, 266, 198–207. [Google Scholar] [CrossRef]
  44. Sahrane, R.; Bounab, A.; Kharim, Y.E.L. Investigating the Effects of Landslides Inventory Completeness on Susceptibility Mapping and Frequency-Area Distributions: Case of Taounate Province, Northern Morocco. Catena 2023, 220, 106737. [Google Scholar] [CrossRef]
  45. Hussain, M.A.; Chen, Z.; Zheng, Y.; Zhou, Y.; Daud, H. Deep Learning and Machine Learning Models for Landslide Susceptibility Mapping with Remote Sensing Data. Remote Sens. 2023, 15, 4703. [Google Scholar] [CrossRef]
  46. Hussain, S.; Pan, B.; Afzal, Z.; Ali, M.; Zhang, X.; Shi, X.; Ali, M. Landslide Detection and Inventory Updating Using the Time-Series InSAR Approach along the Karakoram Highway, Northern Pakistan. Sci. Rep. 2023, 13, 7485. [Google Scholar] [CrossRef] [PubMed]
  47. Chang, Z.; Huang, J.; Huang, F.; Bhuyan, K.; Meena, S.R.; Catani, F. Uncertainty Analysis of Non-Landslide Sample Selection in Landslide Susceptibility Prediction Using Slope Unit-Based Machine Learning Models. Gondwana Res. 2023, 117, 307–320. [Google Scholar] [CrossRef]
  48. Sukristiyanti, S.; Wikantika, K.; Sadisun, I.A.; Yayusman, L.F.; Soebowo, E. Preliminary Study of Landslide Susceptibility Modeling with Random Forest Algorithm Using R (Case Study: The Cisangkuy Sub-Watershed). In Proceedings of the IOP Conference Series: Earth and Environmental Science; IOP Publishing: Bristol, UK, 2021; Volume 936, p. 12015. [Google Scholar]
  49. Chen, W.; Shahabi, H.; Shirzadi, A.; Li, T.; Guo, C.; Hong, H.; Li, W.; Pan, D.; Hui, J.; Ma, M.; et al. A Novel Ensemble Approach of Bivariate Statistical-Based Logistic Model Tree Classifier for Landslide Susceptibility Assessment. Geocarto Int. 2018, 33, 1398–1420. [Google Scholar] [CrossRef]
  50. Ali, A.; Akhtar, R.; Hussain, J. Unveiling High Mountain Communities’ Perception of Climate Change Impact on Lives and Livelihoods in Gilgit-Baltistan: Evidence from People-Centric Approach. Environ. Commun. 2023, 17, 602–617. [Google Scholar] [CrossRef]
  51. Shah, N.A.; Shafique, M.; Ishfaq, M.; Faisal, K.; van der Meijde, M. Integrated Approach for Landslide Risk Assessment Using Geoinformation Tools and Field Data in Hindukush Mountain Ranges, Northern Pakistan. Sustainability 2023, 15, 3102. [Google Scholar] [CrossRef]
  52. Hussain, S.; Hongxing, S.; Ali, M.; Ali, M. PS-InSAR Based Validated Landslide Susceptibility Modelling: A Case Study of Ghizer Valley, Northern Pakistan. Geocarto Int. 2022, 37, 3941–3962. [Google Scholar] [CrossRef]
  53. Hussain, S.; Hongxing, S.; Ali, M.; Sajjad, M.M.; Ali, M.; Afzal, Z.; Ali, S. Optimized Landslide Susceptibility Mapping and Modelling Using PS-InSAR Technique: A Case Study of Chitral Valley, Northern Pakistan. Geocarto Int. 2022, 37, 5227–5248. [Google Scholar] [CrossRef]
  54. Zárate, B.A.; El Hamdouni, R.; Fernández del Castillo, T. Characterization and Analysis of Landslide Evolution in Intramountain Areas in Loja (Ecuador) Using RPAS Photogrammetric Products. Remote Sens. 2023, 15, 3860. [Google Scholar] [CrossRef]
  55. Shang, H.; Su, L.; Chen, W.; Tsangaratos, P.; Ilia, I.; Liu, S.; Cui, S.; Duan, Z. Spatial Prediction of Landslide Susceptibility Using Logistic Regression (LR), Functional Trees (FTs), and Random Subspace Functional Trees (RSFTs) for Pengyang County, China. Remote Sens. 2023, 15, 4952. [Google Scholar] [CrossRef]
  56. Shahabi, H.; Ahmadi, R.; Alizadeh, M.; Hashim, M.; Al-Ansari, N.; Shirzadi, A.; Wolf, I.D.; Ariffin, E.H. Landslide Susceptibility Mapping in a Mountainous Area Using Machine Learning Algorithms. Remote Sens. 2023, 15, 3112. [Google Scholar] [CrossRef]
  57. Searle, M.P.; Kahn, M.A. Geological Map of North Pakistan and Adjacent Areas of Northern Ladakh and Western Tibet. (Western Himalaya, Salt Ranges, Kohistan, Karakoram, Hindu Kush), 1: 650 000; British Geological Service (BGS): Nottingham, UK, 1996. [Google Scholar]
  58. Feng, H.; Miao, Z.; Hu, Q. Study on the Uncertainty of Machine Learning Model for Earthquake-Induced Landslide Susceptibility Assessment. Remote Sens. 2022, 14, 2968. [Google Scholar] [CrossRef]
  59. Fan, X.; Liu, B.; Luo, J.; Pan, K.; Han, S.; Zhou, Z. Comparison of Earthquake-Induced Shallow Landslide Susceptibility Assessment Based on Two-Category LR and KDE-MLR. Sci. Rep. 2023, 13, 833. [Google Scholar] [CrossRef]
  60. Zhang, Y.; Xu, P.; Liu, J.; He, J.; Yang, H.; Zeng, Y.; He, Y.; Yang, C. Comparison of LR, 5-CV SVM, GA SVM, and PSO SVM for Landslide Susceptibility Assessment in Tibetan Plateau Area, China. J. Mt. Sci. 2023, 20, 979–995. [Google Scholar] [CrossRef]
  61. Yuan, X.; Liu, C.; Nie, R.; Yang, Z.; Li, W.; Dai, X.; Cheng, J.; Zhang, J.; Ma, L.; Fu, X. A Comparative Analysis of Certainty Factor-Based Machine Learning Methods for Collapse and Landslide Susceptibility Mapping in Wenchuan County, China. Remote Sens. 2022, 14, 3259. [Google Scholar] [CrossRef]
  62. Hussain, M.A.; Chen, Z.; Wang, R.; Shah, S.U.; Shoaib, M.; Ali, N.; Xu, D.; Ma, C. Landslide Susceptibility Mapping Using Machine Learning Algorithm. Civ. Eng. J. 2022, 8, 209–224. [Google Scholar] [CrossRef]
  63. Al-Aizari, A.R.; Al-Masnay, Y.A.; Aydda, A.; Zhang, J.; Ullah, K.; Islam, A.R.M.T.; Habib, T.; Kaku, D.U.; Nizeyimana, J.C.; Al-Shaibah, B.; et al. Assessment Analysis of Flood Susceptibility in Tropical Desert Area: A Case Study of Yemen. Remote Sens. 2022, 14, 4050. [Google Scholar] [CrossRef]
  64. Ullah, K.; Wang, Y.; Fang, Z.; Wang, L.; Rahman, M. Multi-Hazard Susceptibility Mapping Based on Convolutional Neural Networks. Geosci. Front. 2022, 13, 101425. [Google Scholar] [CrossRef]
  65. Hussain, M.A.; Chen, Z.; Kalsoom, I.; Asghar, A.; Shoaib, M. Landslide Susceptibility Mapping Using Machine Learning Algorithm: A Case Study along Karakoram Highway (KKH), Pakistan. J. Indian Soc. Remote Sens. 2022, 50, 849–866. [Google Scholar] [CrossRef]
  66. Sheng, Y.; Xu, G.; Jin, B.; Zhou, C.; Li, Y.; Chen, W. Data-Driven Landslide Spatial Prediction and Deformation Monitoring: A Case Study of Shiyan City, China. Remote Sens. 2023, 15, 5256. [Google Scholar] [CrossRef]
  67. Vapnik, V.; Vapnik, V. Statistical Learning Theory Wiley. New York 1998, 1, 2. [Google Scholar]
  68. Miao, F.; Ruan, Q.; Wu, Y.; Qian, Z.; Kong, Z.; Qin, Z. Landslide Dynamic Susceptibility Mapping Base on Machine Learning and the PS-InSAR Coupling Model. Remote Sens. 2023, 15, 5427. [Google Scholar] [CrossRef]
  69. Ali, S.A.; Parvin, F.; Pham, Q.B.; Khedher, K.M.; Dehbozorgi, M.; Rabby, Y.W.; Anh, D.T.; Nguyen, D.H. An Ensemble Random Forest Tree with SVM, ANN, NBT, and LMT for Landslide Susceptibility Mapping in the Rangit River Watershed, India. Nat. Hazards 2022, 113, 1601–1633. [Google Scholar] [CrossRef]
  70. Tang, H.; Wang, C.; An, S.; Wang, Q.; Jiang, C. A Novel Heterogeneous Ensemble Framework Based on Machine Learning Models for Shallow Landslide Susceptibility Mapping. Remote Sens. 2023, 15, 4159. [Google Scholar] [CrossRef]
  71. Al-Aizari, A.R.; Alzahrani, H.; AlThuwaynee, O.F.; Al-Masnay, Y.A.; Ullah, K.; Park, H.J.; Al-Areeq, N.M.; Rahman, M.; Hazaea, B.Y.; Liu, X. Uncertainty Reduction in Flood Susceptibility Mapping Using Random Forest and EXtreme Gradient Boosting Algorithms in Two Tropical Desert Cities, Shibam and Marib, Yemen. Remote Sens. 2024, 16, 336. [Google Scholar] [CrossRef]
  72. Deng, H.; Wu, X.; Zhang, W.; Liu, Y.; Li, W.; Li, X.; Zhou, P.; Zhuo, W. Slope-Unit Scale Landslide Susceptibility Mapping Based on the Random Forest Model in Deep Valley Areas. Remote Sens. 2022, 14, 4245. [Google Scholar] [CrossRef]
  73. Zhou, X.; Wen, H.; Zhang, Y.; Xu, J.; Zhang, W. Landslide Susceptibility Mapping Using Hybrid Random Forest with GeoDetector and RFE for Factor Optimization. Geosci. Front. 2021, 12, 101211. [Google Scholar] [CrossRef]
  74. Zhang, W.; Wu, C.; Tang, L.; Gu, X.; Wang, L. Efficient Time-Variant Reliability Analysis of Bazimen Landslide in the Three Gorges Reservoir Area Using XGBoost and LightGBM Algorithms. Gondwana Res. 2023, 123, 41–53. [Google Scholar] [CrossRef]
  75. Sun, D.; Chen, D.; Zhang, J.; Mi, C.; Gu, Q.; Wen, H. Landslide Susceptibility Mapping Based on Interpretable Machine Learning from the Perspective of Geomorphological Differentiation. Land 2023, 12, 1018. [Google Scholar] [CrossRef]
  76. Sun, D.; Wu, X.; Wen, H.; Gu, Q. A LightGBM-Based Landslide Susceptibility Model Considering the Uncertainty of Non-Landslide Samples. Geomat. Nat. Hazards Risk 2023, 14, 2213807. [Google Scholar] [CrossRef]
  77. Hindarto, D. Case Study: Gradient Boosting Machine vs. Light GBM in Potential Landslide Detection. J. Comput. Netw. Archit. High Perform. Comput. 2024, 6, 169–178. [Google Scholar] [CrossRef]
  78. Zhang, H.; Song, Y.; Xu, S.; He, Y.; Li, Z.; Yu, X.; Liang, Y.; Wu, W.; Wang, Y. Combining a Class-Weighted Algorithm and Machine Learning Models in Landslide Susceptibility Mapping: A Case Study of Wanzhou Section of the Three Gorges Reservoir, China. Comput. Geosci. 2022, 158, 104966. [Google Scholar] [CrossRef]
  79. Wang, S.; Zhuang, J.; Zheng, J.; Fan, H.; Kong, J.; Zhan, J. Application of Bayesian Hyperparameter Optimized Random Forest and XGBoost Model for Landslide Susceptibility Mapping. Front. Earth Sci. 2021, 9, 712240. [Google Scholar] [CrossRef]
  80. Al-Masnay, Y.A.; Al-Areeq, N.M.; Ullah, K.; Al-Aizari, A.R.; Rahman, M.; Wang, C.; Zhang, J.; Liu, X. Estimate Earth Fissure Hazard Based on Machine Learning in the Qa’ Jahran Basin, Yemen. Sci. Rep. 2022, 12, 21936. [Google Scholar] [CrossRef]
  81. Zhang, Y.; Deng, L.; Han, Y.; Sun, Y.; Zang, Y.; Zhou, M. Landslide Hazard Assessment in Highway Areas of Guangxi Using Remote Sensing Data and a Pre-Trained XGBoost Model. Remote Sens. 2023, 15, 3350. [Google Scholar] [CrossRef]
  82. Zhang, J.; Ma, X.; Zhang, J.; Sun, D.; Zhou, X.; Mi, C.; Wen, H. Insights into Geospatial Heterogeneity of Landslide Susceptibility Based on the SHAP-XGBoost Model. J. Environ. Manag. 2023, 332, 117357. [Google Scholar] [CrossRef]
  83. Zhang, W.; He, Y.; Wang, L.; Liu, S.; Meng, X. Landslide Susceptibility Mapping Using Random Forest and Extreme Gradient Boosting: A Case Study of Fengjie, Chongqing. Geol. J. 2023, 58, 2372–2387. [Google Scholar] [CrossRef]
  84. Kavzoglu, T.; Teke, A. Predictive Performances of Ensemble Machine Learning Algorithms in Landslide Susceptibility Mapping Using Random Forest, Extreme Gradient Boosting (XGBoost) and Natural Gradient Boosting (NGBoost). Arab. J. Sci. Eng. 2022, 47, 7367–7385. [Google Scholar] [CrossRef]
  85. Yavuz Ozalp, A.; Akinci, H.; Zeybek, M. Comparative Analysis of Tree-Based Ensemble Learning Algorithms for Landslide Susceptibility Mapping: A Case Study in Rize, Turkey. Water 2023, 15, 2661. [Google Scholar] [CrossRef]
  86. Chen, T.; Guestrin, C. Xgboost: A Scalable Tree Boosting System. In Proceedings of the 22nd ACM Sigkdd International Conference on Knowledge Discovery and Data Mining, San Francisco, CA, USA, 13–17 August 2016; pp. 785–794. [Google Scholar]
  87. Freund, Y.; Schapire, R.E. A Decision-Theoretic Generalization of on-Line Learning and an Application to Boosting. J. Comput. Syst. Sci. 1997, 55, 119–139. [Google Scholar] [CrossRef]
  88. Yu, H.; Pei, W.; Zhang, J.; Chen, G. Landslide Susceptibility Mapping and Driving Mechanisms in a Vulnerable Region Based on Multiple Machine Learning Models. Remote Sens. 2023, 15, 1886. [Google Scholar] [CrossRef]
  89. Jiang, Z.; Wang, M.; Liu, K. Comparisons of Convolutional Neural Network and Other Machine Learning Methods in Landslide Susceptibility Assessment: A Case Study in Pingwu. Remote Sens. 2023, 15, 798. [Google Scholar] [CrossRef]
  90. Wu, Y.; Ke, Y.; Chen, Z.; Liang, S.; Zhao, H.; Hong, H. Application of Alternating Decision Tree with AdaBoost and Bagging Ensembles for Landslide Susceptibility Mapping. Catena 2020, 187, 104396. [Google Scholar] [CrossRef]
  91. Ting, K.M.; Witten, I.H. Stacking Bagged and Dagged Models; University of Waikato, Department of Computer Science: Hamilton, New Zealand, 1997. [Google Scholar]
  92. Sahana, M.; Pham, B.T.; Shukla, M.; Costache, R.; Thu, D.X.; Chakrabortty, R.; Satyam, N.; Nguyen, H.D.; van Phong, T.; Le, H. Van Rainfall Induced Landslide Susceptibility Mapping Using Novel Hybrid Soft Computing Methods Based on Multi-Layer Perceptron Neural Network Classifier. Geocarto Int. 2022, 37, 2747–2771. [Google Scholar] [CrossRef]
  93. Nguyen, V.T.; Tran, T.H.; Ha, N.A.; Ngo, V.L.; Nadhir, A.A.; Tran, V.P.; Nguyen, H.D.; Malek, M.A.; Amini, A.; Prakash, I.; et al. GIS Based Novel Hybrid Computational Intelligence Models for Mapping Landslide Susceptibility: A Case Study at Da Lat City, Vietnam. Sustainability 2019, 11, 7118. [Google Scholar] [CrossRef]
  94. Mallick, J.; Alqadhi, S.; Talukdar, S.; Sarkar, S.K.; Roy, S.K.; Ahmed, M. Modelling and Mapping of Landslide Susceptibility Regulating Potential Ecosystem Service Loss: An Experimental Research in Saudi Arabia. Geocarto Int. 2022, 37, 10170–10198. [Google Scholar] [CrossRef]
  95. Yan, X.; Jiao, J.; LI, M.; QI, H.; Liang, Y.; XU, Q.; Zhang, Z.; Jiang, X.; Li, J.; Zhang, Z. Lateral Connectivity of Landslides and Its Influence on Sediment Yield of Slope-Channel Cascade Under Heavy Rainstorm on the Loess Plateau. CATENA 2022, 216, 106378. [Google Scholar] [CrossRef]
  96. Hang, H.T.; Tung, H.; Hoa, P.D.; Phuong, N.V.; van Phong, T.; Costache, R.; Nguyen, H.D.; Amiri, M.; Le, H.-A.; Le, H. Van Spatial Prediction of Landslides along National Highway-6, Hoa Binh Province, Vietnam Using Novel Hybrid Models. Geocarto Int. 2022, 37, 5201–5226. [Google Scholar] [CrossRef]
  97. Pham, B.T.; Nguyen-Thoi, T.; Qi, C.; van Phong, T.; Dou, J.; Ho, L.S.; van Le, H.; Prakash, I. Coupling RBF Neural Network with Ensemble Learning Techniques for Landslide Susceptibility Mapping. Catena 2020, 195, 104805. [Google Scholar] [CrossRef]
  98. Pham, B.T.; Prakash, I.; Chen, W.; Ly, H.-B.; Ho, L.S.; Omidvar, E.; Tran, V.P.; Tien Bui, D. A Novel Intelligence Approach of a Sequential Minimal Optimization-Based Support Vector Machine for Landslide Susceptibility Mapping. Sustainability 2019, 11, 6323. [Google Scholar] [CrossRef]
  99. Thai Pham, B.; Shirzadi, A.; Shahabi, H.; Omidvar, E.; Singh, S.K.; Sahana, M.; Talebpour Asl, D.; Bin Ahmad, B.; Kim Quoc, N.; Lee, S. Landslide Susceptibility Assessment by Novel Hybrid Machine Learning Algorithms. Sustainability 2019, 11, 4386. [Google Scholar] [CrossRef]
  100. Chen, W.; Shahabi, H.; Shirzadi, A.; Hong, H.; Akgun, A.; Tian, Y.; Liu, J.; Zhu, A.; Li, S. Novel Hybrid Artificial Intelligence Approach of Bivariate Statistical-Methods-Based Kernel Logistic Regression Classifier for Landslide Susceptibility Modeling. Bull. Eng. Geol. Environ. 2019, 78, 4397–4419. [Google Scholar] [CrossRef]
  101. Costache, R.; Pham, Q.B.; Avand, M.; Linh, N.T.T.; Vojtek, M.; Vojteková, J.; Lee, S.; Khoi, D.N.; Nhi, P.T.T.; Dung, T.D. Novel Hybrid Models between Bivariate Statistics, Artificial Neural Networks and Boosting Algorithms for Flood Susceptibility Assessment. J. Environ. Manag. 2020, 265, 110485. [Google Scholar] [CrossRef] [PubMed]
  102. Pham, B.T.; Jaafari, A.; Prakash, I.; Bui, D.T. A Novel Hybrid Intelligent Model of Support Vector Machines and the MultiBoost Ensemble for Landslide Susceptibility Modeling. Bull. Eng. Geol. Environ. 2019, 78, 2865–2886. [Google Scholar] [CrossRef]
  103. Nguyen, V.V.; Pham, B.T.; Vu, B.T.; Prakash, I.; Jha, S.; Shahabi, H.; Shirzadi, A.; Ba, D.N.; Kumar, R.; Chatterjee, J.M. Hybrid Machine Learning Approaches for Landslide Susceptibility Modeling. Forests 2019, 10, 157. [Google Scholar] [CrossRef]
  104. Peng, T.; Chen, Y.; Chen, W. Landslide Susceptibility Modeling Using Remote Sensing Data and Random SubSpace-Based Functional Tree Classifier. Remote Sens. 2022, 14, 4803. [Google Scholar] [CrossRef]
  105. Nhu, V.-H.; Shirzadi, A.; Shahabi, H.; Singh, S.K.; Al-Ansari, N.; Clague, J.J.; Jaafari, A.; Chen, W.; Miraki, S.; Dou, J. Shallow Landslide Susceptibility Mapping: A Comparison between Logistic Model Tree, Logistic Regression, Naïve Bayes Tree, Artificial Neural Network, and Support Vector Machine Algorithms. Int. J. Environ. Res. Public Health 2020, 17, 2749. [Google Scholar] [CrossRef]
  106. Ageenko, A.; Hansen, L.C.; Lyng, K.L.; Bodum, L.; Arsanjani, J.J. Landslide Susceptibility Mapping Using Machine Learning: A Danish Case Study. ISPRS Int. J. Geo-Inf. 2022, 11, 324. [Google Scholar] [CrossRef]
  107. Lee, C.; Lee, G.G. Information Gain and Divergence-Based Feature Selection for Machine Learning-Based Text Categorization. Inf. Process. Manag. 2006, 42, 155–165. [Google Scholar] [CrossRef]
  108. Ozcift, A.; Gulten, A. Classifier Ensemble Construction with Rotation Forest to Improve Medical Diagnosis Performance of Machine Learning Algorithms. Comput. Methods Programs Biomed. 2011, 104, 443–451. [Google Scholar] [CrossRef]
  109. Provost, F.; Hibert, C.; Malet, J. Automatic Classification of Endogenous Landslide Seismicity Using the Random Forest Supervised Classifier. Geophys. Res. Lett. 2017, 44, 113–120. [Google Scholar] [CrossRef]
  110. Nhu, V.-H.; Shirzadi, A.; Shahabi, H.; Chen, W.; Clague, J.J.; Geertsema, M.; Jaafari, A.; Avand, M.; Miraki, S.; Talebpour Asl, D. Shallow Landslide Susceptibility Mapping by Random Forest Base Classifier and Its Ensembles in a Semi-Arid Region of Iran. Forests 2020, 11, 421. [Google Scholar] [CrossRef]
  111. Dang, V.-H.; Dieu, T.B.; Tran, X.-L.; Hoang, N.-D. Enhancing the Accuracy of Rainfall-Induced Landslide Prediction along Mountain Roads with a GIS-Based Random Forest Classifier. Bull. Eng. Geol. Environ. 2019, 78, 2835–2849. [Google Scholar] [CrossRef]
  112. Aslam, B.; Maqsoom, A.; Khalil, U.; Ghorbanzadeh, O.; Blaschke, T.; Farooq, D.; Tufail, R.F.; Suhail, S.A.; Ghamisi, P. Evaluation of Different Landslide Susceptibility Models for a Local Scale in the Chitral District, Northern Pakistan. Sensors 2022, 22, 3107. [Google Scholar] [CrossRef] [PubMed]
  113. Abbas, F.; Zhang, F.; Abbas, F.; Ismail, M.; Iqbal, J.; Hussain, D.; Khan, G.; Alrefaei, A.F.; Albeshr, M.F. Landslide Susceptibility Mapping: Analysis of Different Feature Selection Techniques with Artificial Neural Network Tuned by Bayesian and Metaheuristic Algorithms. Remote Sens. 2023, 15, 4330. [Google Scholar] [CrossRef]
  114. Shahabi, H.; Hashim, M. Landslide Susceptibility Mapping Using GIS-Based Statistical Models and Remote Sensing Data in Tropical Environment. Sci. Rep. 2015, 5, 9899. [Google Scholar] [CrossRef]
  115. Ma, Z.; Mei, G.; Piccialli, F. Machine Learning for Landslides Prevention: A Survey. Neural Comput. Appl. 2021, 33, 10881–10907. [Google Scholar] [CrossRef]
  116. Rahmati, O.; Kornejady, A.; Samadi, M.; Deo, R.C.; Conoscenti, C.; Lombardo, L.; Dayal, K.; Taghizadeh-Mehrjardi, R.; Pourghasemi, H.R.; Kumar, S. PMT: New Analytical Framework for Automated Evaluation of Geo-Environmental Modelling Approaches. Sci. Total Environ. 2019, 664, 296–311. [Google Scholar] [CrossRef]
  117. Lombardo, L.; Opitz, T.; Ardizzone, F.; Guzzetti, F.; Huser, R. Space-Time Landslide Predictive Modelling. Earth-Sci. Rev. 2020, 209, 103318. [Google Scholar] [CrossRef]
  118. Hong, H.; Panahi, M.; Shirzadi, A.; Ma, T.; Liu, J.; Zhu, A.-X.; Chen, W.; Kougias, I.; Kazakis, N. Flood Susceptibility Assessment in Hengfeng Area Coupling Adaptive Neuro-Fuzzy Inference System with Genetic Algorithm and Differential Evolution. Sci. Total Environ. 2018, 621, 1124–1141. [Google Scholar] [CrossRef] [PubMed]
  119. Kalantar, B.; Pradhan, B.; Amir Naghibi, S.; Motevalli, A.; Mansor, S. Assessment of the Effects of Training Data Selection on the Landslide Susceptibility Mapping: A Comparison between Support Vector Machine (SVM), Logistic Regression (LR) and Artificial Neural Networks (ANN). Geomat. Nat. Hazards Risk 2018, 9, 49–69. [Google Scholar] [CrossRef]
  120. Kulsoom, I.; Hua, W.; Hussain, S.; Chen, Q.; Khan, G.; Shihao, D. SBAS-InSAR Based Validated Landslide Susceptibility Mapping along the Karakoram Highway: A Case Study of Gilgit-Baltistan, Pakistan. Sci. Rep. 2023, 13, 3344. [Google Scholar] [CrossRef] [PubMed]
  121. Shirzadi, A.; Soliamani, K.; Habibnejhad, M.; Kavian, A.; Chapi, K.; Shahabi, H.; Chen, W.; Khosravi, K.; Thai Pham, B.; Pradhan, B. Novel GIS Based Machine Learning Algorithms for Shallow Landslide Susceptibility Mapping. Sensors 2018, 18, 3777. [Google Scholar] [CrossRef] [PubMed]
Figure 1. Location map of the present research: (a) Pakistan, (b) Gilgit-Baltistan, (c) study area.
Remotesensing 16 00988 g001
Figure 2. (A) Study area and location map of Pakistan. (B) The regional geology of the study region was modified after [38].
Remotesensing 16 00988 g002
Figure 3. Flowchart of the current study.
Remotesensing 16 00988 g003
Figure 4. LCFs employed in the present research region: (a) slope, (b) distance to fault, (c) annual rainfall, (d) aspect, (e) curvature, (f) distance to road.
Remotesensing 16 00988 g004
Figure 5. LCFs employed in the present research region: (g) NDVI, (h) landcover, (i) geology, (j) elevation, (k) distance to river, (l) TWI.
Remotesensing 16 00988 g005
Figure 6. Variable importance heatmap using random forest classifier.
Remotesensing 16 00988 g006
Figure 7. ROC curve of baseline learning algorithms.
Remotesensing 16 00988 g007
Figure 8. ROC curve of ensemble learning algorithms.
Remotesensing 16 00988 g008
Figure 9. LSM of baseline algorithms: (a) KNN, (b) LR, (c) SVM.
Remotesensing 16 00988 g009
Figure 10. LSM of ensemble algorithms: (a) RF, (b) LGMB, (c) XGBoost, (d) AdaBoost, (e) CG, (f) Dagging.
Remotesensing 16 00988 g010
Figure 11. Susceptible area % for baseline algorithms.
Remotesensing 16 00988 g011
Figure 12. Susceptible area % for ensemble algorithms.
Remotesensing 16 00988 g012
Table 1. Geospatial data overview and sources.
S.NOParametersData OriginsComprehensive Details
1Elevation
Slope
Aspect
Curvature
TWI
Distance to River
DEM
12.5 m
https://search.asf.alaska.edu/#/, accessed on 29 June 2023
2LULCSentinel-2 images 10 mhttps://earthexplorer.usgs.gov/#/, accessed on 30 August 2023
3Lithology
Distance to Road
Distance to Fault
Geological map scale: 1:650,000Geological Map of Pakistan (Searle & Khan 1996) [57]
4RainfallGIOVANNIhttps://gpm.nasa.gov/data/sources/giovanni#/, accessed on 19 September 2023
Table 2. CFS ranking variables.
AttributeAverage Merit (AM)Average Rank (AR)Rank Error (AR)
Slope29.9210.0
Elevation24.8220.0
Aspect17.6130.0
Annual Rainfall14.8540.0
Distance to Fault11.3250.0
LULC6.0860.0
TWI5.16470.0
Distance to Road5.14180.0
NDVI5.13990.0
Geology4.291100.0
Curvature0.141110.0
Distance to Stream0.218120.0
Table 3. Evaluation outcomes for baseline algorithms.
Testing Set
KNNSVMLR
ACC0.8960.9100.912
AUC0.7500.7340.784
K0.4090.3590.394
Table 4. Evaluation outcomes for ensemble algorithms.
Testing Set
RFLGBMXGBoostAdaBoostDaggingCG
ACC0.9140.9250.9270.8980.9160.923
AUC0.9090.9070.9100.8700.8430.863
K0.4810.5790.6200.4450.5250.530
Disclaimer/Publisher’s Note: The statements, opinions and data contained in all publications are solely those of the individual author(s) and contributor(s) and not of MDPI and/or the editor(s). MDPI and/or the editor(s) disclaim responsibility for any injury to people or property resulting from any ideas, methods, instructions or products referred to in the content.

