

Drought Dynamics in the Nile River Basin: Meteorological, Agricultural, and Groundwater Drought Propagation


1
Geospatial Information Science (GIS) Department, Wondo Genet Forestry and Natural Resources, Hawassa University, Hawassa P.O. Box 5, Ethiopia
2
Faculty of Geosciences and Environmental Engineering, Southwest Jiaotong University, Chengdu 611756, China
3
State-Province Joint Engineering Laboratory of Spatial Information Technology for High-Speed Railway Safety, Chengdu 610031, China
4
Institute of Environment, Department of Earth and Environment, AHC-5-390, Florida International University, Miami, FL 33199, USA
*
Author to whom correspondence should be addressed.
Remote Sens. 2024, 16(5), 919; https://doi.org/10.3390/rs16050919
Submission received: 16 January 2024
/
Revised: 21 February 2024
/
Accepted: 5 March 2024
/
Published: 6 March 2024
(This article belongs to the Special Issue Monitoring Ecohydrology with Remote Sensing)
Abstract
:The Nile River Basin (NRB) has experienced a notable rise in drought episodes in recent decades. The propagation of meteorological, agricultural, and groundwater drought dynamics in the NRB was investigated in this study. The following drought indices examined the correlation and propagation among meteorological, agricultural, and groundwater droughts. These are the standardized precipitation evapotranspiration index (SPEI), soil moisture index, Gravity Recovery and Climate Experiment, and GRACE Follow-On (GRACE/GRACE-FO)-derived groundwater drought index (GGDI). These droughts were comprehensively evaluated in the NRB from 2003 to 2022. The cross-wavelet transform approach highlighted the links between droughts. The following are the key findings: (1) In the NRB, the cross-wavelet energy spectrum of wavelet coherence can indicate the internal connection between meteorological versus (vs.) agricultural and agricultural versus (vs.) groundwater drought. The time scale with the most significant correlation coefficient is the drought propagation time. (2) The El Niño–Southern Oscillation (ENSO) correlated with agricultural and groundwater drought much more than the Indian Ocean Dipole (IOD), demonstrating that ENSO has an important impact on drought advancement. (3) The R2 values were 0.68 for GGDI vs. standardized soil moisture index (SSI), 0.71 for Blue Nile Region (BNR) GGDI vs. SSI, and 0.55 for SSI vs. Standardized Precipitation Evapotranspiration Index (SPEI). Similarly, in the Lake Victoria Region (LVR), GGDI vs. SSI was 0.51 and SSI vs. SPEI was 0.55, but in the Bahr-el-Ghazal Region (BER), GGDI vs. SSI was 0.61 and SSI vs. SPEI was 0.27 during the whole research period with varied lag durations ranging from 1 to 6 months. Thus, the propagation of drought (i.e., meteorological, agricultural, and groundwater drought) dynamics has the potential to reshape our understanding of drought evolution, which could lead to early drought forecasting across the NRB and similar climatic regions.

1. Introduction
Drought is a complex, recurring, and extreme climatic condition characterized by below-normal precipitation for weeks to years, causing negative impacts on life on Earth. Droughts are divided into four types: meteorological, agricultural, hydrological (i.e., groundwater drought), and socioeconomic [1]. Meteorological drought is caused by below-normal rainfall for months to years. In contrast, agricultural drought [2] is caused by a lack of soil moisture to sustain crop production [3,4], resulting in crop yield decrease or failure. According to Van Loon et al. [5], hydrological drought occurs when the total water storage in water bodies (e.g., rivers, lakes, reservoirs, or aquifers) falls below normal levels for an extended period of time.
Furthermore, when more groundwater is exploited owing to natural climate change or human-induced factors, groundwater drought can occur through a reduction in groundwater storage [6]. These droughts are linked by interlinkage within the water cycle [3] and by climate change [7], which causes hydrological cycle changes [5,8,9]. Thus, understanding the propagation of these droughts (i.e., meteorological, agricultural drought, and groundwater droughts) and their occurrence under drought conditions is crucial to understanding the driving factors of propagation time.
Drought-related conditions affect the Nile River Basin, which is a vital water source for eleven countries in northeastern Africa. It is crucial for sustainable water resource management to comprehend the dynamics of drought in this area. NRB has been severely affected by drought catastrophes. For example [4], droughts in Ethiopia and Sudan between 1985 and 1986 affected 450,000 lives in 2008 and 2010, and more than 13 million people faced tragedy; the worst drought occurred in 2010–2011, leading to significant food insecurity and famine.
Meteorological droughts that cause hydrological droughts spread across the hydrological system and impact the terrestrial parts of the water cycle. Changes in drought indicators, such as attenuation, lag time, and lengthening, are a part of drought propagation and are impacted by basins’ hydrogeological, geomorphological, and climatic factors [10]. Since precipitation serves as the primary water source for streams and soil, prolonged droughts are more likely to cause agricultural and hydrological droughts [11]. The time interval that separates the beginning, peak, and termination of various types of drought—from hydrological to meteorological to soil moisture—is referred to as the lag time. Improving water resource management once a drought occurs requires understanding the influence of regulating variables on drought propagation.
These complex hydrologic processes can essentially be revealed by cross-correlation analysis [12], especially in hydrologic series with non-stationary features over multi-temporal scales. Conventional techniques, including ergodic and linear series, have drawbacks and are unable to identify cross-correlations at particular scales. When examining cross-correlations across hydrologic variables, wavelet cross-correlation analysis techniques (WCCs) work better [12]. WCC techniques have a broad potential range of applications in hydrologic series cross-correlations at many temporal scales, which can be found using the WCC approach.
Furthermore, these complex hydrologic processes are linked with major natural phenomena [10], such as the El Niño Southern Oscillation and Pacific Decadal Oscillation [13], that affect local climate, soil moisture storage and groundwater recharge. Meteorological droughts propagate more slowly in groundwater systems due to teleconnection effects, which can have an indirect impact on regional precipitation. Forecasting and assessing regional drought episodes ahead of time requires an understanding of how these elements affect the propagation of drought.
Several studies using various approaches have analyzed groundwater drought and its relationship with precipitation and teleconnection [14,15,16,17] at global and regional scales. Among these, globally, Liu et al. [11] studied worldwide reach; although it could oversimplify local details and geographical variation, worldwide research investigates drought dynamics in several regional contexts. Hence, more data accessibility, methodological improvements, and a variety of approaches are needed to strengthen the findings’ robustness. Furthermore, understanding climatic conditions is crucial for effective drought warning and prevention. Zhang et al. [18] examined the propagation relationship between three types of droughts in the Yangtze and Yellow River basins with a focus on the correlation and quantification of droughts from 2002 to 2020.
Similarly, several researchers [10,11,12,13] found that extreme climate change has increased the frequency and severity of drought occurrences and that groundwater responds to meteorological drought more slowly. Furthermore, some researchers [19,20] have focused on meteorological to hydrological drought propagation. However, in drought propagation, the water cycle is not restricted to climatic or hydrological circumstances. Thus, investigating the dynamic propagation of meteorological versus (vs.) agricultural and agricultural vs. groundwater drought is critical for establishing efficient monitoring and early warning systems for the dynamic propagation of drought in the NRB.
To the best of our knowledge, the propagation and linkage of meteorological, agricultural, and groundwater droughts in the Nile River Basin has not been thoroughly researched. Moreover, no research has been conducted to analyze the correlation and propagation distinction between these two factors. Thus, this study will plug this gap by exploring the propagation and correlation among the three types of droughts. This study had two specific goals: (1) to understand the dynamic propagation of meteorological vs. agricultural and agricultural vs. groundwater drought and (2) to investigate the possible effect of teleconnections on drought propagation time and dynamics.
2. Methodology
2.1. Study Area Description
The NRB is the world’s longest drainage basin, stretching over 6700 km and encompassing 11 nations (Figure 1) and over 400 million people. The basin is divided into four distinct regions based on the hydroclimatic conditions and previous studies [8]: the Blue Nile Region (BNR), the Lake Victoria Region (LVR), the Bahr-el-Ghazal Region (BER), and the Main Nile Region (MNR). The population of NRBs is expected to reach 700 million by 2030, prompting issues about fair resource usage [21] and the sustainable management of basin water resources. Sub-basins of the NRB provide significant geographic coverage for identifying changes in terrestrial water storage. In this study, the term sub-basins is used equivalently to denote the NRB’s four regions.
Ethiopia receives the most annual rainfall (RF) in the NRB [8], with 2292 mm/year, during its two rainy seasons. Egypt and Sudan have the greatest annual mean surface temperature (27–31 °C), while air temperatures vary both geographically and chronologically. Savana woods are mainly found in countries where rainfed agriculture is prevalent, such as Ethiopia, Uganda, Burundi, Congo, Kenya, Rwanda, and Tanzania. Both Ethiopia and Sudan have notable variations in yearly precipitation; Ethiopia has the greatest mean precipitation of 803–1581 mm/year and a rainy season that lasts from mid-June to September. Conversely, Sudan has moderate to high levels of precipitation and is mostly characterized by deserts and dryness.
The mean annual RF is consistent with the temporal fluctuation and amount of annual evapotranspiration (ET) over the Nile River Basin. Seasonal variations in ET and its constituents cause them to peak during the rainy season and to minimize during the dry one. Vegetation species assimilation across climatic areas influences the ET climatology in the region. From 1980 to 2014, trend analysis reveals a declining trend of 18.8 mm/year with marginal rises in ET trends in dry and semi-arid zones. Savannas and forests are prime locations for reducing ET.
Groundwater change and abstraction for irrigation (i.e., human-induced activity) play an important role in drought occurrence and impact in NRB countries [22]. For example, Sudan and Egypt rely heavily on groundwater abstraction for industrial, municipal, and agricultural uses. The rest of the NRB countries rely, to a limited extent, on groundwater abstraction for agricultural purposes. Drought affects the sustainable management of groundwater resources, which is critical in the NRB countries to ensure water security, especially in the face of increasing water demand, population growth, and climate change impacts.
2.2. Data
The Global Land Data Assimilation System (GLDAS) and “Gravity Recovery and Climate Experiment and GRACE Follow-On” (GRACE/GRACE-FO)-derived groundwater storage were among the datasets utilized in this study. Rainfall (RF), temperature (Temp), soil moisture (SM), and evapotranspiration (ET) are all driven by GLDAS and other hydrological datasets (see details in Table 1).
Groundwater Storage (GWS) Data
Groundwater storage (GWS) drought indicator data are produced using terrestrial water storage observations derived from the GRACE/GRACE-FO observations and a land surface modeling and data assimilation (GLDAS) framework with a spatial resolution of 0.25° × 0.25°. For data assimilation, GRACE/GRACE-FO observations are integrated with ground- and space-based meteorological measurements into a sophisticated numerical hydrological model to produce high-resolution, spatially and temporally continuous data. GRACE-Data Assimilation for Drought Monitoring (GRACE-DA-DM) data products are archived and disseminated by the Goddard Space Flight Center (GSFC).
2.3. Tri-Collocation Analysis (TCA) Using SM Data
For soil moisture, this study used “Global Land Data Assimilation System versions 2 and 2.1” (GLDAS-NOAH M2.0 & M2.1), “European Centre for Medium-Range-Weather-Forecasts (ECMWF) Reanalysis” (ERA5-Land), and “Modern Era Retrospective-analysis for Research and Applications” (MERRA-2) as detailed in Table 1. To obtain trustworthy soil moisture estimations [23] throughout the NRB, the three independent data sources were integrated using Tri-Collocation Analysis (TCA).
Optimal land surface states and atmospheric fields are produced using GLDAS, which is an offline terrestrial modeling system with global coverage and high resolution (1° × 1°) that combines satellite and ground-based data [24]. In order to estimate TCA using the hydrological model data indicated above, this study obtained the monthly soil moisture (0 to 2 m depth) products from GLDAS (version 2.1) for the years 1980 to 2022.
The TCA is used over the NRB to integrate SM data from the GLDAS [25], MERRA-2 [26], and ERA5-Land [27] models. In the absence of ground reference data, TCA provides an alternate method for measuring random error variances and reliably calculates changes in soil moisture [22,23]. The process to compute TCA involves four steps [28,29]: (1) scaling each soil moisture dataset to the primary reference set; (2) utilizing pairwise multiplication to calculate the error variance; (3) estimating the relevant weights; and (4) combining the datasets.
2.4. Drought Indices Computation
Technical methods and comprehensive TCA descriptions were provided by Nigatu et al. [8] and [30]. The standardized soil moisture index (SSI) was estimated by computing the soil moisture data using the TCA technique.
GRACE groundwater drought index (GGDI): In this study, a monthly climatology () computed is based on (Equation (1)) that accounts for seasonality in the groundwater records. We adopted the GRACE groundwater drought index (GGDI) from Wang et al. [31] to examine the characteristics associated with groundwater drought in this work.
where is the month number and i = 1, 2, 3, …, 12; is the groundwater storage anomaly for a month i.
Subtracting the computed monthly climatology () from the mean groundwater storage anomaly in the basin produces the groundwater storage deviation (GSD), which represents the net deviation of groundwater storage and is based on the suggestion of Thomas et al. [32]. Lastly, the standard deviation ( was divided by the mean ( to normalize the GSD. The groundwater drought index () is used to represent the drought condition and is determined by normalizing the net deviation of groundwater storage volumes.
Standardized Soil Moisture Index (SSI): Soil moisture is an important factor in agricultural drought (SSI), as indicated by Hao et al. [33]. By employing the Standardized Drought Analysis Toolbox (SDAT), a lognormal distribution function is used for the computation of SSI, which is a drought index. Different hydrological variables, such as soil moisture, precipitation, and relative humidity, might be measured using the nonparametric SDAT framework [34].
Standardized Precipitation Evapotranspiration Index (SPEI): In order to assess meteorological drought, this study employed SPEI monthly gridded data at 0.5° spatial resolution that was obtained from https://spei.csic.es/map/maps.html for January 1950 to December 2022. Generally, the SPEI of one month indicates a meteorological drought [35].
The meteorological, agricultural, and groundwater drought indices were utilized to evaluate the correlation and propagation among drought categories. Similarly, to understand the climate teleconnections [36,37] with the NRB’s drought events [38], we conducted a detailed analysis using recommended teleconnections [38,39] SSTs, such as the El Niño–Southern Oscillation (i.e., Nino 3.4 ENSO Index) and Indian Ocean Dipole (i.e., IOD index).
2.5. Cross-Wavelet Transform (CWT) Technique
The phase relationship of signals in time–frequency space and the connections between two signals could potentially be found using the cross-wavelet transform approach [31,40]. The cross-wavelet transform technique, which is based on wavelet analysis theory, could be used to examine the frequency and time domain co-relationships between two non-stationary signals. In order to investigate the dynamic links between groundwater and agricultural drought with teleconnection elements in the NRB, this study used the cross-wavelet transform approach. The following equation expresses the hypothetical distribution of the cross-wavelet power of two-time series (i.e., x and y) with their respective background power spectra and :
where is a “probability distribution function’s confidence level” associated with probability p.
A novel multiscale time–frequency and multi-signal analysis methodology, the cross-wavelet transform method, was created based on the conventional wavelet transformation [14,30]. In both the time and frequency domains, the CWT is capable of effectively analyzing correlations and reflecting the phase structure between two time series. The correlation between two sequences in the high-energy domain may be measured using the cross-wavelet transform. However, for the analysis of the low-energy spectrum in time–frequency space, this technique is not sufficient. On the other hand, the connection between two low-energy spectrum sequences may be more clearly seen when using wavelet coherence (WTC) [19].
Thus, the WTC of the monthly data revealed the relationships between meteorological, agricultural, and hydrological drought in the NRB during the study period. The complete procedures of the WTC can be found in Grinsted et al. [40]. To avoid the wavelet transform’s boundary effect [41] and high-frequency false information, the thin gray solid line in the WTC figure is the cone of influence (COI) boundary per its effective spectral area.
3. Results
3.1. Pattern of Hydrological Drought and SST in NRB
Numerous drought occurrences, especially in the 1980s, were noted in the NRB drought history. To give some examples, consider the extreme drought years of 1984/1985, 2005/2006, 2010/2011, and 2014/2015 (Figure 2). Nigatu et al. [38] report that in 1985, the NRB was severely affected by drought with the exception of the northern BNR (summer and fall) and the southwestern LVR (winter and fall). Correspondingly, the NRB’s central regions experienced drought in 2005–2006 especially in the spring and fall. The NRB countries [38], which include the whole of Kenya, Ethiopia, and some parts of Uganda, were severely hit by the 2010–2011 drought because of a prolonged decrease in rainfall during the springtime.
According to some climate studies [42], temperatures in NRB countries have risen by more than 1 °C and 1.5 °C, respectively, resulting in 1.5 °C and 2 °C of warming. Furthermore, supporting the importance of temperature in the research region, the same study found that NRB nations warm more quickly than the world average. Similar to this, Touma et al. [43] state that the changes in drought characteristics corresponding to the SPEI are more substantial than those corresponding to the SPI and have bigger consequences for meteorological and agricultural drought development owing to the more significant influence of temperature changes.
In order for groundwater drought to extend from meteorological drought, it needs to initially lag behind and penetrate the soil layer, which is why it is linked to agricultural drought. As observed in Figure 2, the GGDI was able to highlight six groundwater droughts in the years 2004–2006, 2009–2010, 2012, 2015, 2017–2018, and 2019. The droughts varied in length and severity. In the NRB, these are the years of drought. Drought in the weather always precedes drought in the groundwater. A significant drought is more likely to result from the SPI’s ongoing decrease. However, during the drought seasons of 2004–2006 and 2009–2010, there were some instances of extremely severe and protracted groundwater droughts.
Groundwater drought frequency increased, and its duration persisted in the NRB even after 2010, when there was an average SM anomaly (Figure 2a) that was possibly connected with meteorological drought-increased intensity. There are several factors influencing precipitation that contribute to groundwater drought [44]. In addition, temperature, evapotranspiration (ET), and human activity (such as abstractions) all influence it. In a similar vein, groundwater droughts typically spread quicker, responding to meteorological droughts or agricultural droughts.
3.2. Implications of the Altered Water Cycle on the Propagation of Drought
The precipitation that falls as rainfall can either move horizontally—runoff—or vertically—evaporating in the sky or penetrating the soil to form soil moisture—before replenishing groundwater and groundwater aquifers [45]. The reason for the stronger correlation between soil moisture anomalies and rainfall rather than groundwater storage change in the basin might also be attributed to this lag in response.
It is anticipated that as a result of global warming, the land-based hydrological cycle will become more intense with an increase in water vapor feedback [46], changing the behavior of climatic extremes as well as RF, SM, Temp, and ET. As indicated in Figure 3a, ET exhibited a consistent pattern with RF. Particularly during the NRB drought years (1984/1985, 2005/2006, 2010/2011, 2015, 2017–2018, and 2019), both RF and ET showed decreasing tendencies. The temperature has a comparatively increasing pattern in the entire time series during the study period (Figure 3a) with higher temperature anomaly records occurring during drought periods. Particularly, after 1985, the temperature anomaly was above normal, which coincided with decreasing RF and ET anomaly (Figure 3b). Flash droughts intensified during the warming phase as a result of higher soil moisture drying trends and rapid ET, which offset the declining temperature [47]. It resulted in more severe drought events that tended to occur during this period.
In addition, the basin’s water cycle and the ability of the climatic circumstances to react quickly to groundwater dryness are exacerbated by the rise in extremely hot temperature events and the decline in extremely low-temperature events [27,48]. A noteworthy development after 1985 was the rise in precipitation, which in turn caused an increase in the ET rate (Figure 3b). This increased humidity year-round and, coupled with high temperatures, increased the likelihood of heat waves [49]. Drought has generally spread more quickly as a result of heat waves, flash droughts, and increased water cycle intensity brought on by global warming.
3.3. Links between Teleconnection Factors and the Dynamics of Drought
This study examined the dynamic links between teleconnection elements and drought (i.e., meteorological, groundwater, and agricultural drought) using bivariate wavelet coherence. Not just the direct effects of human activity and climate change but also the indirect effects of teleconnection [41] variables are linked to drought [9,15]. As a result, the NRB’s groundwater and agricultural drought were exposed to the impacts of teleconnection variables, such as ENSO and IDO, via the cross-wavelet transform approach (Figure 4). An arrow, with a negative correlation pointing left and positive affiliations going right, is used to represent the relative phase relationship. The left-to-right arrows show that the hydrological drought coincided with the shift in teleconnections (ENSO). The negative phase is shown by the right-to-left arrows. The drought that occurs behind or ahead of the 1/4 cycle’s climatic index is shown by the vertically upward or downward arrows, respectively, demonstrating a nonlinear association.
Figure 4, Figure 5 and Figure 6 show a thick contour representing a 95% confidence level against red noise with arrows indicating the relative phase connection (i.e., negative correlations pointing left and positive affiliations pointing right). The correlation based on wavelet energy is indicated by the color bar labeled on the right. Grinsted et al. [40] explain that in wavelet analysis, the color of a cross-wavelet plot usually indicates the intensity or degree of the covariance between two signals at various frequencies and time scales. Regions of high color intensity or brightness in the cross-wavelet plot indicate a high degree of covariance between two signals that are comparable in phase and frequency. On the other hand, low covariance or different signals result in low color intensity or a less colorful plot.
Warmer colors, such as red, orange, and yellow, imply stronger covariance or correlation between the signals, whereas cooler colors, such as blue and green, indicate lower covariance or correlation. The color scale commonly follows this practice in cross-wavelet plots. Generally, regions of strong correlation or covariance between signals across several frequencies and time scales may be visually identified using a cross-wavelet plot’s color scheme.
Regarding the black outlines, they are frequently employed to indicate statistically significant coherence zones. These contours show areas where, usually based on statistical testing, the coherence between the two signals is considered significant at a given confidence level. This makes it easier to spot places where the coherence is probably not the result of random chance but rather shows a significant correlation between the signals under study.
To summarize, wavelet coherence analysis uses a color scale to signify the intensity of coherence between signals, and black outlines, which denote statistically significant coherence at a specific confidence level, aid in the differentiation of meaningful coherence patterns from random fluctuations.
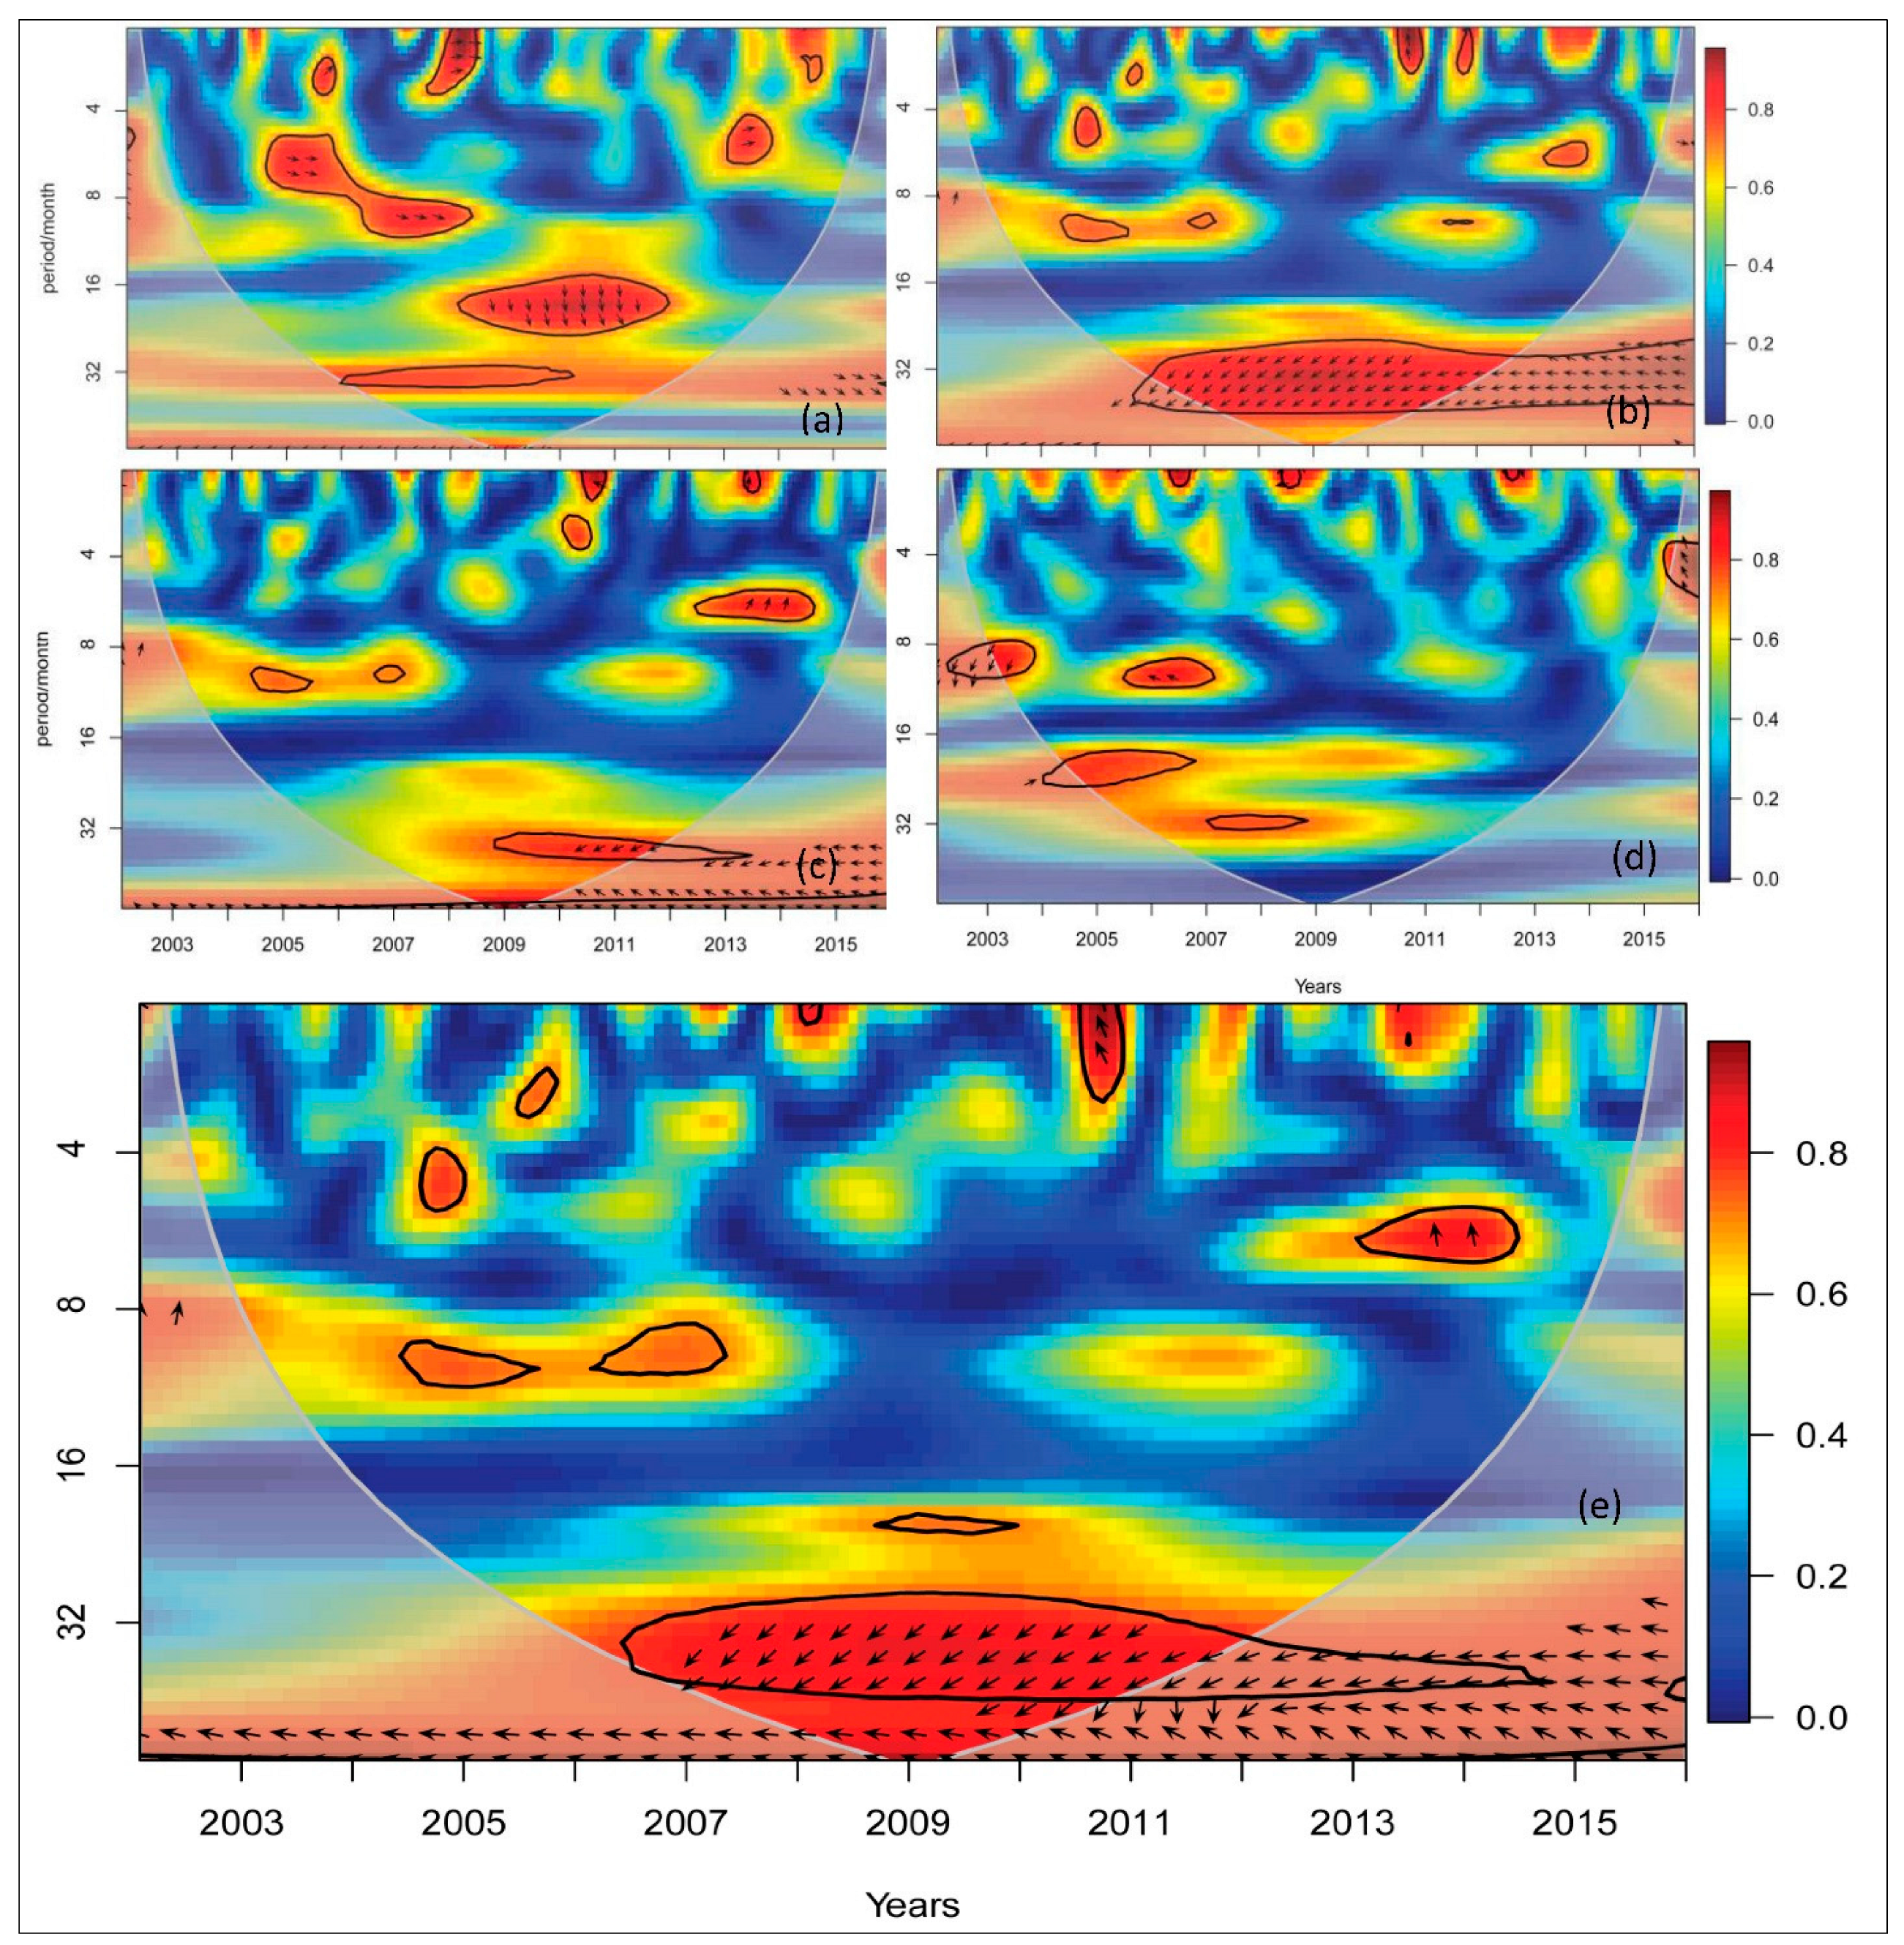
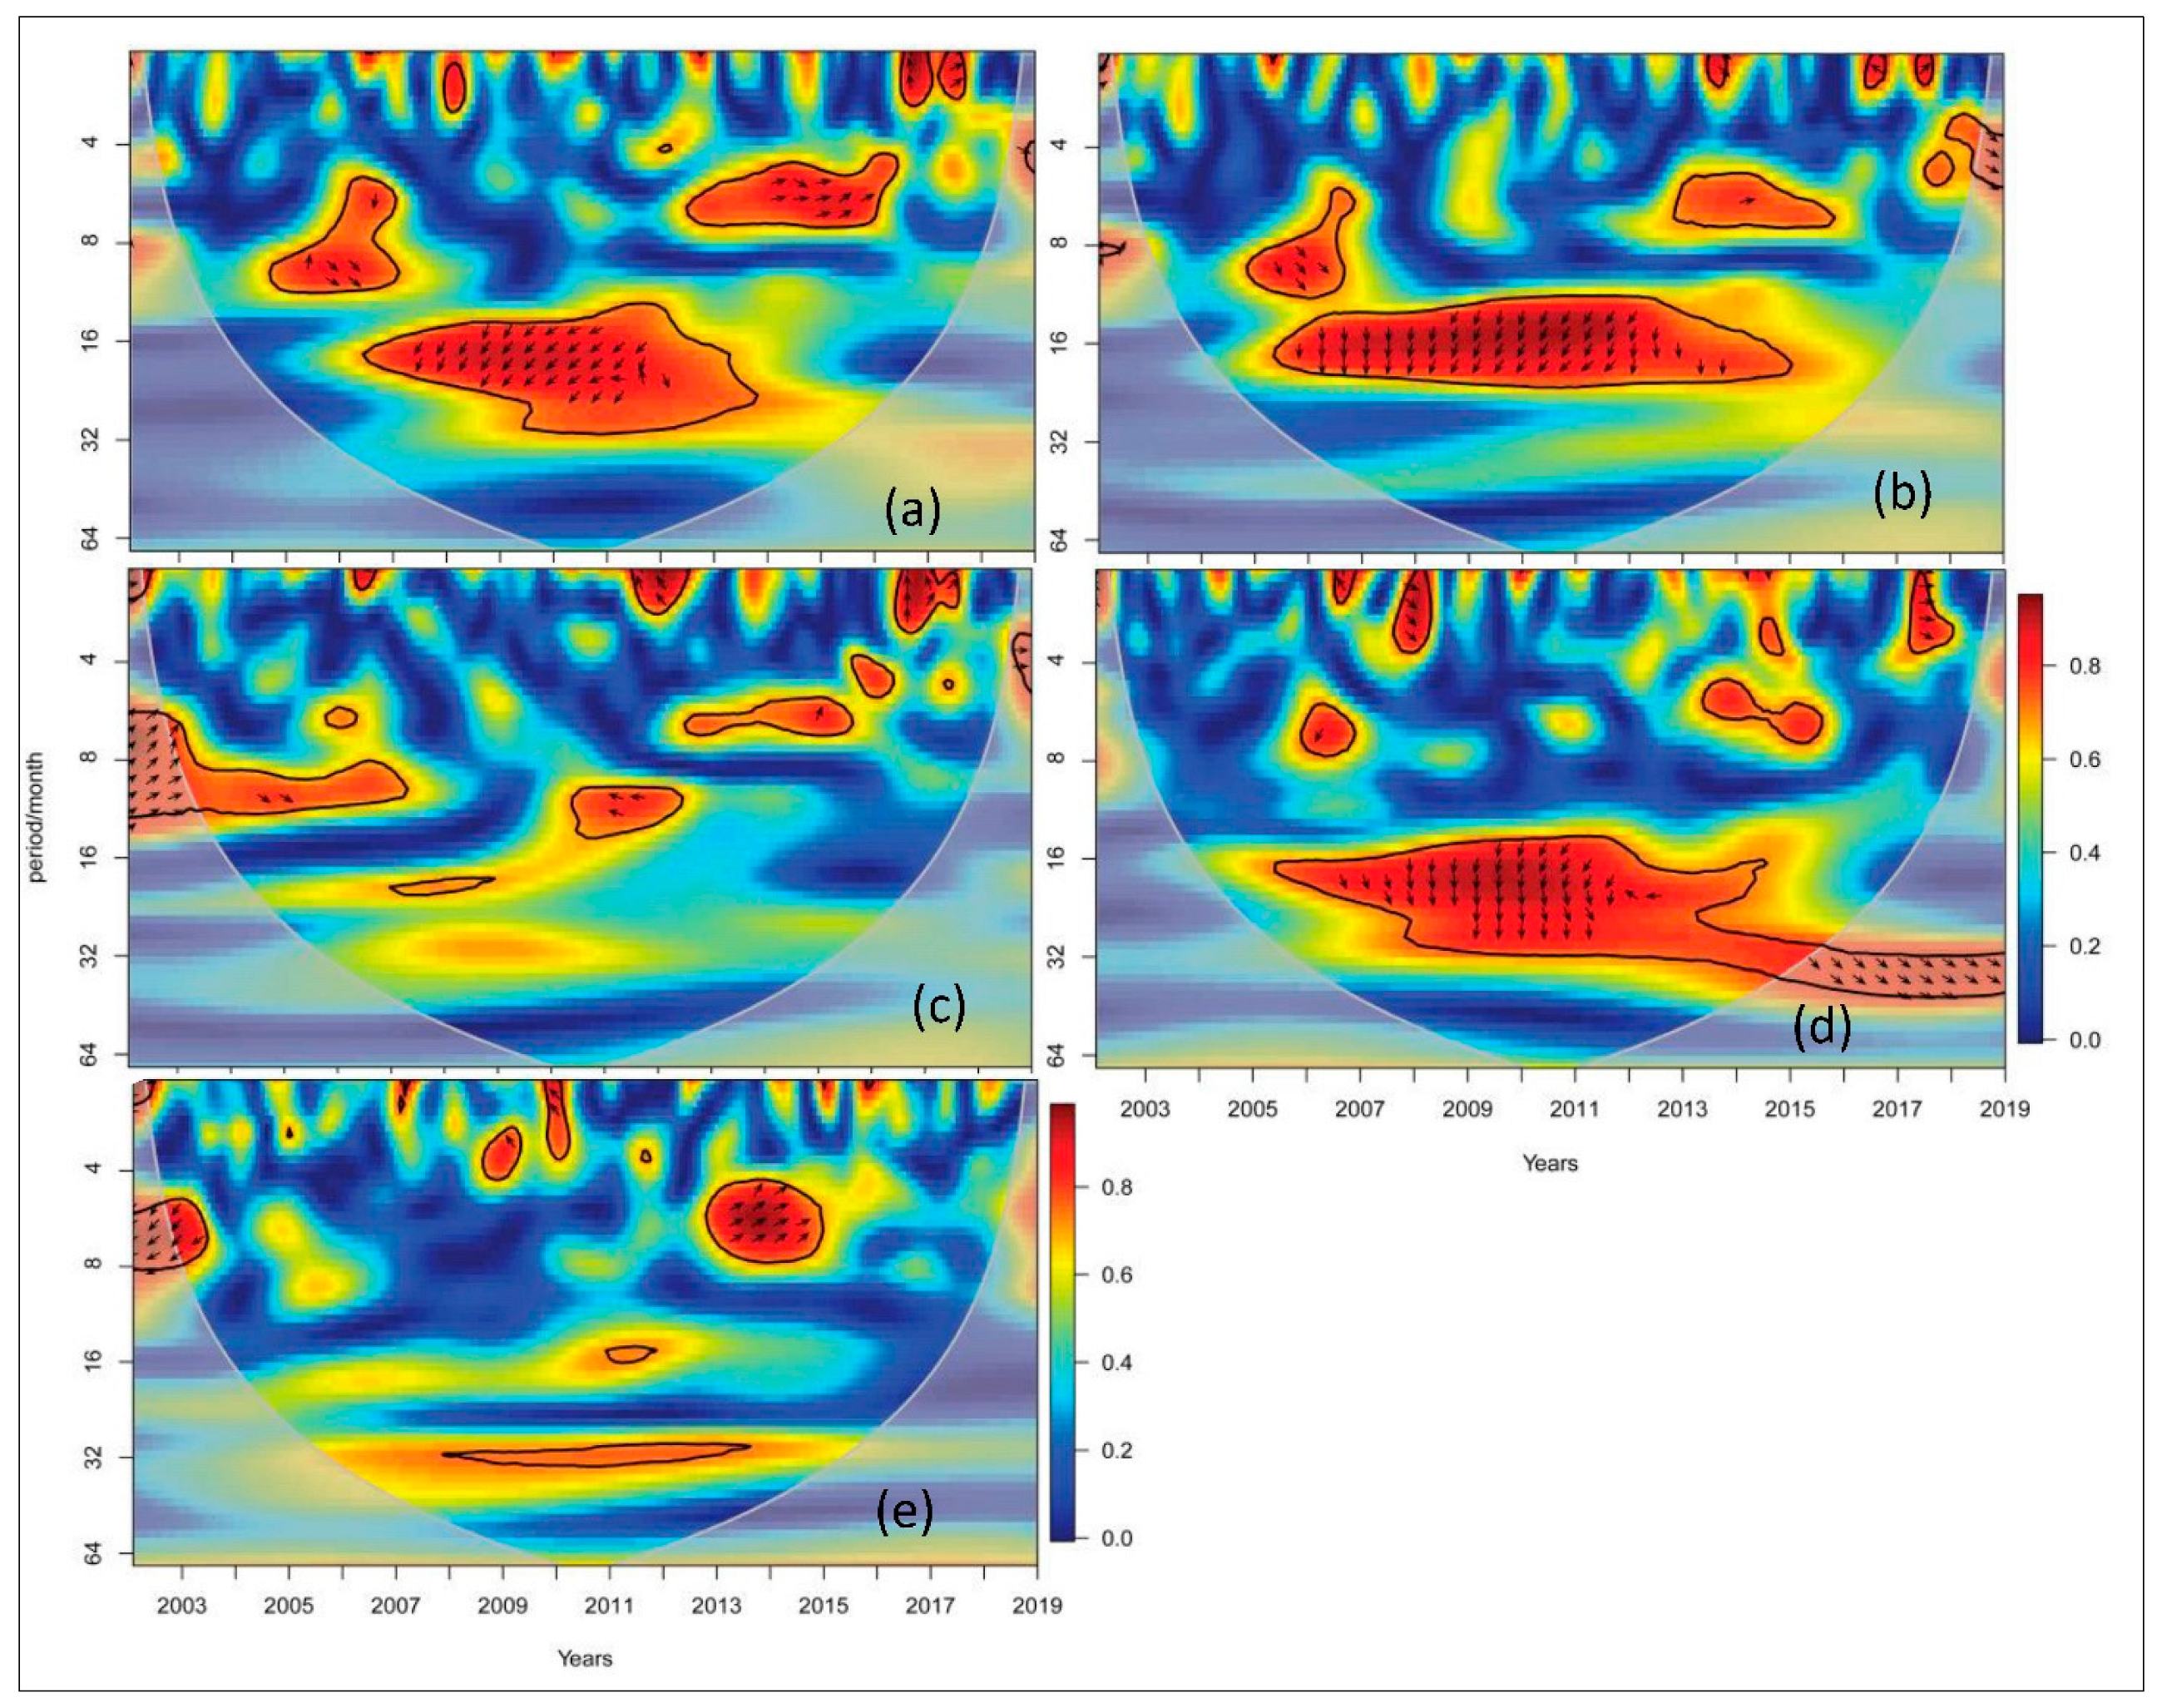
In the NRB, four significant resonance periods can be observed between the GGDI and ENSO: 5–12 months in 2004–2006, 5–7 months in 2013–2016, a very short period in 2017–2018 with positive correlations, and 15–31 months in 2007–2013 with negative correlations (Figure 4a). Similarly, in the LVR, four significant resonance periods were noted: 1–3 months in 2007, 5–8 months in 2013–2016, and 15–32 months in the very long period 2005–2019, with GGDI drought ahead of ENSO and 2–6 months in 2017–2019 with positive correlations (Figure 4b). As indicated in Figure 4a,b,d, arrows in between negative and positive correlation indicate that the signals are correlated. Still, with a delay, which the arrow’s angles can calculate, there is a large pattern from 16 to 32 months. The arrows there point downwards, close to −90 degrees, or 1/4 of a cycle of 360. Considering the average time scale of 20 months in that range, the arrows angle would convert to 1/4 of 20 months, or 5 months. It means that there is a delay of 5 months between ENSO and GDI, highlighting that ENSO affects GGDI and not the opposite (negative GGDI occurring before ENSO). If we assume that ENSO affects GGDI inversely and with a delay, then it could be said that El Nino (+) leads to negative GGDI 5 months in the future and that La Nina (−) causes positive GGDI 5 months after.
Furthermore, as shown in Figure 4c, GGDI drought occurred before ENSO events 6–13 months in 2005–2006 and 15–24 months in 2005–2015, revealing a positive correlation of 5–7 months in 2013–2015 in the BNR. The arid and hyperarid/desert dominant sub-basins (i.e., BER and MNR) exhibit low coherence with one or two significant resonances for a short period, as indicated in Figure 4d,e. This low coherence reveals that groundwater depletion is mostly associated with groundwater withdrawal for irrigation/other uses.
Therefore, the dynamic linkages between groundwater drought and teleconnection elements in the NRB may be efficiently shown by the cross-wavelet transform. Groundwater drought and ENSO have a statistically significant association, suggesting that ENSO occurrences are crucial to the development of drought. When it comes to groundwater dryness in the NRB across the Indian Ocean Dipole (IOD), the ENSO generally has the most impact.
3.4. Soil Moisture Anomaly and ENSO
The arrows in Figure 4 indicate the relative phase connection: that is, relationships that are negative are pointing left, and positive correlations are heading right. Like the GW, the ENSO affects the NRB and sub-basin SM, as seen in Figure 5. Three major resonance intervals between the SMI and ENSO are found in the NRB: 1–3 months from 2011 to 2012, 1–3 months from 2013 to 2014, and 28–36 months from 2006 to 2011 with negative correlations; these times are linked to the La Nina (Figure 5e).
Similarly, in the LVR (Figure 5a), four significant resonance periods were noted, which were 6–12 months in 2004–2007 and 1–3 months in 2007–2008 with positive correlations and a 15–24 month very long period in 2007–2012 with SM drought ahead of ENSO and 4–6 months in 2013–2014 with positive correlations. As indicated in Figure 5b, BNR SM drought exhibited a negative correlation of 24–36 months in 2005–2012 and 1–3 months ahead of ENSO in 2010–2011. The BER and MNR arid/hyperarid and desert dominant sub-basins exhibited low coherence with one or two significant resonances for a short period, as indicated in Figure 5c,d. This low coherence reveals that SM depletion is mostly associated with surface water withdrawal for irrigation and high evaporation loss from different LULCs.
Figure 5.
Monthly soil moisture anomaly and ENSO bivariate wavelet coherence in the LVR (a), BNR (b), BER (c), MNR (d), and NRB (e).
Figure 5.
Monthly soil moisture anomaly and ENSO bivariate wavelet coherence in the LVR (a), BNR (b), BER (c), MNR (d), and NRB (e).
The phenomenon known as El Niño Southern Oscillation (ENSO) occurs when the eastern Pacific Ocean, which is colder in the equatorial region, heats up every two to seven years [37]. Seven of the nine driest years in the BNR between 1960 and 2003 took place during El Niño years (1994, 1983, 1972, 1982, 1987, 1990, and 2003), which included the strong El Niño years and the 1988–1989 Ethiopian famine, which coincided with the strong El Niño of 1988 [37].
In Figure 5, thick contour represents a 95% confidence level against red noise with arrows indicating the relative phase connection (i.e., negative correlations pointing left and positive affiliations pointing right). Similarly, the arrows point downwards, close to −90 degrees, or 1/4 of a cycle of 360. For example, the average time scale of 16 months in that range, the arrows (Figure 5a) angle would convert to 1/4 of 16 months, or 4 months.
3.5. Relationships between the Three Drought Stages
Using the cross-wavelet energy spectrum (CWES) of monthly SSI vs. SPEI sequences and SSI vs. GGDI, the correlations between agricultural versus meteorological and agricultural vs. groundwater drought were examined (Figure 6) in the NRB and at the sub-basin level. Figure 6a–h shows that there were five significant resonance periods between the SSI and SPEI at the basin scale in the NRB. A 6–10 month signal (2003–2006) demonstrated phase angle relationships in which the SSI was positively correlated with the SPEI and lagged behind the SPEI, indicating a meteorological drought developing into an agricultural drought. In contrast, a twenty to thirty-month signal (2003–2009) showed that the SPEI led the SSI with a positive correlation.
Figure 6.
CWT of meteorological (SPEI) vs. agricultural (SSI) and agricultural (SSI) vs. hydrological (GGDI) drought in the NRB and sub-basins: (a) SPEI vs. SSI in the NRB, (b) SSI vs. GGDI in the NRB, (c) SPEI vs. SSI in the BNR, (d) SSI vs. GGDI in the BER, and (e) SPEI vs. SSI in LVR, (f) SSI vs. GGDI in LVR, (g) SPEI vs. SSI in BER, (h) SSI vs. GGDI in BER.
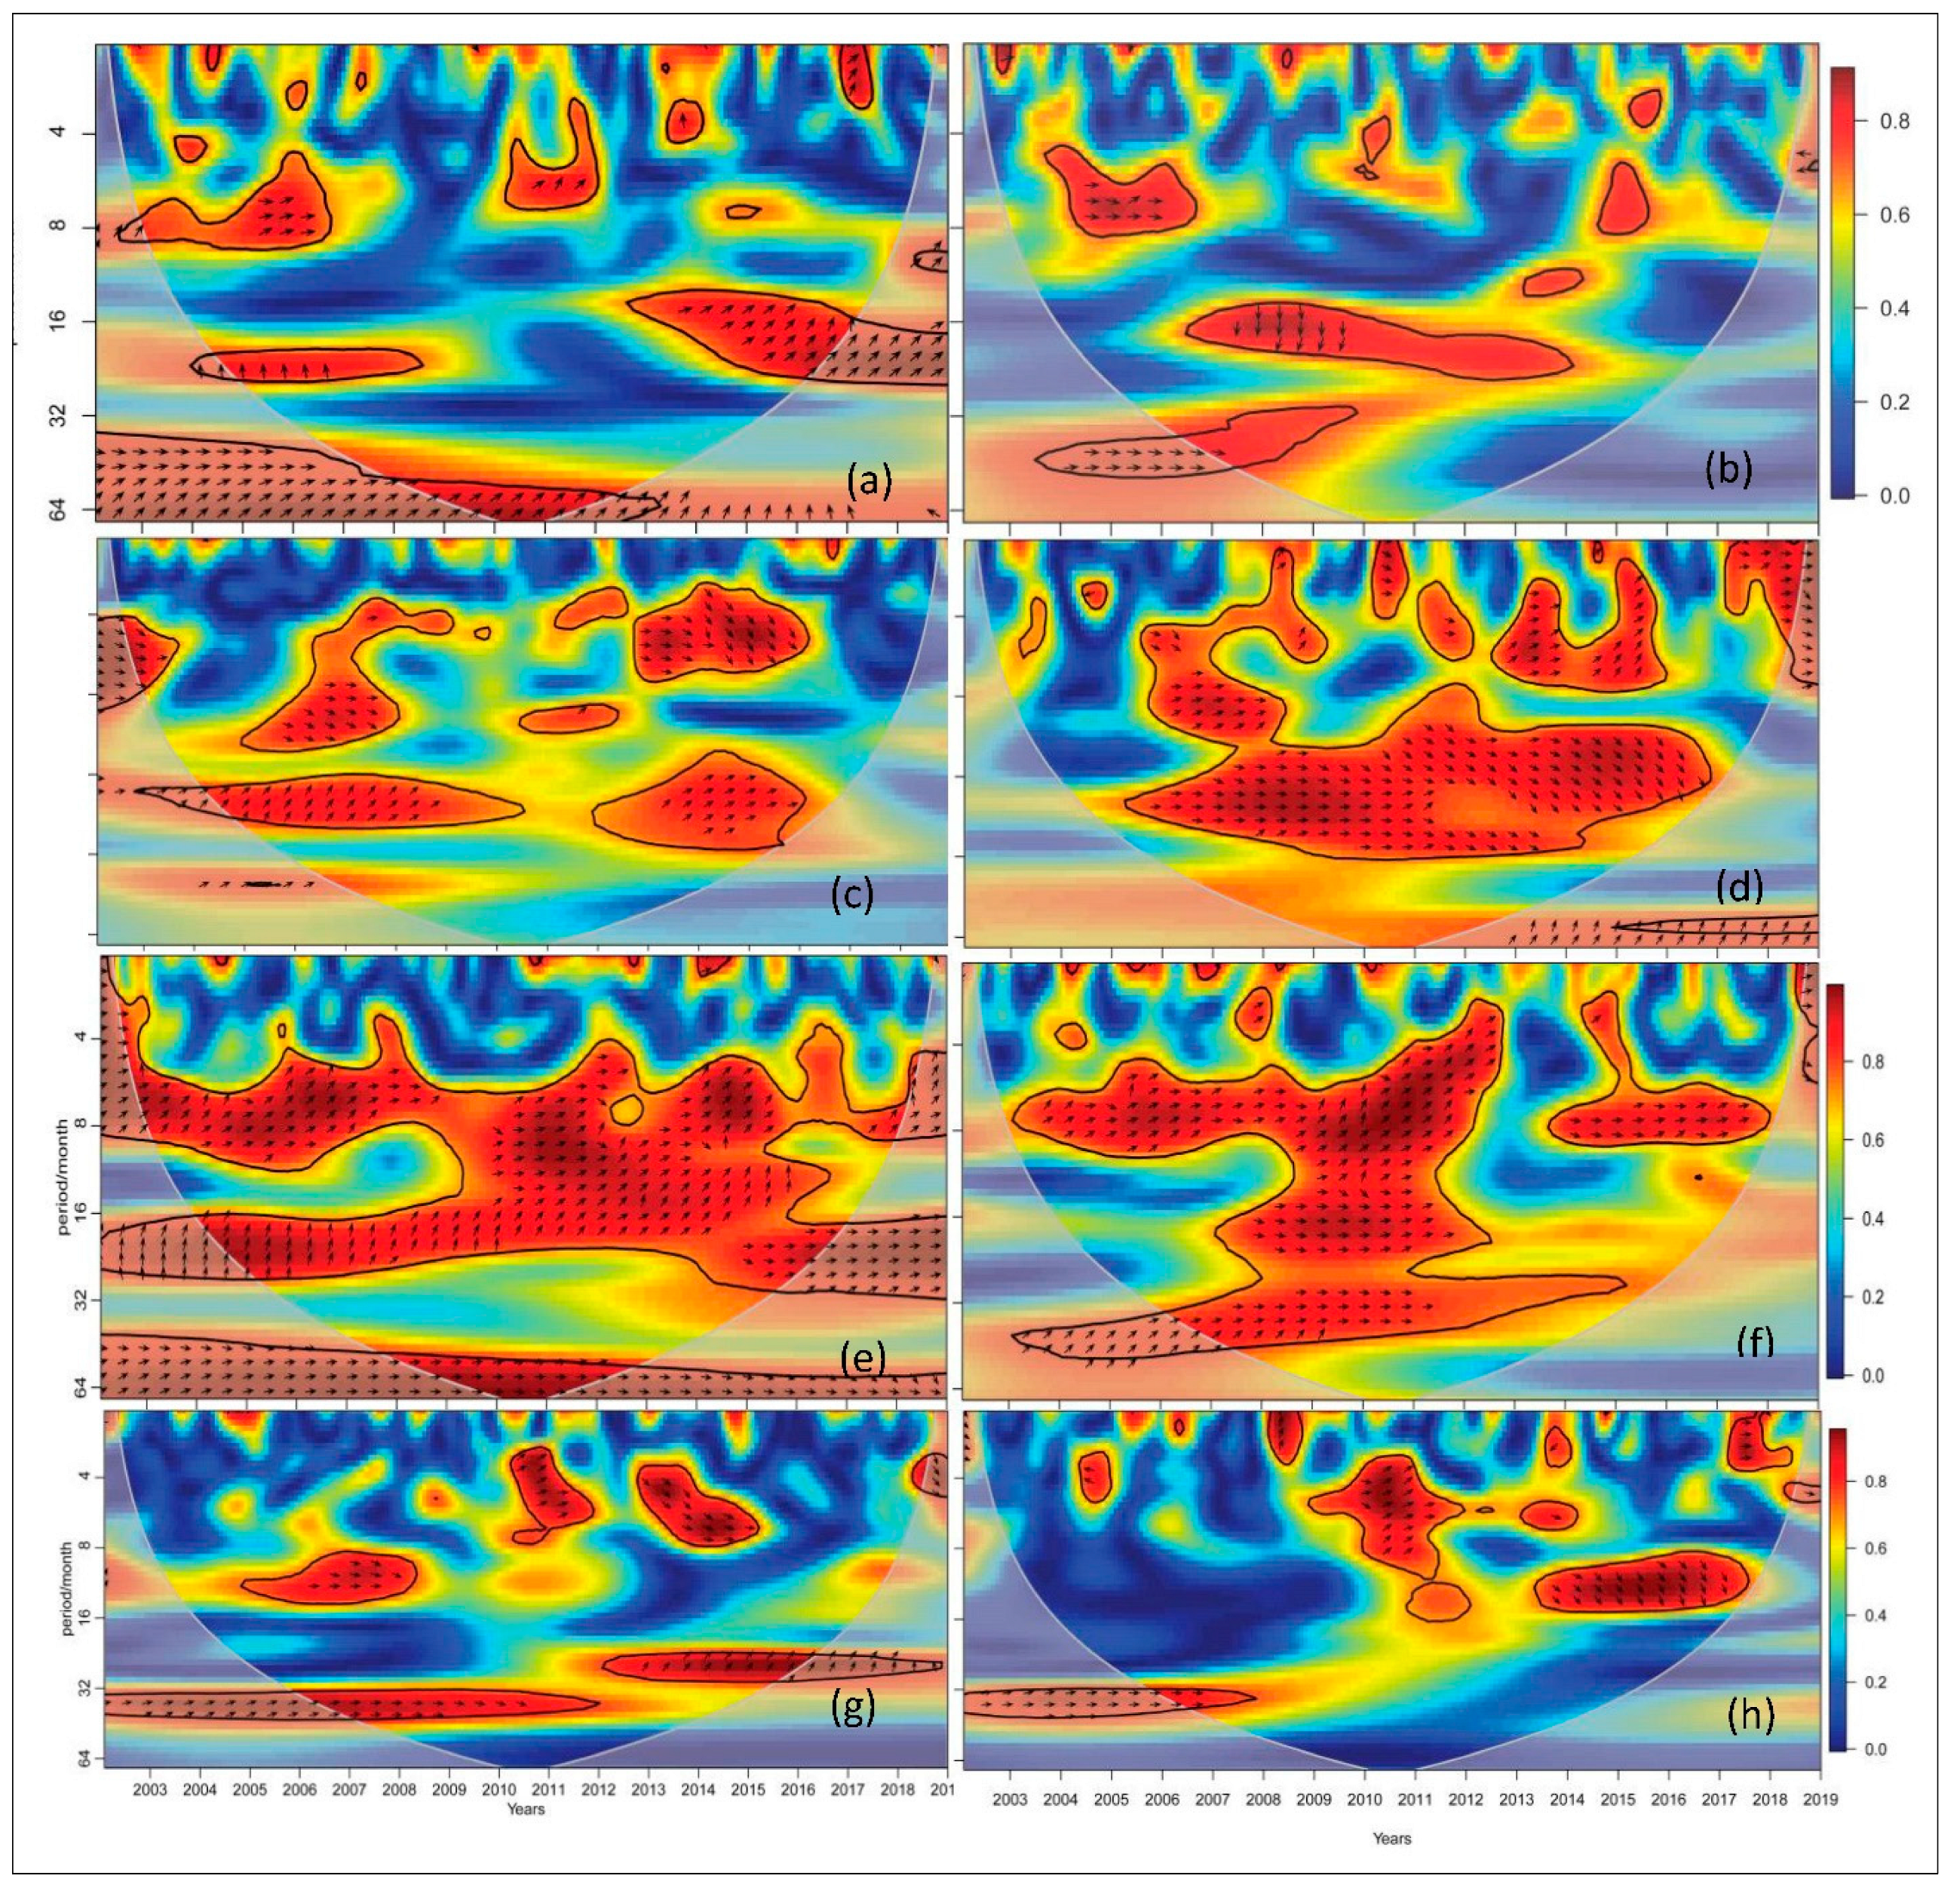
Moreover, a 3–6 month (2010–2012) and a 14–30 month (2013–2018) phase angle relationship showed that the SPEI was positively correlated with the SSI and lagged behind the SSI. Thus, during the NRB’s most severe drought period (2003–2009), agricultural drought (SSI) and meteorological drought (SPEI) had feedback effects. This feedback effect might be associated with the equatorial region convective process that causes the rising dry air to bear rainfall and aggravates meteorological drought. Similarly, the SSI shows a positive and lagged correlation with the GGDI (Figure 6b).
In Figure 6, thick contour represents a 95% confidence level against red noise with arrows indicating the relative phase connection (i.e., negative correlations pointing left and positive affiliations pointing right). Similarly, the arrows point downwards, close to −90 degrees, or 1/4 of a cycle of 360. For example, arrows pointing mostly downward in Figure 6b (i.e., 2006–2009) and Figure 6d (i.e., 2013–2017) show that hydrological drought occurs prior to agricultural drought in the propagation of drought. That might be associated with the BER region’s strong reliance on irrigated agriculture, especially in Sudan [50], which needs further study, as mentioned in Section 4.2.
In the NRB and BNR (Figure 6a,c), among the four significant resonance periods, the SPEI led the SSI during a long-duration coherence (16–32 months in 2003–2009 and 2014–2017). In contrast, the SSI leads to the SPEI during short-duration coherence (2–12 months in 2003–2007 and 2013–2017). Similarly, groundwater drought (GGDI) and agricultural drought (SSI) were positively correlated with the leading SSI between 2006 and 2016 during a few months of coherence, while the GGDI led to a 10–32 month coherence period in 2012–2016. LVR (Figure 6e,f) shows constant coherence for a longer period between the SPEI and SSI and between the SSI and GGDI, while the BER (Figure 6h) shows a short-term spectrum of monthly index sequences among different drought types. Different correlations between the wavelet coherence of the monthly SPEI vs. SSI and SSI vs. GGDI sequences in the NRB and sub-basins are shown in Figure 6a–h both in the time and frequency domain.
In general, the CWES of wavelet coherence can provide a detailed picture of the internal correlation between groundwater drought and meteorological vs. agricultural conditions in the NRB as well as the relationships with the intricate details of oscillation periods that change over time. Therefore, agricultural drought may develop more quickly because of meteorological drought. However, from 2003 to 2022, there was a variation in the incidence of hydrological drought intermittent oscillation intervals between the SSI and SPEI as well as between the GGDI and SSI. Additionally, there was a positive correlation between agricultural drought and groundwater drought.
As presented in Figure 6, to acquire further insights, we compared lagged correlation coefficients (R2) among the monthly SSI vs. SPEI and GGDI vs. SSI throughout the entire study period (2003–2022) and during the period with significant resonance. In the NRB, the R2 values for GGDI vs. SSI were 0.68, those for BNR GGDI vs. SSI were 0.71, and those for SSI vs. SPEI were 0.55.
Similarly, in LVR (Figure 6e,f), GGDI vs. SSI showed 0.51 and SSI vs. SPEI showed 0.55, while in BER (Figure 6g,h), GGDI vs. SSI showed 0.61 and SSI vs. SPEI showed 0.27 during the whole study period with different lag periods 1–6 months. Nonetheless, the R2 values improved during significant resonance periods, as shown in Figure 6a–h, ranging from 0.8 to 0.9. As a result, in the substantial resonance periods based on the CWT, the correlation coefficient between the SPEI vs. SSI and GGDI vs. SSI was significantly improved. These improvements in correlation prove the significance of considering various time scales when exploring the interactions among the three drought types.
4. Discussion
The discussion part of this research has been divided into three parts. The significance of applying the CW method to investigate the relationships between different droughts is covered in the first section, which is followed by recommendations for further studies.
4.1. CW Method to Analyze the Relationships between Different Droughts
In previous research, correlation analysis [51] was used to measure the linear connection between droughts. However, traditional correlation analysis may not capture nonlinear or time-varying correlations, while wavelet coherence offers a more comprehensive understanding of drought dynamics by capturing both linear and nonlinear interactions. Unlike the Fourier transform [52], which focuses on periodic components, wavelet coherence effectively detects localized patterns and changes in coherence over time, providing valuable insights into drought dynamics.
Additionally, some studies used Granger causality analysis [53] to examine drought connections, but it may not capture instantaneous or bidirectional influences. Wavelet coherence offers insights into instantaneous and time-lagged relationships, while Empirical Mode Decomposition (EMD) decomposes [53] time series into intrinsic mode functions (IMFs), capturing nonlinear and non-stationary characteristics. However, EMD may lack the frequency localization and multi-resolution analysis capabilities of wavelet coherence.
Consequently, this study employed the wavelet coherence approach to examine the interactions between three distinct types of droughts. WC analysis is an effective technique for examining complex drought associations, providing information that may not be available using typical linear methods. Therefore, meteorological drought is triggered by a decline in precipitation and an increase in evapotranspiration, which in turn causes agricultural drought. This induction highlights the propagation of hydrological drought from meteorological drought. This study cross-correlated the monthly meteorological drought (SPEI) with the agricultural drought (SSI) to investigate the proliferation of agricultural drought. While the SSI operates on a one-month scale (SSI-1), the SPEI series operates on many time scales ranging from one to twenty-four months. Temperature and precipitation have the greatest effects on soil moisture, which is a reliable indication of agricultural drought [54,55]. Thus, groundwater drought has a more delayed effect than meteorological drought [56]. The propagation time differed in each sub-region due to the differences in topography, climate, hydrology, and anthropogenic activities in the NRB. For example, the evapotranspiration rate increases crop water requirement in highly irrigated areas of the NRB [43,44,45].
Moreover, the pumping of groundwater to satisfy agricultural irrigation needs during the cropping season exacerbates the groundwater shortage [57,58]. Because of this, the amount of time it takes for a meteorological drought to progress to a groundwater drought varies according to the season. However, GRACE/GRACE-FO has uncertainties and limitations in detecting GW drought dynamic variations [41], mainly from limited spatial–temporal resolution, postprocessing errors, and missing and assimilated data to quantify other key water components ranging from surface water to groundwater storage changes.
4.2. Future Research Direction
In the future, the study of groundwater drought based on GRACE/GRACE-FO and other hydrological models’ data could improve the spatial (i.e., hourly to daily) and temporal (less than 0.5°) resolutions. Furthermore, GGDI propagation can be improved in future studies when GRACE/GRACE-FO data are combined with advanced hydrological models and interferometric synthetic aperture radar [59] or in situ GW data. Thus, we recommend exploring the GRACE Follow-On satellite product with improved spatiotemporal resolution assimilated with other data. This approach is important for determining the dynamic variations in regional and global groundwater drought propagation.
Similarly, future research can evaluate the benefits and drawbacks of each strategy and develop a more thorough grasp of the connections between various droughts by contrasting the outcomes of wavelet coherence with those from other techniques like correlation analysis, spectral analysis, Granger causality analysis, or EMD. Furthermore, these kinds of comparisons can aid in verifying the results and resilience of the wavelet coherence approach in describing intricate interactions in drought propagation.
Furthermore, the order in which different types of droughts occur can, in fact, change in the context of how they propagate, particularly around areas where irrigated agriculture plays a major role. However, it is crucial to understand that agricultural drought and groundwater drought are linked and can affect one another. Farmers may experience difficulties obtaining water for irrigation if groundwater levels drastically drop, which might have an effect on crop production that could be interpreted as GGDI propagated to SSI. On the other hand, a drought in agriculture may cause more groundwater to be extracted, which might worsen groundwater depletion, which is thought to be SSI propagated to GGDI. Therefore, by differentiating between areas dominated by irrigated and rainfed agriculture, we propose that future studies focus on agricultural and groundwater drought propagation.
5. Conclusions and Recommendations
The dynamics of groundwater, agricultural and meteorological drought propagation in the Nile River Basin are assessed. The NRB conducted a thorough evaluation of the correlations and propagations between groundwater (GGDI), agricultural (SSI), and meteorological (SPEI) droughts from 2003 to 2022. Through the application of cross-wavelet transform, the linkages between droughts were detected.
The CWES of wavelet coherence was able to reveal the internal correlation between meteorological vs. agricultural and agricultural vs. groundwater drought in the NRB. Among the three types of drought, the propagation time has the strongest correlation coefficient. In the study area, the R2 values for GGDI vs. SSI were 0.68, those for BNR GGDI vs. SSI were 0.71, and those for SSI vs. SPEI were 0.55. Similarly, in LVR, GGDI vs. SSI showed 0.51 and SSI vs. SPEI showed 0.55, while in BER, GGDI vs. SSI showed 0.61 and SSI vs. SPEI showed 0.27 during the whole study period with different lag periods of 1–6 months.
The main limitation of this study is that agricultural irrigation and human-induced factors that are significant in drought propagation were not considered. However, the increased use of groundwater and agricultural irrigation could efficiently shorten the time needed for meteorological drought to progress to agricultural drought, which is critical for reducing agricultural drought. As a result, future research should address agricultural irrigation and other human-induced variables in drought propagation studies. Overall, the findings of this study will unpack to a better knowledge of the dynamics and factors that influence the propagation of droughts as well as local or regional drought mitigation strategies.
In conclusion, by using the wavelet coherence approach, our work has significantly advanced our knowledge of drought dynamics in NRB. Using this cutting-edge analytical method, we have shown complex linkages between various drought occurrences, providing insight into their frequency and temporal aspects. Our results emphasize that non-stationarity and nonlinear interactions must be taken into account when examining drought events, and the wavelet coherence approach proves to be an effective tool for capturing these complexities. Furthermore, we recommend implementing the CWT on a smaller scale in NRB sub-basins and similar hydroclimatic conditions in order to examine the propagation of drought in more detail, considering agricultural irrigation and human-induced factors.
Author Contributions
Methodology, Z.M.N. and A.M.M.; Software, Z.M.N.; Validation, Z.M.N.; Formal analysis, Z.M.N.; Investigation, W.Y.; Writing—review & editing, A.M.M.; Supervision, W.Y.; Project administration, W.Y.; Funding acquisition, W.Y. All authors have read and agreed to the published version of the manuscript.
Funding
This research received no external funding.
Data Availability Statement
The GRACE/GRACE-FO and GLDAS data, as well as supporting documentation, accessed from https://disc.gsfc.nasa.gov/datasets?keywords=GRACE-DADM (accessed on 10 October 2023). Rainfall, temperature and evapotranspiration data accessed from GLDAS-NOAH (https://disc.gsfc.nasa.gov/datasets) (accessed on 31 October 2023). Similarly, SPEI retrieved freely from https://spei.csic.es/map/maps.html (accessed on 15 October 2023). The data used in this study are freely available from the abovementioned respective websites.
Acknowledgments
The GES DISC, accessible at https://disc.gsfc.nasa.gov/, archives and distributes the GRACE-DADM data, which are used in this study and are publicly accessible from GRACE-DA-DM data packages. Data for temperature, rainfall, and soil moisture were obtained from GLDAS databases. SPEI, on the other hand, was freely acquired at https://spei.csic.es/map/maps.html.
Conflicts of Interest
There are no conflicts of interest declared by the authors.
References
- Mishra, A.K.; Singh, V.P. A review of drought concepts. J. Hydrol. 2010, 391, 202–216. [Google Scholar] [CrossRef]
- Sheffield, J.; Wood, E.F. Global Trends and Variability in Soil Moisture and Drought Characteristics, 1950–2000, from Observation-Driven Simulations of the Terrestrial Hydrologic Cycle. J. Clim. 2008, 21, 432–458. [Google Scholar] [CrossRef]
- Van Loon, A.F.; Stahl, K.; Di Baldassarre, G.; Clark, J.; Rangecroft, S.; Wanders, N.; Gleeson, T.; Van Dijk, A.I.J.M.; Tallaksen, L.M.; Hannaford, J.; et al. Drought in a human-modified world: Reframing drought definitions, understanding, and analysis approaches. Hydrol. Earth Syst. Sci. 2016, 20, 3631–3650. [Google Scholar] [CrossRef]
- Nigatu, Z.M.; Fan, D.; You, W.; Melesse, A.M.; Pu, L.; Yang, X.; Wan, X.; Jiang, Z. Crop production response to soil moisture and groundwater depletion in the Nile Basin based on multi-source data. Sci. Total. Environ. 2022, 825, 154007. [Google Scholar] [CrossRef] [PubMed]
- Van Loon, A.F. Hydrological drought explained. WIREs Water 2015, 2, 359–392. [Google Scholar] [CrossRef]
- Thomas, B.F.; Caineta, J.; Nanteza, J. Global Assessment of Groundwater Sustainability Based On Storage Anomalies. Geophys. Res. Lett. 2017, 44, 11445–11455. [Google Scholar] [CrossRef]
- Van Loon, A.F.; Gleeson, T.; Clark, J.; Van Dijk, A.I.; Stahl, K.; Hannaford, J.; Di Baldassarre, G.; Teuling, A.J.; Tallaksen, L.M.; Uijlenhoet, R.; et al. Drought in the Anthropocene. Nat. Geosci. 2016, 9, 89–91. [Google Scholar] [CrossRef]
- Nigatu, Z.M.; Fan, D.; You, W. GRACE Products and Land Surface Models for Estimating the Changes in Key Water Storage Components in the Nile River Basin. Adv. Space Res. 2021, 67, 1896–1913. [Google Scholar] [CrossRef]
- Mukherjee, S.; Mishra, A.; Trenberth, K.E. Climate Change and Drought: A Perspective on Drought Indices. Curr. Clim. Chang. Rep. 2018, 4, 145–163. [Google Scholar] [CrossRef]
- Raposo, V.D.M.B.; Costa, V.A.F.; Rodrigues, A.F. A review of recent developments on drought characterization, propagation, and influential factors. Sci. Total Environ. 2023, 898, 165550. [Google Scholar] [CrossRef] [PubMed]
- Liu, Y.; Shan, F.; Yue, H.; Wang, X.; Fan, Y. Global analysis of the correlation and propagation among meteorological, agricultural, surface water, and groundwater droughts. J. Environ. Manag. 2023, 333, 117460. [Google Scholar] [CrossRef] [PubMed]
- Sang, Y.-F. A review on the applications of wavelet transform in hydrology time series analysis. Atmos. Res. 2013, 122, 8–15. [Google Scholar] [CrossRef]
- Abtew, W.; Melesse, A.M.; Dessalegne, T. El Niño Southern Oscillation link to the Blue Nile River Basin hydrology. Hydrol. Process. 2009, 23, 3653–3660. [Google Scholar] [CrossRef]
- Wada, Y.; Van Beek, L.P.H.; Van Kempen, C.M.; Reckman, J.W.T.M.; Vasak, S.; Bierkens, M.F.P. Global depletion of groundwater resources. Geophys. Res. Lett. 2010, 37, L20402. [Google Scholar] [CrossRef]
- Bloomfield, J.P.; Marchant, B.P.; McKenzie, A.A. Changes in groundwater drought associated with anthropogenic warming. Hydrol. Earth Syst. Sci. 2019, 23, 1393–1408. [Google Scholar] [CrossRef]
- Li, B.; Rodell, M.; Sheffield, J.; Wood, E.; Sutanudjaja, E. Long-term, non-anthropogenic groundwater storage changes simulated by three global-scale hydrological models. Sci. Rep. 2019, 9, 10746. [Google Scholar] [CrossRef]
- Wang, L.; Chen, C.; Ma, X.; Fu, Z.; Zheng, Y.; Peng, Z. Evaluation of GRACE mascon solutions using in-situ geodetic data: The case of hydrologic-induced crust displacement in the Yangtze River Basin. Sci. Total. Environ. 2020, 707, 135606. [Google Scholar] [CrossRef]
- Zhang, H.; Ding, J.; Wang, Y.; Zhou, D.; Zhu, Q. Investigation about the correlation and propagation among meteorological, agricultural and groundwater droughts over humid and arid/semi-arid basins in China. J. Hydrol. 2021, 603, 127007. [Google Scholar] [CrossRef]
- Lin, Q.; Wu, Z.; Singh, V.P.; Sadeghi, S.H.R.; He, H.; Lu, G. Correlation between hydrological drought, climatic factors, reservoir operation, and vegetation cover in the Xijiang Basin, South China. J. Hydrol. 2017, 549, 512–524. [Google Scholar] [CrossRef]
- Wossenyeleh, B.K.; Worku, K.A.; Verbeiren, B.; Huysmans, M. Drought propagation and its impact on groundwater hydrology of wetlands: A case study on the Doode Bemde nature reserve (Belgium). Nat. Hazards Earth Syst. Sci. 2021, 21, 39–51. [Google Scholar] [CrossRef]
- Abtew, W.; Melesse, A.M. Transboundary Rivers and the Nile BT—Nile River Basin: Ecohydrological Challenges, Climate Change and Hydropolitics; Melesse, A.M., Abtew, W., Setegn, S.G., Eds.; Springer International Publishing: Cham, Switzerland, 2014; pp. 565–579. [Google Scholar]
- Awulachew, S.B. The Nile River Basin: Water, Agriculture, Governance and Livelihoods; Routledge: London, UK, 2012. [Google Scholar]
- Tamaddun, K.A.; Kalra, A.; Kumar, S.; Ahmad, S. CMIP5 Models’ Ability to Capture Observed Trends under the Influence of Shifts and Persistence: An In-Depth Study on the Colorado River Basin. J. Appl. Meteorol. Clim. 2019, 58, 1677–1688. [Google Scholar] [CrossRef]
- Rodell, M.; Houser, P.R.; Jambor, U.; Gottschalck, J.; Mitchell, K.; Meng, C.-J.; Arsenault, K.; Cosgrove, B.; Radakovich, J.; Bosilovich, M.; et al. The Global Land Data Assimilation System. Bull. Am. Meteorol. Soc. 2004, 85, 381–394. [Google Scholar] [CrossRef]
- Spennemann, P.C.S.; Rivera, J.A.R.; Saulo, A.C.E.; Penalba, O.C.P. A Comparison of GLDAS Soil Moisture Anomalies against Standardized Precipitation Index and Multisatellite Estimations over South America. J. Hydrometeorol. 2015, 16, 158–171. [Google Scholar] [CrossRef]
- Li, M.; Wu, P.; Ma, Z. A comprehensive evaluation of soil moisture and soil temperature from third-generation atmospheric and land reanalysis data sets. Int. J. Clim. 2020, 40, 5744–5766. [Google Scholar] [CrossRef]
- Sabater, J.M. ERA5-Land Monthly Averaged Data from 1981 to Present. Copernicus Climate Change Service (C3S) Climate Data Store (CDS). 2019. Available online: https://confluence.ecmwf.int/display/CKB/ERA5-Land%3A+data+documentation (accessed on 1 September 2020).
- Gruber, A.; Dorigo, W.A.; Crow, W.; Wagner, W. Triple Collocation-Based Merging of Satellite Soil Moisture Retrievals. IEEE Trans. Geosci. Remote Sens. 2017, 55, 6780–6792. [Google Scholar] [CrossRef]
- Stoffelen, A. Toward the true near-surface wind speed: Error modeling and calibration using triple collocation. J. Geophys. Res. Ocean. 1998, 103, 7755–7766. [Google Scholar] [CrossRef]
- Yilmaz, M.T.; Crow, W.T.; Ryu, D. Impact of Model Relative Accuracy in Framework of Rescaling Observations in Hydrological Data Assimilation Studies. J. Hydrometeorol. 2016, 17, 2245–2257. [Google Scholar] [CrossRef]
- Wang, F.; Wang, Z.; Yang, H.; Di, D.; Zhao, Y.; Liang, Q. Utilizing GRACE-based groundwater drought index for drought characterization and teleconnection factors analysis in the North China Plain. J. Hydrol. 2020, 585, 124849. [Google Scholar] [CrossRef]
- Thomas, B.F.; Famiglietti, J.S.; Landerer, F.W.; Wiese, D.N.; Molotch, N.P.; Argus, D.F. GRACE Groundwater Drought Index: Evaluation of California Central Valley groundwater drought. Remote Sens. Environ. 2017, 198, 384–392. [Google Scholar] [CrossRef]
- Hao, Z.; AghaKouchak, A. Multivariate Standardized Drought Index: A parametric multi-index model. Adv. Water Resour. 2013, 57, 12–18. [Google Scholar] [CrossRef]
- Farahmand, A.; AghaKouchak, A. A generalized framework for deriving nonparametric standardized drought indicators. Adv. Water Resour. 2015, 76, 140–145. [Google Scholar] [CrossRef]
- Ye, L.; Shi, K.; Zhang, H.; Xin, Z.; Hu, J.; Zhang, C. Spatio-Temporal Analysis of Drought Indicated by SPEI over Northeastern China. Water 2019, 11, 908. [Google Scholar] [CrossRef]
- Wang, J.; Chen, Y.; Wang, Z.; Shang, P. Drought evaluation over Yangtze River basin based on weighted water storage deficit. J. Hydrol. 2020, 591, 125283. [Google Scholar] [CrossRef]
- Abtew, W.; Melesse, A.M. Climate Teleconnections and Water Management BT—Nile River Basin: Ecohydrological Challenges, Climate Change and Hydropolitics; Melesse, A.M., Abtew, W., Setegn, S.G., Eds.; Springer International Publishing: Cham, Switzerland, 2014; pp. 685–705. [Google Scholar]
- Nigatu, Z.M.; Fan, D.; You, W.; Melesse, A.M. Hydroclimatic Extremes Evaluation Using GRACE/GRACE-FO and Multidecadal Climatic Variables over the Nile River Basin. Remote Sens. 2021, 13, 651. [Google Scholar] [CrossRef]
- Awange, J.; Forootan, E.; Kuhn, M.; Kusche, J.; Heck, B. Water storage changes and climate variability within the Nile Basin between 2002 and 2011. Adv. Water Resour. 2014, 73, 1–15. [Google Scholar] [CrossRef]
- Grinsted, A.; Moore, J.C.; Jevrejeva, S. Application of the cross wavelet transform and wavelet coherence to geophysical time series. Nonlinear Process. Geophys. 2004, 11, 561–566. [Google Scholar] [CrossRef]
- Wang, F.; Lai, H.; Li, Y.; Feng, K.; Zhang, Z.; Tian, Q.; Zhu, X.; Yang, H. Identifying the status of groundwater drought from a GRACE mascon model perspective across China during 2003–2018. Agric. Water Manag. 2022, 260, 107251. [Google Scholar] [CrossRef]
- Osima, S.; Indasi, V.S.; Zaroug, M.; Endris, H.S.; Gudoshava, M.; Misiani, H.O.; Nimusiima, A.; Anyah, R.O.; Otieno, G.; Ogwang, B.A.; et al. Projected climate over the Greater Horn of Africa under 1.5 °C and 2 °C global warming. Environ. Res. Lett. 2018, 13, 065004. [Google Scholar] [CrossRef]
- Touma, D.; Ashfaq, M.; Nayak, M.A.; Kao, S.-C.; Diffenbaugh, N.S. A multi-model and multi-index evaluation of drought characteristics in the 21st century. J. Hydrol. 2015, 526, 196–207. [Google Scholar] [CrossRef]
- Brito, S.S.B.; Cunha, A.P.M.A.; Cunningham, C.C.; Alvalá, R.C.; Marengo, J.A.; Carvalho, M.A. Frequency, duration and severity of drought in the Semi-arid Northeast Brazil region. Int. J. Climatol. 2018, 38, 517–529. [Google Scholar] [CrossRef]
- Andrew, R.L.; Guan, H.; Batelaan, O. Large-scale vegetation responses to terrestrial moisture storage changes. Hydrol. Earth Syst. Sci. 2017, 21, 4469–4478. [Google Scholar] [CrossRef]
- Huntington, T.G. Evidence for intensification of the global water cycle: Review and synthesis. J. Hydrol. 2006, 319, 83–95. [Google Scholar] [CrossRef]
- Wang, W.; Cui, W.; Wang, X.; Chen, X. Evaluation of GLDAS-1 and GLDAS-2 Forcing Data and Noah Model Simulations over China at the Monthly Scale. J. Hydrometeorol. 2016, 17, 2815–2833. [Google Scholar] [CrossRef]
- Cook, B.I.; Smerdon, J.E.; Seager, R.; Coats, S. Global warming and 21st century drying. Clim. Dyn. 2014, 43, 2607–2627. [Google Scholar] [CrossRef]
- Peterson, T.C.; Heim, R.R.; Hirsch, R.; Kaiser, D.P.; Brooks, H.; Diffenbaugh, N.S.; Dole, R.M.; Giovannettone, J.P.; Guirguis, K.; Karl, T.R.; et al. Monitoring and understanding changes in heat waves, cold waves, floods, and droughts in the United States: State of knowledge. Bull. Am. Meteorol. Soc. 2013, 94, 821–834. [Google Scholar] [CrossRef]
- Omer, A. Focus on groundwater in Sudan. Environ. Geol. 2002, 41, 972–976. [Google Scholar] [CrossRef]
- Vergni, L.; Todisco, F.; Di Lena, B. Evaluation of the similarity between drought indices by correlation analysis and Cohen’s Kappa test in a Mediterranean area. Nat. Hazards 2021, 108, 2187–2209. [Google Scholar] [CrossRef]
- Wilks, D.S. Statistical Methods in the Atmospheric Sciences, 4th ed.; Academic Press: Cambridge, MA, USA, 2019. [Google Scholar]
- Singh, N.K.; Borrok, D.M. A Granger causality analysis of groundwater patterns over a half-century. Sci. Rep. 2019, 9, 12828. [Google Scholar] [CrossRef]
- Wu, H.; Su, X.; Singh, V.P.; Feng, K.; Niu, J. Agricultural Drought Prediction Based on Conditional Distributions of Vine Copulas. Water Resour. Res. 2021, 57, e2021WR029562. [Google Scholar] [CrossRef]
- Chen, H.; Zhang, W.; Nie, N.; Guo, Y. Long-term groundwater storage variations estimated in the Songhua River Basin by using GRACE products, land surface models, and in-situ observations. Sci. Total Environ. 2019, 649, 372–387. [Google Scholar] [CrossRef]
- Han, Z.; Huang, S.; Huang, Q.; Leng, G.; Wang, H.; Bai, Q.; Zhao, J.; Ma, L.; Wang, L.; Du, M. Propagation dynamics from meteorological to groundwater drought and their possible influence factors. J. Hydrol. 2019, 578, 124102. [Google Scholar] [CrossRef]
- Döll, P.; Schmied, H.M.; Schuh, C.; Portmann, F.T.; Eicker, A. Global-scale assessment of groundwater depletion and related groundwater abstractions: Combining hydrological modeling with information from well observations and GRACE satellites. Water Resour. Res. 2014, 50, 5698–5720. [Google Scholar] [CrossRef]
- Multsch, S.; Elshamy, M.; Batarseh, S.; Seid, A.; Frede, H.-G.; Breuer, L. Improving irrigation efficiency will be insufficient to meet future water demand in the Nile Basin. J. Hydrol. Reg. Stud. 2017, 12, 315–330. [Google Scholar] [CrossRef]
- Castellazzi, P.; Longuevergne, L.; Martel, R.; Rivera, A.; Brouard, C.; Chaussard, E. Quantitative mapping of groundwater depletion at the water management scale using a combined GRACE/InSAR approach. Remote Sens. Environ. 2018, 205, 408–418. [Google Scholar] [CrossRef]
Figure 1.
NRB lakes, rivers, countries and altitude variations.
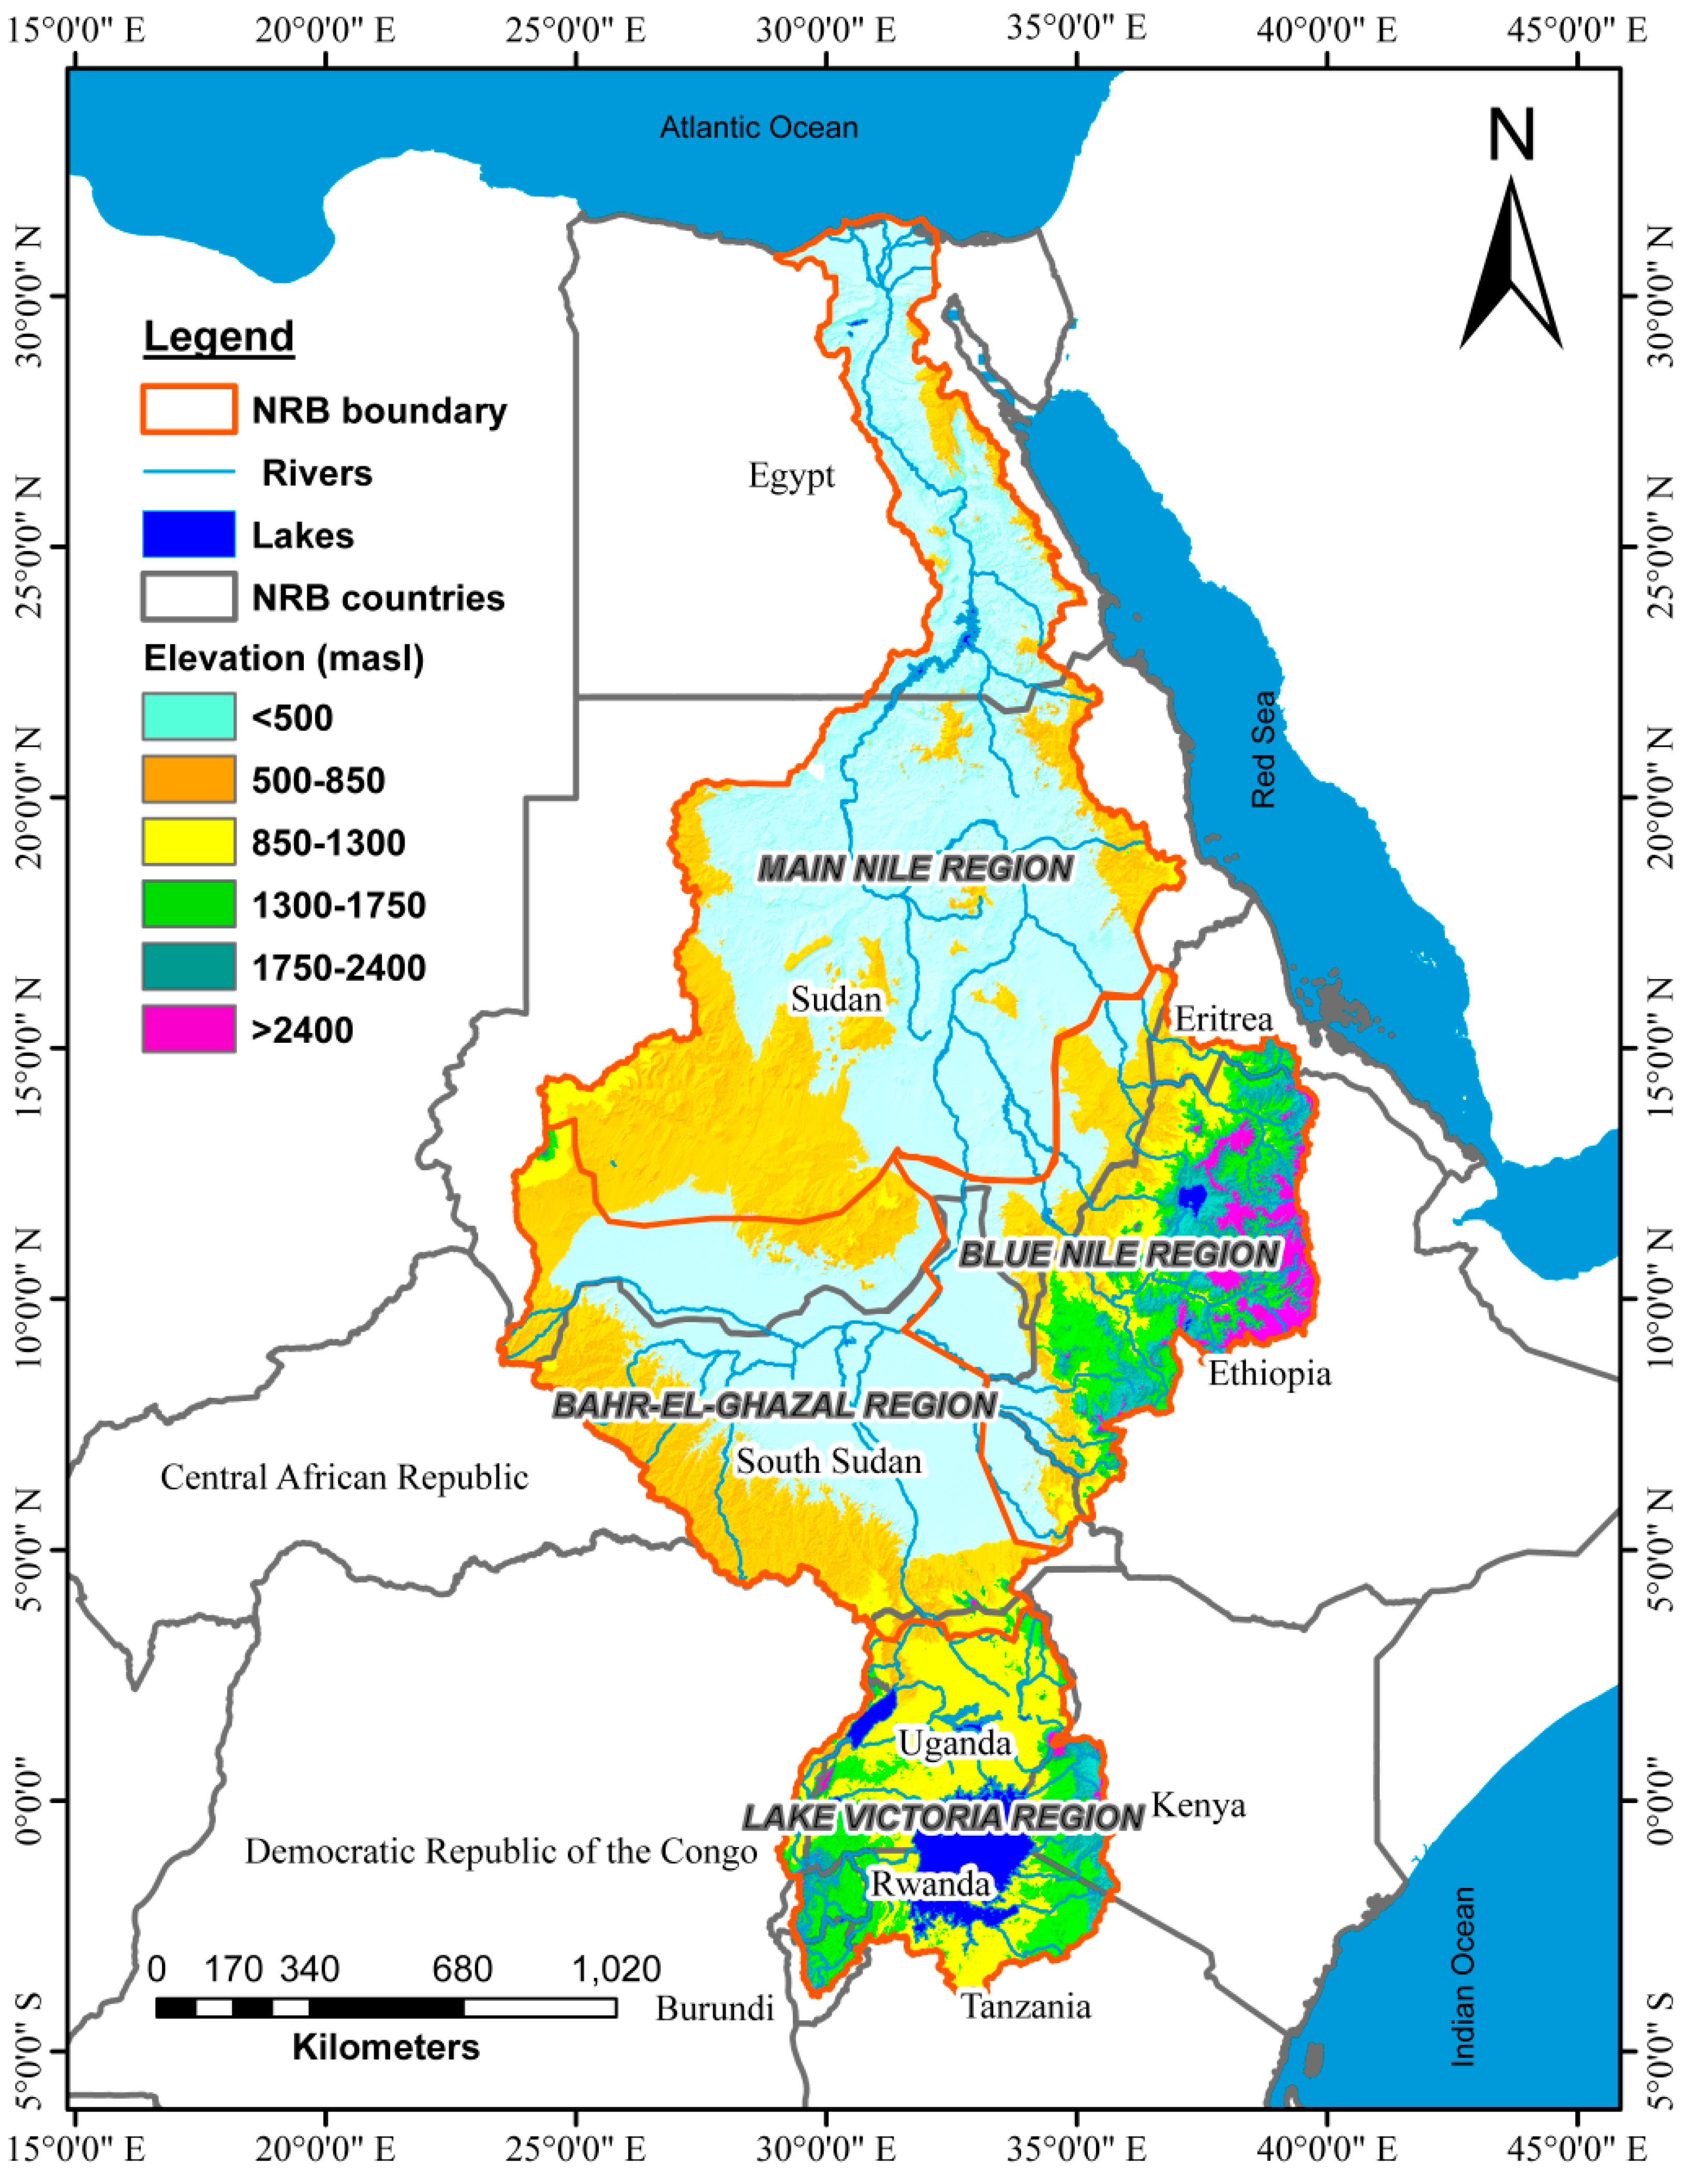
Figure 2.
The change patterns of SST, soil moisture, and groundwater drought in the NRB (red, yellow, and gray bands indicate severe, moderate, and slight degrees of groundwater drought, respectively).
Figure 2.
The change patterns of SST, soil moisture, and groundwater drought in the NRB (red, yellow, and gray bands indicate severe, moderate, and slight degrees of groundwater drought, respectively).

Figure 3.
Changes in rainfall (RF), ET (a), and temperature (b) in the NRB from 1950 to 2022.
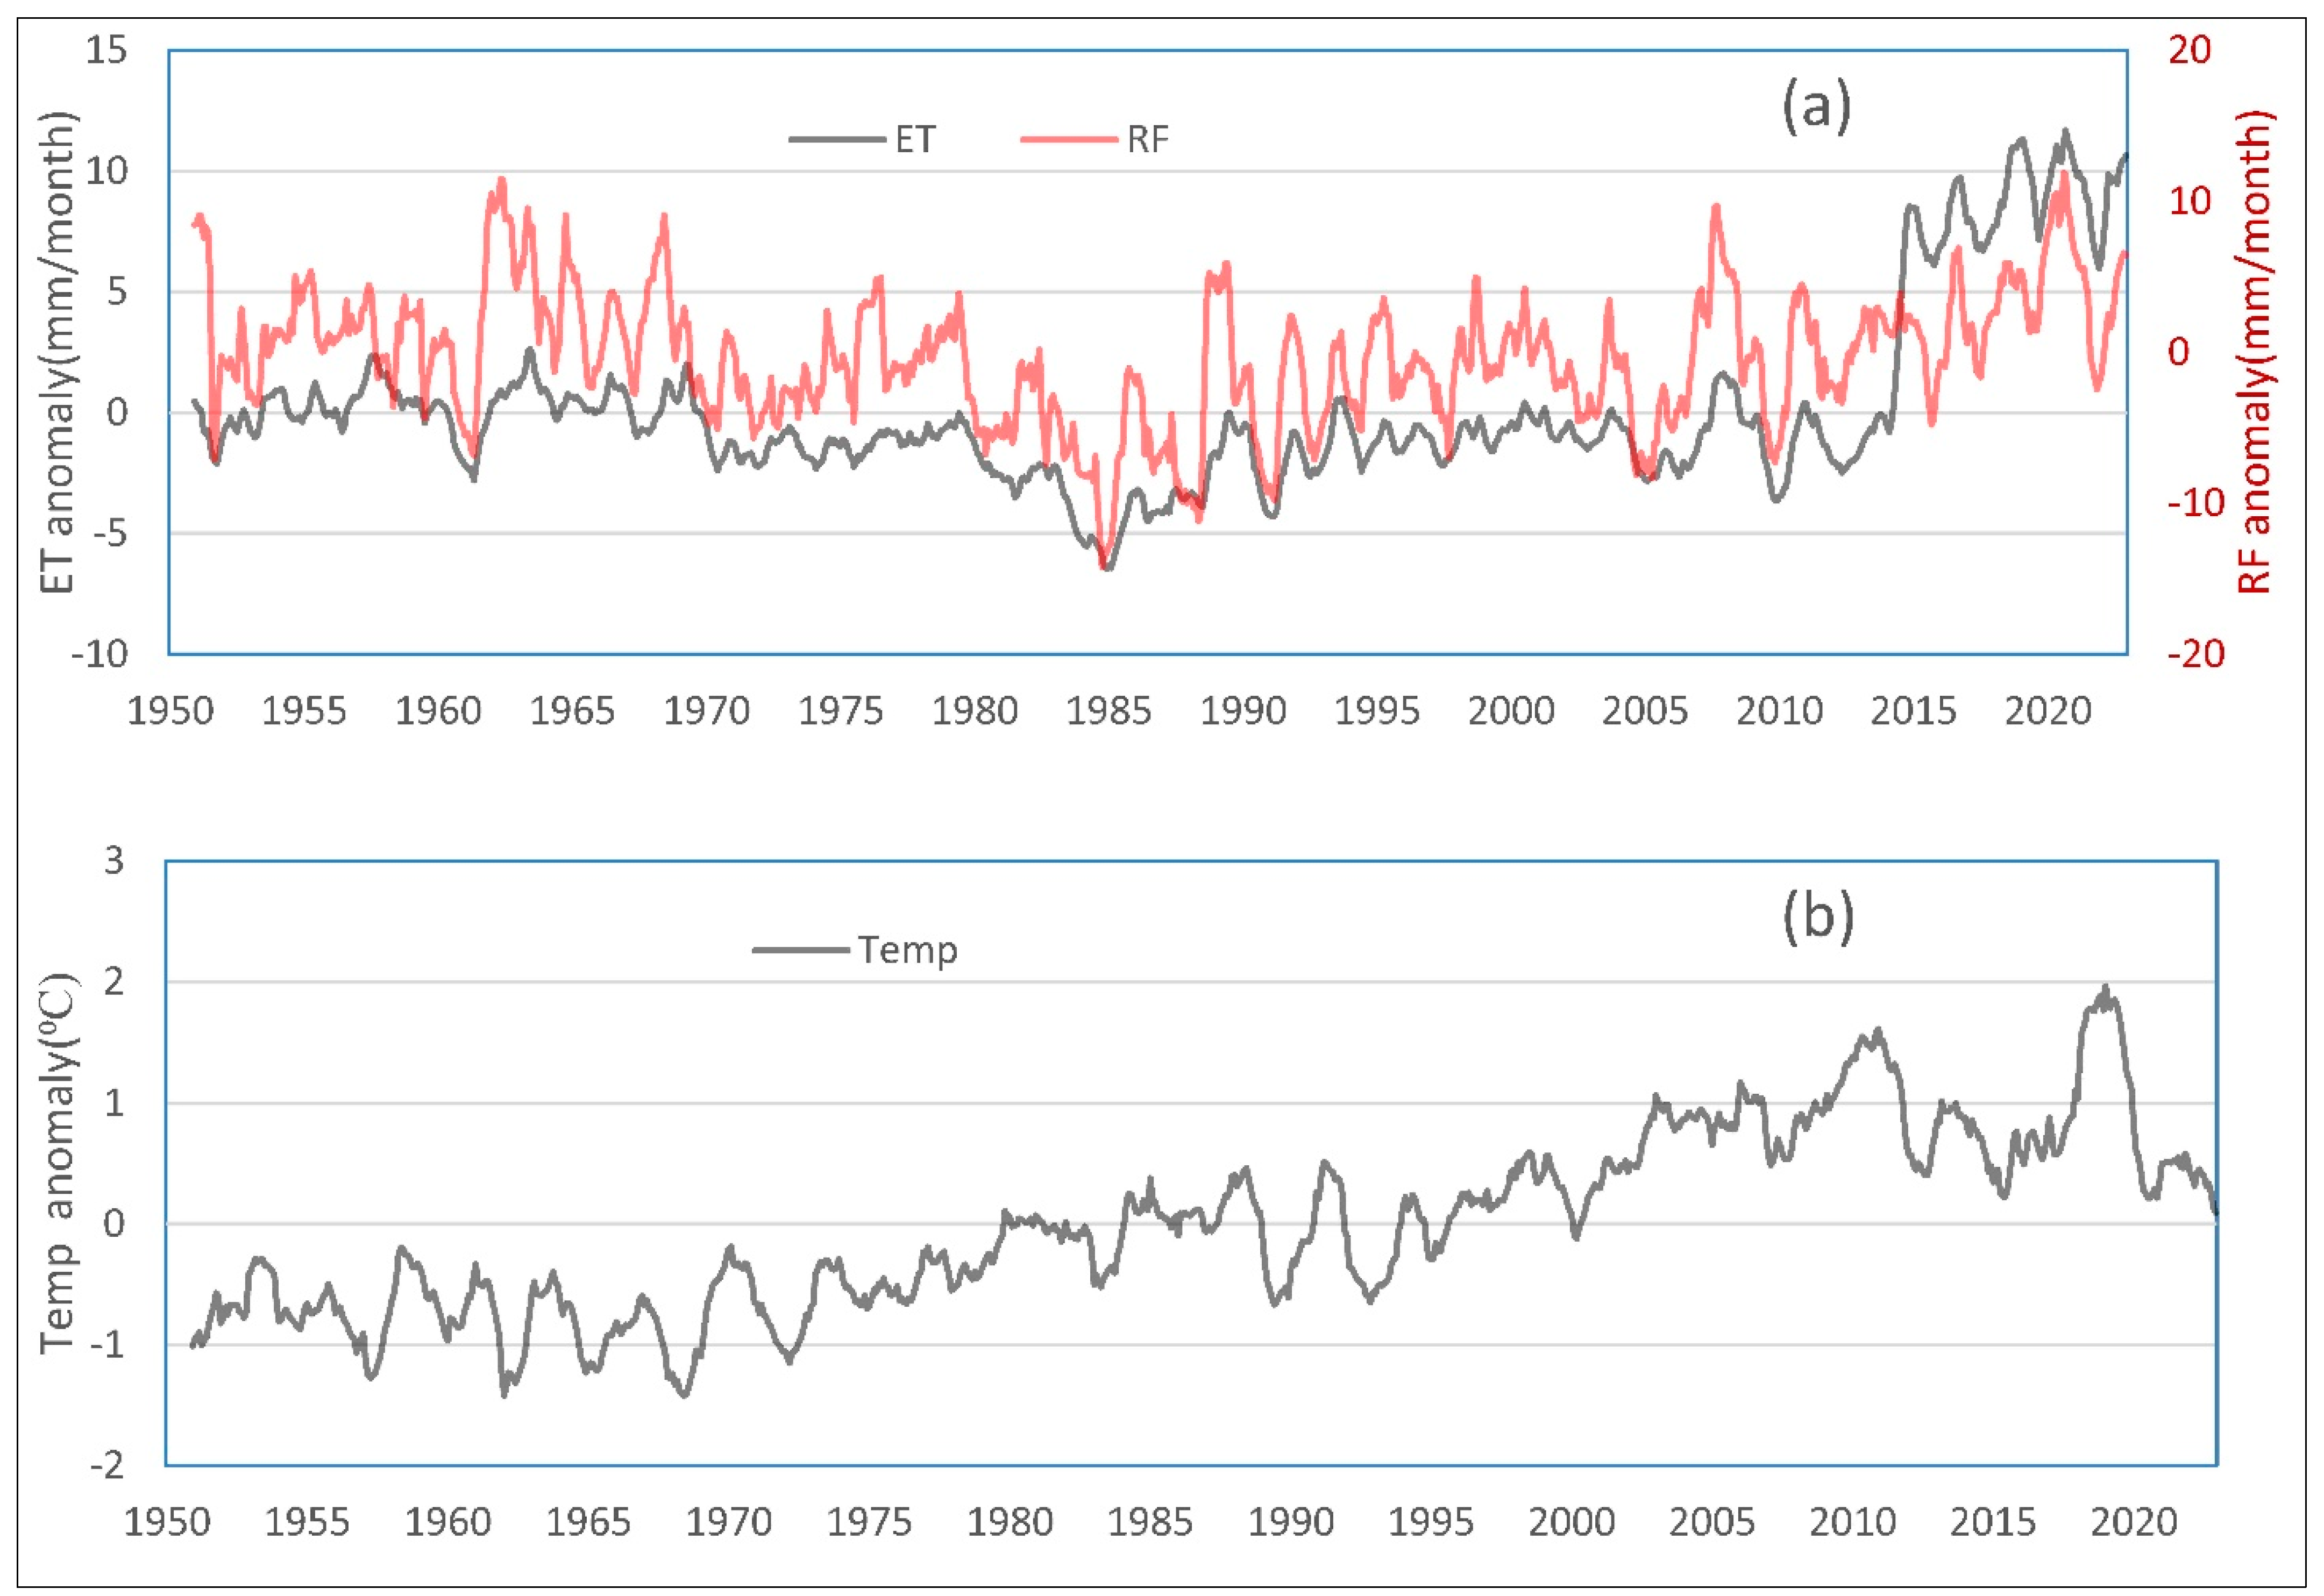
Figure 4.
The CWT between the monthly ENSO and GGDI events for the NRB (a), BNR (b), LVR (c), BER (d), and MNR (e) covering 2003–2022 in the NRB.
Figure 4.
The CWT between the monthly ENSO and GGDI events for the NRB (a), BNR (b), LVR (c), BER (d), and MNR (e) covering 2003–2022 in the NRB.

Table 1.
Dataset used in this research.
| Data Types | Model Name | Data Interval | Spatial Resolution | Data Retrieving Sources |
|---|---|---|---|---|
| GWS | GRACE-DADM | 2003–2022 | 0.25° × 1° | https://disc.gsfc.nasa.gov/datasets?keywords=GRACE-DADM |
| SM | ERA5-Land | 1981–2022 | 0.1° × 0.1° | https://www.ecmwf.int/en/era5-land |
| MERRA-2 | 1980–2022 | 0.5° × 0.625° | https://gmao.gsfc.nasa.gov/reanalysis/MERRA-2 | |
| GLDAS-NOAH (M2.0 & 2.1) | 1950–2022 | 1° × 1° | https://catalog.data.gov/dataset/gldas-noah-land-surface-model-l4-monthly-0-25-x-0-25-degree-v2-0-gldas-noah025-m-at-ges-di | |
| RF | GLDAS-NOAH | 1950–2022 | 0.25° × 0.25° | https://disc.gsfc.nasa.gov/datasets?keywords=rainfall https://gpm.nasa.gov/data/sources |
| Temp | GLDAS-NOAH | 1950–2022 | 0.25° × 0.25° | https://disc.gsfc.nasa.gov/datasets?keywords=temperature |
| ET | GLDAS-NOAH | 1950–2022 | 0.25° × 0.25° | https://disc.gsfc.nasa.gov/datasets?keywords=ET |
| Drought data | SPEI | 1950–2022 | 0.5° × 0.5° | https://spei.csic.es/map/maps.html |
| SST | Niño3.4 | 1950–2022 | NA | https://psl.noaa.gov/gcos_wgsp/Timeseries/Nino34 |
Disclaimer/Publisher’s Note: The statements, opinions and data contained in all publications are solely those of the individual author(s) and contributor(s) and not of MDPI and/or the editor(s). MDPI and/or the editor(s) disclaim responsibility for any injury to people or property resulting from any ideas, methods, instructions or products referred to in the content. |
© 2024 by the authors. Licensee MDPI, Basel, Switzerland. This article is an open access article distributed under the terms and conditions of the Creative Commons Attribution (CC BY) license (https://creativecommons.org/licenses/by/4.0/).
Share and Cite
MDPI and ACS Style
Nigatu, Z.M.; You, W.; Melesse, A.M. Drought Dynamics in the Nile River Basin: Meteorological, Agricultural, and Groundwater Drought Propagation. Remote Sens. 2024, 16, 919. https://doi.org/10.3390/rs16050919
AMA Style
Nigatu ZM, You W, Melesse AM. Drought Dynamics in the Nile River Basin: Meteorological, Agricultural, and Groundwater Drought Propagation. Remote Sensing. 2024; 16(5):919. https://doi.org/10.3390/rs16050919
Chicago/Turabian StyleNigatu, Zemede M., Wei You, and Assefa M. Melesse. 2024. "Drought Dynamics in the Nile River Basin: Meteorological, Agricultural, and Groundwater Drought Propagation" Remote Sensing 16, no. 5: 919. https://doi.org/10.3390/rs16050919
Note that from the first issue of 2016, this journal uses article numbers instead of page numbers. See further details here.