Appendix B
Sensitivity of the portable albedometer. Effect of clouds on field albedo measurements.
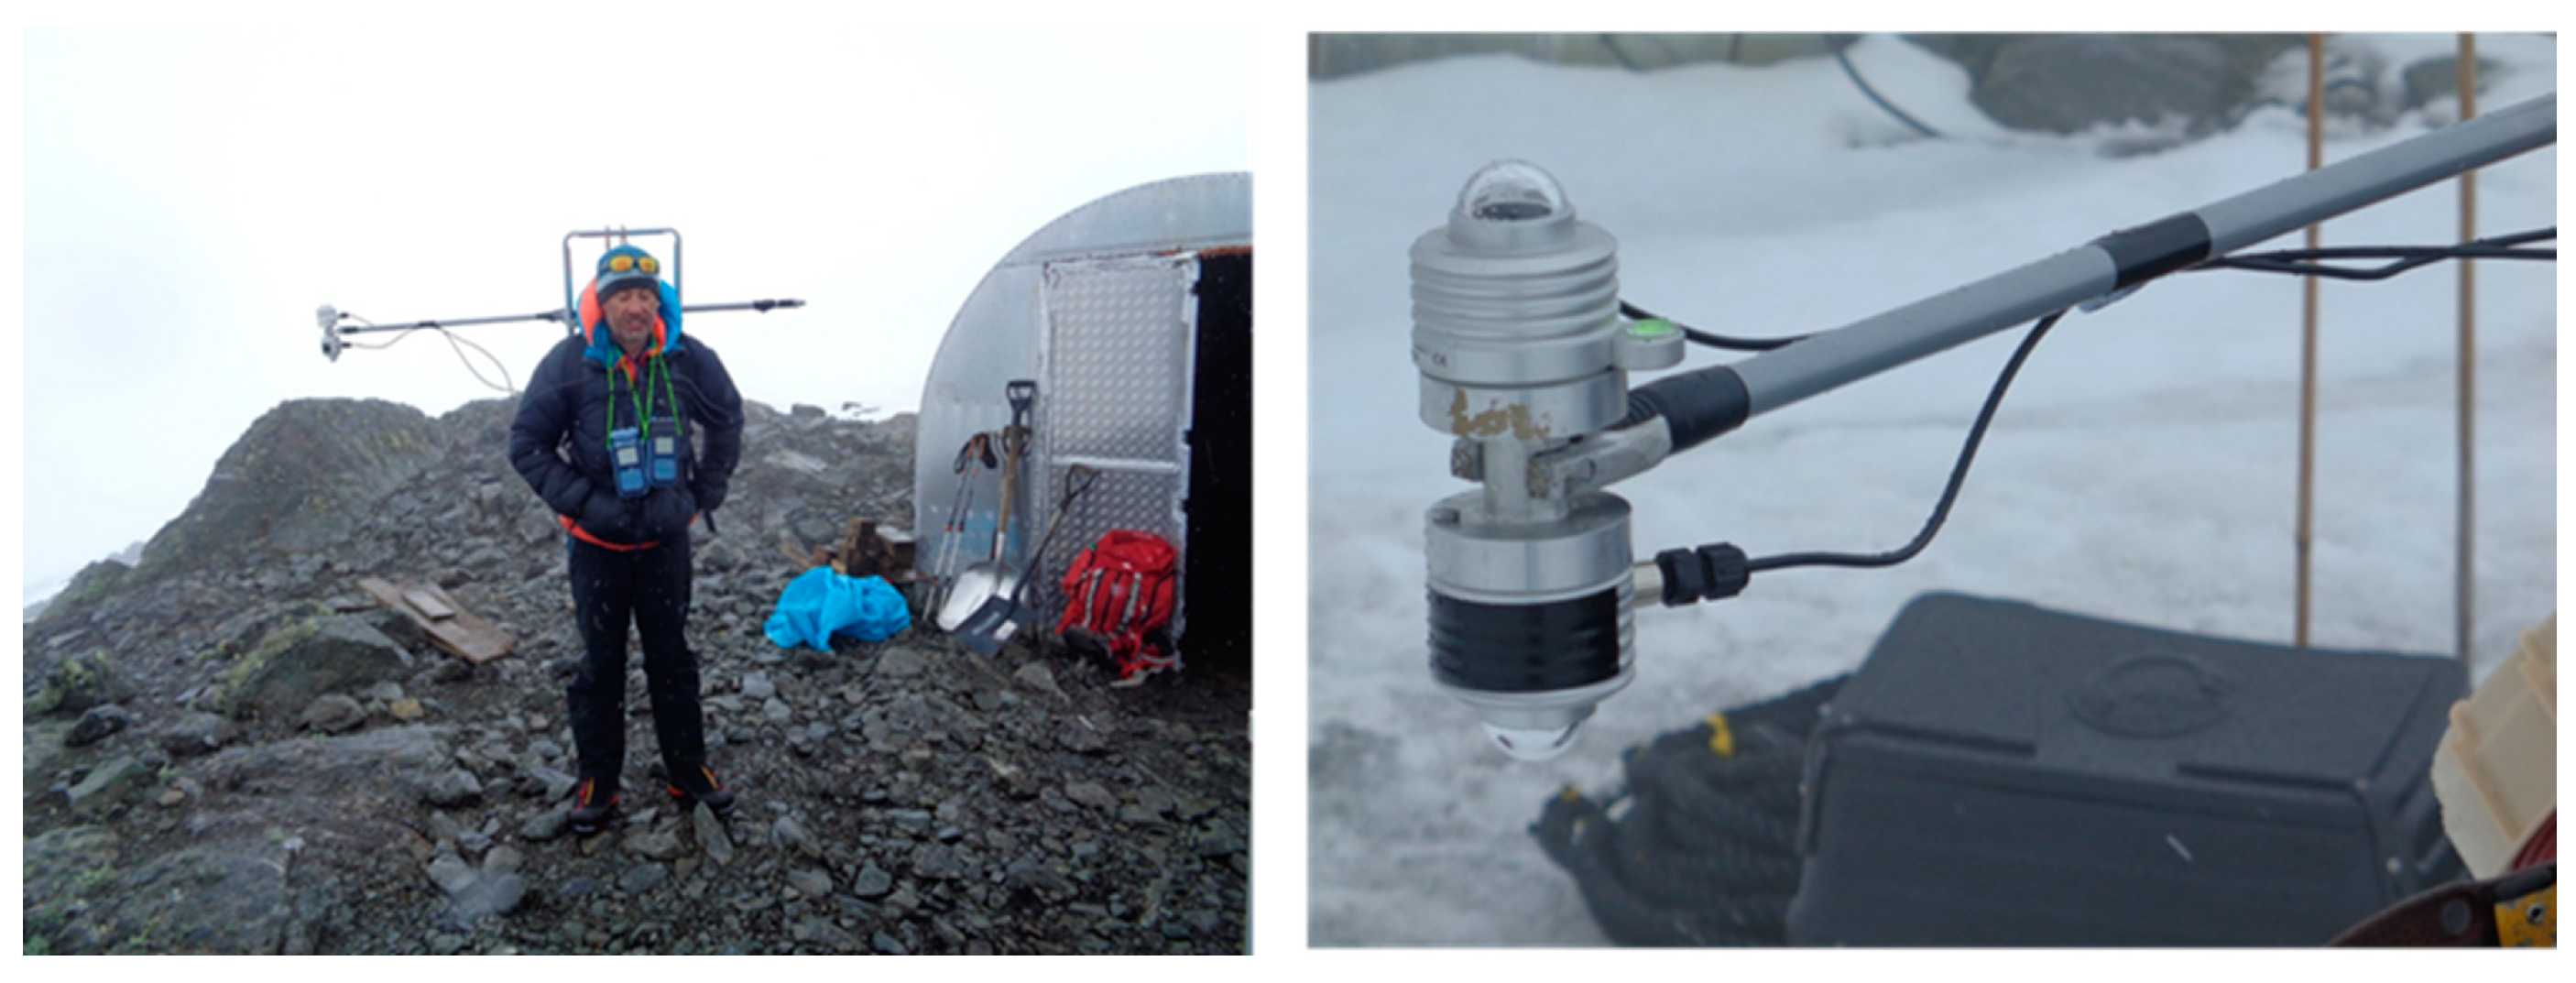
For the purpose of studying the sensitivity of the portable albedometer, we carried out five experiments:
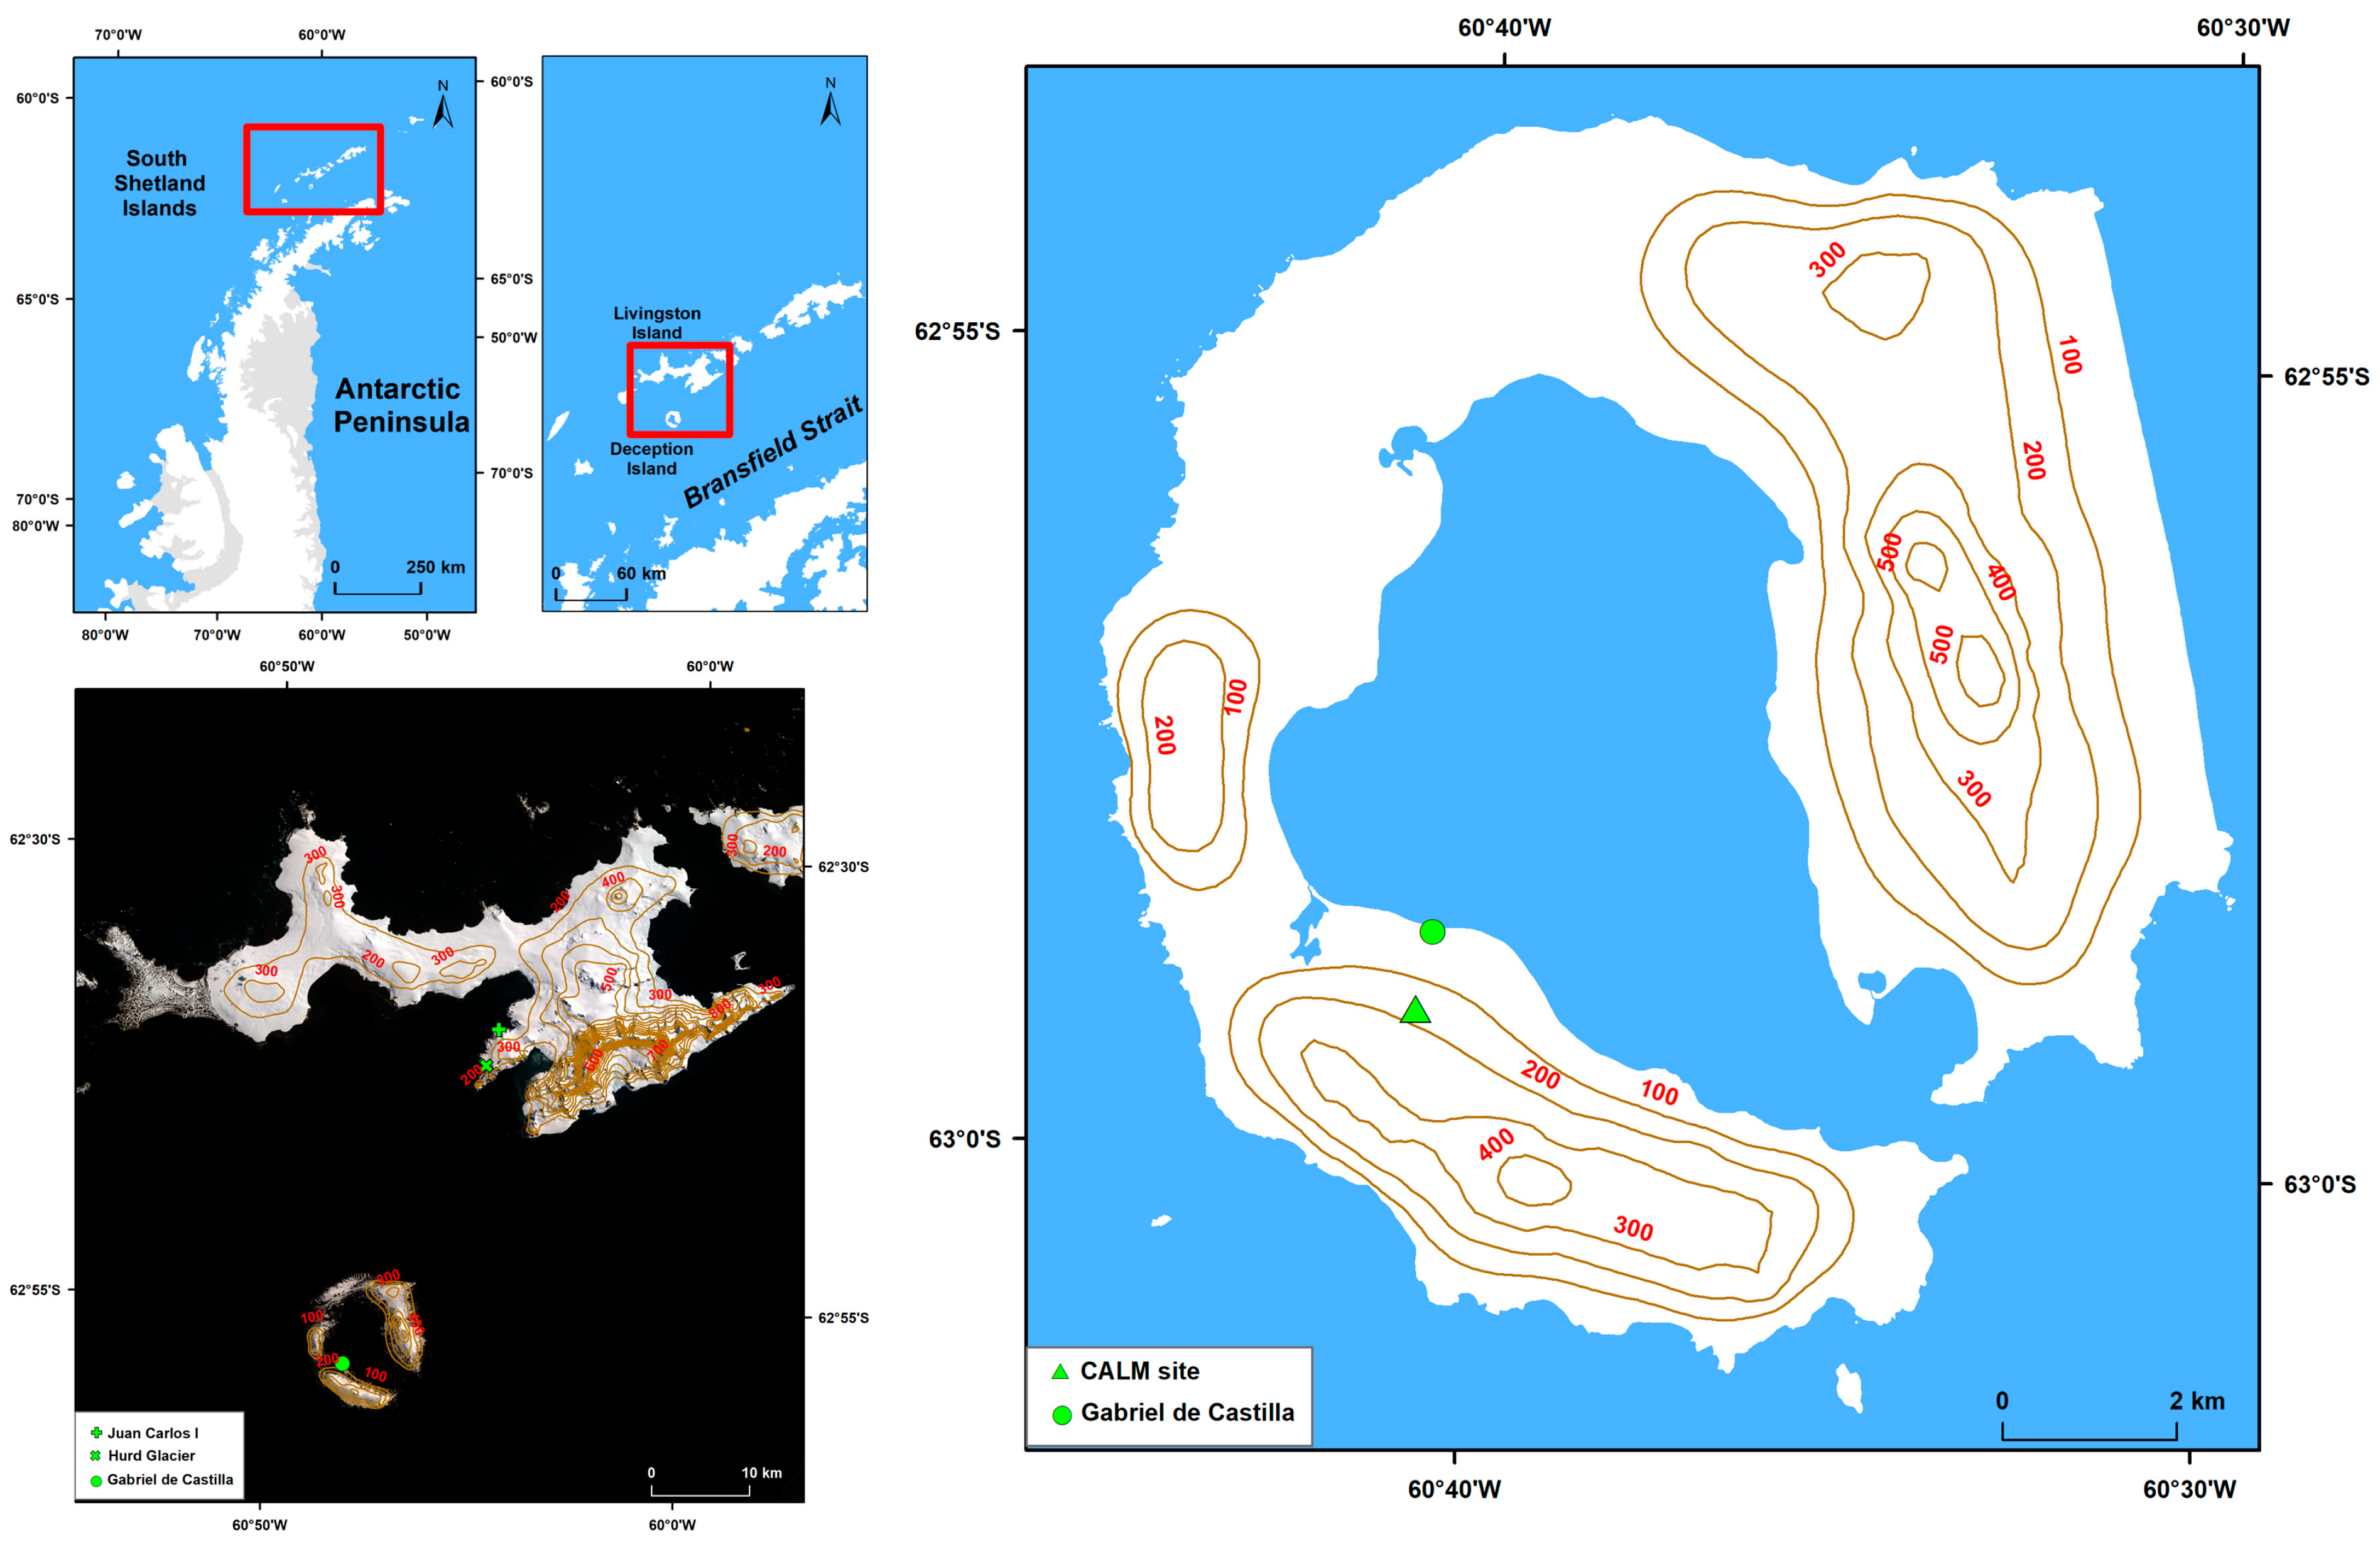
Experiment A.—Standing still on bare soil. Pyranometers carried on the shoulders. 31 January 2019. Close to the AWS at JCI station. Overcast sky, 327 samples (27 min).
Experiment B.—Standing still on bare soil. Pyranometers carried on the shoulders. 31 January 2019. Close to the AWS at JCI station. Overcast sky. Very stable incident irradiance, 73 samples (6 min).
Experiment C.—Standing still on bare soil. Pyranometers carried on the shoulders. 1 February 2019. Close to the AWS at JCI station. Clear sky with clouds, large fluctuations in incident irradiance, 367 samples (31 min).
Experiment D.—Standing still on clean snow. Pyranometers carried on the shoulders. 25 January 2019. Close to the AWS at Hurd Glacier, Livingston Island. Clear sky. Very stable incident irradiance, 100 samples (8 min).
Experiment E.—Standing still on clean snow. Pyranometers carried on the shoulders. 1 February 2019. Close to the AWS at Hurd Glacier, Livingston Island. Overcast sky, 120 samples (10 min).
The surface cover at the AWS close to JCI station is bare soil between January and March; the surface cover at the AWS on Hurd Glacier is snow or ice all year round. Both AWSs provide the incident irradiance, reflected irradiance, and albedo every 10 min.
- (1)
Estimation of fluctuations due to incident irradiance fluctuations
We analyze the incident irradiance, the reflected irradiance, and the albedo measured with the portable albedometer from Experiments A, B, C, D, and E. The data from the AWSs are not used at this point. The results are shown in
Table A2.
Table A2.
Results of the sensitivity experiments A, B, C, D, and E run in the proximity of the AWSs. Exp means experiment. CV = coefficient of variance calculated as the ratio of the standard deviation to the mean.
Table A2.
Results of the sensitivity experiments A, B, C, D, and E run in the proximity of the AWSs. Exp means experiment. CV = coefficient of variance calculated as the ratio of the standard deviation to the mean.
| Exp | | Incident (W/m2) | Reflected (W/m2) | Albedo |
|---|
| A | Mean | 566 | 59 | 0.104 |
| Standard deviation | 34 | 3 | 0.003 |
| CV (%) | 6 | 5 | 3 |
| B | Mean | 556 | 59 | 0.106 |
| Standard deviation | 5 | 2 | 0.002 |
| CV (%) | 1 | 3 | 2 |
| C | Mean | 568 | 62 | 0.108 |
| Standard deviation | 160 | 20 | 0.007 |
| CV (%) | 28 | 3 | 7 |
| D | Mean | 821 | 440 | 0.540 |
| Standard deviation | 5 | 3 | 0.004 |
| CV (%) | <1 | <1 | <1 |
| E | Mean | 466 | 266 | 0.571 |
| Standard deviation | 31 | 17 | 0.006 |
| CV (%) | 7 | 6 | 1 |
The results show that:
- (a)
As long as the coefficient of variance (CV) of the incident irradiance is below 7%, the standard deviation of albedo is below 0.003 for bare soil (Experiments A and B) and below 0.004 for snow (Experiment D). For other cover types consisting of a mixture of bare soil and snow, we assume values in between these two values. This means that when working with a dataset with a CV of the incident irradiance of 6% or less, variations of albedo above 0.003 for bare soil and above 0.004 for snow can be attributed to changes in the surface.
- (b)
According to Experiments B and D (both correspond to very stable incident irradiance), we see that the noise of the portable albedometer (internal noise of the pyranometers plus noise caused by uncontrolled tilt of the pyranometers due to tiredness of the researcher or tilting of the body of the researcher over time, like, for example, when standing on snow) causes variations in albedo below 0.004. Variations above 0.004 under stable illumination must be caused by changes in the surface.
- (2)
Estimation of biased uncertainties caused by the experimental set-up (pyranometers model, influence of the body of the researcher carrying the pyranometers).
In this case, the results obtained with the portable albedometer in Experiments D and E were averaged and compared to those acquired by the AWSs. We take the data from the AWS as truth. Unfortunately, the AWS at JCI does not provide any data for the dates of Experiments A, B, and C, so the biased uncertainties could only be tested on snow. The results are shown in
Table A3 below.
Table A3.
Results of Experiments D and E. Ratio is the ratio of the data from the portable albedometer to the data from the AWS. Exp means experiment. The relative difference is calculated as (Portable albedometer—AWS)/AWS.
Table A3.
Results of Experiments D and E. Ratio is the ratio of the data from the portable albedometer to the data from the AWS. Exp means experiment. The relative difference is calculated as (Portable albedometer—AWS)/AWS.
| Exp | | Incident (W/m2) | Reflected (W/m2) | Albedo |
|---|
| D | AWS | 847 | 513 | 0.606 |
| Portable albedometer | 820 | 441 | 0.538 |
| Ratio | 0.968 | 0.860 | 0.888 |
| Relative Difference | −0.032 | −0.140 | −0.112 |
| E | AWS | 554 | 354 | 0.639 |
| Portable albedometer | 488 | 278 | 0.570 |
| Ratio | 0.881 | 0.785 | 0.892 |
| Relative Difference | −0.119 | −0.215 | −0.108 |
The maximum difference in albedo is −11.2% (Experiment D). The relative difference is larger for the reflected irradiance than for the incident irradiance due to the blocking of light by the body of the researcher. On the other hand, although the difference in the reflected irradiance can be as high as 21.5% (Experiment E), this is compensated by the difference in the incident irradiance.
- (3)
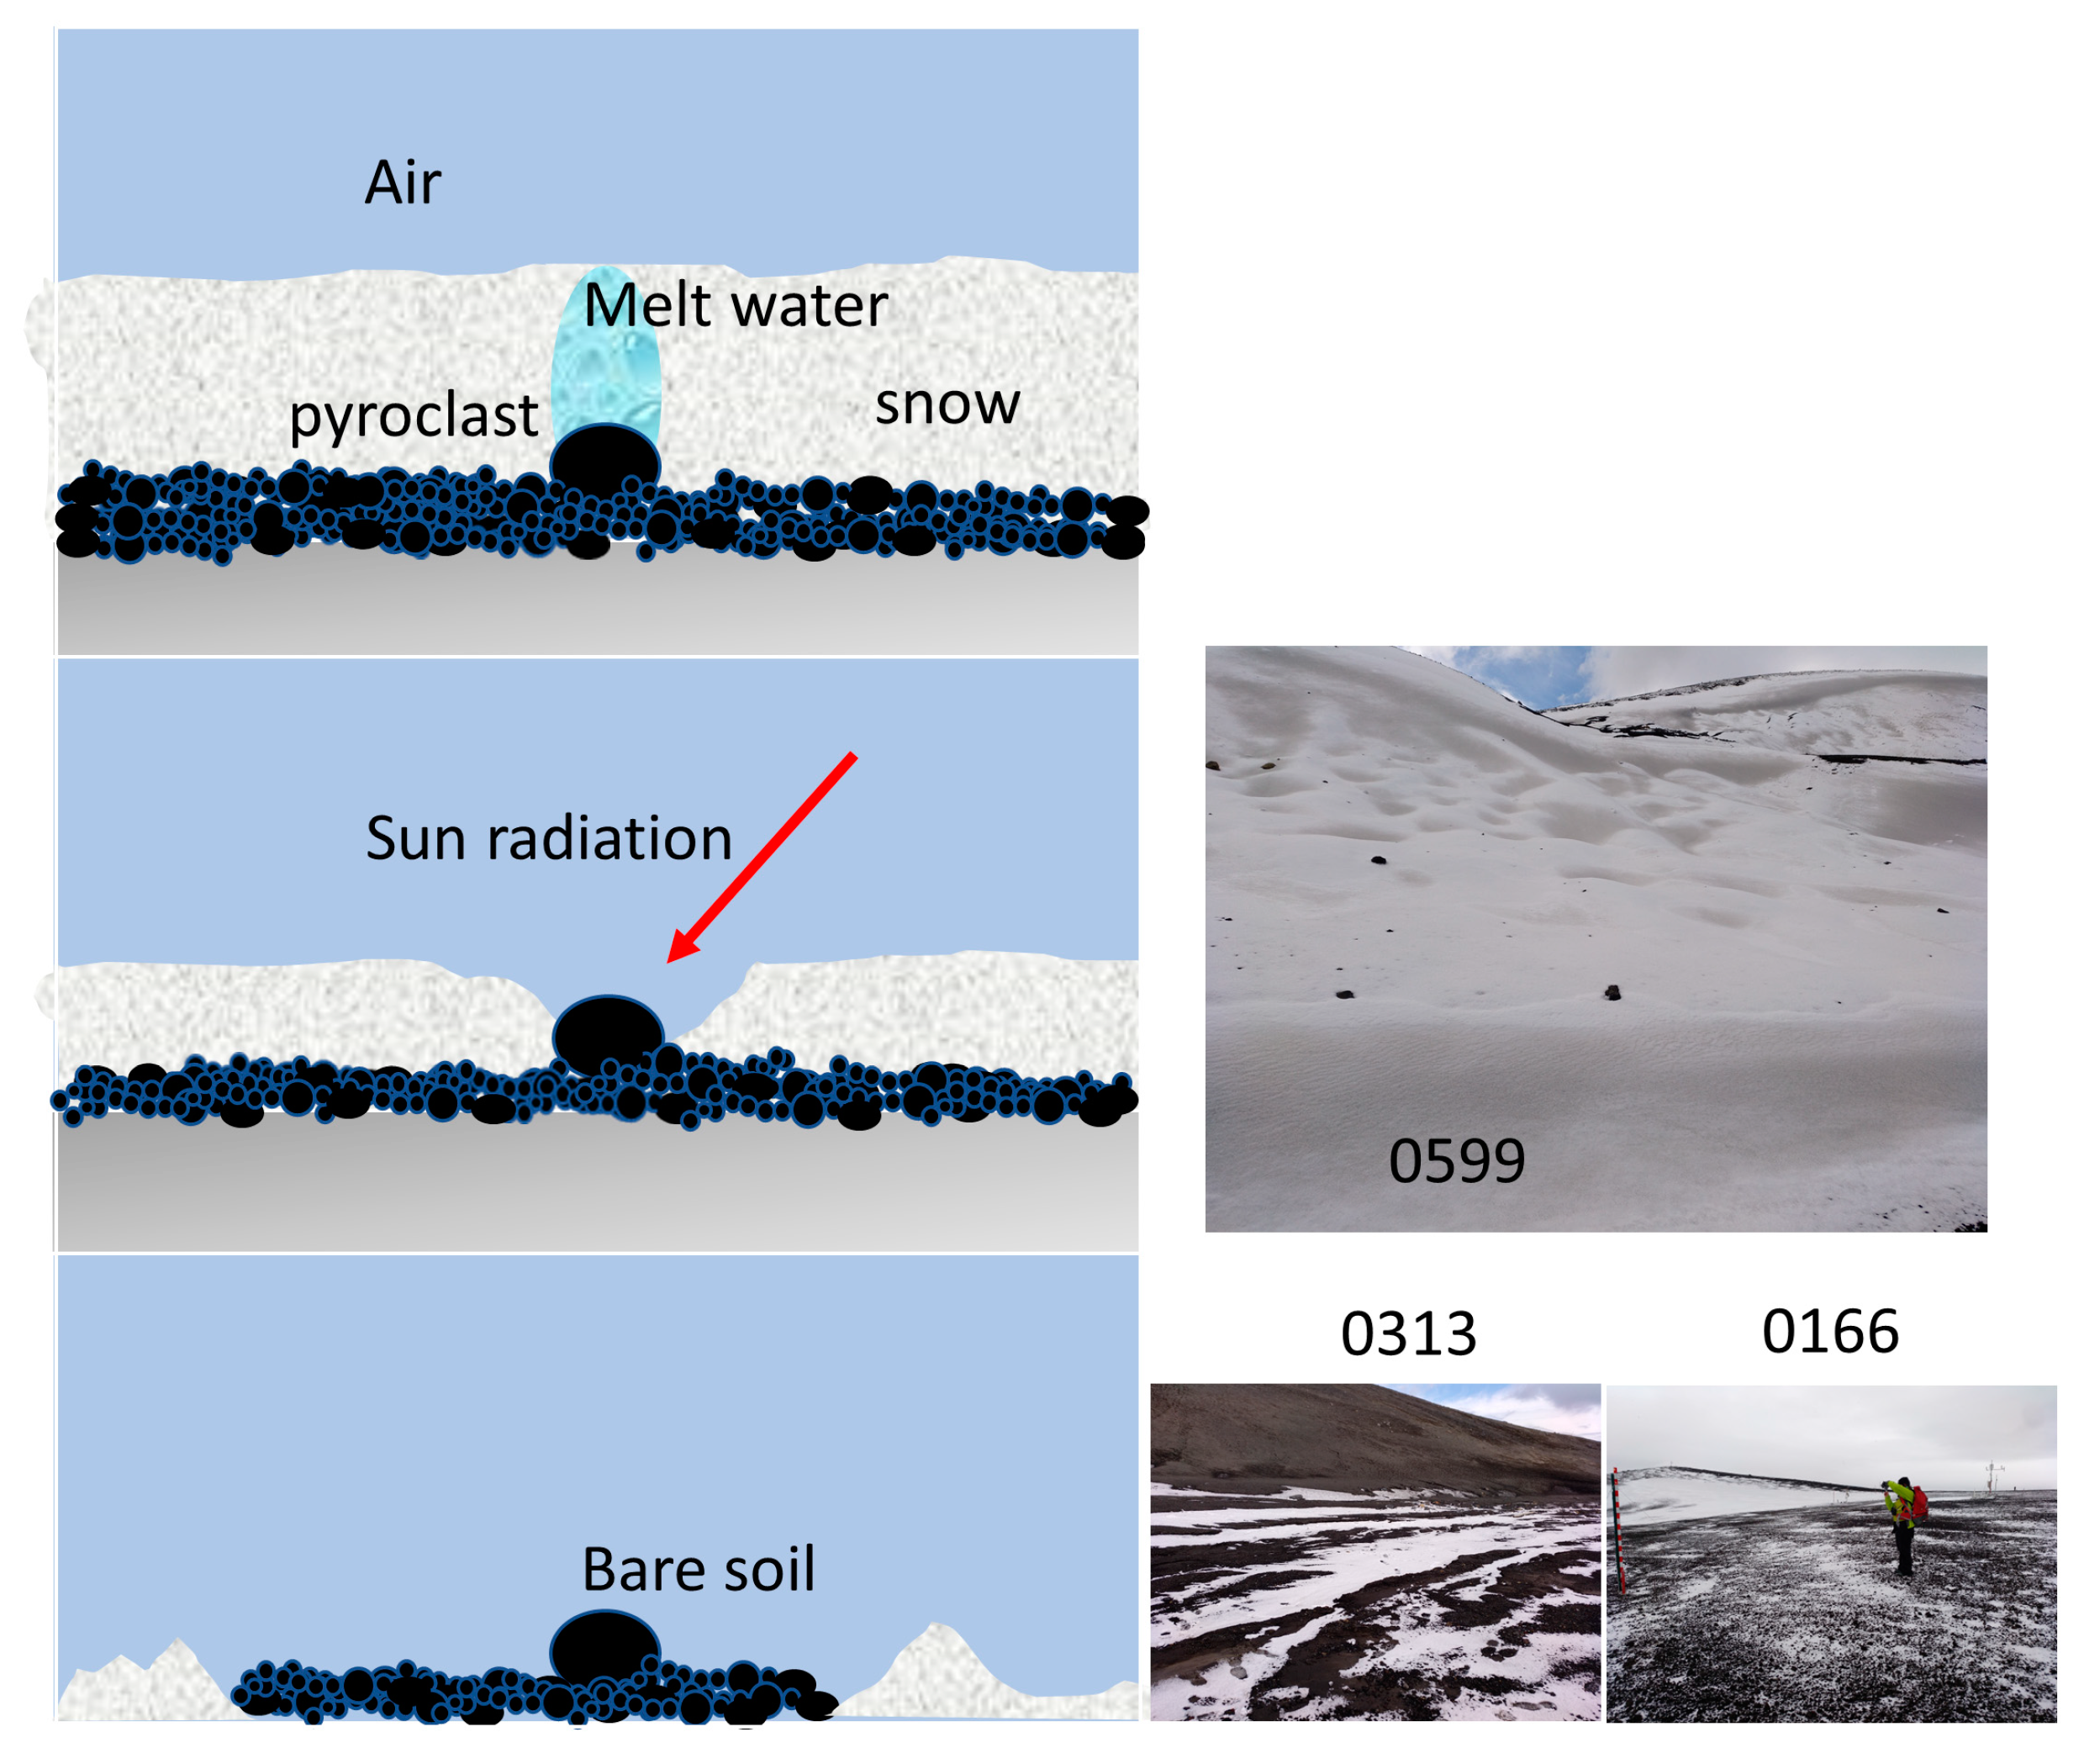
Effect of clouds
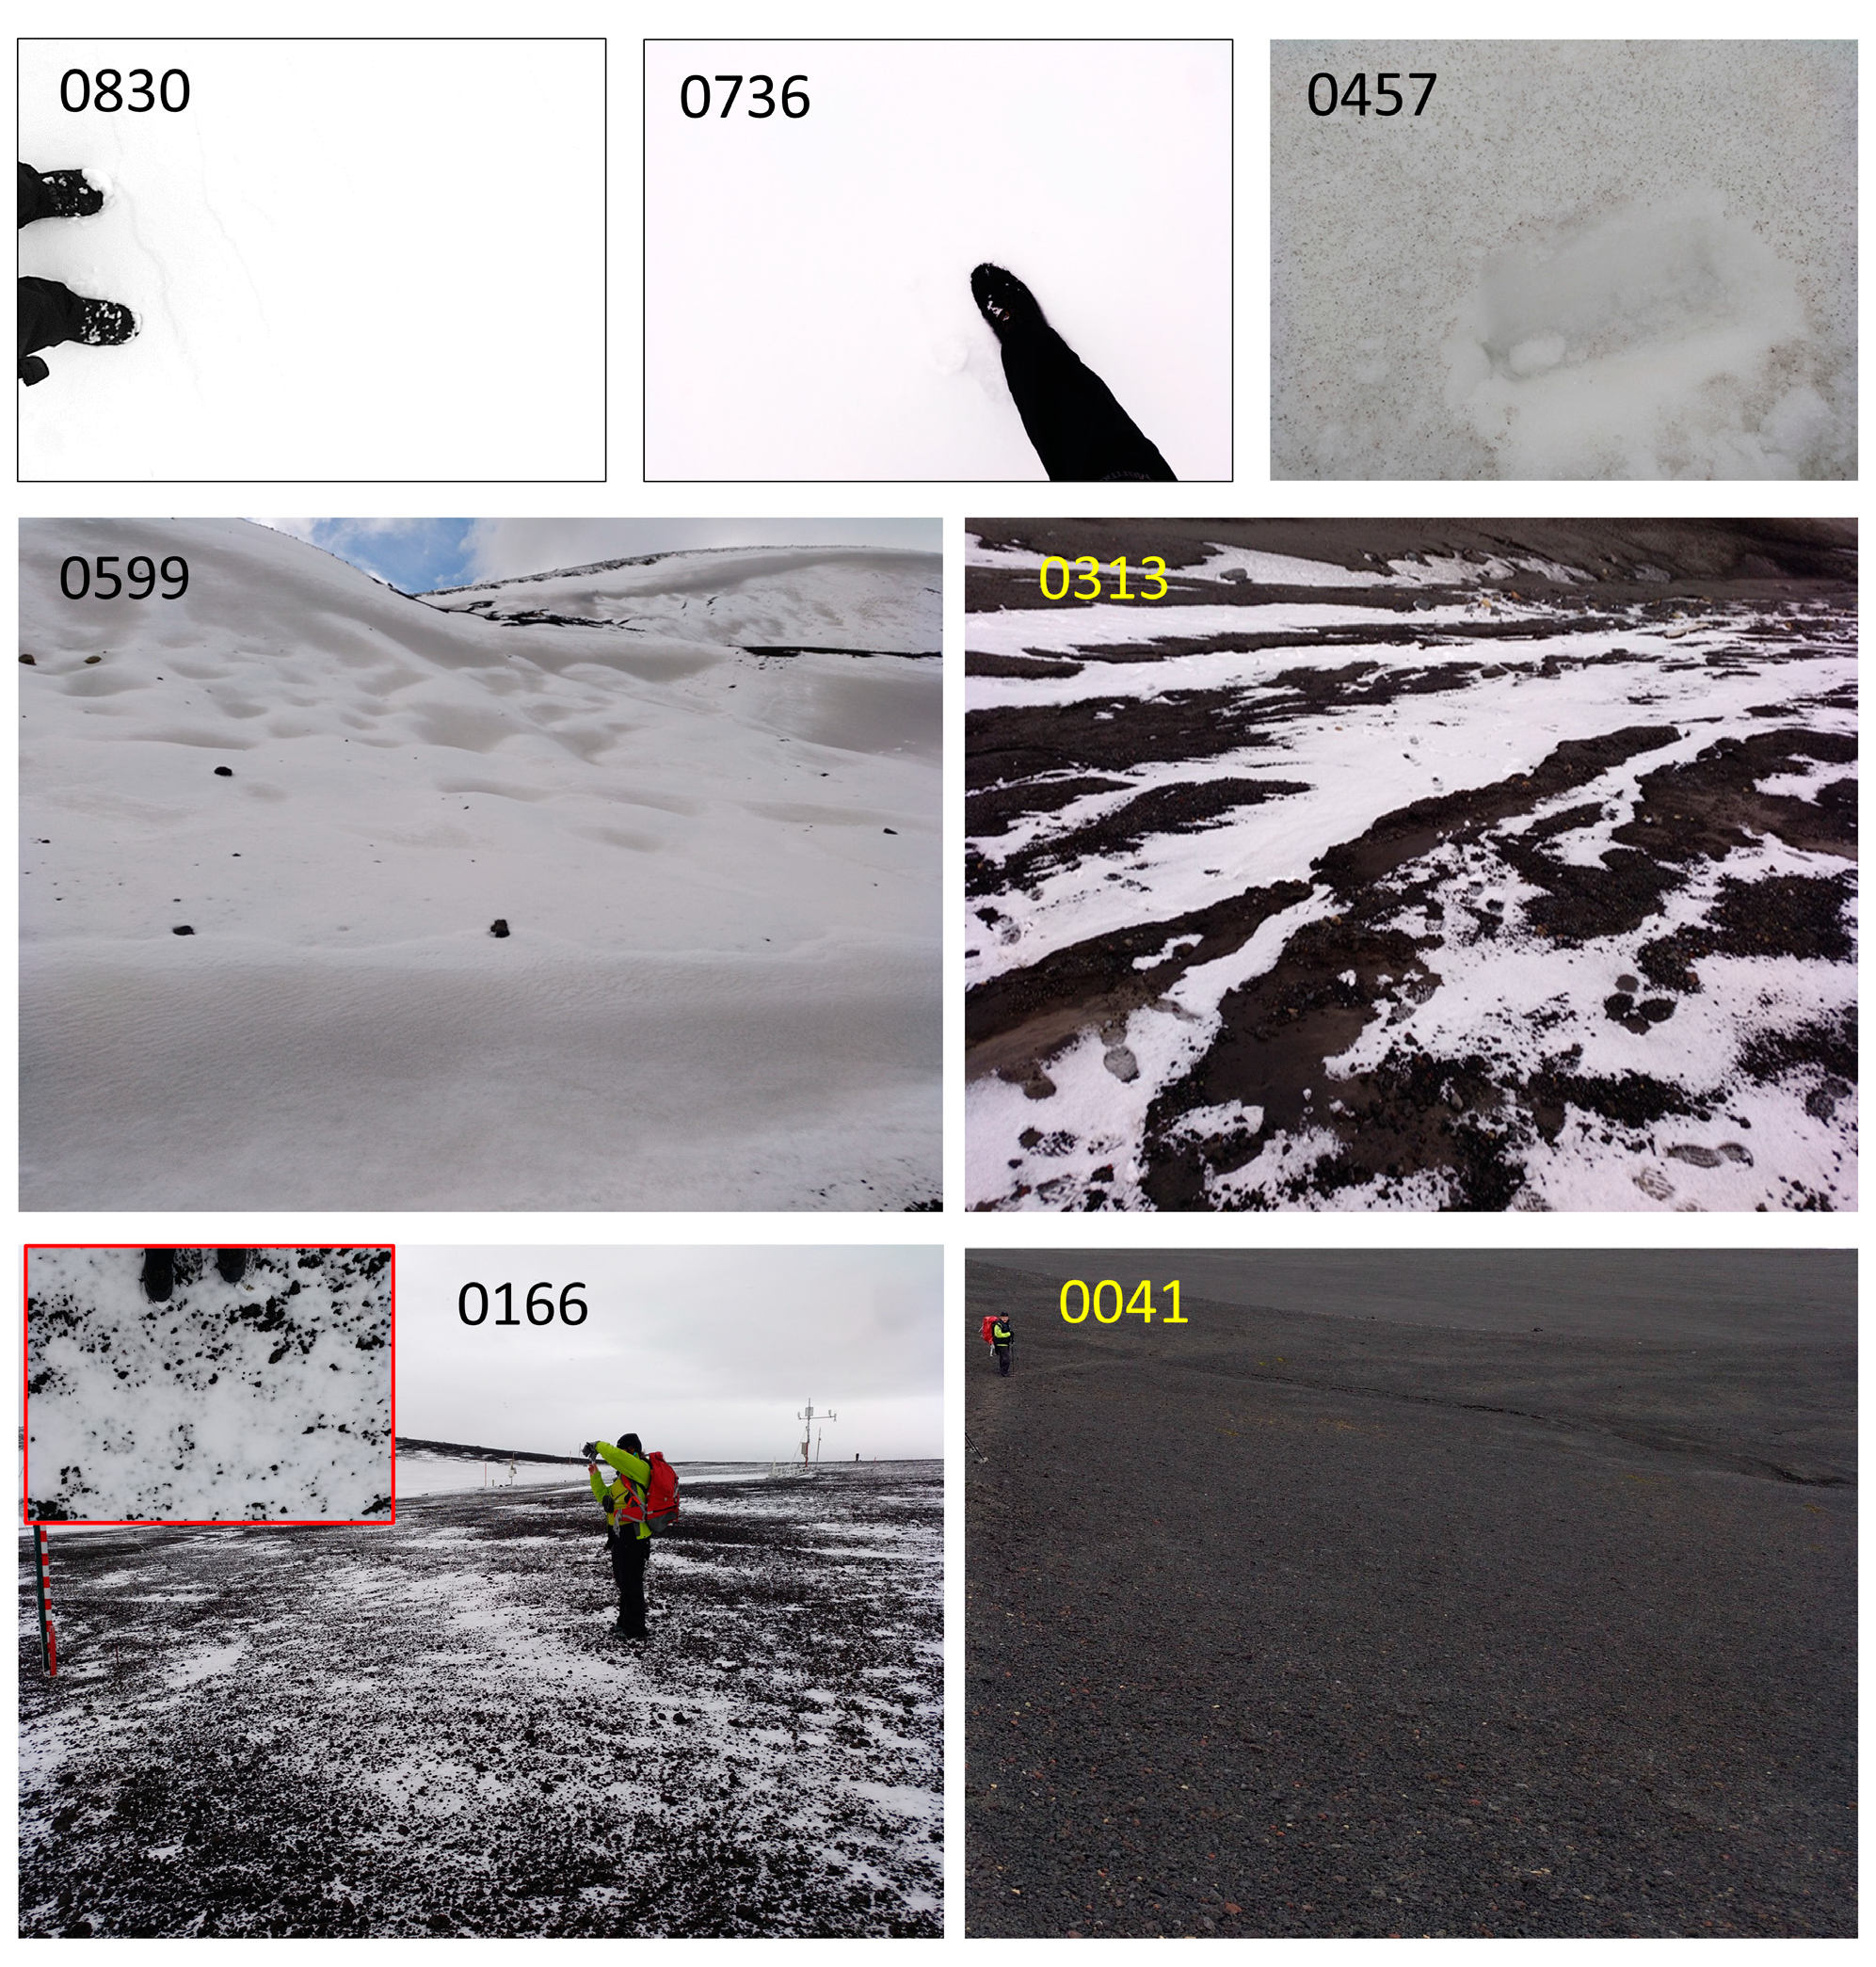
Because of time constraints and logistics during the Antarctic campaign, some of the field albedo measurements had to be performed under cloudy conditions. While snow albedo is very sensitive to clouds, that of bare soil is not. Clouds change the spectral composition of the incident radiation due to the strong absorption in the infrared part of the spectrum. Snow spectral albedo exhibits a great dependence on wavelengths, while soil spectral albedo depends very smoothly on wavelengths. Snow-covered landscape units (0457, 0599, 0736, and 0830) were corrected for cloudiness following the method proposed in a previous work [
36]. The method consists of calculating the albedo under a clear sky from the actually measured albedo as:
where
αclear is the albedo that would have been measured under a clear sky,
αcloud is the actually measured albedo, and n is the cloud index (
n = 1 means a completely overcast sky,
n = 0 means a completely clear sky). Equation (A1) can only be applied on snow-covered surfaces. The cloud index can be calculated from the cloud transmittance (
T) and the altitude above sea level of the observation site (h in m) using the relation:
with
A = 0.78 and
B = 0.00085 m
−1, empirically derived constants.
The value of T is calculated assuming that
where
E(cloud) is the actually measured irradiance and
E(clear) is the irradiance that would have been measured under clear-sky conditions. E(clear) depends on the Sun Zenith Angle
(SZA). To calculate
E(clear) at the time of the acquired
E(cloud), we used the measured irradiance on the closest date with clear-sky conditions. In our case, this happened on February 16, 2019.
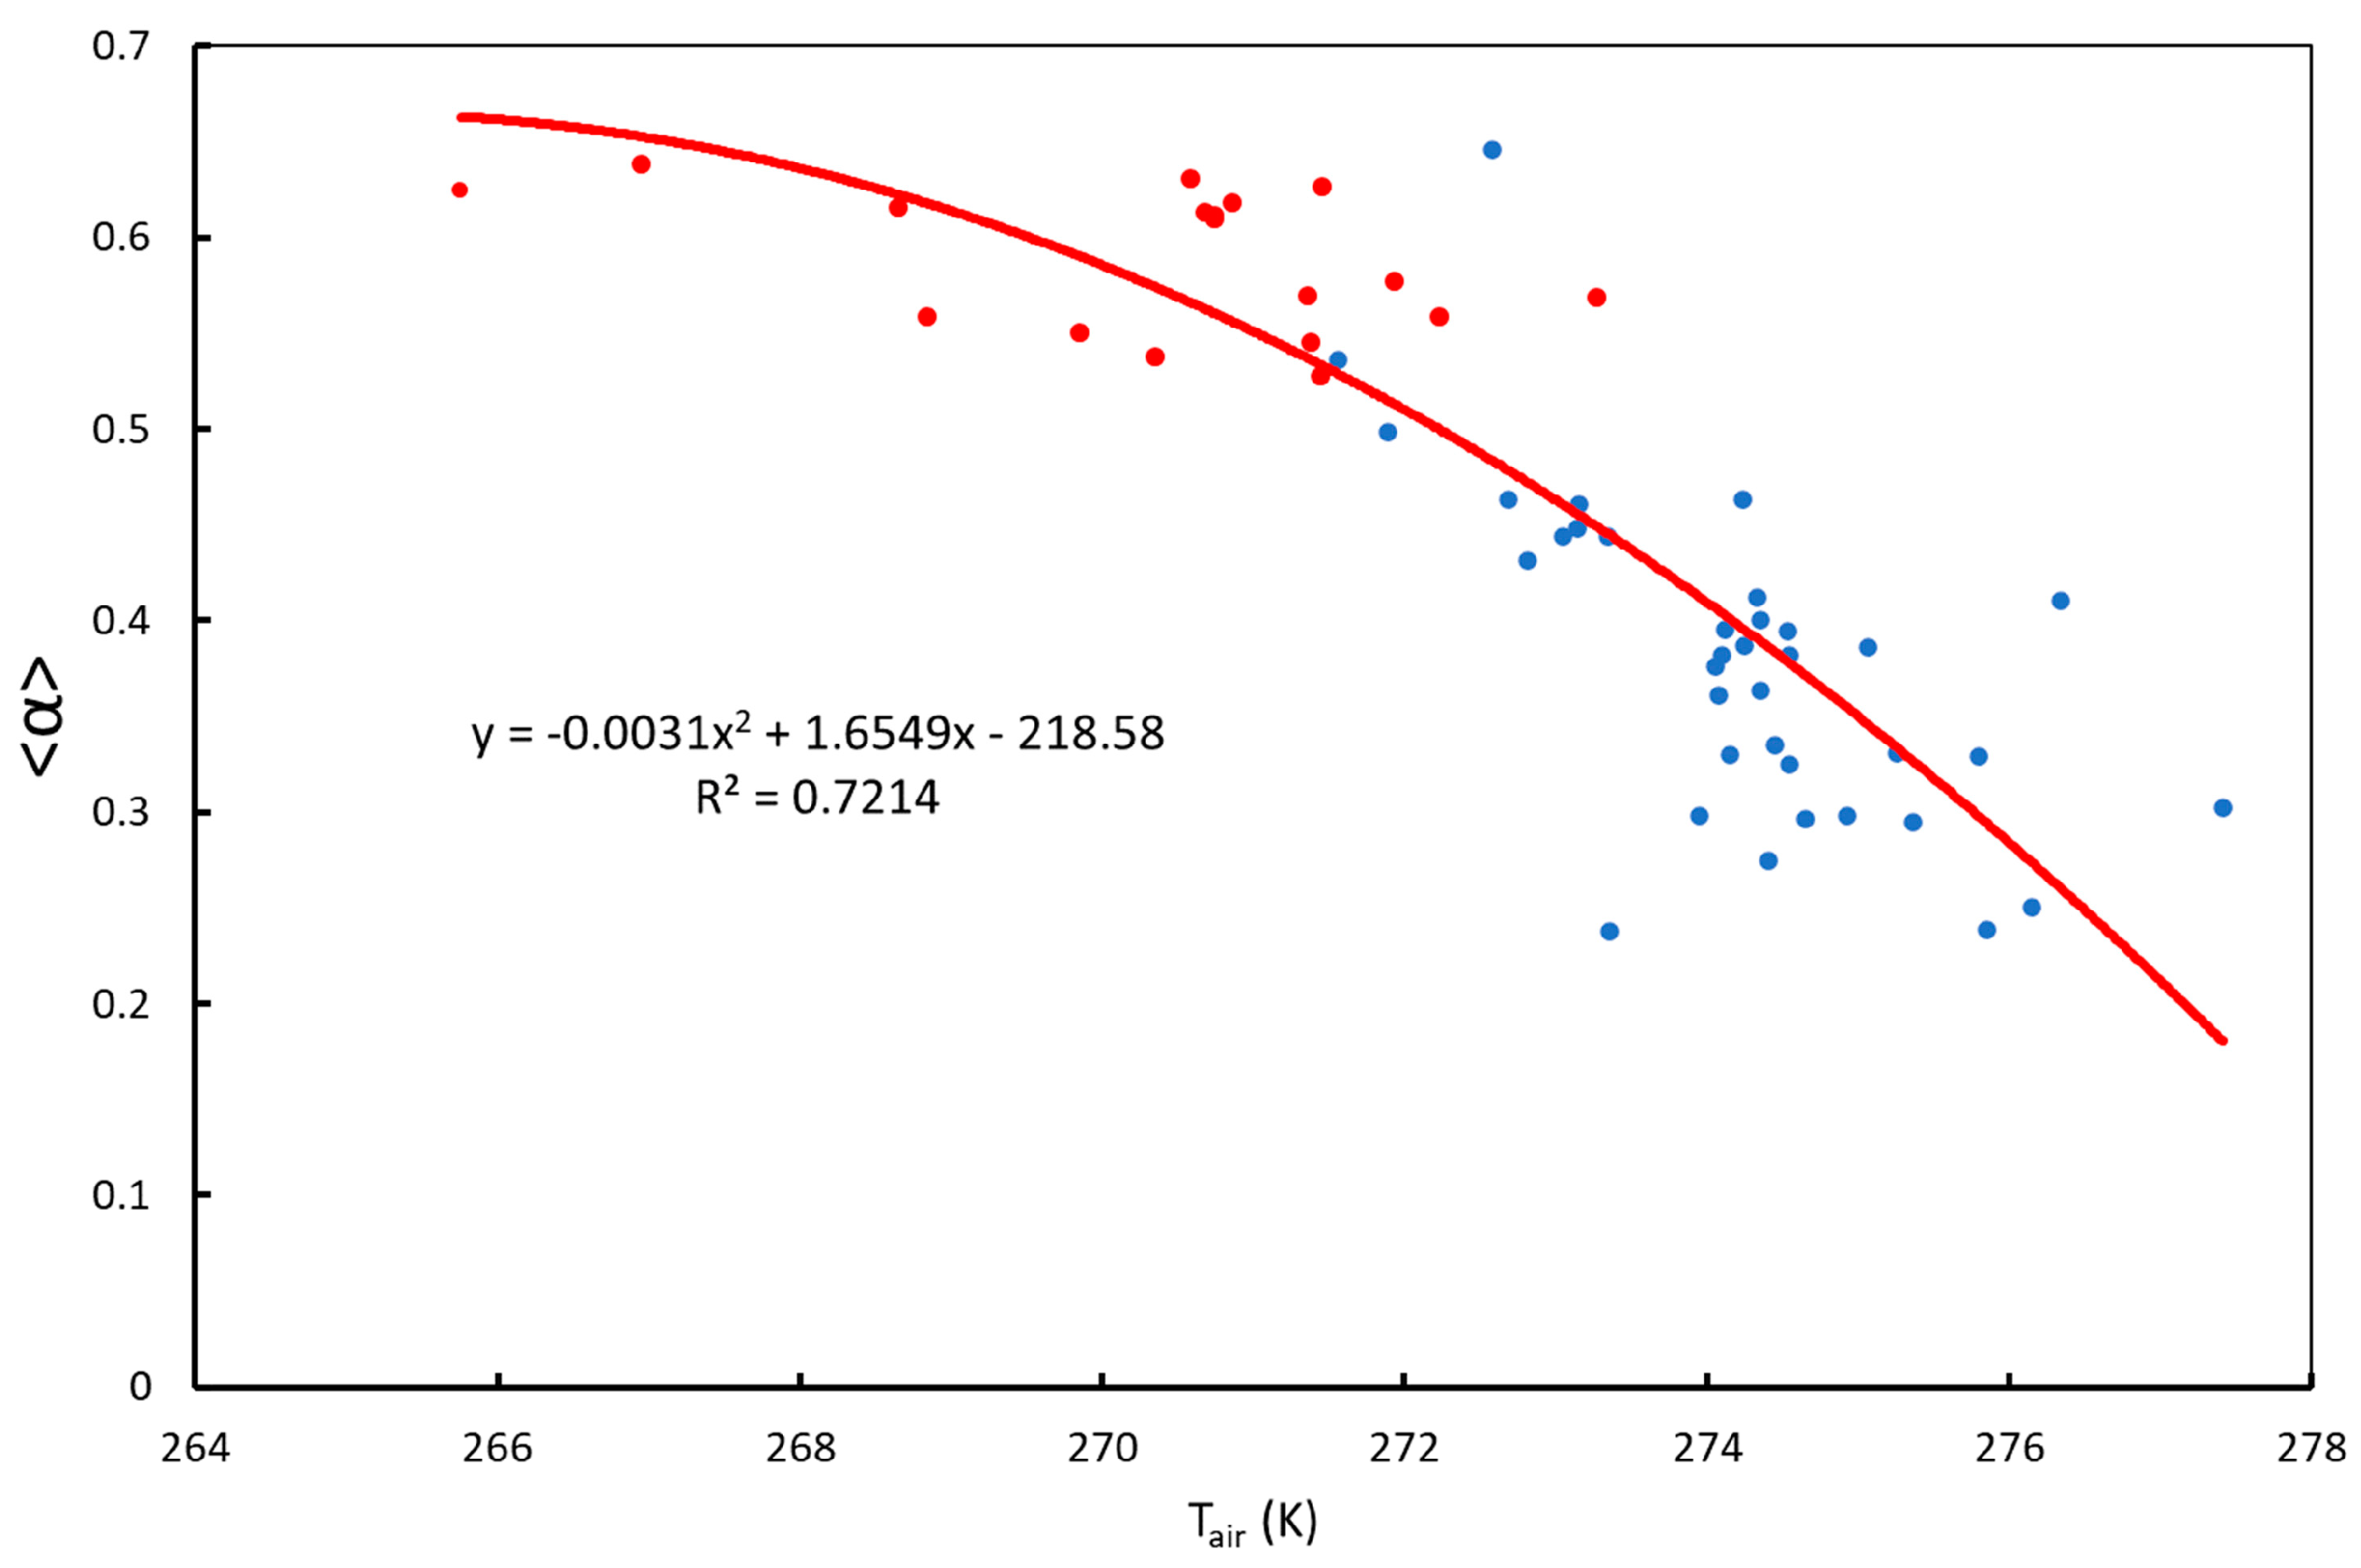
E(clear) at any time of the day was obtained by fitting hourly irradiance to the SZA:
From the fit, we obtained a = 1088 W/m2 and b = 1.7, with a coefficient of determination R2 = 0.97.
The results of the correction are shown in
Table A4.
Table A4.
Mean albedo and standard deviation of landscape units L = 0457, 0599, 0736, and 0830 before (measured) and after (corrected) the cloudiness correction. R. D. = relative difference measured as (Measured—Corrected)/Corrected.
Table A4.
Mean albedo and standard deviation of landscape units L = 0457, 0599, 0736, and 0830 before (measured) and after (corrected) the cloudiness correction. R. D. = relative difference measured as (Measured—Corrected)/Corrected.
| | | L | | |
|---|
| | 0457 | 0599 | 0736 | 0830 |
|---|
| | <α> | Σ | <α> | σ | <α> | σ | <α> | σ |
|---|
| Corrected | 0.437 | 0.016 | 0.578 | 0.041 | 0.722 | 0.014 | 0.805 | 0.016 |
| Measured | 0.457 | 0.018 | 0.599 | 0.040 | 0.736 | 0.013 | 0.830 | 0.016 |
| R. D. | 0.05 | 0.10 | 0.04 | −0.02 | 0.02 | −0.07 | 0.03 | 0.00 |
The effect of clouds is an increase in the albedo mean between 2% and 5% and a variation in the standard deviation between −7% and 10%. We assume that the correction for bare soil due to clouds is negligible. The correction for mixtures of bare soil and snow cannot be quantified, but we assume that it is below that obtained for surfaces completely covered by snow.
In summary, we have calculated the effect of the experimental set-up and clouds on snow-covered surfaces. The effect of the experimental set-up is a decrease in the measured albedo with respect to that from the AWSs, with a maximum decrease of −11.2%. On the other hand, clouds produce an increase in the measured albedo with respect to the cloud-free one in the range from 2% to 5% and an uncertainty in the standard deviation in the range from −7% to 10%. It has been impossible to calculate the correction due to these factors on the rest of the landscape units: on the one hand, the AWS at JCI (bare soil) does not provide data for the dates of the experiments; on the other hand, a procedure to correct albedo measurements for the effect of clouds is only known for a snow-covered surface. We think it would not be a good procedure to correct some surfaces and not others.
- (4)
Impact of corrections
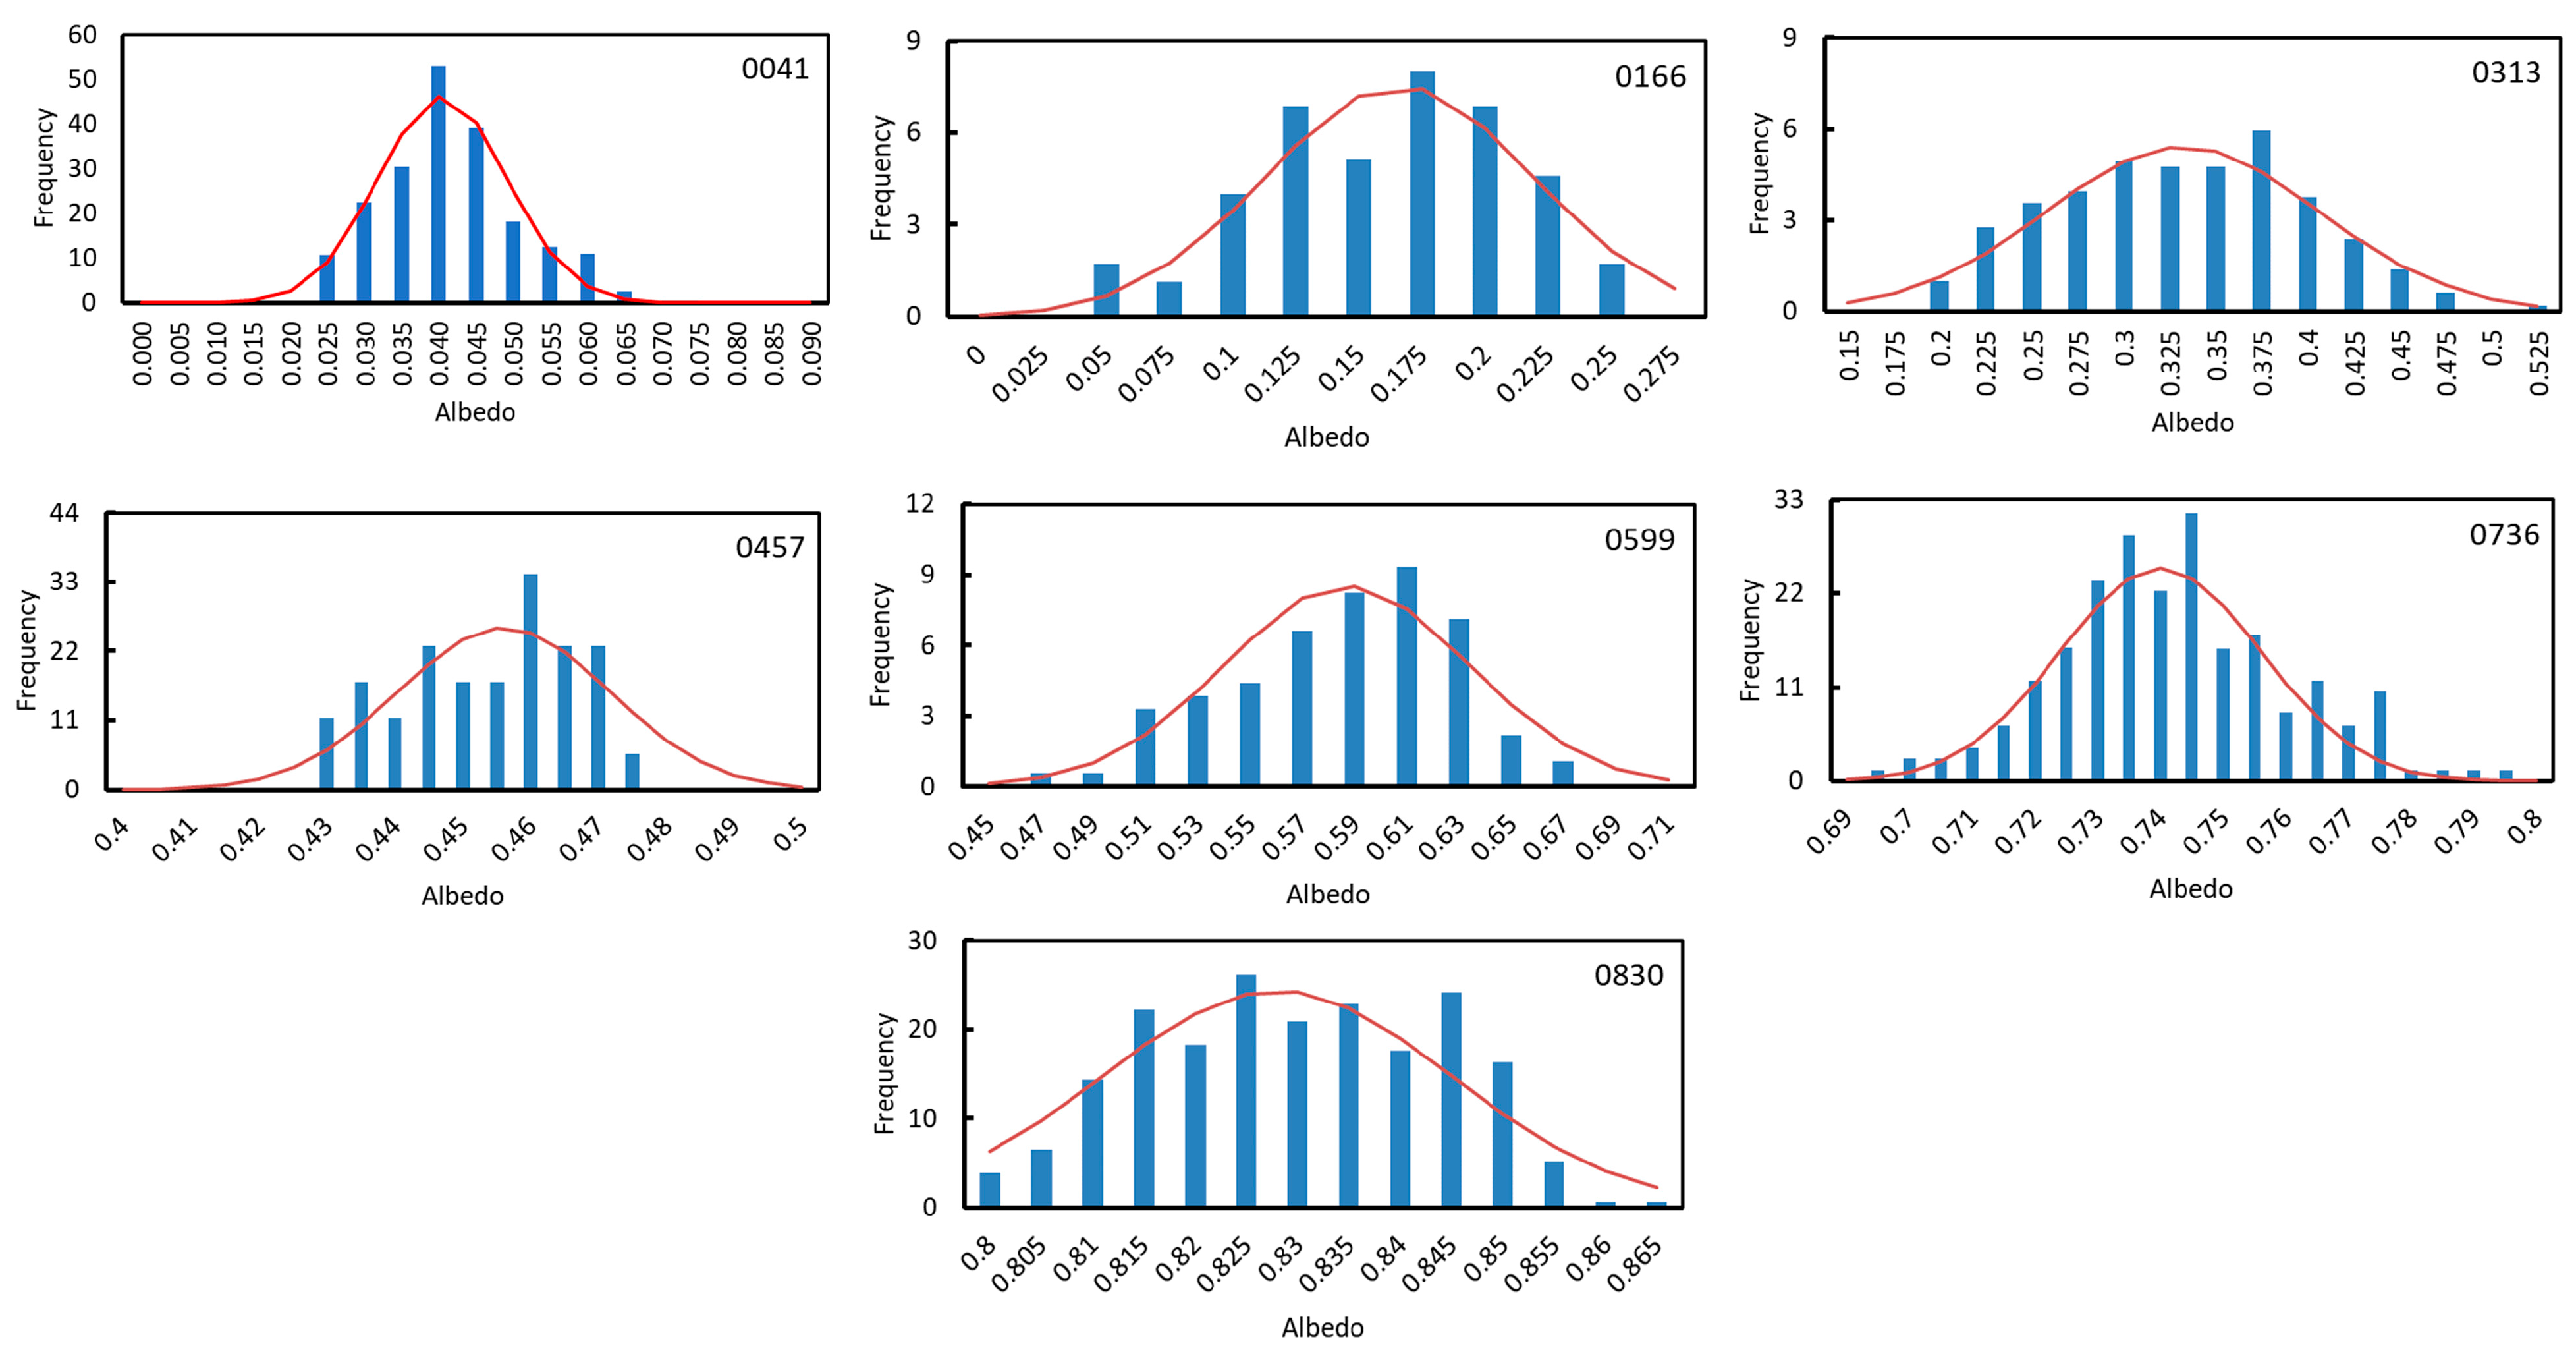
To estimate the impact of bias and clouds on the results, we assume that landscape units 0041, 0166, and 0313 are only affected by the bias due the experimental set-up, and landscape units 0457, 0599, 0736, and 0830 are affected by bias and by cloudiness. We assume that bias provokes a decrease in albedo of 11.2% (the maximum observed) for all the landscape units, while clouds provoke the increase in albedo and the variation in the standard deviation shown in
Table A4. Taking account all of these corrections, we assume that the corrected landscape units are the ones shown in
Table A5 (the identification codes are the same as in the main body of the manuscript).
Table A5.
Landscape unit code (L), mean albedo (μL), and standard deviation (σL) of the normal distribution of each landscape unit after correction for cloudiness and bias due to the experimental set-up.
Table A5.
Landscape unit code (L), mean albedo (μL), and standard deviation (σL) of the normal distribution of each landscape unit after correction for cloudiness and bias due to the experimental set-up.
| L | Description | μL | σL |
|---|
| 0830 | Clean fresh snow | 0.898 | 0.016 |
| 0736 | Clean old snow | 0.804 | 0.014 |
| 0599 | Rugged landscape of snow and pyroclasts | 0.647 | 0.041 |
| 0457 | Dirty snow | 0.488 | 0.016 |
| 0313 | Stripes of bare soil and snow | 0.348 | 0.080 |
| 0166 | Shallow snow and bare soil holes | 0.185 | 0.053 |
| 0041 | Bare soil | 0.046 | 0.009 |
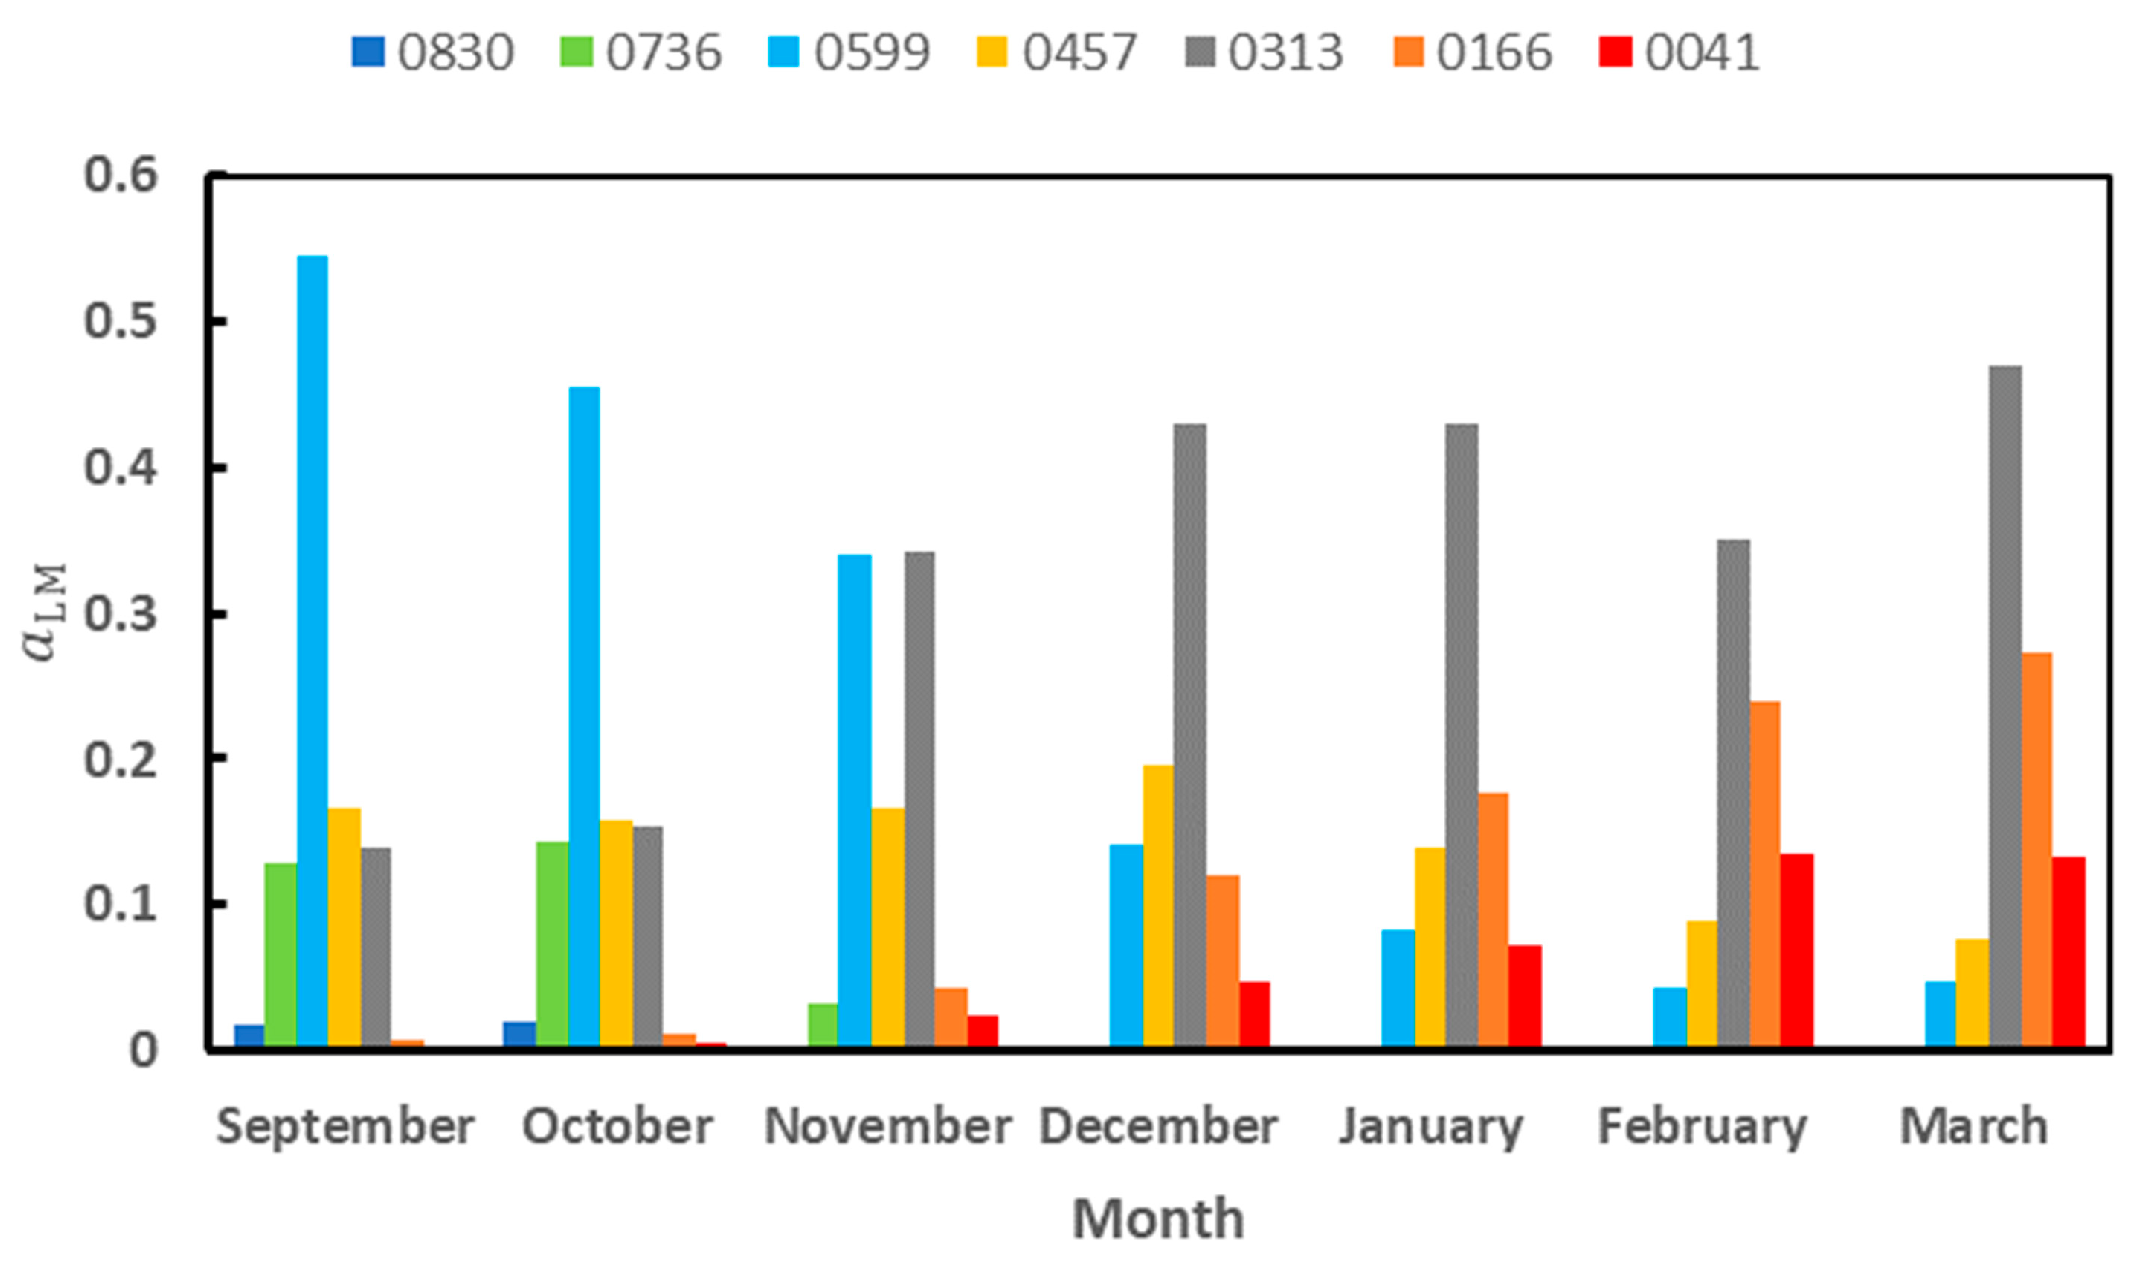
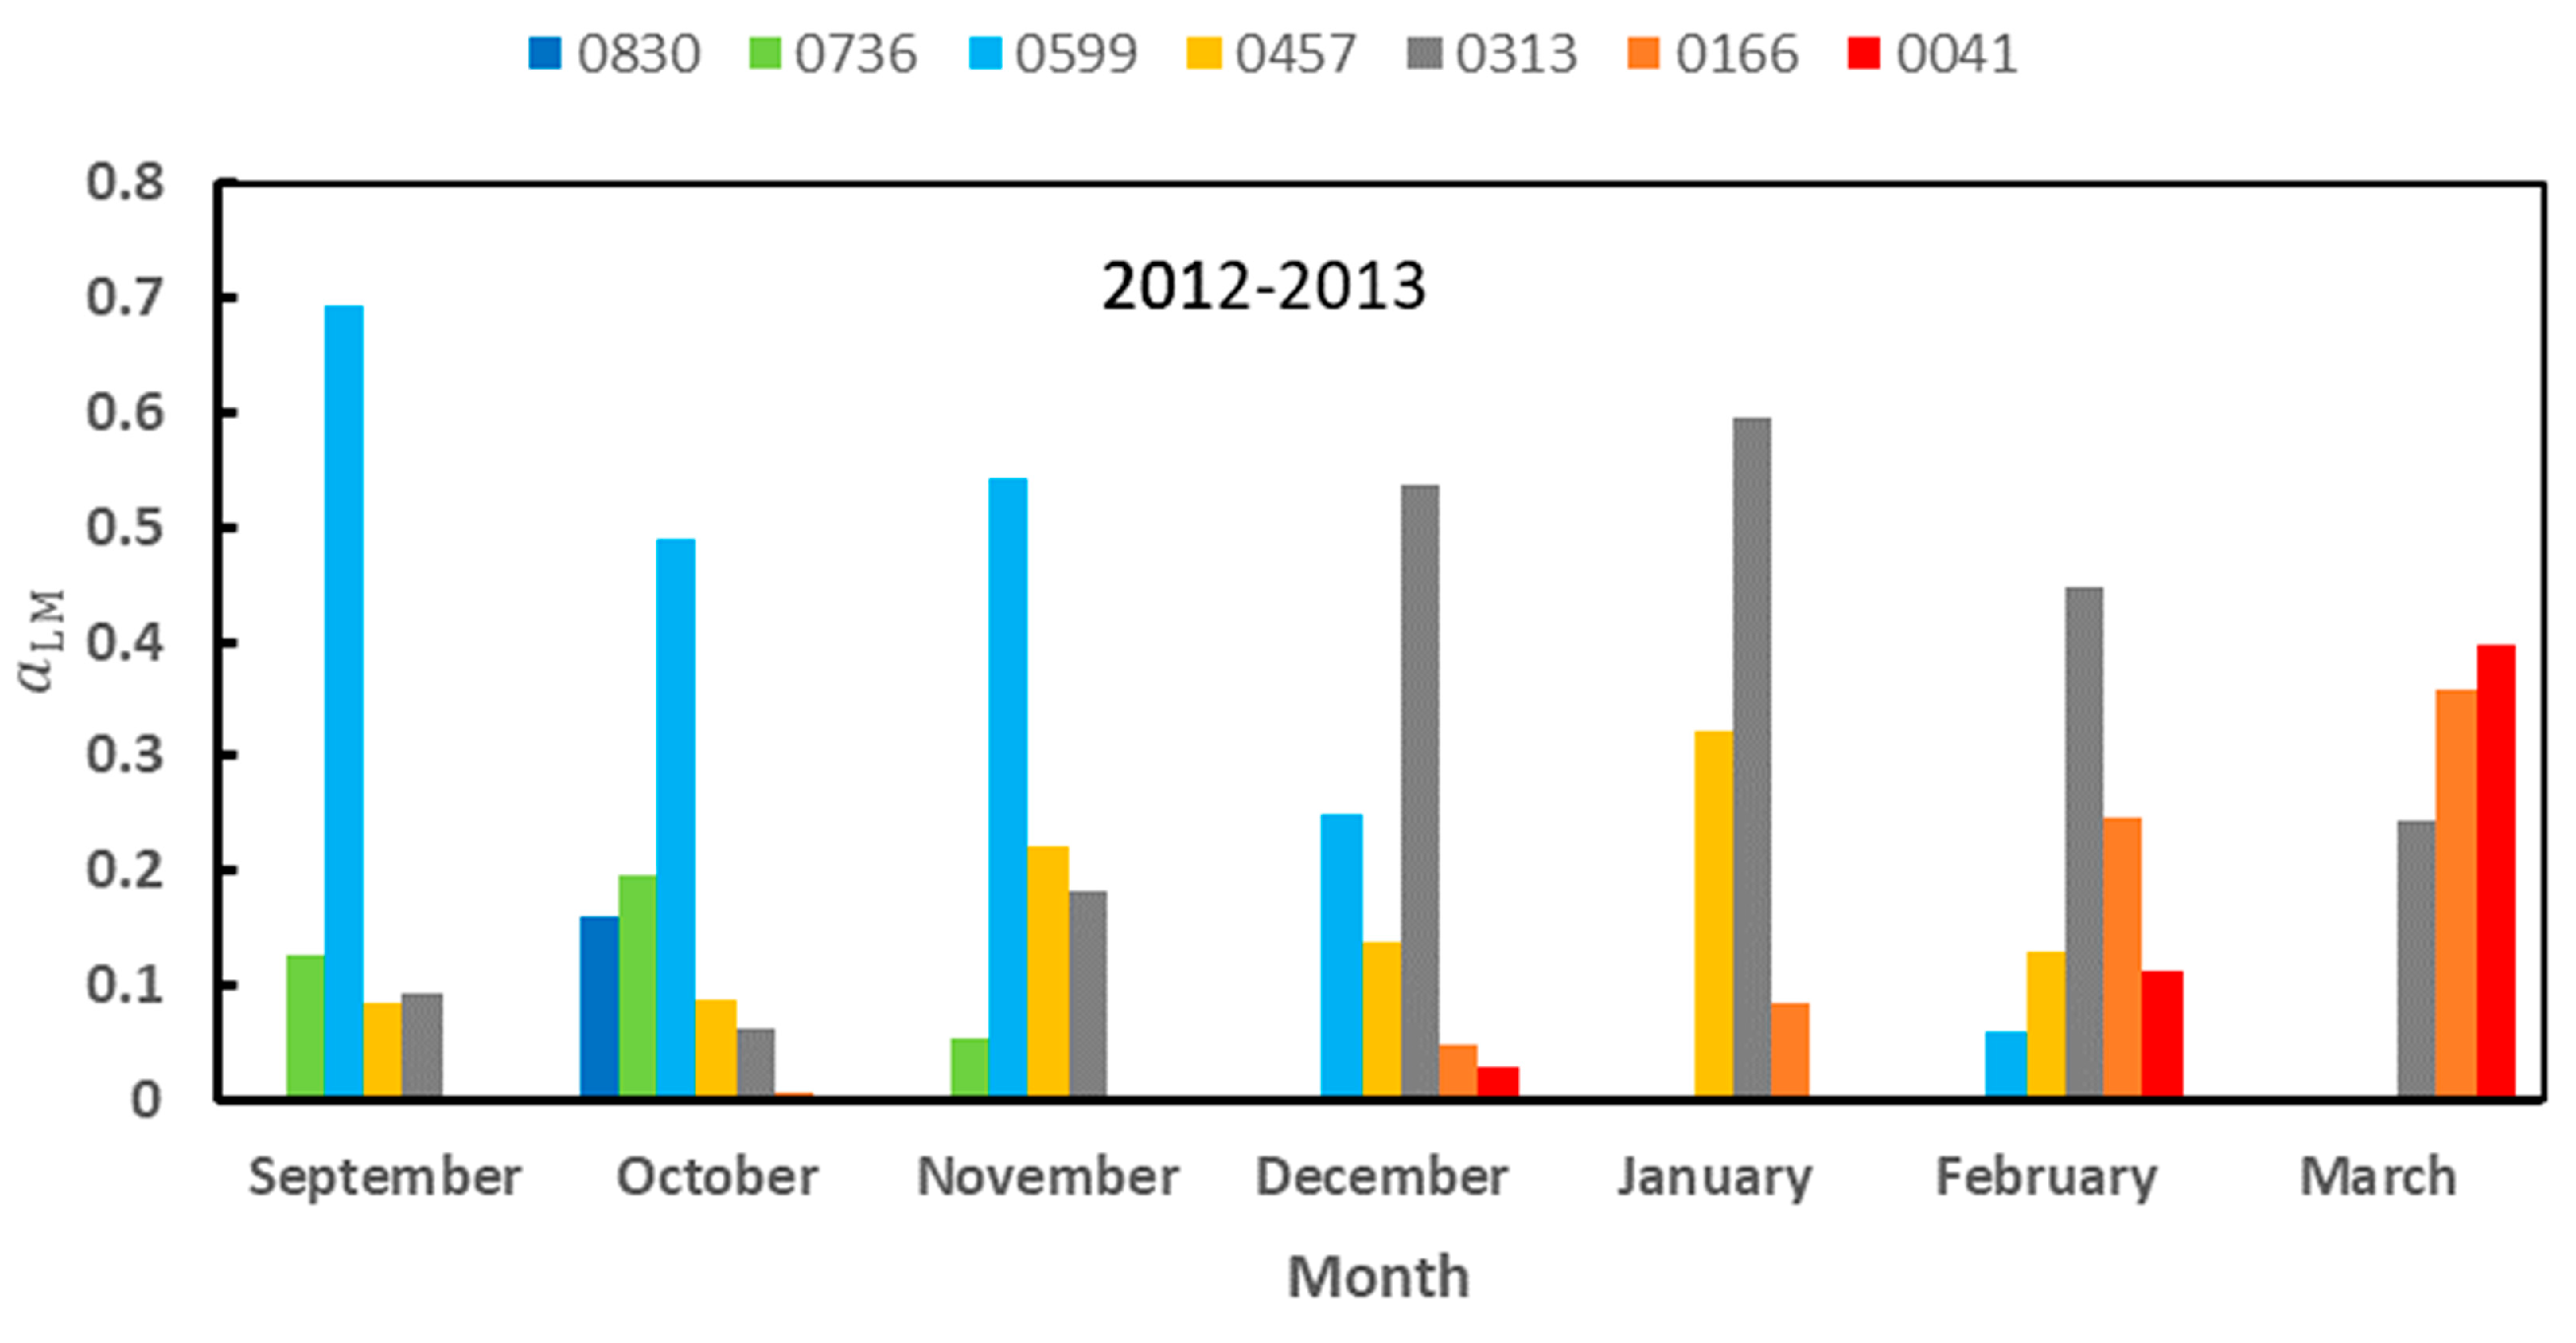
We repeated the calculations of
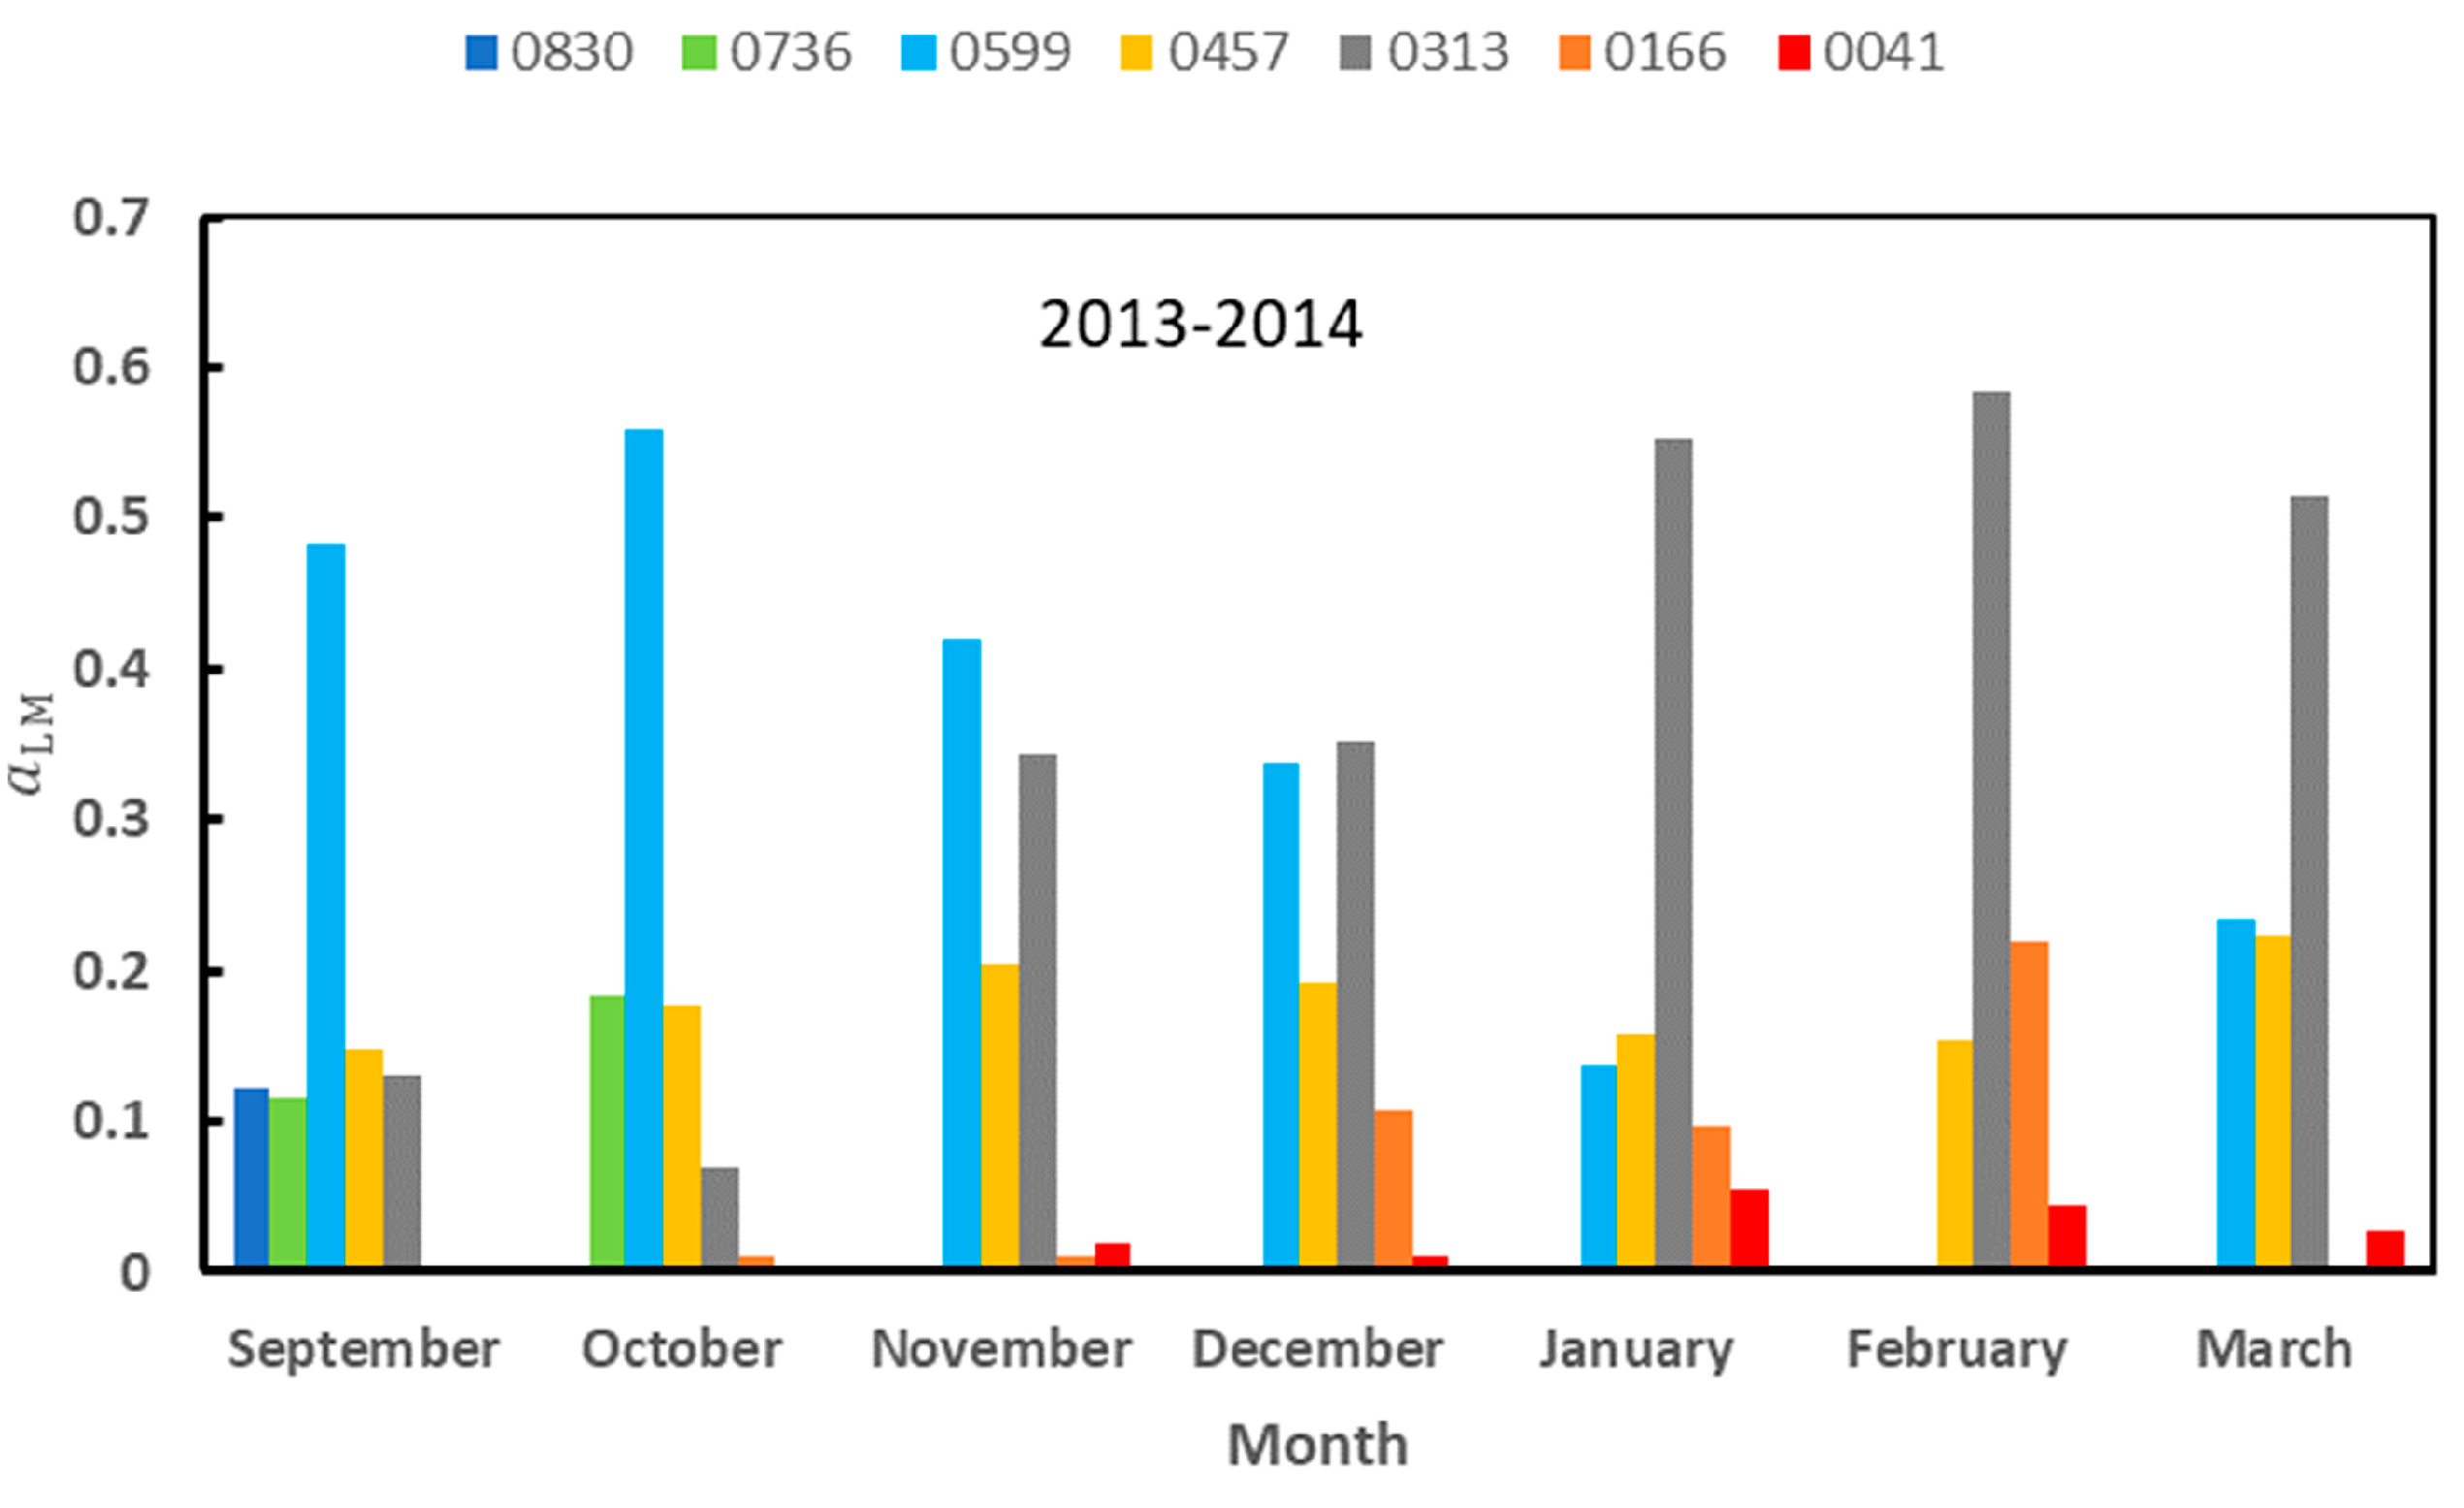
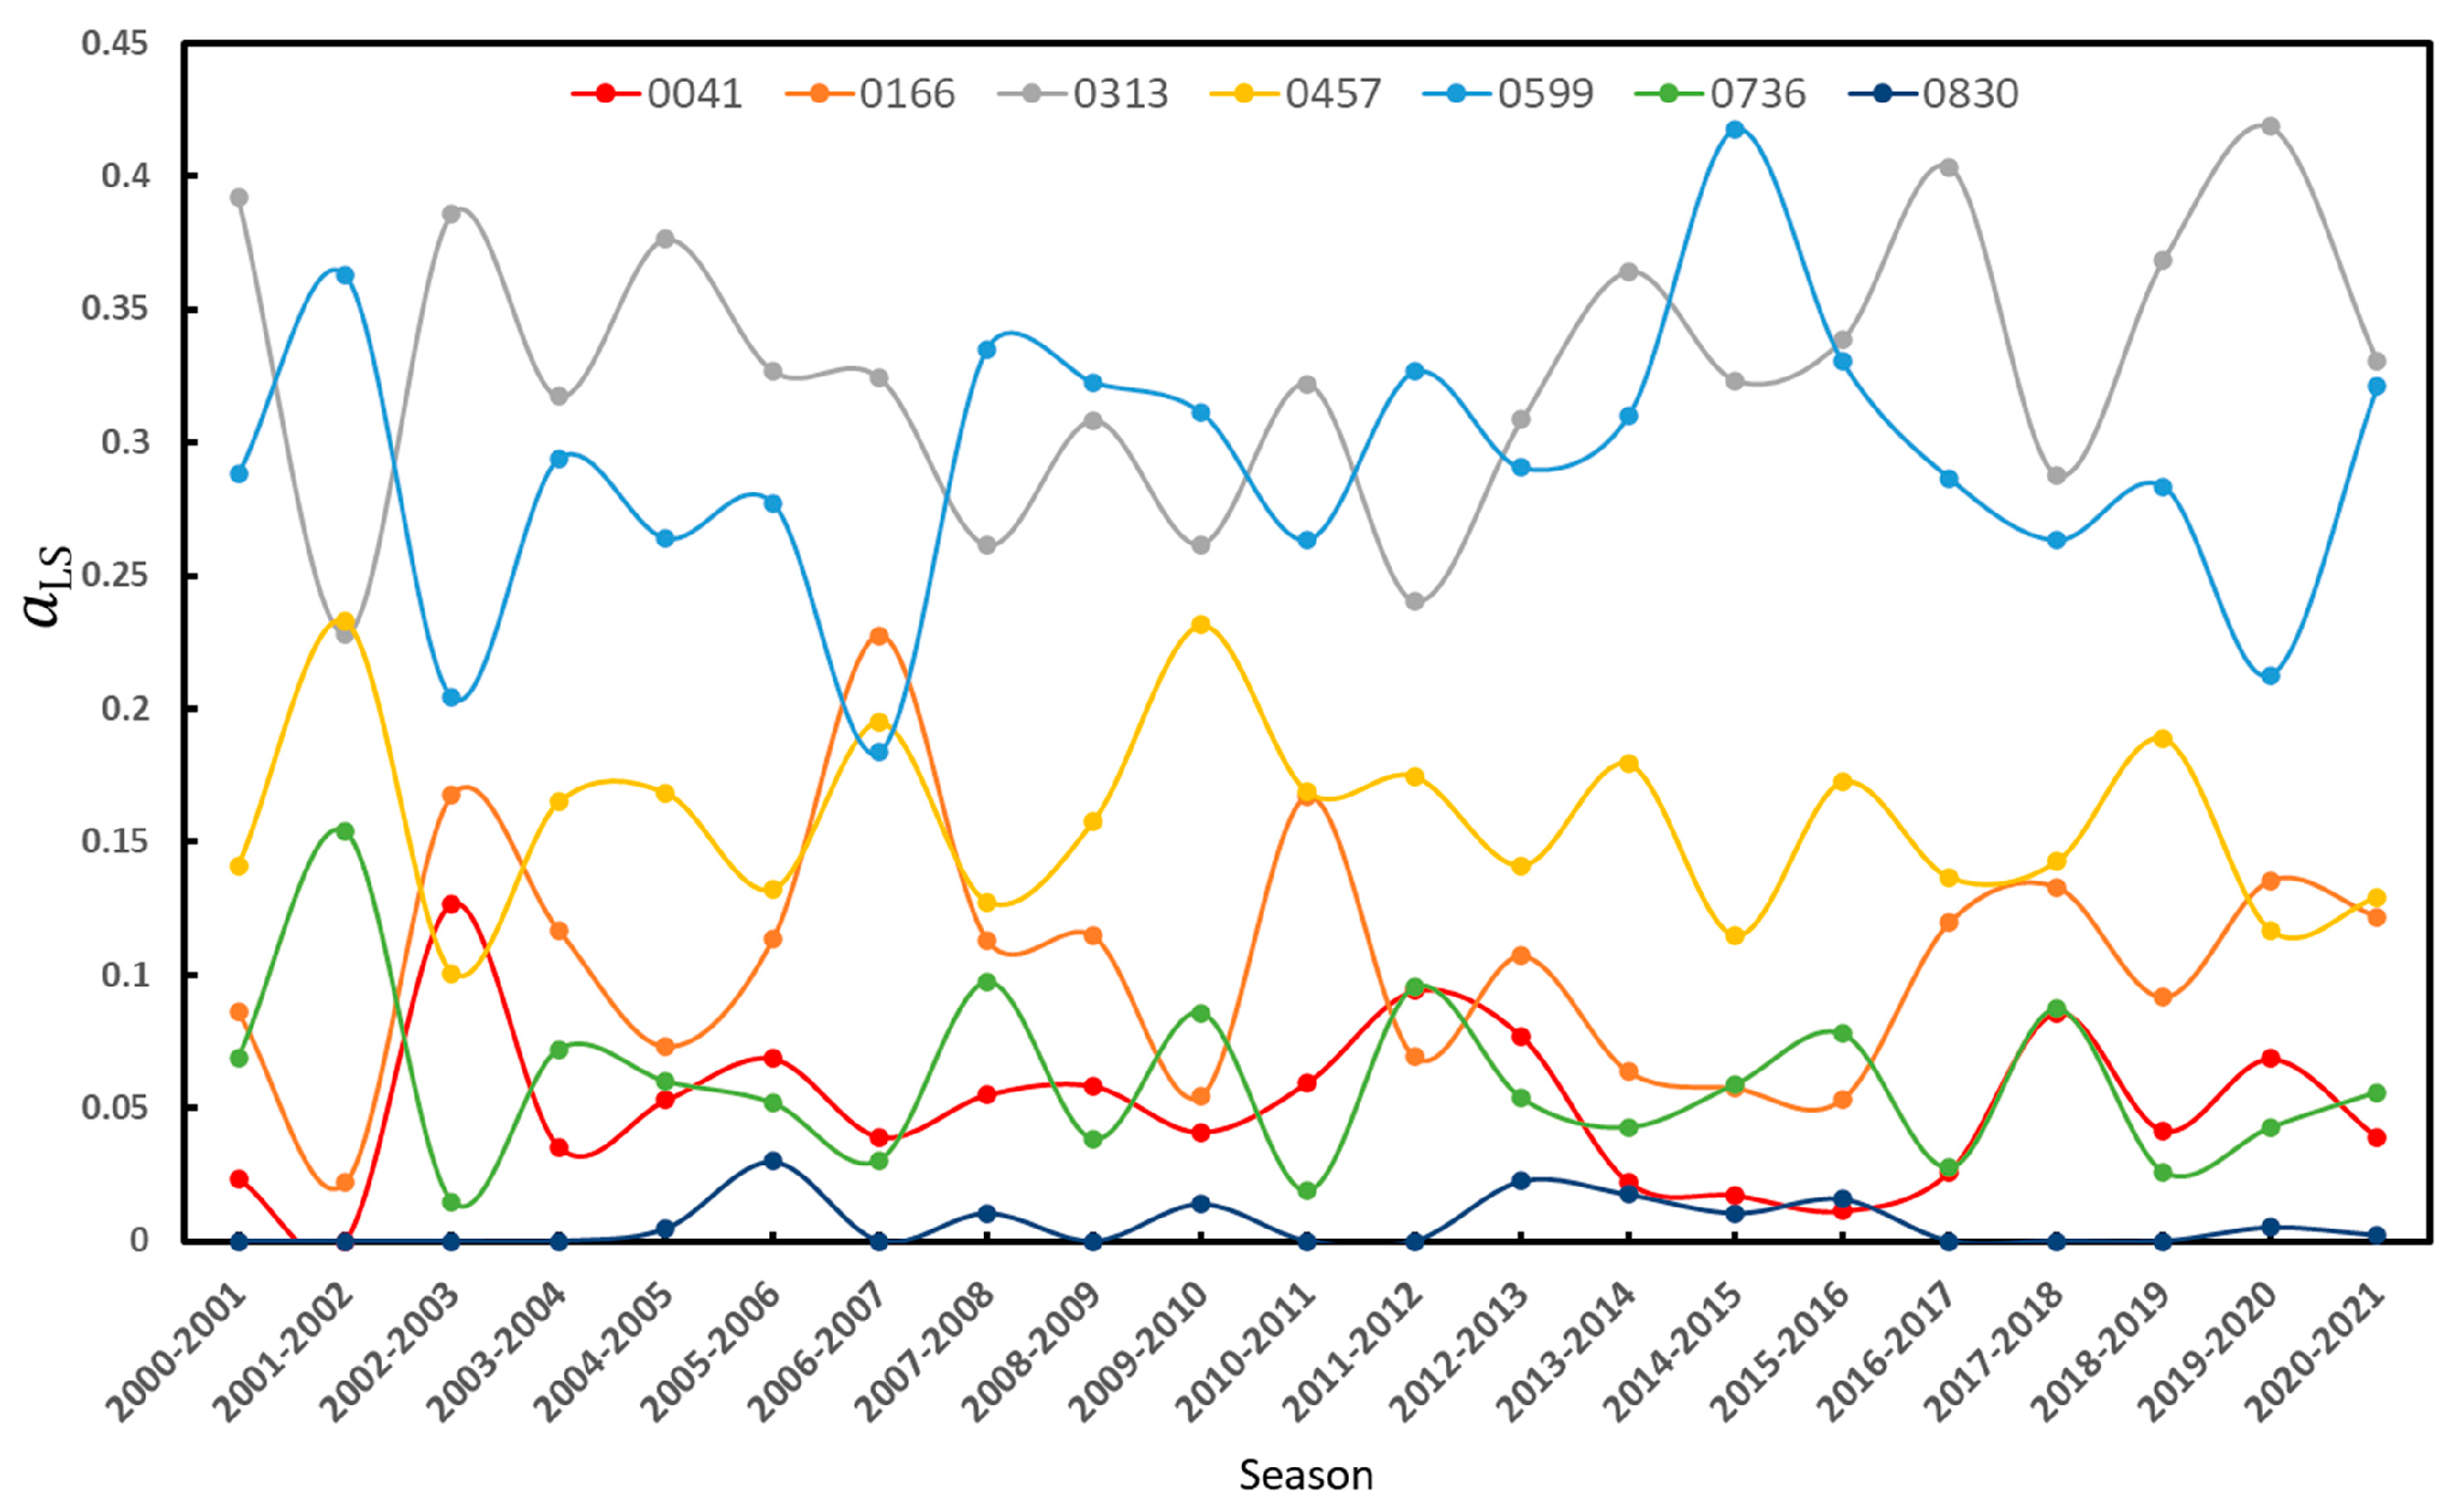
Section 2.4.3 with the new normal distributions. Let us denote by a
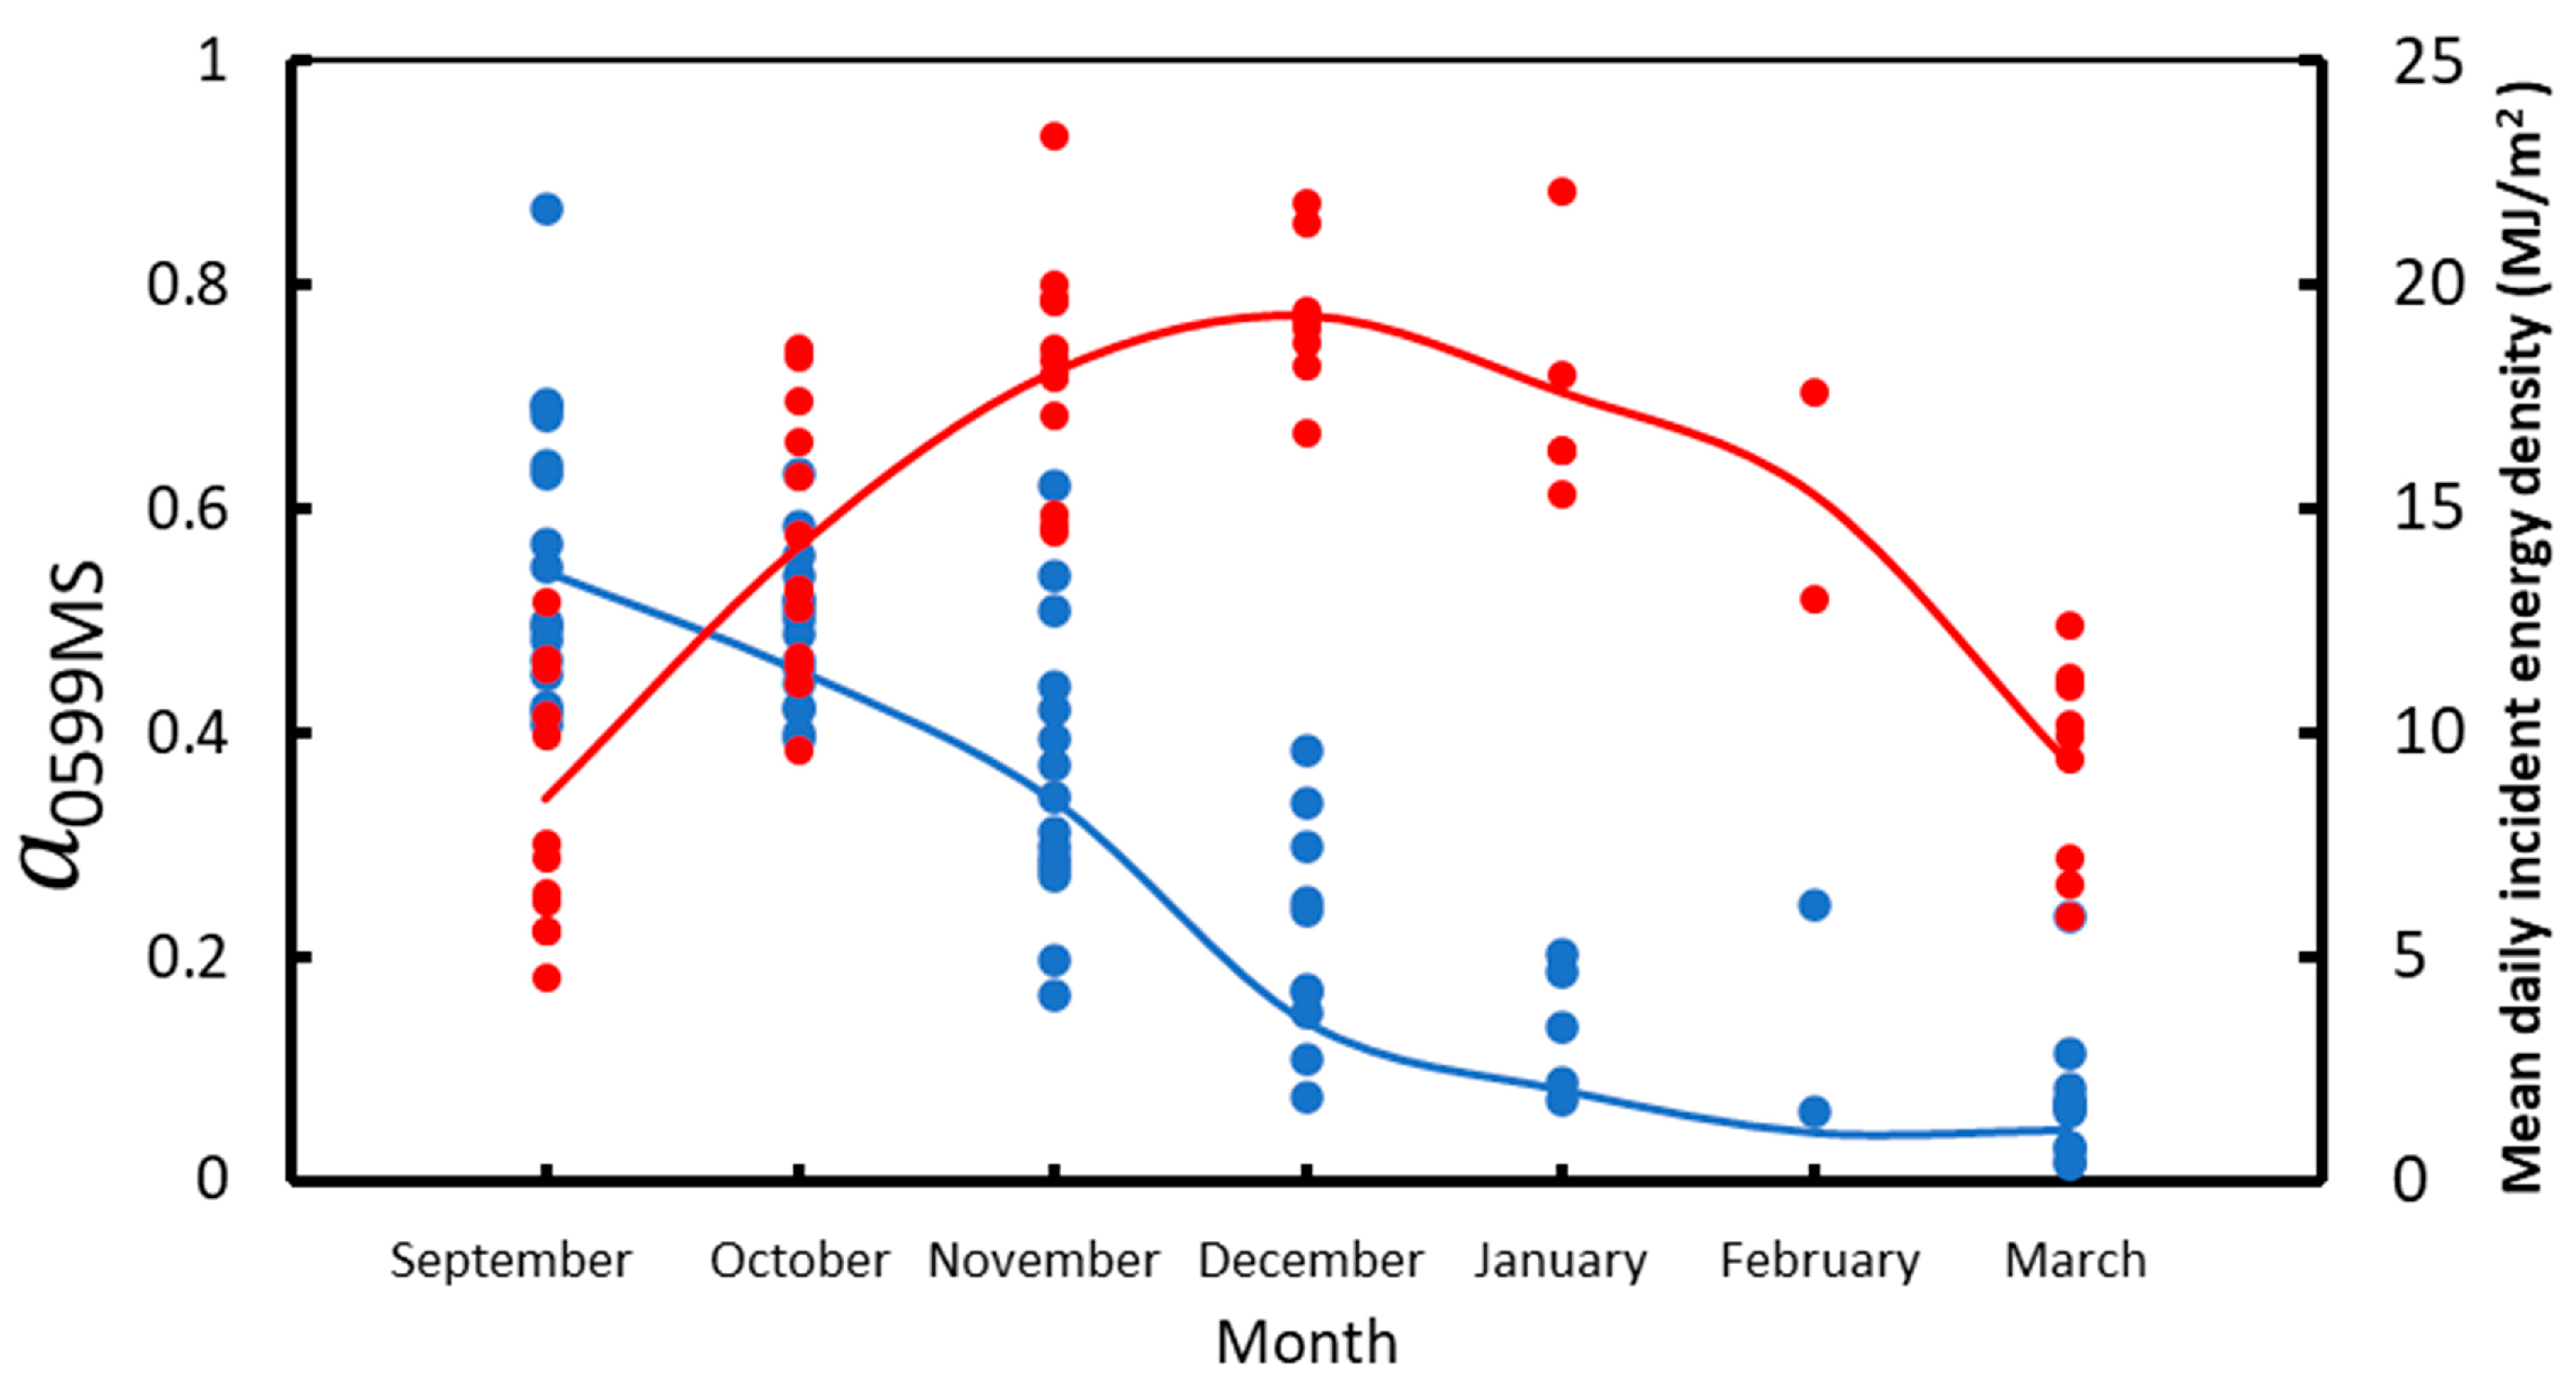
LMS the monthly relative abundance obtained. We calculated the correlation of <α> and T
air with
aLMS and the correlation between the
aLMS for the 2012–2013 and 2013–2014 seasons together. These two seasons were chosen because all the months attained the label of representative. The results are shown in
Table A6 and
Table A7 below, and they have to be compared with those of
Table 8 and
Table 9 in the main body of the article. Although the values of the coefficients of correlation change, the main results remain unchanged. The signs of the correlations are the same with and without correction. The landscape units exhibiting a higher correlation with <α> and T
air are the same with and without correction.
Table A6.
Coefficient of determination between the monthly relative abundance () and the monthly mean albedo over Deception Island (<α>) and the monthly mean air temperature from the GdC AWS (Tair) for seasons 2012–2013 and 2013–2014. Data in red are statistically significant at a 95% level (p-value < 0.05). Values with very high coefficient of determination are marked in bold. The correlation is linear in all the cases, being positive (+) or negative (−) as indicated.
| L | 0041 | 0166 | 0313 | 0457 | 0599 | 0736 | 0830 |
|---|
| <α> | 0.44 (−) | 0.75 (−) | 0.63 (−) | 0.03 | 0.74 (+) | 0.67 (+) | Only 2 data |
| Tair | <0.01 | 0.18 | 0.81 (+) | 0.20 | 0.55 (−) | 0.49 | Only 2 data |
Table A7.
Coefficients of determination between monthly relative abundances () of landscape units for seasons 2012–2013 and 2013–2014. Data in red are statistically significant at a 95% level (p-value < 0.05). Values with very high coefficient of determination are marked in bold. The correlation is linear, being positive (+) or negative (−) as indicated. The symbol (exp) means that the correlation is exponential. Landscape units 0830 and 0041 coincide in only one month over the whole time period, and the correlation cannot be calculated.
| L | 0166 | 0313 | 0457 | 0599 |
|---|
| 0041 | 0.64 (+) | <0.01 | 0.13 | 0.64 (exp) (−) |
| 0166 | | 0.12 | 0.22 | 0.71 (exp) (−) |
| 0313 | | | 0.18 | 0.67 (−) |
| 0457 | | | | 0.10 |


 ,
, 