
A Coarse-to-Fine Transformer-Based Network for 3D Reconstruction from Non-Overlapping Multi-View Images

School of Artificial Intelligence, University of Chinese Academy and Sciences, No. 19 Yuquan Road, Shijingshan District, Beijing 100049, China
*
Author to whom correspondence should be addressed.
†
These authors contributed equally to this work.
Remote Sens. 2024, 16(5), 901; https://doi.org/10.3390/rs16050901
Submission received: 14 January 2024
/
Revised: 8 February 2024
/
Accepted: 1 March 2024
/
Published: 3 March 2024
(This article belongs to the Section AI Remote Sensing)
Abstract
:Reconstructing 3D structures from non-overlapping multi-view images is a crucial task in the field of 3D computer vision, since it is difficult to establish feature correspondences and infer depth from overlapping parts of views. Previous methods, whether generating the surface mesh or volume of an object, face challenges in simultaneously ensuring the accuracy of detailed topology and the integrity of the overall structure. In this paper, we introduce a novel coarse-to-fine Transformer-based reconstruction network to generate precise point clouds from multiple input images at sparse and non-overlapping viewpoints. Specifically, we firstly employ a general point cloud generation architecture enhanced by the concept of adaptive centroid constraint for the coarse point cloud corresponding to the object. Subsequently, a Transformer-based refinement module applies deformation to each point. We design an attention-based encoder to encode both image projection features and point cloud geometric features, along with a decoder to calculate deformation residuals. Experiments on ShapeNet demonstrate that our proposed method outperforms other competing methods.

1. Introduction
Three-dimensional reconstruction plays a crucial role in the field of computer vision, serving as a fundamental component for various downstream applications such as robotics, augmented reality, and autonomous systems. However, reconstructing the 3D structure of an object from a single-view image faces challenges due to limited spatial information, resulting in issues such as ambiguity, noise, and rough synthesis of occluded parts.
Utilizing multi-view images for reconstruction is an effective approach to solving the problem mentioned above, as it provides additional spatial information about the target object. Traditional methods, such as Structure from Motion (SFM) and Simultaneous Localization and Mapping (SLAM), and some deep learning methods [1,2,3,4] based on multi-view stereo (MVS) can establish feature correspondences across views, leading to more accurate reconstruction results. In these methods, significant overlap between viewpoints and even a fixed order of input images are often required to obtain feature correspondences for reconstruction. However, in practical applications, limitations in acquiring overlapping viewpoints can lead to a significant increase in data collection costs and operational complexity, restricting the applicability of these methods. On the other hand, these methods focus on depth estimation, making it difficult to recover the complete shape of objects with a small number of input views (e.g., 2–5).
To address the limitations of these MVS-based methods, some approaches [5,6,7] integrate the idea of shape generation, directly encoding multi-view features for reconstruction rather than matching features across views. These works target scenarios where obtaining substantial overlap between viewpoints is impractical, such as real-time object reconstruction in specific shooting environments and limited viewpoints from drones or mobile devices, among others. However, most of these methods reconstruct the surface mesh or volume of an object, struggling to ensure the accuracy of detailed topology while attempting to recover the overall structure, leaving room for improvement in reconstruction quality.
Motivated by this challenge, we aim to leverage point cloud representation to fit the overall shape of objects while simultaneously recovering detailed topological structures flexibly. This is a difficult task because the unordered and unconnected nature of point clouds significantly reduces the efficiency in utilizing multi-view features. Therefore, we integrate the Transformer architecture into the framework of point cloud reconstruction from non-overlapping and sparse viewpoints. Transformer is well-suited for handling unordered data such as point clouds, ensuring adaptive information exchange among points in the absence of connectivity relationships. Based on the Transformer architecture, we present an innovative approach to enhance the precision and completeness of reconstructed point clouds.
In this study, we propose PCR-T, a Transformer-based point cloud reconstruction network, to generate a point cloud corresponding to the target object from non-overlapping multi-view images. Our two-stage model comprises a point cloud generator for obtaining a coarse point cloud containing semantic information and a Transformer-based module to refine the position of each point using geometric features and integrated multi-view image features. Firstly, the generator decodes coarse point clouds from multiple input images at non-overlapping viewpoints in parallel and mitigates the impact of the regressed locations of point cloud centroids. Subsequently, the refiner extracts point-wise features, taking into account both the guidance from input images and the spatial distribution of points. Point-wise features undergo updates through a self-attention layer, enabling comprehensive information exploitation on a global scale. Finally, the refiner proposes possible deformation locations for each point and assesses their possibilities. The deformation residual of each point is calculated as the weighted sum of these deformation proposals and then is added to the coarse point cloud, yielding the final output. The contributions of this paper are summarized as follows:
- We innovatively design a novel deep neural network named PCR-T to reconstruct high-quality 3D shapes from non-overlapping multi-view images. Equipped with a well-designed generator and refiner, PCR-T demonstrates enhanced capabilities in handling this challenging task.
- We innovatively propose a Transformer-based architecture to refine the shape of point clouds, facilitating adaptive information exchange among unordered points and leading to more accurate predictions of 3D structures.
- Experimental results on the ShapeNet [8] dataset showcase that the proposed approach outperforms state-of-the-art methods.
2. Related Work
In this section, we review 3D reconstruction methods related to our work. We focus on classifying these methods based on the number of input views. Meanwhile, we also discuss the latest reconstruction methods based on Transformer.
2.1. Single-View Reconstruction Methods
It is extremely difficult to predict the 3D shape of an object from a single image. Before the advent of powerful 3D generation architectures such as Generative Adversarial Networks (GANs) and Variational Auto-Encoders (VAEs), many methods [9,10,11,12] were proposed to solve the problem by extracting surface information from the texture or shading of the object. However, lacking the learning experience process similar to deep neural networks, these methods require too many priors and assumptions to recover the 3D structure from a single image. Wu et al. [13] studied the effectiveness of learned representations from generative models, such as GANs and VAEs, and proposed a generative architecture to reconstruct a point cloud from an image. Fan et al. [14] then proposed a common network called PSGN for point cloud reconstruction consisting of an image encoder and a 3D decoder, which can serve as the foundation for most reconstruction tasks. Mandikal et al. [15] proposed 3D-LMNet to match the latent representation of 2D images and 3D point clouds. Mandikal et al. [16] designed a hierarchical network to predict point clouds of increasing resolution. Wang et al. [17] modified the hierarchical network proposed by Mandikal et al., incorporating the GAN framework to enhance both the point cloud generation and the network optimization, thereby improving reconstruction quality. Li et al. [18] improved the image feature extraction and activation function of the PSGN [14] network, resulting in better reconstruction results. Choi et al. [19] applied deformation on a randomly generated point cloud based on point-wise features. In addition to point cloud distance constraint for shape fitting, Ping et al. [20] introduced constraints based on the projection image consistency of edge points and corner points, paying more attention to the reconstruction of details. Wen et al. [21] disentangled and extracted semantic attributes explicitly through different semantic levels in the input images and leverage them to guide the reconstruction of specific attributes on point clouds. 3D-R2N2 [22] first utilizes a 3D-LSTM network to encode the information of volume occupancy. OGN [23] uses an octree representation to reduce storage and computation costs when generating volumetric results. Similarly, to address the cubic growth of the computational cost caused by predicting high-resolution volumetric 3D shapes, Shen et al. [24] chose to reconstruct 3D shapes by predicting 2D slices in the frequency domain. DISN [25] proposed a network to regress the underlying signed distance field (SDF) corresponding to the input image and then uses Marching Cubes [26] to obtain the 3D mesh. Pixel2Mesh [27] leverages perceptual features extracted from the input image to deform an initial ellipsoid mesh. Similar to DISN [25], Mescheder et al. [28] proposed an occupancy network to represent the 3D surface as the decision boundary of a classifier. However, reconstructing 3D structures from a single image is ill-posed because observation from one view cannot accurately guide the fitting of details, leading to ambiguity, distortion, and noise in the invisible part.
2.2. Multi-View Reconstruction Methods
Traditional methods, such as SFM and SLAM, require the sequential input of images to recover a 3D structure by feature extraction and matching, lacking robustness when dealing with separated and sparse viewpoints. Recently, multi-view stereo methods [1,2,3,4] based on deep learning have become crucial in this field. Unlike traditional methods, these deep learning approaches have fewer restrictions on the order and number of input images. However, they are typically employed for depth estimation rather than generating complete 3D shapes. Moreover, for dense depth inference, these methods often necessitate distinct textures on objects and overlap between input viewpoints. Apart from these approaches, there has been limited exploration of direct 3D reconstruction without strict restrictions on the input images. 3D-R2N2 [22] utilizes an RNN (Recurrent Neural Network) to process multi-view features and a 3D-LSTM (Long Short-Term Memory) module to address the occlusions. Lin et al. [29] and Insafutdinov et al. [30] generated point clouds from several views, constraining the shape fitting by utilizing silhouette and depth projection results. The latter method can also regress camera poses simultaneously. Wang et al. [31] proposed MVPNet to predict view-dependent point clouds by projecting 2D grids to 3D space and regress the visibility. Jia et al. [32] presented an end-to-end network to generate point clouds from two different views and fused them by multi-scale features extracted by a structure feature learning module. Xie et al. [6,33] proposed the Pix2Vox model to fuse multi-view volume occupancy and refine the volume output. Without camera poses, Spezialetti et al. [34] regressed relative poses through pairwise pose estimation followed by carving the volumetric shape based on the silhouette on images. Pixel2Mesh++ [5] samples the nearby area around each vertex of the initial mesh to predict the deformation locations. Tang et al. [7] explored generating the object’s skeletal volume as an intermediate representation to reconstruct the surface mesh.
2.3. Transformer-Based Methods
The Transformer architecture [35], renowned for its remarkable performance in natural language processing (NLP) tasks such as machine translation and question answering, has recently found applications in the domain of 3D vision. Although some works [36,37] have illustrated how Transformer is applied in downstream tasks, research on 3D reconstruction based on Transformer remains relatively limited. Lu et al. [38] proposed an attention-based point cloud generation network, aiming to append the attention weight extracted by the image encoder to the the point cloud decoder via skip connection. Wang et al. [39] utilized an attention mechanism to fuse features from multi-view images and decode volume results for each query token. Yuan et al. [40] proposed a view attention guided network to re-weight image features and append global features on each vertex of the surface mesh, enhancing the precision of features for inferring a 3D mesh. Tiong et al. [41] presented a 3D-C2FT model, a coarse-to-fine architecture which uses self-attention layers to refine coarse volume results. Huang et al. [42] used an attention mechanism to fuse features at the same 3D volume locations across different views rather than just fusing image feature tokens. Yagubbayli et al. [43] proposed LegoFormer to predict a full 3D model as an aggregation of independently predicted parts.
3. Method
Our point cloud reconstruction network consists of a point cloud generation architecture like PSGN [14] and a 3D Transformer-based refinement module. The overview of our method is illustrated in Figure 1. The method takes several images from M different views of an object as input and produces a point cloud with N points corresponding to the object. Specifically, the point cloud generator leverages the concept of centroid constraint to enhance both the shape fitting and alignment of point clouds derived from multi-view images. In order to optimize the shape of the generated point cloud, the refinement network adopts self-attention modules for point-wise encoding. It further queries the possibilities of deformation position proposals to regress the deformation residual for each point. The entire network is explained in detail in the following paragraphs.
3.1. Preliminaries
We first provide some background about methods for measuring point cloud distance and concepts of attention mechanisms.
Point cloud distance metrics. In this paper, we use the Chamfer Distance (CD) and the Earth Mover’s Distance (EMD) mentioned in PSGN [14] to constrain the predicted point cloud to fit the shape of the object. Given two point clouds and , CD and EMD can be defined as
Attention mechanisms. We use scaled dot-product attention [35] rather than a graph convolution network to achieve efficient and unlimited information exchange among points. Given the input query, key, and value matrix , this common attention mechanism is defined as
where represents the feature dimensions of Q and K. During the implementation, multi-head attention is used because it can calculate attention weights for different aspects at the same time. Given the number of heads h, multi-head attention (MHA) is defined as
where all the Ws are linear mappings.
3.2. Point Cloud Generator
To predict the point clouds of the object from different viewpoints, we use ResNet [44] as an image encoder to extract image features and map the input data to a latent representation. This is followed by a fully connected network, which is utilized to directly regress the coordinates of every point based on the latent code. Assuming the functions which represent 3D transformation relationships from the M viewpoints to the canonical space have been given, each point cloud can be transformed to the canonical space via the following:
where represents the point cloud in the canonical space, and represents the camera pose.
Now that we have obtained coarse point clouds generated from several views, the next step is to integrate them. The most straightforward approach is to directly concatenate them in the canonical space. However, our experiments revealed a significant issue: noticeable positional errors between point clouds from different viewpoints. It seems as though each point cloud has shifted slightly in a certain direction. This indicates that the overall backbone has a limited ability to extract specific spatial locations of each point cloud, which are implicit and entangled with the shape features.
To address this problem, we introduce a point cloud fusion module. The key idea is to supervise centroid consistency between the generated point cloud and the ground truth. We center the centroid of the point cloud at the origin and perform the same operation on the ground-truth point cloud. During training, we apply Chamfer Distance (CD) and Earth Mover’s Distance (EMD) between these processed point clouds, guiding the shape generation of points while disregarding the influence of the centroid position. Additionally, direct supervision of the centroid of the generated point cloud is deemed necessary. We use loss to measure the error of generated centroid :
where and represent the centroid of and , respectively. The overall loss function of the point cloud generator can be defined as
where is the hyperparameter balancing the losses. Considering that there is no ground truth as reference during inference, we use an adaptive operation to integrate point clouds generated from all viewpoints: replacing the centroids of point clouds with the mean of these centroids.
3.3. Transformer-Based Refiner
We obtain a coarse point cloud from the generator, along with multi-view image features extracted by the image encoder. Our proposed point cloud refiner, utilizing the Transformer encoder–decoder architecture, can apply positional deformation to each point. This process improves the results of shape fitting, ultimately yielding the final point cloud . The detailed structure of the refiner is shown in Figure 2. In the following sections, we first describe the point-wise feature extractor, which extracts image features and geometric features from the output of the generator, in Section 3.3.1. We then illustrate the feature encoder, a self-attention layer designed for capturing the relationships among all the points, in Section 3.3.2. Finally, in Section 3.3.3, we present the deformation decoder, based on the idea of position proposals and cross-attention architecture.
3.3.1. Point-Wise Feature Extractor
Generally speaking, the 3D coordinates of the point cloud naturally contain spatial information about the geometric distribution of the object, which can be simply encoded as point-wise features. Inspired by Pixel2Mesh [27] and Pixel2Mesh++ [5], it is also essential to append hierarchical image features to the feature context. The entire point-wise feature context consists of these two aspects of information.
Image feature binding. Considering that ResNet is used to generate latent representations for shape fitting in the generator, we can also obtain different levels of image features in the process. We utilize the inverse functions of mentioned above to transform the generated to each camera coordinate system via the following:
Then, we calculate 2D projection of on input image planes using camera intrinsics. Due to the fact that the low-level features in the image features extracted by ResNet contain more detailed information, we bind these features to each projected point via bilinear interpolation. It is worth noting that we actually obtain image features from all viewpoints. To combine multi-view features and ensure the performance invariance to different input orders, we use several statistics (, , and ) of the features bound from all views and concatenate them, resulting in a feature matrix . Using these statistics instead of directly concatenating multi-view features allows our network to automatically adapt to changes in the number and order of input viewpoints, thereby enhancing the stability of the training and inference processes. The entire process is illustrated in Figure 3.
Geometric position fusion. According to the idea of PointNet++ [45] and DGCNN [46], the local neighborhood features are crucial to point cloud representation learning. By explicitly encoding local information, each point can appropriately perceive the surrounding shape, laying the foundation for recovering local details. We search for k neighbors for each point in using the algorithm and thus obtain a matrix . To encode local details relatively, we duplicate a dimension of for k times and make the local context as follows:
To produce the point-wise features from the context, we apply an MLP and a max-pooling layer on C, just as
Figure 4 shows the entire process of geometric position fusion.
3.3.2. Self-Attention Feature Encoder
The entire point-wise feature can be generated by concatenating the two components and . We use a self-attention encoder to achieve interaction among points, making better to guide the following deformation residual decoding. From , we compute the query, key, and value map through three fully connected layers and apply a feed-forward network (FFN) on the results of the multi-head attention layer (illustrated in Section 3.1), generating the interacted feature context .
3.3.3. Deformation Decoder
In theory, the most common method involves directly regressing the deformation residuals since the point-wise features are available. However, there is no doubt that this approach is too rough to achieve accurate deformation estimation. Therefore, we introduce some possible deformation positions for each point and query the possibilities of these proposals. This assists the network in determining the final deformation residuals more easily.
Possible deformation proposals. For each point, we set six points with fixed distances as deformation proposals. These proposals are in six deformation directions, respectively: up, down, left, right, front, and back. Including the central point, we actually extend the coarse point cloud to .
Cross-attention feature query. We use the image feature binding layer illustrated in Section 3.3.1 and an MLP to map the proposals to the feature space, denoted as . We adopt a cross-attention layer to query the exact representation of each deformation proposal. The cross-attention layer is essentially a multi-head attention (MHA) module, with the distinction that it acquires the query, key, and value maps from different sources. The query map is generated from , and the key map and value map are generated from . Then, we can obtain the updated features of all the proposals by the cross-attention layer.
Deformation residual regression. Considering that we need to regress the possibilities of proposals, it is essential to exchange information among the seven position proposals for a specific point. Therefore, we utilize a local-attention block consisting of several self-attention layers with as the query, key, and value maps, as shown in Figure 2. In this block, we just operate self-attention on each set of seven proposals. Finally, the resulting feature context from the local-attention block is passed through an MLP to decode the scores of each proposal, and these scores are fed into a softmax layer to generate the real possibilities . The deformation residuals are calculated by the weighted sum of proposals, and the final output point cloud is the result of adding the deformation residuals to the coarse point cloud .
The loss function of the refiner focuses on the reconstruction quality of the final results and can be defined as
4. Experiment
In this section, we present the performance evaluation and implementation details of our model.
4.1. Experimental Setup
Dataset. We use the dataset provided by Choy et al. [22] because it is widely used by many 3D reconstruction works. The dataset is a subset of ShapeNet [8]. It contains 43k 3D CAD models from 13 categories, and each model is rendered from 24 separated and sparse camera viewpoints. For the sake of fairness, we use the same training and test splits as [22] with a ratio of 4:1 for all experiments. In addition, we also evaluate our model’s capability to generate point clouds from real-world images on the Pix3D [47] dataset.
Evaluation Metrics. We employ Chamfer Distance (CD) as a metric, computed between the predicted point clouds and point clouds uniformly sampled from the ground truth, to quantify the reconstruction quality. The definition of the Chamfer Distance is provided by Equation (1) in Section 3.1. A lower CD value suggests a better reconstruction. We also calculate the F-score following [5,27] to measure the accuracy and completeness of the shape fitting. For each point in the reconstructed point cloud, if its minimum distance to a point in the ground truth is within the threshold , it is considered as accurately predicted. In this way, we can calculate the precision and recall of the reconstructed point cloud, and the F-score at a given threshold is the harmonic mean of these two values. A higher F-score value suggests a better reconstruction.
Implementation details. Our network receives views of images and generates 1024 points for every viewpoint, resulting in a predicted point cloud with points. The model is implemented in PyTorch and trained by an Adam optimizer with weight decay as . The model can be trained end-to-end, but we train it separately for stability. Firstly, we train the generator for 40 epochs with a batch size of 16. The learning rate is initialized as and drops to after 20 epochs. Then, we train the refiner for 20 epochs with a batch size of 12. The learning rate is initialized as and decreases by a factor of 0.3 every 5 epochs. The total training time is about 40 h on an Nvidia A30 GPU.
4.2. Comparison to Sparse-View Reconstruction
We conduct a comparative analysis with previous works in multi-view 3D reconstruction, demonstrating the exceptional performance of our model in enhancing reconstruction quality and preserving detailed topology. Specifically, we compare our approach with two state-of-the-art methods—Pixel2Mesh++ [5] and SkeletonNet [7]—utilizing the same dataset. Pixel2Mesh++ is known for its outstanding performance in mesh reconstruction; while elegant, its method of deforming the initial mesh to optimize shape introduces limitations in fitting complex topology, inspiring our proposed improvements. SkeletonNet addresses this limitation by regressing the skeletal volume of the object to better accommodate complex topology, followed by surface mesh reconstruction based on the skeletal structure. We employ the multi-view version of SkeletonNet, as outlined in its publication. For fair comparison, we sample the same number of points uniformly on the surfaces reconstructed by Pixel2Mesh++ and SkeletonNet. Additionally, we make reference to DV-Net [32] and 3D-R2N2 [22] for quantitative analysis.
Qualitative results are shown in Figure 5 and Figure 6. Each object’s main view input image, ground-truth point cloud, and outcomes from various methods are presented. We separately present the comparison results in the chair category in Figure 5 due to its high demands on the reconstruction capabilities of both overall object shape and detailed topology. It is evident that while both Pixel2Mesh++ [5] and SkeletonNet [7] focus on surface mesh reconstruction, our method similarly excels in fitting object shapes. However, Pixel2Mesh++ and SkeletonNet encounter substantial challenges in capturing intricate details and complex topologies of objects. Pixel2Mesh++ struggles with detailed components like thin bars on a chair back, resorting to representing them with a continuous mesh. SkeletonNet employs skeletal volume to preserve object topology, but its capability for recovering details remains suboptimal. In contrast, our approach, while effectively recovering object shapes, excels in reconstructing detailed topology such as the thin bars on the back of the chair.
To demonstrate the stability of the method’s performance, we showcase results from other categories in Figure 6. Pixel2Mesh++ is good at shape fitting for objects with simple topology, such as airplanes and tables, but introduces reconstruction errors for closely positioned table legs in the images. For SkeletonNet, significant distortion arises when reconstructing large continuous surfaces due to expressive limitations in voxel representation. Our method demonstrates excellent performance in reconstructing large, planar surfaces and thin, intricate structural components with minimal reconstruction errors.
As shown in Figure 7, we select instances from the chair and table categories, zooming in on specific regions to specifically compare the methods’ ability to fit detailed topology. Due to its inherent limitations, Pixel2Mesh++ loses the ability to fit details for objects that do not share the same topology as an ellipsoid, resorting to a continuous mesh to fit complex topology uniformly. For regions with distinct texture differences, it can be observed that SkeletonNet makes efforts to fit detailed topology, but the reconstruction results still lack accuracy, exhibiting holes, fractures, and blurry regions. Our method can recover the thin bars on a chair back and the connecting structure of the table legs relatively clearly, presenting results consistent with the overall view.
Table 1 provides a quantitative comparison using the Chamfer Distance (CD) metric, demonstrating the comprehensive superiority of our approach over alternative methods. Due to the flexibility of point cloud generation compared to mesh deformation and voxel carving, coupled with the effectiveness of our point cloud refinement module, our method exhibits a significant advantage in this metric.
Table 2 shows the quantitative results using the F-score metric. Our method showcases improvements across nearly all categories, except for the cabinet category and the lamp category. Objects in the cabinet category exhibit simple and uniform shapes, aligning well with the mesh deformation approach of Pixel2Mesh++. Consequently, our method can only achieve results comparable to it. In addition, the lamp category consists of lamps with highly diverse shapes and contains very few objects in the dataset. This poses a significant challenge for our model: our point cloud generator, based on feature space mapping, struggles to effectively learn and accurately recover the overall shape of each object in such situations. Therefore, for the lamp category, our method performs weaker than Pixel2Mesh++ in the F-score metric with threshold , but the gap narrows under a looser threshold . Overall, Table 1 and Table 2 demonstrate the enhanced accuracy and completeness of the point clouds reconstructed by our method.
We provide results comparing the number of model parameters and the inference speed in Figure 8. The number of parameters is measured in terms of million (M), and the inference speed is represented by the time required to generate a shape. For a fair comparison, we replaced the image backbone—VGG—in the original version of Pixel2Mesh++ with ResNet and retrained the model for evaluation. As shown in the left subplot, our method utilizes the least number of parameters (32.78 M) and achieves the highest inference efficiency (0.07 s per object). The evaluation results of SkeletonNet, the retrained Pixel2Mesh++ model, and our model are presented in the right subplot, with threshold of the F-score metric. Despite the performance enhancement of Pixel2Mesh++ with the use of ResNet, our model still demonstrates the best performance.
4.3. Reconstruction from Real-World Images
To demonstrate the stability and universality of our model, we test its capability to generate point clouds from real-world images using the Pix3D [47] dataset. The Pix3D dataset comprises objects from nine categories in the real world, and each object has only a single-view image. Among the nine categories, three categories (sofa, table, chair) overlap with the ShapeNet dataset. Therefore, we evaluate our trained model on these categories. Figure 9 shows the reconstruction results of our model on the Pix3D dataset. Even when faced with unseen single-view images from the real world, our model still generates 3D point clouds completely and accurately and significantly preserves detailed topology.
4.4. Ablation Study
Performance under different numbers of views. We evaluate the performance of our well-trained PCR-T under varying numbers of input views. As illustrated in Table 3, our model exhibits improved performance with an increasing number of viewpoints, despite being trained with only three input views. This observation suggests that our model adeptly extracts additional spatial information from more images, indicating the potential to enhance accuracy through the incorporation of additional images during inference. In Table 3, the “Resp.” part represents the performance of models trained with two/three/four/five input images when tested with the corresponding number of images, respectively. From the comparison results, we observe that even when trained with limited inputs (three images), our model’s actual performance has minimal differences compared to the training version that can access more image inputs (four or five). This indicates strong generalization capabilities with respect to the number of input images. Therefore, to achieve optimal training efficiency, the number of input images during training is fixed as three.
Component ablation.Table 4 illustrates the impact of ablating various components proposed in our network. To investigate the impact of centroid constraints, we remove the supervision on centroid positions during the training of the generator and directly calculate the distance between point clouds. Regarding the refiner, we conduct ablation studies on three modules: the geometric position fusion module, designed for extracting local geometric features of points; the local-attention module, designed for deformation reasoning; and the entire cross-attention module. Specifically, when removing the entire cross-attention decoder, we replace it by appending an MLP to regress the deformation directly. Table 4 presents the effectiveness of these modules in enhancing reconstruction accuracy. Experimental data also indicate that the removal of the entire cross-attention decoder has the most significant impact on the model’s performance. This strongly validates our initial intention of designing this module to regulate the shape fitting of point clouds through a stable and efficient deformation prediction network.
4.5. Failure Cases
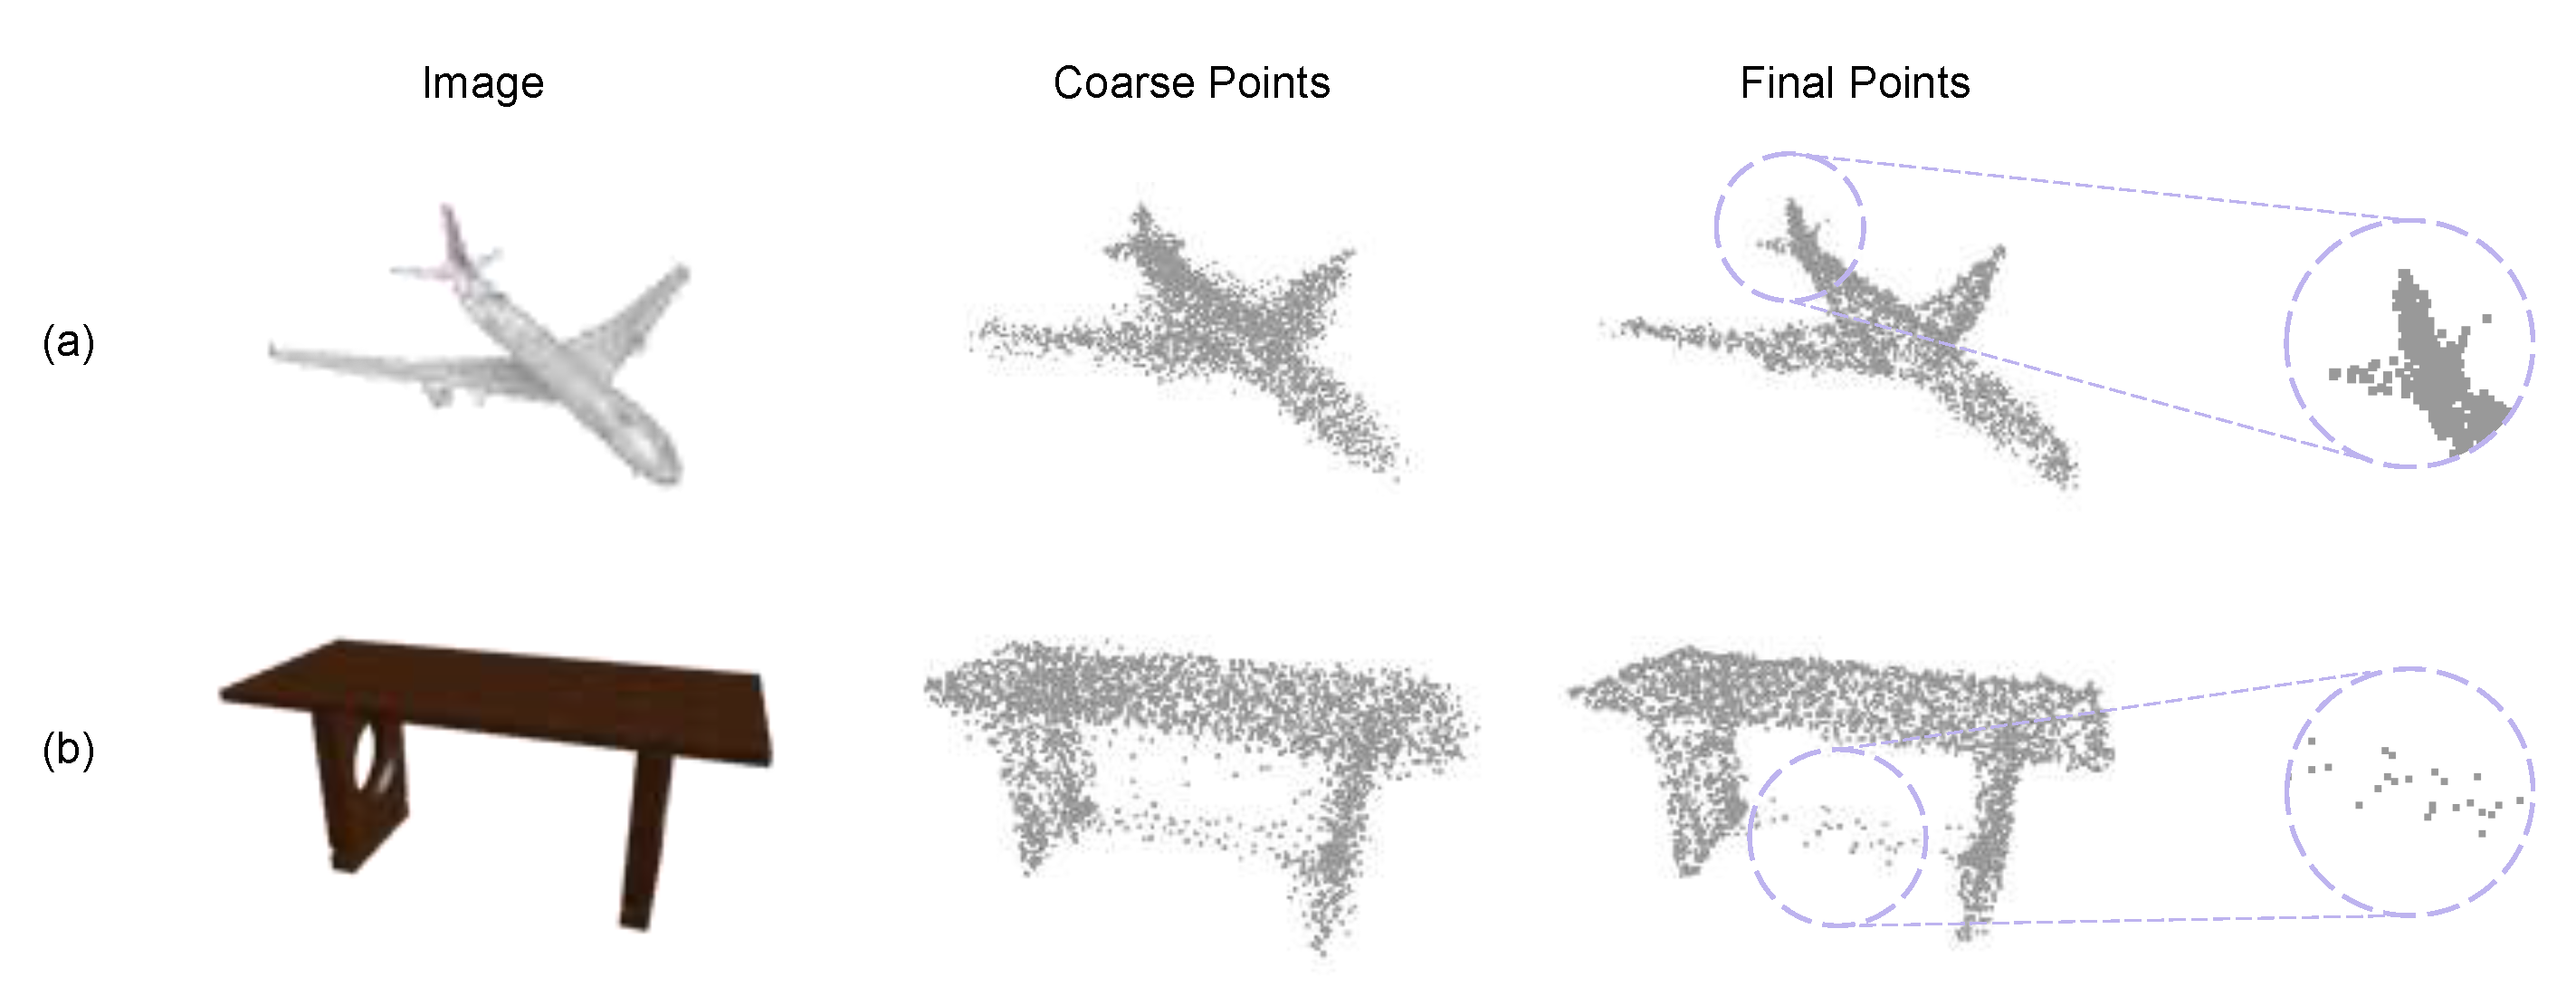
We present some failure cases in Figure 10. For each object, we show the coarse point cloud generated by the point cloud generator and the final reconstruction result. Figure 10a shows that the horizontal wing on the left side of the plane’s tail is not well fitted, even though several points attempt to extend to the left to reconstruct the details in this part. This is because although our model can fit detailed topology through local geometric position encoding and global adaptive information exchange, it does not explicitly guide the structural integrity of small components like the tail wings of an aircraft. It can be observed that the Transformer-based refinement module provides some corrective capability, but it may encounter performance bottlenecks due to constraints in local point cloud distribution or weak image textures. Figure 10b illustrates an instance where our model generates some noise points under a table. In fact, this is a reconstruction error—the model attempts to generate a horizontal connecting component at this location. From the intermediate result, it is apparent that the point cloud generator incorrectly generates some points under the table during decoding, and the refinement network tries to correct this error. However, due to the maximum distance limitation for the deformation of each point, it cannot move all incorrectly generated points to the correct positions, resulting in several noise-like outlier points in the final output.
To solve these problems, we will optimize both modules of our network. Firstly, refining the training of the point cloud generator may be a good choice because a more accurate point cloud in the generation stage can significantly reduce the correction difficulty in the subsequent refinement module. Secondly, it may be helpful to increase the flexibility of the deformation network, such as increasing the number of deformation steps, to enhance its correction capabilities. All of these aspects will be the focus of our research in the next stage.
5. Conclusions
In conclusion, our work integrates the Transformer architecture into multi-view point cloud reconstruction. PCR-T, our proposed deep neural network, excels in handling non-overlapping and sparse input views, offering improved precision and completeness in 3D structure reconstruction. The Transformer-based refiner facilitates adaptive information exchange among unordered points, resulting in superior performance on the ShapeNet dataset compared to existing methods. Future research could focus on optimizing network efficiency, exploring additional modalities, and extending PCR-T’s applicability to diverse real-world scenarios.
Author Contributions
Conceptualization, Y.S. and L.L.; methodology, Y.S.; software, Y.S. and L.L.; validation, L.L., Y.W. and D.Y.; formal analysis, Y.W.; investigation, D.Y.; resources, Y.W.; data curation, W.Z.; writing—original draft preparation, Y.S. and Y.W.; writing—review and editing, L.L. and D.Y.; visualization, W.Z.; supervision, J.X.; project administration, J.X.; funding acquisition, J.X. All authors have read and agreed to the published version of the manuscript.
Funding
This research is supported by the National Natural Science Foundation of China (U21A20515,
62102393, 62206263, 62271467), Beijing Natural Science Foundation (4242053), China Postdoctoral
Science Foundation (2022T150639, 2021M703162), the State Key Laboratory of Robotics and Systems
(HIT) (SKLRS-2022-KF-11), and the Fundamental Research Funds for the Central Universities.
Data Availability Statement
The data presented in this paper are openly available at https://github.com/chrischoy/3D-R2N2, accessed on 1 November 2022.
Conflicts of Interest
The authors declare no conflicts of interest.
References
- Yao, Y.; Luo, Z.; Li, S.; Fang, T.; Quan, L. Mvsnet: Depth inference for unstructured multi-view stereo. In Proceedings of the European Conference on Computer Vision, Munich, Germany, 8–14 September 2018; Springer: Berlin/Heidelberg, Germany, 2018; pp. 767–783. [Google Scholar]
- Chen, R.; Han, S.; Xu, J.; Su, H. Point-based multi-view stereo network. In Proceedings of the IEEE International Conference on Computer Vision, Seoul, Republic of Korea, 27 October–2 November 2019; pp. 1538–1547. [Google Scholar]
- Li, J.; Lu, Z.; Wang, Y.; Wang, Y.; Xiao, J. DS-MVSNet: Unsupervised Multi-view Stereo via Depth Synthesis. In Proceedings of the ACM International Conference on Multimedia, Lisboa, Portugal, 10–14 October 2022; pp. 5593–5601. [Google Scholar]
- Jia, R.; Chen, X.; Cui, J.; Hu, Z. MVS-T: A coarse-to-fine multi-view stereo network with transformer for low-resolution images 3D reconstruction. Sensors 2022, 22, 7659. [Google Scholar] [CrossRef] [PubMed]
- Wen, C.; Zhang, Y.; Li, Z.; Fu, Y. Pixel2mesh++: Multi-view 3d mesh generation via deformation. In Proceedings of the IEEE International Conference on Computer Vision, Seoul, Republic of Korea, 27 October–2 November 2019; pp. 1042–1051. [Google Scholar]
- Xie, H.; Yao, H.; Sun, X.; Zhou, S.; Zhang, S. Pix2vox: Context-aware 3d reconstruction from single and multi-view images. In Proceedings of the IEEE International Conference on Computer Vision, Seoul, Republic of Korea, 27 October–2 November 2019; pp. 2690–2698. [Google Scholar]
- Tang, J.; Han, X.; Tan, M.; Tong, X.; Jia, K. Skeletonnet: A topology-preserving solution for learning mesh reconstruction of object surfaces from rgb images. IEEE Trans. Pattern Anal. Mach. Intell. 2021, 44, 6454–6471. [Google Scholar] [CrossRef]
- Wu, Z.; Song, S.; Khosla, A.; Yu, F.; Zhang, L.; Tang, X.; Xiao, J. 3d shapenets: A deep representation for volumetric shapes. In Proceedings of the IEEE Conference on Computer Vision and Pattern Recognition, Boston, MA, USA, 7–12 June 2015; pp. 1912–1920. [Google Scholar]
- Durou, J.D.; Falcone, M.; Sagona, M. Numerical methods for shape-from-shading: A new survey with benchmarks. Comput. Vis. Image Underst. 2008, 109, 22–43. [Google Scholar] [CrossRef]
- Richter, S.R.; Roth, S. Discriminative shape from shading in uncalibrated illumination. In Proceedings of the IEEE Conference on Computer Vision and Pattern Recognition, Boston, MA, USA, 7–12 June 2015; pp. 1128–1136. [Google Scholar]
- Witkin, A.P. Recovering surface shape and orientation from texture. Artif. Intell. 1981, 17, 17–45. [Google Scholar] [CrossRef]
- Zhang, R.; Tsai, P.S.; Cryer, J.E.; Shah, M. Shape-from-shading: A survey. IEEE Trans. Pattern Anal. Mach. Intell. 1999, 21, 690–706. [Google Scholar] [CrossRef]
- Wu, J.; Zhang, C.; Xue, T.; Freeman, W.T.; Tenenbaum, J.B. Learning a probabilistic latent space of object shapes via 3D generative-adversarial modeling. In Proceedings of the International Conference on Neural Information Processing Systems, Barcelona, Spain, 5–10 December 2016; pp. 82–90. [Google Scholar]
- Fan, H.; Su, H.; Guibas, L.J. A point set generation network for 3d object reconstruction from a single image. In Proceedings of the IEEE Conference on Computer Vision and Pattern Recognition, Honolulu, HI, USA, 21–26 July 2017; pp. 605–613. [Google Scholar]
- Mandikal, P.; Navaneet, K.; Agarwal, M.; Babu, R.V. 3D-LMNet: Latent embedding matching for accurate and diverse 3D point cloud reconstruction from a single image. arXiv 2018, arXiv:1807.07796. [Google Scholar]
- Mandikal, P.; Radhakrishnan, V.B. Dense 3d point cloud reconstruction using a deep pyramid network. In Proceedings of the IEEE Winter Conference on Applications of Computer Vision, Waikoloa Village, HI, USA, 7–11 January 2019; pp. 1052–1060. [Google Scholar]
- Wang, P.; Liu, L.; Zhang, H.; Wang, T. CGNet: A Cascaded Generative Network for dense point cloud reconstruction from a single image. Knowl.-Based Syst. 2021, 223, 107057. [Google Scholar] [CrossRef]
- Li, B.; Zhu, S.; Lu, Y. A single stage and single view 3D point cloud reconstruction network based on DetNet. Sensors 2022, 22, 8235. [Google Scholar] [CrossRef] [PubMed]
- Choi, S.; Nguyen, A.D.; Kim, J.; Ahn, S.; Lee, S. Point cloud deformation for single image 3d reconstruction. In Proceedings of the IEEE International Conference on Image Processing, Taipei, Taiwan, 22–25 September 2019; pp. 2379–2383. [Google Scholar]
- Ping, G.; Esfahani, M.A.; Wang, H. Visual enhanced 3D point cloud reconstruction from a single image. arXiv 2021, arXiv:2108.07685. [Google Scholar]
- Wen, X.; Zhou, J.; Liu, Y.S.; Su, H.; Dong, Z.; Han, Z. 3D shape reconstruction from 2D images with disentangled attribute flow. In Proceedings of the IEEE Conference on Computer Vision and Pattern Recognition, New Orleans, LA, USA, 18–24 June 2022; pp. 3803–3813. [Google Scholar]
- Choy, C.B.; Xu, D.; Gwak, J.; Chen, K.; Savarese, S. 3D-R2N2: A unified approach for single and multi-view 3d object reconstruction. In Proceedings of the European Conference on Computer Vision, Amsterdam, The Netherlands, 11–14 October 2016; Springer: Berlin/Heidelberg, Germany, 2016; pp. 628–644. [Google Scholar]
- Tatarchenko, M.; Dosovitskiy, A.; Brox, T. Octree generating networks: Efficient convolutional architectures for high-resolution 3d outputs. In Proceedings of the IEEE International Conference on Computer Vision, Venice, Italy, 22–29 October 2017; pp. 2088–2096. [Google Scholar]
- Shen, W.; Jia, Y.; Wu, Y. 3D shape reconstruction from images in the frequency domain. In Proceedings of the IEEE Conference on Computer Vision and Pattern Recognition, Long Beach, CA, USA, 15–20 June 2019; pp. 4471–4479. [Google Scholar]
- Wang, W.; Xu, Q.; Ceylan, D.; Mech, R.; Neumann, U. DISN: Deep implicit surface network for high-quality single-view 3D reconstruction. In Proceedings of the International Conference on Neural Information Processing Systems, Vancouver, BC, Canada, 8–14 December 2019; pp. 492–502. [Google Scholar]
- Lorensen, W.E.; Cline, H.E. Marching cubes: A high resolution 3D surface construction algorithm. ACM SIGGRAPH Comput. Graph. 1987, 21, 163–169. [Google Scholar] [CrossRef]
- Wang, N.; Zhang, Y.; Li, Z.; Fu, Y.; Liu, W.; Jiang, Y.G. Pixel2mesh: Generating 3d mesh models from single rgb images. In Proceedings of the European Conference on Computer Vision, Munich, Germany, 8–14 September 2018; Springer: Berlin/Heidelberg, Germany, 2018; pp. 52–67. [Google Scholar]
- Mescheder, L.; Oechsle, M.; Niemeyer, M.; Nowozin, S.; Geiger, A. Occupancy networks: Learning 3d reconstruction in function space. In Proceedings of the IEEE Conference on Computer Vision and Pattern Recognition, Long Beach, CA, USA, 15–20 June 2019; pp. 4460–4470. [Google Scholar]
- Lin, C.H.; Kong, C.; Lucey, S. Learning efficient point cloud generation for dense 3d object reconstruction. In Proceedings of the AAAI Conference on Artificial Intelligence, New Orleans, LA, USA, 2–7 February 2018; pp. 7114–7121. [Google Scholar]
- Insafutdinov, E.; Dosovitskiy, A. Unsupervised learning of shape and pose with differentiable point clouds. In Proceedings of the International Conference on Neural Information Processing Systems, Montréal, QC, Canada, 3–8 December 2018; pp. 2807–2817. [Google Scholar]
- Wang, J.; Sun, B.; Lu, Y. Mvpnet: Multi-view point regression networks for 3d object reconstruction from a single image. In Proceedings of the AAAI Conference on Artificial Intelligence, Honolulu, HI, USA, 27 January–1 February 2019; pp. 8949–8956. [Google Scholar]
- Jia, X.; Yang, S.; Peng, Y.; Zhang, J.; Chen, S. DV-Net: Dual-view network for 3D reconstruction by fusing multiple sets of gated control point clouds. Pattern Recognit. Lett. 2020, 131, 376–382. [Google Scholar]
- Xie, H.; Yao, H.; Zhang, S.; Zhou, S.; Sun, W. Pix2Vox++: Multi-scale context-aware 3D object reconstruction from single and multiple images. Int. J. Comput. Vis. 2020, 128, 2919–2935. [Google Scholar] [CrossRef]
- Spezialetti, R.; Tan, D.J.; Tonioni, A.; Tateno, K.; Tombari, F. A divide et Impera approach for 3D shape reconstruction from multiple views. In Proceedings of the International Conference on 3D Vision, Fukuoka, Japan, 25–28 November 2020; pp. 160–170. [Google Scholar]
- Vaswani, A.; Shazeer, N.; Parmar, N.; Uszkoreit, J.; Jones, L.; Gomez, A.N.; Kaiser, Ł.; Polosukhin, I. Attention is all you need. In Proceedings of the International Conference on Neural Information Processing Systems, Long Beach, CA, USA, 4–9 December 2017; pp. 6000–6010. [Google Scholar]
- Lu, D.; Xie, Q.; Wei, M.; Gao, K.; Xu, L.; Li, J. Transformers in 3d point clouds: A survey. arXiv 2022, arXiv:2205.07417. [Google Scholar]
- Lahoud, J.; Cao, J.; Khan, F.S.; Cholakkal, H.; Anwer, R.M.; Khan, S.; Yang, M.H. 3D vision with transformers: A survey. arXiv 2022, arXiv:2208.04309. [Google Scholar]
- Lu, Q.; Xiao, M.; Lu, Y.; Yuan, X.; Yu, Y. Attention-based dense point cloud reconstruction from a single image. IEEE Access 2019, 7, 137420–137431. [Google Scholar] [CrossRef]
- Wang, D.; Cui, X.; Chen, X.; Zou, Z.; Shi, T.; Salcudean, S.; Wang, Z.J.; Ward, R. Multi-view 3d reconstruction with transformers. In Proceedings of the IEEE International Conference on Computer Vision, Montreal, BC, Canada, 11–17 October 2021; pp. 5722–5731. [Google Scholar]
- Yuan, Y.; Tang, J.; Zou, Z. Vanet: A view attention guided network for 3d reconstruction from single and multi-view images. In Proceedings of the IEEE International Conference on Multimedia and Expo, Shenzhen, China, 5–9 July 2021; pp. 1–6. [Google Scholar]
- Tiong, L.C.O.; Sigmund, D.; Teoh, A.B.J. 3D-C2FT: Coarse-to-fine Transformer for Multi-view 3D Reconstruction. In Proceedings of the Asian Conference on Computer Vision, Macau, China, 4–8 December 2022; pp. 1438–1454. [Google Scholar]
- Huang, Y.; Zhou, S.; Zhang, J.; Dong, J.; Zheng, N. VPFusion: Towards Robust Vertical Representation Learning for 3D Object Detection. arXiv 2023, arXiv:2304.02867. [Google Scholar]
- Yagubbayli, F.; Wang, Y.; Tonioni, A.; Tombari, F. Legoformer: Transformers for block-by-block multi-view 3d reconstruction. arXiv 2021, arXiv:2106.12102. [Google Scholar]
- He, K.; Zhang, X.; Ren, S.; Sun, J. Deep residual learning for image recognition. In Proceedings of the IEEE Conference on Computer Vision and Pattern Recognition, Las Vegas, NV, USA, 27–30 June 2016; pp. 770–778. [Google Scholar]
- Qi, C.R.; Yi, L.; Su, H.; Guibas, L.J. PointNet++ deep hierarchical feature learning on point sets in a metric space. In Proceedings of the International Conference on Neural Information Processing Systems, Long Beach, CA, USA, 4–9 December 2017; pp. 5105–5114. [Google Scholar]
- Wang, Y.; Sun, Y.; Liu, Z.; Sarma, S.E.; Bronstein, M.M.; Solomon, J.M. Dynamic graph cnn for learning on point clouds. ACM Trans. Graph. 2019, 38, 1–12. [Google Scholar] [CrossRef]
- Sun, X.; Wu, J.; Zhang, X.; Zhang, Z.; Zhang, C.; Xue, T.; Tenenbaum, J.B.; Freeman, W.T. Pix3d: Dataset and methods for single-image 3d shape modeling. In Proceedings of the IEEE Conference on Computer Vision and Pattern Recognition, Salt Lake City, UT, USA, 18–22 June 2018; pp. 2974–2983. [Google Scholar]
Figure 1.
The pipeline for the proposed method. Our PCR-T consists of a generator to fuse point clouds predicted from multi-view images and a refiner to obtain a more accurate result. The geometric features produced by the image encoder are low-level image convolution features used to describe geometric details.

Figure 2.
Detailed structure of the Transformer-based refiner. We adopt the encoder–decoder architecture like traditional Transformers to deeply explore relationships among all the points. The local-attention block is employed to normalize the probability regression of deformation proposals for each point.
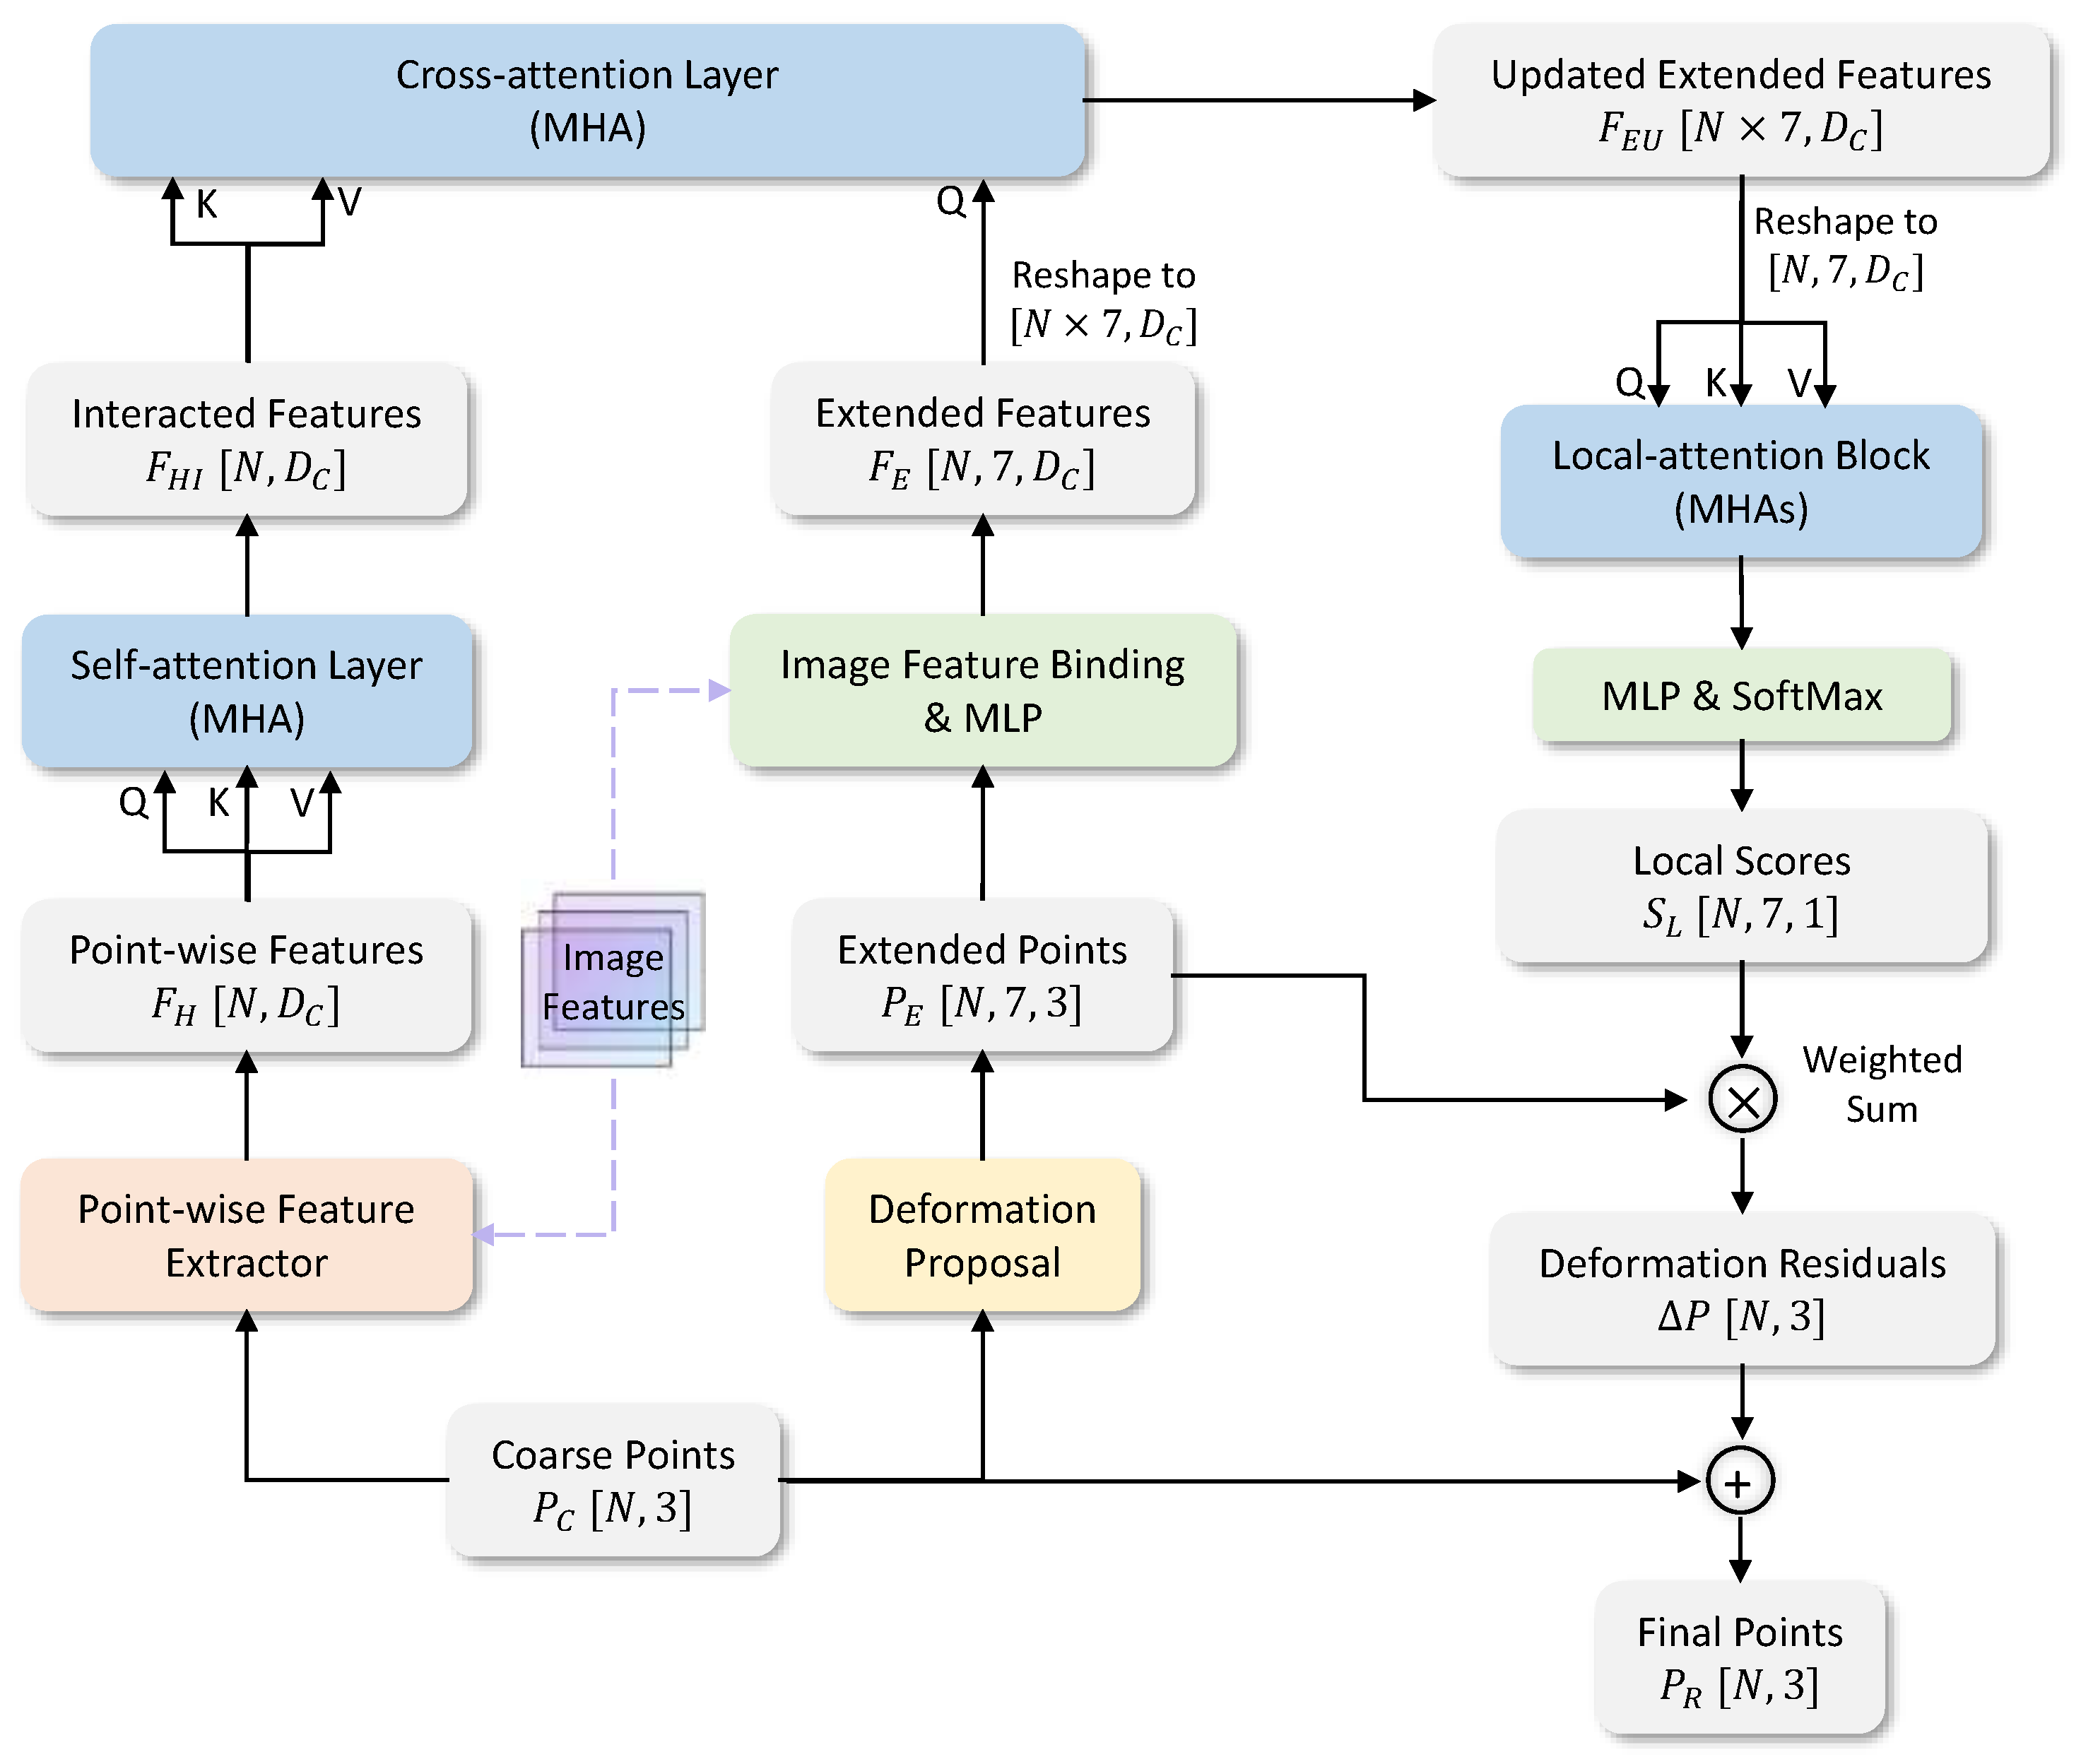
Figure 3.
Image feature binding operation. The 3D points are projected to image planes and bound with low-level image features via bilinear interpolation. Features from different viewpoints are integrated by several statistics, such as max, mean, and std.
Figure 3.
Image feature binding operation. The 3D points are projected to image planes and bound with low-level image features via bilinear interpolation. Features from different viewpoints are integrated by several statistics, such as max, mean, and std.
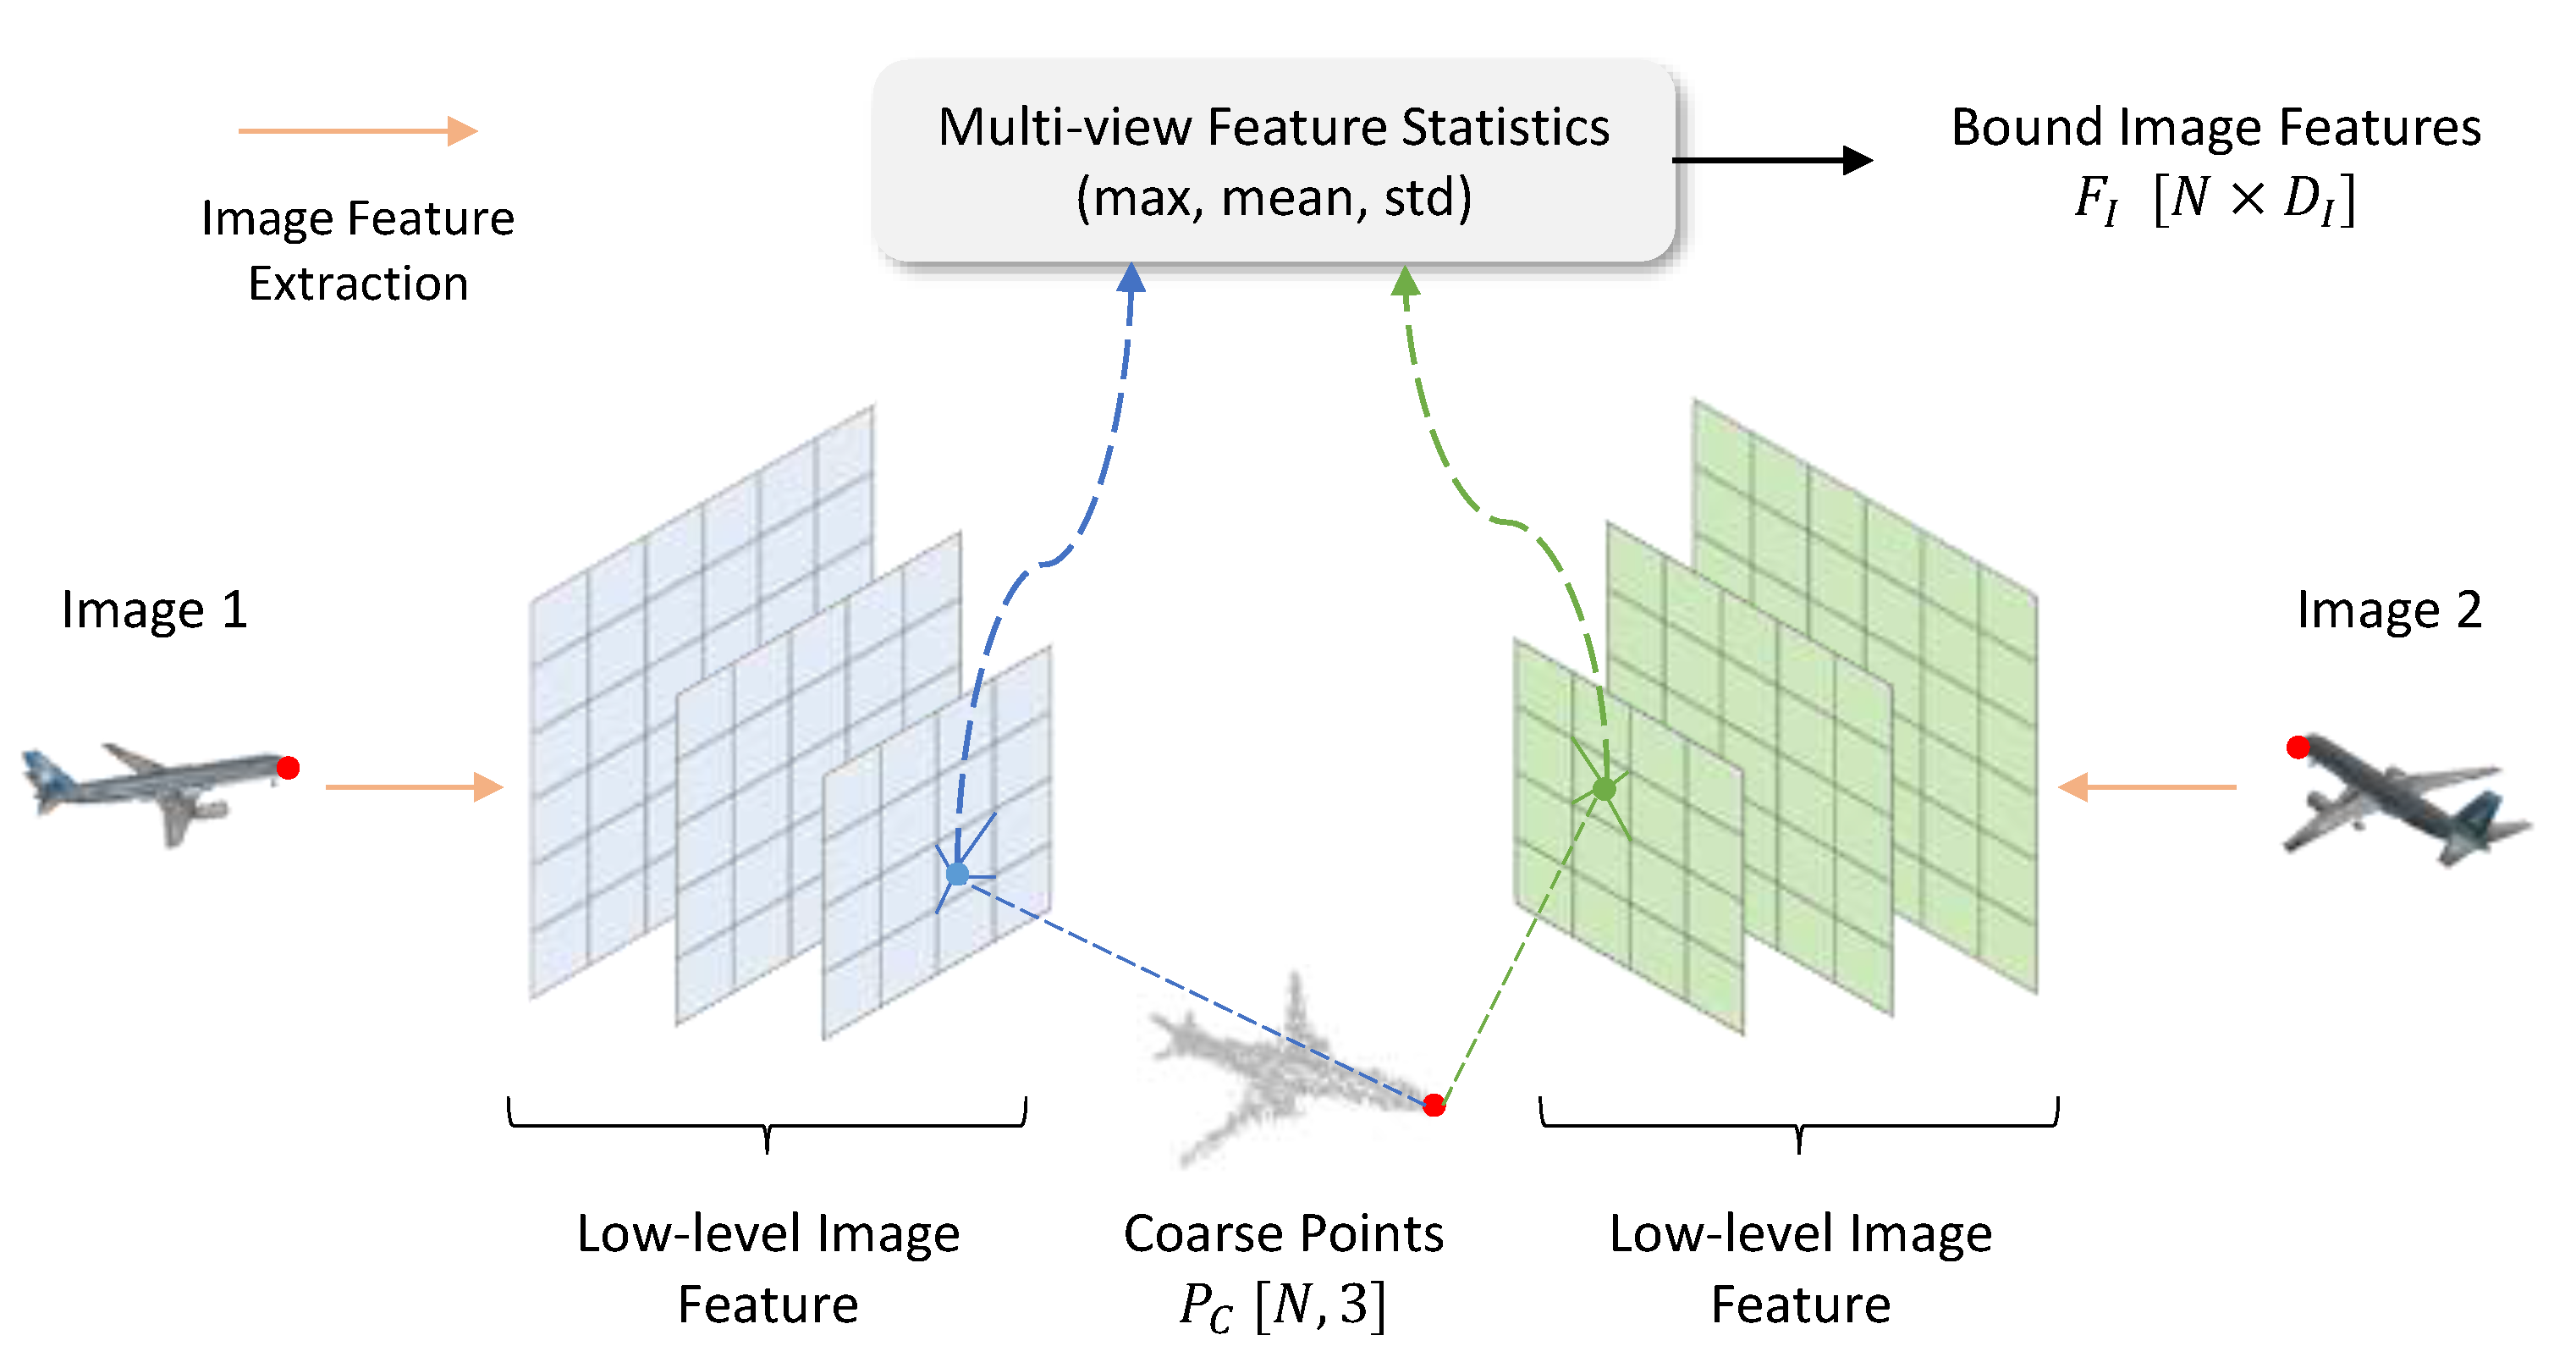
Figure 4.
Geometric position fusion operation. The local geometric information of each point is encoded relatively by the operator.
Figure 4.
Geometric position fusion operation. The local geometric information of each point is encoded relatively by the operator.
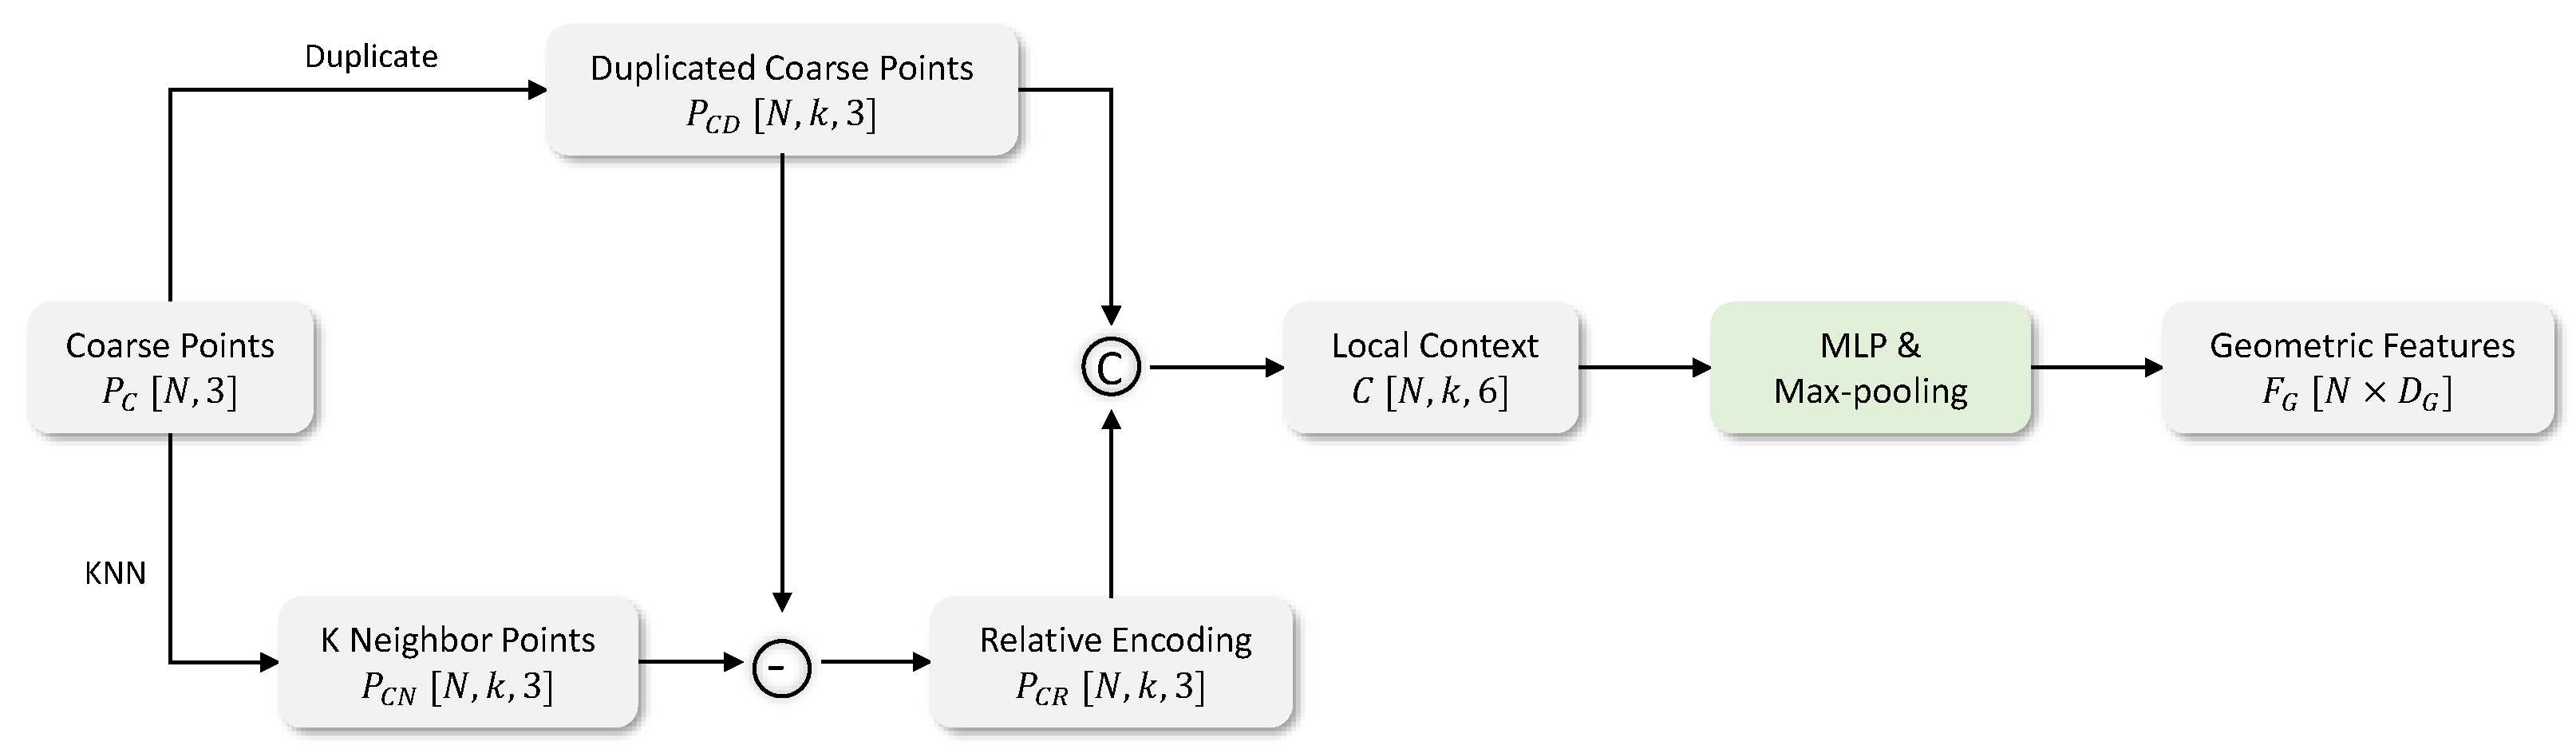
Figure 5.
Quantitative analysis results for the chair category. From left to right, we show in each column the input image at main view, the ground truth, and the results of Pixel2Mesh++ [5], SkeletonNet [7], and ours. The chair category is representative as it requires attention to both the overall completeness and specific details of components.

Figure 6.
Quantitative analysis results for other categories. From left to right, we show in each column the input image at main view, the ground truth, and the results of Pixel2Mesh++ [5], SkeletonNet [7], and ours.
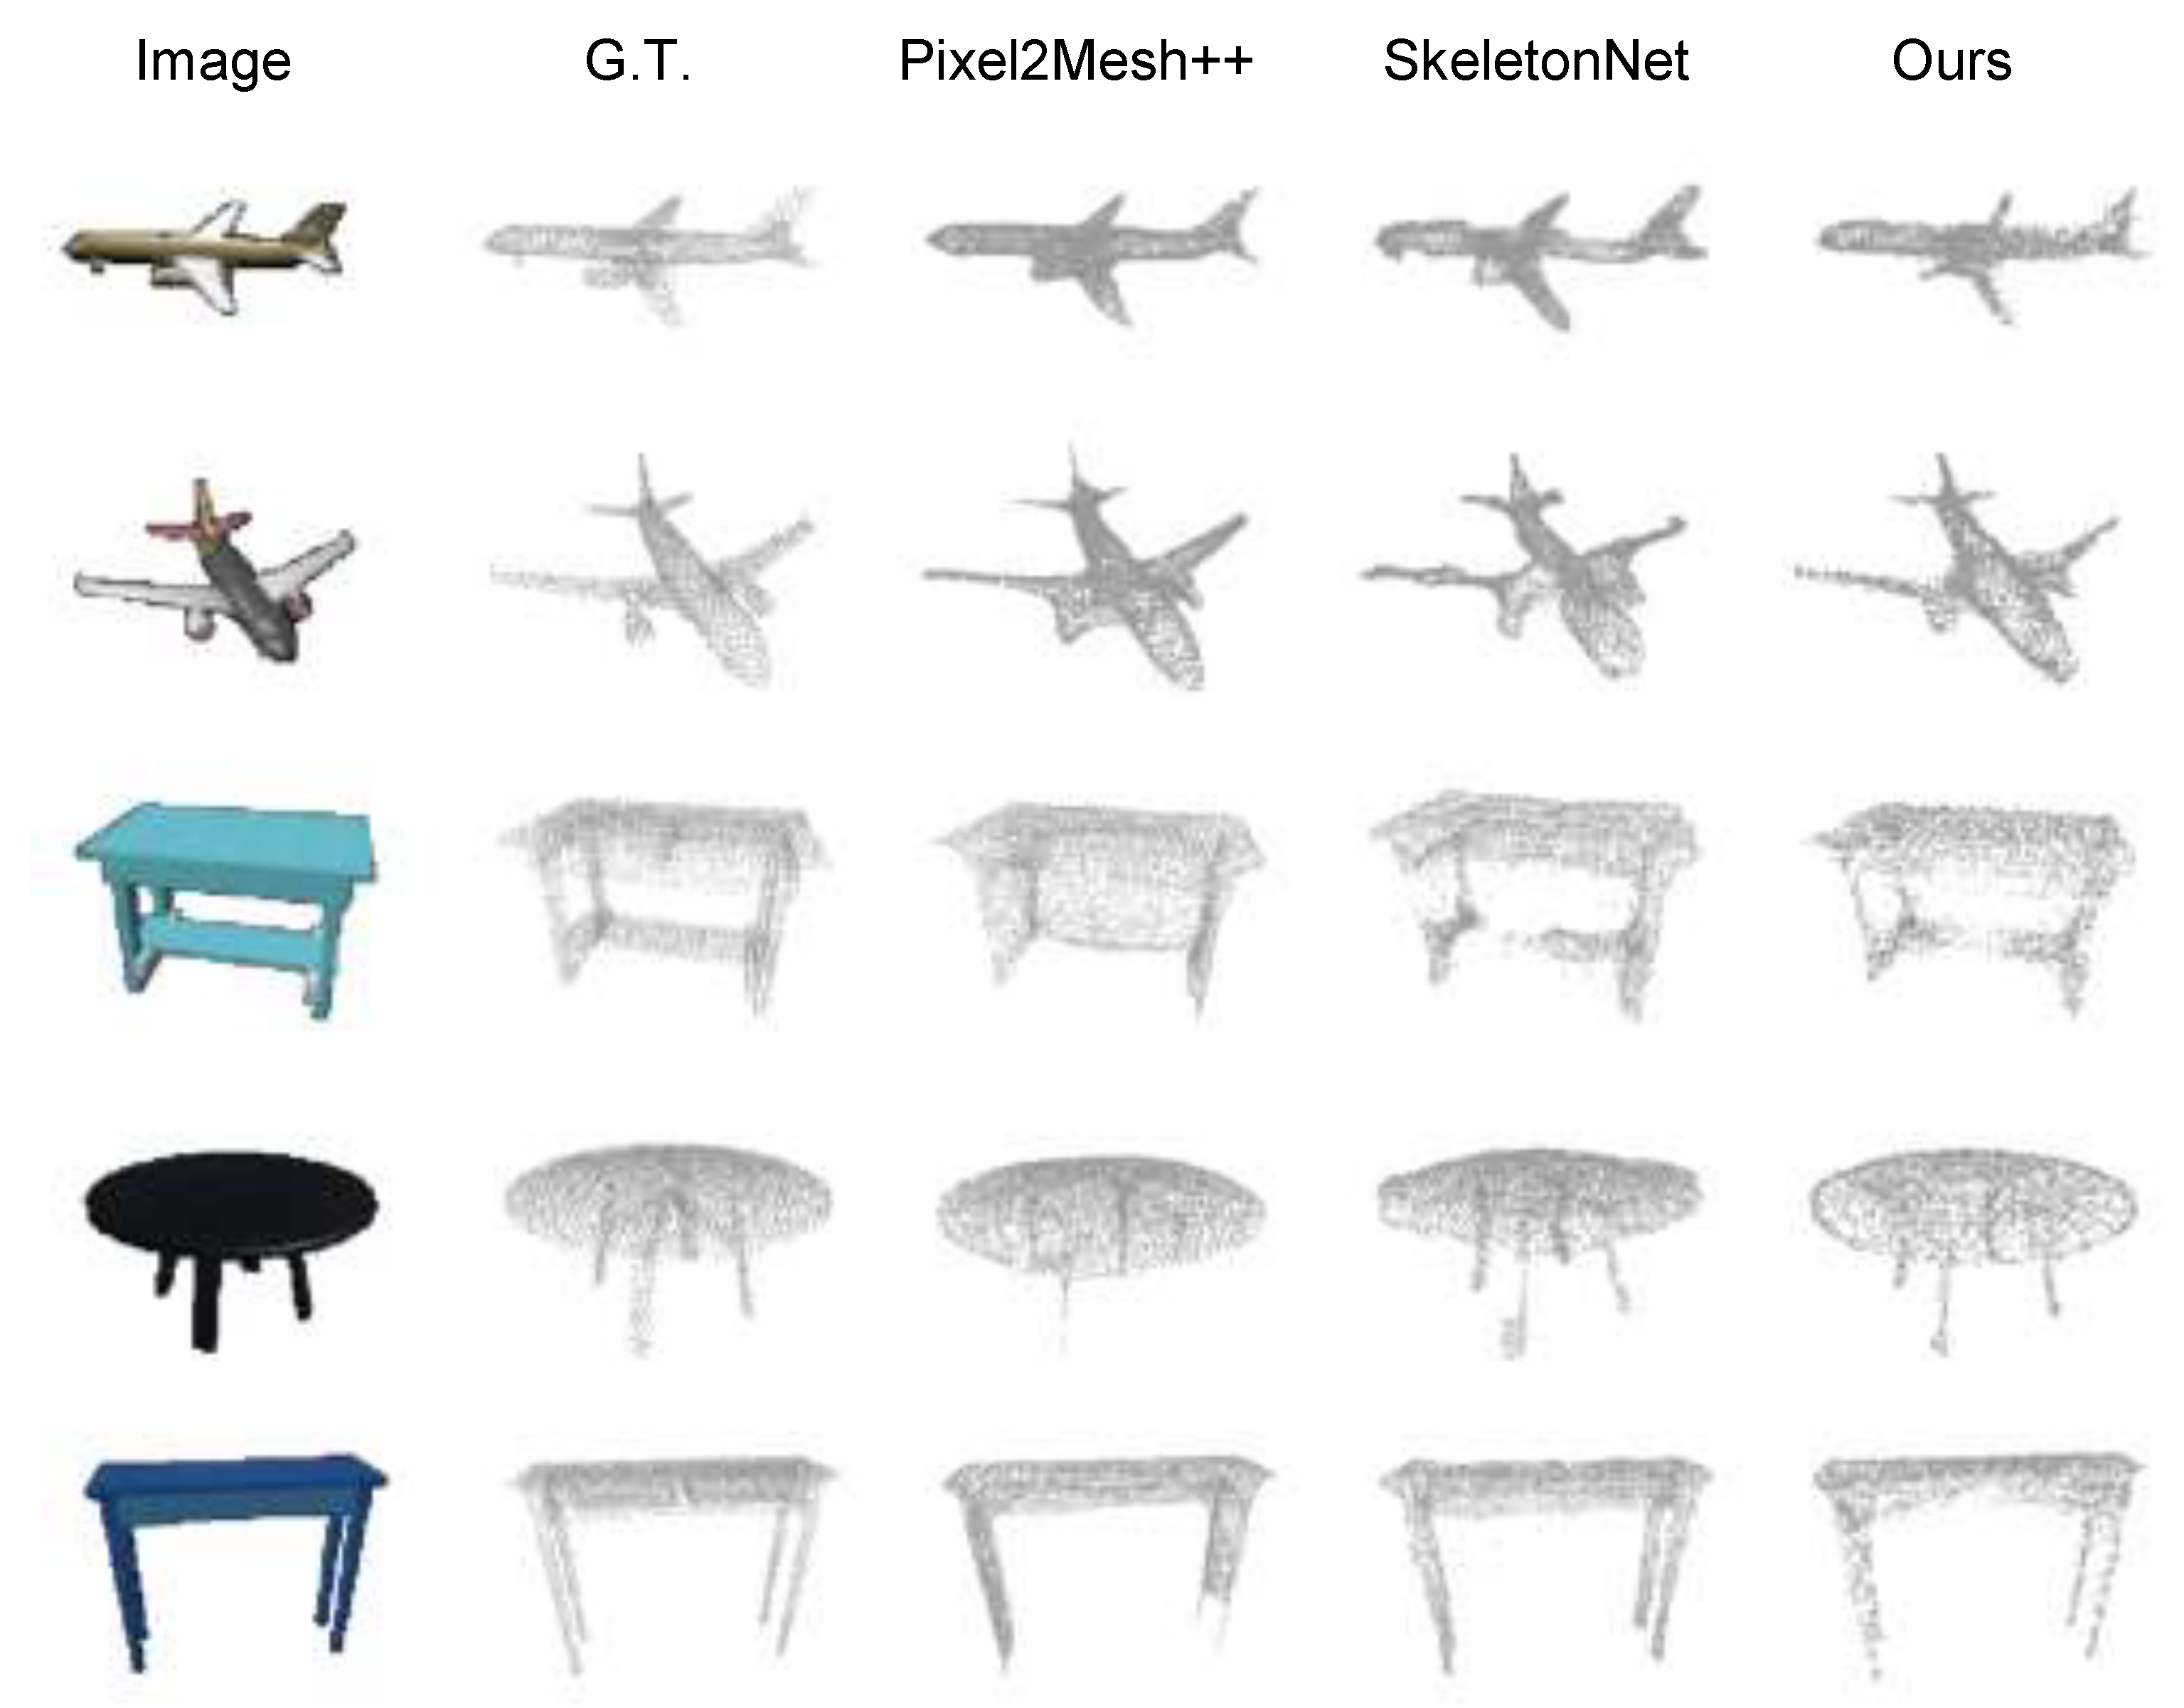
Figure 7.
Visualization of detailed topology. We magnify some details, showcasing the reconstruction capability of our method and two competitive approaches for elongated components and complex topology. Our method significantly outperforms the other two.
Figure 7.
Visualization of detailed topology. We magnify some details, showcasing the reconstruction capability of our method and two competitive approaches for elongated components and complex topology. Our method significantly outperforms the other two.

Figure 8.
Comparisons among the three methods are conducted in terms of number of parameters and inference speed. The number of parameters is measured in terms of million (M), and the inference speed is represented by the time required to generate a shape. CD and F-score under threshold are also presented.
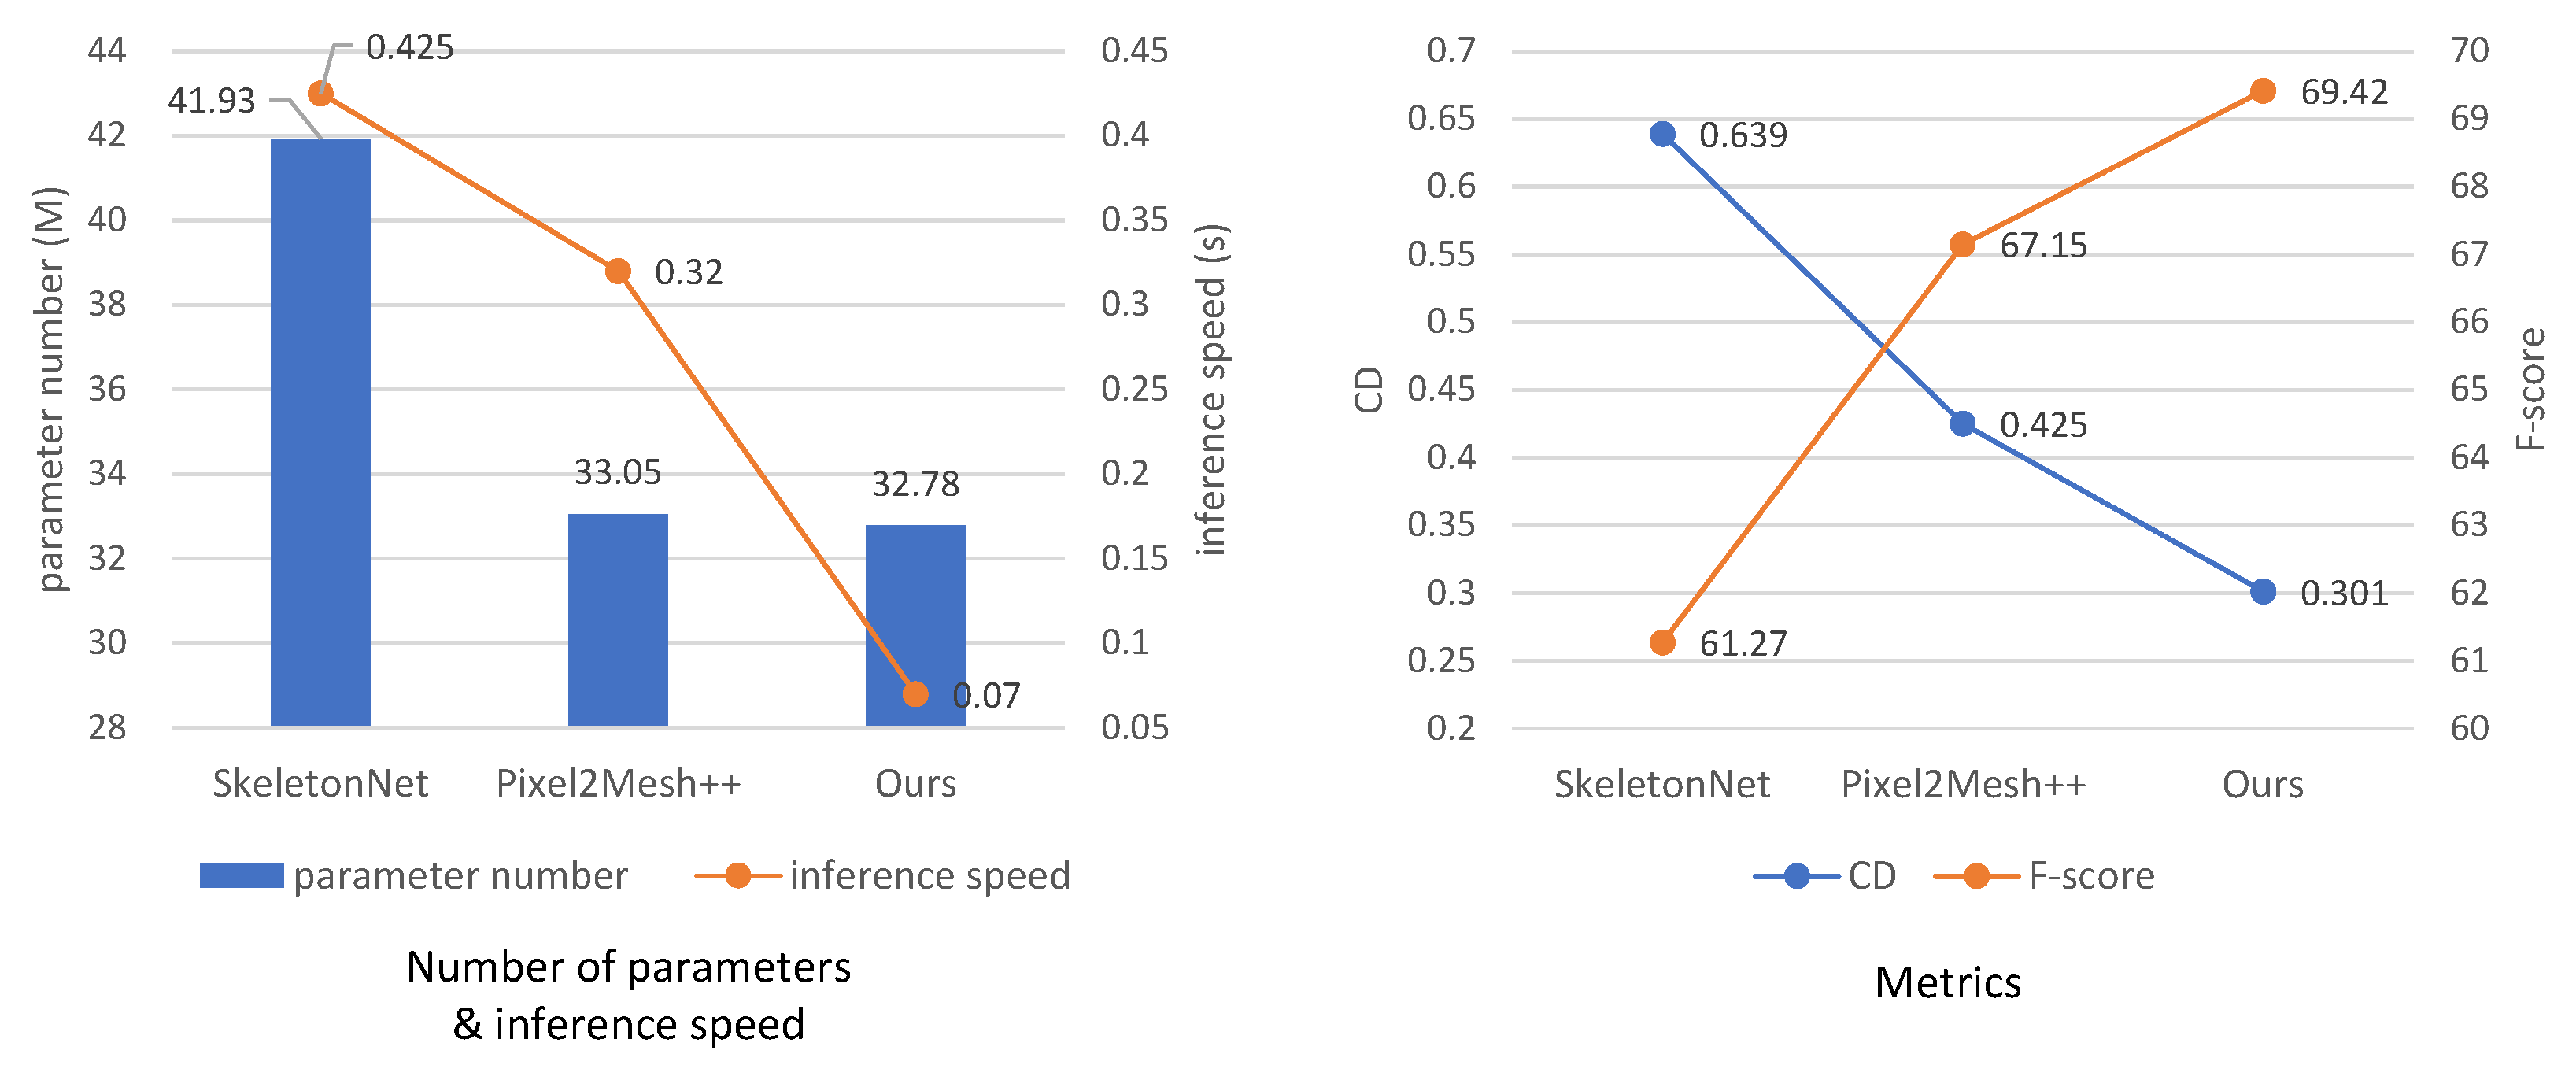
Figure 9.
Reconstruction results on Pix3D dataset. For real-world images, our model can still reconstruct complete and accurate point clouds effectively.
Figure 9.
Reconstruction results on Pix3D dataset. For real-world images, our model can still reconstruct complete and accurate point clouds effectively.
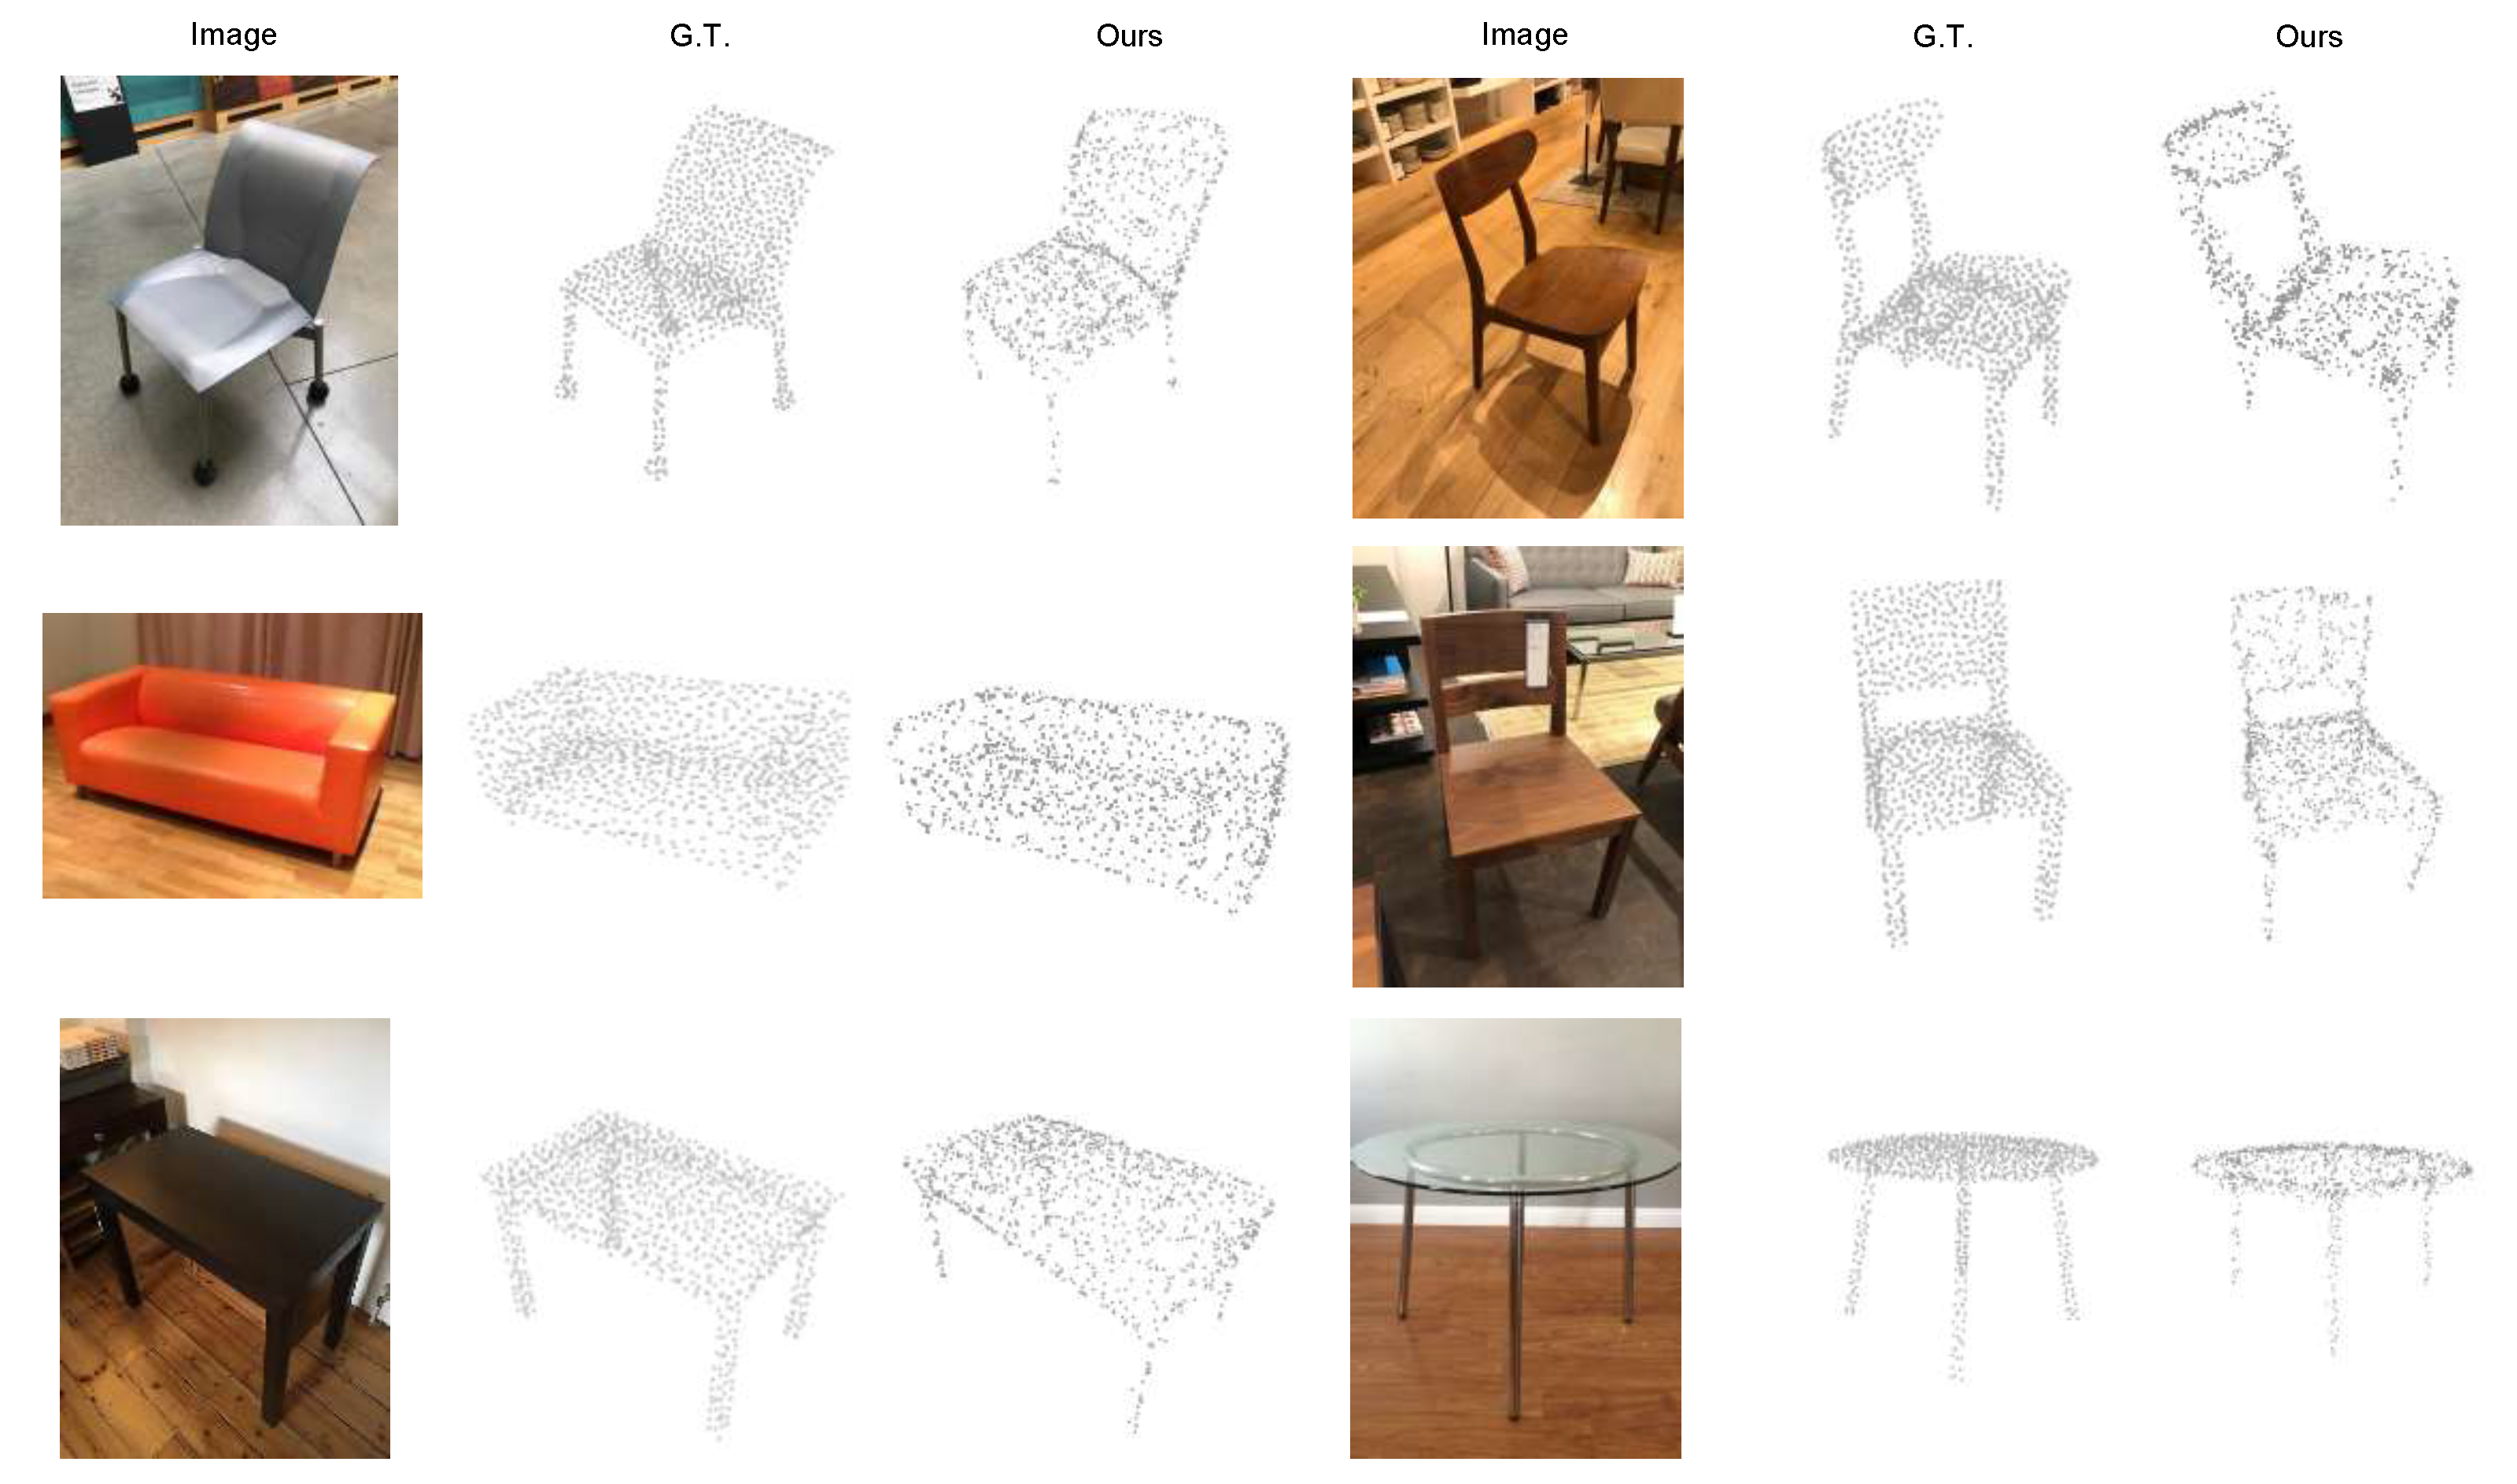
Figure 10.
Failure cases. (a) Small component is not well fitted. (b) Outlier points at incorrect positions.
Figure 10.
Failure cases. (a) Small component is not well fitted. (b) Outlier points at incorrect positions.

Table 1.
Chamfer Distance (CD) on ShapeNet. Smaller is better. The best score for each category is written in bold.
Table 1.
Chamfer Distance (CD) on ShapeNet. Smaller is better. The best score for each category is written in bold.
| Category | CD (×0.001) ↓ | ||||
|---|---|---|---|---|---|
| 3D-R2N2 | Pixel2Mesh++ | SkeletonNet | DV-Net | Ours | |
| Plane | 0.854 | 0.422 | 0.732 | 0.338 | 0.184 |
| Bench | 1.362 | 0.549 | 0.447 | 0.396 | 0.236 |
| Cabinet | 0.613 | 0.337 | 0.625 | 0.291 | 0.285 |
| Car | 0.358 | 0.253 | 0.278 | 0.246 | 0.203 |
| Chair | 1.534 | 0.461 | 0.589 | 0.466 | 0.324 |
| Monitor | 1.465 | 0.566 | 0.536 | 0.466 | 0.294 |
| Lamp | 6.780 | 1.135 | 1.268 | 0.857 | 0.760 |
| Speaker | 1.443 | 0.635 | 0.910 | 0.527 | 0.423 |
| Firearm | 0.432 | 0.305 | 0.365 | 0.354 | 0.197 |
| Coach | 0.806 | 0.439 | 0.491 | 0.396 | 0.308 |
| Table | 1.243 | 0.388 | 0.568 | 0.351 | 0.329 |
| Cellphone | 1.161 | 0.325 | 0.604 | 0.297 | 0.154 |
| Watercraft | 0.869 | 0.508 | 0.572 | 0.488 | 0.280 |
| Mean | 1.455 | 0.486 | 0.639 | 0.417 | 0.301 |
Table 2.
F-score on ShapeNet at different thresholds, where . Larger is better. The best score for each category is written in bold.
Table 2.
F-score on ShapeNet at different thresholds, where . Larger is better. The best score for each category is written in bold.
| Category | F-Score () ↑ | F-Score () ↑ | ||||||
|---|---|---|---|---|---|---|---|---|
| 3D-R2N2 | SkeletonNet | Pixel2Mesh++ | Ours | 3D-R2N2 | SkeletonNet | Pixel2Mesh++ | Ours | |
| Plane | 47.81 | 59.53 | 76.79 | 81.28 | 70.49 | 74.87 | 86.62 | 91.19 |
| Bench | 44.56 | 68.01 | 66.24 | 73.40 | 62.47 | 82.26 | 79.67 | 87.71 |
| Cabinet | 54.08 | 59.74 | 65.72 | 65.25 | 64.42 | 79.72 | 81.57 | 83.21 |
| Car | 59.86 | 68.39 | 68.45 | 71.19 | 78.31 | 84.50 | 85.19 | 88.82 |
| Chair | 37.62 | 59.59 | 62.05 | 63.88 | 54.26 | 75.82 | 77.68 | 81.30 |
| Monitor | 36.33 | 60.45 | 60.00 | 65.56 | 48.65 | 79.57 | 75.42 | 82.62 |
| Lamp | 32.25 | 49.52 | 62.56 | 58.78 | 49.38 | 56.81 | 74.00 | 73.08 |
| Speaker | 41.48 | 47.15 | 54.88 | 55.23 | 52.29 | 67.47 | 71.46 | 72.77 |
| Firearm | 55.72 | 67.95 | 74.85 | 82.38 | 76.79 | 83.15 | 89.29 | 91.39 |
| Coach | 45.47 | 57.23 | 57.56 | 58.91 | 59.97 | 74.56 | 75.33 | 79.91 |
| Table | 48.78 | 65.90 | 71.89 | 72.34 | 62.67 | 81.66 | 84.19 | 85.36 |
| Cellphone | 58.09 | 72.64 | 74.36 | 78.70 | 69.66 | 85.24 | 86.16 | 93.35 |
| Watercraft | 40.72 | 61.07 | 62.99 | 68.16 | 63.59 | 78.91 | 77.32 | 83.86 |
| Mean | 46.37 | 61.27 | 66.48 | 69.42 | 62.53 | 77.43 | 80.30 | 84.71 |
Table 3.
Performance under different numbers of views. Our PCR-T performs better when seeing more images even though the number of input views is fixed as three during training.
Table 3.
Performance under different numbers of views. Our PCR-T performs better when seeing more images even though the number of input views is fixed as three during training.
| Training Views | Metrics | Testing Views | |||
|---|---|---|---|---|---|
| 2 | 3 | 4 | 5 | ||
| 3 | CD ↓ | 0.348 | 0.301 | 0.297 | 0.291 |
| F-score () ↑ | 67.73 | 69.42 | 69.79 | 70.26 | |
| F-score () ↑ | 82.86 | 84.71 | 85.10 | 85.67 | |
| Resp. | CD ↓ | 0.356 | 0.301 | 0.293 | 0.288 |
| F-score () ↑ | 67.34 | 69.42 | 70.15 | 70.58 | |
| F-score () ↑ | 82.27 | 84.71 | 85.52 | 86.03 | |
Table 4.
Ablation study. Effects of several components are evaluated by the two metrics.
| Variant Methods | CD ↓ | F-Score () ↑ | F-Score () ↑ |
|---|---|---|---|
| w/o centroid constraint | 0.315 | 68.53 | 83.79 |
| w/o position fusion | 0.312 | 68.72 | 84.28 |
| w/o local attention | 0.319 | 68.25 | 83.64 |
| w/o cross attention | 0.328 | 67.90 | 83.43 |
| full model | 0.301 | 69.42 | 84.71 |
Disclaimer/Publisher’s Note: The statements, opinions and data contained in all publications are solely those of the individual author(s) and contributor(s) and not of MDPI and/or the editor(s). MDPI and/or the editor(s) disclaim responsibility for any injury to people or property resulting from any ideas, methods, instructions or products referred to in the content. |
© 2024 by the authors. Licensee MDPI, Basel, Switzerland. This article is an open access article distributed under the terms and conditions of the Creative Commons Attribution (CC BY) license (https://creativecommons.org/licenses/by/4.0/).
Share and Cite
MDPI and ACS Style
Shan, Y.; Xiao, J.; Liu, L.; Wang, Y.; Yu, D.; Zhang, W. A Coarse-to-Fine Transformer-Based Network for 3D Reconstruction from Non-Overlapping Multi-View Images. Remote Sens. 2024, 16, 901. https://doi.org/10.3390/rs16050901
AMA Style
Shan Y, Xiao J, Liu L, Wang Y, Yu D, Zhang W. A Coarse-to-Fine Transformer-Based Network for 3D Reconstruction from Non-Overlapping Multi-View Images. Remote Sensing. 2024; 16(5):901. https://doi.org/10.3390/rs16050901
Chicago/Turabian StyleShan, Yue, Jun Xiao, Lupeng Liu, Yunbiao Wang, Dongbo Yu, and Wenniu Zhang. 2024. "A Coarse-to-Fine Transformer-Based Network for 3D Reconstruction from Non-Overlapping Multi-View Images" Remote Sensing 16, no. 5: 901. https://doi.org/10.3390/rs16050901
Note that from the first issue of 2016, this journal uses article numbers instead of page numbers. See further details here.