
Numerical Evaluation of Planetary Radar Backscatter Models for Self-Affine Fractal Surfaces


1
Department of Physics, University of Helsinki, Gustaf Hällströminkatu 2, 00560 Helsinki, Finland
2
Finnish Geospatial Research Institute, National Land Survey, Vuorimiehentie 5, 02150 Espoo, Finland
Remote Sens. 2024, 16(5), 890; https://doi.org/10.3390/rs16050890
Submission received: 21 December 2023
/
Revised: 23 February 2024
/
Accepted: 29 February 2024
/
Published: 2 March 2024
(This article belongs to the Special Issue Radar for Space Observation: Systems, Methods and Applications)
Abstract
:Numerous analytical radar-scattering laws have been published through the past decades to interpret planetary radar observations, such as Hagfors’ law, which has been commonly used for the Moon, and the cosine law, which is commonly used in the shape modeling of asteroids. Many of the laws have not been numerically validated in terms of their interpretation and limitations. This paper evaluates radar-scattering laws for self-affine fractal surfaces using a numerical approach. Traditionally, the autocorrelation function and, more recently, the Hurst exponent, which describes the self-affinity, have been used to quantify the height correlation. Here, hundreds of three-dimensional synthetic surfaces parameterized using a root-mean-square (rms) height and a Hurst exponent were generated, and their backscattering coefficient functions were computed to evaluate their consistency with selected analytical models. The numerical results were also compared to empirical models for roughness and radar-scattering measurements of Hawaii lava flows and found consistent. The Gaussian law performed best at predicting the rms slope regardless of the Hurst exponent. Consistent with the literature, it was found to be the most reliable radar-scattering law for the inverse modeling of the rms slopes and the Fresnel reflection coefficient from the quasi-specular backscattering peak, when homogeneous statistical properties and a ray-optics approach can be assumed. The contribution of multiple scattering in the backscattered power increases as a function of rms slope up to about 20% of the backscattered power at normal incidence when the rms slope angle is 46°.
1. Introduction
The characterization of planetary surfaces relies dominantly on remote-sensing techniques due to the high cost of in situ measurement opportunities provided by spacecraft missions. Visual and near-infrared (VNIR) observations can be utilized for photometric, polarimetric, and spectroscopic characterization of the physical properties from the mineralogy of regolith to convex-hull shape estimates of SSOs. The grain sizes can be estimated as well, but the estimates are constrained by the size scale of the utilized wavelength. In order to characterize the planetary surfaces on a larger scale, such as the topography and regolith particles on a centimeter-to-meter scale, radar observations are arguably the best remote-sensing tool for the purpose. In typical radar observations, a high-power microwave signal is transmitted, and the scattered echo is received using the same (monostatic) or a different antenna (bistatic). The comparison of the received signal properties to those of the transmitted signal in terms of the expected echo power, wavelength, and polarization provides various ways for the characterization of the regolith as well as the target as a whole. In fact, the radar delay-Doppler images provide the finest mapping resolution for Earth-based observations of SSOs: the echo power mapped as a function of the round-trip time (delay) measured in fractions of microseconds, and thus providing a range resolution as fine as a few meters, and the Doppler frequency, which arises from the rotation of the object. For the Moon, fully spatial synthetic aperture radar (SAR) images are an option; for example, the Lunar Reconnaissance Orbiter’s Mini-RF instrument has observed numerous regions of the Moon using the SAR technique, e.g., [1]), and more recently, also the dual-frequency L-band and S-band synthetic aperture radar (DFSAR) instrument on Chandrayaan-2 has contributed a wealth of data [2].
This article is focused on the characterization methods of the topographic properties of planetary surfaces dominated by fine-grained regolith (grain sizes much smaller than the wavelength). The first analytical radar backscattering laws for this purpose were derived in the 1950s and 1960s and inspired by the first radar observations of the Moon and Venus (e.g., [3,4]). Radar scattering laws refer to the backscattering coefficient (BSC) functions as a function of the incidence angle, i.e., the angular distribution of the area-normalized backscattering reflection coefficient as a function of the angle between the direction of the incident illumination and the normal of a surface element. The planetary surfaces have been traditionally parameterized using the root-mean-square (rms) height and the autocorrelation length, which is the average vertical offset between any two arbitrary points on the surface separated by a horizontal distance (lag) at which the height correlation has decreased to (about 37%).
The first analytical laws assumed the Gaussian height probability density function and height autocorrelation function because of mathematical convenience [5]. Hagfors [3] showed that a Gaussian height autocorrelation function did not provide a good fit to the Lunar radar data but that an exponential function provided a better fit. Thus, Hagfors’ law (see Section 2) became the most commonly used radar scattering law since 1964, as it provided the best fit to the data; however, not without controversy, because the exponential height autocorrelation function is non-physical, as the law does not conserve energy. Also, Hagfors’ law was not a good fit for many asteroids’ radar-scattering profiles. For example, Mitchell et al. [6] used only the Gaussian law, cosine law [7,8], and a “flat law” [9], for attempts to fit radar scattering by (1) Ceres, (2) Pallas, and (4) Vesta. The cosine law remains the most used scattering law option in the shape modeling of asteroids based on radar data (e.g., [10,11,12,13]); however, the physical interpretation of the fit parameters of the cosine law is not well constrained as will be discussed further below.
Close to the year 2000, several radar scattering laws based on self-affine fractal surface properties emerged [14,15,16]. Self-affine fractal and Brownian surfaces are physically more realistic than surfaces described by a single, specific height autocorrelation function. Instead of the autocorrelation length, the height elements’ correlation in self-affine fractal surfaces is better described using the Hurst exponent, H, which is related to the fractal dimension , so that represents an ideally fractal topography, [17]. For a two-dimensional surface profile, , the Hurst exponent is . Turcotte [17] defined the Hurst exponent as the power-law index for the increase of the height standard deviation (traditionally called the rms height) as a function of the sample length, L:
where is measured for a sample length . As the equation makes clear, does not remain stationary through the sample but depends on the selected length; therefore, no single value of h can uniquely describe the surface roughness. A similar equivalence can be found for the rms (Allan) deviation as a function of the sampling interval, , (hereafter, lag):
The rms slope and is thus proportional to . It is related to the slope angle so that .
Optionally, the topography can be characterized using the power spectrum, which is related to the Fourier transform of the topography profile so that the power spectrum defines the amplitude of a given spatial frequency [17,18]. The two methods of characterization do not, however, always provide consistent results. Austin et al. [19] reported that the fractal dimensions derived using the power-spectrum method are biased toward greater Hurst exponents (lower fractal dimension), attributing it to spectral leakage toward higher frequencies, and further suggesting that filtering out the highest frequencies (Hanning filter) may improve the results. According to Shepard et al. [18], the deviogram (a logarithmic graph of the rms deviation as a function of lag) does not require filtering and is less noisy than the power spectrum, so characterizing the topography using the deviogram is often preferred. However, generating synthetic surfaces using the power spectrum can be faster and more consistent (free from artifacts) than spatial methods ([18] and references therein).
Furthermore, it is important to remember that no physically realistic surface is infinitely fractal due to structural limitations, but the length-scale limits of the self-affinity depend on, for example, the mineralogical composition or the formation mechanisms. A length-scale limit of self-affinity in the power spectrum is typically called a roll-off frequency or wavevector; it appears as a change of gradient in the power spectrum, or even a plateau. Similarly, it changes the gradient of a deviogram. The fractality has a lower limit determined by the grain size for particular surfaces or the mineralogical structure for solid materials, and also the roughness below the Rayleigh limit is dominated by the wavelength scale and larger height undulations in terms of contribution to the echo power, so the roughness larger than the Rayleigh limit is more relevant to the scattering profile. For polarization studies, the wavelength-scale and sub-wavelength-scale roughness play a greater role than they do for the intensity of the echo. In the larger size scales, there is periodicity beyond the upper size scale; however, a finite measurement length can also have a similar effect, as will be discussed in detail in this paper. Similarly, in numerical models, the discretized surfaces are always limited by a discretization parameter (i.e., the size of the element) and a finite size of the topography model. The mathematical consequence of this fact is that although integration of the power spectra or the autocorrelation functions through the range of scales may converge from zero to infinity, and thus be analytically convenient, it is not physically correct and thus risks the realism of the models.
In order to evaluate the scattering laws, I conducted numerical simulations of the BSC functions of rough surfaces using different levels of self-affinity and evaluated to what extent the analytically derived scattering laws are able to predict the rms slopes. The benefit of the numerical approach is the ability to compare the consistency between the analytical and numerical models, to investigate possible constraints in each approach, and to quantify the effects of shadowing and multiple scattering, which are challenging analytical problems, especially for a three-dimensional surface. Shepard and Campbell [20] have investigated comprehensively shadowing models for self-affine fractal surfaces, which is why shadowing effects are addressed here only briefly. This work takes a step forward from the existing numerical models by, for example, Ulaby et al. [21], who have provided a variety of numerical methods to simulate microwave scattering; however, their methods are limited to the autocorrelation function approach and a length-independent rms height. Although the numerical models have shown to provide good fits to measured data, they cannot provide a straightforward model of the BSC functions when the surface statistics are measured and described using the Hurst exponent instead of the autocorrelation function. For example, Campbell [22] measured the topographic properties and the microwave backscattering coefficients of Hawaii lava flows, which can be considered analogous to all basaltic planetary surfaces. Only empirical modeling was presented in [22] with a call for numerical computations as future work.
2. Methods
2.1. The Generation of the Synthetic Surfaces
I generated synthetic rough surfaces using a Python translation of the Matlab code “Surface generator: artificial randomly rough surfaces”, which is based on theory presented by Persson [23], and freely available through MathWorks (https://www.mathworks.com/matlabcentral/fileexchange/60817-surface-generator-artificial-randomly-rough-surfaces; accessed on 16 June 2023). The algorithm is described in detail in Appendix A. The surface model is defined using a Hurst exponent, an edge length (), an rms height (), a number of elements per edge (m), and a roll-off wavevector index (), which defines the roll-off wavevector (to be explained in further detail in Section 2.3). The physical interpretation of the roll-off length is to quantify the spatial wavelength limit where the self-affinity properties of the surface change. The rms height is equal to the height standard deviation of the whole topography model. The number of elements could be different for each side but here I use only square areas discretized to m elements per side. The element size is then defined as , which can be set to be, for example, the wavelength of the measurements. Also, an electric permittivity, , is required for computing the scattering properties.
After, the vertex coordinates were generated so that their height correlation with respect to the horizontal scale was consistent with the given Hurst exponent, the vertices were connected into triangular facets (as common in 3D models), and could be saved in a wavefront file format when needed. The facet size has to be at least one wavelength wide for the ray-optics scattering regime, and thus, for the Fresnel scattering to remain physically valid. A second requirement for physical validity—especially relevant to self-affine fractal surfaces with low Hurst exponents—is the rms height within each element: if the element-scale rms height is below the Rayleigh limit, i.e., , the element can be considered electromagnetically “smooth”, whereas if the rms height is much greater than the Rayleigh limit, the validity of Fresnel scattering becomes questionable. This fact will be considered in the analysis where relevant in the evaluation of the scattering laws.
It is also important to note that because the generation of the sample surfaces has stochastic elements, individual topography models are not necessarily fully isotropic, but an ensemble average over several sample surfaces is required. Figure 1 visualizes example surfaces using different surface-roughness parameters. Once generated, the topography statistics (total and projected area and the statistical roughness properties) of the surface models were recorded and analyzed.
2.2. Scattering Properties
For the scattering properties, two different algorithms were used: (1) a simplified but fast algorithm to simply sum together the reflected power by all illuminated and visible triangles but shadowing omitted, available online under the name “surface-scattering”, and (2) a full ray-tracer that keeps account of shadowing, multiple bounces, and the polarization of the rays, available online as Ray-optics for self-affine fractal surfaces (ROSAS). Both codes are open source and available online; see the Data Availability Statement.
In the first algorithm, the relative Fresnel reflection powers of each triangular element of the shape model were summed together, but each element’s local incidence angle, (the triangles facing away from the incident direction were thus fully excluded), and the relative power to the corresponding phase angle () bin, was recorded so that . Then, I rotated the incident direction by 2° around the y-axis while keeping the topography model’s mean-height plane parallel to the -plane and repeated the process up to . The algorithm does not take into account elements that shadow other elements or multiple scattering but considers that if a ray reflects from an element near the edge downward outside the area of the synthetic surface, the reflection is excluded. In other words, only the reflected vectors with a positive z-component in the shape model reference frame are included.
In ROSAS, I used a ray-tracing algorithm to track which triangle a ray intersects first and whether it intersects another triangle after the reflection, and if so, how many times, and in which direction the ray eventually emits. The algorithm reads or generates the surface topography model, generates rays that hit a random (but illuminated) location at the surface, and tracks their propagation during the interaction with the surface, keeping account of the number of reflections that take place and the polarization of the rays. The user can select the incidence angle, the number of rays, the number of azimuth angles for ensemble averaging, the number of phase angle bins, the refractive properties, and the wavelength. Here, the reflectivity was investigated as a function of incidence angle using 30,000 rays for five different surface realizations (i.e., 150,000 rays in total) for incidence angles from 0° to 60° with 10° intervals. The manual for the ROSAS code is included in the online repository for the code and includes a more detailed description of its functionality. The effect of multiple scattering is small and will be discussed in more detail in Section 3.
In both algorithms, the total scattering efficiency was obtained by normalizing the total scattered power by the incident power, in this case, represented by the number of rays. The phase function (the first element of the scattering phase matrix as a function of the phase angle) was normalized so that the integral of the phase function over the full space angle is equal to . Mathematically dressed:
The BSC function was then derived by multiplying the phase function value at the phase angle of 0° by the scattering efficiency () for each incidence angle:
The scattering efficiency increases as a function of incidence angle as the average of the Fresnel reflection coefficients increases. At normal incidence,
Finally, the scattering laws were fit to the computed BSC functions using SciPy’s curve_fit function, and the results were recorded and evaluated. For each law, the fit parameter C was assumed and compared to the rms slope () so that the slope angle is obtained from the vertical component of unit normal vectors of the surface elements: .
2.3. Statistical Properties of the Surfaces
The statistical properties include the rms height h, rms deviation, , and its square, the rms variance, the rms slope, and the autocorrelation function. The definitions follow those presented in [24]. Let us begin with the square of the rms height as a function of the sample length, or rather, the standard deviation of the heights around the mean height:
where is the average of all N height points included in the sample length L. The square of the rms height as a function of step size, , is:
The rms height is constant as a function of step size but increases as a function of sample length, L, whereas the rms deviation and rms slope are constant as functions of sample length but change as a function of step size, as shown, for example, in [25]. The rms variance as a function of step size is:
where N is the number of pairs of points separated by a lag, . The rms slope is:
The rms slope for a two-dimensional (2D) surface profile, , is denoted using a subscript p. The adirectional rms slope for a 3D surface, , denoted using a subscript A, is related to the 2D rms slope so that . Here, the 2D rms slope is calculated as shown above for each individual line and column of the synthetic surfaces, and the 3D rms slope using the vertical component of the normals, , of the topography model’s individual elements: , where the chevrons indicate an ensemble average. The numerical results were compared at different values of H for possible variations from but the ratio was always consistently .
The rms-height-normalized autocorrelation function is defined as:
The autocorrelation functions are typically given as:
so that for the exponential and 2 for the Gaussian autocorrelation function and l is the autocorrelation length. Also, other options such as x-exponential and x-power correlation functions have been presented (e.g., [21]) but are significantly less used in planetary science applications. For stationary surfaces, the rms slope can be derived from the second derivative of the autocorrelation function (), i.e., at a small enough step, the local slope can be found. On the contrary, in fractal surfaces, the roughness depends on the scale as defined by the fractal dimension (or the related Hurst exponent), so the given relation is not valid. Here, the synthetic surfaces are generated using the power spectrum (the Fourier transform of the autocorrelation function), and autocorrelation functions are derived from the generated surfaces to understand how the autocorrelation at the wavelength-scale sampling is related to the Hurst exponent. Examples of the obtained autocorrelation functions are further discussed and visualized in Section 3.
For stationary surface profiles, the autocorrelation function is related to the rms variance so that
but this relation may depend on the self-affinity of the surface [18], which will be considered in the analysis.
The roughness characteristics can also be derived from the power spectrum:
Here, W is in units of m4 and the wavevectors q and are in units of m−1 for three-dimensional (hereafter 3D) surfaces. Note that units of m3 and a power of would be used for the power spectrum of a two-dimensional (hereafter 2D) surface profile. The values of and depend on the choice of the integration limits and coordinate system. For an analytical solution that ensures isotropic characteristics with respect to any reference point, integration in a polar coordinate system is more convenient. If for a 2D surface profile, in a 3D case, the surface area remains equal only if , where is the radius of the circular sample area. Therefore, if , . The upper limit of the wavevectors, , is constrained by the sampling interval (i.e., the element size) so that .
Using the power spectrum, the square of the rms height over an isotropic self-affine fractal surface area with an edge length of and a sampling interval of is
and the square of the rms slope is given as
as shown in [26]. When , the rms slope as a function of the rms height and the Hurst exponent is then (as shown in more detail in Appendix B):
Here, . When , the wavelength-scale rms slope can be approximated as:
For the end case of :
and for :
The equations above assume that the power spectrum follows the relation through all included wavevectors from to (). If , the low-frequency components of the surface profile are cut, and the power spectrum has a constant value of when . In this case, the roll-off wavevector index has to be set to , and s requires an additional factor of .
Because of the discretization, small differences in the analytical solutions may occur in the numerical surface model realizations. A confidence test of the Hurst exponent was conducted by computing the adirectional rms slopes for synthetic surfaces generated using two different values of m and but equal and for different values of H. A selection of and 128, and, respectively, and , keeps . In this case, the ratio of the rms slopes should only depend on the Hurst exponent and the ratio of either m or so that . The derived H was found to be about , where denotes the value used for generating the surface. Therefore, some error in the derived self-affinity can be expected for the synthetic surfaces that are generated using values of H not equal to 0.5 with decreasing confidence toward 0 and 1; whereas surfaces with , have a high level of confidence.
To verify the power-spectrum reference value , I generated synthetic surfaces of and () and and using and , 0.3, 0.5, 0.8, or 1, and recorded the adirectional rms slopes, then solved for (assuming that ). For values of , I found to be in the range from 3.33 to 3.67, with a positive correlation with H and small differences due to the discretization. This range for intermediate values of H is consistent with , which is consistent with the analytical solution as described above. For and , I found , and for the synthetic surfaces, respectively; however, the confidence for the statistical properties when using the end values of H is low because of the bias towards .
For surface profiles, the corresponding wavevectors would be and . The discretization plays a small role, which will be addressed in more detail in Section 3 and Section 4. When using the limiting wavevectors given above, Equation (17) takes the form
Note that here, , when using Equation (1), and the step size is equal to the wavelength: . Because ,
If written as a ratio of the rms variance to the square of the same-scale rms height, a simple form can be found:
for surface areas, whereas for surface profiles:
2.4. The Radar Scattering Laws
The BSC function, also known as a differential or area-normalized radar cross section, is defined as . It quantifies the backscattering reflectivity of a surface as a function of incidence angle, i.e., the angle between the source of illumination and the normal of a surface element. The presented laws are only valid for the backscattered power of the quasi-specular reflection, which is the same-sense polarization as the transmitted signal when using linear polarization, typically denoted as HH for horizontal-to-horizontal or VV for vertical-to-vertical, or the opposite-circular (OC) when using circular polarization.
The Gaussian law is mathematically the most convenient one because it is based on a Gaussian height distribution and a Gaussian autocorrelation function; the fit parameters directly describe the statistical properties of the surface so that . It is defined as
where l is the autocorrelation length, and is the rms height. The Gaussian law can also be derived using only the slope probability density function (p.d.f.), assuming that it follows a Gaussian form. For example, Simpson and Tyler [27] presented a compilation of some of the legacy radar-scattering laws and how they were derived.
Hagfors’ law [3] assumes the height distribution to be Gaussian and the autocorrelation function to be exponential. It is traditionally presented in the form:
where is described as the Fresnel power reflection coefficient at normal incidence, and is a (wavelength-scale) roughness parameter, and is the wavelength. It is useful to highlight the difference in the definitions of and , as both are often simply C in the literature and are described to be related to the “slope” or “surface roughness”; however, the definition of C differs between the laws.
Mitchell et al. [6] chose three different scattering laws for evaluating the radar scattering profiles of the dwarf planets (1) Ceres, (2) Pallas, and (4) Vesta: the Gaussian law, the cosine law, and the flat law.It should be noted that the scattering profiles in this study were Doppler-only echo spectra rather than BSC functions. The flat law is omitted here as it was found to be a bad fit for most radar profiles and is thus not used widely. The cosine law is defined as
This law was selected as part of the study because it is the default radar scattering law in the shape-modeling software Shape (version 2; for more details, see, e.g., [10,28]). The users of the software typically fix to an arbitrary value and let float through the multitude of iterations that the numerical sculpting of the model requires. As the shape model reaches its final shape, can be allowed to vary with the purpose of constraining it using the Doppler-echo-power spectra; however, this step is often skipped and the scattering-law fit parameters left unpublished, or only is included. Therefore, I selected the cosine law here as one scattering law for our analysis, so that a more robust interpretation for the fit parameters can be provided using the better-established laws as a reference, and thus help inform Shape users. Analytically, when x is small, so for small slopes, the cosine law can be expected to be comparable to the Gaussian law.
Shepard and Campbell [14] presented near-nadir scattering laws for self-affine fractal surfaces that are defined using the Hurst exponent (H) and a slope (s) that depends on the scale (so that the Hurst exponent defines the scaling, as described in detail in [24]). They derived the BSC function in the near-nadir regime for cases , , and a general case using the wavelength-scale slope (). I adopt the case of as one of our scattering laws to fit by using their , which they define as the Fresnel reflection coefficient, and as the fitting parameters and , respectively:
They note that the term appears analogous to when compared to the Hagfors’ scattering law but do not attach any further physical interpretation to the parameters. When , they define the BSC function as:
This form using is evidently similar to the form of the Gaussian law (Equation (24)) with a difference of the (incorrect) factor of . The general form is omitted here because it is complicated to use for fitting, and is incorrect, as will be discussed in Section 4.
Another widely used set of more comprehensive models for microwave scattering is the integral equation method (IEM) [29,30] and the improved integral equation method (I2EM) [21]. Similar to the models presented above, IEM and I2EM are based on a given autocorrelation function, an autocorrelation length, and a stationary rms height. The benefit of these models is that the reflection coefficients take into account both horizontal and vertical polarizations and I2EM also includes diffuse scattering, which improves the modeling of the polarization properties [21], but makes inverse-problem solutions more challenging. The comparison to these models is not provided in this paper due to the complexity of the fitting in a large parameter space that is not analytically derived for self-affine fractal surfaces.
Figure 2 demonstrates the forms of the selected radar scattering laws when using a fixed rms slope of 15° and assuming that . Similarly, all R-parameters as equal to the normal-incidence Fresnel reflection coefficient of a plane interface with an electric permittivity of 5.0. Several other radar scattering models exist in the literature; however, as stated, only those in wider use and not restricted to rms slopes below 10° are included. As is evident in the graph, the Gaussian and cosine laws are very similar to each other, whereas Hagfors’ and Shepard’s laws have approximately one-half of that of the Gaussian and cosine laws. Also, Hagfors’ law has a distinct tail, whereas the other functions decrease to zero more steeply.
In addition, one empirical law was selected to compare analytical laws to measured data with surface statistics and radar-scattering properties validated numerically. Campbell [22] modeled the backscattering coefficients measured from the Hawaii lava flows empirically, and found that , and that the left-to-right (LR), or more generally the OC, polarization component follows a similar form but with a difference of a constant factor:
the ratio of the cross-polarization component to is
and the ratio of to the left-to-left (LL) polarized component, more commonly notated as the same-circular (SC) polarization, is
The total BSC function computed for the synthetic surfaces is using the linear polarization components and using the circular polarization components. From these equations, also the circular-polarization ratio, i.e., the ratio of the echo power in the LL or SC polarization to that in the LR or OC polarization can be easily derived. The measurements were conducted using incidence angles from 35° to 60°, so the model can be considered valid only within this range of incidence angles. The surface statistics and the measured backscattering coefficients were averaged over surface profiles covering 50–100 m per side as shown in [22].
I selected three cases out of the ten sample surfaces presented by Campbell [22,25], hereafter referred to as Test cases.
- , , and ;
- , , and ;
- , , and .
The corresponding rms slope angles in degrees are , , and . For the surface models, the edge length is assumed to be m, because the spatial resolution of the images used for deriving the empirical equations was within the range of 5–10 m (Bruce Campbell, personal communication), and using a number in the high end of the range is beneficial for statistical reasons due to the greater number of elements per sample surface. Furthermore, when using 25 cm as the sampling interval, following the reported surface statistics, the discretization number is . The wavelength of the BSC measurements was 24 cm (L-band). For using the values above in the model, two other issues must be considered: first, the rms heights and slopes were measured for surface profiles, and second, the Hurst exponent’s dependence on the size scale either due to different surface formation mechanisms [25], which can be considered mathematically as the roll-off length (as described earlier). As described in more detail in [25], the Hurst exponent of these sample surfaces does not remain constant at all measured length scales, which could be a sign of the proximity of the roll-off length to the measurement scales. Also concerning Test Case 3, the wavelength-scale rms height significantly exceeds the Rayleigh limit of 3.1 cm at normal incidence; this fact is included in the discussion.
In Section 2.3, an equation for the slope was shown for the case, where the length scale extended from the wavelength scale to the roll-off length. Here, assuming that the roll-off length is a lot greater than 1 m, but the rms heights are reported only up to a length scale of 1 m, the result of integration from the wavelength scale to an arbitrary integer factor of the wavelength, () is (as described in more detail in Appendix B):
In this case, and because the length scale for the rms height is four times the wavelength. Also here, a factor of is accounted for in (profiles) vs. (areas). The same equation can also be used to derive the rms height at any value of x (within the limits stated above) so that
which gives m for Test Case 1, 0.13 m for Test Case 2, and 0.28 m for Test Case 3. The values for Test Cases 1 and 2 are comparable to using Equation (1), in this case, , which gives, respectively, 0.07 and 0.14. For Test Case 3, Equation (1) gives m—significantly below 0.28 m—possibly because of a roll-off length m, while Equation (1) would require a much greater value of to apply, as the next section discusses in more detail.
3. Results
The results are presented in four parts: first, how consistent the surface statistics of the synthetic surfaces are with the theory, which is a fundamental part of validating the further results; second, the evaluation of the consistency of the selected analytical scattering laws with the computed BSC functions; third, the evaluation of the consistency of an empirical scattering law that models the measured BSC functions of Hawaii lava flows with the analytical scattering laws validated numerically; and fourth, the contribution of multiple scattering, which quantifies the validity of single-scattering assumptions of analytical scattering laws. The contribution of multiple scattering by a three-dimensional undulating surface is challenging to derive analytically and is thus better to compute numerically.
3.1. Surface Statistics
First, the statistical properties of the surfaces are shown so that sample profiles are extracted from the individual rows and columns of several surface realizations, and the properties are averaged. The autocorrelation function, the rms heights, and the rms deviations and slopes are shown. The code for computing the surface statistics is included in the same online repository as the codes introduced in Section 2; see the Data Availability Statement.
The autocorrelation function at a specific length scale for the synthetic surfaces was derived to quantify how it is related to the Hurst parameter (at low values of lag):
where a linear relation of can be found for the exponent (to be discussed below) and when , but at . Figure 3 illustrates the change in the shape of the autocorrelation functions when , m, m, , and ( m). The fitting is limited to the values of lag up to 1 m.
Figure 4 shows the rms height as a function of profile length () based on Equation (6), with a linear fit to the data points at , and the rms height as a function of step size based on Equation (7). The fit to the average of ten surface realizations gave a linear relation , which is nearly exactly as expected for the given input characteristics for the sample surfaces. The power of 0.51 is consistent with the value of H used for generating the surface, i.e., . The factor 0.07 is, here, the value of and thus depends on , which defines . Beyond , the power was found to be up to about 60% of the input H for , comparable at , but greater than zero even for .
Figure 5 illustrates the rms deviation and slope of a surface profile as functions of lag. Here, the roll-off length appears as a plateau in the function at . Consequently, the Allan (rms) deviation follows
where and were found to be nearly equal to those for the autocorrelation function above: when and at , and is discussed below mutually for all cases. The respective rms slope as a function of lag is , for which when and at .
Similar to the rms height, when the rms deviation increases exponentially, it appears linear in the log scale at low values of lag, i.e., if measurements are conducted only at low values of lag with respect to the roll-off length, only this part may be visible. However, when approaching the roll-off length, the gradient of the deviogram decreases. When the lag is longer than the roll-off length, the rms deviation remains approximately stationary at , whereas the slope continues to decrease as . In the numerical approach, when , the function has excessive downward curving at higher values of lag, so for modeling purposes, using , provides more realistic results when the lag extends beyond . Likely due to the same reason, the equation for , as shown above, was not as good a fit for as for greater values of . Equation (17) was found to be a good approximation for for (the square root added due to the difference in dimensions—3D for the analytical equation but 2D for the surface-statistics data computed here).
As for , the values from fits to the autocorrelation function, rms deviation, and rms slope as functions of lag produced similar trends: . The value of was consistently about and at . In none of the tested cases , likely due to the bias in the self-affinity, as was discussed earlier. Nevertheless, the form of the slope p.d.f. of the surface is similar to a Rayleigh distribution (consistent with [18]) regardless of the wavelength-scale autocorrelation function when the rms (), whereas the slope angle p.d.f. is nearly Gaussian at moderate slopes. For significantly greater rms slopes, the Gaussian distribution cannot model the skew toward greater angles (see Figure A1 in Appendix D for histograms of the slope angle p.d.f.); however, a combination of two or more Gaussian distributions could be more successful.
The surface statistics theory presented so far can be tested on the surface-profile statistics presented by Campbell [22]. Figure 6 depicts the 2D wavelength-scale rms slopes for surface profiles obtained for the Hawaii lava flows versus the rms slope model following Equation (32). The surface profile with the greatest slope has the highest residual value possibly due to a shorter roll-off length than the other cases. The power spectral density function for the specific case in question is presented in [25] (Figure 3.13). The spectrum shows more variation in the slope of the function for the lowest Hurst exponent than those of the other two profiles with greater Hurst exponents, which could be indicative of a roll-off length near the measurement scale. A lower Hurst exponent would provide a better fit to the model for the case in question.
Campbell [22] found the following empirical model for the rms deviation for a step size and rms height of profile length :
which is intriguingly similar to Equation (21) when and , that is, for all their sample surfaces. Also, computing for the surface statistics data shown in Figure 4 and Figure 5 suggests that Equation (23) is a good analytical solution for the ratio, although there was a lot of variation for individual surfaces at (from 3 to 15, while the expected value was ). The evaluation of the consistency of the synthetic surfaces’ statistical properties with the analytical solutions for 3D surfaces (e.g., Equation (17)) was found, in general, to be challenging due to the significant variance.
3.2. Evaluation of Radar Backscatter Functions
First, the laws based on autocorrelation functions, the Gaussian law, Hagfors’ law, and the cosine law are evaluated. In the examples below, the wavelength-scale element discretization is kept at 25 cm, while varying and H. The Rayleigh limit for the wavelength-scale is then 0.031 m at zero incidence. The electric permittivity is .
Figure 7 and Figure 8 demonstrate the quality of the different laws in modeling the BSC functions of the synthetic surfaces computed using the simplified surface-scattering algorithm. Each curve in Figure 7 is an ensemble average of 40 surfaces and 4 azimuth angles. Despite the ensemble- and orientation-averaged results, there is a significant deviation in the phase function at low phase angles when m due to the steep slopes of individual elements. The error in the first phase angle bin is mitigated by using the mean of the first three phase-angle bins for the BSC functions. For m, m, which is well below the Rayleigh limit. For m, , which is at the Rayleigh limit at the zero incidence, but not through all local incidence angles of the individual elements. For m, m, which is significantly above the Rayleigh limit, and therefore the result should be considered with caution. Figure 7 also shows the change in the shape of the phase function as the incidence angle increases. The phase functions are useful for verifying that the distributions of the surface reflections are correct, but also have practical use when modeling scenarios where the source of illumination and the observer are not at the same location.
In Figure 8, the rms slopes derived from the BSC functions using the Gaussian law are the most consistent with the rms slopes computed geometrically using the vertical component of the normal of each element. The rms slopes derived using the cosine law were increasingly over the true rms slope as the rms slope increased (up to a factor of 1.19 at ), while the Fresnel reflection coefficient was close to the expected value. The rms slopes derived using Hagfors’ law were increasingly below the true rms slope (down to a factor of 0.77 at ), while the Fresnel reflection coefficient was consistently above the true value by a factor of 1.42–1.92 with a negative correlation to the rms slope. Here, I assumed that , which is not analytically correct for an exponential correlation function that the Hagfors’ law is based on, but this result can be useful information for estimating the uncertainty of results that have been previously derived using Hagfors’ law. For the Gaussian and cosine scattering laws (Equations (24) and (26)), the accuracy of the fit parameter R was 5% up to an rms slope of 0.467 (). It should be noted that although the autocorrelation function at the wavelength scale was not found to have a Gaussian form at any value of H within the range , the Gaussian scattering law still provides the best fit to the synthetic BSC functions. The accuracy of the Gaussian law deteriorated below rms slope angles of 3° as well as above 40°. One reason is the slope angle p.d.f: at very low and very high rms slopes, the slope angle p.d.f. skews from a Gaussian shape, as the slopes of the elements increase but cannot reach 90° (Appendix D). This is an important note for the assumption of a gently undulating surface. As the slopes approach 0°, the reflections are more accurately described by simple Fresnel equations for planar surfaces.
The cosine law was performed to equal accuracy only up to slopes of about 15°, and increasingly overestimated the steeper rms slopes. Hagfors’ law performed in a similar quality to the cosine law but underestimated the rms slopes close to a comparable extent to what the cosine law overestimated them. The distinct ”tail” at high incidence angles was not observed to occur in any of the simulations regardless of whether multiple scattering was included or not.
The Shepard’s model for fits the computed BSC functions at higher incidence angles better than the cosine law but no better than the Gaussian law. Despite the similarity to Hagfors’ law, there is no distinct tail visible at high incidence angles. The simulations showed that is not equal to as claimed in [14], but a correction factor that depends on the slope and the Hurst exponent is required. Shepard’s model for was able to predict the rms slope with any value of H when . The Fresnel reflection coefficient also requires a non-trivial term that depends on the rms slope to correctly predict the reflection coefficient.
One reason for the discrepancies is a misplaced factor of . Also, the integration to infinity used in many analytical approaches can be questioned in physical applications. It is mathematically convenient in the analytical derivation of the models; however, the statistical properties are, in reality, limited to specific length scales. When modeling radar imaging data, the integration is ideally done through the area covered by each pixel or a set of pixels, i.e., the area that contributes to the pixel. Because the rms height depends on the horizontal scale, as given by the Hurst exponent, the measured, finite area might play a role that should not be omitted.
3.3. Backscatter Functions of Hawaii Lava Flows
The consistency of the analytical and numerical solutions with measured data is a crucial part of evaluating their validity. Campbell [22,25] reported surface statistics for ten surface profiles of lava flows at Kilauea, Hawaii. The measured rms slopes are available in both the wavelength scale of 25 cm () and a unit scale of 1 m, the rms heights are measured over 1-m profile lengths (), the Hurst exponents are available in the unit scale of 1 m for all ten profiles, and some additional information available for a few profiles (Hurst exponent when using a different step size, deviograms, and power spectral density plots).
Figure 9 illustrates the scattering law fits for the three test cases (Section 2.4), with the empirical model for the data presented in Campbell [22] included at the incidence angle range from 35° to 60°. The shown BSC functions for the synthetic surfaces are ensemble-averaged for 30 sample surfaces and orientation-averaged for 4 different azimuth orientations. The electric permittivity was set here to i. For Test Cases 1 and 2, , and for Test Case 3, . The fits include the Gaussian, cosine, and Hagfors’ laws. The surface model was able to reproduce a comparable rms slope using the rms height and Hurst exponent for all test cases to an accuracy of 97% (with the dimension factor of considered).
3.4. Contribution of Multiple Scattering
In order to quantify the contribution of multiple scattering in the synthetic surfaces selected for the study, I used the more elaborate ray-tracing algorithm ROSAS described in Section 2. For the computations presented here, the number of rays was 20,000, and the refractive index was set to i (electric permittivity of i). The scattering properties were averaged over four azimuth angles for a synthetic surface with m and .
For Test Case 1, no multiple scattering took place. For Test Case 2, multiple scattering took place at a level of 1–2 per 600 rays, but the contribution of multiple scattering is negligible in the total echo power, particularly at backscattering. For Test Case 3, it was not clear what the value of should be for an edge length of 9 m because, as discussed earlier, there are indications that the roll-off length is less than 4.5 m, and the same wavelength-scale rms slope could be reproduced with different combinations of and . Also, it is interesting to look at two different examples, where multiple bounces take place: one where the peak contribution is visible for double and triple bounces at about (Figure 10 panels a and b, , , m, and ), and a second one where the phase function for the double and triple bounces decreases (panels c and d; , , m, and ). In the first example, the power contribution of the double bounce was, at most, about 10% of the power contribution of single scattering and that of the triple bounce, at most, about 1%, the maxima for the double bounce occurring at about at both incidence angles and also for the triple bounce at . In the second example, the maxima for all numbers of bounces are at zero phase angle for both incidence angles, 0° and 40°, and the power contribution of double bounces was up to % of the total at backscattering while remaining at 1% for triple bounces.
Figure 11 shows that for Test Case 3, the backscattered echo power decreases in both polarization states as the incidence angle increases from 0° to 60°. The BSC function is (as given in Equation (4) , whereas and . The BSC function for the total and the OC polarization follows the empirical model for the lava flows well. The difference between the simplified surface-scattering code and the ROSAS code can be attributed to the improved tracking of multiple scattering in ROSAS. The electric permittivity of the lava flows was not well constrained in [22], which is one factor in the difference to the empirical model. I used an electric permittivity of 4.5 (real part); although a lower value down to 4.0 could further improve the fit at an incidence angles of 30°–40°, it could produce a worse fit at . The SC polarization of the BSC function decreases as a function of incidence angle more steeply as the empirical function, as is visualized in Figure 11; this finding is contrary to observations, which demonstrates the well-known inadequacy of ray-optics models in simulating depolarization effects even when second- and third-order scattering are included. As Fa et al. [31] showed, simulating the SC polarization component so that it is consistent with measurements is difficult even when volume scattering by wavelength-scale ellipsoids is included in the model. On the other hand, in their surface model, which is based on IEM and uses an exponential autocorrelation function for the surface statistics, the circular-polarization ratio increases as a function of incidence angle, which suggests that the ROSAS code could be developed further by incorporating relevant field coefficients [29,30].
4. Discussion
First, it is important to discuss how well the artificial surface generation algorithm performed with respect to the existing analytically derived statistical properties for self-affine surfaces. The discretization of the artificial surface is a good analog to empirical measurements, where the topographic height distribution is derived using sampling at regular intervals. However, differences to mathematically ideal surfaces are possible due to the discretization, and therefore the analytical solution could be, to some extent, different from the generated surface despite ensemble averaging. The algorithm was created based on the theory presented in [23], and the numerical evaluation revealed that the surface properties were quite consistent with the theory. The consistency was the best near and degraded towards the end values and . Specifically, the low values of H caused issues. For artificial surfaces that were generated using Hurst exponents near the end values, the algorithm tended to generate surfaces with their self-affinity biased toward . Considering applications, Campbell’s measurements [22,25] showed that natural rocky and grain surfaces have Hurst exponents typically below but above . Therefore, the surface generation algorithm can be considered a good analog when the Hurst exponent of the surface is measured at , which applies to the majority of natural surfaces. The issues related to the low values of H could be related to the fact that the surface slopes should be larger than the discretization can reproduce.
The modeling of the measured Hawaii lava flows was successful; the synthetic surfaces were able to reproduce the measured rms slopes when generated using the measured rms height and Hurst exponent as input parameters. For Test Case 3, the fit was the most challenging one but surprisingly good considering that no diffuse component was included while simultaneously the rms height within a wavelength scale was greater than the Rayleigh limit.
The presented exponential form for the rms deviation (Equation (35)) is analytically sensible and considers the roll-off length better than a simple power-law function. The downward curvature is consistent with the empirical deviograms presented in [24] Figure 3. An increased consideration of the roll-off length was also a key to being able to reproduce the rms slope of Test Case 3.
The main scope of the paper is to evaluate how well the various radar scattering laws are able to model the rms slope. The surface slope p.d.f. is the main factor of a rough surface that determines how the scattered power distributes in space. The simulations showed that although the synthetic surfaces did not have a Gaussian autocorrelation function at the wavelength scale nor the slope or the slope angle p.d.f were precisely Gaussian (a combination of two Gaussian laws could be a better fit), the Gaussian law performed the best at modeling the rms slopes at 95% accuracy at all adirectional wavelength-scale rms slopes from 2° to 40°. At , the surface can be assumed planar, and regular Fresnel reflection coefficients are a decent approximation.
The cosine law performed to equal accuracy with the Gaussian law only up to slopes of about 15°, and increasingly overestimated the steeper rms slopes, when the slope was derived from the scattering profile. Hagfors’ law (Equation (25)) also fits well at low slopes but was found to underestimate the rms slopes close to an equal amount to what cosine law overestimates them. Also, was inconsistent with the true Fresnel reflection coefficient, whereas and provided better fits. The distinct diffuse scattering ”tail” of Hagfors’ law at high incidence angles did not fit well using a ray-optics model even when multiple scattering was included in the model. In fact, the tail was not observed to occur in any of the simulations regardless of the inclusion of multiple scattering. Therefore, it is questionable whether such a feature can be produced when only Fresnel scattering is included, which is consistent with Hagfors’ own suspicion that “an entirely different type of reflection mechanism should be sought to describe the tail of the echo” due to an observation of depolarization of the radar echo [3]. For example, wavelength-scale particles on the surface could reproduce the tail, because there is always a non-zero backscattering intensity component and a non-zero depolarization component for non-spheroidal, asymmetric particles in the resonance-scattering regime (e.g., [32]).
In conclusion, the Gaussian law can be recommended as the most reliable radar-scattering law for all natural surfaces for the inverse modeling of the rms slopes and the Fresnel reflection coefficient from the quasi-specular backscattering peak in disk functions. If diffuse scattering is observed, a separate law that considers the physical properties of wavelength-scale scatterers rather than rms slopes could be a more realistic approach. For large objects such as planets and moons, also considering a realistic distribution of roughness parameters could be an improvement to assuming homogeneous roughness characteristics for the whole object.
Shadowing models for self-affine surfaces have been comprehensively investigated by Shepard and Campbell [20]. The shadowing produced by the artificial surface model presented here was found to be consistent with the numerical shadowing models for up to moderate slopes. This result is expected for the shadowing models that presume a Gaussian slope p.d.f. For the test case with the steepest slopes, the analytical model of Smith [33] was valid with an uncertainty of 85%, which is a relatively good performance as well for such complex topographies. Also here, it is useful to remember that the model is derived for an undulating surface without wavelength-scale particles on the surface. The shadowing function for a surface covered with wavelength-scale particles would increasingly differ as a function of the incidence angle, because the resonance-regime scattering functions of particles with various shapes, sizes, and orientations are much more complicated than the Fresnel scattering functions in the ray-optics regime, and their relative contribution to the total backscattering is greater at higher incidence angles.
Campbell [34] showed that double reflections by dihedral corners may increase the SC polarization component significantly; however, the probability density function of the favorable angles with respect to the full measured area is a complex question, and only 2D surface profiles were considered. In this paper, the ray-tracing computations for multiple scattering revealed that for very rough surfaces (rms slope angle above 30°), the contribution of each increasing order of scattering is about one order of magnitude less than the previous, i.e., the second and third-order contributions are, respectively, about one-tenth and one-hundredth of the contribution of the first-order reflection (Figure 10). The reflected double-bounce phase function’s maximum is centered at , whereas for a single reflection, the phase function remains at a stationary level up to before decreasing. The SC polarization component was up to 33% of the OC polarization component when multiple scattering was included and the roughest Test Case 3 was used as the surface model. The circular-polarization ratio decreased as a function of incidence angle, which is contrary to what measurements suggest. Ray-optics approximation is known to be insufficient for modeling polarization, which is highly sensitive to the scatterer’s morphology and may also require the wave-interference effects to be taken into account. In Test Case 3, also the element-scale rms height significantly exceeding the Rayleigh limit likely plays a role. Finer discretization would improve the accuracy of the true morphology, but element sizes smaller than the wavelength make the use of ray-optics approximation questionable.
A discrete dipole approximation approach such as that presented in Riskilä et al. [35] (and the references therein) would allow including sub-wavelength-scale roughness, so it was also evaluated as a modeling approach, but it did not produce results that would be more consistent; in fact, the backscattering functions were much less consistent with the lava flow measurements due to a strong diffraction peak (visible in Figures 8–20 in [35]). Separating the diffraction peak from the incoherent scattering field would require additional computations that are out of the scope of this paper but, as future work, could potentially help resolve discrepancies. The same issue prevents the use of other scattering software based on volumetric discretization of the medium.
Applications to Planetary Surfaces
The Hawaii lava flows are a good example of natural surfaces for which the Hurst exponents, rms heights, and slopes have been measured. I found a relatively good consistency between the synthetic surfaces in this study and the radar measurements for the flows. The consistency validates the synthetic surfaces as realistic and provides a further interpretation of the lava flows; for example, the electric permittivity based on the modeling in this paper was found to be 4.5 (or slightly less) in contrast to the estimate of 6 by Campbell [22]. The porosity of the lava flows could thus be higher than originally expected. There was, however, some discrepancy in the rate of decrease of the BSC function for rough surfaces, which the ray-optics models were not able to model. For the smoother surfaces, the simulations provided an excellent fit to the measurements, but there was measurement data available only at incidence angles where BSC is close to zero, so the most relevant information on the specular enhancement is lacking.
Furthermore, the surfaces of the atmosphereless solar-system objects (SSOs) are mostly composed of regolith. Depending on the object, the size-frequency distribution of regolith varies from fine-grained micrometer-scale particles to multi-meter-scale boulders. The surfaces of the atmosphereless terrestrial planets and their moons are dominated by the fine-grained regolith as the Moon landings and numerous spacecraft missions have shown. Helfenstein and Shepard [36] reported an average Hurst exponent of about for the Moon, which was considered consistent with other literature. In contrast, while fine-grained regolith is common on asteroids as well, some asteroids have been found to be lacking the fine-grained regolith and are composed primarily of centimeter-scale and larger particles, possibly deep into the subsurface and even into the core, for example, the Origins, Spectral Interpretation, Resource Identification, Security, Regolith Explorer (OSIRIS-REx) mission revealed for asteroid (101955) Bennu [37], and Hayabusa2 for asteroid (162173) Ryugu [38]. Harmon and Ostro [39] estimated that 25% of the lunar echo power is contributed by diffuse scattering by decimeter-scale particles and an even greater fraction of more than 40% for Mars. When a surface is dominantly composed of wavelength-scale particles, ray optics is not a sufficient scattering mechanism. Also, rms slopes above 40° are unphysical for a regolith surface because regolith particles would likely not retain such high-angled slopes over large areas for a long time due to dynamical and weathering processes. The scattering by wavelength-scale particles using particle shapes characteristic to the surface in question is thus crucial to realistically simulate the SC polarization component [32,40]. So far, the radar-scattering simulations have focused on particles in free space or near a smooth, Fresnel-scattering interface. Recently, there have also been useful developments in understanding the scattering in dense random media of irregular particles (e.g., [41]). The next key step is understanding the scattering interactions by irregular, wavelength-scale particles and the rough surface of a medium of fine-grained regolith.
Although this paper focuses on applications at microwave wavelengths, the results can be useful at visual and near-infrared wavelengths as well. For planetary surfaces composed of larger grains (greater than a millimeter), the scattering by the particles can be modeled more precisely when a rough surface is assumed instead of an ideal ellipsoid. Statistical treatment of the surface roughness could enhance the effectiveness of simulations. Furthermore, there are significant opportunities for other light-scattering applications using synthetic surfaces. There are both easy and challenging opportunities for software development; although the focus is here on incidence angles, the presented codes also compute phase functions, which can be used for modeling visual observations, when ray optics can be considered a valid approximation. An example of a more challenging task would be to add a diffuse scattering component that is not simply empirical but has physical meaning. Moreover, the observed self-affinity bias towards requires further consideration.
5. Conclusions
In summary, this paper presents a set of open-source Python codes for generating synthetic self-affine fractal surfaces and computing their phase and BSC functions, which were used to evaluate radar scattering laws. The codes can provide a useful tool for the scientific communities from various applications of physics from remote sensing and modeling of electromagnetic radiation to material sciences. The synthetic surfaces were shown to be able to reproduce measured rms slopes for a real-life example, lava flows, which gives significant confidence to the validity of the model. Some challenges were also encountered, the most significant of which is the self-affinity bias of the generated synthetic surfaces towards . This issue is fortunately not a major constraint for most natural surfaces. Moreover, the roll-off length (i.e., the frequency limits of the undulations) of the self-affine fractal surfaces has been given little consideration in the existing analytical solutions for the surface-roughness characteristics, although it plays a clear role. Here, the wavelength-scale rms slope was derived using the power spectrum with different options of roll-off length (low-frequency limit; Equations (17) and (32)).
The Gaussian law was confirmed to be the optimal scattering model for surfaces for predicting rms slope angles up to 40° when the volumes below and above the interface are homogeneous (free from scatterers larger than the Rayleigh limit), which is consistent with the literature (e.g., [18]). The Gaussian law reproduced measured rms slopes well, even when the rms height within a wavelength-scale sample length was above the Rayleigh limit; however, the produced BSC function could be less accurate. A Gaussian autocorrelation function or a Gaussian slope p.d.f. are not required for the Gaussian law to be valid for self-affine fractal surfaces. The evaluation of other widely used radar scattering laws showed that the cosine law can predict the rms slope when the slope is below 15° but overestimates the larger slopes. Neither the Gaussian nor cosine models should be used when the rms slopes are below 1°, but Fresnel reflection functions for a planar surface can be used as a valid approximation. Hagfors’ model has been shown to be an empirically well-fitting model for regolith surfaces; however, the model underestimates large rms slopes and overestimates the Fresnel reflectivity. Hagfors’ law is distinct from the other laws due to the diffuse-scattering tail at high incidence angles. The tail was not visible in the computed BSC functions at any value of the Hurst exponent or rms height, but a diffuse scattering component such as wavelength-scale structures or particles on the surface or as volume scatterers below the surface would be required to reproduce it. The scattering models presented in Shepard and Campbell [14] were incorrect; the fitted parameters require additional correction functions.
The ROSAS code was used to quantify multiple scattering, which is complex to quantify analytically. When the rms slope of the 3D surface was 0.745 (0.527 for a surface profile), the double-bounce contribution of the backscattered power was up to 10% of the total at normal incidence and the peak of the phase function appeared near for any incidence angle, whereas for a greater rms slope of 1.027 (0.726 for a profile), the backscattered power was up to 20% of the total and the peak of the phase function was at 0°. Deriving further empirical or analytical solutions for the multiple-scattering contributions is not in the scope of the paper, but the code provides a concrete tool for the estimation of the multiple scattering for any relevant applications and paves the way for further work.
Further modeling work is also needed to understand the interactions of wavelength-scale particles in contact with the self-affine fractal surfaces. A large number of elaborate scattering modeling applications exist, some are optimized for modeling volume scattering by buried inclusions, and some for individual objects of finite size with respect to the wavelength, such as applications based on the discrete-dipole approximation or the T-matrix method. A key challenge that arises in the modeling of planetary surfaces is combining a wavelength-scale object with a surface much larger than the wavelength; the scenario environment is too large for the discretization-based full-wave approaches, but ray tracing is not a sufficient approximation for a wavelength-scale object. A solution to this challenge requires future work.
Funding
This research was funded by the Academy (Research Council) of Finland grant number 347627.
Data Availability Statement
The numerical data used in the article was generated using the presented codes available through https://bitbucket.org/planetarysystemresearch/workspace/projects/SAS (accessed on 20 December 2023).
Acknowledgments
I would like to thank Bruce Campbell for providing additional information regarding the Hawaii lava flow measurements, Antti Penttilä for providing the scattering computations using the discrete dipole approximation, Juan F. Alcaide for the language check of the manuscript, and the anonymous reviewers for comments that improved the manuscript.
Conflicts of Interest
The author declares no conflicts of interest. The funders had no role in the design of the study; in the collection, analyses, or interpretation of data; in the writing of the manuscript; or in the decision to publish the results.
Abbreviations
The following abbreviations are used in this manuscript:
| BSC | Backscattering coefficient |
| HH | Horizontal to horizontal |
| HV | Horizontal to vertical |
| LL | Left to left |
| LR | Left to right |
| OC | Opposite circular |
| P.d.f. | Probability density function |
| Rms | Root mean square |
| ROSAS | Ray-optics for self-affine fractal surfaces |
| SAR | Synthetic aperture radar |
| SC | Same circular |
| SSO | Solar-system object |
| VNIR | Visual and near-infrared |
| VV | Vertical to vertical |
Appendix A
The artificial-surface algorithm, based on the theory presented in [23], generates and discretizes self-affine surfaces. The key steps of the algorithm are summarized here. First, an array of wavevectors is generated so that for each array element j:
a corresponding array is generated for the orthogonal dimension. For each dimension, the array is shifted and scaled by the pixel width, , so that the center of the array is at 0, and the wavevector ranges from to . The two arrays are used for generating a two-dimensional array where an element . This array is then used to generate a two-dimensional array for all elements , and for all elements . The array is then summed; let us define this sum as . The normalized power spectrum array is then:
The array can be used to derive the one-dimensional power-spectral-density function to check that the gradient of the function is at all wavevectors that are greater than the roll-off wavevector and constant at the wavevectors below the roll-off limit.
Next, the Fourier-transformed height array is derived so that the amplitudes are
and the phases, , are (uniformly) random in the range from to . The Fourier-transformed height array has a conjugate symmetry so that . To ensure the symmetry, and of the corners of the first quarter, i.e., elements (1,1), (1,), (,1), and (, ) are set to 0 (1 referring here to the first element). Then, the values along the rows and columns in both the amplitude and phase arrays are mirrored across to the other side so that the second half of each row (columns extending from to m) are copied and flipped (i.e., in reverse order) to replace the first half of the row (columns extending from 2 to ). For columns 1 and , the arrays are copied from row 2 to and flipped to replace the rows from to m. The mirrored phase arrays are also multiplied by .
Finally, the topography is generated by the inverse fast-Fourier transformation of an array (where i is the imaginary unit) after shifting the origin of the array from the middle () back to the beginning ().
Appendix B
In this section, Equations (17) and (32) are derived. The power spectrum for a 3D surface is defined as
The square of the rms height over an isotropic self-affine surface area is then
which gives
where . If ,
The square of the rms slope is given as
which gives
where, with a similar assumption for m as above,
The ratio of the two products is then
Here, the power spectrum is integrated from the roll-off wavevector to the single-element wavevector . To solve the rms height and the wavelength-scale rms slope for an arbitrary length (e.g., the spatial resolution in a radar image) defined by a wavevector , the power spectrum must be integrated from to , while the roll-off wavevector is still to obtain:
and
In the ratio of the rms slope and rms height, is eliminated and the ratio is expressed as a function of only and , that is, Equation (32). To clarify, this solution is different from the rms slope for a lag of by solving the wavelength-scale rms slope.
Appendix C
Table A1 lists the statistical roughness properties of the Hawaii lava flows presented in [22,25]. The Rayleigh roughness limit is m (at normal incidence) for the rms height in the wavelength-scale sample length, which can be calculated by . All sites with m are above the Rayleigh limit at a sample length of 0.25 m.

Table A1.
Roughness statistics for the Hawaii lava flows presented in [22,25] (sorted by roughness, i.e., root-mean-square (rms) slope and rms height, but with the original site numbers shown in the first column) and used in Figure 6. Test Cases 1, 2, and 3 are, respectively, sites 10, 8, and 5.
| Site | H | (25 cm) | (1 m) | (1 m) [m] | (25 cm) [m] |
|---|---|---|---|---|---|
| 1 | 0.62 | 0.073 | 0.039 | 0.014 | 0.006 |
| 10 | 0.63 | 0.076 | 0.046 | 0.017 | 0.007 |
| 9 | 0.64 | 0.147 | 0.088 | 0.032 | 0.013 |
| 2 | 0.68 | 0.172 | 0.104 | 0.036 | 0.014 |
| 6 | 0.44 | 0.222 | 0.099 | 0.041 | 0.022 |
| 8 | 0.49 | 0.225 | 0.108 | 0.046 | 0.023 |
| 4 | 0.48 | 0.324 | 0.155 | 0.062 | 0.032 |
| 3 | 0.51 | 0.436 | 0.215 | 0.085 | 0.042 |
| 7 | 0.29 | 0.586 | 0.217 | 0.105 | 0.070 |
| 5 | 0.26 | 0.705 | 0.240 | 0.120 | 0.084 |
Appendix D
Figure A1 shows four different slope angle p.d.f. histograms so that varies from 0.01 m to 0.3 m, and other parameters are kept constant (, m, , and ). The slope angle is obtained from the vertical component of unit normal vectors of the surface elements so that . A Gaussian p.d.f. fit is added for reference. The slope () distributions are best fit by the Rayleigh p.d.f. as shown by Shepard et al. [18].
Figure A1.
The slope angle p.d.f. for four different cases of : (A) m, (B) m, (C) m, and (D) m, when , m, , and . The magenta curve is a Gaussian p.d.f. fit.
Figure A1.
The slope angle p.d.f. for four different cases of : (A) m, (B) m, (C) m, and (D) m, when , m, , and . The magenta curve is a Gaussian p.d.f. fit.

References
- Patterson, G.W.; Stickle, A.M.; Turner, F.S.; Jensen, J.R.; Bussey, D.B.J.; Spudis, P.; Espiritu, R.C.; Schulze, R.C.; Yocky, D.A.; Wahl, D.E.; et al. Bistatic radar observations of the Moon using Mini-RF on LRO and the Arecibo Observatory. Icarus 2017, 283, 2–19. [Google Scholar] [CrossRef]
- Bhiravarasu, S.S.; Chakraborty, T.; Putrevu, D.; Pandey, D.K.; Das, A.K.; Ramanujam, V.M.; Mehra, R.; Parasher, P.; Agrawal, K.M.; Gupta, S.; et al. Chandrayaan-2 Dual-frequency Synthetic Aperture Radar (DFSAR): Performance Characterization and Initial Results. Planet. Sci. J. 2021, 2, 134. [Google Scholar] [CrossRef]
- Hagfors, T. Backscattering from an undulating surface with applications to radar returns from the Moon. J. Geophys. Res. 1964, 69, 3779–3784. [Google Scholar] [CrossRef]
- Muhleman, D.O. Symposium on Radar and Radiometric Observations of Venus during the 1962 Conjunction: Radar scattering from Venus and the Moon. Astron. J. 1964, 69, 34. [Google Scholar] [CrossRef]
- Rea, D.G.; Hetherington, N.; Miffin, R. The Analysis of Radar Echoes from the Moon. J. Geophys. Res. 1964, 69, 5217–5223. [Google Scholar] [CrossRef]
- Mitchell, D.L.; Ostro, S.J.; Hudson, R.S.; Rosema, K.D.; Campbell, D.B.; Velez, R.; Chandler, J.F.; Shapiro, I.I.; Giorgini, J.D.; Yeomans, D.K. Radar Observations of Asteroids 1 Ceres, 2 Pallas, and 4 Vesta. Icarus 1996, 124, 113–133. [Google Scholar] [CrossRef]
- Jurgens, R.F.; Goldstein, R.M. Radar observations at 3.5 and 12.6 CM wavelength of asteroid 433 Eros. Icarus 1976, 28, 1–15. [Google Scholar] [CrossRef]
- Ostro, S.J.; Campbell, D.B.; Shapiro, I.I. Radar observations of asteroid 1685 Toro. Astron. J. 1983, 88, 565–576. [Google Scholar] [CrossRef]
- McCollom, T.M.; Jakosky, B.M. Interpretation of planetary radar observations: The relationship between actual and inferred slope distributions. J. Geophys. Res. 1993, 98, 1173–1184. [Google Scholar] [CrossRef]
- Nolan, M.C.; Magri, C.; Howell, E.S.; Benner, L.A.M.; Giorgini, J.D.; Hergenrother, C.W.; Hudson, R.S.; Lauretta, D.S.; Margot, J.L.; Ostro, S.J.; et al. Shape model and surface properties of the OSIRIS-REx target Asteroid (101955) Bennu from radar and lightcurve observations. Icarus 2013, 226, 629–640. [Google Scholar] [CrossRef]
- Marshall, S.E.; Howell, E.S.; Magri, C.; Vervack, R.J.; Campbell, D.B.; Fernández, Y.R.; Nolan, M.C.; Crowell, J.L.; Hicks, M.D.; Lawrence, K.J.; et al. Thermal properties and an improved shape model for near-Earth asteroid (162421) 2000 ET70. Icarus 2017, 292, 22–35. [Google Scholar] [CrossRef]
- Rożek, A.; Lowry, S.C.; Nolan, M.C.; Taylor, P.A.; Benner, L.A.M.; Fitzsimmons, A.; Zegmott, T.J.; Weissman, P.R.; Green, S.F.; Rozitis, B.; et al. Shape model and spin-state analysis of PHA contact binary (85990) 1999 JV6 from combined radar and optical observations. Astron. Astrophys. 2019, 631, A149. [Google Scholar] [CrossRef]
- McGlasson, R.A.; Marshall, S.E.; Venditti, F.C.F.; Naidu, S.P.; Benner, L.A.M.; Brozović, M.; Giorgini, J.D.; Taylor, P.A.; Aponte, B.; Virkki, A.K.; et al. Radar and Lightcurve Observations and a Physical Model of Potentially Hazardous Asteroid 1981 Midas. Planet. Sci. J. 2022, 3, 35. [Google Scholar] [CrossRef]
- Shepard, M.K.; Campbell, B.A. Radar Scattering from a Self-Affine Fractal Surface: Near-Nadir Regime. Icarus 1999, 141, 156–171. [Google Scholar] [CrossRef]
- Franceschetti, G.; Iodice, A.; Migliaccio, M.; Riccio, D. Scattering from natural rough surfaces modeled by fractional Brownian motion two-dimensional processes. IEEE Trans. Antennas Propag. 1999, 47, 1405–1415. [Google Scholar] [CrossRef]
- Biccari, D.; Picardi, G.; Seu, R.; Corradini, A.; Orosei, R. The Mars High Resolution Advanced Radar for 2005 Space Mission. In Proceedings of the Conference on the Geophysical Detection of Subsurface Water on Mars, Houston, TX, USA, 6–10 August 2001; p. 7029. [Google Scholar]
- Turcotte, D.L. Fractals and Chaos in Geology and Geophysics; Cornell University: New York, NY, USA, 1997. [Google Scholar]
- Shepard, M.K.; Brackett, R.A.; Arvidson, R.E. Self-affine (fractal) topography: Surface parameterization and radar scattering. J. Geophys. Res. Planets 1995, 100, 11709–11718. [Google Scholar] [CrossRef]
- Austin, R.T.; England, A.W.; Wakefield, G.H. Special problems in the estimation of power-law spectra as applied to topographical modeling. IEEE Trans. Geosci. Remote Sens. 1994, 32, 928–939. [Google Scholar] [CrossRef]
- Shepard, M.K.; Campbell, B.A. Shadows on a Planetary Surface and Implications for Photometric Roughness. Icarus 1998, 134, 279–291. [Google Scholar] [CrossRef]
- Ulaby, F.T.; Long, D.G. Microwave Radar and Radiometric Remote Sensing; University of Michigan Press: Ann Arbor, MI, USA, 2014. [Google Scholar]
- Campbell, B.A. Scale-Dependent Surface Roughness Behavior and ItsImpact on Empirical Models for Radar Backscatter. IEEE Trans. Geosci. Remote Sens. 2009, 47, 3480–3488. [Google Scholar] [CrossRef]
- Persson, B.N.J.; Albohr, O.; Tartaglino, U.; Volokitin, A.I.; Tosatti, E. TOPICAL REVIEW: On the nature of surface roughness with application to contact mechanics, sealing, rubber friction and adhesion. J. Phys. Condens. Matter 2005, 17, R1–R62. [Google Scholar] [CrossRef]
- Shepard, M.K.; Campbell, B.A.; Bulmer, M.H.; Farr, T.G.; Gaddis, L.R.; Plaut, J.J. The roughness of natural terrain: A planetary and remote sensing perspective. J. Geophys. Res. 2001, 106, 32777–32796. [Google Scholar] [CrossRef]
- Campbell, B.A. Radar Remote Sensing of Planetary Surfaces; Cambridge University Press: Cambridge, UK, 2002. [Google Scholar]
- Persson, B.N.J. On the Fractal Dimension of Rough Surfaces. Tribol. Lett. 2014, 54, 99–106. [Google Scholar] [CrossRef]
- Simpson, R.A.; Tyler, G.L. Radar scattering laws for the lunar surface. IEEE Trans. Antennas Propag. 1982, 30, 438–449. [Google Scholar] [CrossRef]
- Magri, C.; Ostro, S.J.; Scheeres, D.J.; Nolan, M.C.; Giorgini, J.D.; Benner, L.A.M.; Margot, J.L. Radar observations and a physical model of Asteroid 1580 Betulia. Icarus 2007, 186, 152–177. [Google Scholar] [CrossRef]
- Fung, A.K. Microwave Scattering and Emission Models and Their Applications; Artech House: Norwood, MA, USA, 1994. [Google Scholar]
- Fung, A.K.; Li, Z.; Chen, K.S. Backscattering from a randomly rough dielectric surface. IEEE Trans. Geosci. Remote Sens. 1992, 30, 356–369. [Google Scholar] [CrossRef]
- Fa, W.; Wieczorek, M.A.; Heggy, E. Modeling polarimetric radar scattering from the lunar surface: Study on the effect of physical properties of the regolith layer. J. Geophys. Res. (Planets) 2011, 116, E03005. [Google Scholar] [CrossRef]
- Virkki, A.K.; Bhiravarasu, S.S. Modeling Radar Albedos of Laboratory-Characterized Particles: Application to the Lunar Surface. J. Geophys. Res. (Planets) 2019, 124, 3025–3040. [Google Scholar] [CrossRef]
- Smith, B.G. Lunar Surface Roughness: Shadowing and Thermal Emission. J. Geophys. Res. 1967, 72, 4059. [Google Scholar] [CrossRef]
- Campbell, B.A. High circular polarization ratios in radar scattering from geologic targets. J. Geophys. Res. (Planets) 2012, 117, E06008. [Google Scholar] [CrossRef]
- Riskilä, E.; Lindqvist, H.; Muinonen, K. Light scattering by fractal roughness elements on ice crystal surfaces. J. Quant. Spectrosc. Radiat. Transf. 2021, 267, 107561. [Google Scholar] [CrossRef]
- Helfenstein, P.; Shepard, M.K. Submillimeter-Scale Topography of the Lunar Regolith. Icarus 1999, 141, 107–131. [Google Scholar] [CrossRef]
- Lauretta, D.S.; Dellagiustina, D.N.; Bennett, C.A.; Golish, D.R.; Becker, K.J.; Balram-Knutson, S.S.; Barnouin, O.S.; Becker, T.L.; Bottke, W.F.; Boynton, W.V.; et al. The unexpected surface of asteroid (101955) Bennu. Nature 2019, 568, 55–60. [Google Scholar] [CrossRef] [PubMed]
- Michikami, T.; Honda, C.; Miyamoto, H.; Hirabayashi, M.; Hagermann, A.; Irie, T.; Nomura, K.; Ernst, C.M.; Kawamura, M.; Sugimoto, K.; et al. Boulder size and shape distributions on asteroid Ryugu. Icarus 2019, 331, 179–191. [Google Scholar] [CrossRef]
- Harmon, J.K.; Ostro, S.J. Mars: Dual-polarization radar observations with extended coverage. Icarus 1985, 62, 110–128. [Google Scholar] [CrossRef]
- Virkki, A.; Muinonen, K. Radar scattering by planetary surfaces modeled with laboratory-characterized particles. Icarus 2016, 269, 38–49. [Google Scholar] [CrossRef]
- Markkanen, J.; Väisänen, T.; Penttilä, A.; Muinonen, K. Scattering and absorption in dense discrete random media of irregular particles. Opt. Lett. 2018, 43, 2925. [Google Scholar] [CrossRef]
Figure 1.
A compilation of the artificial surface realizations using the labeled Hurst exponents and root-mean-square (rms) heights.
Figure 1.
A compilation of the artificial surface realizations using the labeled Hurst exponents and root-mean-square (rms) heights.
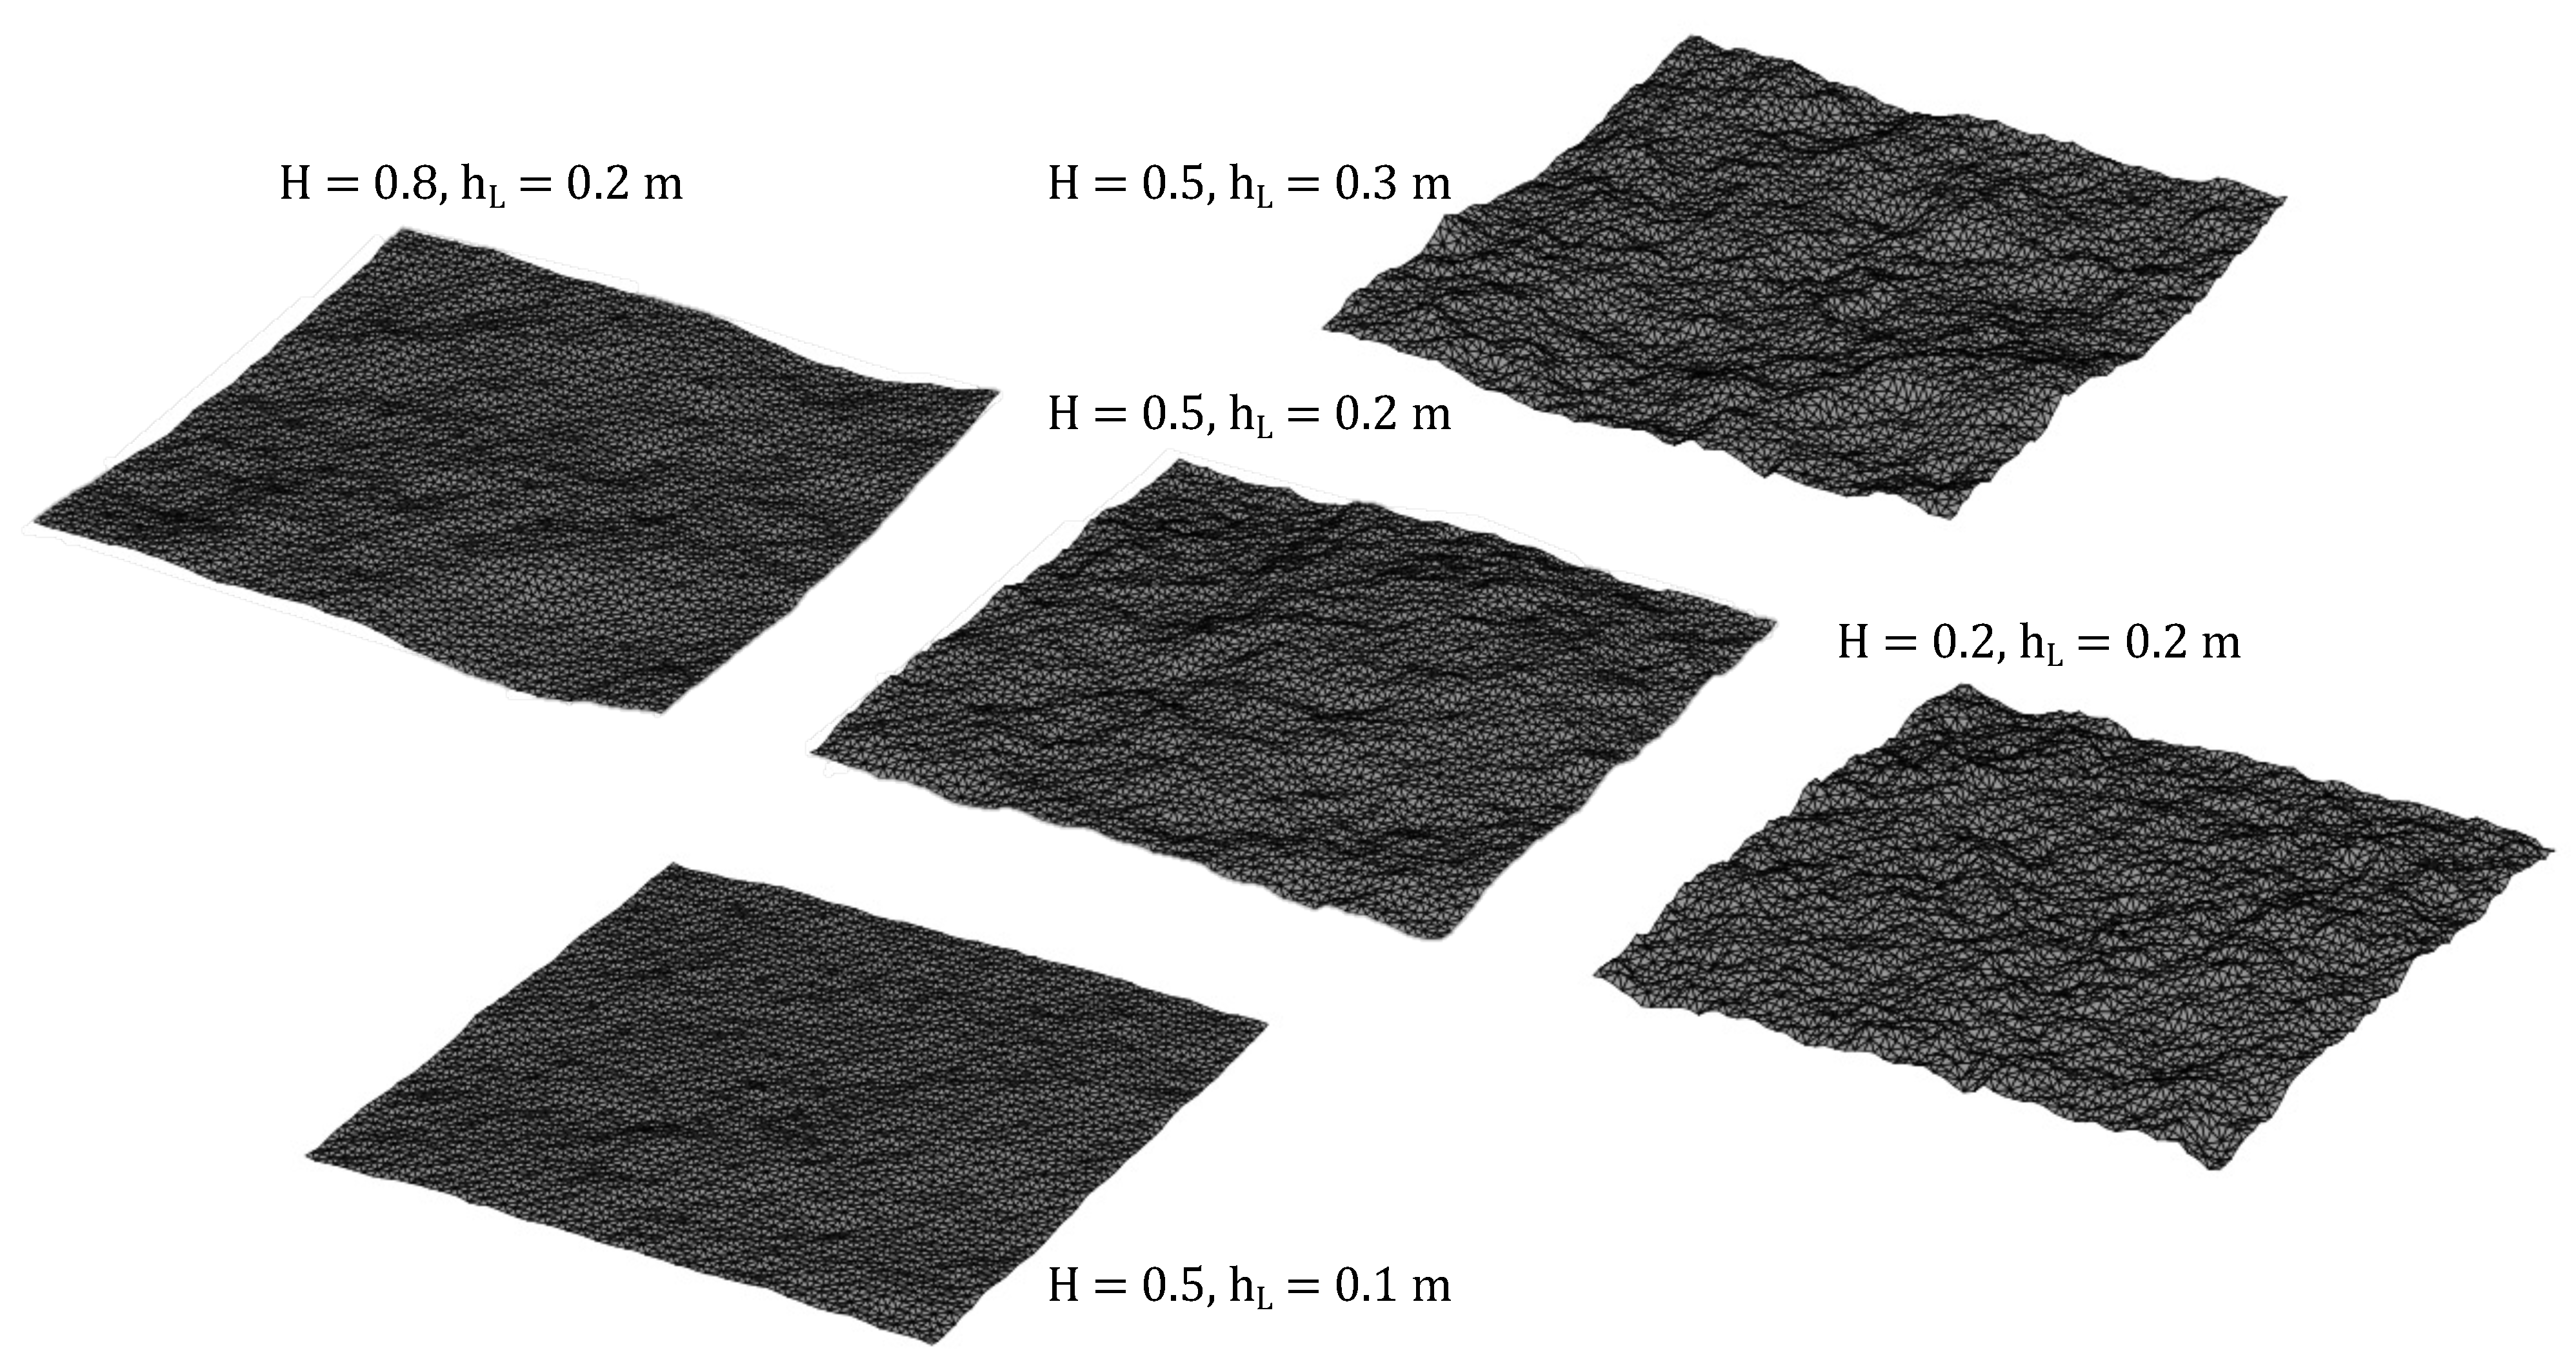
Figure 2.
An example illustration of the radar scattering laws selected for the analysis when using , which is equal to and when .
Figure 2.
An example illustration of the radar scattering laws selected for the analysis when using , which is equal to and when .

Figure 3.
The power spectrum (on the left) and the autocorrelation function (on the right) when , m, m, , and ( m, depicted as a vertical blue dotted line). In the power spectrum, the transition point is at , and the power-law gradient is proportional to . The black horizontal line depicts , i.e., the correlation length is here the value of lag where the line crosses the autocorrelation function (at m).
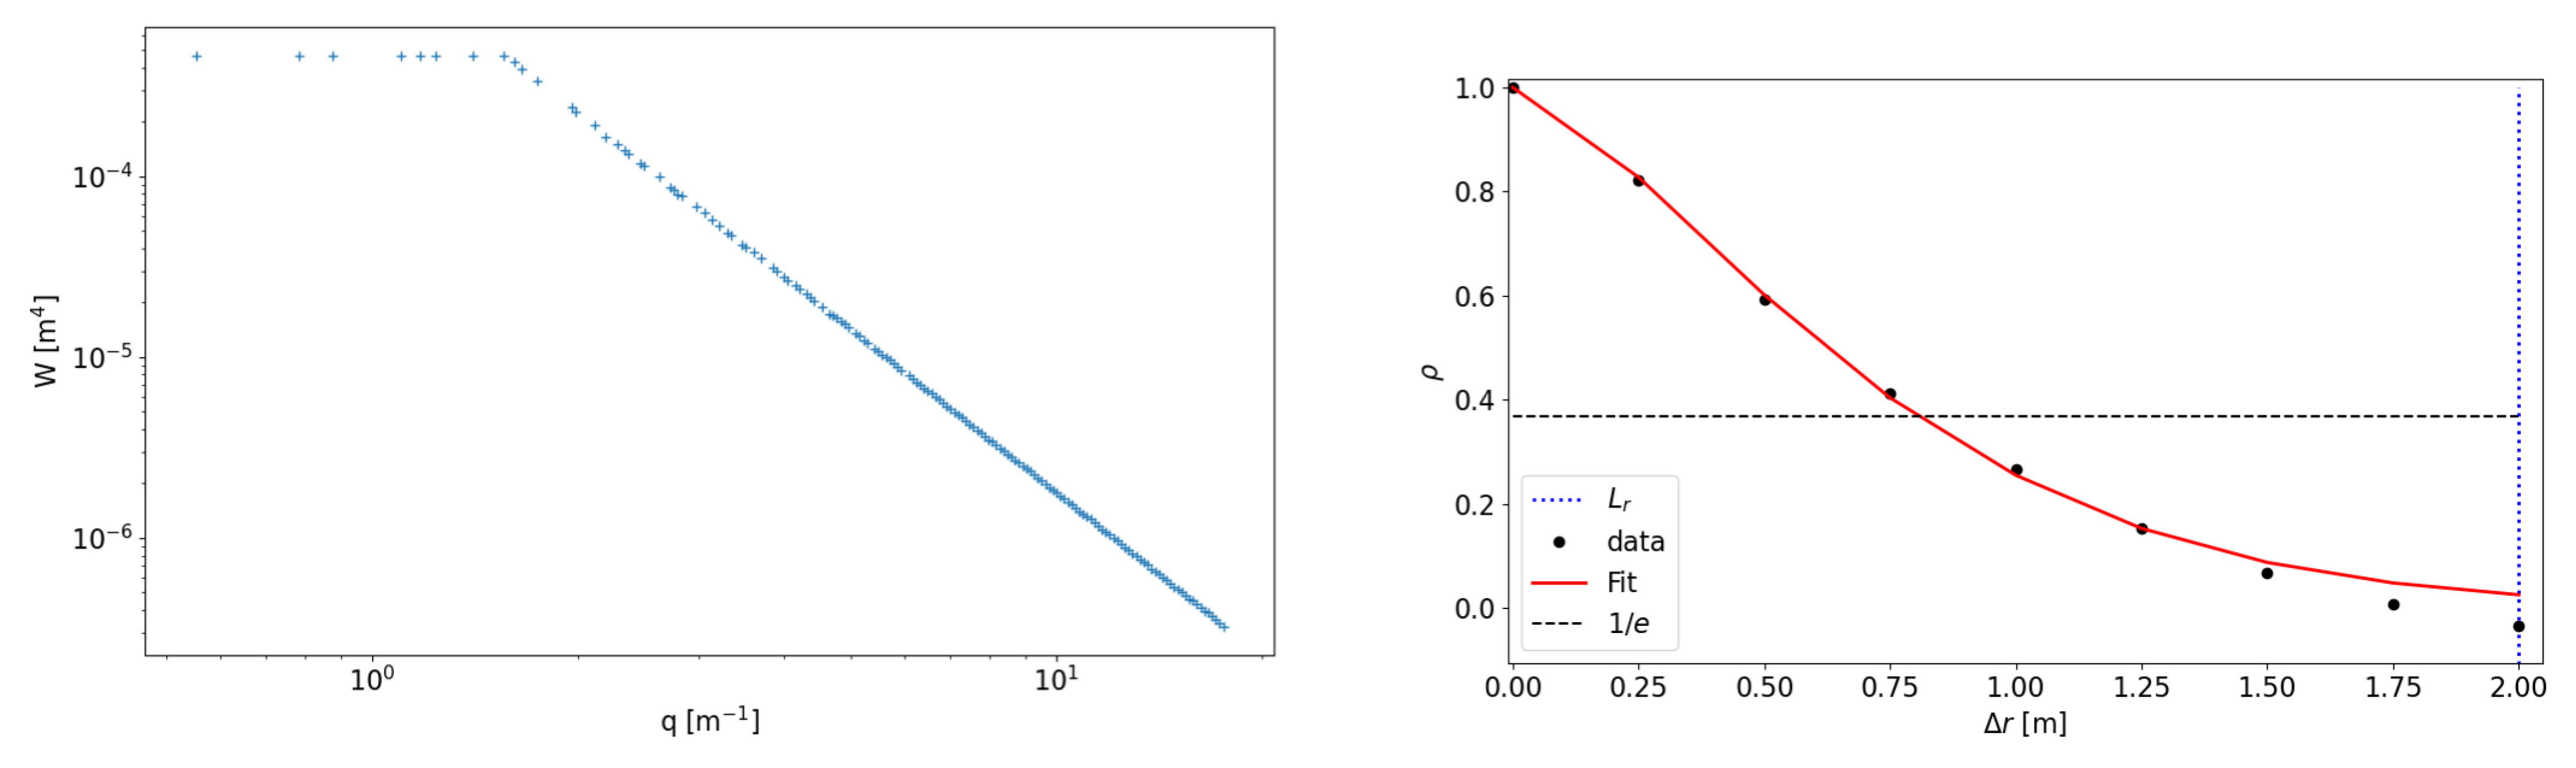
Figure 4.
The root-mean-square (rms) height as a function of step size (cyan) and profile length (magenta) when , m, m, , and ( m, depicted as a vertical blue dotted line), where each data set is an average of 10 surface realizations. The fit to the rms height as a function of profile length (L) is shown as a red dashed line, and the horizontal black dashed line depicts given as input to define the surface.

Figure 5.
The surface properties as functions of lag when , m, m, , and ( m, depicted as a vertical blue dotted line). (a) The root-mean-square (rms) deviation for surface profiles sampled from synthetic surfaces (black circles) and a fitted model (Equation (35); red solid line at ), and (horizontal green dashed line at ). The power-law model (Equation (2)) fitted to only small values of is added for reference (red dotted lines). (b) The rms slope (black circles) and the fitted model (with the same line styles as in panel (a)). (c) The ratio of the rms deviation model’s values to the data values as a function of lag (the solid and dotted line corresponding to the red lines of the same style). (d) The ratio of the rms slope model’s values to the data values as a function of lag (with the same line styles as in panel (c)).
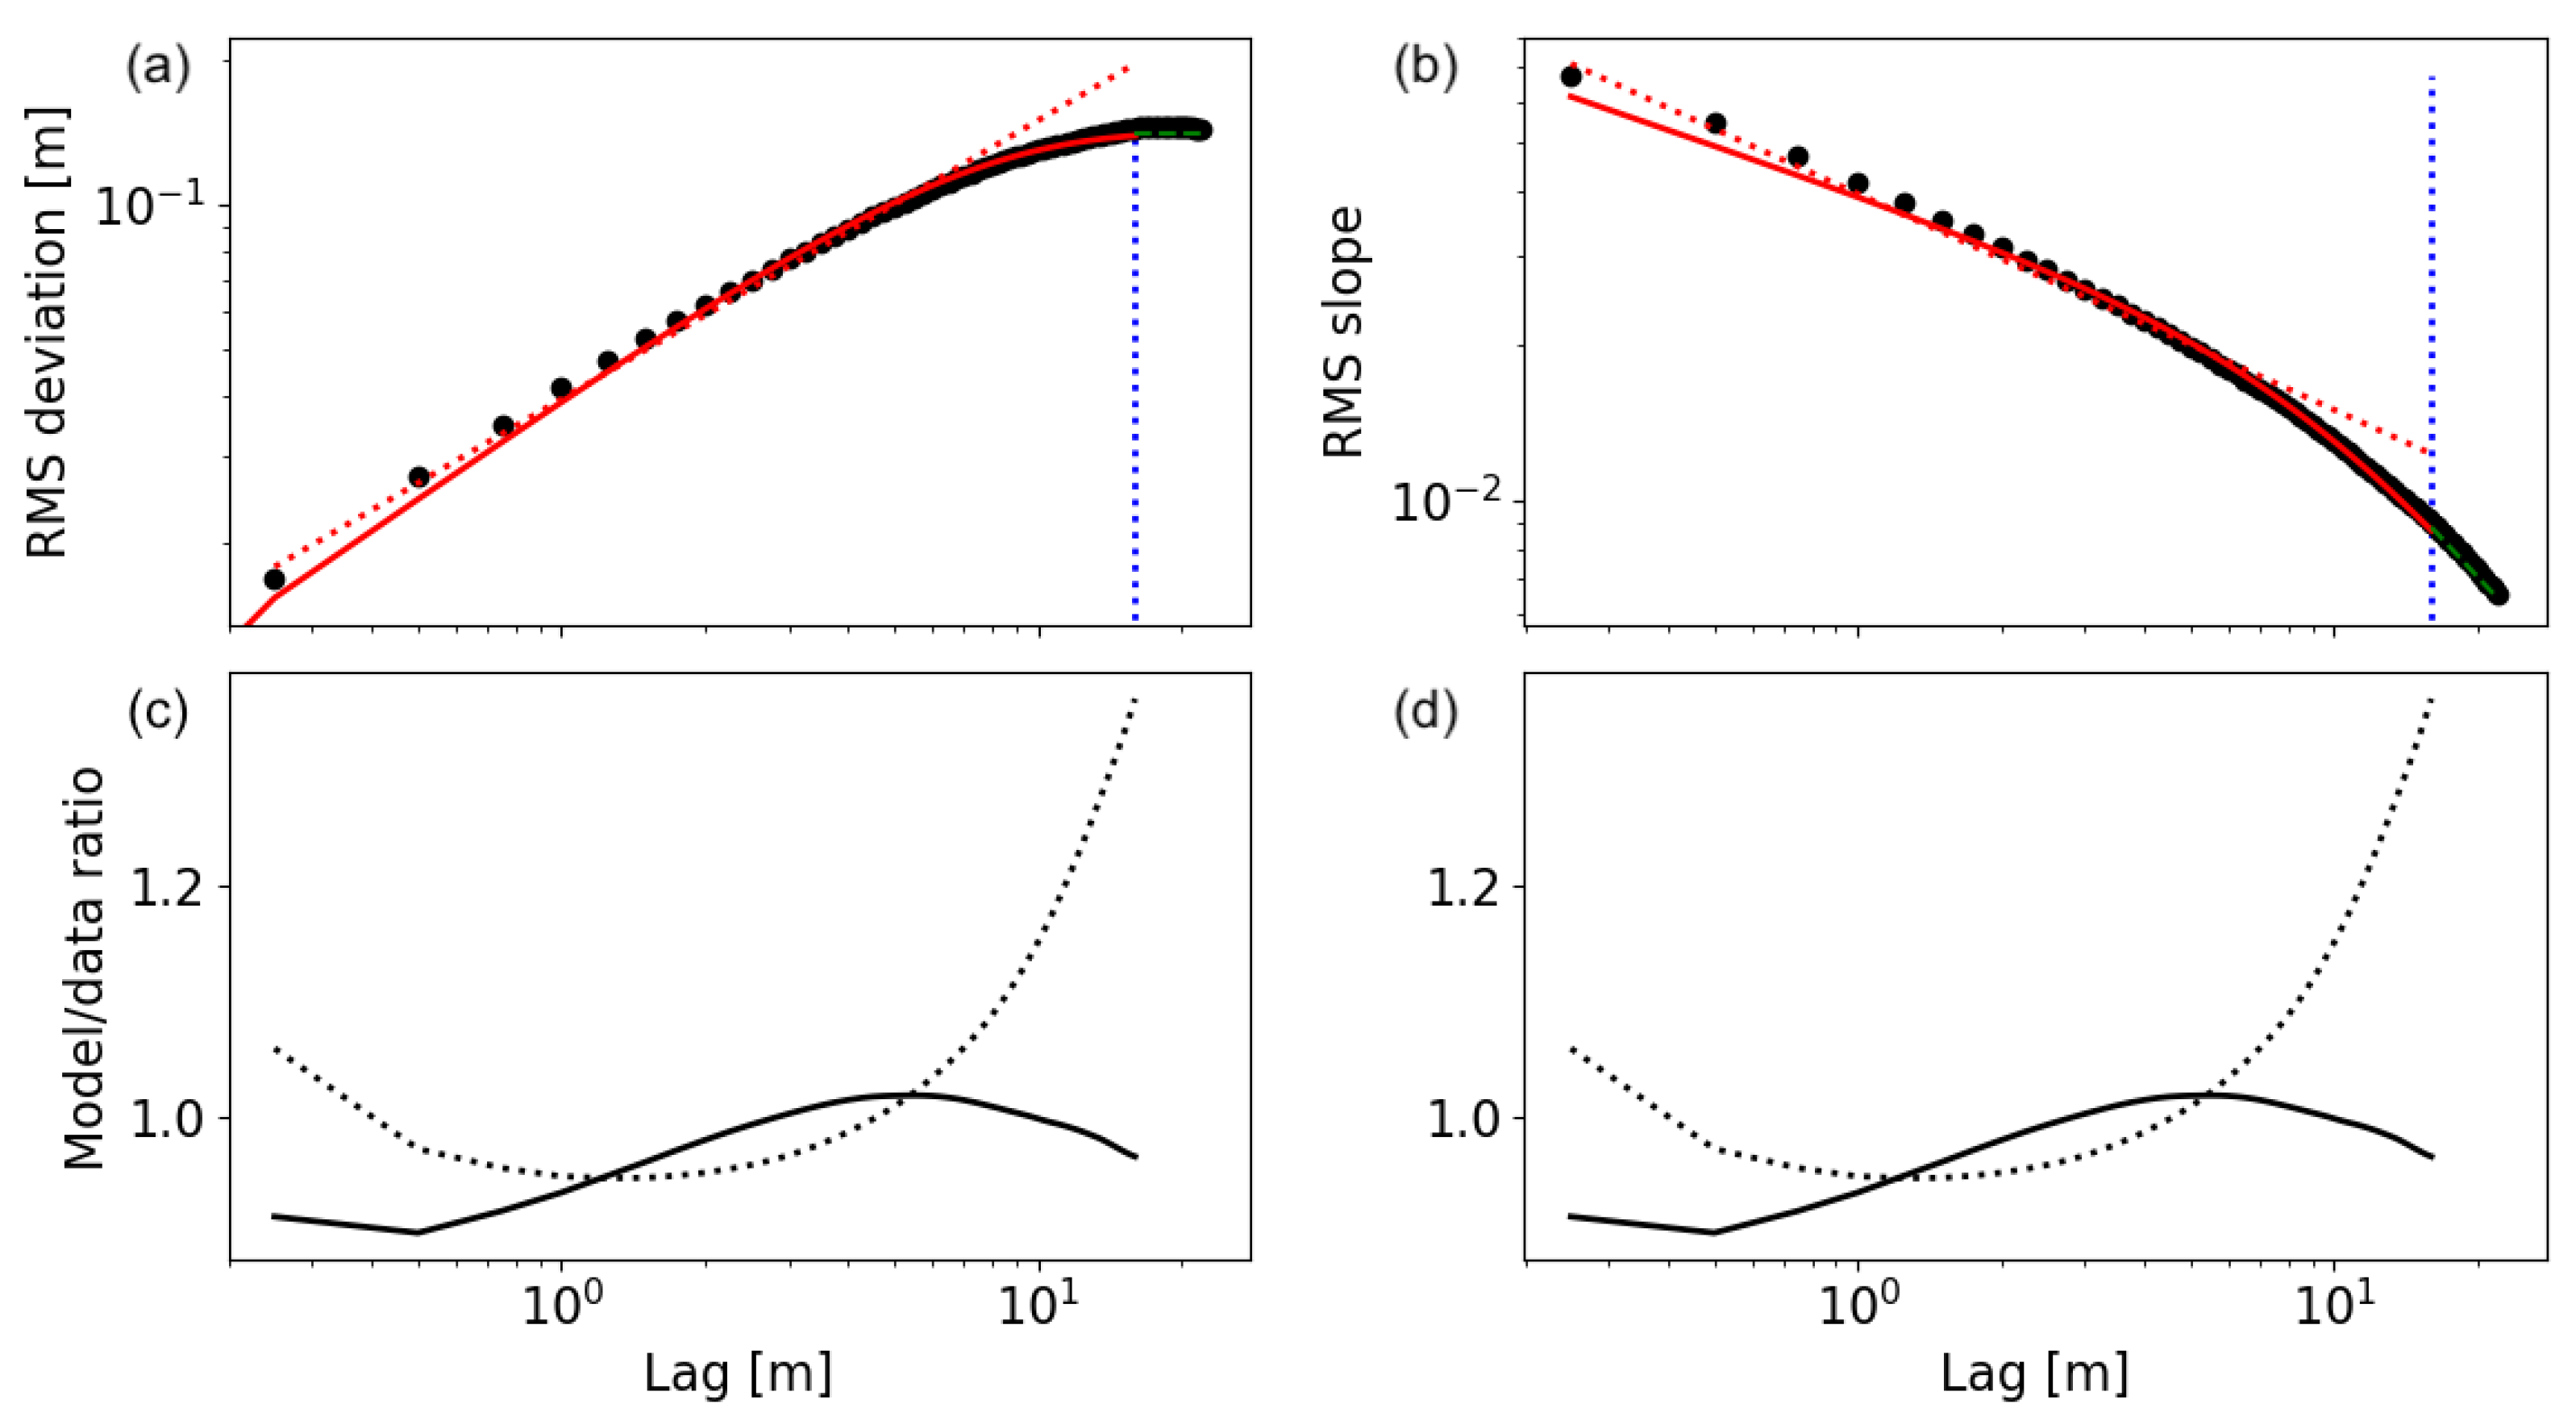
Figure 6.
The root-mean-square (rms) slopes measured for Hawaii lava flow surface profiles [22] compared to a model following Equation (32) using . The black dashed line has been added as a visual reference of an optimal fit. The values are listed in Table A1 in Appendix C.
Figure 6.
The root-mean-square (rms) slopes measured for Hawaii lava flow surface profiles [22] compared to a model following Equation (32) using . The black dashed line has been added as a visual reference of an optimal fit. The values are listed in Table A1 in Appendix C.
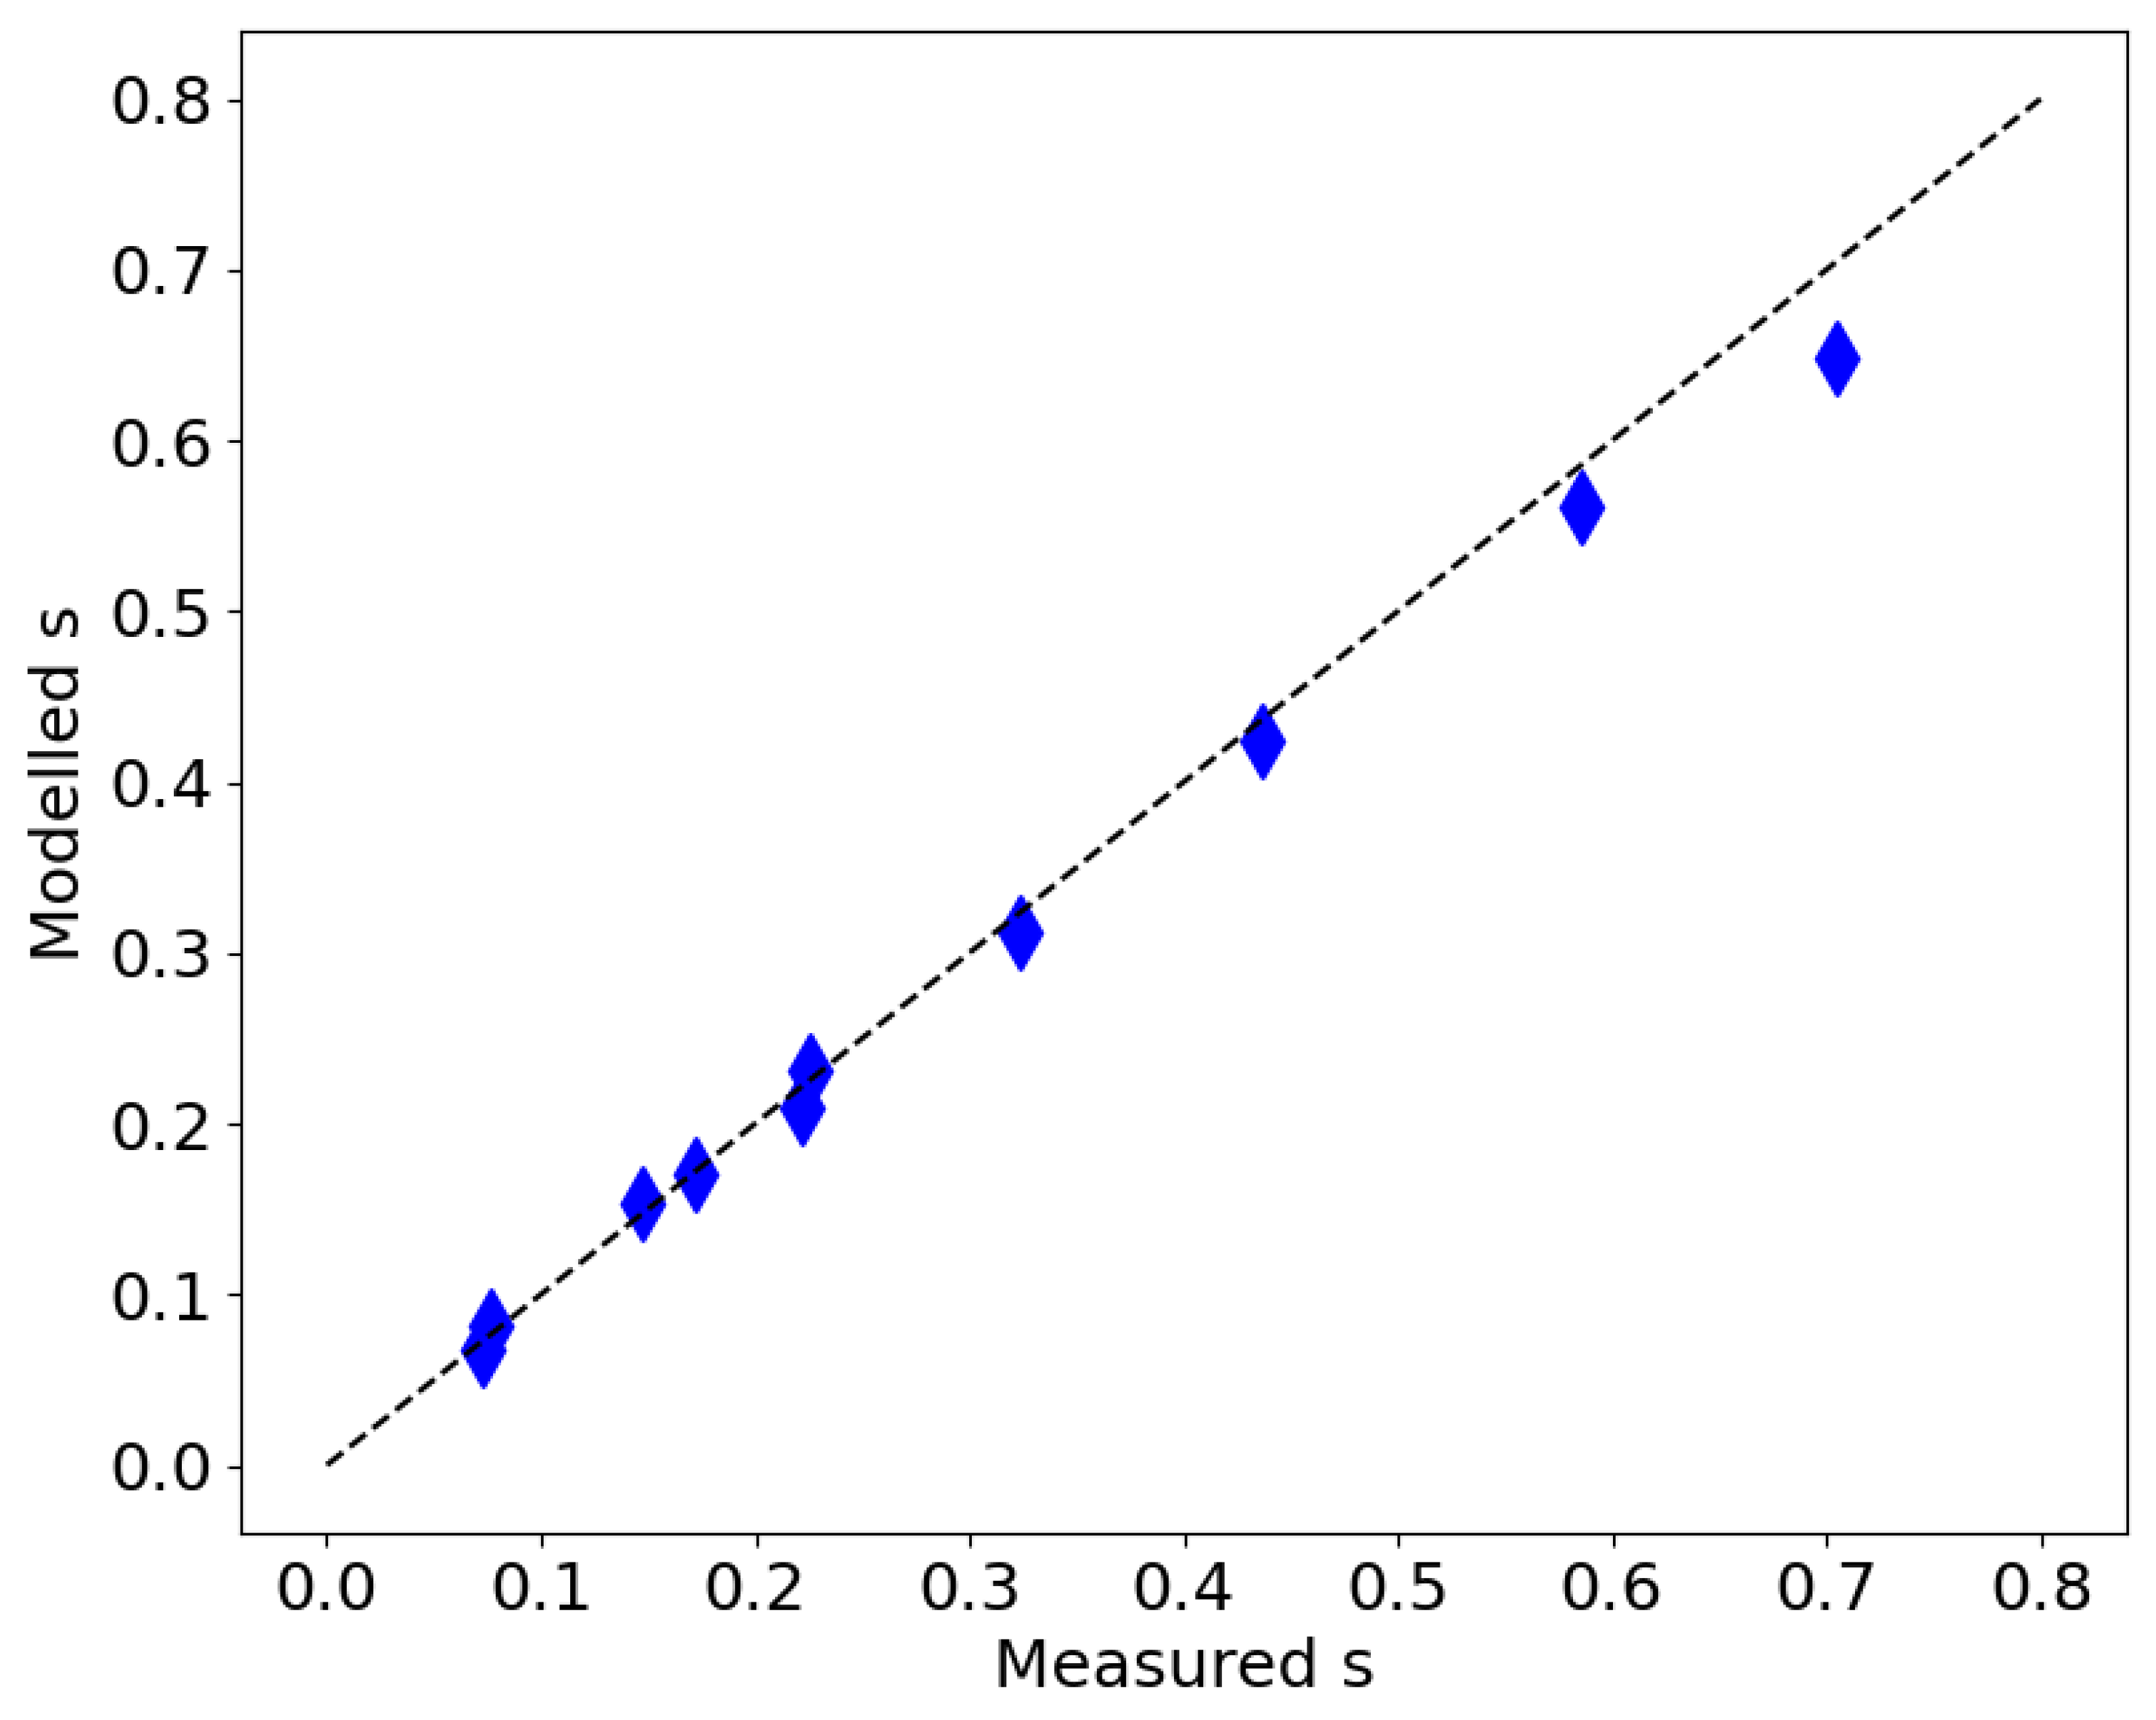
Figure 7.
The backscattering coefficients as a function of incidence angle (the left-side panels (a,c,e)) and the scattering phase matrix element as a function of the phase angle (the right-side panels (b,d,f)) for , m, , and , when m (a,b), m (c,d), and m (e,f). The scattering models based on the cosine (magenta), Gaussian (cyan), and Hagfors’ laws (green) were fitted to the computed BSC functions at incidence angles from 0 to 80°. In the phase curves on the right, the normal incidence is shown as a black line, and each consecutive incidence angle at 4° intervals in a lightening shade of gray.

Figure 8.
(a) The comparison of the model-predicted (fitted) root-mean-square (rms) slope versus the true (expected) rms slope of the synthetic surface when using the cosine (magenta), the Gaussian (cyan), and the Hagfors’ law (green) depicted with the reference for an ideal fit (the dashed line); and (b) the same comparison for the Fresnel normal-incidence reflectivity coefficient with the ideal fit at 0.146 (the black cross). Here, and varies from 0.01 m to 0.5 m with steps of 0.1 m (respectively, the markers from the lower left to the upper right corner in panel (a), and the corresponding colors on the right).

Figure 9.
The backscattering coefficient (BSC) functions for Test Case 1 (top), Test Case 2 (middle), and Test Case 3 (bottom). The scattering models based on the cosine, Gaussian, and Hagfors’ laws were fit to the computed BSC functions at incidence angles from 0° to 78°. Campbell’s empirical model (the sum of Equations (29) and (30)) for backscattering coefficients is depicted in blue “x” markers for the wavelength-scale root-mean-square (rms) slope for the synthetic surface.


Figure 10.
The contribution of multiple scattering. The phase function with a breakdown of the contribution of first-order reflection in green, double bounce depicted in magenta, and that of triple reflections in cyan, when the incidence angle is (a) 0° and (b) 40° when (), and (c) 0° and (d) 40°, when ().

Figure 11.
The backscattering coefficients and circular polarization components as a function of incidence angle for Test Case 3 computed using ROSAS (here, , , ). (a) The total BSC function, (b) the opposite-circular-polarization component, (c) the same-circular-polarization component, and (d) the circular-polarization ratio. The errorbars were derived using the one-sigma uncertainty of the zero-phase-angle intercept for a line fit to the phase angles from 0° to 20° of the and elements using a linear regression fit (the functions are sufficiently linear in this range of angles). The blue crosses depict the empirical models for the measurements by Campbell [22] (using Equations (29)–(31) and their combinations), and the cyan dashed line depicts the Gaussian fit using the simplified surface-scattering algorithm.

Disclaimer/Publisher’s Note: The statements, opinions and data contained in all publications are solely those of the individual author(s) and contributor(s) and not of MDPI and/or the editor(s). MDPI and/or the editor(s) disclaim responsibility for any injury to people or property resulting from any ideas, methods, instructions or products referred to in the content. |
© 2024 by the author. Licensee MDPI, Basel, Switzerland. This article is an open access article distributed under the terms and conditions of the Creative Commons Attribution (CC BY) license (https://creativecommons.org/licenses/by/4.0/).
Share and Cite
MDPI and ACS Style
Virkki, A. Numerical Evaluation of Planetary Radar Backscatter Models for Self-Affine Fractal Surfaces. Remote Sens. 2024, 16, 890. https://doi.org/10.3390/rs16050890
AMA Style
Virkki A. Numerical Evaluation of Planetary Radar Backscatter Models for Self-Affine Fractal Surfaces. Remote Sensing. 2024; 16(5):890. https://doi.org/10.3390/rs16050890
Chicago/Turabian StyleVirkki, Anne. 2024. "Numerical Evaluation of Planetary Radar Backscatter Models for Self-Affine Fractal Surfaces" Remote Sensing 16, no. 5: 890. https://doi.org/10.3390/rs16050890
Note that from the first issue of 2016, this journal uses article numbers instead of page numbers. See further details here.