Article

Digital Mapping of Soil Particle Size Fractions in the Loess Plateau, China, Using Environmental Variables and Multivariate Random Forest

1
Faculty of Resources and Environmental Science, Hubei University, Wuhan 430062, China
2
Hubei Key Laboratory of Regional Development and Environmental Response, Hubei University, Wuhan 430062, China
3
Tianjin Institute of Geological Survey, Tianjin 300191, China
4
Tianjin Monitoring Central Station of Geological Environment, Tianjin 300191, China
5
Key Laboratory of Natural Resources Monitoring and Supervision in Southern Hilly Region, Ministry of Natural Resources, Changsha 410118, China
6
Key Laboratory of Digital Mapping and Land Information Application, Ministry of Natural Resources, Wuhan University, Wuhan 430079, China
*
Author to whom correspondence should be addressed.
Remote Sens. 2024, 16(5), 785; https://doi.org/10.3390/rs16050785
Submission received: 14 December 2023 / Revised: 4 February 2024 / Accepted: 5 February 2024 / Published: 24 February 2024
(This article belongs to the Special Issue GIS and Remote Sensing in Soil Mapping and Modeling)

Abstract

:
Soil particle size fractions (PSFs) are important properties for understanding the physical and chemical processes in soil systems. Knowledge about the distribution of soil PSFs is critical for sustainable soil management. Although log-ratio transformations have been widely applied to soil PSFs prediction, the statistical distribution of original data and the transformed data given by log-ratio transformations is different, resulting in biased estimates of soil PSFs. Therefore, multivariate random forest (MRF) was utilized for the simultaneous prediction of soil PSFs, as it is able to capture dependencies and internal relations among the three components. Specifically, 243 soil samples collected across the Loess Plateau were used. Meanwhile, Landsat data, terrain attributes, and climatic variables were employed as environmental variables for spatial prediction of soil PSFs. The results depicted that MRF gave satisfactory soil PSF prediction performance, where the R2 values were 0.62, 0.53, and 0.73 for sand, silt, and clay, respectively. Among the environmental variables, nighttime land surface temperature (LST_N) presented the highest importance in predicting soil PSFs in the Loess Plateau, China. Maps of soil PSFs and texture were generated at a 30 m resolution, which can be utilized as alternative data for soil erosion management and ecosystem conservation.

1. Introduction

Soil texture, measured by particle size fractions (PSFs), partly determines the state and quality of soil, which plays a crucial role in modeling hydrological, ecological, and environmental processes [1,2]. High-resolution maps of soil PSFs are essential for sustainable agriculture and soil erosion management. Notably, a sampling survey is a widely accepted approach to obtain soil properties at a regional scale [3,4]. Soil samples are collected in accordance with planned sampling profiles and then carried to the laboratory for the soil PSF analysis. However, for a large-scale investigation of soil properties, it is labor-intensive and time-consuming to collect sufficient soil samples [5].
In recent decades, digital soil mapping (DSM) has been developed to estimate soil properties. Specifically, the discrete sampling points can be converted to a continuous surface using spatial interpolation approaches [6]. Odeh et al. [7] applied kriging interpolation with two data transformation methods to estimate soil PSF distribution. Zhang et al. [8] employed ordinary kriging, regression kriging, and compositional kriging for the mapping of soil texture and PSFs. Zhao et al. [9] used universal kriging interpolation to generate multi-layer soil PSF maps for the Loess Plateau of China. Li et al. [10] evaluated kriging approaches with various log-ratio transformations for interpolating the soil PSFs and texture. Wan et al. [11] developed a co-kriging approach based on exploratory factor analysis to explore the spatial distribution of multi-layered soil PSFs. Furthermore, machine learning has been applied to estimate soil properties, examining the relations between soil observations and spatially continuous environmental variables [12,13,14]. In particular, random forest (RF), as an effective technique, has been employed for the estimation of soil texture and PSFs. Akpa et al. [15] depicted the superiority of RF in mapping the soil PSFs of Nigeria. Hengl et al. [16] mapped the soil PSFs of Africa and illustrated that the use of RF improved the DSM performance. da Silva Chagas et al. [17] showed that combining RF and remote sensing data can provide a satisfactory estimation result of soil texture in semi-arid areas. Liu et al. [18] employed RF to predict the spatial variation of soil PSFs as well as soil texture at multiple depths across China with a 90 m resolution. Zheng et al. [19] mapped the soil PSFs of cultivated land in Songnen Plain using RF and Sentinel-2 images. Cheshmberah et al. [2] evaluated 16 mathematical models for predicting soil PSF distribution and used RF to identify the relations between environmental variables and soil PSFs.
In soil science, soil PSFs are well-known compositional data, consisting of sand, silt, and clay [20]. The contents of the three components are related to each other and presented as percentages. Notably, log-ratio transformations have been applied in the interpretation of the compositional soil PSF data. Specifically, additive log-ratio (ALR), centroid log-ratio (CLR), and isometric log-ratio (ILR) are widely used transformation methods [21,22]. Moreover, log-ratio transformations and kriging-based interpolations have been combined for soil PSF mapping [7,23]. The soil PSF estimation performances obtained using log-ratio transformations with different machine learning approaches were compared [24,25].
Although log-ratio transformation guarantees that the sum of predicted sand, silt, and clay contents is 100%, the statistical distribution of transformed data is different from that of the untransformed original data. Zhang et al. [24] illustrated that log-ratio transformation made soil PSF data more symmetric with lower skews, and the transformed data showed greater kurtosis values than the original ones. Although the application of log-ratio transformation showed satisfactory soil PSF prediction results, data transformation could lead to biased estimates of PSFs [25]. The distribution of transformed data can be affected by outliers, which may influence the soil PSF mapping performance [23]. Therefore, to avoid the possible bias caused by data transformations, we pay attention to predicting soil PSFs based on the original untransformed data.
This study aims to predict and map the soil PSFs in the Loess Plateau, China, at a 30 m resolution using a DSM approach. To ensure that the sum of sand, silt, and clay content at each location is 100%, multivariate random forest (MRF) was employed to simultaneously predict the soil PSFs with the original compositional data for the first time. Specifically, MRF regards that the components of the compositional data are independent and simultaneously predicts the target variables, which can preserve the internal relations among sand, silt, and clay contents.

2. Materials and Methods
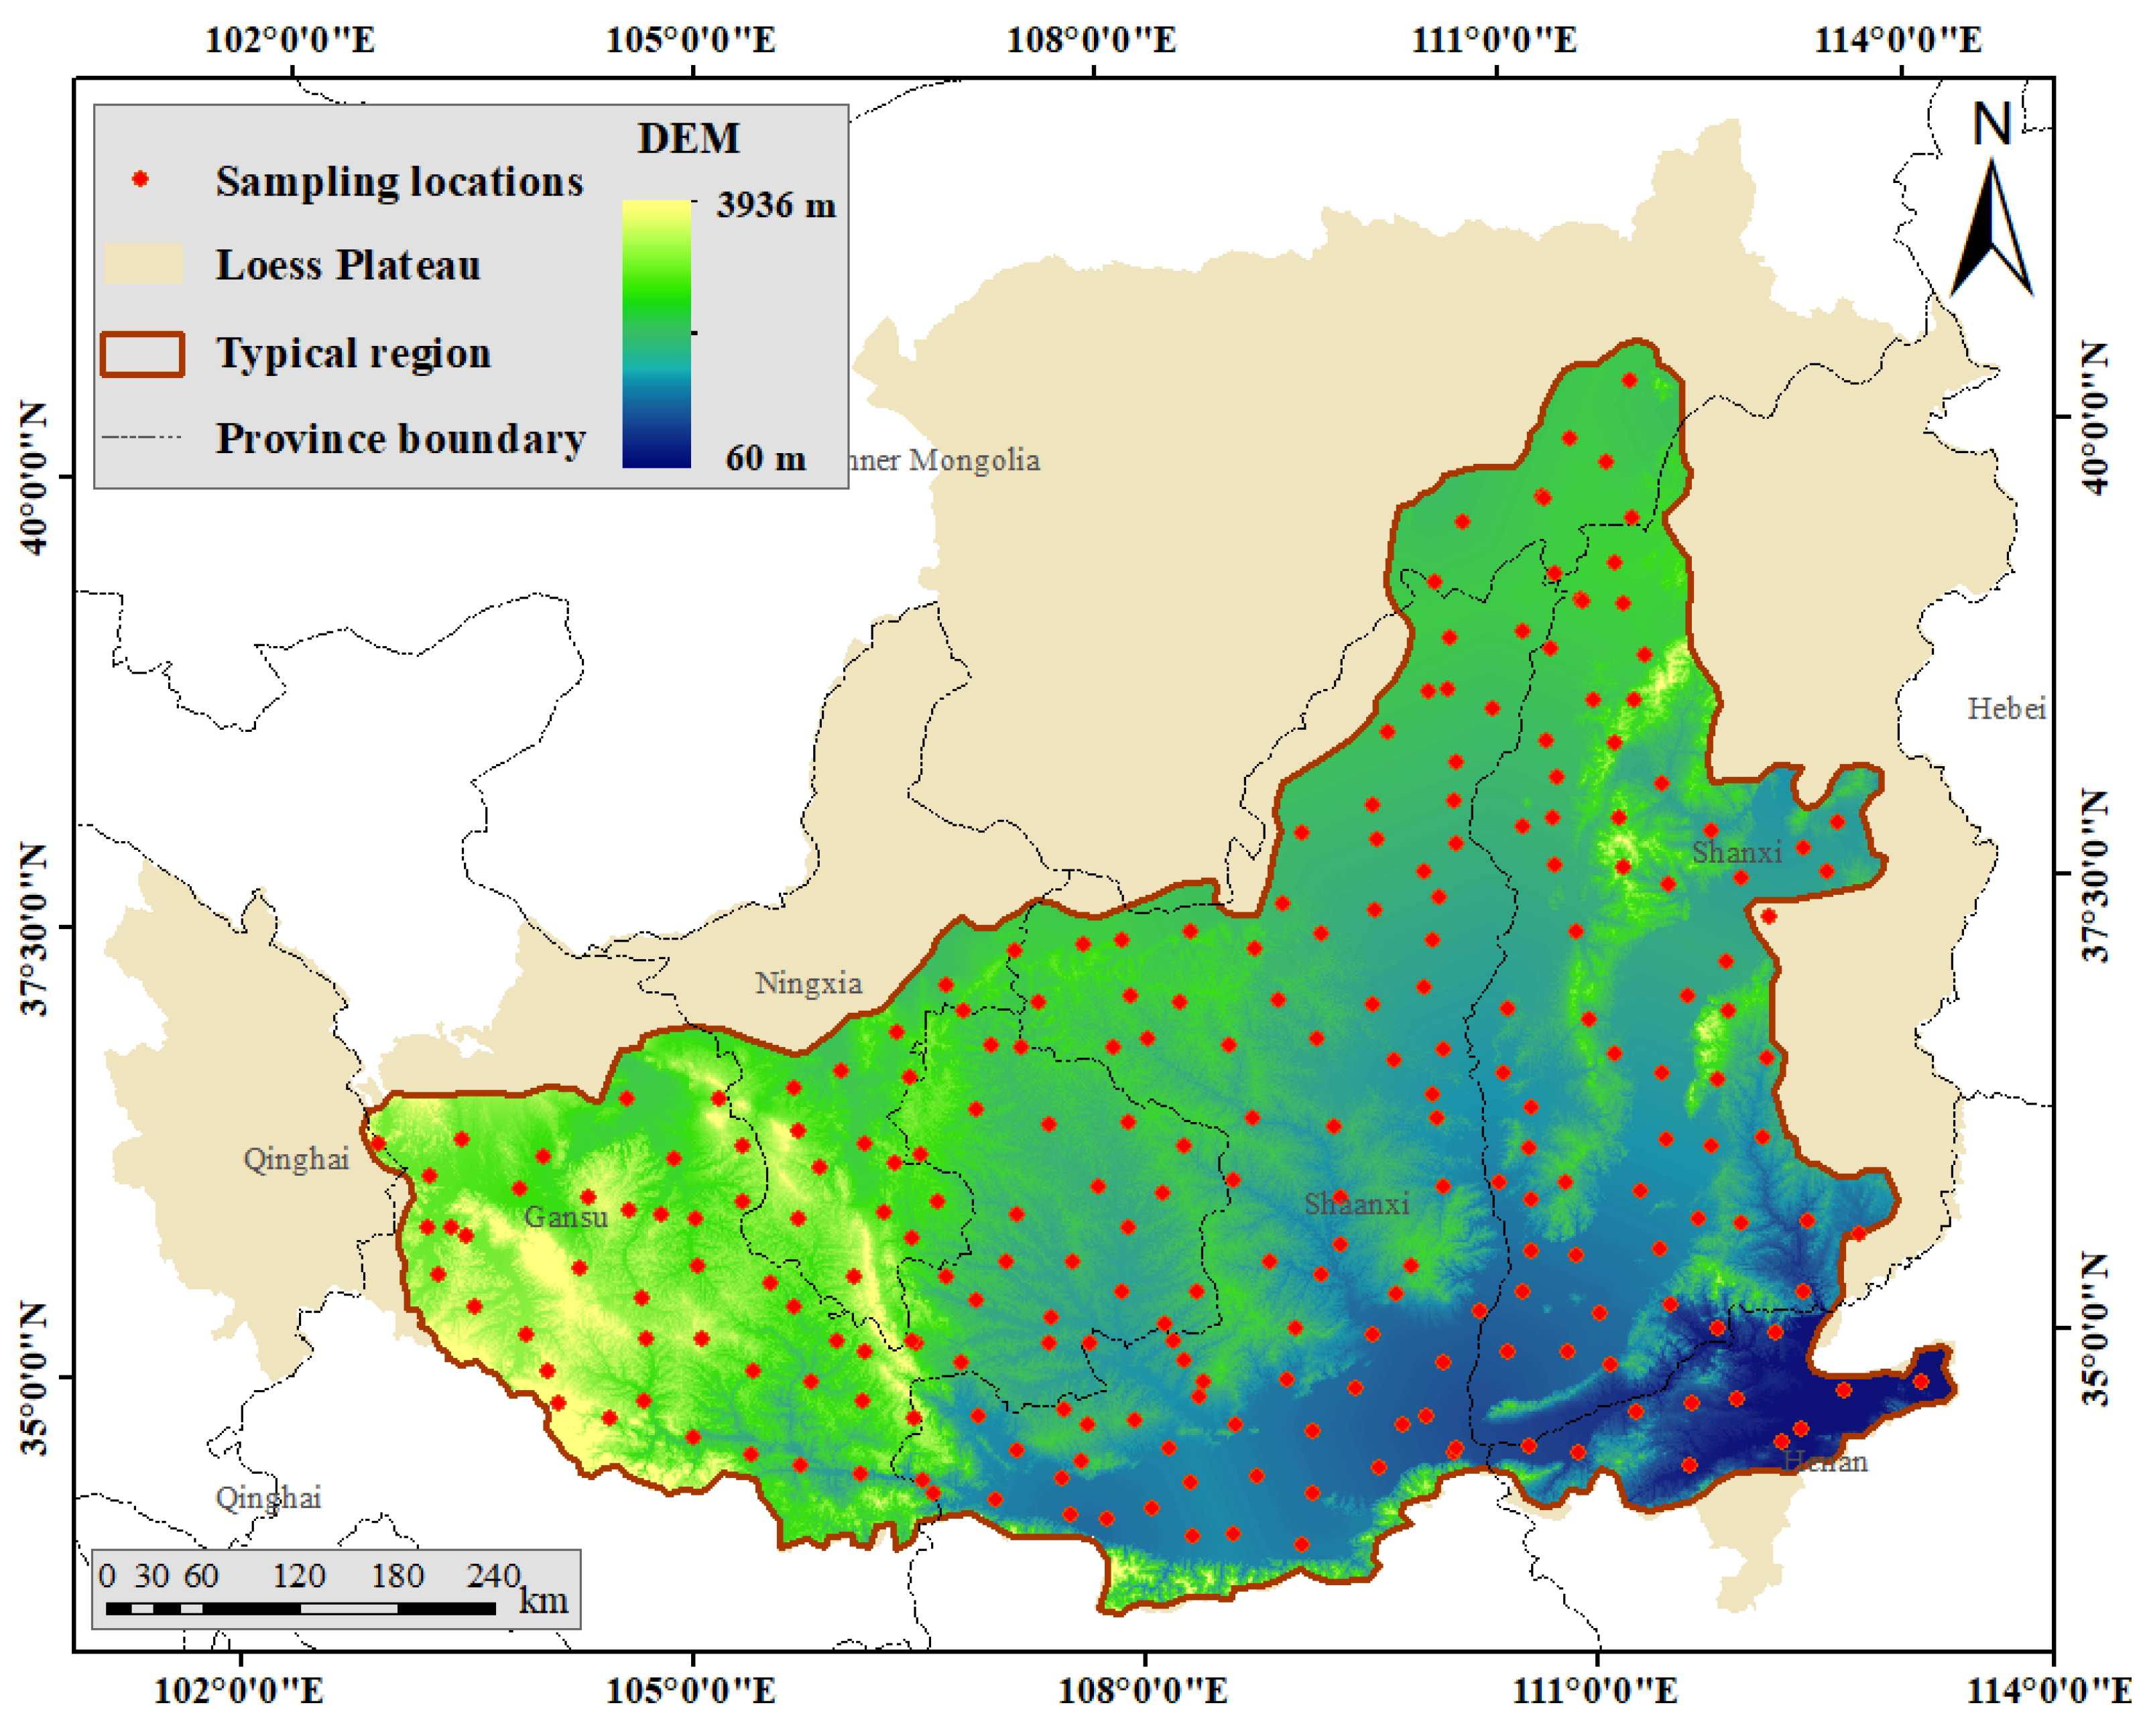
2.1. Study Area

The Loess Plateau, China, located in the middle reaches of the Yellow River, is the world’s largest loess deposit [26]. Due to the limited and unbalanced precipitation, highly erodible loess soil, sparse vegetation cover, improper land use, and intensive human disturbance, this area has experienced severe land degradation and soil erosion [27,28]. The Loess Plateau belongs to the continental monsoon region [29], and most areas of the Plateau are dominated by semi-arid and sub-humid climates [28,30]. Its altitude ranges from 200 to 3000 m, and highly erodible loess layers cover most of the Plateau area. For the Plateau, the mean annual precipitation from northwest to southeast increases from 150 to 800 mm, and the mean annual temperature varies from 3.6 to 14.3 °C [31,32]. Notably, most precipitation occurs between June and September [33], and the concentrated high-intensity precipitations cause soil loss in the areas with steep slopes [34]. From the south to the north of the Loess Plateau, the dominant soil types are Haplic Luvisols, Terric Anthrosols, Calcic Chernozems, Aridic Leptosols, Calcaric Regosols, Calcic Kastanozems, and Aridic Arenosols. The main geomorphic landforms are Yuans (large flat surfaces with little or no erosion), ridges, hills, and gullies [35].

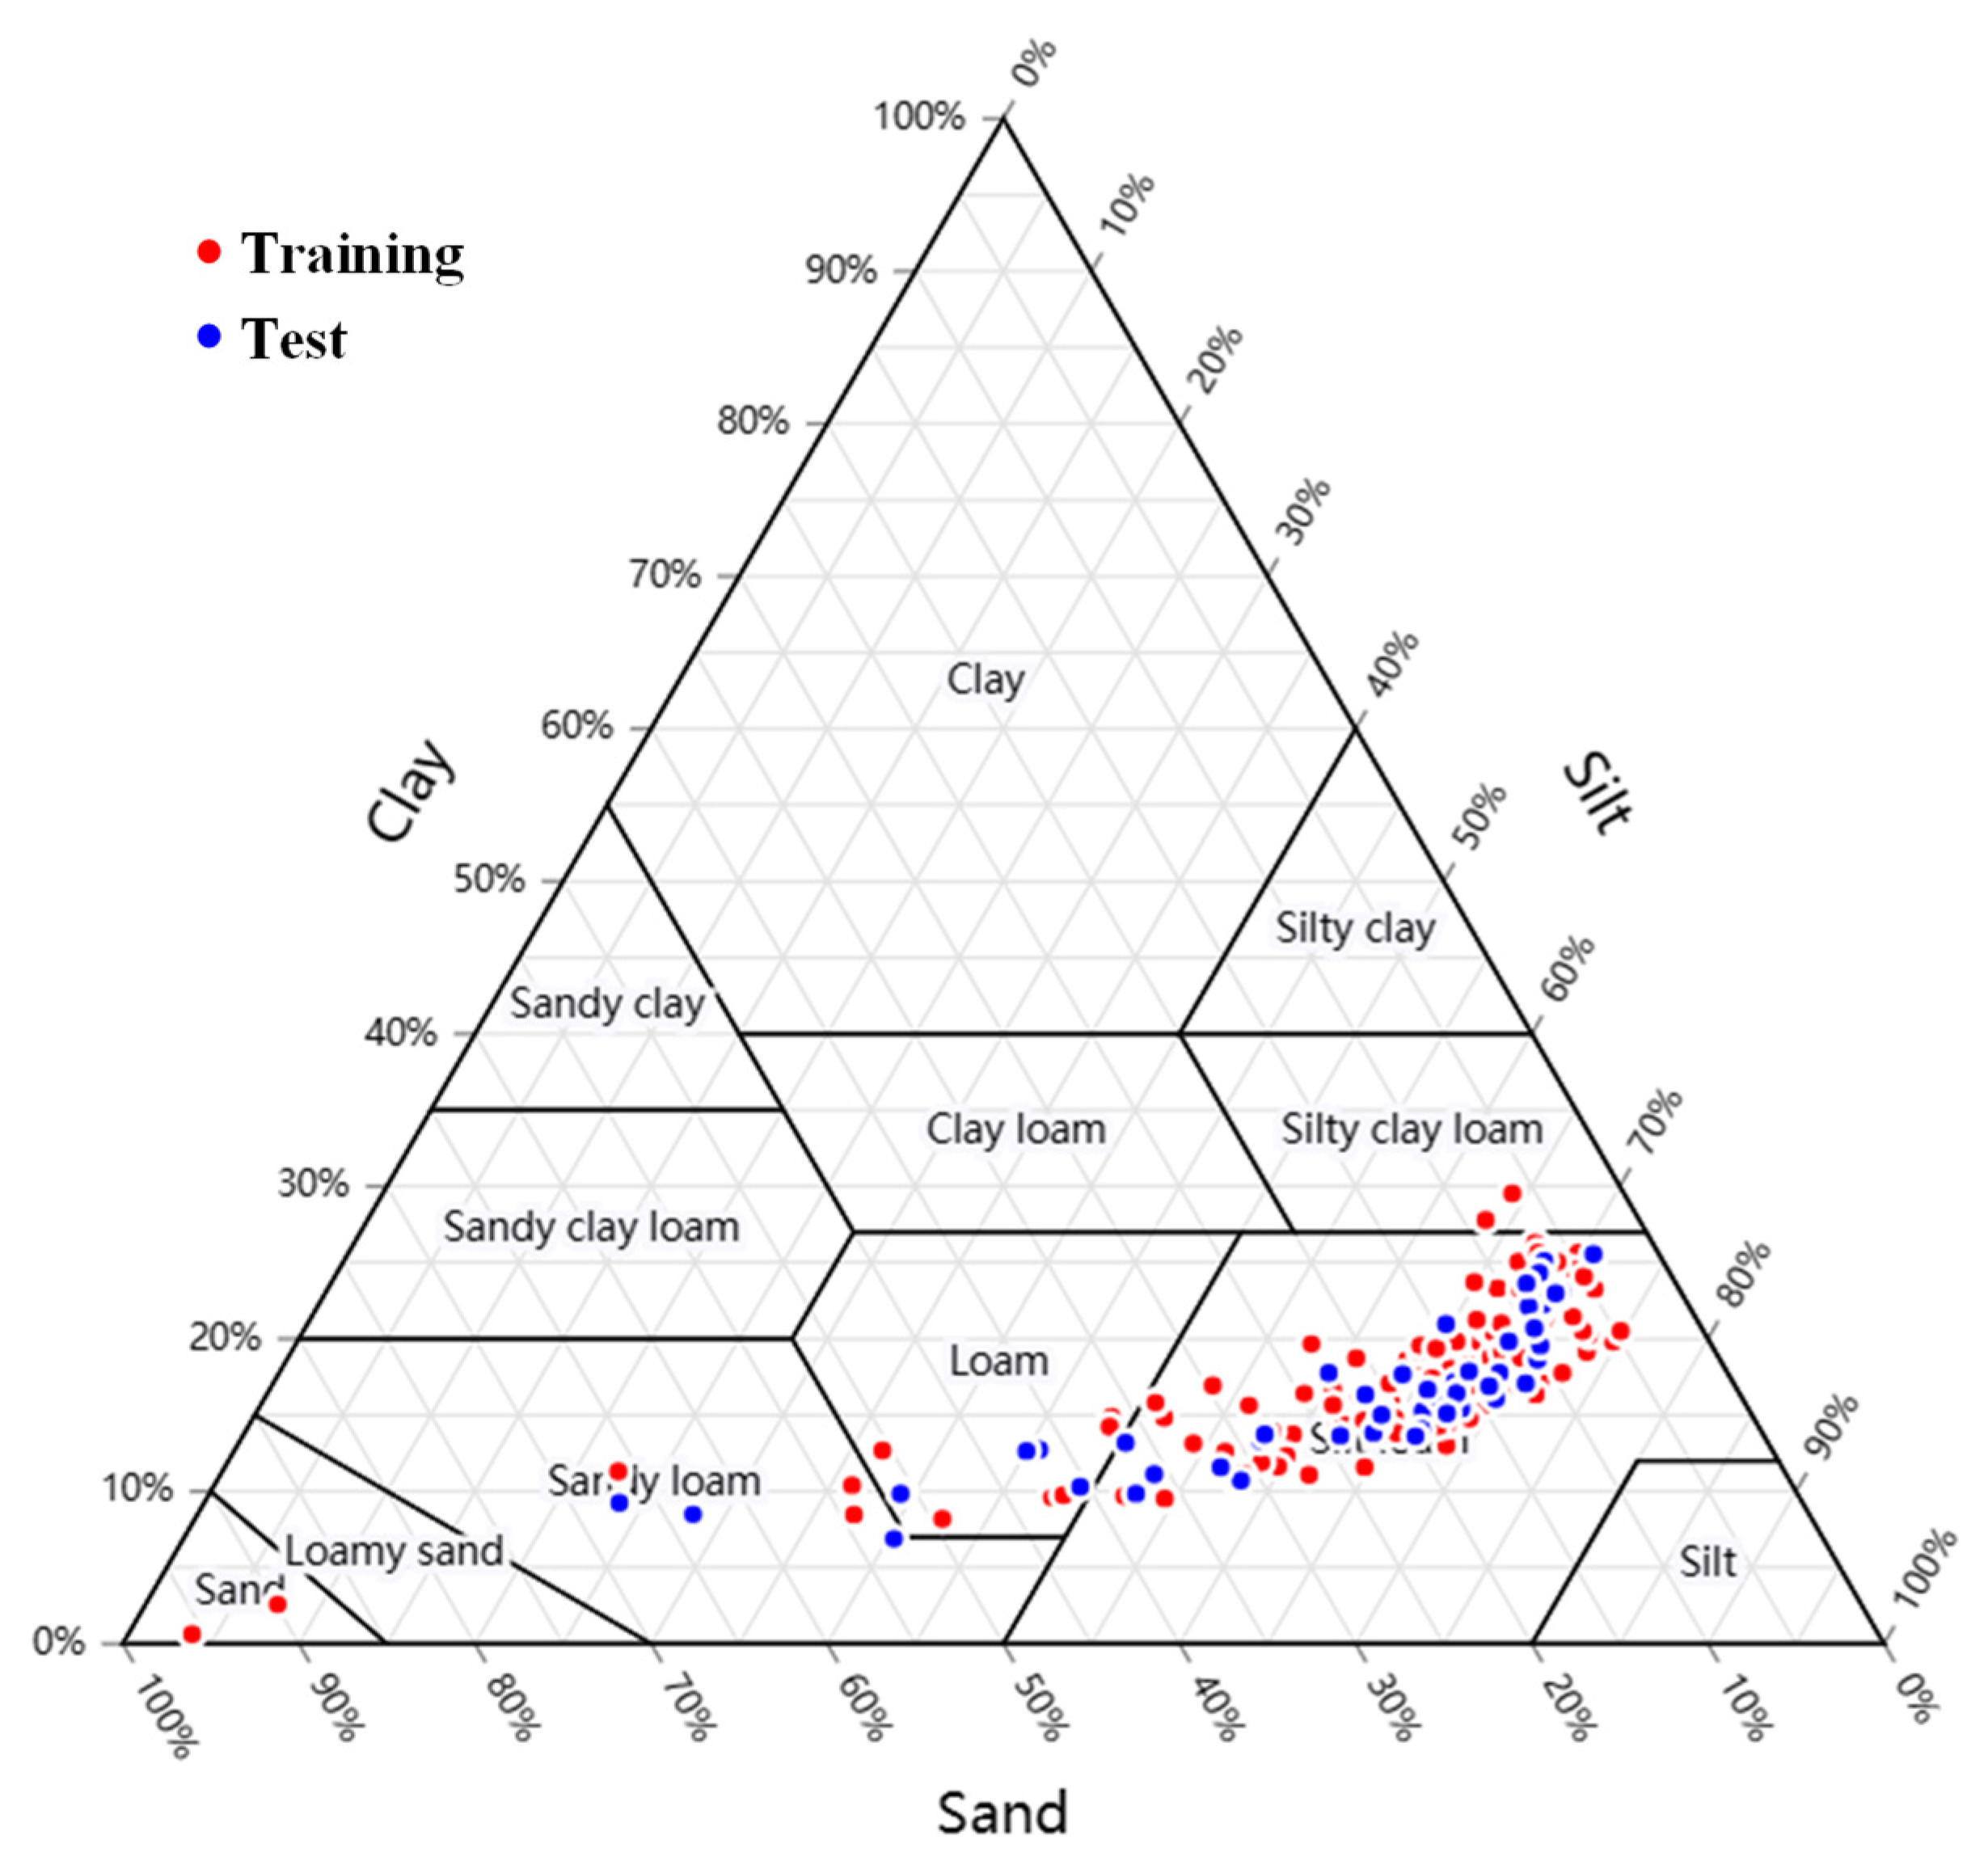
2.2. Soil Data and Analyses

A total of 243 soil samples were collected at 0–40 cm in a typical region that is about 2/3 (43 × 104 km2) of the Loess Plateau (Figure 1). To represent soil PSFs in this region, an intensive soil sampling method was used [9]. In each grid, the sampling site that can represent the dominant soil type, topography, and land cover within the field of view was selected. The distance between adjacent sites was approximately 40 km. In the areas with complicated geomorphology and landscapes, more sampling sites were added for better representation. To reduce the influence of transportation systems and human disturbance on the soil samples, the sampling sites were set at least 150 m away from the road. During the soil sampling, the position and land use of the site were recorded.
In the laboratory, the collected soil samples were air-dried and then passed through a 2 mm mesh. The soil organic matter was removed by using hydrogen peroxide, and the soil samples were dispersed using sodium hexametaphosphate. The soil PSFs were measured using the Malvern Mastersizer 2000 laser diffraction particle size analyzer (Malvern Instruments, Malvern, UK).

2.3. Environmental Variables

For the prediction of soil PSFs, three types of spatially continuous environmental variables, including remote sensing data, terrain attributes, and climate variables, were employed. To reduce the redundancy among the environmental variables, the Pearson correlation coefficient values were considered in the selection of variables. Specifically, variables with Pearson correlation coefficient values lower than 0.85 were selected. Table 1 records the 20 variables selected for the mapping of soil PSF distribution. For remote sensing data, the 30 m resolution Landsat 7 ETM+ data were employed to reveal the spectral reflectance of land surface, and a series of indexes were derived to represent the distribution of vegetation. Based on the ASTER Global Digital Elevation Model with a 30 m spatial resolution and 1° × 1° tiles, the terrain attributes were generated using SAGA GIS software. Moreover, the climate variables covering the Loess Plateau of China with 1 km resolution were provided by the National Earth System Science Data Center, National Science and Technology Infrastructure of China (http://www.geodata.cn (accessed on 15 October 2022)), and the National Tibetan Plateau Data Center (http://data.tpdc.ac.cn (accessed on 10 October 2022)) [36,37,38]. To harmonize the spatial resolution of different variables, the climatic variables were resampled to 30 m by using bilinear interpolation.

2.4. Multivariate Random Forest

To predict the multiple target variables as well as to model their compound dependencies, MRF is employed to estimate the components of soil PSFs in this study. MRF can be regarded as an extension of the widely used RF method. RF is a powerful ensemble learning method, which combines multiple regression trees to construct a stronger model [45]. Specifically, a regression tree is built by recursively partitioning samples into several groups using a top-down strategy [46]. The core of building a tree is to find the optimal partition rule, which depends on the selection of the feature and splitting points. The average of the predictions obtained from the generated trees can be used to yield the final RF output. To obtain an accurate RF model, not only the prediction error of individual trees should be low, but also the correlation among regression trees should be diminished [47]. Thus, the bagging strategy is used in RF, where each tree is built based on a bootstrap sample drawn with replacement from the training set.
MRF constructs a single model to simultaneously predict all the target variables, in which the internal relations among multiple targets are preserved [48]. In MRF, an ensemble of multivariate regression trees is generated on the basis of bootstrap resampling and predictor subsampling [49]. The multivariate regression tree is an extension of the univariate regression tree for addressing the multioutput issue. Specifically, a multivariate regression tree exhibits several similar characteristics to a univariate regression tree [50,51]. Both of them are easy to be built, and the generated results are simple to interpret. The interactions between variables can be automatically detected by these trees. Meanwhile, the trees are robust to the noise response and can handle missing values in feature variables with minimal loss of information. Furthermore, compared to the separate prediction approach that builds individual models for each target variable, MRF has two main advantages [48]. Firstly, a single MRF is usually much smaller than the total size of the individual predictors for all variables. Secondly, the separate prediction approach ignores the correlation of compositional data, while MRF is able to exploit the compound dependencies among multiple target variables.
The construction of multivariate regression tree starts with all samples in the root node, and then the split and partitioning of nodes are recursively performed until meeting the predefined stopping criterion. Based on the multivariate response, the node impurity measure is defined as the sum of squared error, which should be minimized in each split. In a multivariate regression tree, each leaf is depicted by the multivariate mean of the samples at the leaf [48]. For each tree in MRF, the samples will be assigned to a certain terminal leaf. By combining the decisions of different multivariate regression trees, the final regression result can be obtained. As the internal relations of multivariate response are considered in the building of trees, MRF can retain the data correlation in the prediction process [52]. For soil PSFs, the sum of sand, silt, and clay content is 100% for each input sample. Therefore, the output estimates of the three components can be calculated using the multivariate mean of the input samples at the same leaf, which satisfies the constraint of summing to 100%. In addition, the importance of feature variables can be obtained and ranked to identify those most influencing MRF prediction [49].

2.5. Evaluation Criteria

The collected 243 samples were split into a training and a test set randomly. Specifically, 182 samples (75%) were utilized to construct the model, and 61 samples (25%) were utilized for evaluation. For each model, the grid search and 5-fold cross validation were used to adjust the number of trees in the forest (n_trees) and the maximum depth of each tree (max_depth). Statistics including the coefficient of determination (R2), root mean square error (RMSE), mean absolute error (MAE), and Lin’s concordance correlation coefficient (CCC) were used to evaluate the models’ performance.
R 2 = 1 i = 1 n o i p i 2 i = 1 n o i o ¯ 2
RMSE = 1 n i = 1 n o i p i 2
MAE = 1 n i = 1 n o i p i
CCC = 2 r σ o σ p σ o 2 + σ p 2 + ( o ¯ p ¯ )
where o i and p i are the observed and predicted values of sample i , o ¯ and p ¯ are the means of the observed and predicted values, σ o and σ p are their standard deviations (SDs), n denotes the number of test samples, and r represents the correlation coefficient between o i and p i .

3. Results and Discussion

3.1. Descriptive Statistics of Soil PSFs

As shown in Figure 2, most of the collected samples are classified as silt loam soil in texture according to the USDA soil taxonomy. Table 2 demonstrates that the training and test soil samples showed similar PSFs statistics. The mean and median contents of silt were higher than those of sand and clay. Compared to silt and clay, sand showed higher variability with coefficients of variation (CV) of 0.73 and 0.65 for the training and test samples, respectively.

3.2. Performances of Different Approaches

To test the effectiveness of MRF in soil PSF prediction, three widely used log-ratio transformation approaches, namely, ALR, CLR, and ILR, were considered, where RF was used as the base predictor. Table 3 summarizes the R2, RMSE, MAE, and CCC of different approaches for predicting soil PSFs. Compared to the transformation approaches, MRF exhibited higher R2 and CCC with lower RMSE and MAE. For the transformation approaches, CLR outperformed ALR and ILR in terms of the evaluation metrics. Wang and Shi [53] pointed out that the changes in the composition arrangements may influence the data transformation as well as the estimation result. In ALR, the arbitrary selection of the divisor may cause the changes in the distances among samples in the transformed space [54]. To overcome the problem in compositional data analysis, CLR takes the geometric mean into account. Meanwhile, the comparative approaches gave different results for sand, silt, and clay. Specifically, the R2 and CCC of clay were higher than those of sand and silt. The RMSEs of clay obtained using different approaches were lower than 2.8%, and the corresponding MAEs were lower than 2.3%. The obtained optimal RMSEs for sand and silt were 8.53% and 7.04%, and the corresponding MAEs were 5.64% and 4.66%, respectively.

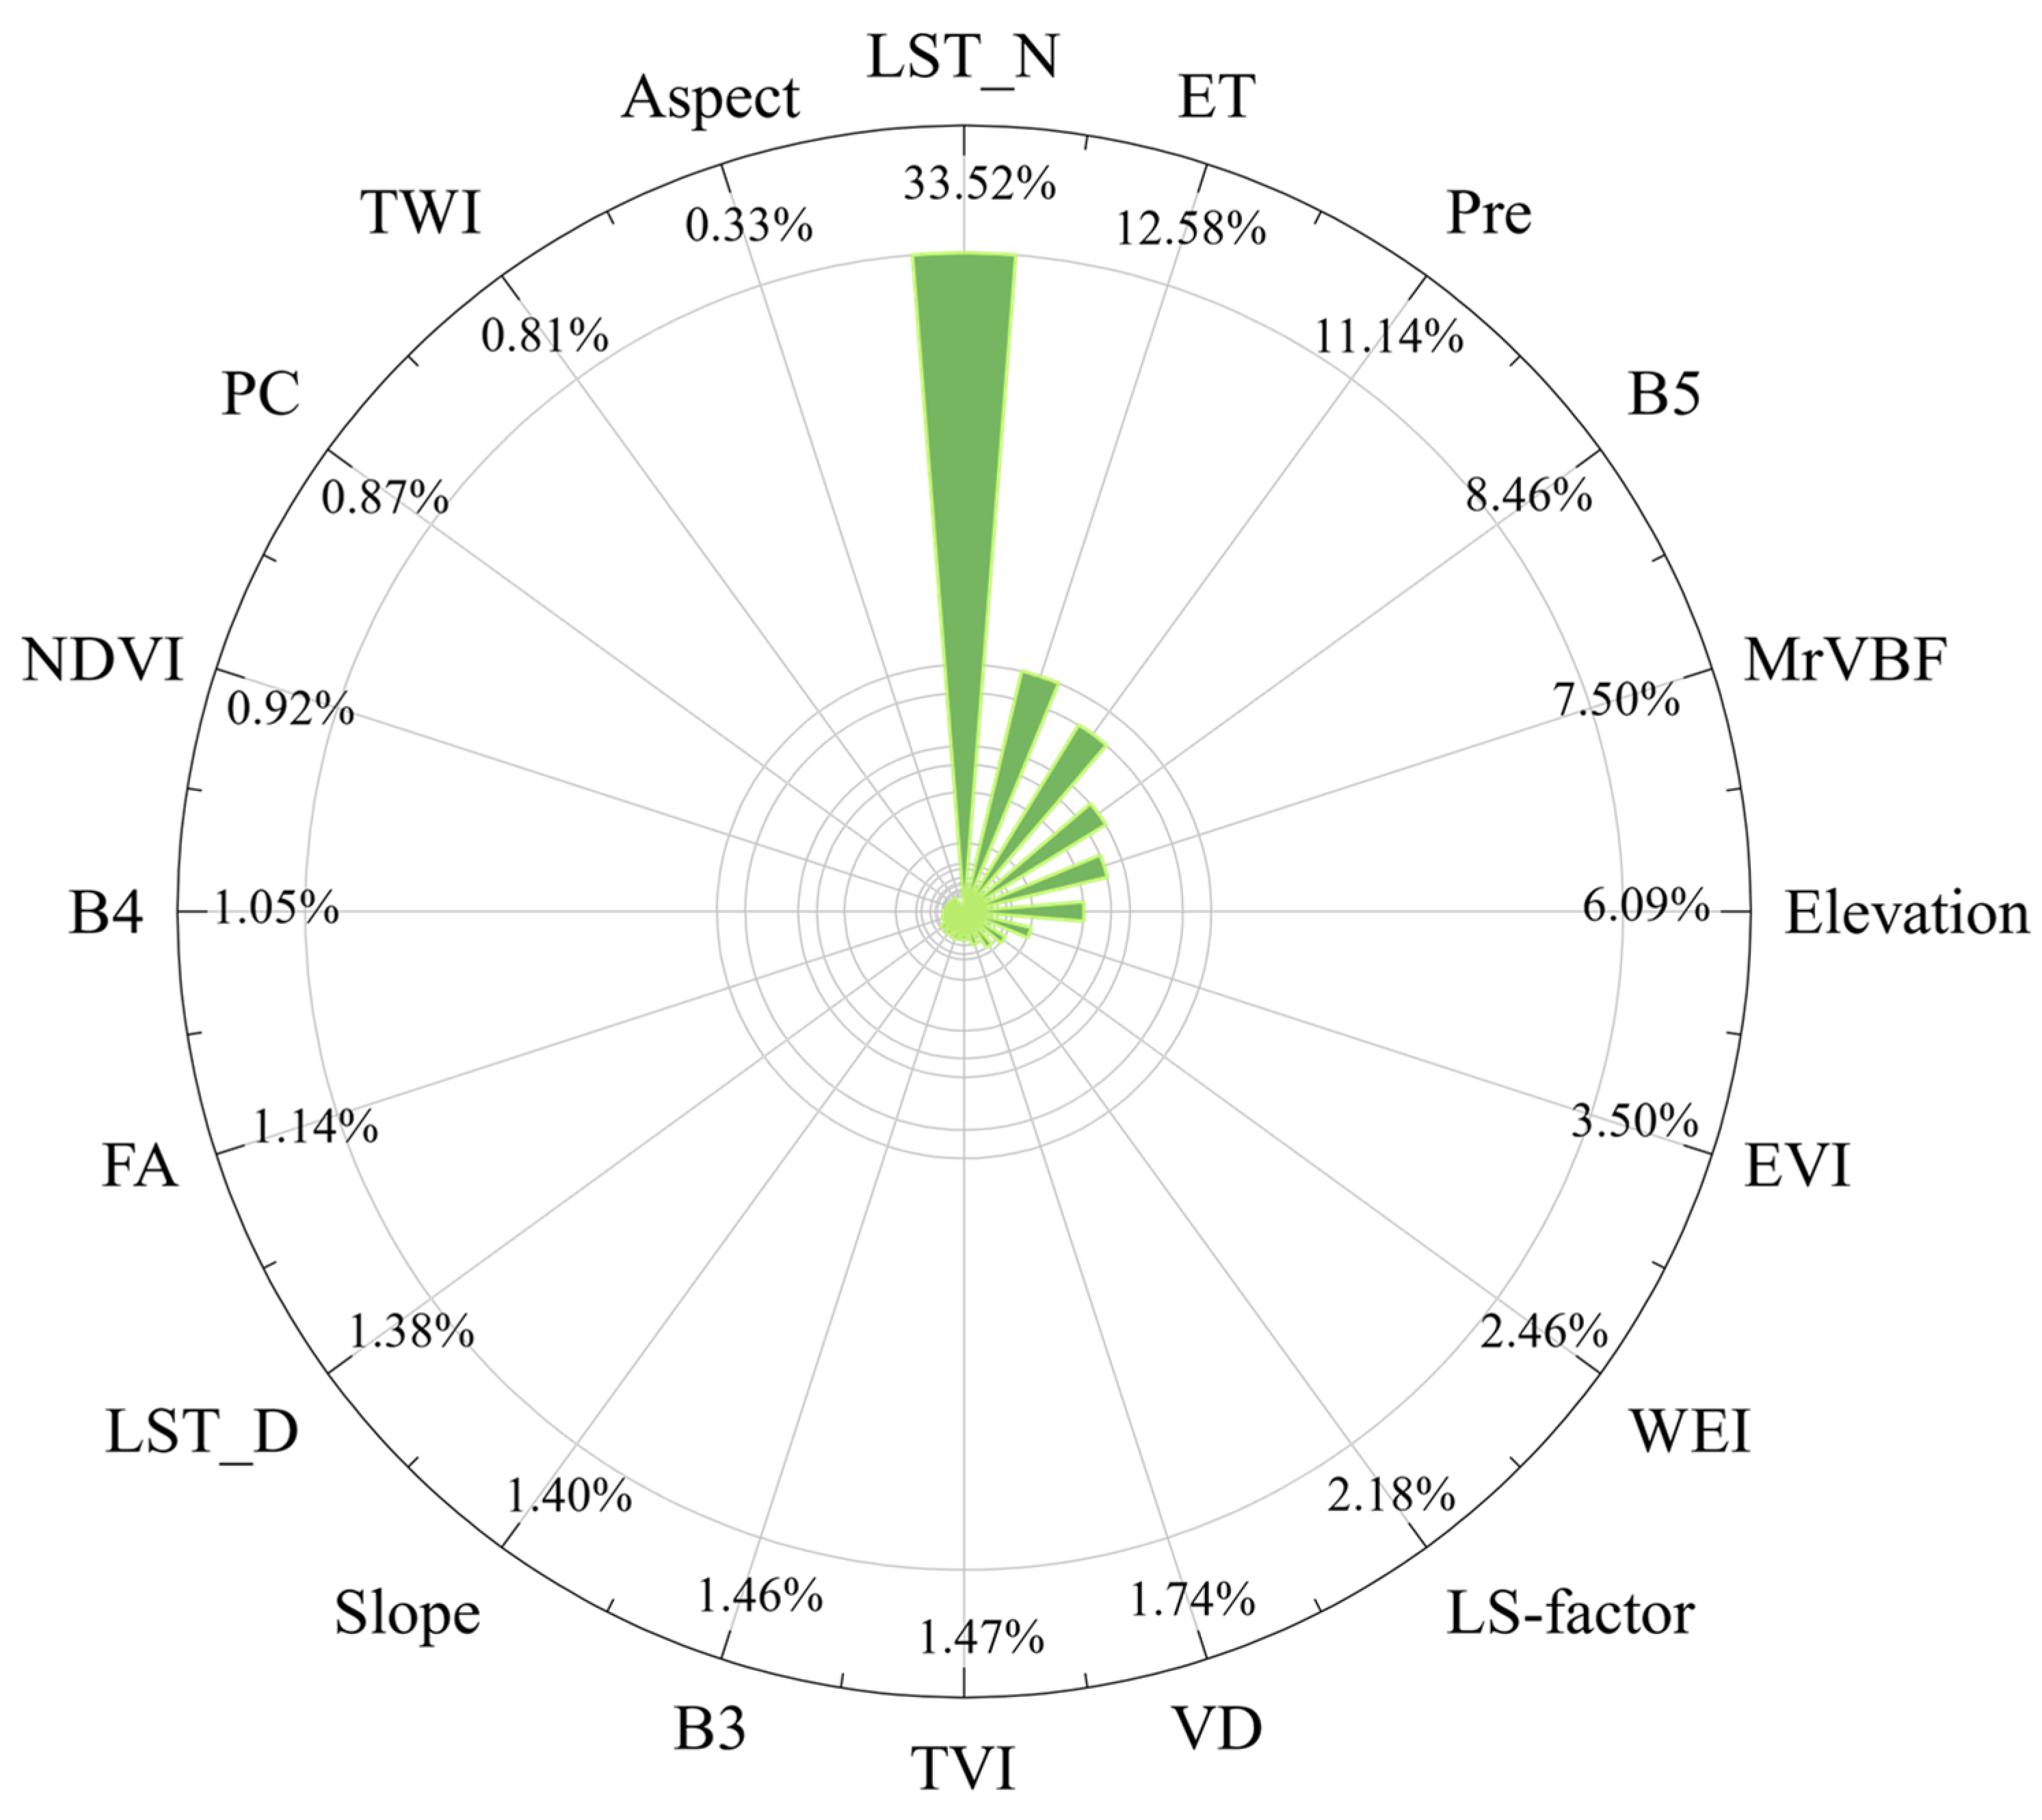
3.3. Importance of Environmental Variables

Soil PSFs are typical compositional data in soil science, where the three components are dependent on each other. The approaches based on transformed data used multiple predictive models to estimate soil PSFs separately. In each model, the environmental variables showed a different contribution, making it difficult to accurately identify the importance of variables in predicting the compositional PSF data. Conversely, MRF uses a single model to simultaneously predict the soil PSFs, and the relative importance of different variables is showed in Figure 3.
Among the 20 environmental variables, LST_N showed the highest importance with 33.52%, followed by ET and Pre with 12.58% and 11.14%. It is evident that the climatic variables exhibit higher contribution than the other selected variables to the soil PSF prediction. The thermal infrared emissivity of bare soils is influenced by soil texture, which determines the LST [55]. Also, soil texture controls the available water content and affects the thermal inertia signature related to surface temperature patterns [56]. Osińska-Skotak [57] pointed out that soil texture and water content influence the land surface temperature (LST). Also, soil PSFs and LST are highly correlated [58]. Sayão et al. [59] found that clayey soils showed higher LST, while sandy soils showed lower LST. Meanwhile, soil PSFs and texture determine water transfer and retention capacity, which have a significant effect on ET [60]. The consideration of soil texture will support the estimation of ET, since the relation between actual and potential ET is related to the soil texture and soil water content [61]. In particular, the finest texture showed greater surface per unit volume, which allows the greater adsorption of soil particles to water films [62]. If the water is heavily retained in soils, the absorption by plant roots will be limited, resulting in the decrease of plant transpiration rate. Additionally, loam soils with a large number of micro- and macro-pores show high water availability for plants, while coarse soils show a low available water capacity. For soil PSF prediction in loess deposition areas, the high importance of Pre can be attributed to the intensive water erosion with the transportation and sorting of soil particles in relation to rainfall [18]. Moreover, Liu et al. [63] emphasized the importance of precipitation and temperature in soil texture determination.
The contributions of B5 and MrVBF were ranked fourth and fifth among the twenty variables. In arid regions of Iran, B5 and MrVBF were also regarded as important variables for the estimation of soil PSFs [64]. B5 recorded the reflectance in the shortwave infrared band. Shortwave infrared reflectance is sensitive to soil available water capacity as well as soil texture [65]. Meanwhile, soil texture influences the shortwave infrared reflectance, as the fine and coarse soil particles exhibit different scattering properties. Stenberg et al. [66] argued that soil textures always show a stronger correlation to infrared bands than to visible bands. Topography affects water flow and material transport, and thus soil properties are related to terrain attributes [67]. MrVBF is an index designed to recognize valley bottoms and represent areas of deposited material. It depicts potential zones of transport for sediment and other materials, and is effective in explaining the soil texture distribution [68]. Due to the erosion and transportation processes, the soils in the hill slopes show a coarse texture. Meanwhile, owing to the deposition process, the soils in the valleys and plains show a fine texture [69].

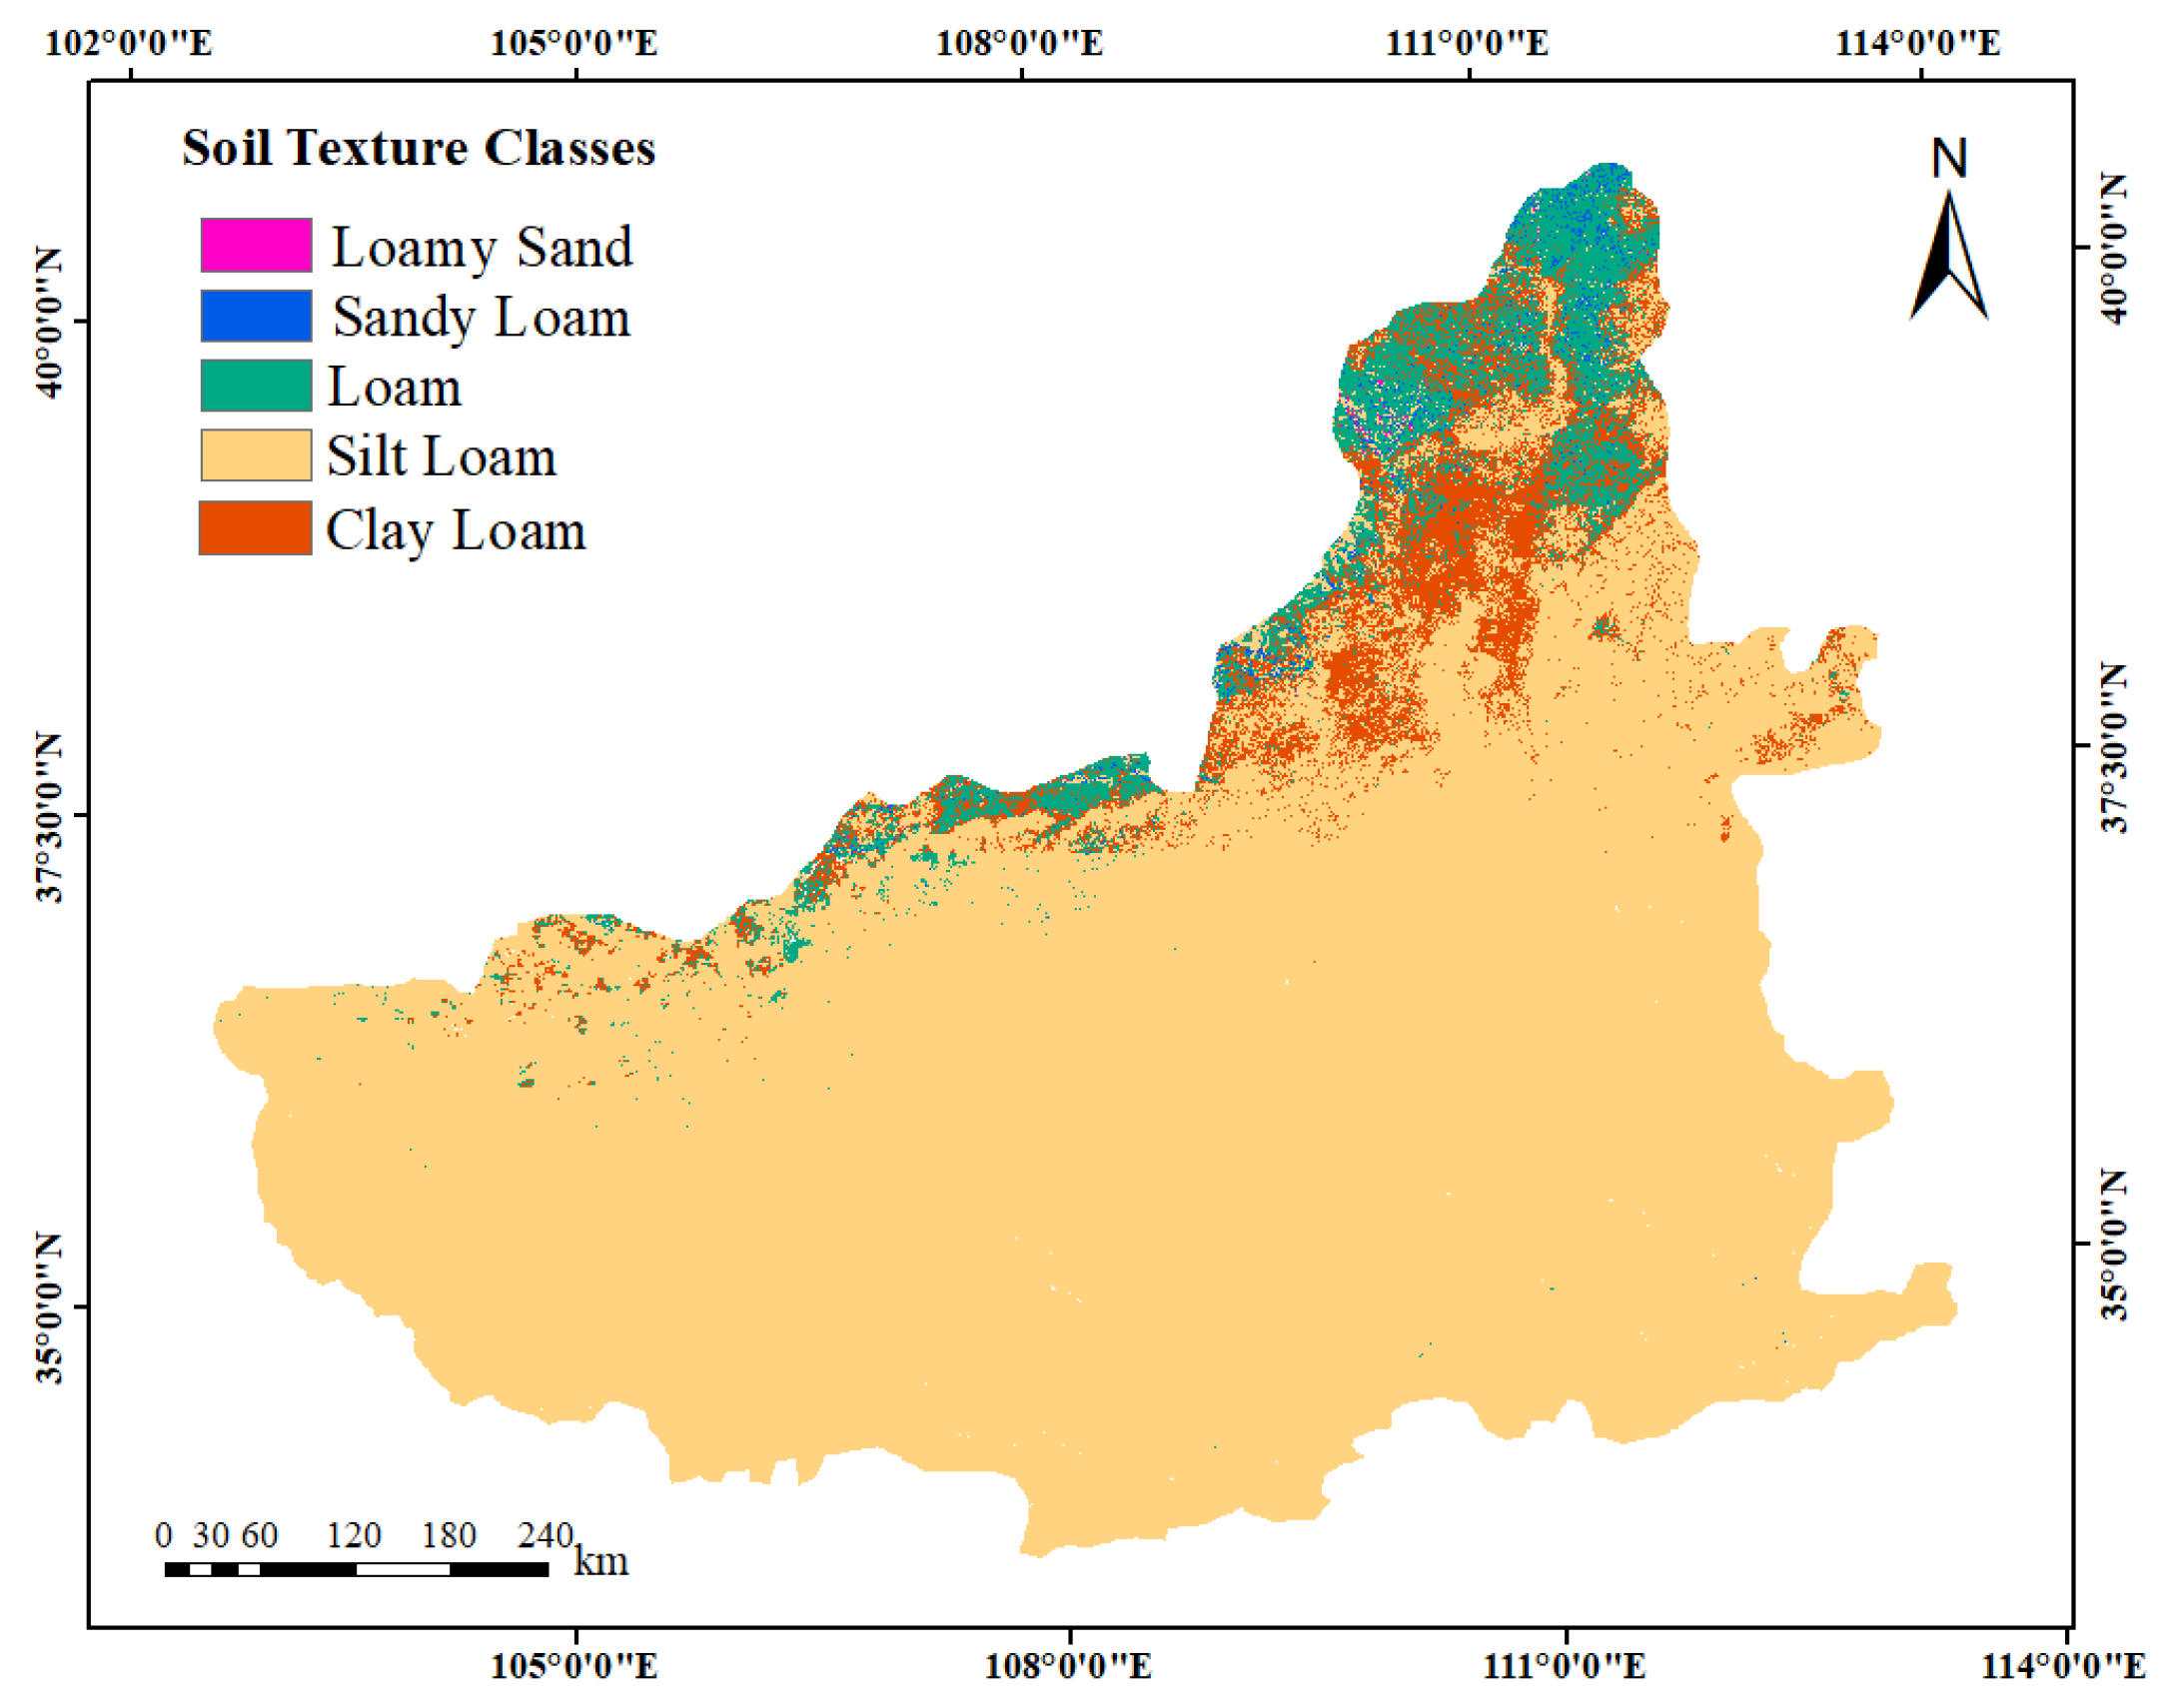
3.4. Distribution of Soil PSFs

The soil PSF maps generated using MRF are shown in Figure 4. It can be observed that the silt content is much higher than the sand and clay contents in most areas of the Loess Plateau, China. According to the USDA soil taxonomy, the soil texture types of each point can be classified based on the estimated sand, silt, and clay contents. In Figure 5, the predicted soil texture map of the Loess Plateau, China, is presented, showing that silt loam is the main soil texture class.
The soils are sandy in the northwest and clayey in the southeast of the Loess Plateau. The Gobi Desert and the sand deserts located in the northwest of the Loess Plateau provide the loess source [70]. Loess with different sizes was carried to the plateau by the prevailing wind, monsoon wind, and dust storm. When the energy of the wind decreased, the largest and heaviest particles were first deposited. The northwesterly wind transported loess to the Plateau, and the coarser materials were deposited in the northwestern region [71]. The finer loess materials were brought and deposited in the southeast of the Loess Plateau. In the southeast of the Plateau, the climate is warm and wet. The strong weathering process driven by heat and water affected soil formation by increasing the clay content. In certain regions, the platy structures, that are the result of the combined effect of sedimentation, geomorphology, and topography, disrupted the continuing distribution of soil PSFs [9].

3.5. Soil Erosion Management

The high-resolution maps of soil PSFs can be a prerequisite to support soil erosion management decisions for the Loess Plateau, China, as the soil erosion rate is influenced by soil texture and PSFs [72]. As one of the most severely eroded regions, the Loess Plateau contributes approximately 90% of sediment sources in the Yellow River [73]. The severe soil erosion threatens land conditions for human survival, which reduces land productivity and exacerbates rural poverty [74,75].
To limit soil erosion and land degradation, a series of soil erosion control practices, such as soil management techniques, engineering techniques, and ecological restoration programs, have been conducted since 1950 [76]. Soil management techniques, including conservation tillage and mulching, aim to maintain soil structure and fertility. Conservation tillage justifies the soil texture and available water capacity, thereby reducing soil erosion [77]. Mulching protects the soil against raindrop impact and increases roughness, which further reduces the overland flow generation rates and velocity [78]. Engineering techniques prevent soil erosion by constructing terraces, which avert rainfall runoff on slopes, and check dams, which retain the sediments transported into the rivers [79,80]. As essential soil erosion control practices, ecological restoration programs have received the attention of decision-makers [1]. In particular, the Grain for Green Program and Natural Forest Conservation Program are the most famous national ecological restoration programs [76]. Increasing vegetation cover has been proven a useful practice to prevent soil erosion. The transport capacity of runoff water depends on the land cover types. Also, the energy of raindrops striking the land surface is reduced by vegetation, since trees, shrubs, and grasses with a dense vegetation canopy decrease the velocity of raindrops [81]. Meanwhile, the overland water flow is slowed down by dense vegetation, and the root systems of vegetation decrease runoff [82]. Notably, the programs promote the local economic development and reshape rural socio-economic structures.
For regional sustainable development, the trade-offs between ecosystem benefits and soil erosion management should be taken into consideration. Although the practices reduce soil loss, the water yield is concurrently reduced [73]. Excessive afforestation consumes deeper soil water resources, resulting in soil desiccation and the formation of a dry soil layer. The decrease in soil water storage capacity limits the growth of trees and threatens the ecosystem’s health [83,84]. Hence, it might not be a good choice to plant short-lived and fast-growing vegetation in arid and semi-arid regions. A trait-based community that combines optimal species to maximize multiple ecosystem services should be considered for ecological restoration [85]. Moreover, the costly and labor-intensive maintenance is a major challenge for soil erosion management. Soil erosion management is a long-term plan, which requires sustainable management. To integrate the requirements of governments and farmers, soil management should be resilient and adaptive, and ecological, social, and economic benefits should be taken into account [76].

3.6. Limitations

This study mapped the soil PSFs and texture of a typical region in the Loess Plateau, China, but there is still room for further research. The 243 soil samples were mainly collected from the south of the Plateau, and few samples were collected from the northern region. Hence, more samples could be collected across the Loess Plateau to improve the DSM performance. For the conservation and responsible management of soils, the soil chemical properties could be predicted and mapped with a high spatial resolution in a future study [86]. In this study, Landsat data, terrain attributes, and climatic variables were employed as environmental variables to map soil PSFs, but in future, more variables associated with the formation, accumulation, and transportation processes of soil could be taken into account.

4. Conclusions

The soil PSFs in the Loess Plateau, China were simultaneously predicted and mapped at a 30 m resolution using environmental variables and MRF. Specifically, Landsat data, terrain attributes, and climatic variables were utilized for the high-resolution DSM. MRF used a single model to predict the three components of soil PSFs simultaneously, capturing the internal relations among the sand, silt, and clay contents. The results illustrated that MRF gave a satisfactory soil PSFs prediction performance in terms of high R2 and CCC as well as low RMSE and MAE values. Among the environmental variables, climatic variables showed higher importance in the prediction of soil PSFs, where LST_N was the most important variable to the MRF model. Moreover, 30 m resolution maps of soil PSFs across the typical region in the Loess Plateau were generated, which can provide insightful information for soil erosion management, ecosystem conservation, and agricultural development. Future work will focus on the spatial prediction of the chemical properties of soil across the Loess Plateau, where more machine learning approaches and environmental variables could be taken into consideration.

Author Contributions

Conceptualization, Q.L.; methodology, W.H. and Z.X.; software, Z.X.; validation, W.H., Z.X. and Q.L.; formal analysis, W.H. and Q.L.; investigation, Z.X. and Q.L; resources, W.H. and Z.X.; data curation, Z.X. and X.L.; writing—original draft preparation, W.H.; writing—review and editing, Q.L.; visualization, Z.X. and X.L.; supervision, Q.L.; project administration, L.W.; funding acquisition, Q.L. and L.W. All authors have read and agreed to the published version of the manuscript.

Funding

This work was supported by the Open Fund of Key Laboratory of Natural Resources Monitoring and Supervision in Southern Hilly Region, Ministry of Natural Resources (NRMSSHR2023Y04), the Open Research Fund Program of the Key Laboratory of Digital Mapping and Land Information Application, Ministry of Natural Resources (ZRZYBWD202208), the Scientific Research Project of Hubei Provincial Education Department (Q20201003), the Natural Science Foundation of Hubei Province (2021CFB116), the Hubei Key Research and Development Program (2021BID002), the National Natural Science Foundation of China (42271392), the Opening Foundation of Hubei Key Laboratory of Regional Development and Environmental Response (2020(B)001), and the Teaching Research Project of Hubei University (2022057).

Data Availability Statement

The data presented in this study are available on request from the corresponding author. The data are not publicly available due to privacy.

Acknowledgments

The authors are thankful for the data support from the National Tibetan Plateau Data Center (https://data.tpdc.ac.cn/ (accessed on 10 October 2022)), the National Ecosystem Science Data Center (http://www.nesdc.org.cn/ (accessed on 20 June 2022)), and the National Earth System Science Data Center, National Science and Technology Infrastructure of China (http://www.geodata.cn (accessed on 15 October 2022)).

Conflicts of Interest

The authors declare no conflicts of interest.

References

  1. Fu, B.; Wang, S.; Liu, Y.; Liu, J.; Liang, W.; Miao, C. Hydrogeomorphic Ecosystem Responses to Natural and Anthropogenic Changes in the Loess Plateau of China. Annu. Rev. Earth Planet. Sci. 2017, 45, 223–243. [Google Scholar] [CrossRef]
  2. Cheshmberah, F.; Zolfaghari, A.A.; Taghizadeh-Mehrjardi, R.; Scholten, T. Evaluation of Mathematical Models for Predicting Particle Size Distribution Using Digital Soil Mapping in Semiarid Agricultural Lands. Geocarto Int. 2022, 37, 13016–13038. [Google Scholar] [CrossRef]
  3. Arrouays, D.; Marchant, B.P.; Saby, N.P.A.; Meersmans, J.; Orton, T.G.; Martin, M.P.; Bellamy, P.H.; Lark, R.M.; Kibblewhite, M. Generic Issues on Broad-Scale Soil Monitoring Schemes: A Review. Pedosphere 2012, 22, 456–469. [Google Scholar] [CrossRef]
  4. Zhu, A.X.; Liu, J.; Du, F.; Zhang, S.J.; Qin, C.Z.; Burt, J.; Behrens, T.; Scholten, T. Predictive Soil Mapping with Limited Sample Dat. Eur. J. Soil Sci. 2015, 66, 535–547. [Google Scholar] [CrossRef]
  5. Lu, Q.; Tian, S.; Wei, L. Digital Mapping of Soil pH and Carbonates at the European Scale Using Environmental Variables and Machine Learning. Sci. Total Environ. 2023, 856, 159171. [Google Scholar] [CrossRef] [PubMed]
  6. Sun, W.; Shao, Q.; Liu, J.; Zhai, J. Assessing the Effects of Land Use and Topography on Soil Erosion on the Loess Plateau in China. CATENA 2014, 121, 151–163. [Google Scholar] [CrossRef]
  7. Odeh, I.O.A.; Todd, A.J.; Triantafilis, J. Spatial Prediction of Soil Particle-Size Fractions as Compositional Data. Soil Sci. 2003, 168, 501–515. [Google Scholar] [CrossRef]
  8. Zhang, S.; Shen, C.; Chen, X.; Ye, H.; Huang, Y.; Lai, S. Spatial Interpolation of Soil Texture Using Compositional Kriging and Regression Kriging with Consideration of the Characteristics of Compositional Data and Environment Variables. J. Integr. Agric. 2013, 12, 1673–1683. [Google Scholar] [CrossRef]
  9. Zhao, C.; Jia, X.; Zhang, C. Particle Size Distribution of Soils (0–500 cm) in the Loess Plateau, China. Geoderma Reg. 2016, 7, 251–258. [Google Scholar] [CrossRef]
  10. Li, J.; Wan, H.; Shang, S. Comparison of Interpolation Methods for Mapping Layered Soil Particle-Size Fractions and Texture in an Arid Oasis. CATENA 2020, 190, 104514. [Google Scholar] [CrossRef]
  11. Wan, H.; Li, J.; Shang, S.; Rahman, K.U. Exploratory Factor Analysis-Based Co-Kriging Method for Spatial Interpolation of Multi-Layered Soil Particle-Size Fractions and Texture. J. Soils Sediments 2021, 21, 3868–3887. [Google Scholar] [CrossRef]
  12. Sanchez, P.A.; Ahamed, S.; Carré, F.; Hartemink, A.E.; Hempel, J.; Huising, J.; Lagacherie, P.; McBratney, A.B.; McKenzie, N.J.; Mendonça-Santos, M.d.L.; et al. Digital Soil Map of the World. Science 2009, 325, 680–681. [Google Scholar] [CrossRef] [PubMed]
  13. Nussbaum, M.; Spiess, K.; Baltensweiler, A.; Grob, U.; Keller, A.; Greiner, L.; Schaepman, M.E.; Papritz, A. Evaluation of Digital Soil Mapping Approaches with Large Sets of Environmental Covariates. Soil 2018, 4, 1–22. [Google Scholar] [CrossRef]
  14. Wadoux, A.M.J.-C.; Minasny, B.; McBratney, A.B. Machine Learning for Digital Soil Mapping: Applications, Challenges and Suggested Solutions. Earth-Sci. Rev. 2020, 210, 103359. [Google Scholar] [CrossRef]
  15. Akpa, S.I.C.; Odeh, I.O.A.; Bishop, T.F.A.; Hartemink, A.E. Digital Mapping of Soil Particle-Size Fractions for Nigeria. Soil Sci. Soc. Am. J. 2014, 78, 1953–1966. [Google Scholar] [CrossRef]
  16. Hengl, T.; Heuvelink, G.B.M.; Kempen, B.; Leenaars, J.G.B.; Walsh, M.G.; Shepherd, K.D.; Sila, A.; MacMillan, R.A.; Jesus, J.; Tamene, L.; et al. Mapping Soil Properties of Africa at 250 m Resolution: Random Forests Significantly Improve Current Predictions. PLoS ONE 2015, 10, 0125814. [Google Scholar] [CrossRef] [PubMed]
  17. Silva Chagas, C.; Carvalho Junior, W.; Bhering, S.B.; Calderano Filho, B. Spatial Prediction of Soil Surface Texture in a Semiarid Region Using Random Forest and Multiple Linear Regressions. CATENA 2016, 139, 232–240. [Google Scholar] [CrossRef]
  18. Liu, F.; Zhang, G.-L.; Song, X.; Li, D.; Zhao, Y.; Yang, J.; Wu, H.; Yang, F. High-Resolution and Three-Dimensional Mapping of Soil Texture of China. Geoderma 2020, 361, 114061. [Google Scholar] [CrossRef]
  19. Zheng, M.; Wang, X.; Li, S.; Zhu, B.; Hou, J.; Song, K. Soil Texture Mapping in Songnen Plain of China Using Sentinel-2 Imagery. Remote Sens. 2023, 15, 5351. [Google Scholar] [CrossRef]
  20. Lark, R.M.; Bishop, T.F.A. Cokriging Particle Size Fractions of the Soil. Eur. J. Soil Sci. 2007, 58, 763–774. [Google Scholar] [CrossRef]
  21. Gozukara, G.; Akça, E.; Dengiz, O.; Kapur, S.; Adak, A. Soil Particle Size Prediction Using Vis-NIR and pXRF Spectra in a Semiarid Agricultural Ecosystem in Central Anatolia of Türkiye. CATENA 2022, 217, 106514. [Google Scholar] [CrossRef]
  22. Hengl, T.; Heuvelink, G.B.M.; Stein, A. A Generic Framework for Spatial Prediction of Soil Variables Based on Regression-Kriging. Geoderma 2004, 120, 75–93. [Google Scholar] [CrossRef]
  23. Wang, Z.; Shi, W. Robust Variogram Estimation Combined with Isometric Log-Ratio Transformation for Improved Accuracy of Soil ParticlFraction Mapping. Geoderma 2018, 324, 56–66. [Google Scholar] [CrossRef]
  24. Zhang, M.; Shi, W.; Xu, Z. Systematic Comparison of Five Machine-Learning Models in Classification and Interpolation of Soil Particle Size Fractions Using Different Transformed Data. Hydrol. Earth Syst. Sci. 2020, 24, 2505–2526. [Google Scholar] [CrossRef]
  25. Amirian-Chakan, A.; Minasny, B.; Taghizadeh-Mehrjardi, R.; Akbarifazli, R.; Darvishpasand, Z.; Khordehbin, S. Some Practical Aspects of Predicting Texture Data in Digital Soil Mapping. Soil Tillage Res. 2019, 194, 104289. [Google Scholar] [CrossRef]
  26. Lu, N.; Fu, B.; Jin, T.; Chang, R. Trade-off Analyses of Multiple Ecosystem Services by Plantations along a Precipitation Gradient across Loess Plateau Landscapes. Landsc. Ecol. 2014, 29, 1697–1708. [Google Scholar] [CrossRef]
  27. Zhao, G.; Mu, X.; Wen, Z.; Wang, F.; Gao, P. Soil Erosion, Conservation, and Eco-Environment Changes in the Loess Plateau of China. Land Degrad. Dev. 2013, 24, 499–510. [Google Scholar] [CrossRef]
  28. Huang, L.; Shao, M. Advances and Perspectives on Soil Water Research in China’s Loess Plateau. Earth Sci. Rev. 2019, 199, 102962. [Google Scholar] [CrossRef]
  29. He, X.B.; Li, Z.B.; Hao, M.D.; Tang, K.L.; Zheng, F.L. Down-Scale Analysis for Water Scarcity in Response to Soil–Water Conservation on Loess Plateau of China. Agric. Ecosyst. Environ. 2003, 94, 355–361. [Google Scholar] [CrossRef]
  30. Qiao, J.; Zhu, Y.; Jia, X.; Shao, M. Multifractal characteristics of particle size distributions (50–200 m) in soils in the vadose zone on the Loess Plateau, China. Soil Tillage Res. 2021, 205, 104786. [Google Scholar] [CrossRef]
  31. Liu, Z.P.; Shao, M.A.; Wang, Y.Q. Large-Scale Spatial Interpolation of Soil pH across the Loess Plateau, China. Environ. Earth Sci. 2013, 69, 2731–2741. [Google Scholar] [CrossRef]
  32. Zhao, C.; Shao, M.; Jia, X.; Zhu, Y. Factors Affecting Soil Desiccation Spatial Variability in the Loess Plateau of China. Soil Sci. Soc. Am. J. 2019, 83, 266–275. [Google Scholar] [CrossRef]
  33. Cao, R.; Jia, X.; Huang, L.; Zhu, Y.; Wu, L.; Shao, M. Deep Soil Water Storage Varies with Vegetation Type and Rainfall Amount in the Loess Plateau of China. Sci. Rep. 2018, 8, 12346. [Google Scholar] [CrossRef] [PubMed]
  34. Wen, X.; Zhen, L. Soil Erosion Control Practices in the Chinese Loess Plateau: A Systematic Review. Environ. Dev. 2020, 34, 100493. [Google Scholar] [CrossRef]
  35. Shi, H.; Shao, M. Soil and Water Loss from the Loess Plateau in China. J. Arid Environ. 2000, 45, 9–20. [Google Scholar] [CrossRef]
  36. Peng, S.; Gang, C.; Cao, Y.; Chen, Y. Assessment of Climate Change Trends over the Loess Plateau in China from 1901 to 2100. Int. J. Climatol. 2018, 38, 2250–2264. [Google Scholar] [CrossRef]
  37. Zhou, J.; Zhang, X.; Tang, W.; Ding, L.; Ma, J.; Zhang, X. Daily 1-Km All-Weather Land Surface Temperature Dataset for the Chinese Landmass and Its Surrounding Areas (TRIMS LST; 2000-2021); National Tibetan Plateau Data Center: Beijing, China, 2021. [Google Scholar]
  38. Zheng, C.; Jia, L.; Hu, G. ETMonitor Global Actual Evapotranspiration Dataset with 1-Km Resolution; National Tibetan Plateau Data Center: Beijing, China, 2022. [Google Scholar]
  39. Tucker, C.J. Red and Photographic Infrared Linear Combinations for Monitoring Vegetation. Remote Sens. Environ. 1979, 8, 127–150. [Google Scholar] [CrossRef]
  40. Liu, H.Q.; Huete, A. A Feedback Based Modification of the NDVI to Minimize Canopy Background and Atmospheric Noise. IEEE Trans. Geosci. Remote Sens. 1995, 33, 457–465. [Google Scholar] [CrossRef]
  41. Broge, N.H.; Leblanc, E. Comparing Prediction Power and Stability of Broadband and Hyperspectral Vegetation Indices for Estimation of Green Leaf Area Index and Canopy Chlorophyll Density. Remote Sens. Environ. 2001, 76, 156–172. [Google Scholar] [CrossRef]
  42. Desmet, P.J.J.; Govers, G.A. A GIS procedure for automatically calculating the USLE LS factor on topographically complex landscape units. J. Soil Water Conserv. 1996, 51, 427–433. [Google Scholar]
  43. Moore, I.D.; Grayson, R.B.; Ladson, A.R. Digital Terrain Modelling: A Review of Hydrological, Geomorphological, and Biological Applications. Hydrol. Process. 1991, 5, 3–30. [Google Scholar] [CrossRef]
  44. Gallant, J.C.; Dowling, T.I. A Multiresolution Index of Valley Bottom Flatness for Mapping Depositional Areas. Water Resour. Res. 2003, 39, 1347. [Google Scholar] [CrossRef]
  45. Breiman, L. Random Forests. Mach. Learn. 2001, 45, 5–32. [Google Scholar] [CrossRef]
  46. Grömping, U. Variable Importance Assessment in Regression: Linear Regression versus Random Forest. Am. Stat. 2009, 63, 308–319. [Google Scholar] [CrossRef]
  47. Prasad, A.M.; Iverson, L.R.; Liaw, A. Newer Classification and Regression Tree Techniques: Bagging and Random Forests for Ecological Prediction. Ecosystems 2006, 9, 181–199. [Google Scholar] [CrossRef]
  48. Borchani, H.; Varando, G.; Bielza, C.; Larrañaga, P. A survey on multi-output regression. WIREs Data Min. Knowl. Discov. 2015, 5, 216–233. [Google Scholar] [CrossRef]
  49. Segal, M.; Xiao, Y. Multivariate random forests. Wiley Interdisc Rew Data Min. Knowl. Discov. 2011, 1, 80–87. [Google Scholar] [CrossRef]
  50. De’ath, G. Multivariate Regression Trees: A New Technique for Modeling Species-Environment Relationships. Ecology 2002, 83, 1105–1117. [Google Scholar] [CrossRef]
  51. Xu, D.; Shi, Y.; Tsang, I.W.; Ong, Y.-S.; Gong, C.; Shen, X. Survey on Multi-Output Learning. IEEE Trans. Neural Netw. Learn. Syst. 2020, 31, 2409–2429. [Google Scholar] [CrossRef]
  52. Xue, L.; Liu, Y.; Xiong, Y.; Liu, Y.; Cui, X.; Lei, G. A Data-Driven Shale Gas Production Forecasting Method Based on the Multi-Objective Random Forest Regression. J. Petrol. Sci. Eng. 2021, 196, 107801. [Google Scholar] [CrossRef]
  53. Wang, Z.; Shi, W. Mapping Soil Particle-Size Fractions: A Comparison of Compositional Kriging and Log-Ratio Kriging. J. Hydrol. 2017, 546, 526–541. [Google Scholar] [CrossRef]
  54. Pawlowsky-Glahn, V.; Buccianti, A. Compositional Data Analysis: Theory and Applications; John Wiley & Sons: Hoboken, NJ, USA, 2011. [Google Scholar]
  55. Mira, M.; Valor, E.; Boluda, R.; Caselles, V.; Coll, C. Influence of Soil Water Content on the Thermal Infrared Emissivity of Bare Soils: Implication for Land Surface Temperature Determination. J. Geophys. Res. Earth Surf. 2007, 112, F04003. [Google Scholar] [CrossRef]
  56. Müller, B.; Bernhardt, M.; Jackisch, C.; Karsten, S. Estimating Spatially Distributed Soil Texture Using Time Series of Thermal Remote Sensing—A Case Study in Central Europe. Hydrol. Earth Syst. Sci. 2016, 20, 3765–3775. [Google Scholar] [CrossRef]
  57. Osińska-Skotak, K. Studies of Soil Temperature on the Basis of Satellite Data. Int. Agrophysics 2007, 21, 275–284. [Google Scholar]
  58. Wang, D.-C.; Zhang, G.-L.; Zhao, M.-S.; Pan, X.-Z.; Zhao, Y.-G.; Li, D.-C.; Macmillan, B. Retrieval and Mapping of Soil Texture Based on Land Surface Diurnal Temperature Range Data from MODIS. PLoS ONE 2015, 10, 0129977. [Google Scholar] [CrossRef] [PubMed]
  59. Sayão, V.M.; Demattê, J.A.M.; Bedin, L.G.; Nanni, M.R.; Rizzo, R. Satellite Land Surface Temperature and Reflectance Related with Soil Attributes. Geoderma 2018, 325, 125–140. [Google Scholar] [CrossRef]
  60. Wang, X.; Huo, Z.; Feng, S.; Guo, P.; Guan, H. Estimating Groundwater Evapotranspiration from Irrigated Cropland Incorporating Root Zone Soil Texture and Moisture Dynamics. J. Hydrol. 2016, 543, 501–509. [Google Scholar] [CrossRef]
  61. Walker, E.; García, G.A.; Venturini, V.; Carrasco, A. Regional Evapotranspiration Estimates Using the Relative Soil Moisture Ratio Derived from SMAP Products. Agric. Water Manag. 2019, 216, 254–263. [Google Scholar] [CrossRef]
  62. Olivera-Guerra, L.; Mattar, C.; Galleguillos, M. Estimation of Real Evapotranspiration and Its Variation in Mediterranean Landscapes of Central-Southern Chile. Int. J. Appl. Earth Obs. Geoinf. 2014, 28, 160–169. [Google Scholar] [CrossRef]
  63. Liu, Y.; Wu, X.; Wu, T.; Zhao, L.; Li, R.; Li, W.; Hu, G.; Zou, D.; Ni, J.; Du, Y.; et al. Soil Texture and Its Relationship with Environmental Factors on the Qinghai–Tibet Plateau. Remote Sens. 2022, 14, 3797. [Google Scholar] [CrossRef]
  64. Mehrabi-Gohari, E.; Mehrabi-Gohari, H.; Jafari, A.; Taghizadeh-Mehrjardi, R.; Triantafilis, J. The Spatial Prediction of Soil Texture Fractions in Arid Regions of Iran. Soil Syst. 2019, 3, 65. [Google Scholar] [CrossRef]
  65. Liao, K.; Xu, S.; Wu, J.; Zhu, Q. Spatial estimation of surface soil texture using remote sensing data. Soil Sci. Plant Nutr. 2013, 59, 488–500. [Google Scholar] [CrossRef]
  66. Stenberg, B.; Viscarra Rossel, R.A.; Mouazen, A.M.; Wetterlind, J. Chapter Five—Visible and Near Infrared Spectroscopy in Soil Science. In Advances in Agronomy; Sparks, D.L., Ed.; Academic Press: Cambridge, MA, USA, 2010; pp. 163–215. [Google Scholar]
  67. Moore, I.D.; Gessler, P.E.; Nielsen, G.A.; Peterson, G.A. Soil Attribute Prediction Using Terrain Analysis. Soil Sci. Soc. Am. J. 1993, 57, 443–452. [Google Scholar] [CrossRef]
  68. Taghizadeh-Mehrjardi, R.; Sarmadian, F.; Minasny, B.; Triantafilis, J.; Omid, M. Digital Mapping of Soil Classes Using Decision Tree and Auxiliary Data in the Ardakan Region, Iran. Arid Land Res. Manag. 2014, 28, 147–168. [Google Scholar] [CrossRef]
  69. Dharumarajan, S.; Hegde, R. Digital mapping of soil texture classes using Random Forest classification algorithm. Soil Use Manag. 2022, 38, 135–149. [Google Scholar] [CrossRef]
  70. Sun, J. Provenance of Loess Material and Formation of Loess Deposits on the Chinese Loess Plateau. Earth Planet. Sci. Lett. 2002, 203, 845–859. [Google Scholar] [CrossRef]
  71. Ding, Z.L.; Yu, Z.W.; Yang, S.L.; Sun, J.M.; Xiong, S.F.; Liu, T.S. Coeval Changes in Grain Size and Sedimentation Rate of Eolian Loess, the Chinese Loess Plateau. Geophys. Res. Lett. 2001, 28, 2097–2100. [Google Scholar] [CrossRef]
  72. Cerdan, O.; Govers, G.; Le Bissonnais, Y.; Oost, K.; Poesen, J.; Saby, N.; Gobin, A.; Vacca, A.; Quinton, J.; Auerswald, K.; et al. Rates and Spatial Variations of Soil Erosion in Europe: A Study Based on Erosion Plot Data. Geomorphology 2010, 122, 167–177. [Google Scholar] [CrossRef]
  73. Jiang, C.; Zhang, H.; Wang, X.; Feng, Y.; Labzovskii, L. Challenging the Land Degradation in China’s Loess Plateau: Benefits, Limitations, Sustainability, and Adaptive Strategies of Soil and Water Conservation. Ecol. Eng. 2019, 127, 135–150. [Google Scholar] [CrossRef]
  74. Sun, W.; Shao, Q.; Liu, J. Soil Erosion and Its Response to the Changes of Precipitation and Vegetation Cover on the Loess Plateau. J. Geogr. Sci. 2013, 23, 1091–1106. [Google Scholar] [CrossRef]
  75. Li, P.; Mu, X.; Holden, J.; Wu, Y.; Irvine, B.; Wang, F.; Gao, P.; Zhao, G.; Sun, W. Comparison of Soil Erosion Models Used to Study the Chinese Loess Plateau. Earth-Sci. Rev. 2017, 170, 17–30. [Google Scholar] [CrossRef]
  76. Wen, X.; Théau, J. Assessment of ecosystem services in restoration programs in China: A systematic review. Ambio 2020, 49, 584–592. [Google Scholar] [CrossRef]
  77. Wu, Q.; Wang, L.; Wu, F. Tillage—Impact on Infiltration of the Loess Plateau of China. Acta Agric. Scand. Sect. B—Soil Plant Sci. 2014, 64, 341–349. [Google Scholar] [CrossRef]
  78. Prosdocimi, M.; Tarolli, P.; Cerdà, A. Mulching Practices for Reducing Soil Water Erosion: A Review. Earth-Sci. Rev. 2016, 161, 191–203. [Google Scholar] [CrossRef]
  79. Wang, Y.; Fu, B.; Chen, L.; Lü, Y.; Gao, Y. Check Dam in the Loess Plateau of China: Engineering for Environmental Services and Food Security. Environ. Sci. Technol. 2011, 45, 10298–10299. [Google Scholar] [CrossRef] [PubMed]
  80. Xin, Z.; Ran, L.; Lu, X.X. Soil Erosion Control and Sediment Load Reduction in the Loess Plateau: Policy Perspectives. Int. J. Water Resour. Dev. 2012, 28, 325–341. [Google Scholar] [CrossRef]
  81. Mohammad, A.G.; Adam, M.A. The Impact of Vegetative Cover Type on Runoff and Soil Erosion under Different Land Uses. CATENA 2010, 81, 97–103. [Google Scholar] [CrossRef]
  82. Sun, X.-L.; Wu, Y.-J.; Wang, H.-L.; Zhao, Y.-G.; Zhang, G.-L. Mapping Soil Particle Size Fractions Using Compositional Kriging, Cokriging and Additive Log-Ratio Cokriging in Two Case Studies. Math. Geosci. 2014, 46, 429–443. [Google Scholar] [CrossRef]
  83. Fu, C.-F.; Bian, Z.-H.; Xi, J.-J.; Zhao, J.-B. Spatial Distribution Characteristics of Soil Moisture in Different Types of Sand Dune in the Mu Us Sandy Land, Adjacent to North of Chinese Loess Plateau. Environ. Earth Sci. 2018, 77, 151. [Google Scholar] [CrossRef]
  84. Jia, X.; Wang, Y.; Shao, M.; Luo, Y.; Zhang, C. Estimating regional losses of soil water due to the conversion of agricultural land to forest in China’s Loess Plateau. Ecohydrology 2017, 10, 1851. [Google Scholar] [CrossRef]
  85. Cao, S.; Sun, G.; Zhang, Z.; Chen, L.; Feng, Q.; Fu, B.; McNulty, S.; Shankman, D.; Tang, J.; Wang, Y.; et al. Greening China Naturally. Ambio 2011, 40, 828–831. [Google Scholar] [CrossRef] [PubMed]
  86. van der Westhuizen, S.; Heuvelink, G.B.M.; Hofmeyr, D.P. Multivariate random forest for digital soil mapping. Geoderma 2023, 431, 116365. [Google Scholar] [CrossRef]
Figure 1. Locations of soil sampling points in the Loess Plateau, China.
Remotesensing 16 00785 g001
Figure 2. Soil texture classes of soil samples in the USDA texture triangle.
Remotesensing 16 00785 g002
Figure 3. Environmental variable importance for soil PSF prediction with the MRF model.
Remotesensing 16 00785 g003
Figure 4. Spatial distribution of (a) sand, (b) silt, and (c) clay content.
Remotesensing 16 00785 g004aRemotesensing 16 00785 g004b
Figure 5. Digital map of soil texture in the typical Loess Plateau region.
Remotesensing 16 00785 g005
Table 1. Environmental variables used for the spatial prediction of soil PSFs.
VariableAbbreviationBrief Description
Remote sensingBand 3B3Red band (0.63–0.69 μm)
Band 4B4Near-infrared band (0.77–0.90 μm)
Band 5B5Shortwave infrared band (1.55–1.75 μm)
Normalized difference vegetation index [39]NDVIQuantifies vegetation by measuring the difference between near-infrared and red reflectance
Enhanced vegetation index [40]EVIQuantifies vegetation using near-infrared, red, and blue reflectance
Triangular vegetation index [41]TVIQuantifies vegetation using near-infrared, red, and green reflectance
Terrain attributesElevation Original value of the DEM
Slope Rate of elevation change
Aspect Orientation of slope
Slope length and steepness factor [42]LS-factorDescribes effects of slope length and slope gradient on soil erosion
Topographic wetness index [43]TWIQuantifies the topographic control on hydrological processes
Valley depthVDVertical distance to a channel network base level
Flow accumulationFASum of all flows from upstream of a pixel
Plan curvaturePCCurvature along the horizontal plan
Multiresolution index of valley bottom flatness [44]MrVBFDescribes the flatness and lowness characteristics of valley bottoms at a range of scales
Wind exposition indexWEIExpresses how open a location is to the wind
Climate variablesPrecipitationPreAmount of precipitation in a year
EvapotranspirationETTotal water loss to the atmosphere from the land surface
Daytime land surface temperatureLST_DTemperature of the Earth’s lands during the daytime
Nighttime land surface temperatureLST_NTemperature of the Earth’s lands during the nighttime
Table 2. Descriptive statistics for the PSFs of soil samples in the training and test sets.
PSFsMaxMinMeanMedianSDCV
TrainingSand95.743.7718.4515.3913.470.73
Silt74.793.6263.7266.739.930.15
Clay29.530.6317.8317.974.570.25
TestSand67.173.7221.1717.2513.920.65
Silt71.1623.5762.3066.6510.300.16
Clay26.336.8916.5316.124.620.28
Table 3. R2, RMSE, MAE, and CCC achieved using different approaches.
R2RMSE (%)MAE (%)CCC
SandSiltClaySandSiltClaySandSiltClaySandSiltClay
MRF0.620.530.738.537.042.405.684.661.960.740.660.83
ALR0.560.440.659.237.712.755.794.862.260.690.590.76
CLR0.600.490.698.767.352.595.464.712.040.720.630.80
ILR0.530.360.699.598.242.595.905.312.080.670.530.80
Disclaimer/Publisher’s Note: The statements, opinions and data contained in all publications are solely those of the individual author(s) and contributor(s) and not of MDPI and/or the editor(s). MDPI and/or the editor(s) disclaim responsibility for any injury to people or property resulting from any ideas, methods, instructions or products referred to in the content.

