
Robust 3D Semantic Segmentation Method Based on Multi-Modal Collaborative Learning


Abstract
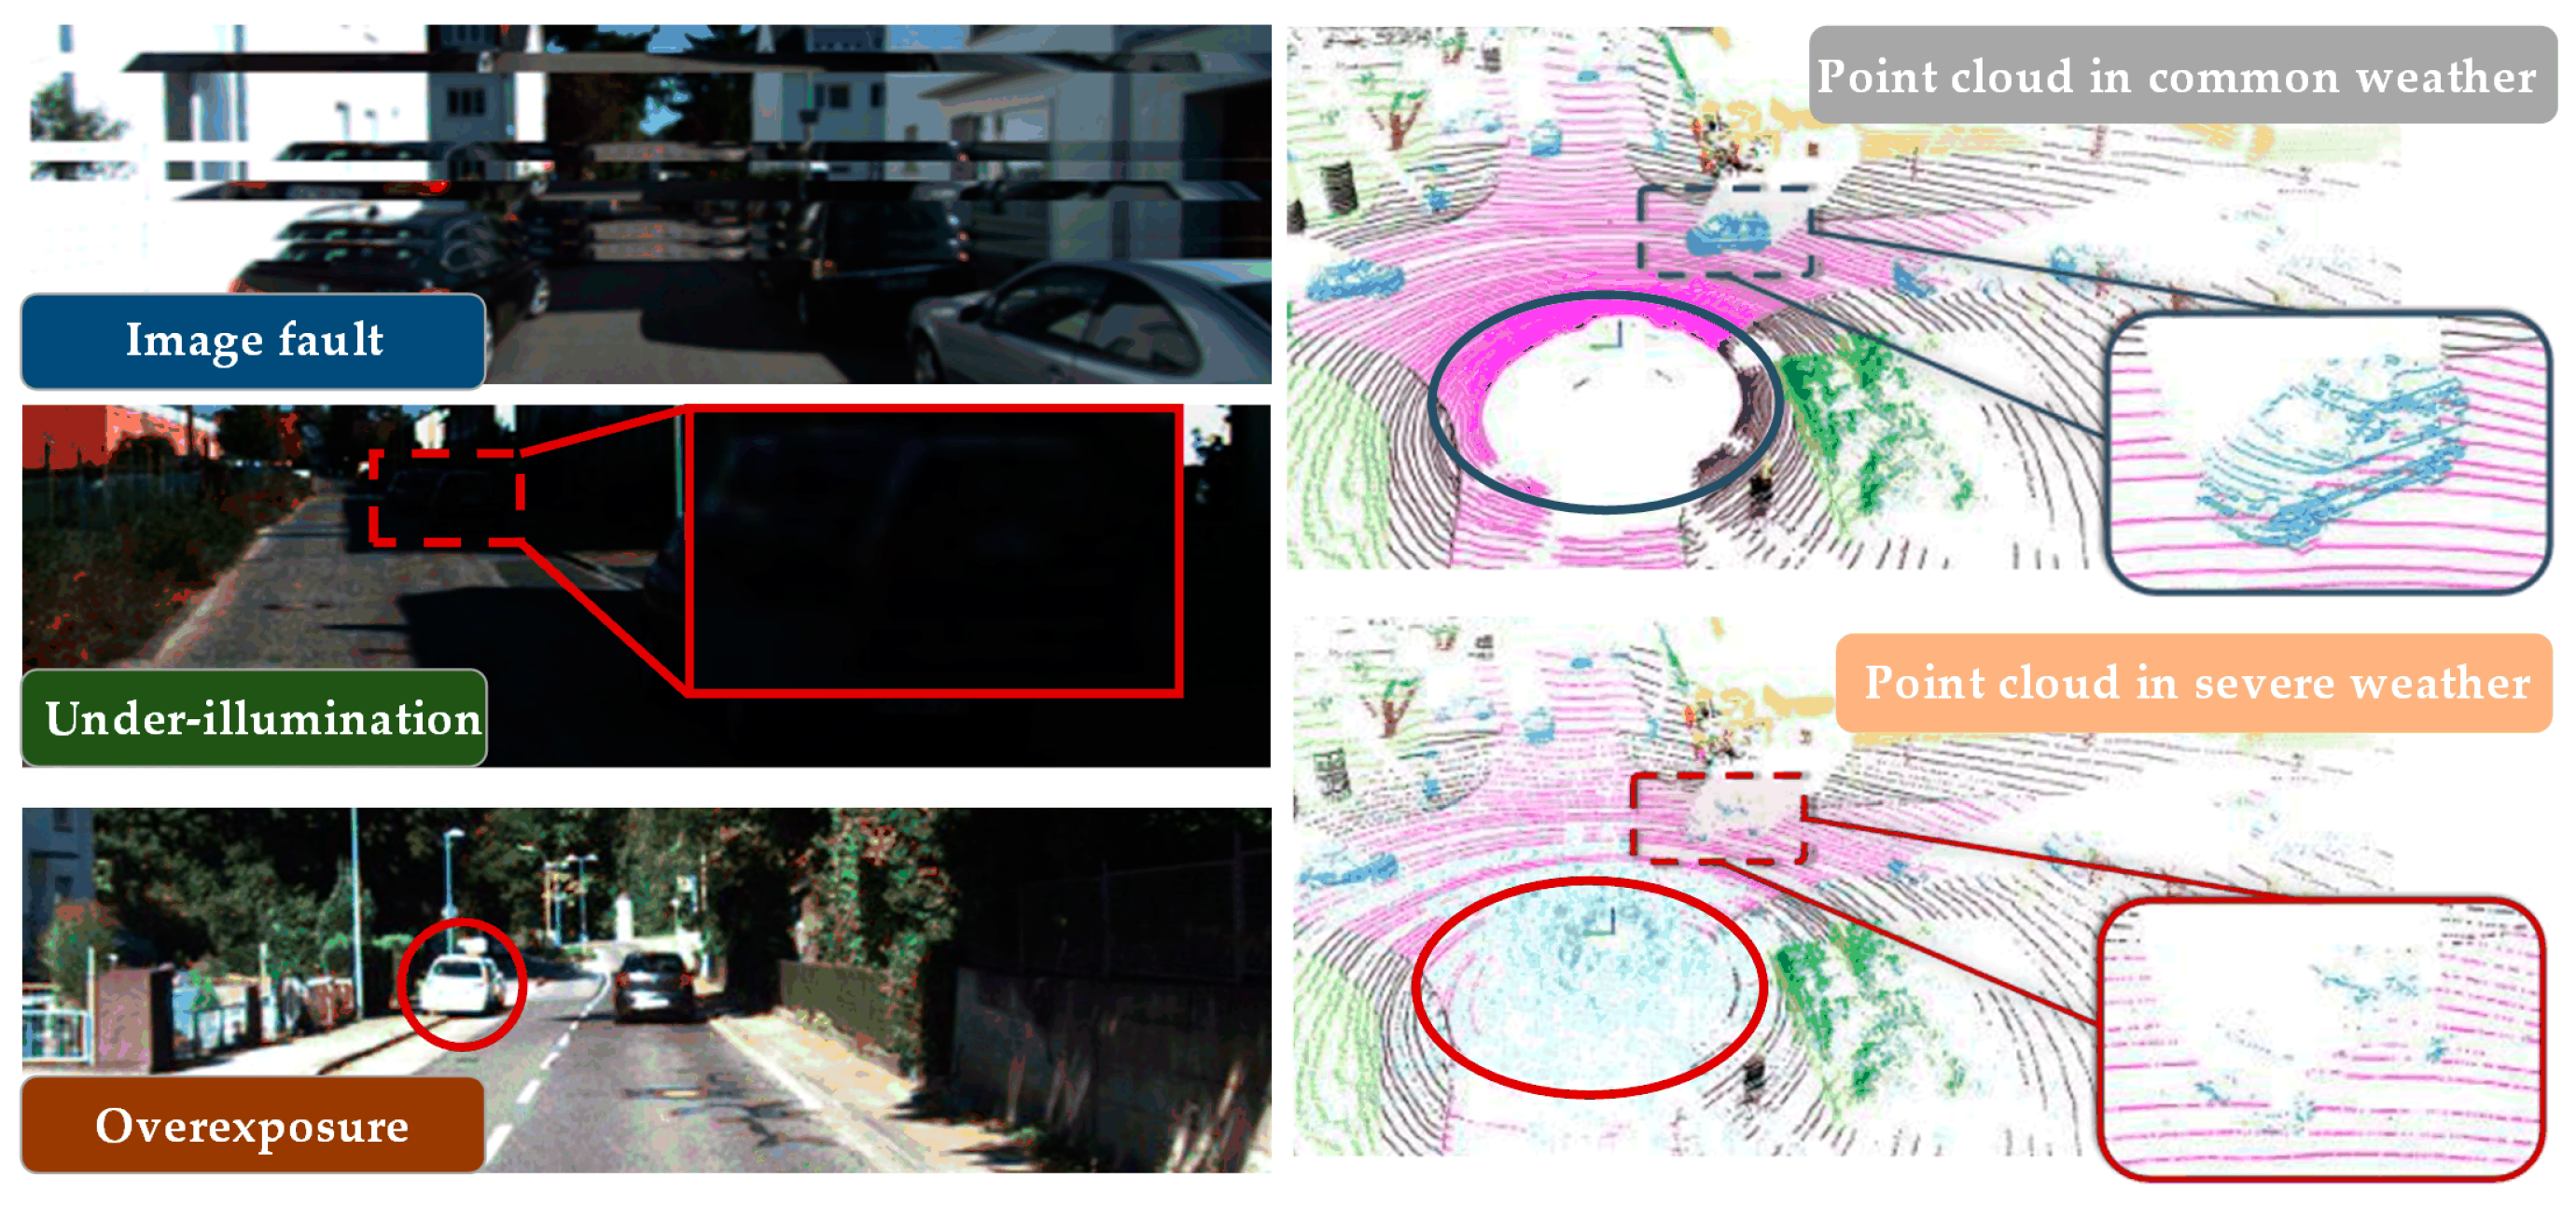
1. Introduction
- (a)
- Field of View Disparity:
- (b)
- Dependency on Precise Paired Data:
- (c)
- Resource-Intensive Processing:
- (a)
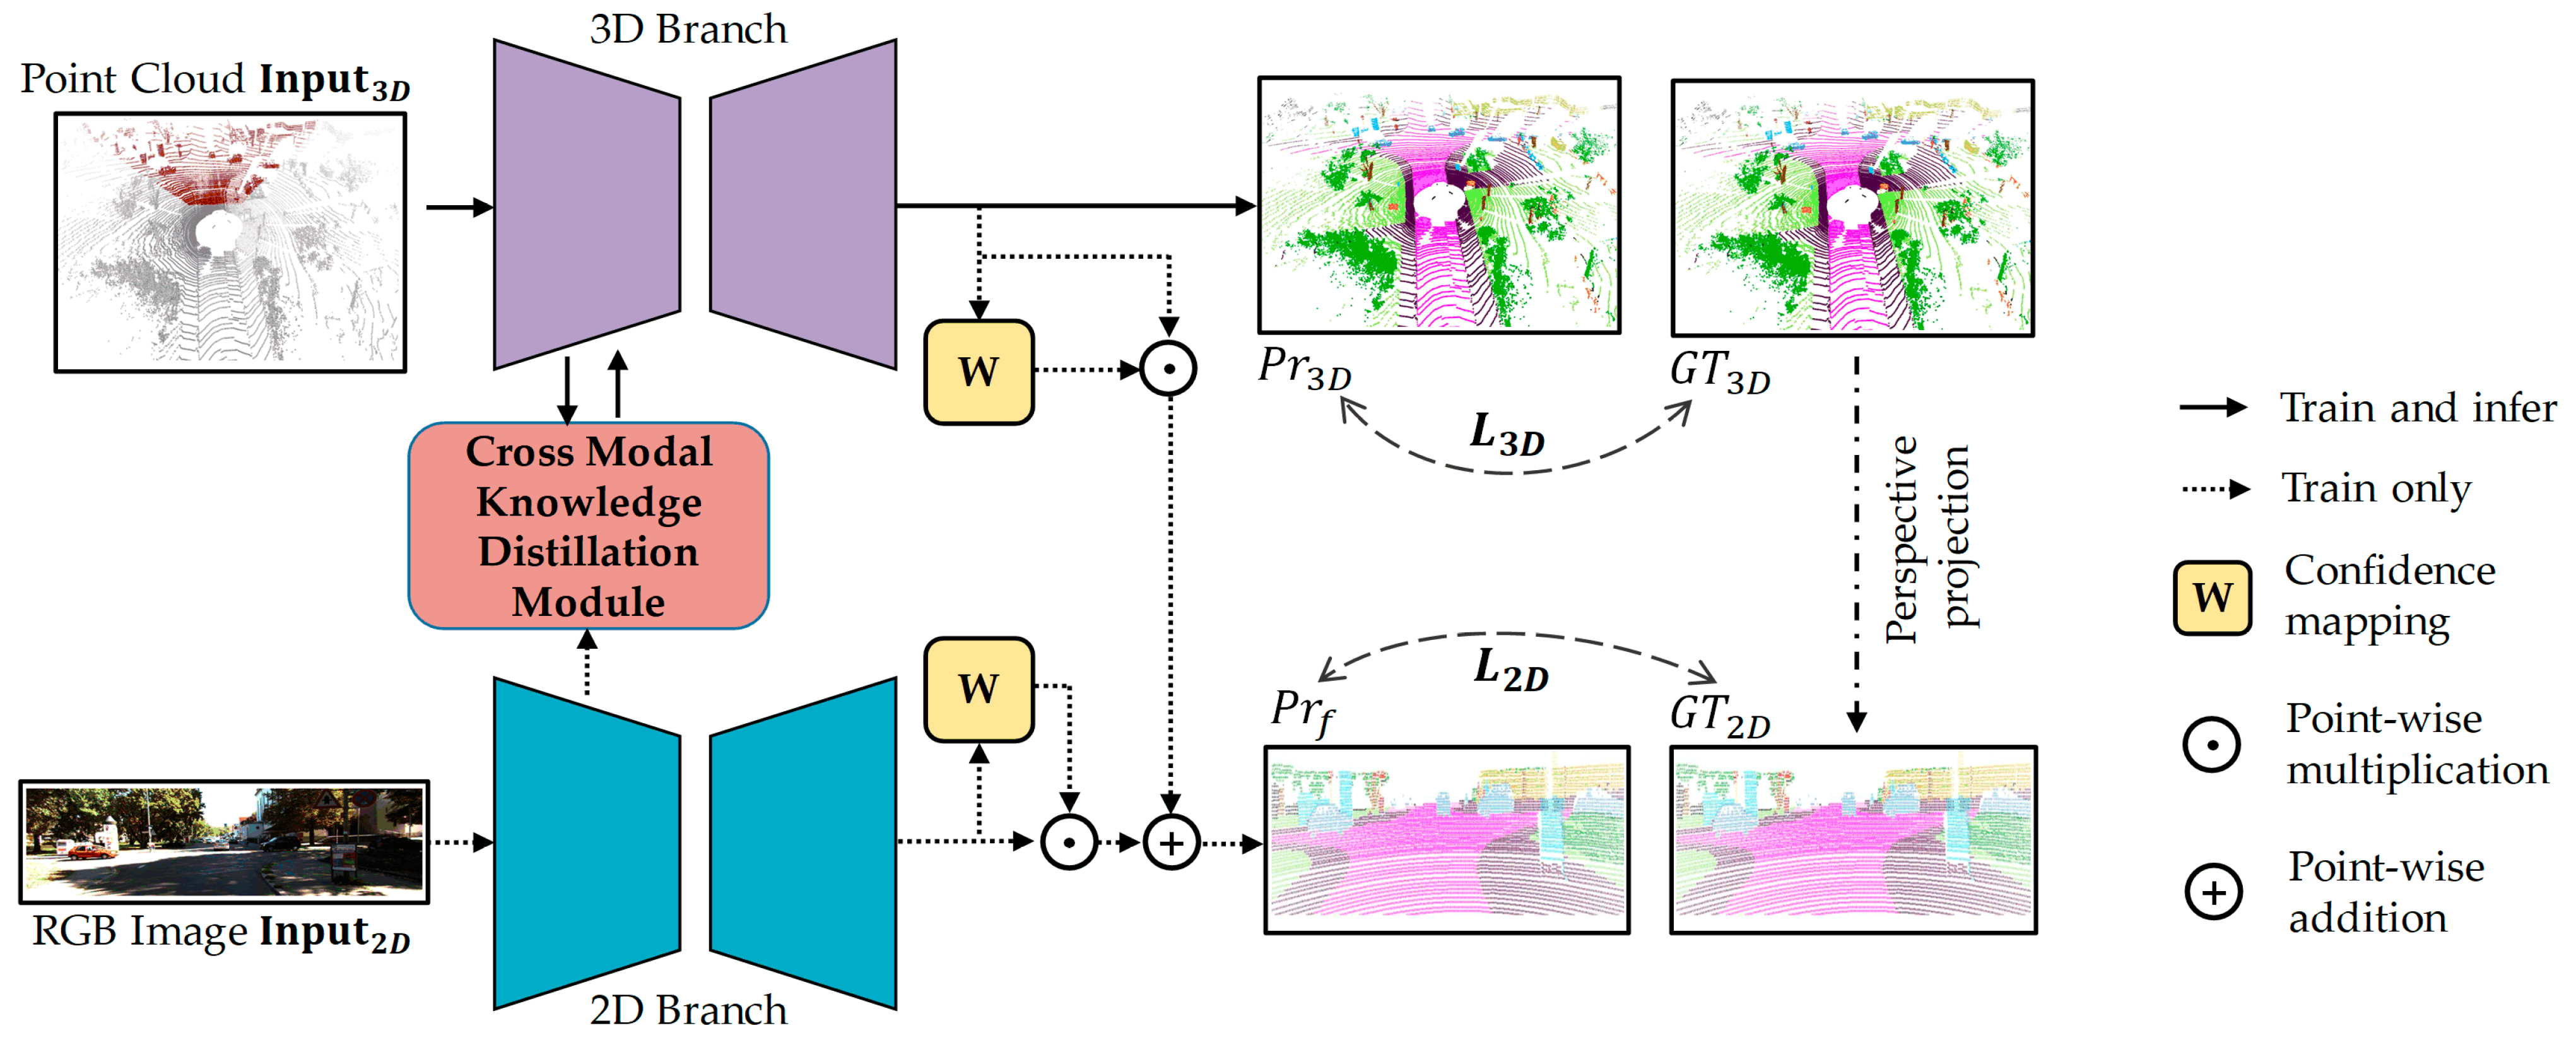
- This paper proposes a robust 3D semantic segmentation method based on multi-modal collaborative learning, which effectively deals with the limitations and restrictions of fusion-based 3D semantic segmentation methods.
- (b)
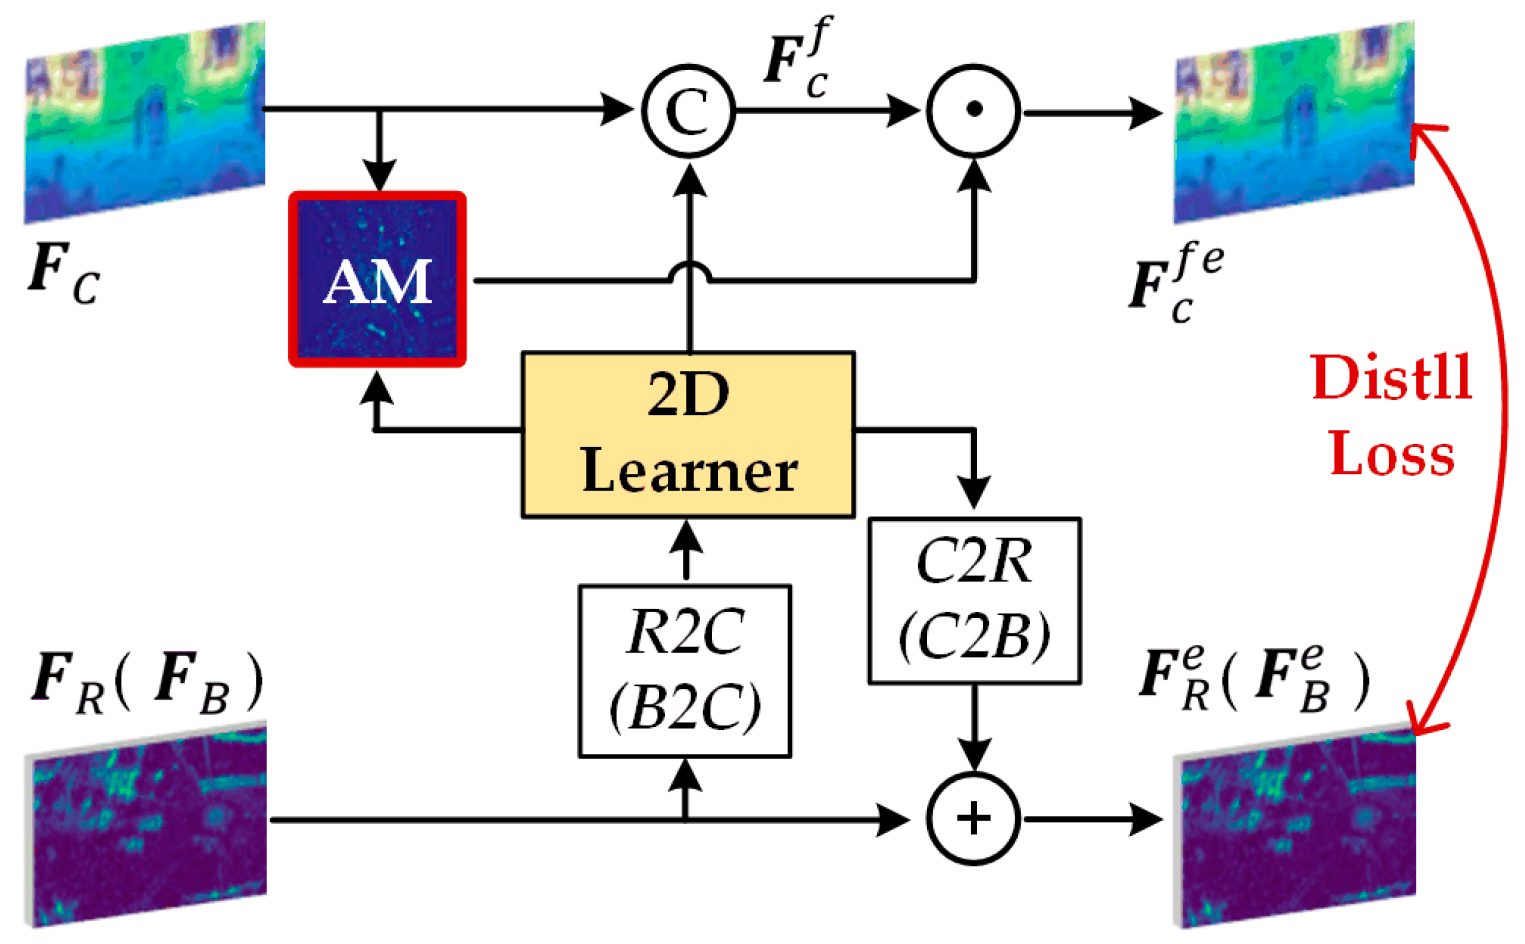
- An attention-based cross-modal knowledge distillation module is proposed to assist 3D feature extraction using 2D image features with higher contributions, which further helps distill multi-modal knowledge to single point-cloud modality for accurate and robust semantic segmentation.
- (c)
- A late fusion strategy guided by a confidence map is proposed to emphasize the strengths of each modality by dynamically assigning per-pixel weights of outputs and further optimizing segmentation results.
2. Related Works
2.1. LiDAR-Based 3D Semantic Segmentation Methods
2.2. Knowledge Distillation Methods
3. Methods
3.1. Semantic Segmentation Backbone
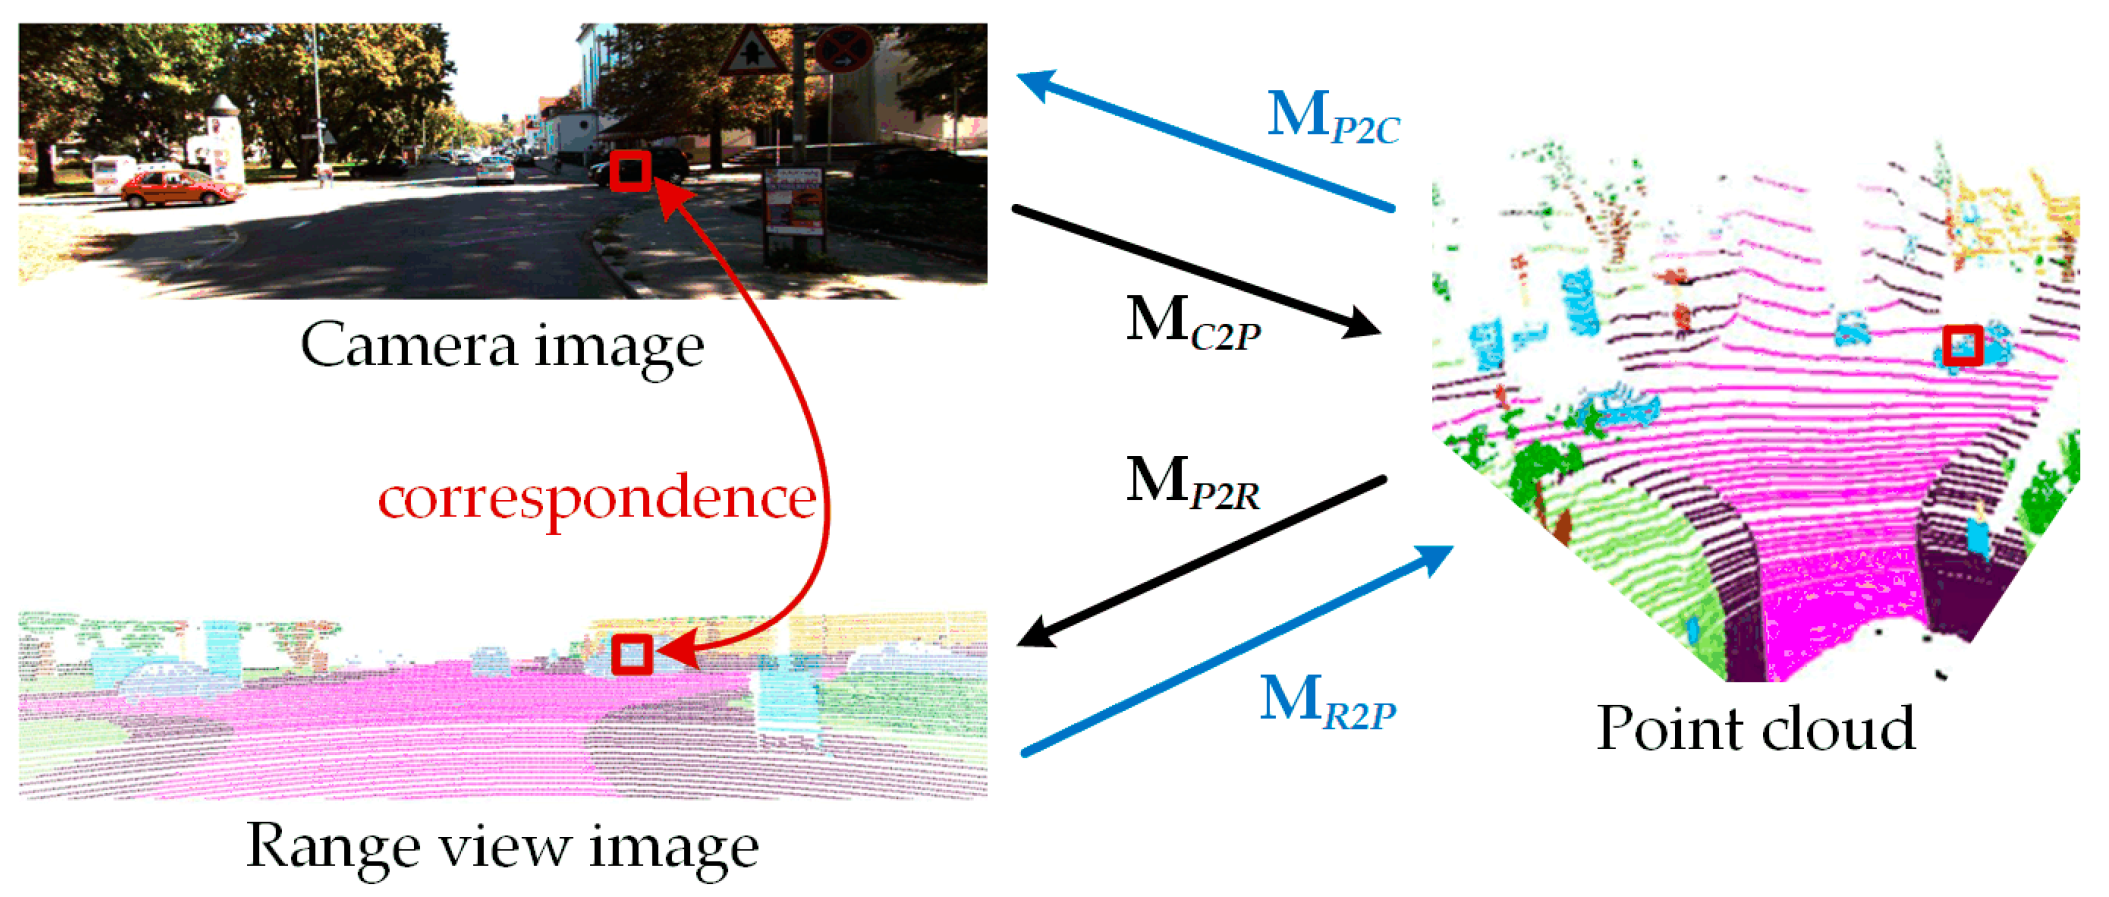
3.2. Attention-Based Cross-Modal Knowledge Distillation Module
3.2.1. Feature Alignment
3.2.2. Fusion and Distillation
3.3. Confidence-Map-Driven Late Fusion Strategy
3.4. Joint Learning
4. Experiments and Results
4.1. Dataset
4.2. Implement Details
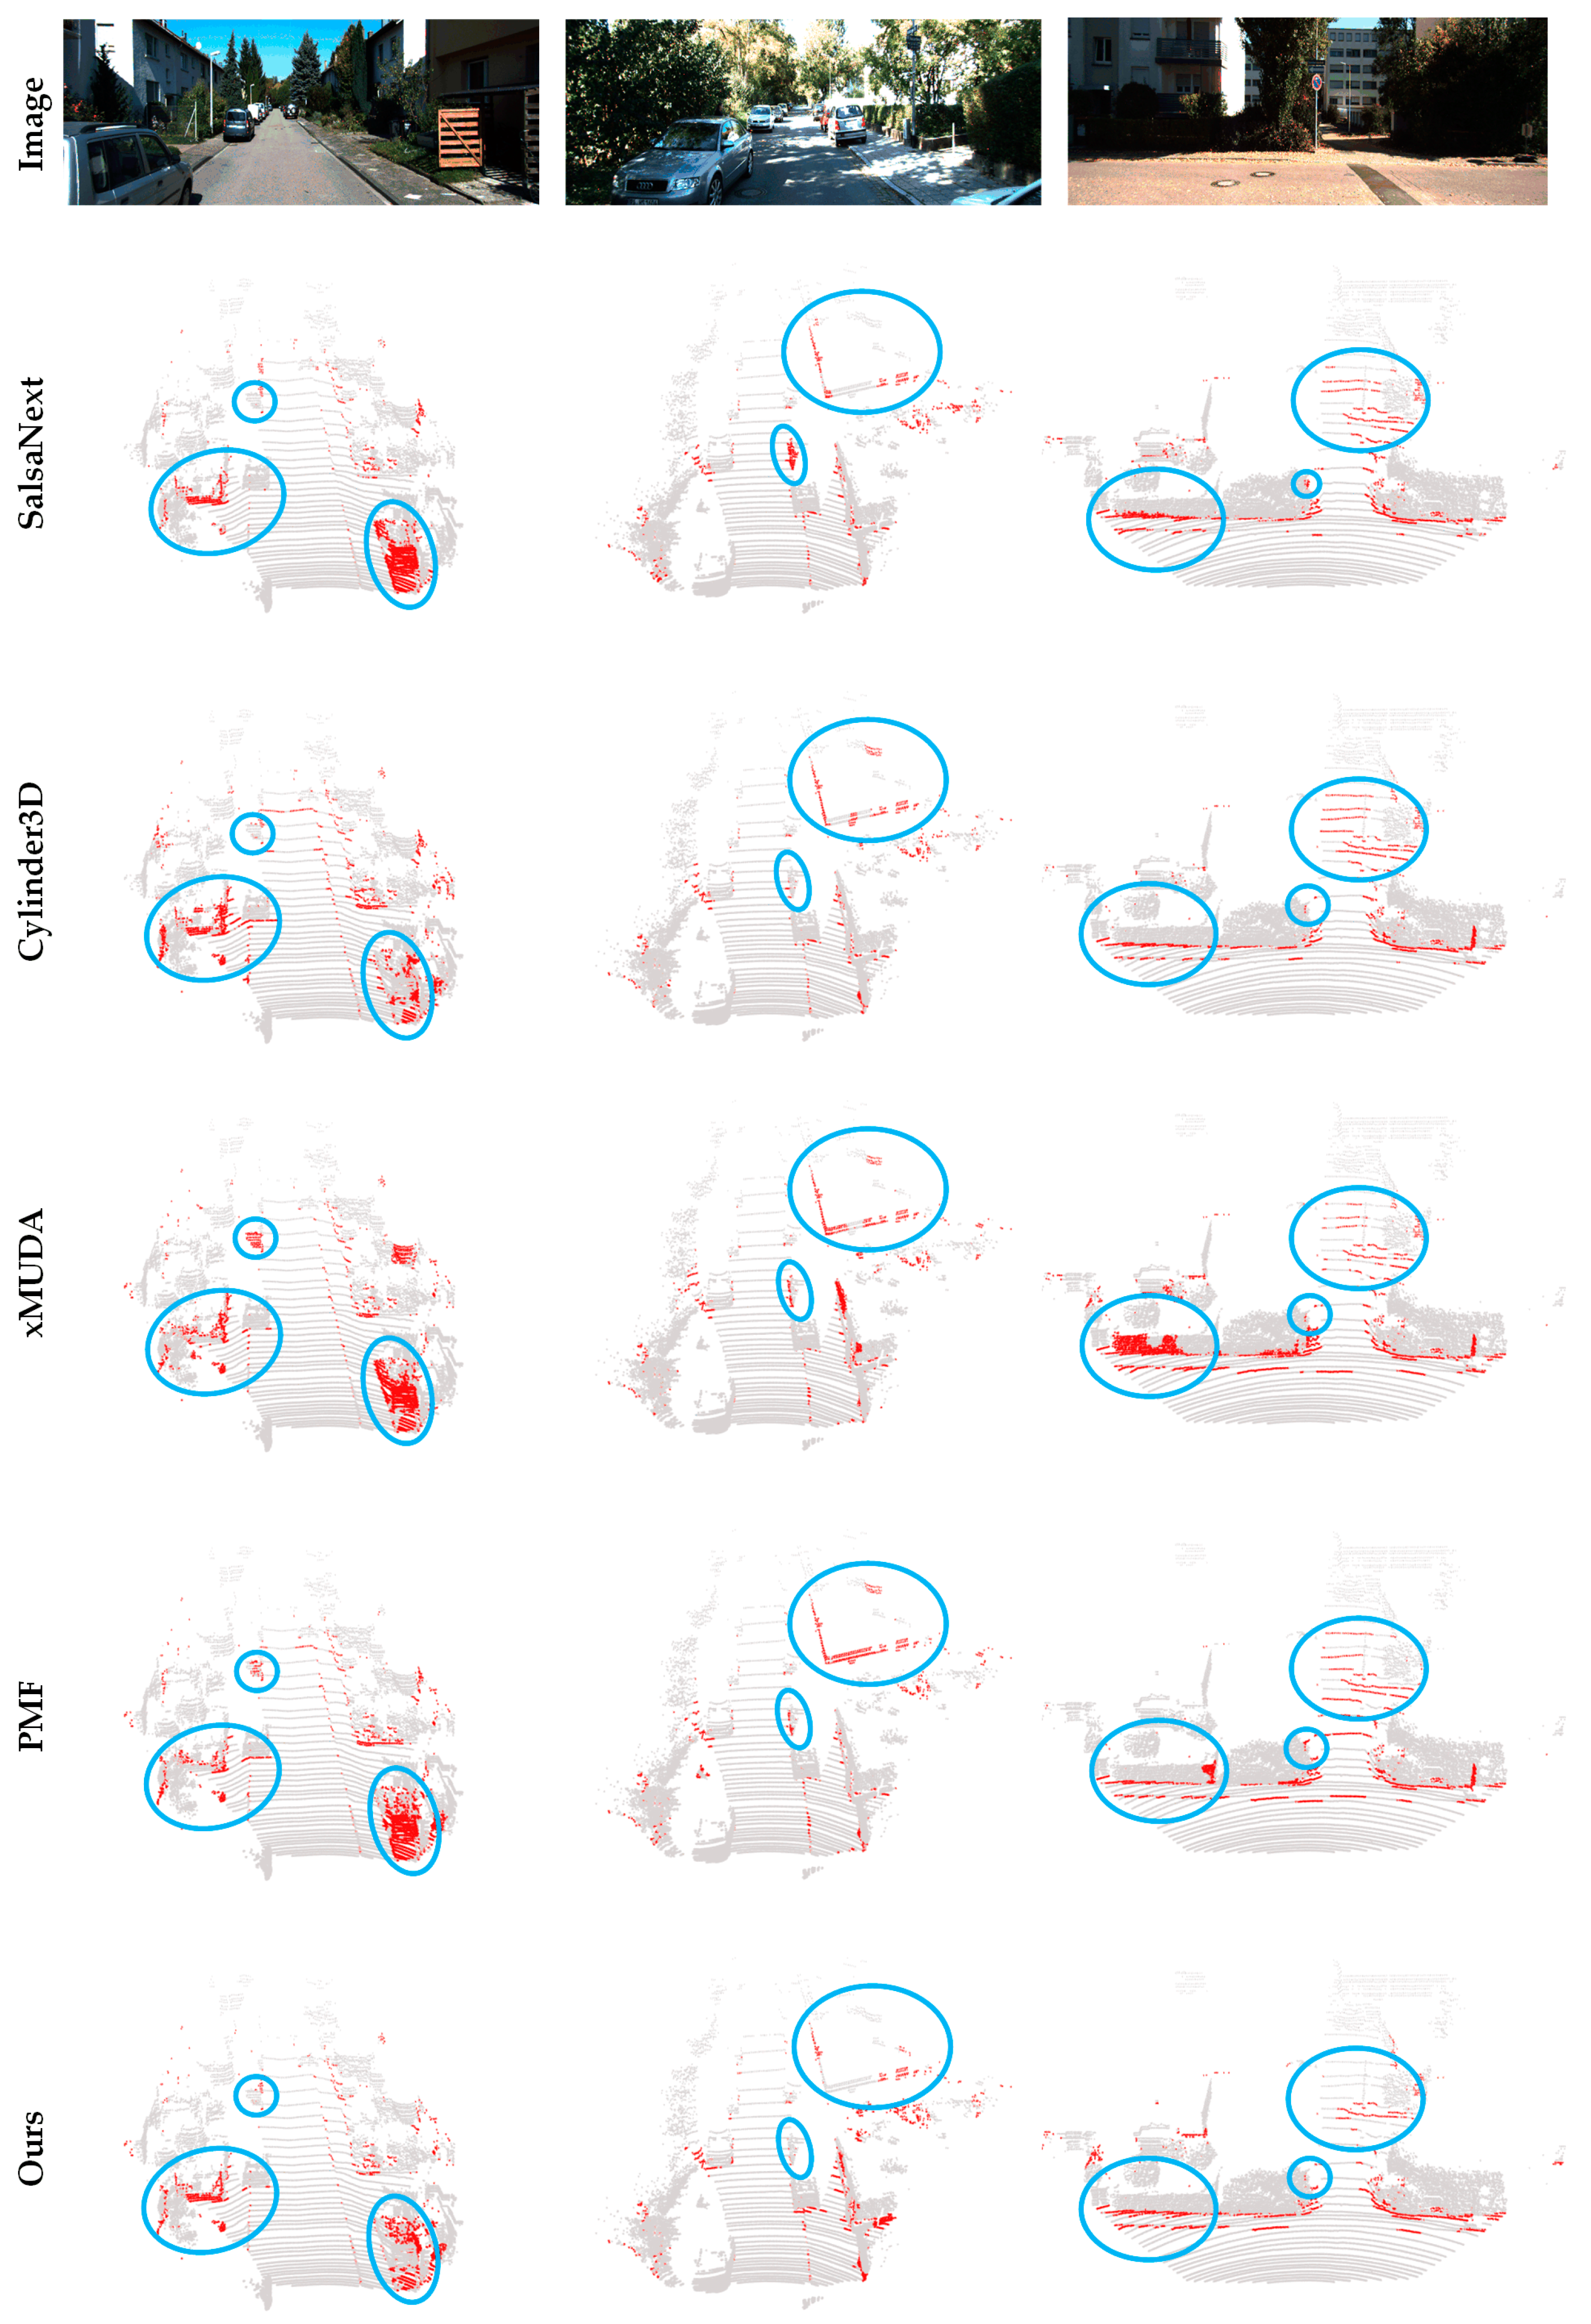
4.3. Comparative Results and Discussion of SemanticKITTI
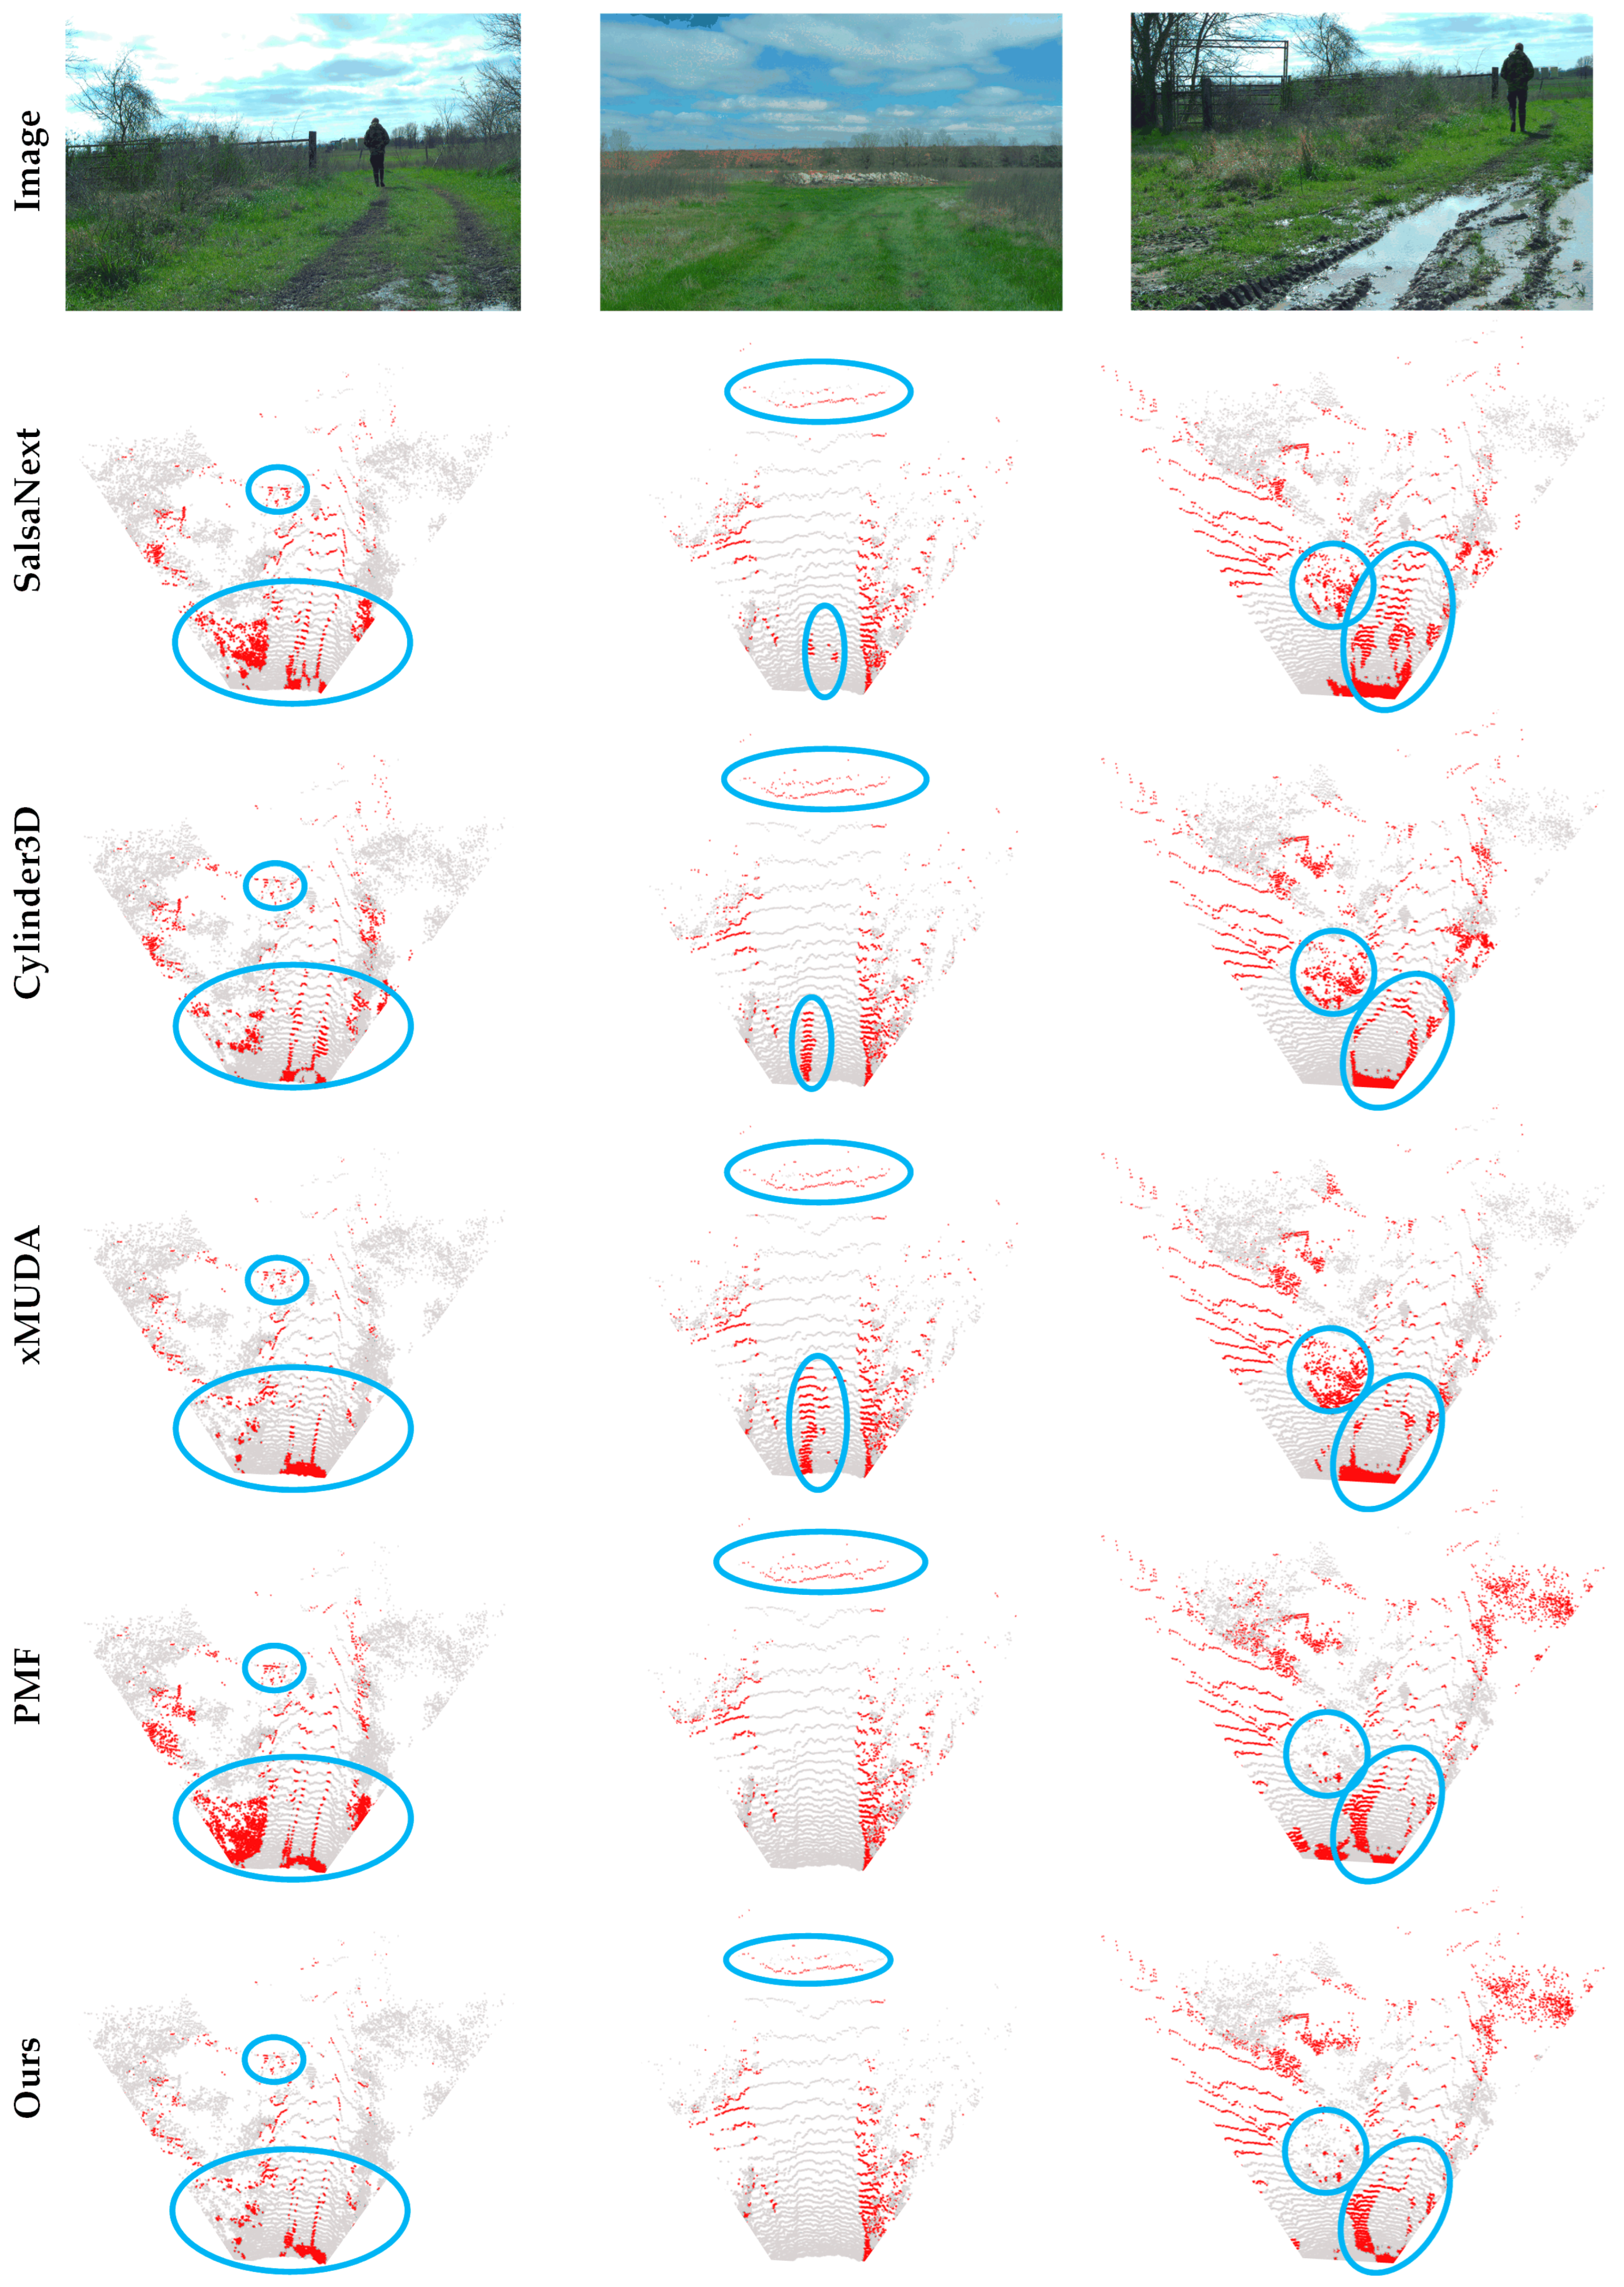
4.4. Comparative Results and Discussion of RELLIS-3D
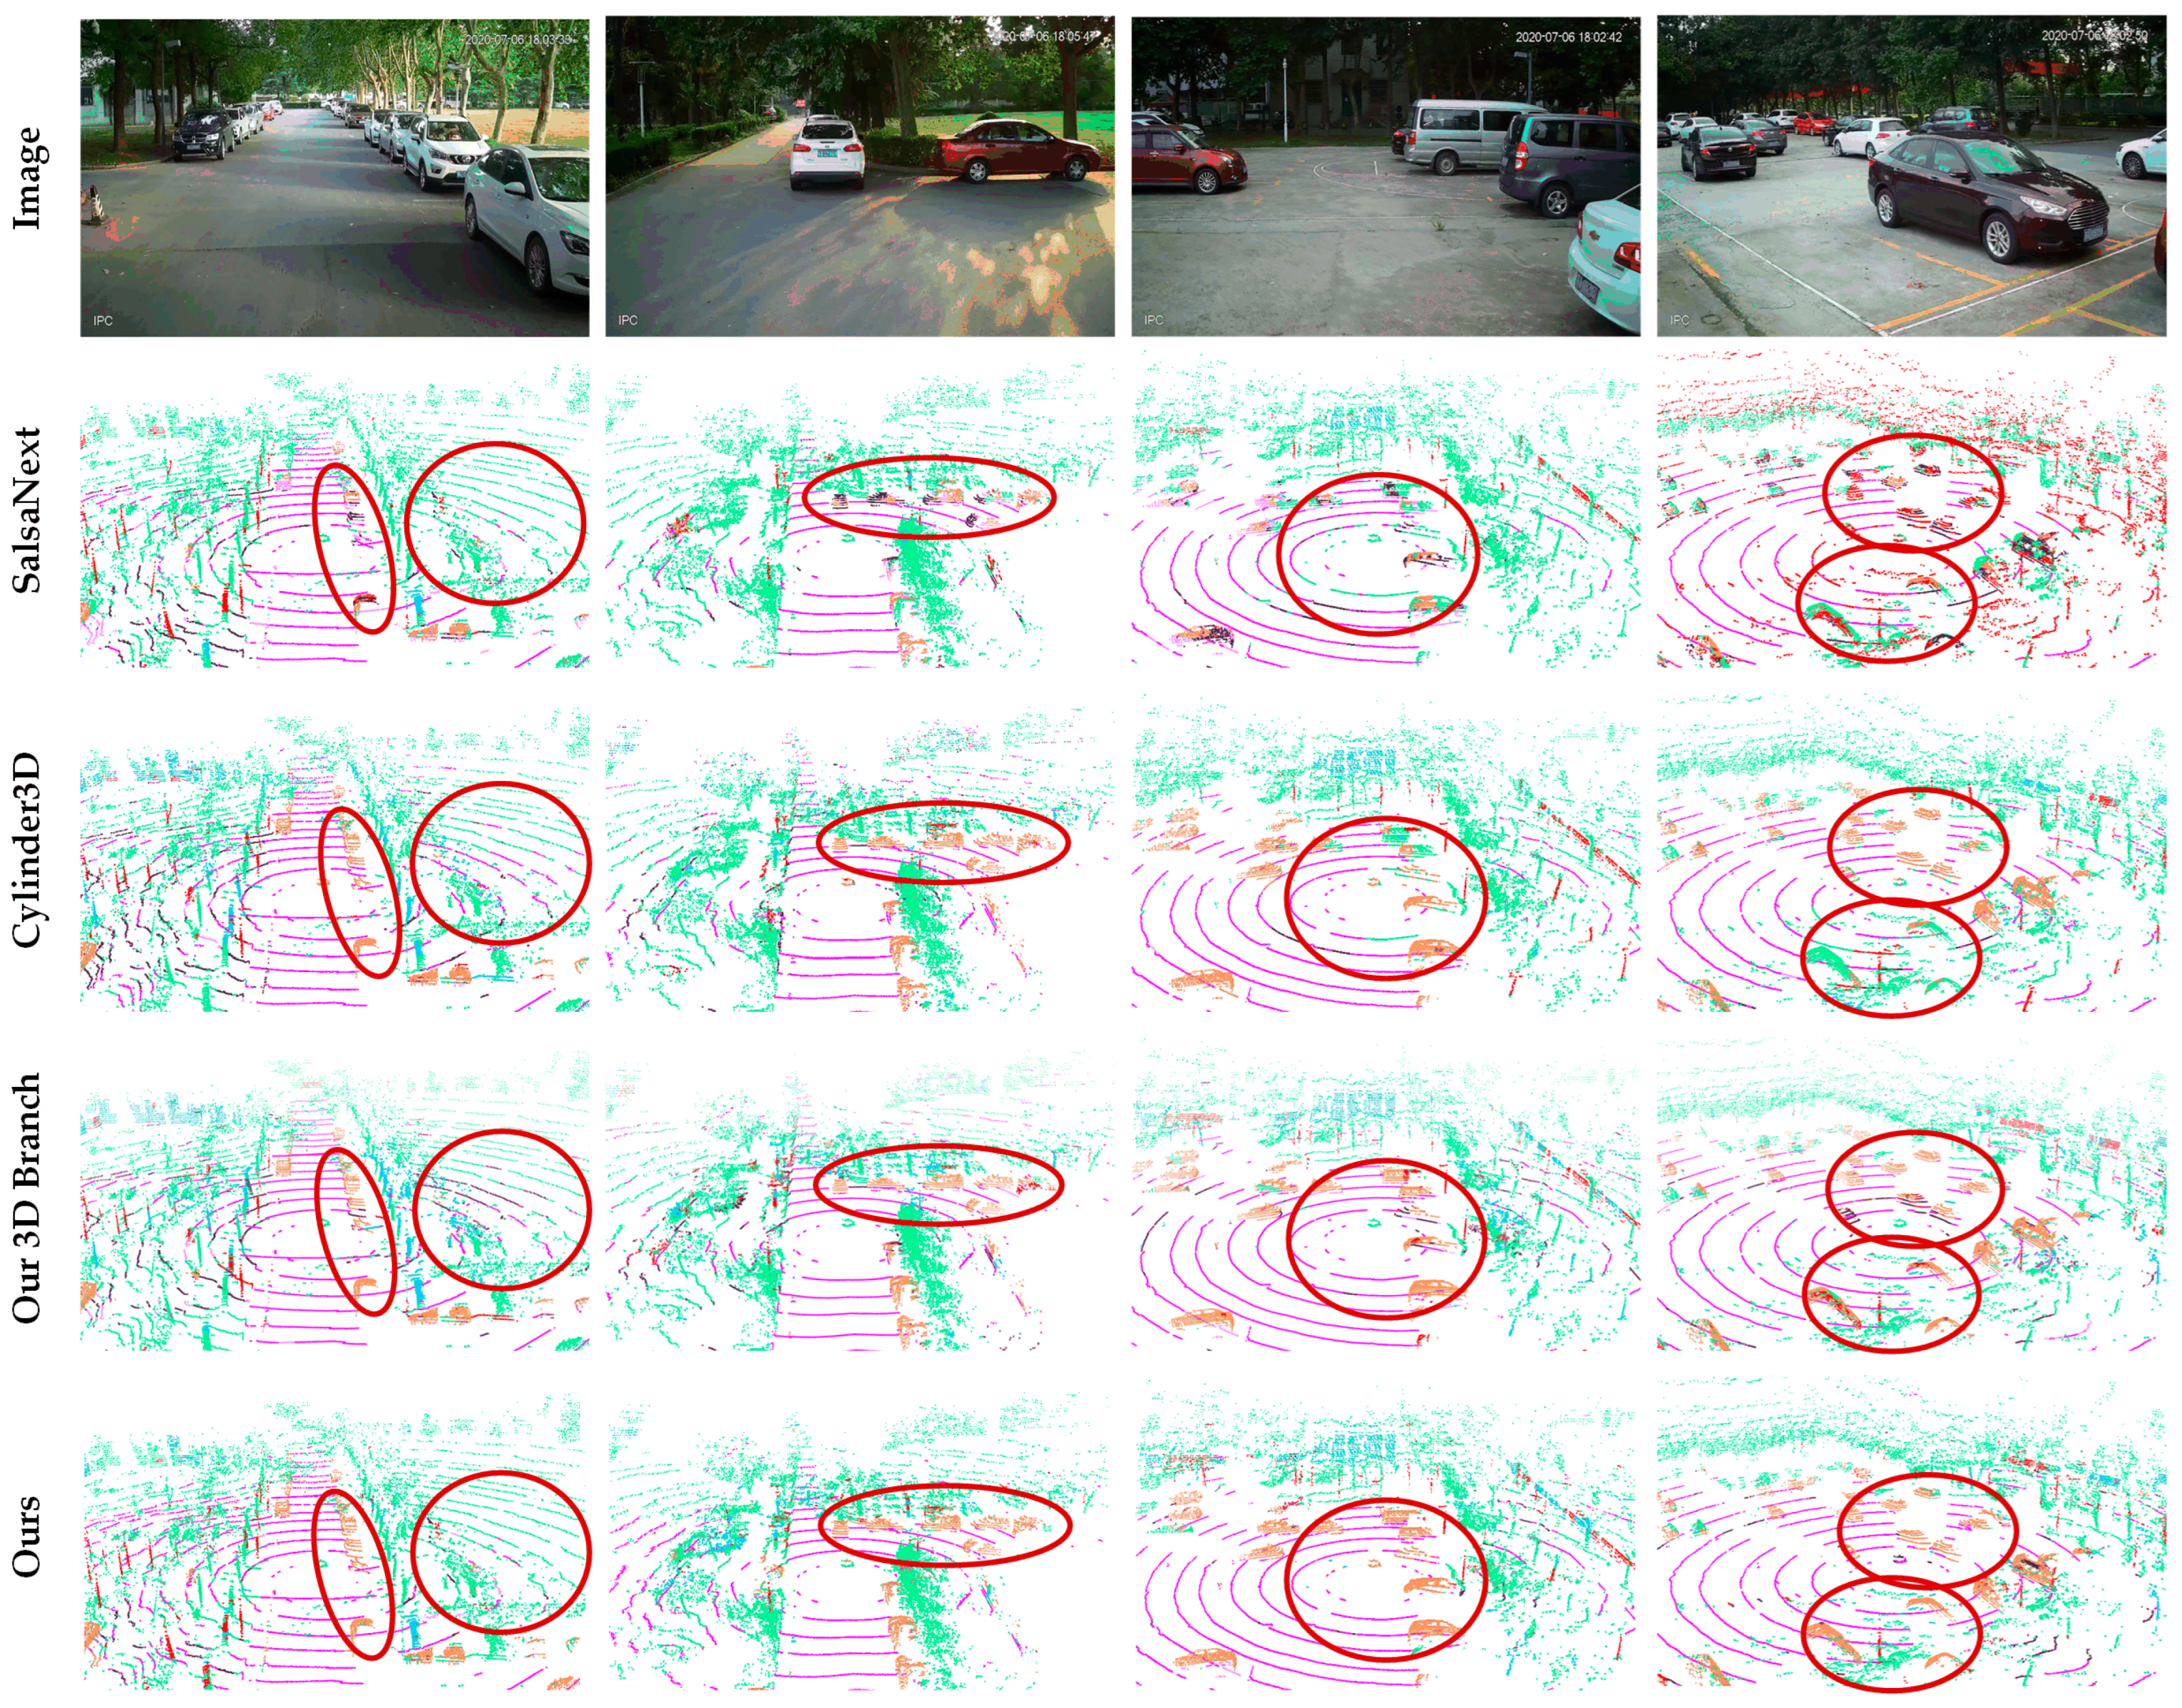
4.5. Comparative Results and Discussion of Our Test Set
4.6. Ablation Study
4.6.1. Effects of Cross-Modal Knowledge Distillation Module
4.6.2. Effects of Late Fusion Strategy
5. Discussion
6. Conclusions
Author Contributions
Funding
Data Availability Statement
Conflicts of Interest
References
- Kong, D.; Li, X.; Hu, Y.; Xu, Q.; Wang, A.; Hu, W. Learning a novel LiDAR submap-based observation model for global positioning in long-term changing environments. IEEE Trans. Ind. Electron. 2022, 70, 3147–3157. [Google Scholar] [CrossRef]
- Richa, J.P.; Deschaud, J.-E.; Goulette, F.; Dalmasso, N. AdaSplats: Adaptive Splatting of Point Clouds for Accurate 3D Modeling and Real-Time High-Fidelity LiDAR Simulation. Remote Sens. 2022, 14, 6262. [Google Scholar] [CrossRef]
- Li, Y.; Ma, L.; Zhong, Z.; Liu, F.; Chapman, M.A.; Cao, D.; Li, J. Deep learning for lidar point clouds in autonomous driving: A review. IEEE Trans. Neural Netw. Learn. Syst. 2020, 32, 3412–3432. [Google Scholar] [CrossRef]
- Zhao, L.; Zhou, H.; Zhu, X.; Song, X.; Li, H.; Tao, W. Lif-seg: Lidar and camera image fusion for 3d lidar semantic segmentation. IEEE Trans. Multimed. 2023, 26, 1158–1168. [Google Scholar] [CrossRef]
- Zhao, J.; Wang, Y.; Cao, Y.; Guo, M.; Huang, X.; Zhang, R.; Dou, X.; Niu, X.; Cui, Y.; Wang, J. The fusion strategy of 2D and 3D information based on deep learning: A review. Remote Sens. 2021, 13, 4029. [Google Scholar] [CrossRef]
- Cui, Y.; Chen, R.; Chu, W.; Chen, L.; Tian, D.; Li, Y.; Cao, D. Deep learning for image and point cloud fusion in autonomous driving: A review. IEEE Trans. Intell. Transp. Syst. 2021, 23, 722–739. [Google Scholar] [CrossRef]
- El Madawi, K.; Rashed, H.; El Sallab, A.; Nasr, O.; Kamel, H.; Yogamani, S. Rgb and lidar fusion based 3d semantic segmentation for autonomous driving. In Proceedings of the 2019 IEEE Intelligent Transportation Systems Conference (ITSC), Auckland, New Zealand, 27–30 October 2019; pp. 7–12. [Google Scholar]
- Zhang, R.; Li, G.; Li, M.; Wang, L. Fusion of images and point clouds for the semantic segmentation of large-scale 3D scenes based on deep learning. ISPRS J. Photogramm. Remote Sens. 2018, 143, 85–96. [Google Scholar] [CrossRef]
- Lee, J.-S.; Park, T.-H. Fast road detection by cnn-based camera–lidar fusion and spherical coordinate transformation. IEEE Trans. Intell. Transp. Syst. 2020, 22, 5802–5810. [Google Scholar] [CrossRef]
- Vora, S.; Lang, A.H.; Helou, B.; Beijbom, O. Pointpainting: Sequential fusion for 3d object detection. In Proceedings of the IEEE/CVF Conference on Computer Vision and Pattern Recognition, Seattle, WA, USA, 13–19 June 2020; pp. 4604–4612. [Google Scholar]
- Xu, S.; Zhou, D.; Fang, J.; Yin, J.; Bin, Z.; Zhang, L. Fusionpainting: Multimodal fusion with adaptive attention for 3d object detection. In Proceedings of the 2021 IEEE International Intelligent Transportation Systems Conference (ITSC), Indianapolis, IN, USA, 19–22 September 2021; pp. 3047–3054. [Google Scholar]
- Fang, F.; Zhou, T.; Song, Z.; Lu, J. MMCAN: Multi-Modal Cross-Attention Network for Free-Space Detection with Uncalibrated Hyperspectral Sensors. Remote Sens. 2023, 15, 1142. [Google Scholar] [CrossRef]
- Zhuang, Z.; Li, R.; Jia, K.; Wang, Q.; Li, Y.; Tan, M. Perception-aware multi-sensor fusion for 3d lidar semantic segmentation. In Proceedings of the IEEE/CVF International Conference on Computer Vision, Montreal, BC, Canada, 11–17 October 2021; pp. 16280–16290. [Google Scholar]
- Valada, A.; Mohan, R.; Burgard, W. Self-supervised model adaptation for multimodal semantic segmentation. Int. J. Comput. Vis. 2020, 128, 1239–1285. [Google Scholar] [CrossRef]
- Schieber, H.; Duerr, F.; Schoen, T.; Beyerer, J. Deep Sensor Fusion with Pyramid Fusion Networks for 3D Semantic Segmentation. In Proceedings of the 2022 IEEE Intelligent Vehicles Symposium (IV), Aachen, Germany, 5–9 June 2022; pp. 375–381. [Google Scholar]
- Jaritz, M.; Vu, T.-H.; Charette, R.D.; Wirbel, E.; Pérez, P. Xmuda: Cross-modal unsupervised domain adaptation for 3d semantic segmentation. In Proceedings of the IEEE/CVF Conference on Computer Vision and Pattern Recognition, Seattle, WA, USA, 13–19 June 2020; pp. 12605–12614. [Google Scholar]
- Behley, J.; Garbade, M.; Milioto, A.; Quenzel, J.; Behnke, S.; Stachniss, C.; Gall, J. Semantickitti: A dataset for semantic scene understanding of lidar sequences. In Proceedings of the IEEE/CVF International Conference on Computer Vision, Seoul, Republic of Korea, 27 October–2 November 2019; pp. 9297–9307. [Google Scholar]
- Jiang, P.; Osteen, P.; Wigness, M.; Saripalli, S. Rellis-3d dataset: Data, benchmarks and analysis. In Proceedings of the 2021 IEEE International Conference on robotics and AUTOMATION (ICRA), Xi’an, China, 30 May–5 June 2021; pp. 1110–1116. [Google Scholar]
- Qi, C.R.; Su, H.; Mo, K.; Guibas, L.J. Pointnet: Deep learning on point sets for 3d classification and segmentation. In Proceedings of the IEEE Conference on Computer Vision and Pattern Recognition, Honolulu, HI, USA, 21–26 July 2017; pp. 652–660. [Google Scholar]
- Thomas, H.; Qi, C.R.; Deschaud, J.-E.; Marcotegui, B.; Goulette, F.; Guibas, L.J. Kpconv: Flexible and deformable convolution for point clouds. In Proceedings of the IEEE/CVF International Conference on Computer Vision, Seoul, Republic of Korea, 27 October–2 November 2019; pp. 6411–6420. [Google Scholar]
- Hu, Q.; Yang, B.; Xie, L.; Rosa, S.; Guo, Y.; Wang, Z.; Trigoni, N.; Markham, A. Randla-net: Efficient semantic segmentation of large-scale point clouds. In Proceedings of the IEEE/CVF Conference on Computer Vision and Pattern Recognition, Seattle, WA, USA, 13–19 June 2020; pp. 11108–11117. [Google Scholar]
- Zhou, Y.; Tuzel, O. Voxelnet: End-to-end learning for point cloud based 3d object detection. In Proceedings of the IEEE Conference on Computer Vision and Pattern Recognition, Salt Lake City, UT, USA, 18–23 June 2018; pp. 4490–4499. [Google Scholar]
- Zhao, L.; Xu, S.; Liu, L.; Ming, D.; Tao, W. SVASeg: Sparse voxel-based attention for 3D LiDAR point cloud semantic segmentation. Remote Sens. 2022, 14, 4471. [Google Scholar] [CrossRef]
- Zhu, Z.; Li, X.; Xu, J.; Yuan, J.; Tao, J. Unstructured road segmentation based on road boundary enhancement point-cylinder network using LiDAR sensor. Remote Sens. 2021, 13, 495. [Google Scholar] [CrossRef]
- Tang, H.; Liu, Z.; Zhao, S.; Lin, Y.; Lin, J.; Wang, H.; Han, S. Searching efficient 3d architectures with sparse point-voxel convolution. In Proceedings of the European Conference on Computer Vision, Glasgow, UK, 23–28 August 2020; pp. 685–702. [Google Scholar]
- Zhu, X.; Zhou, H.; Wang, T.; Hong, F.; Li, W.; Ma, Y.; Li, H.; Yang, R.; Lin, D. Cylindrical and asymmetrical 3d convolution networks for lidar-based perception. IEEE Trans. Pattern Anal. Mach. Intell. 2021, 44, 6807–6822. [Google Scholar] [CrossRef] [PubMed]
- Zhang, C.; Luo, W.; Urtasun, R. Efficient convolutions for real-time semantic segmentation of 3d point clouds. In Proceedings of the 2018 International Conference on 3D Vision (3DV), Verona, Italy, 5–8 September 2018; pp. 399–408. [Google Scholar]
- Zhang, Y.; Zhou, Z.; David, P.; Yue, X.; Xi, Z.; Gong, B.; Foroosh, H. Polarnet: An improved grid representation for online lidar point clouds semantic segmentation. In Proceedings of the IEEE/CVF Conference on Computer Vision and Pattern Recognition, Seattle, WA, USA, 13–19 June 2020; pp. 9601–9610. [Google Scholar]
- Xian, G.; Ji, C.; Zhou, L.; Chen, G.; Zhang, J.; Li, B.; Xue, X.; Pu, J. Location-guided lidar-based panoptic segmentation for autonomous driving. IEEE Trans. Intell. Veh. 2022, 8, 1473–1483. [Google Scholar] [CrossRef]
- Cortinhal, T.; Tzelepis, G.; Erdal Aksoy, E. Salsanext: Fast, uncertainty-aware semantic segmentation of lidar point clouds. In Proceedings of the Advances in Visual Computing: 15th International Symposium, ISVC 2020, San Diego, CA, USA, 5–7 October 2020; Part II 15; pp. 207–222. [Google Scholar]
- Yin, X.; Li, X.; Ni, P.; Xu, Q.; Kong, D. A Novel Real-Time Edge-Guided LiDAR Semantic Segmentation Network for Unstructured Environments. Remote Sens. 2023, 15, 1093. [Google Scholar] [CrossRef]
- Chen, T.-H.; Chang, T.S. RangeSeg: Range-aware real time segmentation of 3D LiDAR point clouds. IEEE Trans. Intell. Veh. 2021, 7, 93–101. [Google Scholar] [CrossRef]
- Xu, W.; Li, X.; Ni, P.; Guang, X.; Luo, H.; Zhao, X. Multi-View Fusion Driven 3D Point Cloud Semantic Segmentation Based on Hierarchical Transformer. IEEE Sens. J. 2023, 23, 31461–31470. [Google Scholar] [CrossRef]
- Hinton, G.; Vinyals, O.; Dean, J. Distilling the knowledge in a neural network. arXiv 2015, arXiv:1503.02531. [Google Scholar]
- Hou, Y.; Ma, Z.; Liu, C.; Loy, C.C. Learning to steer by mimicking features from heterogeneous auxiliary networks. In Proceedings of the AAAI Conference on Artificial Intelligence, Honolulu, HI, USA, 27 January–1 February 2019; pp. 8433–8440. [Google Scholar]
- Hu, J.; Zhao, M.; Li, Y. Hyperspectral image super-resolution by deep spatial-spectral exploitation. Remote Sens. 2019, 11, 1229. [Google Scholar] [CrossRef]
- Hou, Y.; Ma, Z.; Liu, C.; Loy, C.C. Learning lightweight lane detection cnns by self attention distillation. In Proceedings of the IEEE/CVF International Conference on Computer Vision, Seoul, Republic of Korea, 27 October–2 November 2019; pp. 1013–1021. [Google Scholar]
- Chai, Y.; Fu, K.; Sun, X.; Diao, W.; Yan, Z.; Feng, Y.; Wang, L. Compact cloud detection with bidirectional self-attention knowledge distillation. Remote Sens. 2020, 12, 2770. [Google Scholar] [CrossRef]
- Yim, J.; Joo, D.; Bae, J.; Kim, J. A gift from knowledge distillation: Fast optimization, network minimization and transfer learning. In Proceedings of the IEEE Conference on Computer Vision and Pattern Recognition, Honolulu, HI, USA, 21–26 July 2017; pp. 4133–4141. [Google Scholar]
- Tung, F.; Mori, G. Similarity-preserving knowledge distillation. In Proceedings of the IEEE/CVF International Conference on Computer Vision, Seoul, Republic of Korea, 27 October–2 November 2019; pp. 1365–1374. [Google Scholar]
- Park, W.; Kim, D.; Lu, Y.; Cho, M. Relational knowledge distillation. In Proceedings of the IEEE/CVF Conference on Computer Vision and Pattern Recognition, Long Beach, CA, USA, 15–20 June 2019; pp. 3967–3976. [Google Scholar]
- Liu, Y.; Chen, K.; Liu, C.; Qin, Z.; Luo, Z.; Wang, J. Structured knowledge distillation for semantic segmentation. In Proceedings of the IEEE/CVF Conference on Computer Vision and Pattern Recognition, Long Beach, CA, USA, 15–20 June 2019; pp. 2604–2613. [Google Scholar]
- He, T.; Shen, C.; Tian, Z.; Gong, D.; Sun, C.; Yan, Y. Knowledge adaptation for efficient semantic segmentation. In Proceedings of the IEEE/CVF Conference on Computer Vision and Pattern Recognition, Long Beach, CA, USA, 15–20 June 2019; pp. 578–587. [Google Scholar]
- Hou, Y.; Zhu, X.; Ma, Y.; Loy, C.C.; Li, Y. Point-to-voxel knowledge distillation for lidar semantic segmentation. In Proceedings of the IEEE/CVF Conference on Computer Vision and Pattern Recognition, New Orleans, LA, USA, 18–24 June 2022; pp. 8479–8488. [Google Scholar]
- Wang, L.; Wu, J.; Huang, S.-L.; Zheng, L.; Xu, X.; Zhang, L.; Huang, J. An efficient approach to informative feature extraction from multimodal data. In Proceedings of the AAAI Conference on Artificial Intelligence, Honolulu, HI, USA, 27 January–1 February 2019; pp. 5281–5288. [Google Scholar]
- Zhao, L.; Peng, X.; Chen, Y.; Kapadia, M.; Metaxas, D.N. Knowledge as priors: Cross-modal knowledge generalization for datasets without superior knowledge. In Proceedings of the IEEE/CVF Conference on Computer Vision and Pattern Recognition, Seattle, WA, USA, 13–19 June 2020; pp. 6528–6537. [Google Scholar]
- Liu, Z.; Qi, X.; Fu, C.-W. 3d-to-2d distillation for indoor scene parsing. In Proceedings of the IEEE/CVF Conference on Computer Vision and Pattern Recognition, Nashville, TN, USA, 20–25 June 2021; pp. 4464–4474. [Google Scholar]
- Liu, Y.-C.; Huang, Y.-K.; Chiang, H.-Y.; Su, H.-T.; Liu, Z.-Y.; Chen, C.-T.; Tseng, C.-Y.; Hsu, W.H. Learning from 2d: Contrastive pixel-to-point knowledge transfer for 3d pretraining. arXiv 2021, arXiv:2104.04687. [Google Scholar]
- Xu, C.; Yang, S.; Galanti, T.; Wu, B.; Yue, X.; Zhai, B.; Zhan, W.; Vajda, P.; Keutzer, K.; Tomizuka, M. Image2point: 3d point-cloud understanding with 2d image pretrained models. arXiv 2021, arXiv:2106.04180. [Google Scholar]
- Chen, Z.; Li, Z.; Zhang, S.; Fang, L.; Jiang, Q.; Zhao, F. Bevdistill: Cross-modal bev distillation for multi-view 3d object detection. arXiv 2022, arXiv:2211.09386. [Google Scholar]
- Wang, J.; Sun, K.; Cheng, T.; Jiang, B.; Deng, C.; Zhao, Y.; Liu, D.; Mu, Y.; Tan, M.; Wang, X. Deep high-resolution representation learning for visual recognition. IEEE Trans. Pattern Anal. Mach. Intell. 2020, 43, 3349–3364. [Google Scholar] [CrossRef]
- Zhang, L.; Ma, K. Improve Object Detection with Feature-based Knowledge Distillation: Towards Accurate and Efficient Detectors. In Proceedings of the International Conference on Learning Representations, Virtual Event, 3–7 May 2021. [Google Scholar]
- Yang, Z.; Li, Z.; Jiang, X.; Gong, Y.; Yuan, Z.; Zhao, D.; Yuan, C. Focal and Global Knowledge Distillation for Detectors. arXiv 2021, arXiv:2111.11837. [Google Scholar]
- Dai, X.; Jiang, Z.; Wu, Z.; Bao, Y.; Zhou, E. General Instance Distillation for Object Detection. arXiv 2021, arXiv:2103.02340. [Google Scholar]


| Methods | Car | Bicycle | Motorcycle | Truck | Other Vehicle | Person | Bicyclist | Motorcyclist | Road | Parking | Sidewalk | Other Ground | Building | Fence | Vegetation | Trunk | Terrain | Pole | Traffic Sign | mIoU (%) | Time (ms) |
|---|---|---|---|---|---|---|---|---|---|---|---|---|---|---|---|---|---|---|---|---|---|
| RandLA-Net | 94.2 | 26.0 | 25.8 | 40.1 | 38.9 | 49.2 | 48.2 | 7.2 | 90.7 | 60.3 | 73.7 | 20.4 | 86.9 | 56.3 | 81.4 | 61.3 | 66.8 | 49.2 | 47.7 | 53.9 | 769 |
| KPConv | 96.0 | 30.2 | 42.5 | 33.4 | 44.3 | 61.5 | 61.6 | 11.8 | 88.8 | 61.3 | 72.7 | 31.6 | 95.0 | 64.2 | 84.8 | 69.2 | 69.1 | 56.4 | 47.4 | 58.8 | 263 |
| SPVNAS | 97.3 | 51.5 | 50.8 | 59.8 | 58.8 | 65.7 | 65.2 | 43.7 | 90.2 | 67.6 | 75.2 | 16.9 | 91.3 | 65.9 | 86.1 | 73.4 | 71 | 64.2 | 66.9 | 66.4 | 256 |
| Cylinder3D | 97.1 | 67.6 | 64.0 | 59.0 | 58.6 | 73.9 | 67.9 | 36.0 | 91.4 | 65.1 | 75.5 | 32.3 | 91.0 | 66.5 | 85.4 | 71.8 | 68.5 | 62.6 | 65.6 | 67.8 | 179 |
| PolarNet | 93.8 | 40.3 | 30.1 | 22.9 | 28.5 | 43.2 | 40.2 | 5.6 | 90.8 | 61.7 | 74.4 | 21.7 | 90.0 | 61.3 | 84.0 | 65.5 | 67.8 | 51.8 | 57.5 | 54.3 | 63 |
| SalsaNext | 91.9 | 48.3 | 38.6 | 38.9 | 31.9 | 60.2 | 59.0 | 19.4 | 91.7 | 63.7 | 75.8 | 29.1 | 90.2 | 64.2 | 81.8 | 63.6 | 66.5 | 54.3 | 62.1 | 59.5 | 42 |
| MPF | 93.4 | 30.2 | 38.3 | 26.1 | 28.5 | 48.1 | 46.1 | 18.1 | 90.6 | 62.3 | 74.5 | 30.6 | 88.5 | 59.7 | 83.5 | 59.7 | 69.2 | 49.7 | 58.1 | 55.5 | 35 |
| GFNet | 96.0 | 53.2 | 48.3 | 31.7 | 47.3 | 62.8 | 57.3 | 44.7 | 93.6 | 72.5 | 80.8 | 31.2 | 94.0 | 73.9 | 85.2 | 71.1 | 69.3 | 61.8 | 68.0 | 65.4 | 100 |
| AMVNet | 96.2 | 59.9 | 54.2 | 48.8 | 45.7 | 71.0 | 65.7 | 11.0 | 90.1 | 71.0 | 75.8 | 32.4 | 92.4 | 69.1 | 85.6 | 71.7 | 69.6 | 62.7 | 67.2 | 65.3 | - |
| Our 3D Branch | 96.4 | 54.3 | 51.2 | 48.1 | 49.1 | 65.3 | 64.8 | 36.2 | 93.8 | 74.5 | 78.2 | 33.7 | 93.2 | 70.6 | 86.2 | 72.1 | 69.0 | 65.2 | 69.3 | 66.9 | 83 |
| Ours | 97.1 | 66.8 | 58.8 | 54.3 | 59.0 | 66.4 | 66.3 | 80.0 | 93.7 | 79.8 | 79.1 | 40.2 | 95.1 | 74.8 | 85.9 | 73.7 | 68.7 | 66.5 | 69.5 | 72.4 | 83 |
| Methods | Car | Bicycle | Motorcycle | Truck | Other Vehicle | Person | Bicyclist | Motorcyclist | Road | Parking | Sidewalk | Other Ground | Building | Fence | Vegetation | Trunk | Terrain | Pole | Traffic Sign | mIoU (%) | Time (ms) |
|---|---|---|---|---|---|---|---|---|---|---|---|---|---|---|---|---|---|---|---|---|---|
| RGBAL | 87.9 | 36.8 | 26.4 | 63.8 | 54.6 | 58.0 | 72.0 | 0.0 | 94.6 | 43.6 | 77.5 | 0.7 | 78.9 | 52.7 | 84.3 | 60.8 | 72.9 | 56.1 | 39.5 | 55.9 | 12 |
| xMUDA | 93.2 | 11.9 | 33.3 | 72.6 | 51.8 | 68.0 | 61.3 | 0.0 | 95.7 | 36.4 | 78.6 | 0.1 | 86.2 | 57.1 | 78.7 | 69.0 | 74.5 | 59.5 | 37.2 | 56.1 | 33 |
| PMF | 94.6 | 49.0 | 62.0 | 68.2 | 72.5 | 68.7 | 66.1 | 0.0 | 96.3 | 44.3 | 80.4 | 0.0 | 87.8 | 56.8 | 87.6 | 71.2 | 72.7 | 64.8 | 43.5 | 62.4 | 27 |
| Ours | 97.5 | 40.4 | 77.4 | 94.2 | 73.4 | 73.3 | 93.4 | 0.0 | 94.1 | 51.1 | 82.1 | 0.2 | 91.6 | 64.9 | 87.2 | 67.3 | 71.7 | 65.9 | 49.0 | 67.1 | 21 |
| Methods | Grass | Tree | Pole | Water | Vehicle | Log | Person | Fence | Bush | Concrete | Barrier | Puddle | Mud | Rubble | mIoU (%) | Time (ms) |
|---|---|---|---|---|---|---|---|---|---|---|---|---|---|---|---|---|
| RandLA-Net | 62.1 | 76.7 | 42.8 | 0 | 34.8 | 6.3 | 82.9 | 10.2 | 69.8 | 72.8 | 54.3 | 17.6 | 8.5 | 1.7 | 38.6 | 769 |
| Cylinder3D | 64.9 | 76.5 | 63.8 | 0 | 50.3 | 5.5 | 87.0 | 11.8 | 71.8 | 80.4 | 80.5 | 33.0 | 10.6 | 2.3 | 45.6 | 149 |
| SPVNAS | 64.1 | 76.1 | 54.4 | 0 | 48.6 | 15.1 | 85.8 | 11.0 | 71.5 | 70.0 | 64.8 | 22.4 | 8.5 | 5.2 | 42.7 | 167 |
| SalsaNext | 65.3 | 79.6 | 44.3 | 0 | 26.6 | 22.2 | 84.4 | 13.5 | 73.6 | 77.9 | 63.7 | 26.0 | 11.6 | 6.6 | 42.5 | 25 |
| GFNet | 64.3 | 76.4 | 49.8 | 0 | 34.4 | 21.5 | 83.1 | 12.6 | 72.4 | 73.5 | 79.3 | 24.2 | 10.1 | 7.2 | 43.6 | 83 |
| Our 3D Branch | 66.1 | 80.3 | 50.4 | 0 | 32.4 | 24.6 | 85.7 | 15.2 | 72.4 | 73.8 | 78.3 | 24.6 | 10.4 | 9.2 | 44.5 | 71 |
| RGBAL * | 63.7 | 68.7 | 49.9 | 0 | 28.9 | 12.4 | 82.3 | 6.3 | 72.9 | 70.2 | 64.2 | 23.7 | 10.9 | 6.8 | 40.1 | 11 |
| xMUDA * | 64.4 | 71.6 | 54.3 | 0 | 23.3 | 15.1 | 82.7 | 6.0 | 73.3 | 70.8 | 64.2 | 24.4 | 11.2 | 5.4 | 40.5 | 29 |
| PMF * | 65.9 | 80.1 | 60.4 | 0 | 26.4 | 12.8 | 85.4 | 10.4 | 73.5 | 82.0 | 67.8 | 23.6 | 11.9 | 7.6 | 43.4 | 28 |
| Ours | 66.8 | 80.7 | 66.3 | 0 | 31.2 | 27.3 | 86.5 | 19.6 | 73.5 | 82.0 | 81.6 | 28.6 | 15.7 | 9.6 | 47.8 | 71 |
| Row | Module | mIoU (%) | ||||
|---|---|---|---|---|---|---|
| 3D Branch | CMKD | LF | ||||
| FA | F and D | AM | ||||
| 1 | √ | 63.0 | ||||
| 2 | √ | √ | 62.8 | |||
| 3 | √ | √ | D | 63.7 | ||
| 4 | √ | √ | √ | 65.4 | ||
| 5 | √ | √ | √ | √ | 66.0 | |
| 6 | √ | √ | √ | √ | E | 66.6 |
| 7 | √ | √ | √ | √ | √ | 67.1 |
Disclaimer/Publisher’s Note: The statements, opinions and data contained in all publications are solely those of the individual author(s) and contributor(s) and not of MDPI and/or the editor(s). MDPI and/or the editor(s) disclaim responsibility for any injury to people or property resulting from any ideas, methods, instructions or products referred to in the content. |
© 2024 by the authors. Licensee MDPI, Basel, Switzerland. This article is an open access article distributed under the terms and conditions of the Creative Commons Attribution (CC BY) license (https://creativecommons.org/licenses/by/4.0/).
Share and Cite
Ni, P.; Li, X.; Xu, W.; Zhou, X.; Jiang, T.; Hu, W. Robust 3D Semantic Segmentation Method Based on Multi-Modal Collaborative Learning. Remote Sens. 2024, 16, 453. https://doi.org/10.3390/rs16030453
Ni P, Li X, Xu W, Zhou X, Jiang T, Hu W. Robust 3D Semantic Segmentation Method Based on Multi-Modal Collaborative Learning. Remote Sensing. 2024; 16(3):453. https://doi.org/10.3390/rs16030453
Chicago/Turabian StyleNi, Peizhou, Xu Li, Wang Xu, Xiaojing Zhou, Tao Jiang, and Weiming Hu. 2024. "Robust 3D Semantic Segmentation Method Based on Multi-Modal Collaborative Learning" Remote Sensing 16, no. 3: 453. https://doi.org/10.3390/rs16030453
APA StyleNi, P., Li, X., Xu, W., Zhou, X., Jiang, T., & Hu, W. (2024). Robust 3D Semantic Segmentation Method Based on Multi-Modal Collaborative Learning. Remote Sensing, 16(3), 453. https://doi.org/10.3390/rs16030453