
Tiger Habitat Quality Modelling in Malaysia with Sentinel-2 and InVEST
by
 , ,
, ,
Valentin Louis
1, 
Susan E. Page
1,
Kevin J. Tansey
1,
Laurence Jones
2,
Konstantina Bika
1 and
Heiko Balzter
1,3,*
1
School of Geography, Geology and the Environment, Institute for Environmental Futures, University of Leicester, Space Park Leicester, 92 Corporation Road, Leicester LE4 5SP, Leicestershire, UK
2
UK Centre for Ecology & Hydrology, Environment Centre Wales, Deiniol Road, Bangor LL57 2UW, Gwynedd, UK
3
National Centre for Earth Observation, University of Leicester, University Road, Leicester LE1 7RH, Leicestershire, UK
*
Author to whom correspondence should be addressed.
Remote Sens. 2024, 16(2), 284; https://doi.org/10.3390/rs16020284
Submission received: 19 September 2023
/
Revised: 17 December 2023
/
Accepted: 26 December 2023
/
Published: 10 January 2024
(This article belongs to the Topic Earth Observation-Based Ecosystem Services in Support of Planet SDGs)
Abstract
:Deforestation is a threat to habitat quality and biodiversity. In intact forests, even small levels of deforestation can have profound consequences for vertebrate biodiversity. The risk hotspots are Borneo, the Central Amazon, and the Congo Basin. Earth observation (EO) now provides regular, high-resolution satellite images from the Copernicus Sentinel missions and other platforms. To assess the impact of forest conversion and forest loss on biodiversity and habitat quality, forest loss in a tiger conservation landscape in Malaysia is analysed using Sentinel-2 imagery and the InVEST habitat quality model. Forest losses are identified from satellites using the random forest classification and validated with PlanetScope imagery at 3–5 m resolution for a test area. Two scenarios are simulated using InVEST, one with and one without the forest loss maps. The outputs of the InVEST model are maps of tiger habitat quality and habitat degradation in northeast Peninsular Malaysia. In addition to forest loss, OpenStreetMap road vectors and the GLC2000 land-cover map are used to model habitat sensitivity to threats from roads, railways, water bodies, and urban areas. The landscape biodiversity score simulation results fall sharply from ~0.8 to ~0.2 for tree-covered land cover when forest loss is included in the habitat quality model. InVEST makes a reasonable assumption that species richness is higher in pristine tropical forests than in agricultural landscapes. The landscape biodiversity score is used to compare habitat quality between administrative areas. The coupled EO/InVEST modelling framework presented here can support decision makers in reaching the targets of the Kunming-Montreal Global Biodiversity Framework. Forest loss information is essential for the quantification of habitat quality and biodiversity in tropical forests. Next generation ecosystem service models should be co-developed alongside EO products to ensure interoperability.

1. Introduction
Biodiversity monitoring using a harmonized set of EO-derived indicators is still in its infancy [1,2,3,4], and researchers are still developing techniques to address these issues. For example, the “Group on Earth Observations Biodiversity Observation Network” (GEO BON) is an international effort that brings together the remote sensing community with ecologists to create a common understanding of how EO products can be linked to biodiversity datasets to produce essential biodiversity variables (EBVs). Biodiversity survey methods using satellites continue to evolve. The first task is to define a set of variables that are derivable from space-borne sensors and are helpful for biodiversity monitoring [5]. With the status quo, this is still a challenge because biodiversity has no explicit physical unit of measurement for fine- and coarse-resolution satellite data. Therefore, the EO and ecology communities need to agree on a standard set of EO-related essential biodiversity variables [5].
Turner et al. [6] reviewed the ways in which remote sensing data can be used for biodiversity science and conservation and discussed different sensor types and their possible applications. Lausch et al. [7] propose the use of EO for assessing taxonomic diversity, functional diversity and structural diversity, which integrate different levels of organisation from molecular to species, population, and landscape level. They suggest using EO-based spectral traits and spectral trait variations for biodiversity assessments.
Skidmore and Pettorelli [1] suggested ten potential variables to support biodiversity monitoring. These are (i) species occurrence; (ii) plant traits, e.g., specific leaf area and leaf nitrogen content; (iii) ecosystem distribution; (iv) fragmentation and heterogeneity; (v) land cover; (vi) vegetation height; (vii) fire occurrence; (viii) vegetation phenology; (ix) primary productivity and leaf area index; and (x) inundation [1]. These variables partially overlap with currently suggested EBV classes [1] (EBV candidate examples in brackets), such as (i) species population (e.g., species distribution, population abundance), (ii) species traits (e.g., phenology, morphology, physiology), (iii) ecosystem function (e.g., net primary productivity, secondary productivity, nutrient retention, disturbance regime), and (iv) ecosystem structure (e.g., habitat structure, ecosystem extent, and fragmentation, ecosystem composition by functional type) [1,8,9]. These EBVs support the objectives and indicators of the United Nations Convention on Biological Diversity (UNCBD).
Earth observation can be used primarily in three different ways for monitoring and mapping biodiversity:
Land Cover: IUCN published a good practice guidance report on tools for monitoring, modelling, and assessing global ecosystem services [10]. This systematic assessment of available tools focuses on available ecosystem service models. Earth observation data feature only as a source of land-cover maps within the current guidance because land-cover data can feed directly into several ecosystem service models. Land-cover types are often assigned ecosystem-service value functions in order to quantify them.
Vegetation Indices: Onyia et al. [11] demonstrated a more direct way of assessing biodiversity from EO data through a new vegetation index called the normalized difference vegetation vigour index (NDVVI). Their application to a site in Nigeria showed that the NDVVI-based model gave much more accurate predictions of species diversity than traditional narrowband vegetation indices (R2 for Shannon’s diversity index = 0.54 for NDVVI).
Biophysical Variables: EO data products that are now being produced operationally include a wide range of biophysical variables, such as forest biomass, soil moisture, fraction of absorbed photosynthetically active radiation (fAPAR), and others. Many of these variables are suitable indicators for biodiversity.
The UNCBD was established in Rio de Janeiro, Brazil, in 1992 and the Aichi biodiversity targets are part of the strategic plan for the period 2011–2020, which has three main objectives: (i) the conservation of biological diversity, (ii) the sustainable use of the components of biological diversity, and (iii) the fair and equitable sharing of benefits arising from the utilization of genetic resources. The Kunming-Montreal Global Biodiversity Framework was adopted in December 2022 by the Conference of the Parties (COP 15) to the United Nations Convention on biological diversity. It describes 23 action-oriented global targets for urgent action over the decade to 2030, of which 8 are related to reducing threats to biodiversity. In particular, it commits the world to protect and restore at least 30% of the land and inland water areas by 2030 for biodiversity and ecosystem functions and services.
Malaysia is recognised as 1 of 36 biodiversity hotspots on Earth (Sundaland). The Malaysian flora includes at least 1500 endemic vascular plant species. Still, the country has lost at least 70% of its original primary vegetation, primarily due to oil palm expansion and other agricultural uses [12]. Reasons for deforestation in Malaysia include industrial logging, large-scale commercial oil palm plantations and agribusiness, road construction, and large dam building projects [13].
We selected a tiger conservation landscape in Malaysia to develop the methods presented here because Malaysia has set out to meet 17 of the 20 Aichi targets by 2025. The country has experienced a high loss of forest cover due to the expansion of oil palm and other agricultural uses. Target 10, for example, includes illegal harvesting, and target 15 aims to increase capacity to implement national and subnational biodiversity strategies, which can be supported by monitoring vegetation phenology using remote sensing. Applications of phenology and change detection metrics derived from EO also supports monitoring of target 4 on the sustainable management of forest and agricultural resources and target 11 on improving the monitoring and management of invasive species (Table A1 in Appendix A). Information on ecosystem structure falls under strategic goals B, C, and D [1]. Unlike the overall Aichi biodiversity targets, the country-specific targets for Malaysia do not include all targets (i.e., Targets 18–20 are not covered) and the year by which Malaysia aims to achieve these targets is 2025 instead of 2020 [14].
The main threats to the few remaining wild tiger populations are habitat loss and degradation. For example, tiger populations in India have been found to rely mostly on habitat quality and prey availability rather than the conservation status of the area [15]. Early approaches to modelling tiger populations used capture–recapture models and camera trapping data [16] and other non-spatial approaches, but more recently, spatially explicit assessments of habitat quality have gained acceptance.
Tiger habitat in China was modelled with an ensemble of ecological niche factor analyses, resource selection functions, and an expert habitat suitability model by Hebblewhite et al. [17] to assess how many tigers that landscape could sustain. They used a simple ensemble habitat modelling approach that averaged three habitat models (ecological niche factor analysis, resource selection function, and expert-based habitat suitability index) and spatial data layers from a digital elevation model and a land-cover map (3 forest types and a human-dominated land-cover type); net primary productivity derived from EO; and road networks and settlements as inputs. Two complementary data-driven empirical models based on tiger data in the Russian Far East were extrapolated to Northeast China [17].
Other authors have used population viability analysis (PVA) to simulate tiger habitats in northeast China [18] and Sumatra [19]. PVA simulates the interactions between influencing factors and the likelihood that a population will become extinct within a specified time frame. One of these studies [18] simulated the effects of poaching, habitat quality, habitat loss, habitat fragmentation, and conservation interventions on the population viability of the Amur tiger with the PVA software RAMAS/GIS. The other study [19] sought to get unbiased estimates of the proportion of area occupied by tigers from observations in 440 grid cells using a PRESENCE model that was then incorporated into a logistic regression against 7 landscape factors.
Agent-based models have also been applied to simulate tiger populations, e.g., using a model implemented in NetLogo 5.0.4 to simulate tiger populations in Nepal [20]. In the model, tiger territories are modelled based on the tigers’ perception of habitat quality and from their interactions with other individual male or female tigers in habitat grid cells comprising the landscape, the male and female tigers, and the tiger territories [20].
A study using the integrated valuation of environmental services and trade-offs (InVEST) model for habitat quality based on land-cover data showed that areas of high tiger habitat quality in Sumatra also provided vital ecosystem services in the form of carbon storage and sediment retention [21]. InVEST is a suite of ecosystem service models and the Sumatra study [21] used the carbon storage and sequestration, water yield, sediment retention, nutrient retention, and tiger habitat quality models. Tiger habitat quality is expressed as a score between zero and one and is a function of the suitability of a given land-use/land-cover class as a habitat for tigers and the spatial distribution of threats to the habitat integrity.
Some recent studies have explored multiple ecosystem service outcomes together. A study of Liaoning Province examined the driving forces of land expansion and their impacts on carbon storage and habitat quality using the patch-generating land-use simulation (PLUS) model under scenarios of natural development, ecological protection, and economic development [22].
The performance of tiger habitat models can be scale-dependent [23]. A recent study has adopted multi-scale habitat suitability models to inform tiger conservation efforts on suitable tiger habitats by providing information regarding scale-dependent habitat-species relationships using a random forest algorithm for predictions under current and future climatic scenarios [24].
Random forest is a machine learning algorithm that creates a large ensemble of randomised decision trees in order to simulate a training dataset [25]. Machine learning “…is a discipline focused on two interrelated questions: How can one construct computer systems that automatically improve through experience? and What are the fundamental statistical-computational-information-theoretic laws that govern all learning systems, including computers, humans, and organizations?” [26]. Many machine learning algorithms have been developed and have found applications in almost all aspects of research. Machine learning has found widespread uses because it is able to provide plausible representations of datasets based on a model that learns the structure and relationships in the data. Advances in computing power have greatly widened access to these methods.
Tiger populations in Malaysia (as elsewhere in the world) now survive largely in forest habitats and are threatened by forest loss and fragmentation [27]. Habitat quality has been discussed extensively in the literature. Johnson [28] reviews the debate on measuring bird habitat quality. He concludes that habitat quality can be measured in two ways: (i) by measuring attributes of bird populations or (ii) by measuring relevant properties of the habitat itself. This study adopted the latter approach. The objective was to develop a method for monitoring tiger habitat quality using a continuous EO data stream from the Sentinel-2 satellites combined with a spatially explicit habitat quality model within the InVEST toolbox developed by the Natural Capital Project [29]. Our approach was designed to dynamically update habitat quality maps with the latest available detections of forest loss from Sentinel-2. This goes beyond the static assessment of tiger habitat quality by Bhagabati et al. for Sumatra [21] and similar studies. The landscape units selected here are district-level administrative units and land-cover categories. The advantage of this approach is that habitat quality and biodiversity scores can be comparable across landscape units. However, these units may be incomplete when considering the ecosystem approach because biodiversity is both a component of ecosystems and supports ecosystem services, and the administrative units might not cover the whole ecosystem extent. The implementation of the ecosystem approach for biodiversity monitoring has increased since the Convention on Biological Diversity, but general guidance is lacking [30]. International efforts to agree on a set of standardised key biodiversity variables based on EO are ongoing. They include the development of the United Nations System of Environmental–Economic Accounting (UN SEEA) and the Group on Earth Observations (GEO) Biodiversity Observing Network (GEOBON) initiative, who are seeking to establish frameworks and standards for integrating EO data into biodiversity monitoring in a coherent way. SEEA has been developing statistical standards for frameworks and guidelines for integrating natural capital, ecosystem services, and economics [31]. The SEEA Central Framework sets an international statistical standard for measuring the environment and its relationship with the economy in the areas of environmental flows, stocks of environmental assets, and economic activity related to the environment. The Group on Earth Observations is actively using the SEEA framework to advance the methods of EA using EO for natural capital accounting through the Earth Observation for Ecosystem Accounting (EO4EA) initiative.
One of the challenges in assessing habitat quality using EO data is how to combine in situ ecological data with remotely sensed data [32]. Indirectly derived EO datasets (e.g., land cover, land surface temperature) are commonly used to model species distribution. Higher-resolution EO data can be used to estimate species population sizes [32]. Bush et al. [33] suggested that, with the increasingly fine spatial resolution of EO sensors allowing for reliable upscaling combined with new species identification methods, such as metabarcoding and acoustic trapping and more reliable species distribution models, the potential for using EO data to improve biodiversity mapping has never been greater [33]. One of EO’s most widely known biodiversity monitoring services is the Landsat-based Global Forest Watch biodiversity intactness layer [34].
In this study, we analyse two scenarios for assessing land-cover change using habitat quality as a proxy for biodiversity. Scenario 1 uses the InVEST model for habitat quality, which focuses on the effects of infrastructure (roads, railroads), human settlements, and agricultural activities on habitat quality. Scenario 2 adds an additional level of human activities in the form of logging. Using EO data, we estimate habitat conditions and use it to create a district-level biodiversity score. To do this, we use land cover, species habitat, and forest cover loss data as inputs to the InVEST habitat quality model.
The aims of this study were to (1) test the feasibility of using EO-derived forest cover loss in combination with InVEST as a tool for monitoring the habitat condition as a proxy for biodiversity, using the EO data in combination with the InVEST habitat quality model, and (2) analyse the contribution of forest loss data in a biodiversity monitoring framework.
2. Materials and Methods
2.1. Study Area
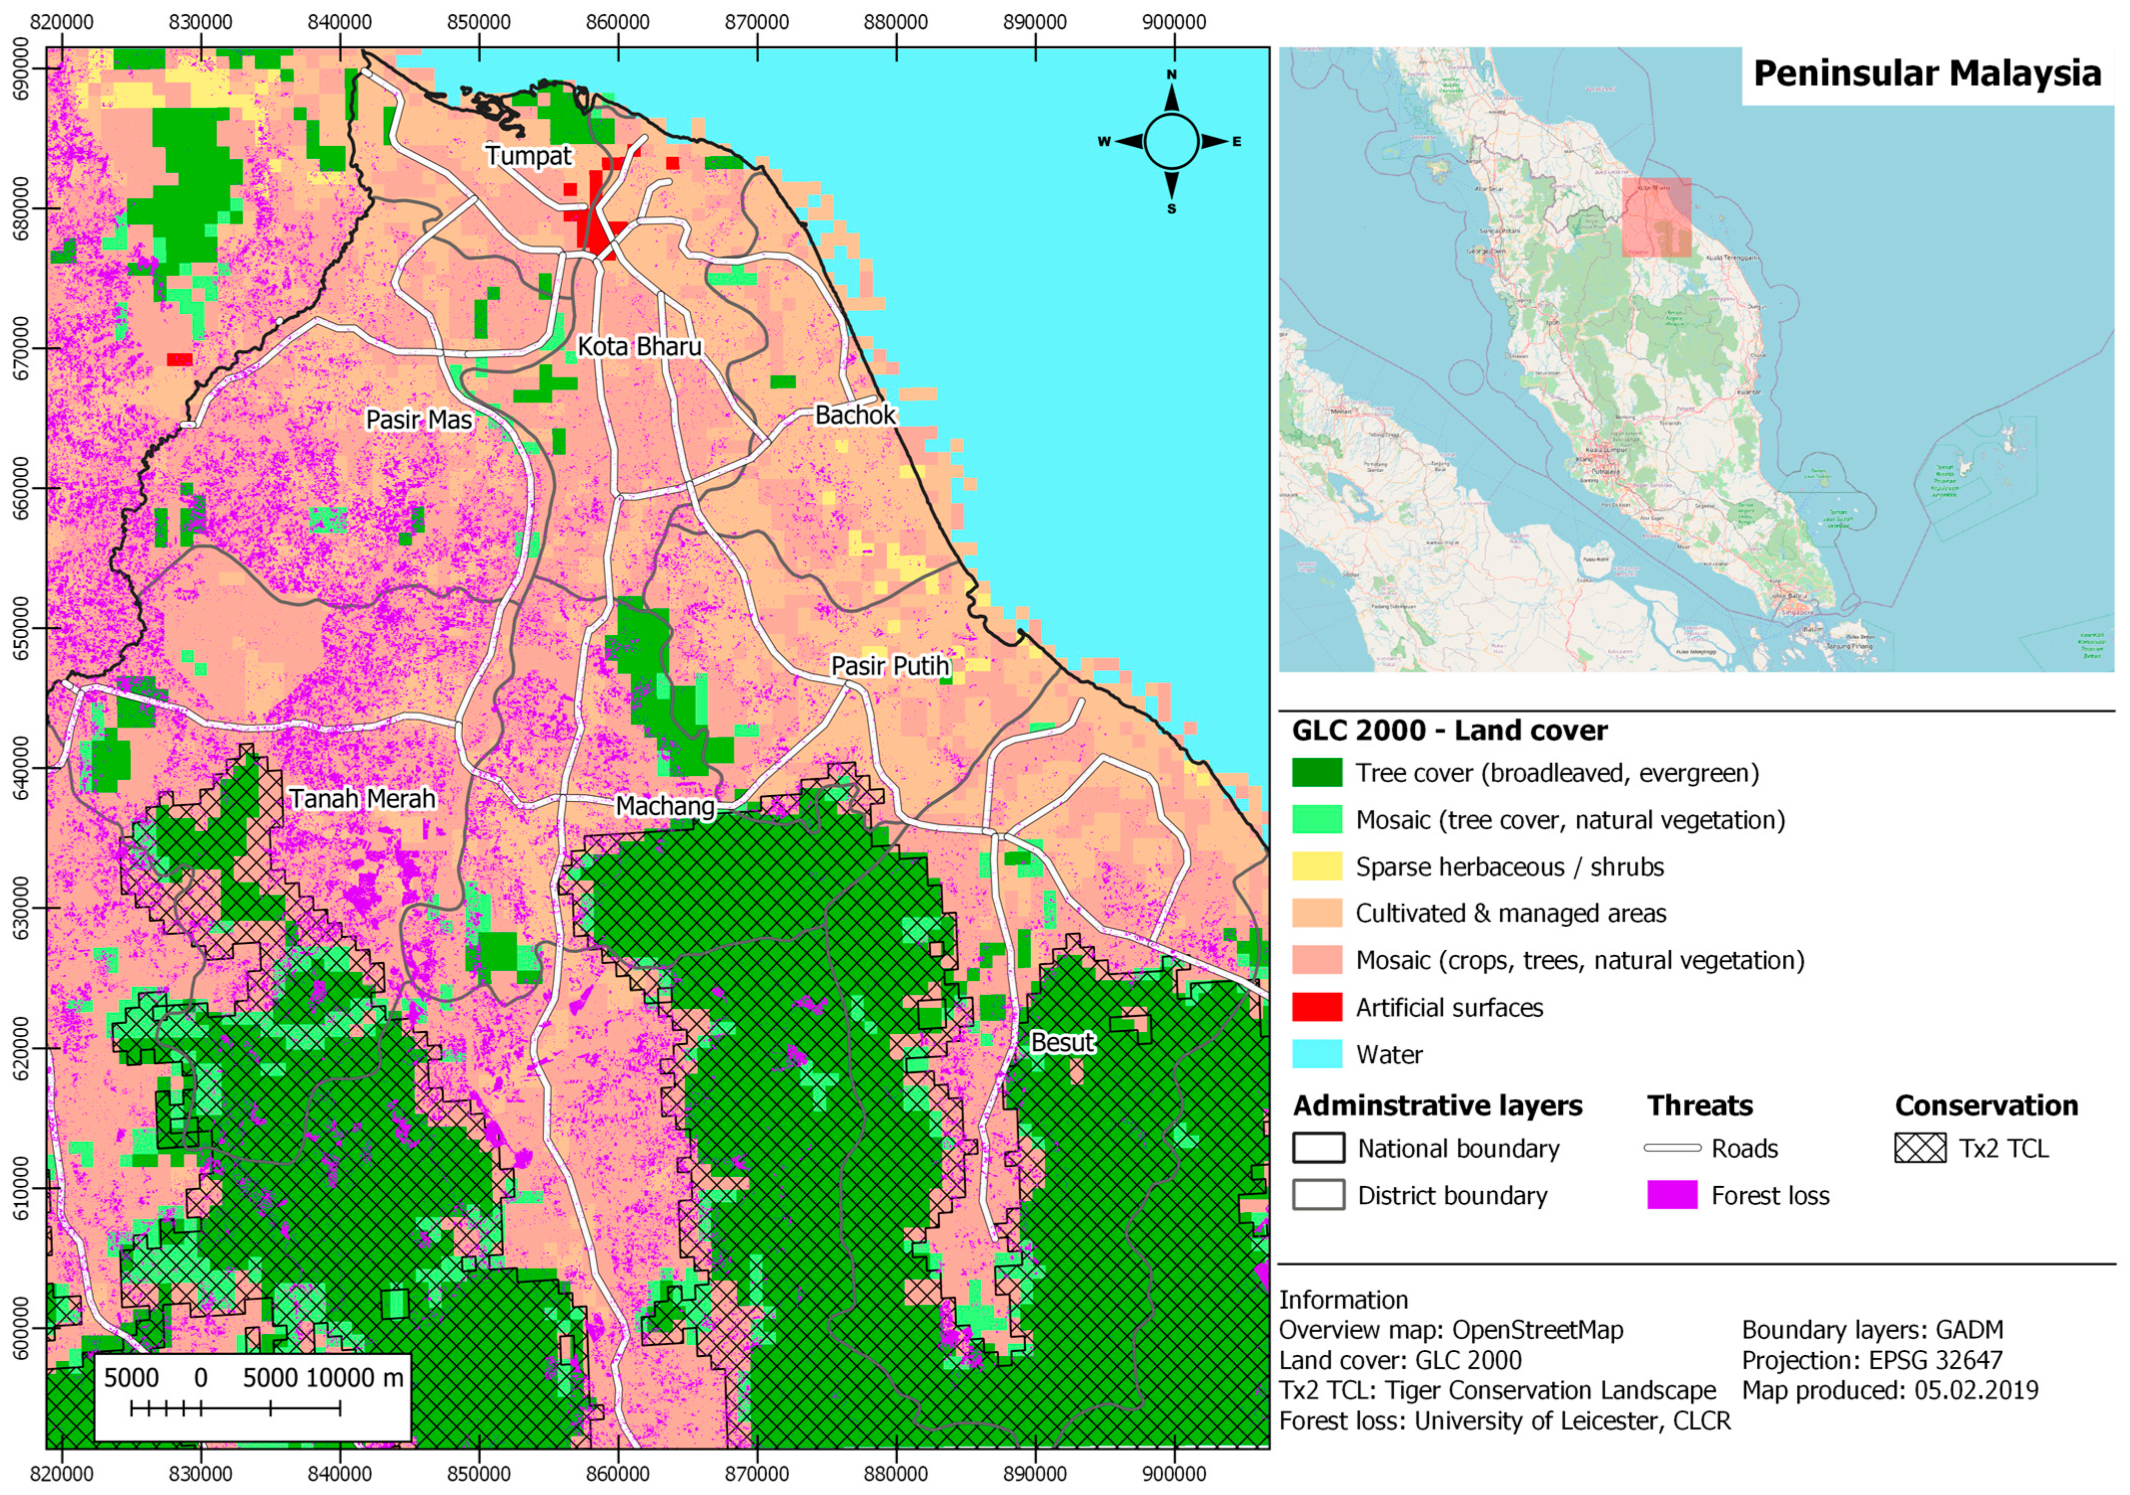
We selected a study area in the northeastern district of Terengganu in Peninsular Malaysia and its neighbouring districts in the bordering province of Kelantan (Figure 1). Eight districts in Terengganu and Kelantan were selected to summarize the pixel-based data into biodiversity scores and illustrate this analysis’s wider application. These are Besut in Terengganu, Pasir Putih, Bachok, Kota Bharu, Machang, Tanah Merah, Pasir Mas, and Tumpat in Kelantan (Figure 1).
Seven land-cover classes dominate these eight districts according to GLC2000 [35]: (1) tree cover (broadleaved, evergreen), (2) mosaic (tree cover/other natural vegetation), (3) sparse herbaceous or sparse shrub, (4) cultivated and managed areas (including tree crops, annual crops, and irrigated and non-irrigated crops), (5) mosaic (cropland/tree cover/other natural vegetation), (6) water bodies (natural and artificial), and (7) artificial surfaces in the sense of built-up areas (Figure 1). For a more detailed description of the class definitions in the GLC2000 land-cover dataset see Stibig et al. [36].
Figure 1.
Land cover from the GLC2000 dataset [36], forest loss derived from Sentinel-2 imagery as well as the Tx2 tiger conservation landscape (TCL).
Figure 1.
Land cover from the GLC2000 dataset [36], forest loss derived from Sentinel-2 imagery as well as the Tx2 tiger conservation landscape (TCL).
2.2. Data
2.2.1. Forest Cover Loss Maps
Forest cover loss maps were created from Sentinel-2 imagery for 2017 and 2018 using the PYEO Python library v0.7 [37,38]. The Sentinel-2 satellite constellation consists of two satellites with a combined image acquisition frequency of 5 days, mapping the Earth’s surface in different wavelengths at 10 m, 20 m, and 60 m spatial resolution. The 13 spectral bands range from visible light to shortwave infrared [39]. The mission is part of the Copernicus programme of the European Space Agency and the European Commission. Sentinel-2A was the first satellite launched on 23 June 2015, and its twin satellite (Sentinel-2B) followed almost two years later on 7 March 2017 [40]. Sentinel-2 data for 2017 and 2018 were obtained from the Copernicus Open Access Data Hub (https://scihub.copernicus.eu/dhus/#/home, accessed on 16 March 2021), regardless of cloud cover. All Sentinel-2 spectral bands at 20 m spatial resolution were used. These are the blue, green, and red bands (B2, B3, and B4); the red-edge bands (B5, B6, and B7); the narrowband near-infrared band (B8a); and the short-wave infrared bands (B11 and B12). All bands were processed to bottom-of-atmosphere reflectance (BOA) using Sen2COR as described in the methods section. These Sentinel-2 bands offer better spectral information for vegetation monitoring than Landsat 8 due to the red-edge bands (B5, B6, B7) and the narrowband near-infrared band (B8a). We used the GLC 2000 land-cover map only to determine the land-cover types for the InVEST model but not in the forest change detection, which was based only on the spectral signatures of forest cover loss from Sentinel-2 data.
The change detection algorithm in Figure 2 recursively downloads the latest Sentinel-2 image and feeds it into the Sen2COR version 2.5.0 atmospheric correction algorithm. The Sen2COR algorithm provides a scene classification that is reclassified to create a cloud mask, which in turn is used to remove clouds, cloud shadows, and erroneous pixels from the atmospherically corrected Sentinel-2 L2A BOA image. The image is processed at a spatial resolution of 20 m and includes nine spectral bands representing surface reflectance. The new incoming and pre-processed image is then stacked to a multitemporal image using a least-cloudy mosaic created from a time series of images from 2016 to 2017. The least-cloudy mosaic was created using the Sen2Three plug-in to the SNAP software in ‘temporal homogeneity’ mode [41]. Sen2Three is a level 3 processor for the Spatiotemporal Synthesis of bottom of atmosphere corrected Sentinel-2 level 2a images.
A change detection model was built using multiple image pairs with different time intervals and at multiple locations. Training data were manually collected from these image pairs, and a random forest model was trained by fitting the model with the best possible combination of parameters. The model classified land cover-change dynamics between two images. The class of primary interest in this analysis was the change from ‘forest to non-forest’. Mapped changes were accumulated to increase the certainty that detected changes in forest/tree cover were valid [42]. All spatially explicit input data were converted to binary rasters (i.e., 0’ s and 1’ s) and reprojected to WGS84 UTM Zone 47N (see EPSG code 32647), and all data were resampled at 20 m spatial resolution to match the Sentinel-2-derived forest cover loss data.
2.2.2. Global Land-Cover 2000 Dataset
2.2.3. Tx2 Tiger Conservation Landscape Data
Tigers in Malaysia live mainly in forested areas and are threatened by forest loss and habitat fragmentation [27]. Data on 29 Tx2 tiger conservation landscapes (Tx2 TCLs) were used (see Figure 2), which were different priority areas distributed across South, Southeast, and East Asia. These are defined as areas where the wild tiger population could double by 2020 through the implementation of effective conservation and management measures. The global number of wild tigers has declined from an estimated 100,000 in the early 1900s to approximately 3500 adult animals [43]. In response to this rapid decline, government officials convened in November 2010 to endorse the St. Petersburg Declaration, pledging to double the wild tiger population by 2020. In total, 29 tiger conservation landscapes were identified, one in Peninsular Malaysia [44]. This is called Taman Negara—Belum and has an area of 4,918,100 ha (49,181 km2), of which a small part is in Thailand. This area could potentially support a tiger population of approximately 148 individuals, assuming that the area consists entirely of tropical evergreen forests [45]. The current tiger population in Malaysia is estimated to be around 250 to 340 individuals, an estimated 90% decline compared to the 1950 estimate, when about 3000 individuals were counted [46]. The tiger is an umbrella species because it is at the top of the food chain and suitable for managing biodiversity. Conservation of tiger habitats, such as tropical moist forests in Malaysia, simultaneously protects numerous other species [47,48]. Where the tiger population is stable, recovering, and/or increasing, it is assumed to indicate a healthy and functioning ecosystem [45,49]. The tiger species is sensitive to habitat fragmentation, habitat loss, and poaching [45]. Moreover, it can be assumed that the tiger’s habitat generally supports high levels of biodiversity [43,45].
2.2.4. Validation Data
The accuracy of the forest cover loss was assessed using confusion matrix, overall accuracy, and producer’s and user’s accuracy. Detailed explanations of these accuracy metrics can be found in [50]. We used high spatial-resolution Planet Scope [51] satellite images as validation data. The subset is a forest reserve located in the north of the province of Terengganu (Figure 3). The elevation ranges from 35 m to 890 m a.s.l. The forest reserve is surrounded by small holder farming systems in the east and industrial plantations in the west. The Sentinel-2 mosaic consists of almost two years of available Sentinel-2A imagery. This forest is part of a conservation project called Tx2 TCL (tiger conservation landscape), which aims at doubling the tiger population [43,44].
A validation dataset was created using a stratified random sampling strategy and visual interpretation of Planet Dove data (www.planet.com, accessed on 1 November 2023). For each class, i.e., ‘change’ and ‘no change’, 300 points were sampled, and a new class was created, also with 300 points, following the methodology by Olofsson et al. [52] (Figure 3). The new class was a 20 m spatial zone encompassing areas of ‘potential forest change’ around the ‘change’ class and was created to reduce omission errors resulting from the visual validation of forest changes. Planet imagery that fit a similar date range of change detection was selected for validation. The image used to evaluate change detection accuracy was acquired on 16 February 2018.
2.3. Accuracy Assessment of Forest Cover Loss
The accuracy score values reported in this report are a confusion matrix, from which precision, recall and F1 were derived. The confusion matrix provides information on the proportion of true positives (TP), true negatives (TN), false positives (FP), and false negatives (FN). User’s (precisions), producer’s (recall), and overall accuracies can be derived from the confusion matrix. User accuracy indicates the probability that a pixel classified into a particular category represents that category in the Planet data. In contrast, producer accuracy indicates how well the training set of pixels was classified for the coverage type.
To compute the precision, the following equation was used [53]:
where TP were the true positives and FP were the false positives. The precision score indicates how well the classifier can avoid labelling a sample as positive when it is negative. Precision answers the following question: “How many of the detected changes are real?”
To derive the recall score, we used following equation [53]:
Instead of summing up the true and false positives, the true positives are divided by the sum of true positives (TP) and false negatives (FN), giving insight into how well the classifier can find all positive examples. In simple terms, recall answers the question: “How many of the real changes are found by the algorithm?” The range is from 0 to 1, with 0 being the lowest and 1 being the highest score.
The F1 score was explicitly developed for binary classification problems. It can be interpreted as a harmonised average of precision and recall with a range of scores from 0 to 1, where 0 is the worst and 1 is the best. The F1 score is a balanced assessment of the performance of an algorithm. Suppose a user expects high precision (a few false positives). In that case, an algorithm can be tuned to lower the recall with various filters (which increases the number of false negatives or changes missed). The F1 score (Equation (3)) will stay very similar [53].
The change detection algorithm has an overall accuracy of 82.33%, with user accuracies of 90.33% and 74.33% (with respective producer’s accuracies of 88.49% and 77.87%). This means that, compared to the Planet dataset, the Sentinel-2 algorithm estimates forest well but produces a false positive rate (or commission error) of 25.6%, resulting in higher rates of false alerts (Table 1). The higher number of validation points (348 points, Table 1) distributed within the Sentinel-2-only detected changes indicates that the algorithm produces a larger area of detected forest loss. This could be due to the subpixel sensitivity to changes in surface reflectance and the algorithm being trained to detect minor changes. Moreover, the results indicate that the use of the additional class of ‘potential forest change’ significantly reduced the omission error while increasing the overall accuracy of change detection, a finding that is in accord with Olofsson et al. [52].
With respect to the accuracy scores in the confusion matrix (Table 1), the precision score shows that the Sentinel-2-derived forest loss is 77.87% and a recall score of 90.33%, resulting in an F1 score of 83.63%.
2.4. Habitat Quality Modelling with InVEST
The data required to run the InVEST habitat quality model are (i) land use/land cover; (ii) threat maps, threat impact distance, and their relative impact weights with linear or exponential decay functions for each habitat; (iii) habitat sensitivity to threats (here, impact factors); (iv) the semi-saturation constant that sets the dispersion and central tendency of quality scores; and (v) habitat suitability. In this way, habitat quality and degradation can be derived based on the intensity of the threat and the sensitivity of the habitat/species. The results consisted of a habitat degradation index and a habitat quality index (HQI). The values used in this study for the different parameters are described in Table 2. Impact factors were selected according to their respective habitat suitability value; if the suitability was high, then it was assumed that the impact of disturbances was high and vice versa. The overall impact decreased with decreasing habitat suitability. The values were taken from the InVEST User Manual [29] and adjusted according to Alkemade et al. [54]. Habitat sensitivity of tree-covered areas was greatest for the effects of tree loss (0.9), followed by urban areas and roads (0.8), because they provide access to people; to a lesser extent, railways (0.7); and water bodies (0.6). Mosaic vegetation (tree cover, natural vegetation) is considered somewhat less sensitive to all these impact factors than tree-covered areas because tiger habitat in this land-cover category is already impacted. For the same reasons, we set even lower values for sparse herbaceous/shrubby areas, managed areas, and mosaics of crops, trees, and natural vegetation.
Optionally, data on conservation status and baseline land-cover data can be included to derive a relative index of habitat rarity and indices of baseline degradation and quality. The threat decay function is required because the disturbances have a dispersion effect on the neighbouring areas. The distance function can be either linear or exponential. The exponential function leads to very narrow corridors of impacts on habitat quality that do not adequately reflect current knowledge of the large effects of habitat fragmentation on tiger habitat quality. Hence, a linear decay function was selected here (Table 3), where threat was the threat level provided in grid format and max_dist was the maximum distance in km over which the threat would impact habitat by increasing accessibility to areas along the road. Decay describes the function used to simulate how the threat impacts the habitat over the maximum distance. Like the sensitivity values in Table 2, the threat values are set by the user of the InVEST habitat quality model and are subject to a degree of expert opinion. We assumed that impacts from urban areas, roads, and railways extended furthest into tiger habitat (7 km) because they created access routes for people that pose a greater threat. For similar reasons, the weights of these threats were the highest (0.9 for roads, 0.75 for railways, and 0.85 for urban areas). While the resulting habitat quality maps respond with some elasticity to changes in sensitivity and threat parameters, our pilot study showed that overall landscape patterns do not change dramatically with minor changes in these values.
The distance decay value for roads and rails was adapted from Alkemade et al. [54]. The study states that exponential functions are more representative of ecological processes. However, this study chose a linear decay function with half the distance value [54] to account for reduced spatial impact. The linear function was chosen because the exponential decay function showed no effects.
Two InVEST habitat quality modelling experiments were carried out based on different scenarios:
- Scenario 1 focused on the impact of transportation infrastructure (roads, rail), human settlements, and agricultural activities on habitat quality.
- Scenario 2 included all the identified impacts from scenario 1 but additionally considered the impacts on habitat quality from forest cover loss from Sentinel-2 satellite imagery.
The InVEST habitat quality model defines habitat quality as “the resources and conditions present in an area that produce occupancy—including survival and reproduction—by a given organism”. The habitat quality model implemented in this case study did not focus on a single specific species but rather on biodiversity in a more general sense. Therefore, two scenarios with different threats were selected, including different land-cover types that are suitable habitats for various species. Scenario 1 of the InVEST habitat quality model focused on the impacts of infrastructure (roads, railroads), human settlements, and agricultural activities on habitat quality. Scenario 2 added another layer of human activity in terms of logging. Habitat quality was calculated using the following, Equation (4) [29]:
where Qxj was habitat quality per pixel x and per suitable habitat type j, Hj was habitat suitability per land cover (here 0 or 1 for Yes or No), Dxj was habitat degradation, and z and k were scaling parameters set to 2.5 and max(Dxj)/2, respectively [29]. The initial value for k was set to the default value of 0.05 for the first run, as recommended in the InVEST user manual [29], and subsequently changed to the max(Dxj)/2 parameter for the following runs. This ensured that habitat quality maps were produced with the greatest variation on the 0 to 1 scale [29].
Qxj = Hj (1 − (Dzxj/Dzxj + kz),
Forest cover loss events and roads were presented as general threats and were included in the habitat degradation equation (Equation (5), [29]). Habitat degradation Dxj is calculated on a pixel level for each suitable habitat type , considering the overall threat level as follows [29]:
where represents all threats for each raster map r indexed by y, Yr indicates the set of grid cells on the respective rasters, wr is the relative impact of the given threat, irxy represents the distance of each suitable habitat type to the threat source and its impact across space. It can be linear or exponential [29]. The parameter βx is a potential mitigating factor representing possible conservation measures that reduce the impact of threats on certain habitats. However, for this study, βx could be disregarded because no input for this information was given for the model. The relative sensitivity of each habitat type to each threat was given by [29].
Dxj = ΣRr = 1 ΣYry = 1 (wr/ΣRr = 1 wr)ry irxy βx Sjr,
Landscape biodiversity scores (LBSs) were calculated to make the outputs of the habitat quality model comparable and to provide guidance to decision-makers on where to focus their potential conservation efforts. These results were aggregated: on one hand, administrative boundaries were used to aggregate HQI values, and on the other hand, GLC2000 land-cover classes were used to represent a habitat or landscape unit. The LBS was calculated by aggregating the habitat quality scores from Equation (1) using the average per habitat, landscape, or district [29].
3. Results
3.1. Change Detection—Mapping Forest Cover Loss
Most forest cover loss was observed in Pasir Mas, Tanah Merah, and Machang districts (Figure 4).
Most of these forest cover loss detections are in the land-cover class of ‘crops, trees, and other natural vegetation’ mosaic. A similar pattern emerges in the district of Besut, where most forest cover loss events occur in mosaic landscapes of crops, trees, and other natural vegetation. The remaining districts (Pasir Putih, Kota Bharu, Tumpat, and Bachok) show the least detected forest cover loss events. This is because only a small amount of forest remains in these districts; the difference could also result from different crops and tree species being cultivated along the coastal areas compared to the land-locked areas.
This could lead to differences in the frequency of logging in managed tree plantations in Pasir Mas, Machang, Tanah Merah, and Besut. For example, oil palm plantations generally have a life cycle of about 25–30 years before the mature oil palms are replaced [54], while pulp and paper (acacia) plantations have a rotation frequency of about eight years in the first rotation and about six years in the second rotation [55]. The map of forest cover loss in Figure 4 shows that even in tiger-protected areas, there is some forest loss, especially at the edges of the protected areas, which is of concern for the habitat quality of the tiger populations in those areas.
Figure 5 shows the area distribution of detected tree cover loss per aggregated land-cover class across the study area. The majority of forest cover loss occurred in the class ‘mosaic of crops, trees, and natural vegetation’ (~65%), followed by the cultivated and managed areas (~22%). Forest cover loss detections from Sentinel-2 in the GLC class tree cover are in third place (~7%). The landscape ‘mosaic of tree cover and natural vegetation’ showed ~5% forest cover loss. Less than 1% of detected forest cover loss occurs in the sparse herbaceous/shrubs, artificial surfaces, and water bodies. These losses may either be the result of misclassifications in the tree cover loss data, or the errors may be attributed to differences in spatial resolution between the Sentinel-2-derived forest cover loss data (20 m × 20 m) and the GLC2000 dataset (1000 m × 1000 m). Given the sensitivity of tiger populations to fine-scale habitat fragmentation, the choice of sufficiently high spatial resolution of input data is important for obtaining a realistic map of habitat quality.
3.2. Habitat Quality Model
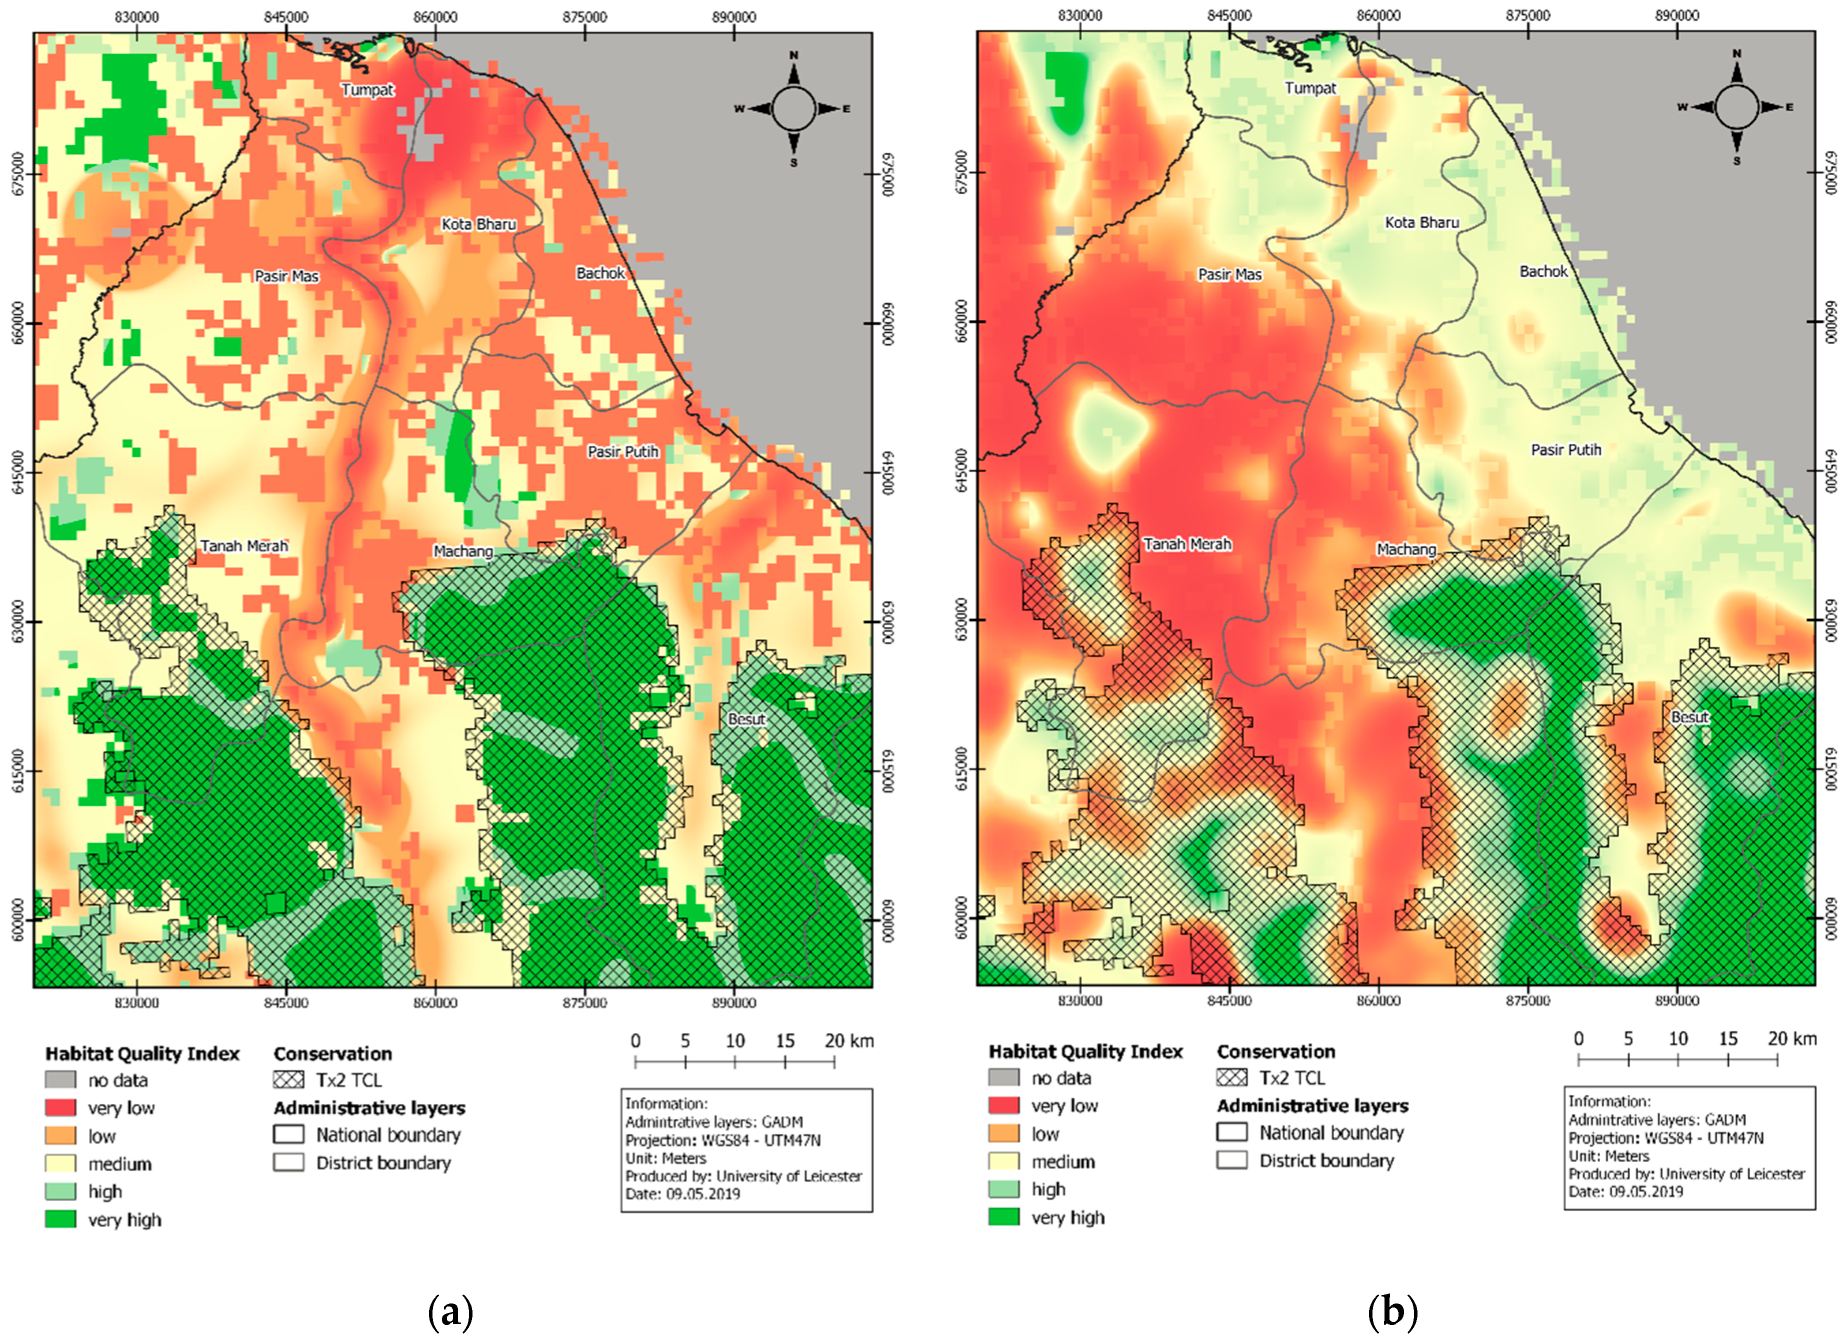
The resulting habitat quality index from the two model scenarios is presented in Figure 6 and then summarized at the administrative level (Table A1) and for the seven land-cover categories (Figure 7).
3.2.1. Habitat Quality Index (HQI)
The HQI is shown in Figure 6. On the left, the results are based only on infrastructure data, while those on the right include data on forest cover loss. Regarding Figure 6a, the distribution of the severely degraded habitats follows the pattern along the infrastructure data and the land-use pattern of lower habitat quality in the northern and north-eastern parts of the study area. Most of the tiger conservation landscape project described in Section 2.2.3. is forested and shows very high values of HQI, except for areas along the rivers showing high HQI values, and the edges of the forested areas show medium HQI values. The spatial distribution of HQI values in Figure 6b differs significantly from Figure 6a. The additional threat of logging and plantation-management practices results in highly degraded habitats in the central and western parts of the study area. Lower HQI values do not occur deep inside the forested tiger conservation landscape. However, a similarity between both scenarios is accessibility. This is evident in both figures by the distribution of medium-to-very low HQI values, mostly along the forest edges and along rivers. Because of the decay function of habitat quality near a threat (such as a road or settlement), there is a strong decline in tiger habitat quality along the edges of the tiger conservation landscape.
Figure 6.
(a) The map on the left shows the resulting habitat quality index distribution of scenario 1, which includes infrastructure (roads, rail roads), human settlements and agricultural data. (b) The map on the right shows the results for scenario 2, where forest cover loss is added as an additional driver of habitat degradation.
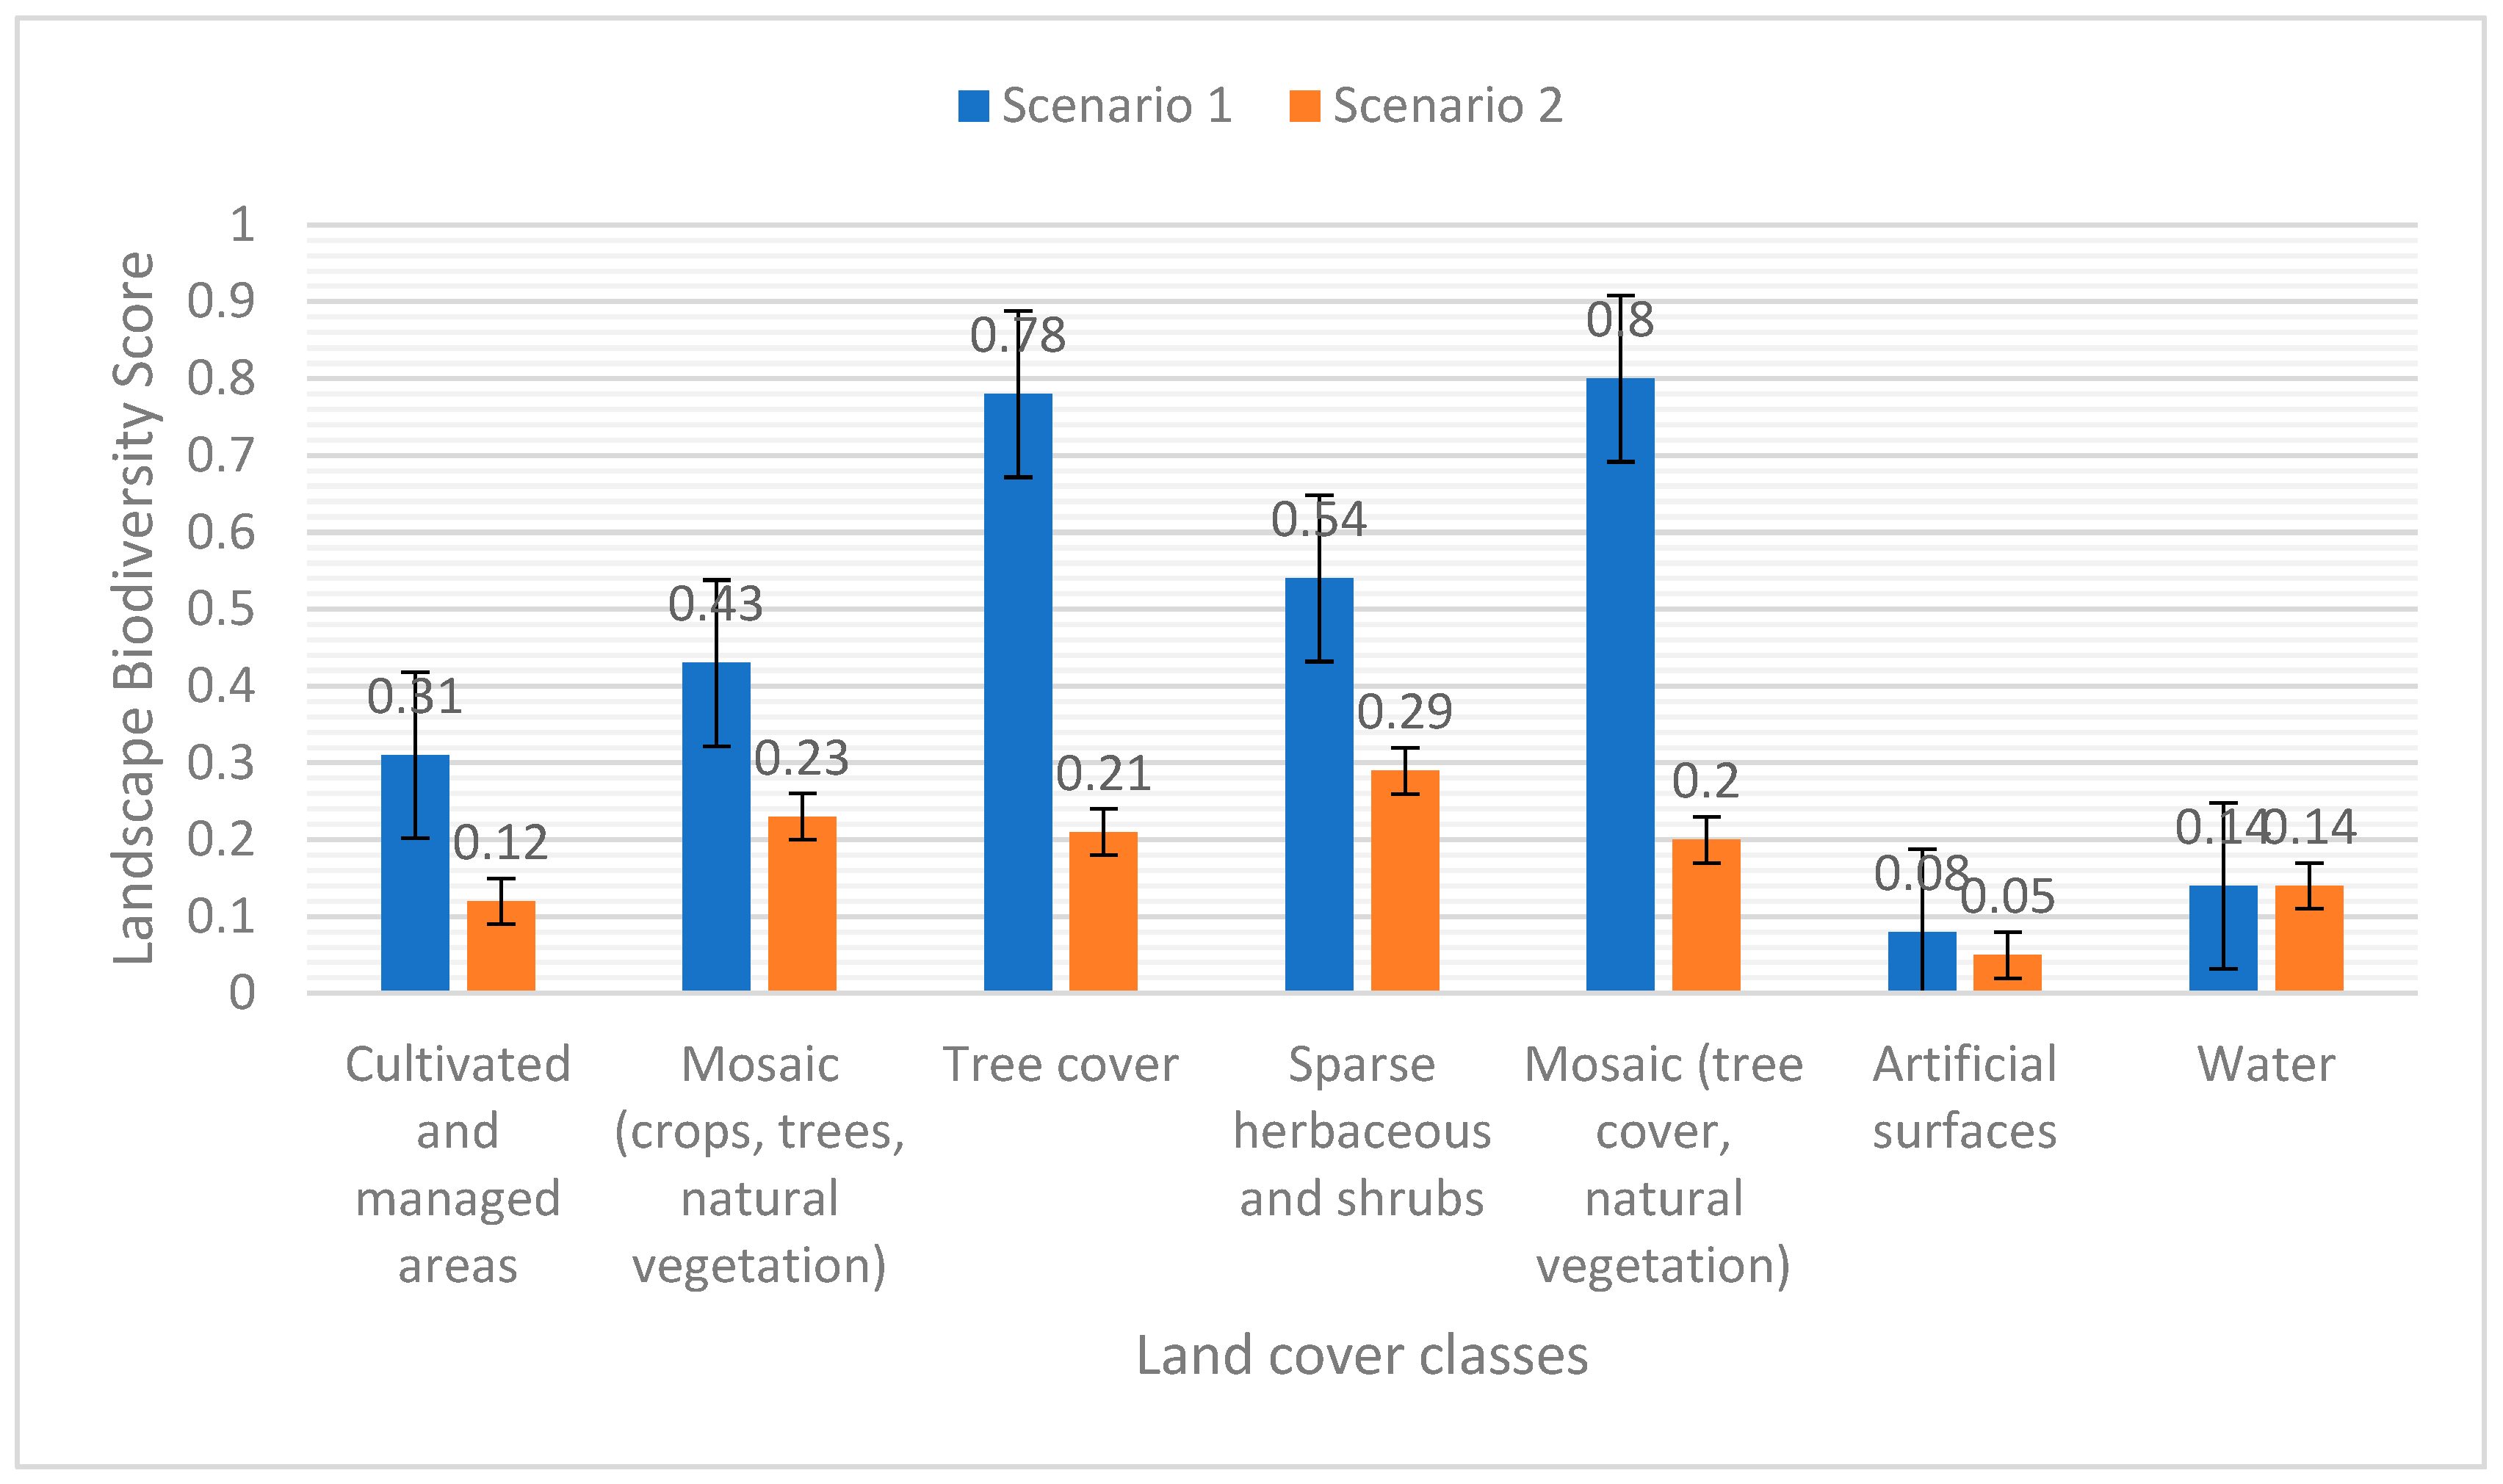
3.2.2. Landscape Biodiversity Score (LBS) across Districts and Land-Cover Class
The impact of forest cover loss on landscape biodiversity scores is shown in Table 4. Pasir Mas exhibits a very low LBS of 0.07 with a standard deviation of 0.1 when considering an LBS with forest cover loss data in scenario 2. For scenario 1, the LBS is higher (0.4) as is the standard deviation (0.17). Here, the forest cover loss data indicates intensive human activities on mixed land uses (crops and natural vegetation), reducing the overall habitat quality. In contrast, removing the forest cover loss data results in a medium-to-high LBS in scenario 1 due to less area that is considered threatened by human activities, resulting in a higher LBS.
The LBS of the Besut district in Table 4 shows the highest value of 0.49, with the greatest standard deviation of 0.38 in scenario 2. The district of Besut also exhibits the highest LBS of 0.74 for scenario 1, with a standard deviation of 0.3. The high LBS values result from covering a large part of the forested area, which also falls into the tiger conservation landscape. Forest cover loss is most evident in mixed land uses such as agriculture mixed with natural vegetation. The model shows edge effects along the forest boundary, resulting in a medium LBS. Similarly, scenario 1 shows the effects of infrastructure on habitat quality along the roads and rivers, resulting in a very high LBS in forested areas.
An LBS is a useful aggregated indicator for monitoring changes in habitat quality over time in specific areas of interest. Here, we have chosen administrative districts, but one could equally choose protected area boundaries, depending on who primarily uses the information. The resulting dynamically updateable LBSs can serve as a rapid assessment technology to alert users and stakeholders to changes in habitat quality.
The bar plot in Figure 7 shows the impact of EO-derived forest cover loss on the habitat quality model. Across all land-cover classes except water, the LBS is significantly higher for scenario 1 without forest cover loss data than for scenario 2, which includes forest cover loss from Sentinel-2 imagery. The difference between the LBS is particularly pronounced in the ‘tree cover’ and ‘mosaic of tree cover and natural vegetation’ land-cover classes, where the LBS is about four times higher for scenario 1 than for scenario 2. This results from assigning higher habitat suitability to more natural land-cover classes (Table 2). The ‘sparse herbaceous and shrubs’ class (GLC2000 class 13) shows a smaller difference between the LBS values because of a significantly reduced number of forest cover loss detections within this class (Figure 5), but it also shows the effects of the spatial impact simulated by the InVEST habitat quality model, where the effects of detected forest cover loss surrounding the ‘sparse herbaceous and shrubs’ class also result in a lower LBS.
The mixed land cover, composed of crops, trees, and natural vegetation, records a mean LBS of 0.43 for scenario 1 and 0.23 for scenario 2. The decreasing trend from natural to cultivated and then to artificial surfaces of both LBS values is maintained from the initial parameter selection of habitat suitability and sensitivity to threats (see Table 2).
A comparison of the two scenarios shows that including forest cover loss from EO in the InVEST habitat quality model leads to significant differences in landscape biodiversity scores. Omitting high-resolution information on forest cover loss leads to overestimating the habitat quality in and around tiger conservation landscapes because tigers are sensitive to small-scale habitat loss and fragmentation, which are not represented in coarse-scale static maps, such as GLC2000.
Dynamically updated maps of forest cover loss from Sentinel-2 or Landsat (e.g., through Global Forest Watch) can provide important input data for tiger habitat quality models. Moreover, regular updates of forest cover loss allow for regular updates of habitat quality maps.
Figure 7.
Bar plot of mean (i.e., landscape biodiversity score) and standard deviation (sd) of the habitat quality index (HQI) by land-cover class for the two scenarios described in the text. Error bars are ±1 sd. 0 is low habitat quality and 1 high habitat quality.
Figure 7.
Bar plot of mean (i.e., landscape biodiversity score) and standard deviation (sd) of the habitat quality index (HQI) by land-cover class for the two scenarios described in the text. Error bars are ±1 sd. 0 is low habitat quality and 1 high habitat quality.
4. Discussion
By combining the InVEST habitat quality model with a fine-grained assessment of forest cover loss from satellite image analysis, we demonstrated an improved assessment of the status of tiger habitat quality in the study area in Malaysia. Our approach allows for the habitat quality maps to be dynamically updated with the latest available detections of forest cover loss from Sentinel-2, an advance over previous static assessments of tiger habitat quality (e.g., [27]). A limitation of the InVEST habitat quality model is that it does not predict tiger populations directly. However, it uses spatial data to simulate the expected habitat quality based on a range of input datasets and sensitivity and threat parameters based on the modeller’s understanding of what constitutes good habitat quality. An alternative approach to modelling habitat quality based on environmental parameters would be to simulate species or population characteristics as indicators of habitat quality. However, for birds, there is no obvious advantage to either way of modelling habitat quality [28].
Adding information on threats to each habitat indicates that the detected forest cover losses have wider impacts than only on the direct location where changes occur. To make the scenarios comparable, the values should remain the same for the respective habitats and threats. Forest loss leads to habitat fragmentation, which in turn limits accessibility and increases the degradation of the surrounding habitat, which can ultimately lead to biodiversity loss [56,57]. However, forest cover loss mapped for one year does not account for potential ecosystem recovery, resilience, and adaptation strategies, which could lead to overestimating habitat quality decline.
Additional information, such as species occurrence data from biodiversity inventory fieldwork campaigns, would add to the confidence in the model outputs. If such data are not available, biodiversity information can also be acquired from databases such as the Global Biodiversity Information Facility (GBIF), the PREDICTS database [58], the International Union for Conservation of Nature’s (IUCN) Red List spatial datasets of taxa threatened by extinction [59], the WDPA dataset showing protected areas, and any other locally available datasets within respective institutions that can provide more information on species occurrence and biodiversity. In this case, the Tx2 tiger conservation landscape was used to compare the area that would be required to double the tiger population when considering overall habitat degradation and quality with respect to remotely sensed forest loss. The tiger has also been used as an indicator species for biodiversity. In general, the habitat preference of the Malayan tiger is primarily forest. Forests degraded due to logging activities tend to be less preferred because they are more accessible to humans via logging trails and/or roads [60]. The modelling approach is based on findings in India that tiger populations require good habitat quality and prey availability more than protected area status [15]. Tiger populations in Malaysia largely survive within forest habitats and are threatened by forest cover loss and fragmentation [27]. Thus, the inclusion of forest cover loss data is considered important. Because of the dynamic nature of forest cover loss, the ability to include recent forest cover loss data into the habitat quality model is an important improvement of static habitat quality modelling approaches.
The main factors contributing to higher HQI values are low accessibility (e.g., terrain) and resource management strategies. These could be the main reasons for finding less degraded habitats in Besut and Machang districts. Furthermore, towards the coastal areas, the terrain becomes flatter, the accessibility increases, and there is more cultivated and managed land and fewer suitable habitat areas for biodiversity-rich habitats, such as forests. Highly degraded habitats are found in areas surrounded by mixed landscapes with more cultivated and managed areas (see Figure 6a,b).
One cannot assume that where the habitat quality maps derived here show high values, the habitat condition is optimum. Rather, the maps provide good insight into areas where human activity, such as logging or natural disturbance events (e.g., tree disease outbreaks, storm damage), have resulted in forest cover loss, which in turn is likely to decrease the habitat quality for tiger populations. The model does not include information on possible ecosystem recovery after a disturbance, such as secondary forest regrowth. This could lead to a possible overestimation of habitat degradation.
Furthermore, the OpenStreetMap (OSM) dataset used to represent roads is compiled by volunteers and, hence, tends to be incomplete. This underrepresents current human infrastructure and accessibility to areas where roads have not yet been mapped. It is recommended to use up-to-date geographic information on regional and national transport infrastructure and settlements if available.
The analysis outcomes presented here differ slightly from the recently published Global Forest Watch (GFW) biodiversity intactness dataset [24]. These differences originate from the different input layers implemented in each product. While GFW bases its analysis on global tree cover loss and gain data from Hansen et al. [61], downscaled land-use data [61], and biodiversity data derived from the PREDICTS database [58], here, we focus on forest cover loss mapped using Sentinel-2 data, habitat distribution and extent from the GLC2000 dataset, and the InVEST habitat quality model. Our approach provides insights into the current state of potential tiger habitats, such as primary forests and less suitable habitats, such as landscape mosaics of crops, trees, and natural vegetation where human threats to tigers are more prevalent. The PREDICTS database used by GFW is quite systematic, with harmonised species-occurrence datasets from different studies, and is suitable for assessing the impact of forest cover loss on biodiversity [58]. The InVEST habitat quality model can also be integrated into the automated processing chain, starting from the Level 1C Top-Of-Atmosphere radiance or the Level 2A surface reflectance images and resulting in continuous updates of the state of the environment, here habitat quality.
Comparing the two approaches mentioned above for assessing the impact of forest cover loss on biodiversity, i.e., the habitat quality index and the biodiversity intactness score, we conclude that if enough species-occurrence data are available in a harmonised form, then the direct approach of deriving the biodiversity intactness is suitable. Thanks to the PREDICTS project, this will be more and more achievable since the project continues to collate species-occurrence data and aims to change the application of the PREDICTS database from a “control-impact” comparison approach to a “before-after-control-impact” approach [58]. If less structured data and limited time are available, the InVEST habitat quality model is an easy and efficient tool to implement, and the computational demands are relatively low.
The choice of sensitivity values in Table 2 and threat values in Table 3 is somewhat subjective, and while we have taken care to select plausible values from the InVEST user handbook and the peer-reviewed literature, the choice of values can be an issue when applying our method to a new study area or a different type of habitat. We have found that the spatial patterns of the HQI maps do not change substantially when small changes to these values are made. However, we recommend using stakeholder knowledge where possible to derive meaningful values with respect to the particular application. An ensemble approach of averaging different model runs [17] parameterized with different values may be a way forward to represent the uncertainty in choosing the values.
Rigorous model validation of the InVEST habitat quality model would have been desirable. There is a notable absence in the literature of scientific studies that validate this model. The only approach validating the habitat quality of a species would be with independently collected species-occurrence data. Importantly, these data would have to be unbiased, i.e., not just the sightings of the species along roads and settlements but also deep in the primary rainforest, which is inaccessible to most people. The study presented here had the same limitation as many other researchers using the InVEST habitat quality model of not having access to reliable geolocated tiger sightings for rigorous validation of the habitat quality model output. Species records in the GBIF database have a reporting bias towards easily accessible areas around settlements and transportation routes. Hence, we were unable to conduct an independent validation of the model simulations.
Future research should focus on methods and data that can account for spatial variability in biodiversity, such as biomass, where higher biomass values indicate potentially higher biodiversity since old and large trees are associated with high biomass [62]. Furthermore, adding the InVEST habitat risk assessment model to the analysis would add value by analysing the cumulative risks for ecosystems and analysing present and future scenarios of risks and threats and their impact on ecosystem services and biodiversity. The InVEST habitat quality model is one of the available ecosystem service models that can help assess progress towards the Aichi targets. Remote sensing imagery plays an important role in informing such models by providing land-cover maps that can form a baseline for ecosystem accounting units and, as shown in this paper, by providing ongoing monitoring of land-cover changes and their impacts on habitat quality. In its current form, the InVEST habitat quality model lacks the capability of including the area of the habitat extent and the impacts of habitat fragmentation as factors in model simulations. Ideally, future generations of ecosystem service models should be co-developed alongside ecosystem account-ready data (EARD) products from Earth observation to ensure full interoperability.
5. Conclusions
The world’s remaining wild tiger populations largely rely on forest habitats for survival. Modern satellite remote sensing can provide up-to-date information on forest cover loss. In our example of a tiger conservation landscape in Malaysia, we measured forest cover loss over a year using Sentinel-2 image acquisitions at 20 m resolution. The user’s accuracy of the forest cover loss detections from Sentinel-2 obtained from two validation exercises were 79% and 90%, respectively, showing very good detection accuracies. The largest areas of forest loss were detected in the class 1 (65% of all forest loss areas are in mosaics of crops, trees, and natural vegetation) followed by class 2 (22% of all losses are in cultivated and managed areas).
In addition to forest cover loss events, OpenStreetMap road vectors and the GLC2000 land-cover map are used to model the sensitivity of habitats to threats from roads, railways, water courses, and urban areas. To test the sensitivity of the habitat quality outcomes from the InVEST model, we ran two model scenarios, one with and one without the forest cover loss data. Out of the two scenarios of habitat quality, in scenario 1 (which includes roads and railway tracks, human settlements, and agricultural land) the land-cover mosaic class of crops, trees, and natural vegetation had a higher LBS score of 0.43 than in scenario 2 (which includes forest loss as an additional driver of habitat degradation), where the LBS was only 0.23. These results show the importance of including forest loss in habitat modelling.
Our results clearly showed that including forest cover loss as a model input greatly reduced the habitat quality index and the spatially aggregated landscape biodiversity index. Therefore, we conclude that, when modelling the habitat quality of forest-dwelling species, forest loss needs to be represented in the model. The dynamic nature of regularly updateable forest cover loss maps enables habitat quality and habitat degradation maps to be made dynamic, which offers decision-makers much greater responsiveness to possible habitat quality loss.
The concept of using remote sensing data of forest cover loss as an input to an ecosystem service modelling framework presented in this paper can enable improved environmental management. Frameworks such as this one have great potential to contribute to the reduction and eventual reversal of biodiversity loss that most nations have signed up for under the UN Convention on Biodiversity. We recommend that new versions of ecosystem service models should be co-developed alongside ecosystem account-ready data (EARD) products from Earth observation to ensure full interoperability.
Author Contributions
Conceptualization, S.E.P. and H.B.; Formal analysis, V.L.; Investigation, V.L., L.J. and H.B.; Methodology, V.L., S.E.P., L.J. and H.B.; Project administration, H.B.; Resources, H.B.; Software, V.L.; Supervision, S.E.P. and H.B.; Validation, K.B.; Writing—original draft, V.L.; Writing—review and editing, S.E.P., K.J.T., L.J., K.B. and H.B. All authors have read and agreed to the published version of the manuscript.
Funding
This study was funded by the UK Space Agency under the International Partnership Programme, project EASOS (“Earth and Sea Observation System”). H.B. was supported by the Natural Environment Research Council, National Centre for Earth Observation. The APC was funded by UK Research and Innovation under the University of Leicester Open Access Fund.
Data Availability Statement
The following datasets are publicly available. The Sentinel-2-derived forest loss map can be downloaded from https://doi.org/10.25392/leicester.data.14473374 (accessed on 28 April 2021); the InVEST habitat quality index map including forest loss as a threat factor can be accessed from https://doi.org/10.25392/leicester.data.14473398 (accessed on 28 April 2021) and without forest loss from https://doi.org/10.25392/leicester.data.14473401 (accessed on 28 April 2021).
Acknowledgments
We thank all partners within the EASOS project for the collaboration, data sharing, and infrastructure. All data were processed on the JASMIN CEMS high-performance computing cluster, managed by the Satellite Applications Catapult.
Conflicts of Interest
The authors declare no conflicts of interest.
Appendix A

Table A1.
Aichi biodiversity targets for Malaysia and identified Earth observation products for their monitoring [14,63,64].
| Strategic Goals | Aichi Biodiversity Targets | EO Related EBV | EO Product Example |
|---|---|---|---|
| A: Address the underlying causes of biodiversity loss by mainstreaming biodiversity across government and society | Production forests, agriculture production and fisheries are managed sustainably. | Net primary production and secondary productivity, plant phenology; Population structure by age/size class; Disturbance regime | NDVI FPAR Land-cover change Biomass |
| B: Reduce the direct pressures on biodiversity and promote sustainable use. | Tourism is sustainably managed and promotes biodiversity conservation. | Ecosystem extent and fragmentation, habitat structure | Land-cover change; Biomass |
| At least 20% of terrestrial areas and inland water, and 10% of coastal and marine areas, are conserved through representative system of protected areas and other effective area-based conservation measures | Net primary production and secondary productivity; Ecosystem extent and fragmentation, habitat structure; Disturbance regime | NDVI FPAR Land-cover change Biomass | |
| Poaching, illegal harvesting and illegal trade of wildlife, fish and plants are under control and significantly reduced. | Habitat structure, land-cover change, Plant phenology | Near-Real-Time land-cover change | |
| C: To improve the status of biodiversity by safeguarding ecosystems, species and genetic diversity. | Invasive alien species and pathways are identified, priority species controlled, and measures are in place to prevent their introduction and establishment. | Ecosystem extent and fragmentation; Population abundance, species distribution; species movement, physiology | Land cover and surrounding matrix; Tracking and remote observation of individuals of an ecosystem; Leaf chlorophyll and water content |
| D: Enhance the benefits to all from biodiversity and ecosystem services. | Malaysia has an operational ABS framework that is consistent with the Nagoya Protocol on Access to Genetic Resources and the Fair and Equitable Sharing of Benefits Arising from their Utilization. | Ecosystem composition by functional type; Ecosystem extent and fragmentation | Plant functional type determine the productivity of an ecosystem |
| Capacity for the implementation of the national and subnational biodiversity strategies, the CBD and other related MEAs has significantly increased. | Ecosystem composition by functional type; Ecosystem extent and fragmentation, Habitat structure, Population abundance, plant phenology and land-cover change; physiology | Plant functional types determine the productivity of an ecosystem; Biomass; Land surface phenology from/vegetation index time series, Land-cover change; Leaf chlorophyll and water content |
References
- Skidmore, A.K.; Pettorelli, N.; Coops, N.C.; Geller, G.N.; Hansen, M.; Lucas, R.; Mücher, C.A.; O’Connor, B.; Paganini, M.; Pereira, H.M.; et al. Environmental Science: Agree on Biodiversity Metrics to Track from Space. Nature 2015, 523, 403–405. [Google Scholar] [CrossRef] [PubMed]
- Turner, W.; Rondinini, C.; Pettorelli, N.; Mora, B.; Leidner, A.K.; Szantoi, Z.; Buchanan, G.; Dech, S.; Dwyer, J.; Herold, M.; et al. Free and Open-Access Satellite Data Are Key to Biodiversity Conservation. Biol. Conserv. 2015, 182, 173–176. [Google Scholar] [CrossRef]
- Pettorelli, N.; Owen, H.J.F.; Duncan, C. How Do We Want Satellite Remote Sensing to Support Biodiversity Conservation Globally? Methods Ecol. Evol. 2016, 7, 656–665. [Google Scholar] [CrossRef]
- Chapin III, F.S.C.; Zavaleta, E.S.; Eviner, V.T.; Naylor, R.L.; Vitousek, P.M.; Reynolds, H.L.; Hooper, D.U.; Lavorel, S.; Sala, O.E.; Hobbie, S.E.; et al. Consequences of Changing Biodiversity. Nature 2000, 405, 6783. [Google Scholar]
- Pettorelli, N.; Wegmann, M.; Skidmore, A.; Mücher, S.; Dawson, T.P.; Fernandez, M.; Lucas, R.; Schaepman, M.E.; Wang, T.; O’Connor, B.; et al. Framing the Concept of Satellite Remote Sensing Essential Biodiversity Variables: Challenges and Future Directions. Remote Sens. Ecol. Conserv. 2016, 2, 122–131. [Google Scholar] [CrossRef]
- Turner, W.; Spector, S.; Gardiner, N.; Fladeland, M.; Sterling, E.; Steininger, M. Remote sensing for biodiversity science and conservation. Trends Ecol. Evol. 2003, 18, 306–314. [Google Scholar] [CrossRef]
- Lausch, A.; Bannehr, L.; Beckmann, M.; Boehm, C.; Feilhauer, H.; Hacker, J.M.; Heurich, M.; Jung, A.; Klenke, R.; Neumann, C.; et al. Linking Earth Observation and taxonomic, structural and functional biodiversity: Local to ecosystem perspectives. Ecol. Indic. 2016, 70, 317–339. [Google Scholar] [CrossRef]
- Pereira, H.M.; Ferrier, S.; Walters, M. Essential Biodiversity Variables. Science 2013, 339, 277–278. [Google Scholar] [CrossRef] [PubMed]
- Petrou, Z.I.; Stathaki, T. Remote Sensing for Biodiversity Monitoring: A Review of Methods for Biodiversity Indicator Extraction and Assessment of Progress towards International Targets. Biodivers. Conserv. 2015, 24, 2333–2363. [Google Scholar] [CrossRef]
- Neugarten, R.A.; Langhammer, P.F.; Osipova, E.; Bagstad, K.J.; Bhagabati, N.; Butchart, S.H.; Dudley, N.; Elliott, V.; Gerber, L.R.; Arrellano, C.G.; et al. Tools for Measuring, Modelling, and Valuing Ecosystem Services; International Union for Conservation of Nature (IUCN): Gland, Switzerland, 2018; 70p, Available online: https://portals.iucn.org/library/node/47778 (accessed on 11 December 2023).
- Onyia, N.N.; Balzter, H.; Berrio, J.C. Normalized difference vegetation vigour index: A new remote sensing approach to biodiversity monitoring in oil polluted regions. Remote Sens. 2018, 10, 897. [Google Scholar] [CrossRef]
- cepf.net. CEPF. Available online: https://www.cepf.net/our-work/biodiversity-hotspots/hotspots-defined (accessed on 6 April 2018).
- Yong, C. Peninsular Malaysia Orang Asli Village Network (JKOASM), and SACCESS: Deforestation Drivers and Human Rights in Malaysia. Forest Peoples Programme. 2014. Available online: https://www.forestpeoples.org/en/topics/rights-land-natural-resources/publication/2014/deforestation-drivers-and-human-rights-malaysi (accessed on 1 December 2023).
- Convention on Biodiversity, Aichi Biodiversity Targets. 2020. Available online: https://www.cbd.int/sp/targets/ (accessed on 16 December 2023).
- Chanchani, P.; Noon, B.R.; Bailey, L.L.; Warrier, R.A. Conserving Tigers in Working Landscapes. Conserv. Biol. 2016, 30, 649–660. [Google Scholar] [CrossRef]
- Karanth, K.U. Estimating Tiger Panthera Tigris Populations from Camera-Trap Data Using Capture—Recapture Models. Biol. Conserv. 1995, 71, 333–338. [Google Scholar] [CrossRef]
- Hebblewhite, M.; Zimmermann, F.; Li, Z.; Miquelle, D.; Zhang, M.; Sun, H.; Mörschel, F.; Wu, Z.; Sheng, L.; Purekhovsky, A.; et al. Is There a Future for A Mur Tigers in a Restored Tiger Conservation Landscape in N Ortheast C Hina? Anim. Conserv. 2012, 15, 579–592. [Google Scholar]
- Tian, Y.; Wu, J.; Smith, A.T.; Wang, T.; Kou, X.; Ge, J. Population Viability of the Siberian Tiger in a Changing Landscape: Going, Going and Gone? Ecol. Model. 2011, 222, 3166–3180. [Google Scholar] [CrossRef]
- Linkie, M.; Chapron, G.; Martyr, D.J.; Holden, J.; Leader-Williams, N. Assessing the Viability of Tiger Subpopulations in a Fragmented Landscape. J. Appl. Ecol. 2006, 43, 576–586. [Google Scholar] [CrossRef]
- Carter, N.; Levin, S.; Barlow, A.; Grimm, V. Modeling Tiger Population and Territory Dynamics Using an Agent-Based Approach. Ecol. Model. 2015, 312, 347–362. [Google Scholar] [CrossRef]
- Bhagabati, N.K.; Ricketts, T.; Sulistyawan, T.B.S.; Conte, M.; Ennaanay, D.; Hadian, O.; McKenzie, E.; Olwero, N.; Rosenthal, A.; Tallis, H.; et al. Ecosystem Services Reinforce Sumatran Tiger Conservation in Land Use Plans. Biol. Conserv. 2014, 169, 147–156. [Google Scholar] [CrossRef]
- Ren, D.F.; Cao, A.H.; Wang, F.Y. Response and Multi-Scenario Prediction of Carbon Storage and Habitat Quality to Land Use in Liaoning Province, China. Sustainability 2023, 15, 4500. [Google Scholar] [CrossRef]
- Ash, E.; Macdonald, D.W.; Cushman, S.A.; Noochdumrong, A.; Redford, T.; Kaszta, Ż. Optimization of spatial scale, but not functional shape, affects the performance of habitat suitability models: A case study of tigers (Panthera tigris) in Thailand. Landsc. Ecol. 2021, 36, 455–474. [Google Scholar] [CrossRef]
- Rather, T.A.; Kumar, S.; Khan, J.A. Multi-scale habitat modelling and predicting change in the distribution of tiger and leopard using random forest algorithm. Nat. Sci. Rep. 2020, 10, 11473. [Google Scholar] [CrossRef]
- Breiman, L. Random Forests. Mach. Learn. 2001, 45, 5–32. [Google Scholar] [CrossRef]
- Jordan, M.I.; Mitchell, T.M. Machine learning: Trends, perspectives, and prospects. Science 2015, 349, 255–260. [Google Scholar] [CrossRef]
- Joshi, A.R.; Dinerstein, E.; Wikramanayake, E.; Anderson, M.L.; Olson, D.; Jones, B.S.; Seidensticker, J.; Lumpkin, S.; Hansen, M.C.; Sizer, N.C.; et al. Tracking Changes and Preventing Loss in Critical Tiger Habitat. Sci. Adv. 2016, 2, e1501675. [Google Scholar] [CrossRef] [PubMed]
- Johnson, M.D. Measuring Habitat Quality: A Review. Condor 2007, 109, 489–504. [Google Scholar] [CrossRef]
- Stanford University, The Natural Capital Project Habitat Quality User Manual—InVEST. Available online: http://releases.naturalcapitalproject.org/invest-userguide/latest/en/habitat_quality.html (accessed on 16 April 2018).
- Mueller, M.; Geist, J. Conceptual Guidelines for the Implementation of the Ecosystem Approach in Biodiversity Monitoring. Ecosphere 2016, 7, e01305. [Google Scholar] [CrossRef]
- King, S.; Vardon, M.; Grantham, H.S.; Eigenraam, M.; Ferrier, S.; Juhn, D.; Larsen, T.; Brown, C.; Turner, K. Linking Biodiversity into National Economic Accounting. Environ. Sci. Policy 2021, 116, 20–29. [Google Scholar] [CrossRef]
- Turner, W. Conservation. Sensing Biodiversity. Science 2014, 346, 301–302. [Google Scholar] [CrossRef]
- Bush, A.; Sollmann, R.; Wilting, A.; Bohmann, K.; Cole, B.; Balzter, H.; Martius, C.; Zlinszky, A.; Calvignac-Spencer, S.; Cobbold, C.A.; et al. Connecting Earth Observation to High-Throughput Biodiversity Data. Nat. Ecol. Evol. 2017, 1, 0176. [Google Scholar] [CrossRef]
- Hill, S.L.; Arnell, A.; Maney, C.; Butchart, S.H.; Hilton-Taylor, C.; Ciciarelli, C.; Davis, C.; Dinerstein, E.; Purvis, A.; Burgess, N.D. Measuring Forest Biodiversity Status and Changes Globally. Front. For. Glob. Chang. 2019, 2, 70. [Google Scholar] [CrossRef]
- Bartholomé, E.; Belward, A.S. GLC2000: A New Approach to Global Land Cover Mapping from Earth Observation Data. Int. J. Remote Sens. 2005, 26, 1959–1977. [Google Scholar] [CrossRef]
- Stibig, H.-J.; Roy, P.S.; Upik, R.; Agrawal, S.; Joshi, P.; Beuchler, R.; Hildanus; Mubareka, S. The Land Cover Map for South and South East Asia in the Year 2000. GLC2000 Database, European Commision Joint Research Centre. 2003. Available online: http://www-gem.jrc.it/glc2000 (accessed on 8 April 2018).
- Roberts, J.; Balzter, H.; Gou, Y.; Louis, V.; Robb, C. Pyeo: Automated Satellite Imagery Processing; Zenodo: Meyrin, Switzerland, 2020. [Google Scholar] [CrossRef]
- Pacheco-Pascagaza, A.M.; Gou, Y.; Louis, V.; Roberts, J.F.; Rodríguez-Veiga, P.; da Conceição Bispo, P.; Espírito-Santo, F.D.B.; Robb, C.; Upton, C.; Galindo, G.; et al. Near Real-Time Change Detection System Using Sentinel-2 and Machine Learning: A Test for Mexican and Colombian Forests. Remote Sens. 2022, 14, 707. [Google Scholar] [CrossRef]
- European Space Agency, Sentinel-2 Online User Guides: Applications: Land Monitoring. Available online: https://sentinels.copernicus.eu/web/sentinel/user-guides/sentinel-2-msi/applications/land-monitoring (accessed on 15 December 2023).
- European Space Agency. Sentinel-2—ESA Operational EO Missions—Earth Online—ESA. Available online: https://earth.esa.int/web/guest/missions/esa-operational-eo-missions/sentinel-2 (accessed on 11 May 2018).
- European Space Agency. Sen2Three 1.1.0 Documentation. Available online: https://step.esa.int/thirdparties/sen2three/1.1.0/sen2three-1.1.0.htmldoc/index.html (accessed on 10 August 2018).
- Hansen, M.C.; Krylov, A.; Tyukavina, A.; Potapov, P.V.; Turubanova, S.; Zutta, B.; Ifo, S.; Margono, B.; Stolle, F.; Moore, R. Humid Tropical Forest Disturbance Alerts Using Landsat Data. Environ. Res. Lett. 2016, 11, 034008. [Google Scholar] [CrossRef]
- Wikramanayake, E.; Dinerstein, E.; Seidensticker, J.; Lumpkin, S.; Pandav, B.; Shrestha, M.; Mishra, H.; Ballou, J.; Johnsingh, A.J.T.; Chestin, I.; et al. A Landscape-Based Conservation Strategy to Double the Wild Tiger Population. Conserv. Lett. 2011, 4, 219–227. [Google Scholar] [CrossRef]
- globalforestwatch.org Tx2 Tiger Conservation Landscapes. 2018. Available online: http://data.globalforestwatch.org/datasets/f50efdadb0234ef392c4ecd8185c1f5f_4 (accessed on 5 April 2018).
- Roberge, J.-M.; Angelstam, P. Usefulness of the Umbrella Species Concept as a Conservation Tool. Conserv. Biol. 2004, 18, 76–85. [Google Scholar] [CrossRef]
- WWF The Malayan Tiger. Available online: http://www.wwf.org.my/about_wwf/what_we_do/species_main/tiger/ (accessed on 29 June 2018).
- Hunter, M.; Westgate, M.; Barton, P.; Calhoun, A.; Pierson, J.; Tulloch, A.; Beger, M.; Branquinho, C.; Caro, T.; Gross, J.; et al. Two Roles for Ecological Surrogacy: Indicator Surrogates and Management Surrogates. Ecol. Indic. 2016, 63, 121–125. [Google Scholar] [CrossRef]
- Wikramanayake, E.D.; Dinerstein, E.; Robinson, J.G.; Karanth, U.; Rabinowitz, A.; Olson, D.; Mathew, T.; Hedao, P.; Conner, M.; Hemley, G.; et al. An Ecology-Based Method for Defining Priorities for Large Mammal Conservation: The Tiger as Case Study. Conserv. Biol. 2008, 12, 865–878. [Google Scholar] [CrossRef]
- Global Tiger Forum (GTF). Available online: http://globaltigerforum.org/why-tigers/ (accessed on 10 January 2019).
- Lillesand, T.M.; Kiefer, R.W.; Chipman, J.W. Digital Image Interpretation and Analysis. In Remote Sensing and Image Interpretation; John Wiley & Sons, Incorporated: Hoboken, NJ, USA, 2008; pp. 482–625. [Google Scholar]
- Planet Labs Inc. Planet Imagery Product Specifications; Planet Labs Inc.: San Francisco, CA, USA, 2018; Volume 57. [Google Scholar]
- Olofsson, P.; Arévalo, P.; Espejo, A.B.; Green, C.; Lindquist, E.; McRoberts, R.E.; Sanz, M.J. Mitigating the effects of omission errors on area and area change estimates. Remote Sens. Environ. 2020, 236, 111492. [Google Scholar] [CrossRef]
- Barsi, Á.; Kugler, Z.; László, I.; Szabó, G.; Abdulmutalib, H.M. Accuracy Dimensions in Remote Sensing. In The International Archives of the Photogrammetry, Remote Sensing and Spatial Information Sciences, Proceedings of the ISPRS TC III Mid-Term Symposium “Developments, Technologies and Applications in Remote Sensing”, Beijing, China, 7–10 May 2018; The ISPRS Foundation: Erode, India; Volume XLII-3. Available online: https://isprs-archives.copernicus.org/articles/XLII-3/61/2018/isprs-archives-XLII-3-61-2018.pdf (accessed on 25 December 2023).
- Alkemade, R.; van Oorschot, M.; Miles, L.; Nellemann, C.; Bakkenes, M.; Brink, B. Ten GLOBIO3: A Framework to Investigate Options for Reducing Global Terrestrial Biodiversity Loss. Ecosystems 2009, 12, 374–390. [Google Scholar] [CrossRef]
- Harwood, C.E.; Nambiar, E.K.S. Productivity of Acacia and Eucalypt Plantations in Southeast Asia. 2. Trends and Variations. Int. For. Rev. 2014, 16, 249–260. [Google Scholar] [CrossRef]
- Morris, R.J. Anthropogenic Impacts on Tropical Forest Biodiversity: A Network Structure and Ecosystem Functioning Perspective. Philos. Trans. R. Soc. Lond. B 2010, 365, 3709–3718. [Google Scholar] [CrossRef]
- Luskin, M.S.; Brashares, J.S.; Ickes, K.; Sun, I.-F.F.; Fletcher, C.; Wright, S.J.; Potts, M.D. Cross-Boundary Subsidy Cascades from Oil Palm Degrade Distant Tropical Forests. Nat. Commun. 2017, 8, 2231. [Google Scholar] [CrossRef] [PubMed]
- Hudson, L.N.; Newbold, T.; Contu, S.; Hill, S.L.L.; Lysenko, I.; De Palma, A.; Phillips, H.R.P.; Alhusseini, T.I.; Bedford, F.E.; Bennett, D.J.; et al. The Database of the PREDICTS (Projecting Responses of Ecological Diversity In Changing Terrestrial Systems) Project. Ecol. Evol. 2017, 7, 145–188. [Google Scholar] [CrossRef] [PubMed]
- International Union for Conservation of Nature. The IUCN Red List of Threatened Species. 2023. Available online: https://www.iucnredlist.org/ (accessed on 16 December 2023).
- Linkie, M.; Haidir, I.A.; Nugroho, A.; Dinata, Y. Conserving Tigers Panthera Tigris in Selectively Logged Sumatran Forests. Biol. Conserv. 2008, 141, 2410–2415. [Google Scholar] [CrossRef]
- Hansen, M.C.; Potapov, P.V.; Moore, R.; Hancher, M.; Turubanova, S.A.; Tyukavina, A.; Thau, D.; Stehman, S.V.; Goetz, S.J.; Loveland, T.R.; et al. High-Resolution Global Maps of 21st-Century Forest Cover Change. Science 2013, 342, 850–853. [Google Scholar] [CrossRef] [PubMed]
- Li, S.; Su, J.; Lang, X.; Liu, W.; Ou, G. Positive Relationship between Species Richness and Aboveground Biomass across Forest Strata in a Primary Pinus Kesiya Forest. Nat. Sci. Rep. 2018, 8, 2227. [Google Scholar] [CrossRef]
- O’Connor, B.; Secades, C.; Penner, J.; Sonnenschein, R.; Skidmore, A.; Burgess, N.D.; Hutton, J.M.; O’Connor, B.; Secades, C.; Penner, J.; et al. Earth Observation as a Tool for Tracking Progress towards the Aichi Biodiversity Targets. Remote Sens. Ecol. Conserv. 2015, 1, 19–28. [Google Scholar] [CrossRef]
- GEOBON. What Are EBVs? 2014. Available online: https://geobon.org/ebvs/what-are-ebvs/ (accessed on 16 December 2023).
Figure 2.
Conceptual diagram of the forest cover-change detection algorithm. The red box provides a legend of the symbols.
Figure 2.
Conceptual diagram of the forest cover-change detection algorithm. The red box provides a legend of the symbols.
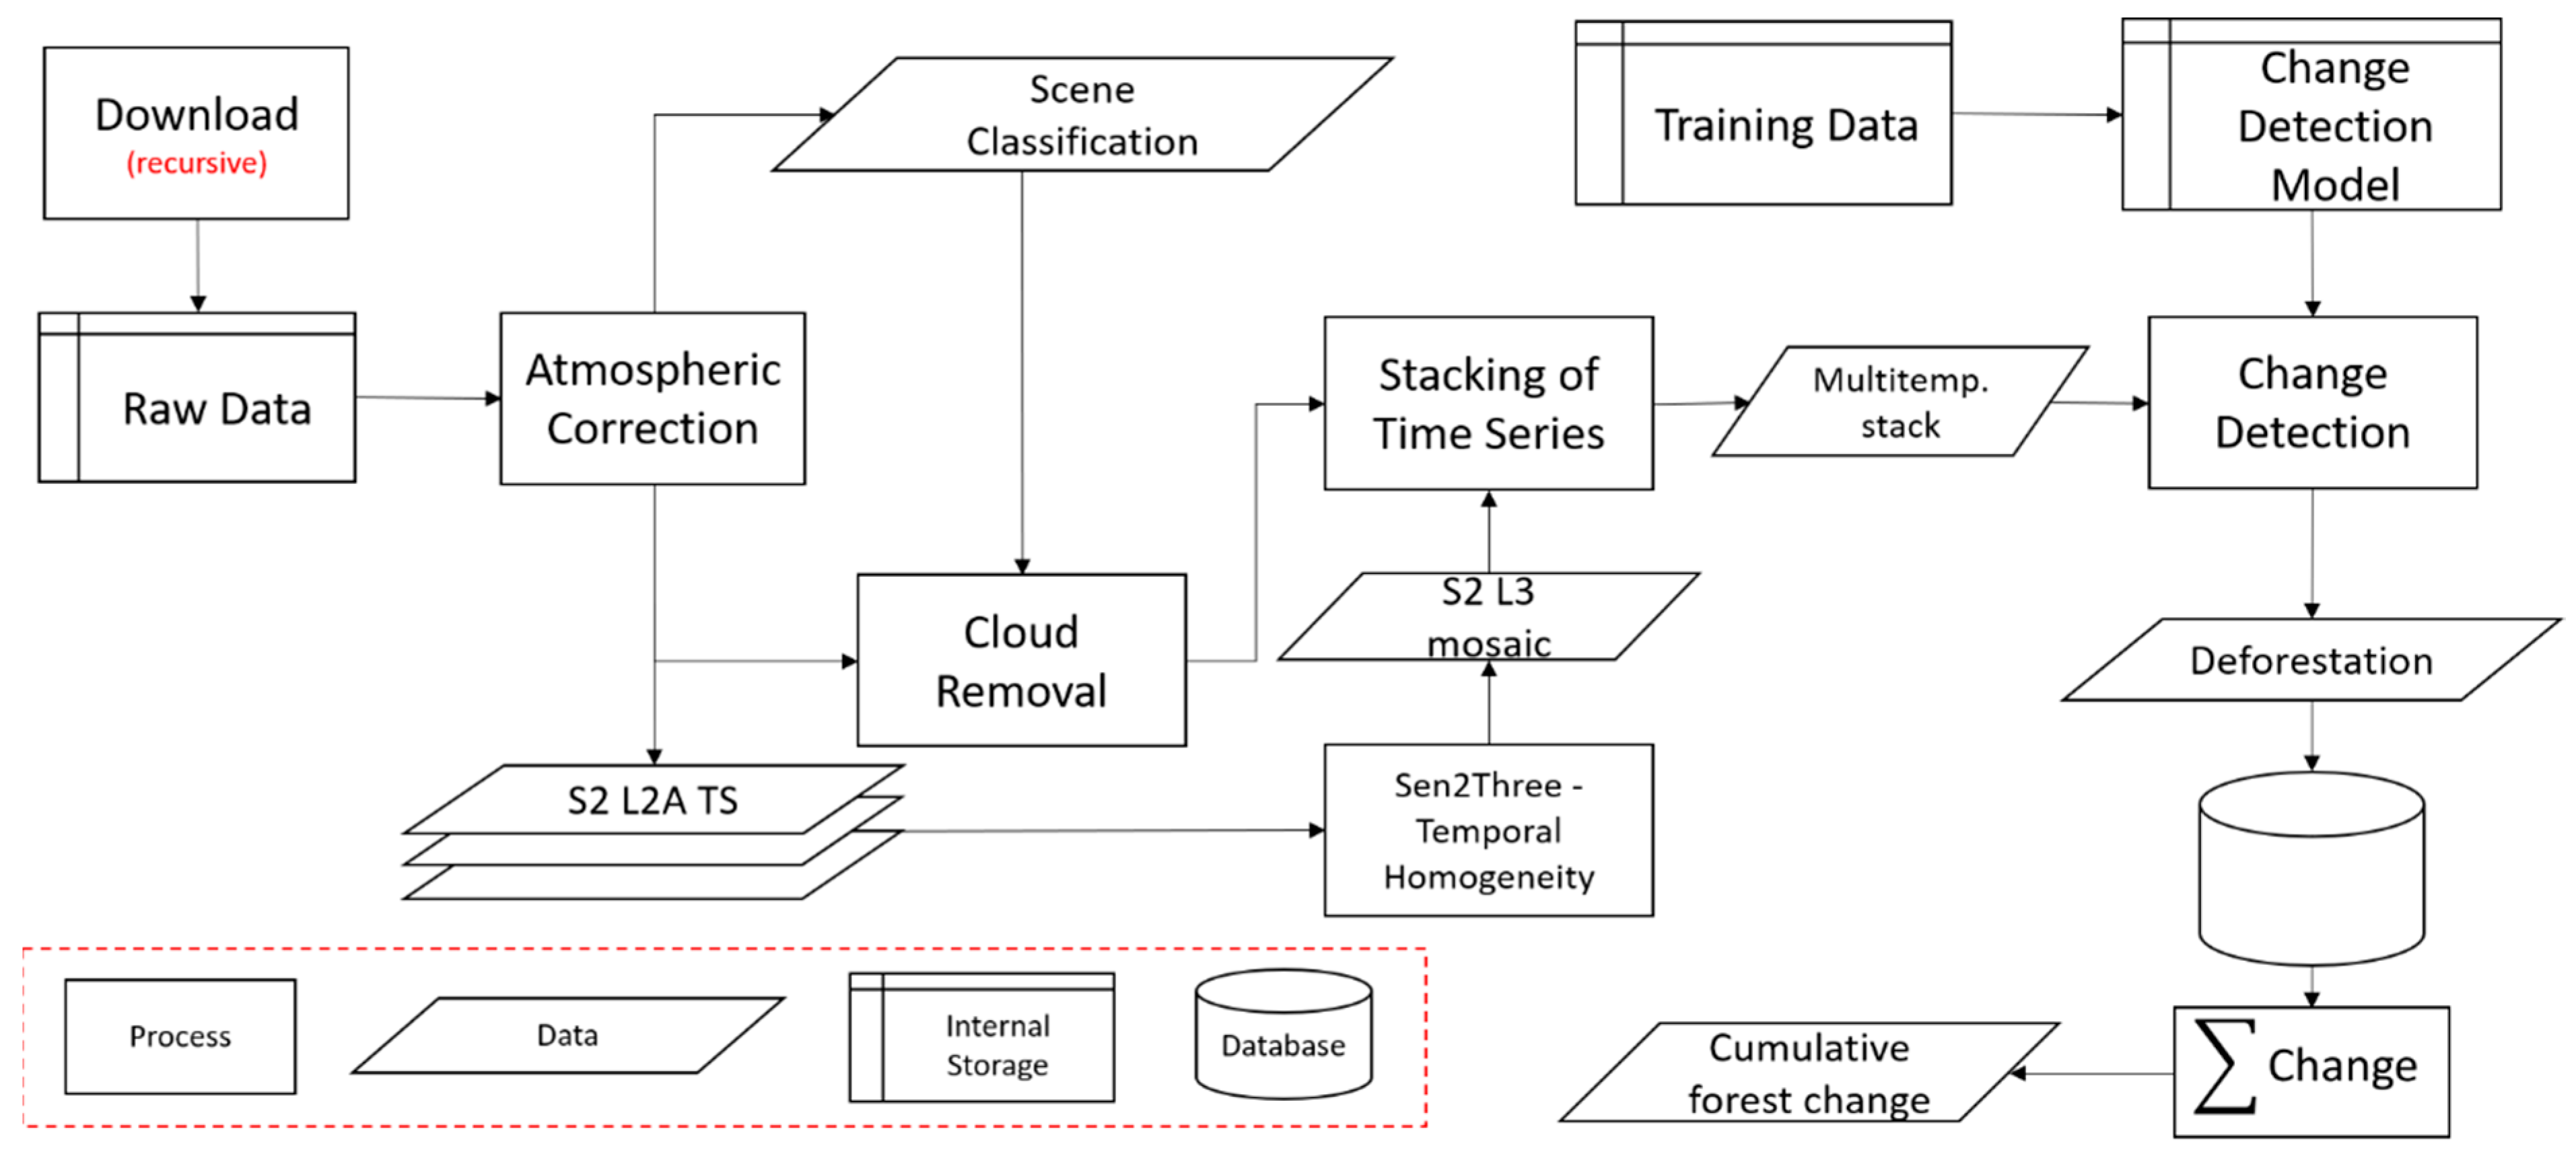
Figure 3.
Locations of the validation points in the province of Terengganu.
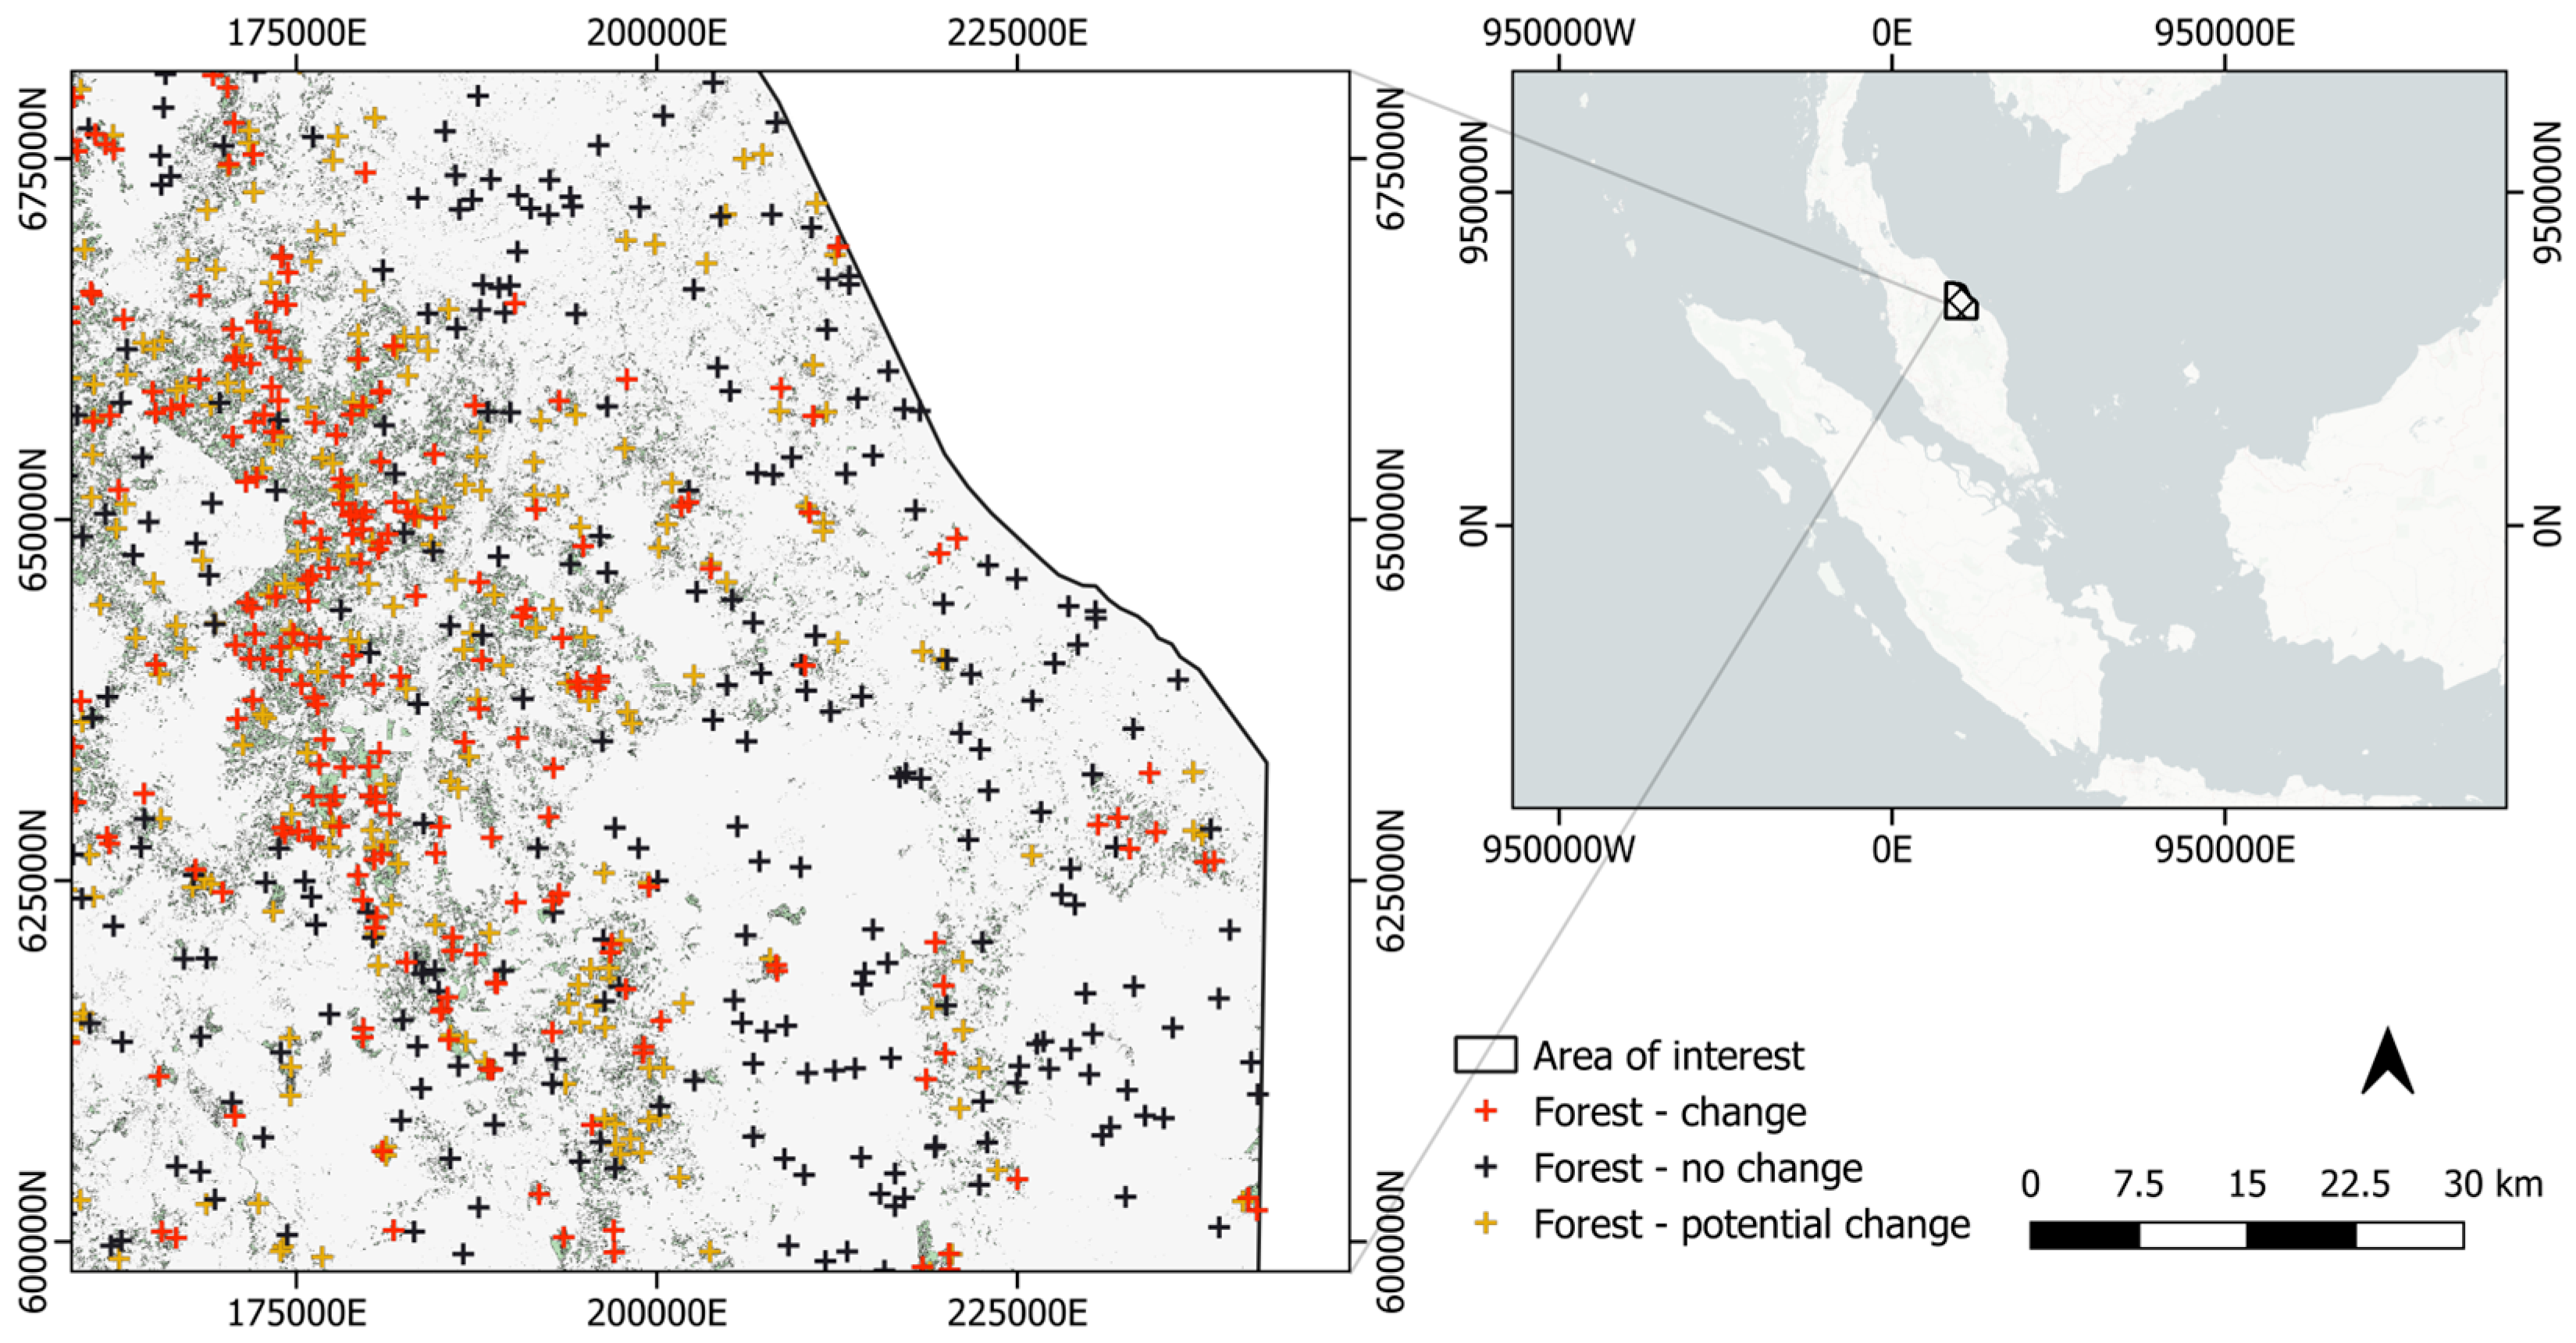
Figure 4.
Forest cover loss events between 2017 and 2018 were observed from Sentinel-2 overlaid with land-cover data (GLC2000, JRC/EU) and the extent of the Tx2 tiger conservation landscapes. The GLC2000 land-cover classes were summarized and renamed to the classes in the legend.
Figure 4.
Forest cover loss events between 2017 and 2018 were observed from Sentinel-2 overlaid with land-cover data (GLC2000, JRC/EU) and the extent of the Tx2 tiger conservation landscapes. The GLC2000 land-cover classes were summarized and renamed to the classes in the legend.
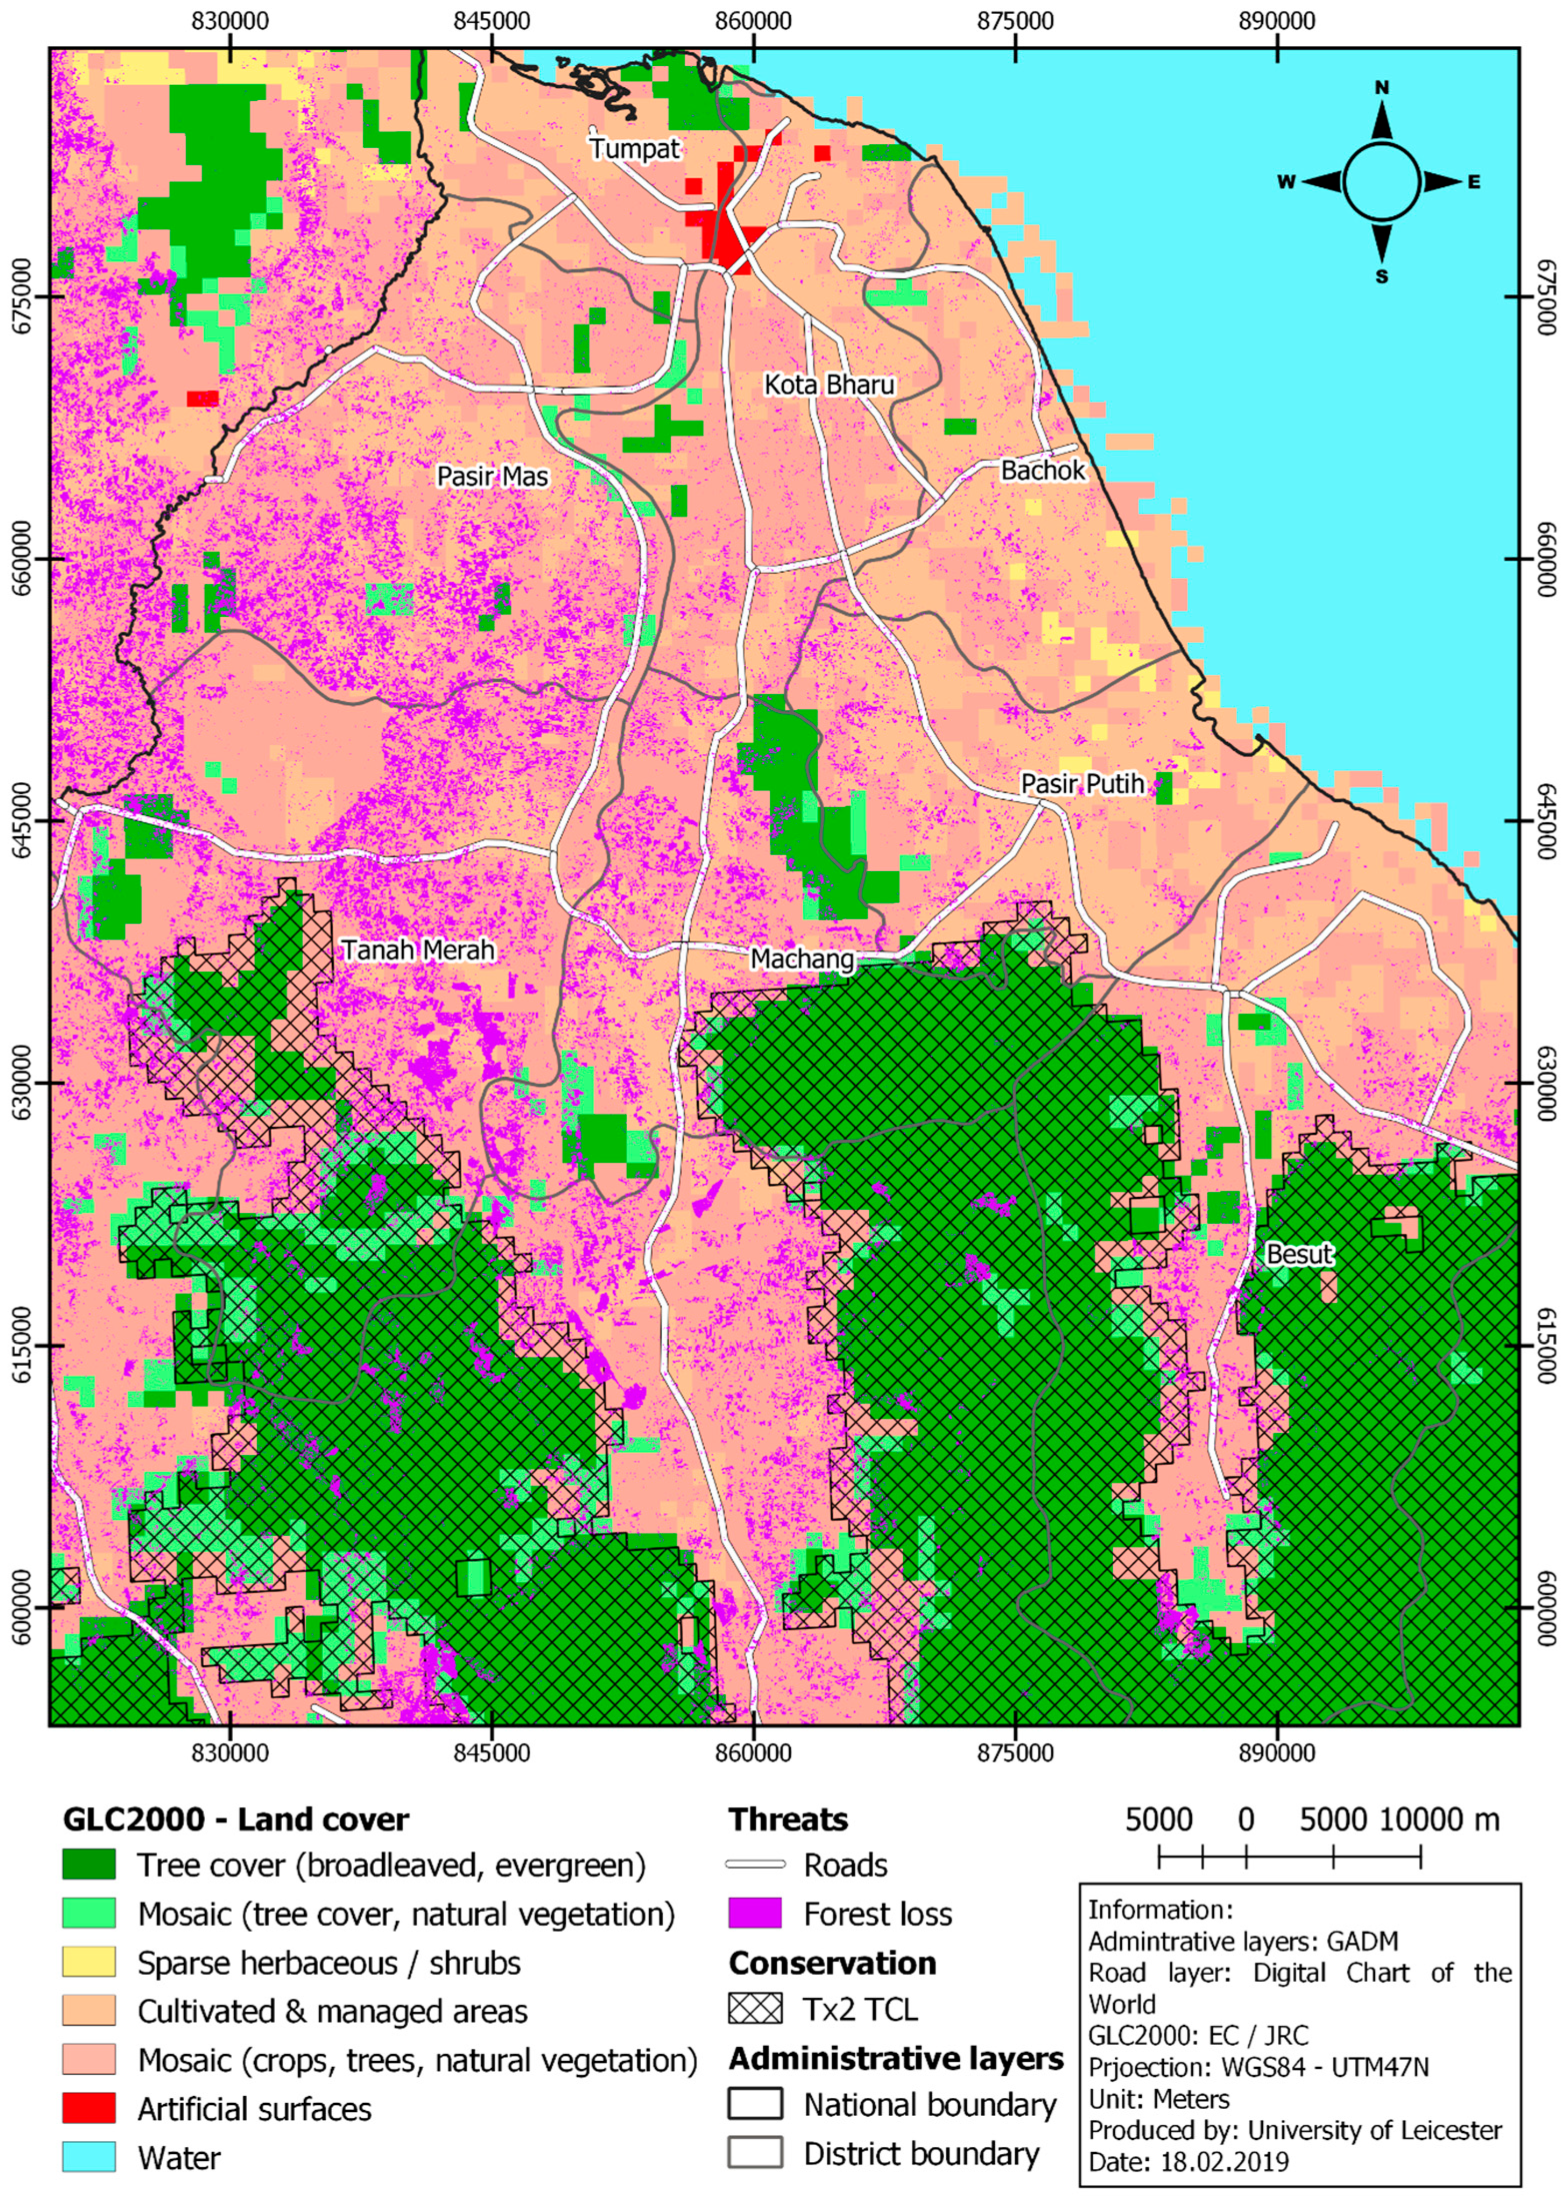
Figure 5.
Bar plot (blue) and cumulative line plot (orange) showing the area distribution of detected tree cover loss cover per GLC2000 land-cover class in the study area. The x-axis shows the land-cover classes, which are: (1) mosaic (crops, tree, natural vegetation), (2) cultivated and managed areas, (3) tree cover, (4) mosaic (tree cover, natural vegetation), (5) sparse and herbaceous and shrubs, (6) artificial surfaces, (7) water.
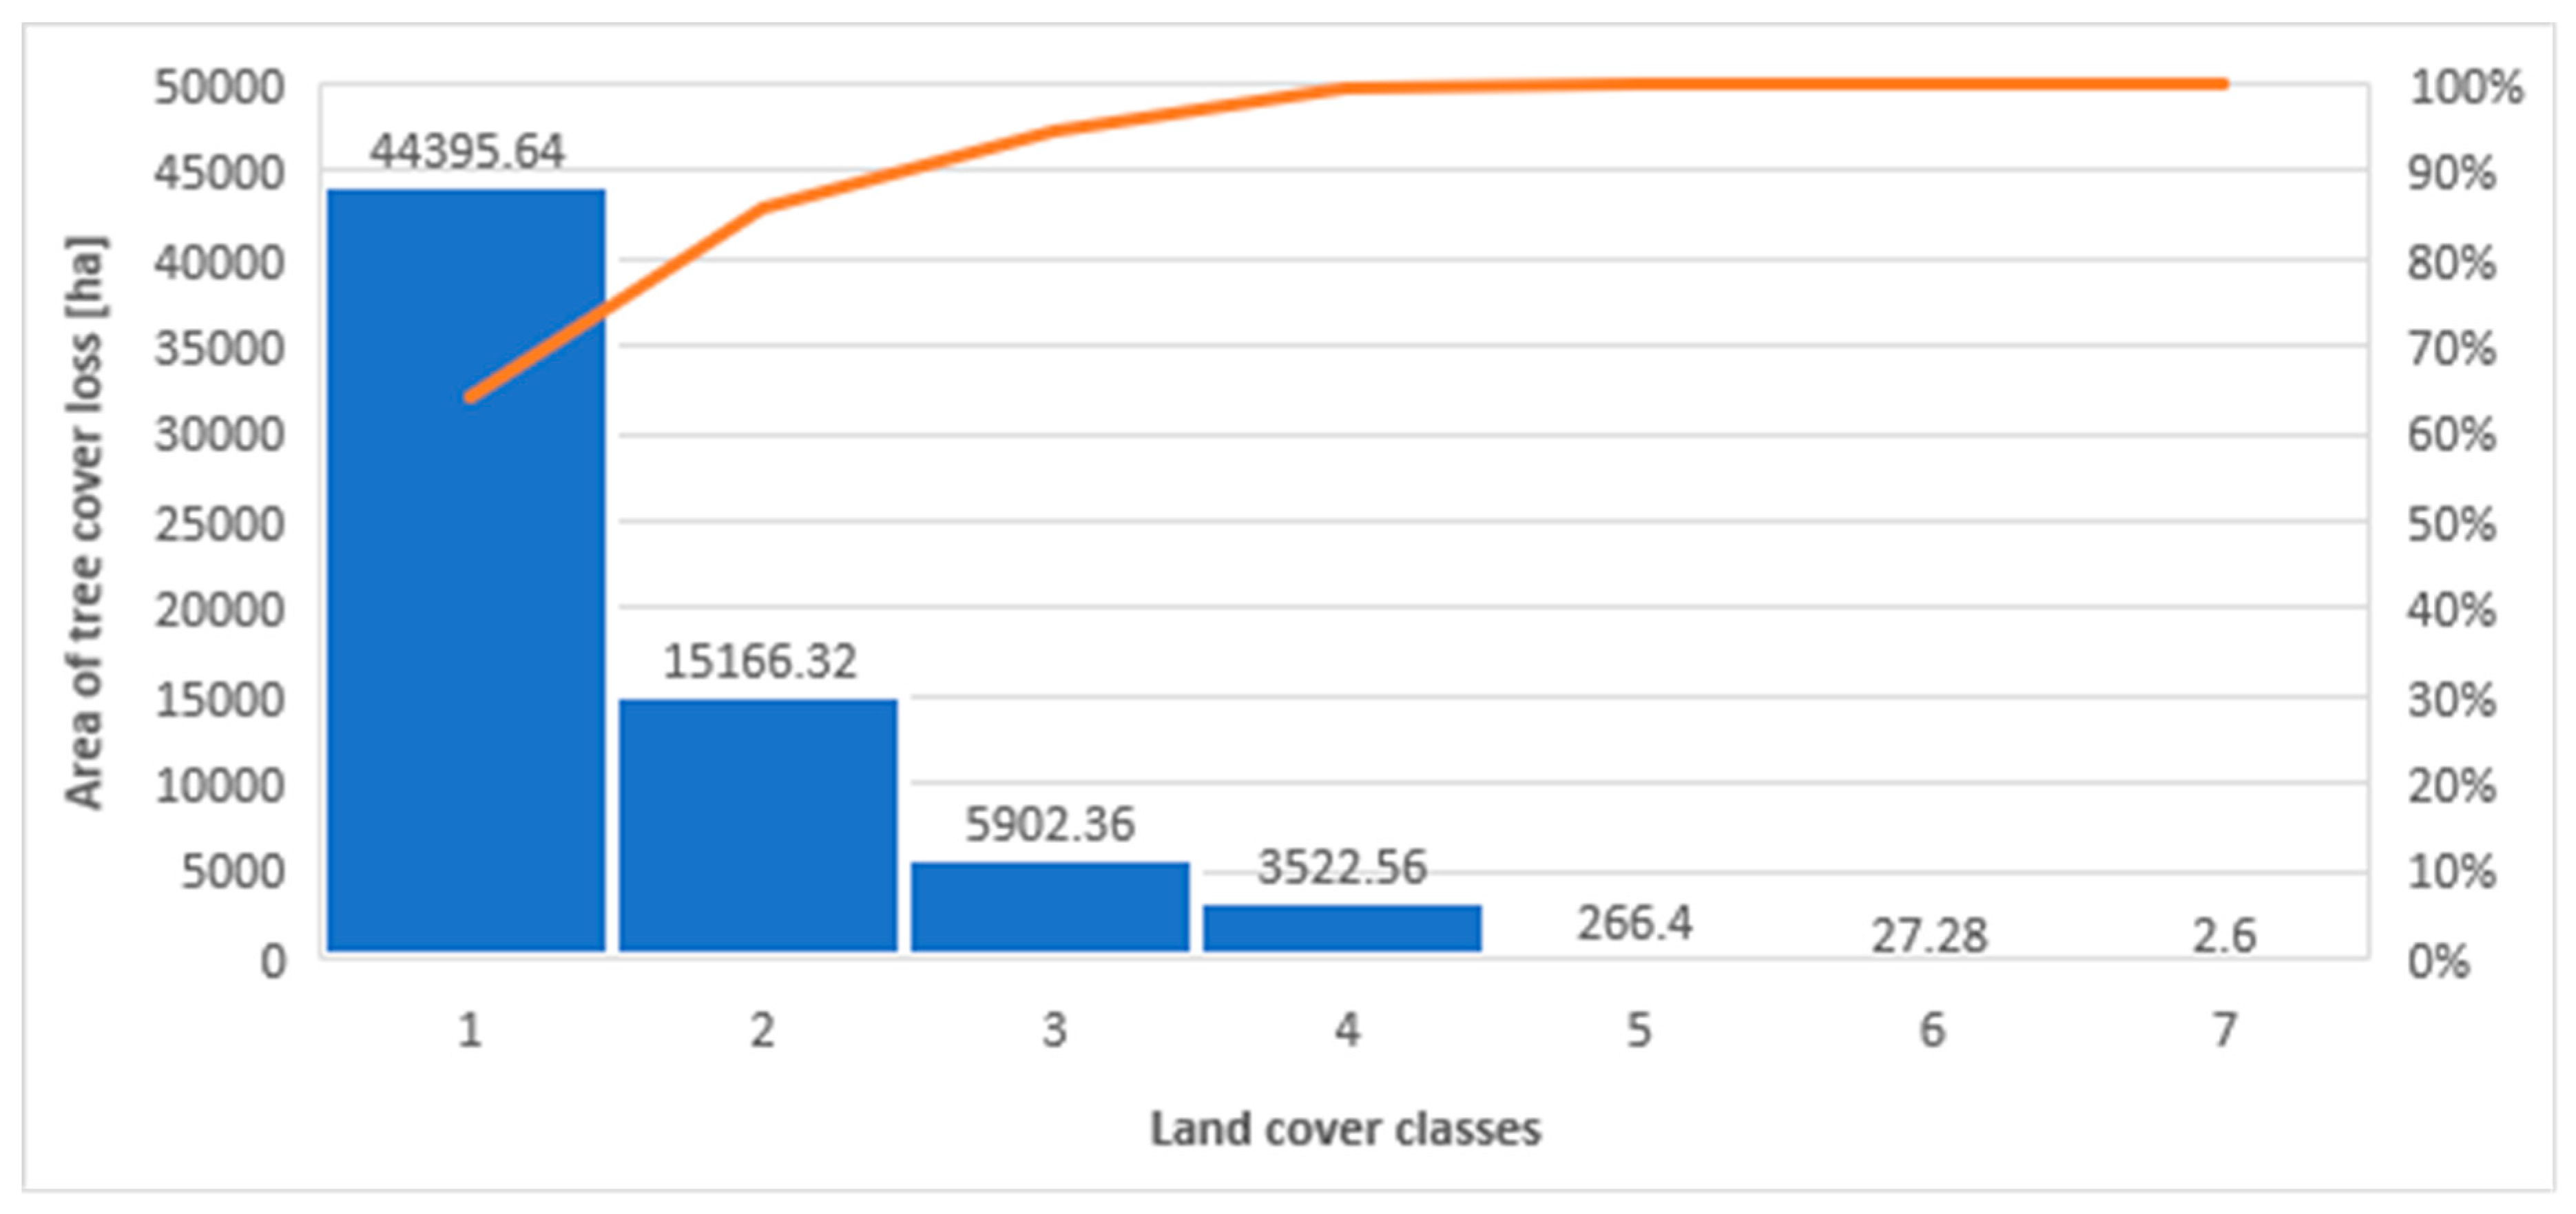
Table 1.
Confusion matrix for Sentinel-2-derived change detections only compared to Planet imagery. The values shown in blue colour are the results without the use of the zone of ‘potential forest change’.
Table 1.
Confusion matrix for Sentinel-2-derived change detections only compared to Planet imagery. The values shown in blue colour are the results without the use of the zone of ‘potential forest change’.
| Predicted Class | Row Totals | User’s Accuracy | Overall Accuracy | |||
|---|---|---|---|---|---|---|
| No Change | Change | |||||
| Reference class | No Change | 223 | 77 | 300 | 74.33% 74.33% | |
| Change | 29 126 | 271 474 | 300 600 | 90.33% 79% | ||
| Column Totals | 252 349 | 348 551 | 600 900 | |||
| Producer’s Accuracy | 88.49% 63.89% | 77.87% 86.02% | ||||
| Overall Accuracy | 82.33% 77.44% | |||||
Table 2.
Habitat sensitivity parameters concerning the land-use/land-cover (LULC) classes. Roads, rails, water, tree loss, and urban describe the potential impact on the respective LULC class.
Table 2.
Habitat sensitivity parameters concerning the land-use/land-cover (LULC) classes. Roads, rails, water, tree loss, and urban describe the potential impact on the respective LULC class.
| LULC | Habitat Suitability | Impact Factors | ||||
| Roads | Rails | Water | Tree Loss | Urban | ||
| Tree cover (broadleaved, evergreen) | 1 | 0.8 | 0.7 | 0.6 | 0.9 | 0.8 |
| Mosaic (tree cover, natural vegetation) | 1 | 0.6 | 0.6 | 0.5 | 0.7 | 0.6 |
| Sparse herbaceous/shrubs | 0.75 | 0.5 | 0.5 | 0.4 | 0.6 | 0.5 |
| Cultivated and managed areas | 0.25 | 0.3 | 0.1 | 0.1 | 0.5 | 0.4 |
| Mosaic (crops, trees, natural vegetation) | 0.5 | 0.4 | 0.3 | 0.2 | 0.5 | 0.4 |
Table 3.
Threat parameters applied in this study. (Adapted from: [54]).
Table 3.
Threat parameters applied in this study. (Adapted from: [54]).
| Threat | Max Distance [km] | Weight | Decay Function |
|---|---|---|---|
| Roads and rails | 7 | 0.9 and 0.75 | Linear |
| Waterways | 3 | 0.5 | Linear |
| Forest loss | 4 | 1 | Linear |
| Urban areas | 7 | 0.85 | Linear |
Table 4.
Mean and standard deviation (SD) of landscape biodiversity scores (LBSs) aggregated per district. The LBS was created by aggregating the habitat quality indices by calculating each district’s mean and standard deviation within the study area. The value range is from 0 to 1, where 0 represents low and 1 high biodiversity.
| Zonal Statistics of Biodiversity Scores | ||||
|---|---|---|---|---|
| Scenario 1 (Infrastructure Only) | Scenario 2 (with Forest Cover Loss) | |||
| District Name: | Mean | SD | Mean | SD |
| Pasir Mas | 0.405 | ±0.167 | 0.069 | ±0.101 |
| Pasir Putih | 0.389 | ±0.209 | 0.187 | ±0.118 |
| Tanah Merah | 0.601 | ±0.255 | 0.078 | ±0.144 |
| Tumpat | 0.272 | ±0.215 | 0.274 | ±0.189 |
| Kota Bharu | 0.281 | ±0.19 | 0.165 | ±0.102 |
| Machang | 0.637 | ±0.334 | 0.239 | ±0.368 |
| Besut | 0.738 | ±0.299 | 0.492 | ±0.383 |
| Bachok | 0.342 | ±0.174 | 0.241 | ±0.122 |
Disclaimer/Publisher’s Note: The statements, opinions and data contained in all publications are solely those of the individual author(s) and contributor(s) and not of MDPI and/or the editor(s). MDPI and/or the editor(s) disclaim responsibility for any injury to people or property resulting from any ideas, methods, instructions or products referred to in the content. |
© 2024 by the authors. Licensee MDPI, Basel, Switzerland. This article is an open access article distributed under the terms and conditions of the Creative Commons Attribution (CC BY) license (https://creativecommons.org/licenses/by/4.0/).
Share and Cite
MDPI and ACS Style
Louis, V.; Page, S.E.; Tansey, K.J.; Jones, L.; Bika, K.; Balzter, H. Tiger Habitat Quality Modelling in Malaysia with Sentinel-2 and InVEST. Remote Sens. 2024, 16, 284. https://doi.org/10.3390/rs16020284
AMA Style
Louis V, Page SE, Tansey KJ, Jones L, Bika K, Balzter H. Tiger Habitat Quality Modelling in Malaysia with Sentinel-2 and InVEST. Remote Sensing. 2024; 16(2):284. https://doi.org/10.3390/rs16020284
Chicago/Turabian StyleLouis, Valentin, Susan E. Page, Kevin J. Tansey, Laurence Jones, Konstantina Bika, and Heiko Balzter. 2024. "Tiger Habitat Quality Modelling in Malaysia with Sentinel-2 and InVEST" Remote Sensing 16, no. 2: 284. https://doi.org/10.3390/rs16020284
Note that from the first issue of 2016, this journal uses article numbers instead of page numbers. See further details here.