
Modeling Climate Characteristics of Qinghai Lake Ice in 1979–2017 by a Quasi-Steady Model
by
 , ,
, ,
Hong Tang
1,2,3,
Yixin Zhao
4,
Lijuan Wen
1,2,*,
Matti Leppäranta
5,
Ruijia Niu
1,2,3 and
Xiang Fu
6 1
Key Laboratory of Cryospheric Science and Frozen Soil Engineering, Northwest Institute of Eco-Environment and Resources, Chinese Academy of Sciences, Lanzhou 730000, China
2
Qinghai Lake Comprehensive Observation and Research Station, Chinese Academy of Sciences, Gangcha 812300, China
3
University of Chinese Academy of Sciences, Beijing 100049, China
4
Powerchina Sichuan Electric Power Engineering Co., Ltd., Chengdu 610000, China
5
Institute of Atmospheric and Earth Sciences, University of Helsinki, 00014 Helsinki, Finland
6
State Key Laboratory of Coastal and Offshore Engineering, Dalian University of Technology, Dalian 116024, China
*
Author to whom correspondence should be addressed.
Remote Sens. 2024, 16(10), 1699; https://doi.org/10.3390/rs16101699
Submission received: 22 February 2024
/
Revised: 2 May 2024
/
Accepted: 7 May 2024
/
Published: 10 May 2024
Abstract
:Lakes on the Qinghai Tibet Plateau (QTP) are widely distributed spatially, and they are mostly seasonally frozen. Due to global warming, the thickness and phenology of the lake ice has been changing, which profoundly affects the regional climate evolution. There are a few studies about lake ice in alpine regions, but the understanding of climatological characteristics of lake ice on the QTP is still limited. Based on a field experiment in the winter of 2022, the thermal conductivity of Qinghai Lake ice was determined as 1.64 W·m−1·°C−1. Airborne radar ice thickness data, meteorological observations, and remote sensing images were used to evaluate a quasi-steady ice model (Leppäranta model) performance of the lake. This is an analytic model of lake ice thickness and phenology. The long-term (1979–2017) ice history of the lake was simulated. The results showed that the modeled mean ice thickness was 0.35 m with a trend of −0.002 m·a−1, and the average freeze-up start (FUS) and break-up end (BUE) were 30 December and 5 April, respectively, which are close to the field and satellite observations. The simulated trend of the maximum ice thickness from 1979 to 2017 (0.004 m·a−1) was slightly higher than the observed result (0.003 m·a−1). The simulated trend was 0.20 d·a−1 for the FUS, −0.34 d·a−1 for the BUE, and −0.54 d·a−1 for the ice duration (ID). Correlation and detrending analysis were adopted for the contribution of meteorological factors. In the winters of 1979–2017, downward longwave radiation and air temperature were the two main factors that had the best correlation with lake ice thickness. In a detrending analysis, air temperature, downward longwave radiation, and solar radiation contributed the most to the average thickness variability, with contributions of 42%, 49%, and −48%, respectively, and to the maximum thickness variability, with contributions of 41%, 45%, and −48%, respectively. If the six meteorological factors (air temperature, downward longwave radiation, solar radiation, wind speed, pressure, and specific humidity) are detrending, ice thickness variability will increase 83% on average and 87% at maximum. Specific humidity, wind, and air pressure had a poor correlation with ice thickness. The findings in this study give insights into the long-term evolutionary trajectory of Qinghai Lake ice cover and serve as a point of reference for investigating other lakes in the QTP during cold seasons.
1. Introduction
As one of the fundamental geographical units in terrestrial ecosystems, lakes play an important role as a source of surface water [1]. Out of the 117 million lakes worldwide, over half are encompassed by varying degrees of ice cover, predominantly situated within the latitude range of 30°–75°N in the Northern Hemisphere. The presence of lake ice confers a multitude of services to humanity, including a platform for fishing, traffic and transportation, and regulation of water cycles within ecosystems [2]. Lake ice formation is dominated by the morphology, size, and depth of the lake, and the local meteorological conditions [3,4,5]. The thermal properties of lakes differ largely from the surrounding land area, and the presence of ice introduces significant changes into the lake–air interaction as compared with open water [4,6], particularly in the surface temperature, albedo, and surface roughness [3,7].
Due to recent climate warming, the overall trend of lake ice worldwide shows retreatment [2]. The FUS (freeze-up start) is delayed, the BUE (break-up end) begins earlier, and the ID (ice duration) is shortened [8,9]. In the past 150 years, the average ID has decreased by 28 days in the Northern Hemisphere, and in recent decades, the decay has accelerated [10]. Currently, there are about 15,000 lakes in the Northern Hemisphere that experience a seasonal ice cover, and the probability of ice-free years is increasing. It is expected that 4.6% of the lakes in the Northern Hemisphere will experience an intermittent ice cover in the future, with some lakes in northern United States, Norway, and Sweden facing permanent disappearance of their ice cover [2]. The decay or even disappearance of lake ice not only affects natural ecosystems, with increased water temperature, excessive algae growth, and changes in underwater communities, but also impacts socio-economic aspects such as traffic and transportation on frozen lakes and other on-ice activities [2,11].
In Asia, the Qinghai-Tibet Plateau (QTP), known as the “Roof of the World” and “Asia’s Water Tower”, is the highest plateau in the world and considered a sensitive area for climate change in China. In the QTP the warming rate has been nearly twice as fast as the Earth average [12,13]. Lakes in the QTP account for more than 50% of the total area and total number of natural lakes in China [1,12], and most of them are seasonally freezing and regarded as sentinels of regional climate change [7,13,14]. Lake ice decay has been observed, in general, in the QTP [15,16,17], but owing to intricate mechanisms in lake ice processes, some lakes have extended their freezing periods [16]. The average temperature has increased by 2.2 °C from 1958 to 2019 (0.37 °C/decade) in the Qinghai Lake Basin, with the largest rise of 0.52 °C/decade in winter [18].
The current research methods for QTP lake ice thickness and phenology include satellite remote sensing, field observations, and model simulations [16,17,19,20,21,22,23,24]. Satellite technology has the ability to observe a large area on a daily basis, allowing for the acquisition of spatial distribution and changes in lake ice conditions. These methods are commonly utilized in reconstructing lake ice phenology [7]. According to [25], lakes larger than 40 km2 typically begin to freeze over from early November to mid-December in the QTP, with complete ice cover reached from mid-November to early January. Ice melting usually starts from mid-March to early May, and the ice has completely melted from mid-April to early June. Lake ice phenology not only exhibits temporal heterogeneity but also shows significant spatial differentiation in large lakes. For instance, the Qinghai Lake, which is the largest lake in the QTP, and even in China, first freezes in the eastern region of Haiyan Bay and first melts in the western part, such as at Heima River [26]. In contrast to remote sensing methods, on-site ice sampling provides the most authentic and direct ice information. However, due to the harsh winter environment at the QTP, only in a few large and common lakes have in situ ice observations been conducted, albeit with frequent missing data in manual observation records that are not sufficient to study lake ice climatology. To overcome the limitations of the resolution and information loss associated with remote sensing observations, as well as the constraints of manual observations, this study employs model simulations for lake ice research at the QTP.
Mathematical lake ice models can be divided into analytic and numerical models. Stefan developed the first ice growth model [27] (also called the Stefan model) based on the temperature gradient across lake ice cover. This model has been further developed by many researchers [28,29,30], including the Leppäranta and Zubov models [3]. Analytic ice growth models are quasi-steady, while numerical models include time-dependent models adopted from sea ice models [3], such as CLIMo (Canadian Lake Ice Model), HIGHTSI (High Resolution Thermodynamic Snow and Ice Model), and SCHISM (Semi-implicit Cross-scale Hydroscience Integrated System Model).
At the Qinghai Lake, a previous study employed a calibrated Stefan model to reconstruct the temporal evolution of ice cover from 2000 to 2019, revealing an annual average ice thickness ranging between 32 cm and 37 cm [31]. However, due to strong solar radiation at the QTP deeply affecting ice growth and melting [3,31,32,33], this model is incomplete with solar forcing ignored [34]. In order to circumvent the calibration of the parameters in numerical models, which often necessitates extensive field experiments and historical data, the multi-layer modeling approach by Leppäranta [3], which takes energy balance into consideration, was adopted. Thermal conductivity of ice is one of the key parameters in lake ice modeling. To address this, a field experiment was conducted in the winter of 2022 to measure the thermal conductivity for modeling applications in Qinghai Lake.
This study aims to propose a reference value for the thermal conductivity of Qinghai Lake ice to evaluate the ice model performance, and to reconstruct the evolution of ice thickness and phenology from 1979 to 2017, supplementing the observation deficiencies of previous years, and exhibiting the climatic characteristics of the ice cover. Furthermore, qualitative and quantitative statistical analyses were conducted using a correlation analysis and a detrending analysis to assess the influence of meteorological factors on the ice season. This work attempts to contribute to future exploration of climatic trends on Qinghai Lake ice thickness and phenology and serve as a reference for studying other lakes in the QTP.
2. Research Region, Data, and Models
2.1. Research Region
Qinghai Lake, located at the junction of Gangcha County, Gonghe County, and Haiyan County in the Qinghai Province (Figure 1), is the largest lake in China with an area reaching 4597 km2 as of September 2019 [35]. Situated at an altitude of 3196 m above sea level, the lake lies at the intersection zone between China’s eastern monsoon region, northwest arid region, and southwest high-cold region. It belongs to a plateau continental-cold climate characterized by intense sunlight and low precipitation. The lake spans from 99.60°E to 100.27°E and from 36.53°N to 37.25°N. With a water volume of 785.2 × 10⁵ m3, it stretches approximately 109 km in length and up to about 65 km in width [26]. The average depth is 21 m and the maximum depth is 27 m [36]. The lake water has weak alkalinity with a pH value of 9.23. From the 1960s to the early 21st century, the salinity of Qinghai Lake increased year by year from 12.49‰ to 15.34‰ and then gradually decreased to 10.40 ‰ [37].
2.2. Data
2.2.1. Lake Ice Heat Conductivity
From 16 February to 1 March in 2022, a comprehensive field experiment was conducted at the Qinghai Lake, specifically at 36.59°N and 100.50°E (Figure 2a). The observations included lake ice and water temperature, heat flux in lake ice, as well as solar radiation transmitted into the water body (unpublished). Based on the heat flux and temperature gradient in the ice, the ice heat conductivity of the Qinghai Lake ice was evaluated. The heat flux was measured using the HFP01SC instrument (Hukseflux, Delft, The Netherlands) at a depth of 12.5 cm below the ice surface, while the ice temperature was recorded at depths of 10 cm and 15 cm beneath the ice surface using the PTWD-2A device (Jinzhou Sunshine Meteorology Technology Co., Ltd., Jinzhou, China).
2.2.2. Lake Ice Thickness from Airborne Radar
The ice thickness in 2018–2019 on the Qinghai Lake was observed by an IGPR-30 radar system (Dalian Zhongrui Technology Development Co., Ltd., Dalian, China), deployed by a UAV (unmanned aerial vehicle), which was equipped with laser ranging, GPS differential positioning, high-definition camera, etc. The center frequency of the radar was 400 MHz, the sampling interval was 2 picoseconds, and the detection accuracy could reach a millimeter level [31].
The principle of ice thickness measurement of the device is that the radar emits high-frequency electromagnetic waves that, upon encountering the air–ice and ice–water interfaces, are reflected back to the antenna. Assuming that the radar waves are transmitted to and returned from the interfaces in equal time frames, the ice thickness is obtained by calculating the two-way travel time, along with the dielectric constant of the ice and the speed of electromagnetic wave propagation through the air.
Taking into consideration staff safety and the limitations of the UAV battery, the 15 observation points (Figure 1) were arranged along the lake side. The experiment period was divided into three stages: 30 January–1 February, 1–3 March, and 22–24 March 2019, on the basis of ice thickness evolution (ice growth, near-equilibrium, and ice melting).
2.2.3. Lake Ice Thickness from the Xiashe Hydrologic Station
The Xiashe hydrologic station is situated in the southeast part of the Qinghai Lake in the northwest direction of the Erliangjian scenic area at a distance of approximately 7300 m from Erliangjian (Figure 1). Since 1 January 1983, the station has conducted on-site ice sampling to measure the thickness of ice manually. Observers utilize an L-shaped steel ruler to measure ice thickness around 1000 m away from the lakeshore. The observation period spans from early January to late March or early April [26]. These ice observations accurately depict the prevailing state of lake ice during each winter. However, data for the winters of 1996 and 1997 are absent, and due to the harsh winter environment and poor bearing capacity of ice during the melting period, there are many missing values in other years. Therefore, the data are not enough to study climatic characteristics of the ice cover.
2.2.4. Gangcha Meteorological Station Data
The Gangcha station is the nearest national reference meteorological station to the Qinghai Lake. The meteorological observations used in this article are from the China Meteorological Administration’s National Meteorological Science Data Center (http://data.cma.cn/, accessed on 1 October 2023), specifically the Chinese Surface Climate Daily Dataset (V3.0). This article extracts the pressure data from 1979 to 2017 for the long-term lake ice research.
2.2.5. Meteorological Elements Gradient of Yulei Station on the Qinghai Lake
The dataset of meteorological observations on the surface of the Qinghai Lake [38] was obtained from the National Tibetan Plateau Data Center (https://cstr.cn/18406.11.Meteoro.tpdc.270732, accessed on 17 October 2023). The observation site is located at the Qinghai Lake Yulei station (36.59°N, 100.5°E), above the water surface. The observation period is from 23 October 2018 to 31 December 2019, with a temporal resolution of 10 min. The dataset has undergone quality control and excludes duplicate records, as well as data that are clearly beyond physical basis or instrument range. The observed elements used in this article include wind speed, air temperature, relative humidity, four-component radiation balance, and lake surface temperature. The data cover the entire freezing period in the winter of 2018.
2.2.6. Terra/MODIS Remote Sensing Images
The combination of Terra, MODIS, corrected reflectance, and Bands 3–6–7 is a specific base layer utilized for presenting ice context in 2018–2019 in this study (https://wvs.earthdata.nasa.gov, accessed on 2 January 2024). This dataset combines data from three bands: Band 3 (red), Band 6 (green), and Band 7 (blue) to create false-color images. The use of this band combination is particularly effective for mapping snow and ice due to the distinct reflective and absorptive properties of these elements in different parts of the electromagnetic spectrum.
2.2.7. China Meteorological Forcing Dataset (1979−2018)
Due to the harsh QTP environment, stations often have missing measurements and significant errors in calculating the longwave and solar radiation. This hampers long-term research at the Qinghai Lake. Therefore, the China Meteorological Forcing Dataset (CMFD) was adopted [39]. This data integrates the existing international data sources, such as the Princeton reanalysis data, GLDAS data, GEWEX−SRB radiation data, as well as conventional meteorological observations from the China Meteorological Administration. It includes near-surface air temperature, specific humidity, wind speed at 10 m, solar radiation, and downward longwave radiation with a spatial resolution of 0.1°. This dataset is currently one of the best quality datasets available [33,40,41,42,43], more details can be found at https://cstr.cn/18406.11.AtmosphericPhysics.tpe.249369.file, (accessed on 10 October 2023).
For simulating the long-term ice evolution, five variables (air temperature, specific humidity, wind speed, downward shortwave radiation, and downward longwave radiation) were selected within Qinghai Lake freezing periods at (36.75°N, 100.35°E) from 1979 to 2017. Previous studies have found that lake surface wind speeds in the CMFD dataset are underestimated [33,43]. Therefore, when driving the model, a correction was made by adding a fixed bias of +1.19 m·s−1 to account for this underestimation [44].
2.2.8. Daily Lake Ice Extent and Coverage Dataset for the TP
The dataset of ice extent and coverage is based on the normalized difference snow index (NDSI) derived from MODIS data employing the conventional SNOWMAP algorithm to detect the daily lake ice extent and coverage under clear sky conditions at a spatial resolution of 500 m. This dataset encompasses extensive plateau lakes exceeding 3 km2, resulting in a comprehensive daily record of lake ice extent and coverage for 308 lakes [45]. Adopting a threshold of 10% lake ice coverage to determine the freezing period for Qinghai Lake enabled us to extract precise information on the FUS and BUE from 2002 to 2017. This dataset was utilized for evaluating the simulation outcome (https://www.scidb.cn/detail?dataSetId=618470093105397760, accessed on 11 November 2023).
2.3. Models and Methods
2.3.1. The Quasi-Steady Lake Ice Model
The model is based on the quasi-steady ice growth and melting formulae derived in [3]. The surface energy balance is written as follows:
where the term represents the net solar radiation, and denote the longwave radiation emitted by the atmosphere and lake surface, respectively, is emissivity of the surface, and are the turbulent sensible and latent heat fluxes, respectively, and is the heat flux associated with precipitation.
In analytic modeling, and some other applications, linearization of energy balance can be introduced [3]. Taking into account the solar radiation penetrated into the ice in the energy balance, we have the following:
where is the air temperature, is the surface temperature, and the parameters and do not explicitly depend on the surface temperature. The linearization can be interpretated at the limits as: for the surface layer becomes a low pass filter for atmospheric temperature, and (in practice) , but the smaller it is the weaker the coupling is between the surface temperature and the air temperature.
With the ice growth condition , one can arrive at [3]:
where is the latent heat of freezing, is ice thickness, is time, is heat flux from water, is thermal conductivity of ice, and is the freezing point. Equation (3) is based on the continuity of heat flow from the ice bottom to the atmospheric surface layer. Eliminating the surface temperature , we have the following:
If the analytic solution is as follows:
There are three parameters: contains the ice thermal properties, accounts for the radiation balance, and is buffer due to air–surface temperature difference.
Modeling the melting of ice is in principle straightforward [3]. Ice loss is directly from external fluxes, and heat conduction is not important. With the equation is as follows:
where is the light attenuation coefficient. Assuming no significant heat sources in the water and sediments, one can assume, for simplicity, that . Thus, the formula is as follows:
More details are in [3]. This model is referred to as the Leppäranta model below.
2.3.2. Correlation Analysis and Detrending Analysis
Correlation and detrending analyses were employed to qualitatively and quantitatively investigate the statistical causality between ice thickness on the Qinghai Lake and concurrent meteorological factors during the freezing periods. Correlation analysis provides the strength and direction of the linear relationship between variables, enabling assessment of the extent to which changes in one variable are associated with changes in another. This analysis facilitates the identification of potential associations and dependencies, providing valuable insights into complex interactions within the variables.
Detrending involved elimination of low-frequency variations attributed to climate change while preserving seasonal fluctuations, effectively serving as a high-pass filter for assessing the influence of the key physical factors on lake ice variability [14]. In this study, detrending operation was separately applied to six main meteorological factors (air temperature, wind speed, specific humidity, atmospheric pressure, solar radiation, and downward longwave radiation) individually and in pairs. The Leppäranta model [3] in Section 2.3.1 allows us to simulate the detrended ice thickness variability for analysis of long-term impact of each meteorological factor. The combination of correlation and detrending analysis provides a comprehensive approach for exploring the relationships and underlying dynamics in lake ice season. These methods enable uncovering valuable insights that enhance our understanding of ice evolution while contributing to robustness and validity of findings.
3. Results
3.1. Thermal Conductivity Observation Result
Based on the field station described in Section 2.2.1, the mean value of heat conductivity of ice was 1.64 W·m−2·°C−1 (ice temperature was about −3.81 °C), 20% less than what is known for pure ice (Figure 2b).
3.2. Modeled Qinghai Lake
3.2.1. Lake Ice in 2018–2019
The simulated ice thickness in the three field experiments is statistically consistent with the airborne radar observations (Figure 3). The model simulated ice formation to commence on 11 December 2018, which is consistent with the Terra/MODIS images (Figure 4). Based on the remote sensing images, on 11 December 2018, sporadic floating ice appeared at the northwestern edge of the lake, the land including surrounding mountains around Qinghai Lake was covered with snow. Until 13 December, floating ice began to appear gradually in the north and west waters of Qinghai Lake. Furthermore, 16 December is taken as the FUS, based on the report from the Qinghai Provincial Meteorological Bureau (http://qh.cma.gov.cn/qxfw/tqqh/201901/t20190124_199371.html, accessed on 12 December 2023).
The simulated melting at the Qinghai Lake ended at ice-off on 16 April 2019, as confirmed by Terra/MODIS images (Figure 4). On 15 April, there was still floating ice on the lake, but by 16–17 April, except for some floating ice in the western part of the lake, most of the main body of the lake was already ice free. According to reports from Qinghai Provincial Meteorological Bureau, on 16 April, only Haiyan Bay was not completely open yet, but most parts of the lake were basically ice free (http://qh.cma.gov.cn/qxfw/tqqh/201904/t20190424_405617.html, accessed on 12 December 2023). In general, the Leppäranta model accurately and completely simulated the ice thickness, FUS, and BUE at Qinghai Lake.
3.2.2. Long-term Climatic Characteristics in 1979–2017
Ice Thickness
Figure 5 illustrates the simulated results of the Leppäranta model in comparison to observations at the Xiashe station. The mean bias between simulated ice thickness and observations was 0.067 m, accompanied by the root mean square error (RMSE) of 0.084 m (Table 1). The average observational ice thickness during winter from 1983 to 2017 at Xiashe station was recorded as 0.24 m, while the simulated annual average ice thickness was 0.35 m. In terms of the maximum annual average, the observations reached a peak of 0.44 m in 1983, and the model predicted nearly the same value, 0.45 m, in 1979. On the other hand, the minimum annual averages for observations and modeling were 0.10 m in 1988 and 0.24 m in 2005. The modeled annual average ice thickness trend in 1979–2017 was −0.2 cm·a−1 (p < 0.01).
The simulated maximum lake ice thickness was 0.63 m in 1979, and the least annual maximum was 0.33 m in 2016. Observations at the Xiashe station indicate a decreasing trend in the maximum annual ice thickness (−0.3 cm·a−1, p < 0.05), while the simulated trend of the maximum ice thickness on Qinghai Lake, −0.4 cm·a−1 (p < 0.01), is slightly higher.
Ice Phenology
The simulated FUS was delayed by 3.20 days, the BUE occurred earlier by 0.93 days, and the freezing period was shorter by 4.13 days compared to the lake ice phenology extracted from remote sensing data using a threshold of 10% ice coverage [45]. The Leppäranta model accurately characterizes the BUE but still exhibits some deviation in simulating the FUS, which further leads to an underestimation in ID.
Figure 6 shows the simulated characteristics of ice phenology (FUS, BUE and ID) during the freezing periods at the Qinghai Lake from 1979 to 2017. The simulated average FUS is about 30 December (−2.29 days from 1 January) of the following year, with the earliest being 18 December in 1996 and the latest 18 January in 2008. Ice formation mainly occurs in mid-to-late December, accounting for approximately 68.42% of the study period.
The simulated average BUE is about 5 April (4.08 days from 1 April) with earliest being 26 March in 2013 and the latest 17 April in 1995. The simulations showed that melting mainly occurred in early-to-mid April, accounting for approximately 76.32% of the study period. On average, ID was 97 days, with the shortest at 73 days in 2016–2015 and longest at 118 days in 1979–1980.
Over the 38 years, the trend towards later ice formation was significant (0.20 d·a−1, p < 0.05). The trend towards earlier melting was also significant (−0.34 d·a−1, p < 0.01), and the ID has significantly shortened over time (−0.54 d·a−1, p < 0.01). FUS and BUE have a weak negative correlation, indicating a memory effect over the ice season.
3.3. Correlation Analysis and Detrending Analysis
3.3.1. Correlation Analysis
Air Temperature
The strongest correlation with ice thickness is given by air temperature in Figure 7a. Over the past 38 years, the average air temperature during the freezing periods of the lake was −5.34 °C, the lowest annual average temperature appeared in 1982 (−8.91 °C), and the highest temperature appeared in 2014 (−3.46 °C). The overall temperature showed a significant upward trend (0.08 °C·a−1, p < 0.01). The correlation coefficient was −0.69 (p < 0.01) between the maximum ice thickness and air temperature and −0.73 (p < 0.01) between the average ice thickness and air temperature.
Downward Longwave Radiation
The average value of downward longwave radiation in the cold seasons in 1979–2017 was 207 W·m−2, with the minimum occurring in 1982 (194 W·m−2) and the maximum occurring in 2008 (217 W·m−2) (Figure 7b). Downward longwave radiation in 1979–2017 shows a significant upward trend (0.39 W·m−2·a−1, p < 0.01). As downward longwave radiation increases, lake ice thickness decreases inversely. There is a significant negative correlation between maximum ice thickness (and average ice thickness) and downward longwave radiation, with a correlation coefficient of −0.65 (p < 0.01).
Wind Speed
The annual average wind speed was 3.76 m·s−1, with the minimum value occurring in 1988 (3.28 m·s−1) and the maximum value occurring in 2000 (4.27 m·s−1) in Figure 7c. Over a span of 38 years, there has been a significant increase in wind speed (0.0011 m·s−1·a−1, p < 0.1). The correlation coefficient between maximum ice thickness and wind speed is 0.34 (p < 0.05), while that between average ice thickness and wind speed is 0.28 (p < 0.1).
Solar Radiation
During the freezing periods from 1979 to 2017 (Figure 7d), the mean solar radiation was 182 W·m−2, with the lowest value occurring in 2011 (172 W·m−2) and the highest value occurring in 2003 (192 W·m−2). The solar radiation showed a decreasing trend (−0.09 W·m−2·a−1), but, due to its large fluctuation, it was insignificant. Previous studies have attributed the decrease in solar radiation on the Tibetan Plateau due to an increase in the water vapor content and thicker cloud layers [46,47]. Solar radiation is positively correlated with maximum ice thickness, with a correlation coefficient of 0.18, and average ice thickness with a correlation coefficient of 0.15, but both are insignificant.
Specific humidity and atmospheric pressure are also correlated with mean ice thickness and maximum ice thickness in 1979–2017, but the correlation coefficient is less than 0.15 and insignificant, so these two factors are neglected.
3.3.2. Detrending Analysis
The first column in Figure 8 presents the contribution of the six meteorological factors to the variability in average and maximum ice thickness in 1979—2017. Air temperature, downward longwave radiation, and solar radiation are identified as the primary factors influencing both average (42%, 49%, and −48%, respectively) and maximum (41%, 45%, and −48%, respectively) ice thickness variability. The negative contribution of solar radiation can be attributed to its decreasing trend during the study period, while ice thickness exhibited a positive trend. Wind speed (5.9% for average ice thickness variability and 3.2% for maximum ice thickness variability), specific humidity (15% for both), and pressure (−8.3% for average ice thickness variability and −8.5% for maximum ice thickness variability) have little impact on ice variability.
When considered in pairs, air temperature and longwave radiation exert the strongest influence on ice variability, accounting for 91% in the average case and 93% in the maximum case. Both of these factors with wind speed and specific humidity have nonlinear enhancement effects on ice thickness variability, that is, the combined effect of the two factors is greater than the direct sum of their individual contributions. Specifically, combinations of specific humidity with temperature and downward longwave radiation contribute to 68% and 66% for average and maximum ice thickness variabilities, respectively, making them the second most significant combinations after the temperature–longwave radiation combination. If all the factors are taken into consideration, the six main factors contribute 85.01% and 87.07% in both cases.
4. Discussion
4.1. Lake Ice Evolution in Other Regions
Lake ice evolution (formation, growth, and melting) in different regions vary significantly, depending largely on the latitude and altitude [3,48,49]. For example, in the arctic tundra zone, the latitude of Kilpisjärvi Lake (69.00°N, 20.48°E) in Finland is 32° higher than that of Qinghai Lake in the QTP, and its altitude (476 m) is lower compared to Qinghai Lake (3196 m). Consequently, the winter temperature at Kilpisjärvi Lake (−10 °C) and Qinghai Lake (−12 °C) are similar [48]. However, FUS occurs almost 2 months earlier in Kilpisjärvi Lake (52 ± 12 days ahead), compared to Qinghai Lake. In the boreal zone, at Pääjärvi Lake in Finland (61.03°N, 25.07°E; altitude: 103 m), the air temperature in December is 5 °C higher than in Qinghai Lake. Pääjärvi Lake freezes on 13 December, almost half a month earlier than Qinghai Lake [48]. This difference can be attributed to the large disparity in solar radiation between Finland and Tibet in November and December; while Kilpisjärvi and Pääjärvi experience nearly no solar radiation during this period, Qinghai Lake receives on average about 180 W·m−2 [49,50].
Strong solar radiation not only affects the formation of lake ice but also the growth and melting of ice. The average air temperature at Pääjärvi Lake and Qinghai Lake in April is 4 °C. In Qinghai Lake the mean break-up date is 1 April, but Pääjärvi Lake ice melts only one month later [48] and Kilpisjärvi Lake ice melts in mid-June. Kilpisjärvi Lake and Pääjärvi Lake maximum ice thickness can reach around 90–114 cm and 30–80 cm [50], respectively.
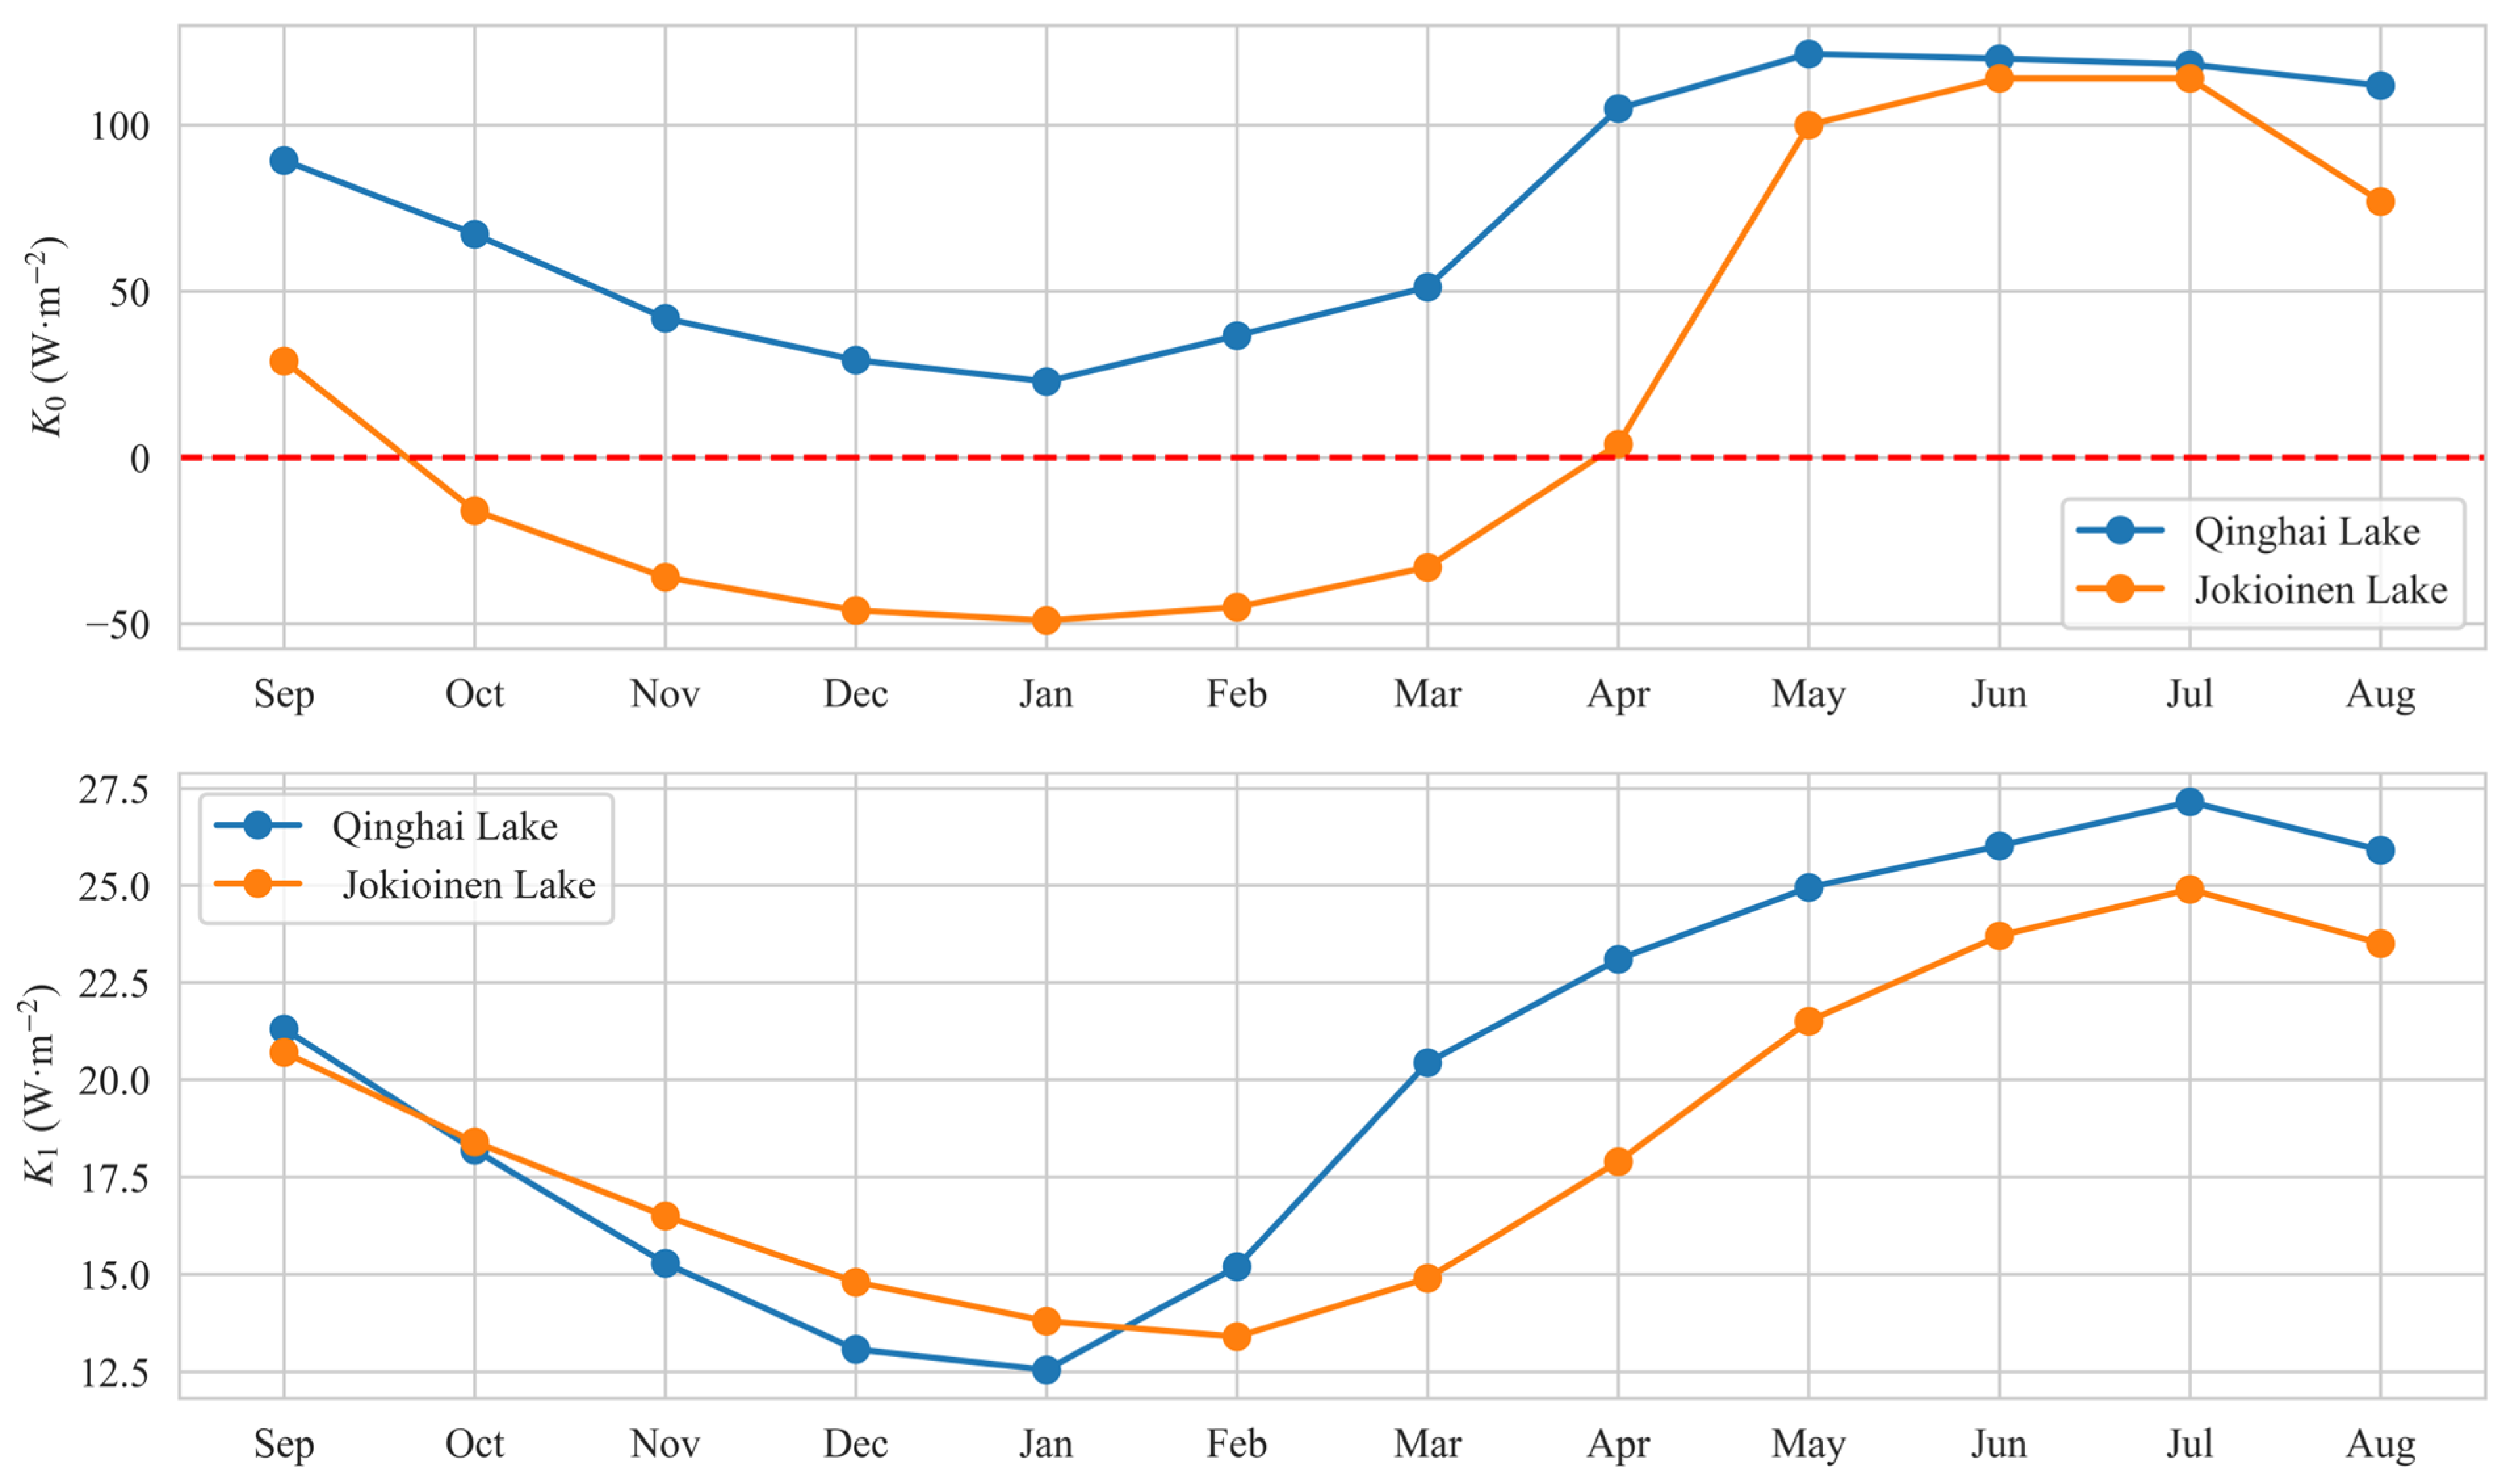
Another case that displays the energy balance difference between the boreal zone (Jokioinen, 60°48′N 23°30′E) and the QTP is shown in Figure 9. The radiation balance dominates the parameter (see Equation (2)). In October–March, at Jokioinen, but at Qinghai Lake ≈ 20–120 W·m−2 all year because of strong solar radiation. The annual averages are 76.2 W·m−2 at Qinghai Lake and 17.8 W·m−2 at Jokioinen [3]. The parameter is close in the both sites, within 10–30 W·m−2·°C−1, showing the contribution due to the air–surface temperature difference. The annual averages are 20.3 W·m−2·°C−1 at the Qinghai Lake and 18.6 W·m−2·°C−1 at Jokioinen.
In summary, by comparing Qinghai Lake with lakes in Finland at 61–69°N, one can conclude that the strong radiation in the QTP freezes Qinghai Lake much later and melts it much earlier, even though the local air temperature is close to the air temperature in Qinghai Lake (or even warmer), which clearly proves the strong role of solar radiation in lake ice season at mid-latitudes or lower.
4.2. More Information on the Leppäranta Model
Solar radiation is included in the parameter in the linearized energy balance in the Leppäranta model, and the other external factors (the zeroth order net incoming terrestrial radiation and latent heat flux, and the heat flux from liquid precipitation) are also absorbed in (zeroth order refers to assuming ). The sensible heat flux is as such proportional to and the proportionality coefficient simply goes to , as well as the first order corrections of the net terrestrial radiation and latent heat flux. The terms and appear in the ice growth equation. By physics, that adds to the insulation of ice bottom from the atmosphere, and the sign of depends on the strength of the solar radiation; in the growth season, decreases (increases) the effective freezing day-days. The values of these parameters are = 2.91 °C, = 9.72 cm for the Qinghai Lake, while in the boreal zone the reference values of the two are about −3 °C and 10 cm.
The relative difference between the Stefan model and the Leppäranta model is largest when the ice thickness is small. When , and the Stefan’s growth law is obtained. This means that all heat conducted through the ice can be moved away. When wind speed tends to zero, becomes small, and ignoring the solar radiation the ice growth is determined only by the terrestrial radiation balance.
In fact, the model also has corresponding modification to complex situations such as snow or geothermal heating. For snow cover on the ice, thermal inertia is assumed absent as in ice. The system of equations is extended into the following:
However, the Qinghai Lake is in an arid area in China where snow cover is rare. For a geothermal lake, one can arrive at equilibrium through the following:
The analytic approaches to the growth and decay of lake ice have limitations: (1) Snow–ice formation would strongly favor a numerical grid approach (however, in the Qinghai Lake, snow cover has less importance); (2) Analytic models are coarse. High spatiotemporal resolution would offer a more realistic heat conduction through ice and snow. Furthermore, (3) ignoring thermal inertia leads to overestimation of ice growth, especially when ice is thicker than half of a meter.
The ice growth model possesses negative feedback to errors. The background Stefan’s law implies that the squared ice thickness is proportional to the freezing degree-days, and in the next step the sensitivity of model ice growth to temperature is as follows:
If the model ice thickness exceeds the observation, the model ice grows then more slowly and tends to reality, and vice versa. In the melting period, in contrast, there is a positive feedback, and the sensitivity of ice decay to albedo is as follows:
When albedo begins to decrease, the ice surface is transformed to absorb more solar radiation and make the surface patchy with more and more liquid water ponds.
5. Conclusions
First, based on the field observation experiment conducted in 2022 at the Qinghai Lake, this study provided a reference value for lake ice thermal conductivity, which is determined to be 1.64 W·m−1 °C−1. Then, based on the reference value, the application of the Leppäranta quasi-steady ice model, which takes into account the energy balance, accurately and completely modeled the ice process in 2018–2019. Overall, the Leppäranta analytic model proved to be a powerful tool for studying lake ice on the TP.
Second, CMFD was used to drive the Leppäranta model for simulating the long-term characteristics of lake ice from 1979 to 2017. The average simulated ice thickness was 0.35 m with −0.2 cm·a−1 in 1979–2017. The simulated average FUS and BUE are about 30 December (−2.29 days from 1 January of the following year) and 5 April (4.08 days from April 1), respectively. From 1979 to 2017, the simulated trend of the maximum ice thickness (0.004 m·a−1) was almost identical to the observations, with an annual decrease of 0.003 m·a−1 in ice thickness. During this period, the phenology of Qinghai Lake ice showed trends of a delayed FUS (0.20 d·a−1, p < 0.05), an earlier BUE (0.34 d·a−1, p < 0.01), and a shorter duration (0.54 d·a−1, p < 0.01).
Finally, the correlation analysis indicates that downward longwave radiation and air temperature are the two dominant meteorological factors that have the best correlation with lake ice thickness. Specific humidity, wind, and pressure are three factors that have poor correlation with the ice. In the detrending analysis, air temperature, downward longwave radiation, and solar radiation are the primary factors influencing both average (42%, 49%, and −48%, respectively) and maximum (41%, 45%, and −48%, respectively) ice thickness variability. By pairs, air temperature and downward longwave radiation have the strongest influence on ice variability, accounting for 91% in the average case and 93% in the maximum case. If all the six meteorological factors are taken into consideration, they contribute to 85.01% and 87.07% of the variance in these cases.
Author Contributions
Conceptualization, Y.Z. and L.W.; data curation, X.F.; formal analysis, H.T.; funding acquisition, L.W.; investigation, Y.Z. and L.W.; methodology, H.T., Y.Z., L.W. and M.L.; project administration, L.W.; resources, R.N. and X.F.; software, Y.Z. and R.N.; supervision, H.T., L.W. and M.L.; validation, H.T. and Y.Z.; visualization, H.T. and R.N.; writing—original draft, H.T.; writing—review and editing, H.T. and M.L. All authors have read and agreed to the published version of the manuscript.
Funding
This research was jointly funded by the CAS “Light of West China” program (Grant No. E129030101), the National Natural Science Foundation of China (Grant No. 42275044), and the Natural Science Foundation of Gansu Province (Grant No. 22JR5RA073).
Data Availability Statement
In addition to public data, field ice thickness data (radar data and manual sampling data) in this paper can be provided by the corresponding author upon request.
Conflicts of Interest
Author Yixin Zhao was employed by the company Powerchina Sichuan Electric Power Engineering Co., Ltd. The remaining authors declare that the research was conducted in the absence of any commercial or financial relationships that could be construed as a potential conflict of interest.
References
- Zhang, Y.; Qin, B.; Zhu, G.; Song, C.; Deng, J.; Xue, B.; Gong, Z.; Wang, X.; Wu, J.; Shi, K.; et al. On the importance of lakes and the main ecological and environmental problems faced by lakes in China. Sci. Bull. 2022, 67, 35033519. [Google Scholar]
- Sharma, S.; Blagrave, K.; Magnuson, J.J.; O’Reilly, C.M.; Oliver, S.; Batt, R.D.; Magee, M.R.; Straile, D.; Weyhenmeyer, G.A.; Winslow, L.; et al. Widespread Loss of Lake Ice around the Northern Hemisphere in a Warming World. Nat. Clim. Chang. 2019, 9, 227–231. [Google Scholar] [CrossRef]
- Leppäranta, M. Freezing of Lakes and the Evolution of Their Ice Cover, 2nd ed.; Springer: Berlin/Heidelberg, Germany, 2023; ISBN 978-3-031-25604-2. [Google Scholar]
- Launiainen, J.; Cheng, B. Modelling of Ice Thermodynamics in Natural Water Bodies. Cold Reg. Sci. Technol. 1998, 27, 153–178. [Google Scholar] [CrossRef]
- Kang, K.-K.; Duguay, C.R.; Lemmetyinen, J.; Gel, Y. Estimation of Ice Thickness on Large Northern Lakes from AMSR-E Brightness Temperature Measurements. Remote Sens. Environ. 2014, 150, 1–19. [Google Scholar] [CrossRef]
- Li, X.; Ma, Y.; Huang, Y.; Hu, X.; Wu, X.; Wang, P.; Li, G.; Zhang, S.; Wu, H.; Jiang, Z.; et al. Evaporation and Surface Energy Budget over the Largest High-altitude Saline Lake on the Qinghai-Tibet Plateau. JGR Atmos. 2016, 121, 10470–10485. [Google Scholar] [CrossRef]
- Guo, L.; Wu, Y.; Zheng, H.; Zhang, B.; Li, J.; Zhang, F.; Shen, Q. Uncertainty and Variation of Remotely Sensed Lake Ice Phenology across the Tibetan Plateau. Remote Sens. 2018, 10, 1534. [Google Scholar] [CrossRef]
- Benson, B.J.; Magnuson, J.J.; Jensen, O.P.; Card, V.M.; Hodgkins, G.; Korhonen, J.; Livingstone, D.M.; Stewart, K.M.; Weyhenmeyer, G.A.; Granin, N.G. Extreme Events, Trends, and Variability in Northern Hemisphere Lake-Ice Phenology (1855–2005). Clim. Change 2012, 112, 299–323. [Google Scholar] [CrossRef]
- Grant, L.; Vanderkelen, I.; Gudmundsson, L.; Tan, Z.; Perroud, M.; Stepanenko, V.M.; Debolskiy, A.V.; Droppers, B.; Janssen, A.B.G.; Woolway, R.I.; et al. Attribution of Global Lake Systems Change to Anthropogenic Forcing. Nat. Geosci. 2021, 14, 849–854. [Google Scholar] [CrossRef]
- Woolway, R.I.; Kraemer, B.M.; Lenters, J.D.; Merchant, C.J.; O’Reilly, C.M.; Sharma, S. Global Lake Responses to Climate Change. Nat. Rev. Earth Environ. 2020, 1, 388–403. [Google Scholar] [CrossRef]
- Filazzola, A.; Blagrave, K.; Imrit, M.A.; Sharma, S. Climate Change Drives Increases in Extreme Events for Lake Ice in the Northern Hemisphere. Geophys. Res. Lett. 2020, 47, e2020GL089608. [Google Scholar] [CrossRef]
- Zhu, L.; Zhang, G.; Yang, R.; Liu, C.; Yang, K.; Qiao, B.; Han, B. Lake variations on Tibetan Plateau of recent 40 years and future changing tendency. J. Bull. Chin. Acad. Sci. 2019, 34, 1254–1263. [Google Scholar] [CrossRef]
- Zhang, G.; Duan, S. Lakes as Sentinels of Climate Change on the Tibetan Plateau. All Earth 2021, 33, 161–165. [Google Scholar] [CrossRef]
- Adrian, R.; O’Reilly, C.M.; Zagarese, H.; Baines, S.B.; Hessen, D.O.; Keller, W.; Livingstone, D.M.; Sommaruga, R.; Straile, D.; Van Donk, E.; et al. Lakes as Sentinels of Climate Change. Limnol. Oceanogr. 2009, 54, 2283–2297. [Google Scholar] [CrossRef] [PubMed]
- Brown, L.C.; Duguay, C.R. The Response and Role of Ice Cover in Lake-Climate Interactions. Prog. Phys. Geogr. Earth Environ. 2010, 34, 671–704. [Google Scholar] [CrossRef]
- Cai, Y.; Ke, C.; Li, X.; Zhang, G.; Duan, Z.; Lee, H. Variations of Lake Ice Phenology on the Tibetan Plateau From 2001 to 2017 Based on MODIS Data. JGR Atmos. 2019, 124, 825–843. [Google Scholar] [CrossRef]
- Qi, M.; Yao, X.; Li, X.; Duan, H.; Gao, Y.; Liu, J. Spatiotemporal Characteristics of Qinghai Lake Ice Phenology between 2000 and 2016. J. Geogr. Sci. 2019, 29, 115–130. [Google Scholar] [CrossRef]
- Sun, Y.; Li, Q.; Liu, T.; Li, Y.; Yang, Y. Analysis of Qinghai Lake’s water level changes and water balance analysis from 1956 to 2019. J. China Hydrol. 2021, 41, 91–96. [Google Scholar]
- Lv, Z.; Zhang, S.; Jin, J.; Wu, Y.; Ek, M.B. Coupling of a Physically Based Lake Model into the Climate Forecast System to Improve Winter Climate Forecasts for the Great Lakes Region. Clim. Dyn. 2019, 53, 6503–6517. [Google Scholar] [CrossRef]
- Stepanenko, V.M.; Repina, I.A.; Ganbat, G.; Davaa, G. Numerical Simulation of Ice Cover of Saline Lakes. Izv. Atmos. Ocean. Phys. 2019, 55, 129–138. [Google Scholar] [CrossRef]
- Wu, Y.; Guo, L.; Zhang, B.; Zheng, H.; Fan, L.; Chi, H.; Li, J.; Wang, S. Ice Phenology Dataset Reconstructed from Remote Sensing and Modelling for Lakes over the Tibetan Plateau. Sci. Data 2022, 9, 743. [Google Scholar] [CrossRef]
- Zhang, Y.J.; Wu, C.; Anderson, J.; Danilov, S.; Wang, Q.; Liu, Y.; Wang, Q. Lake Ice Simulation Using a 3D Unstructured Grid Model. Ocean Dyn. 2023, 73, 219–230. [Google Scholar] [CrossRef]
- Latifovic, R.; Pouliot, D. Analysis of Climate Change Impacts on Lake Ice Phenology in Canada Using the Historical Satellite Data Record. Remote Sens. Environ. 2007, 106, 492–507. [Google Scholar] [CrossRef]
- Su, R.; Ma, W.; Ma, Y.; Xie, Z.; Wang, B.; Hu, W.; Liu, J. Investigation of thermal stratification and mixed layer depth in La’ang Co in the Tibetan Plateau. J. Lake Sci. 2021, 33, 550–560. [Google Scholar] [CrossRef]
- Wang, Z.; Wu, Y.; Chang, J.; Zhang, X.; Peng, D. Temporal and spatial variation of lake ice phenology and its influencing factors in the Tibetan Plateau. Beijing Univ. Technol. 2017, 43, 701–709. [Google Scholar]
- Wang, G.; Zhang, T.; Li, X.; He, Z.; Li, Y. Detecting changes of ice phenology using satellite passive microwave remote sensing data in Qinghai Lake. J. Glaciol. Geocryol. 2021, 43, 296–310. [Google Scholar]
- Stefan, J. Ueber die Theorie der Eisbildung, insbesondere über die Eisbildung im Polarmeere. Ann. Phys. 1891, 278, 269–286. [Google Scholar] [CrossRef]
- Ashton, G.D. Thin Ice Growth. Water Resour. Res. 1989, 25, 564–566. [Google Scholar] [CrossRef]
- Nolan, M. Quantitative and Qualitative Constraints on Hind-Casting the Formation of Multiyear Lake-Ice Covers at Lake El’gygytgyn. Clim. Past 2013, 9, 1253–1269. [Google Scholar] [CrossRef]
- Maykut, G.A. The Surface Heat and Mass Balance. In The Geophysics of Sea Ice; Untersteiner, N., Ed.; Springer US: Boston, MA, USA, 1986; pp. 395–463. ISBN 978-1-4899-5354-4. [Google Scholar]
- Cao, J.; Yao, X.; Jin, H.; Zhang, T.; Gao, Y.; Zhang, D.; Zhao, Q. Spatiotemporal variation of ice thickness of Lake Qinghai derived from field measurements and model simulation. J. Lake Sci. 2021, 33, 607–621. [Google Scholar] [CrossRef]
- Kirillin, G.B.; Shatwell, T.; Wen, L. Ice-Covered Lakes of Tibetan Plateau as Solar Heat Collectors. Geophys. Res. Lett. 2021, 48, e2021GL093429. [Google Scholar] [CrossRef]
- Lazhu; Yang, K.; Wang, J.; Lei, Y.; Chen, Y.; Zhu, L.; Ding, B.; Qin, J. Quantifying Evaporation and Its Decadal Change for Lake Nam Co, Central Tibetan Plateau: LAKE EVAPORATION AND ITS CHANGE. J. Geophys. Res. Atmos. 2016, 121, 7578–7591. [Google Scholar] [CrossRef]
- Zhao, Y.; Wen, L.; Wang, M.; Zeng, L.; Niu, R. Application of the Analytic Model Based on Energy Balance into the Lake Ice Simulation of Qinghai Lake. J. Plateau Meteorol. 2023, 42, 590–602. [Google Scholar]
- Guo, F.; Li, T.; Ji, M. Time series analysis and prediction of Qinghai Lake area from 2000 to 2019. J. Sci. Technol. Eng. 2022, 22, 740–748. [Google Scholar]
- Wang, Z.; Zhang, F.; Li, X.; Cao, Y.; Hu, J.; Wang, H.; Lu, H.; Li, T.; Liu, W. Changes in the Depth of Lake Qinghai since the Last Deglaciation and Asynchrony between Lake Depth and Precipitation over the Northeastern Tibetan Plateau. Glob. Planet. Change 2020, 188, 103156. [Google Scholar] [CrossRef]
- Sun, X.; Jiang, X.; Song, G.; Zheng, P.; Zhang, K.; Gao, H.; Dou, X.; Ai, X. Spatio-temporal patterns of phytoplankton communities and their driving environmental factors in Lake Qinghai. J. Lake Sci. 2023, 35, 540–552. [Google Scholar] [CrossRef]
- Li, X. Qilian Mountains Integrated Observatory Network: Dataset of Qinghai Lake Integrated Observatory Network (An Observation System of Meteorological Elements Gradient of Yulei Station on Qinghai Lake, 2019). National Tibetan Plateau/Third Pole Environment Data Center. 2019. Available online: https://cstr.cn/18406.11.Meteoro.tpdc.270732 (accessed on 17 October 2023).
- Yang, K.; He, J.; Tang, W.; Lu, H.; Qin, J.; Chen, Y.; Li, X. China Meteorological Forcing Dataset (1979–2018). National Tibetan Plateau/Third Pole Environment Data Center. 2019. Available online: https://cstr.cn/18406.11.AtmosphericPhysics.tpe.249369.file (accessed on 10 October 2023).
- Fang, N.; Yang, K.; Lazhu; Chen, Y.; Wang, J.; Zhu, L. Research on the Application of WRF-Lake Modeling at Nam Co Lake on the Qinghai-Tibetan Plateau. Plateau Meteorol. 2017, 36, 610–618. [Google Scholar]
- Yang, J.; Huang, M.; Zhai, P. Performance of the CRA-40/Land, CMFD, and ERA-Interim Datasets in Reflecting Changes in Surface Air Temperature over the Tibetan Plateau. J. Meteorol. Res. 2021, 35, 663–672. [Google Scholar] [CrossRef]
- Chen, H.; Nan, Z. Verification of a Ground Meteorological Forcing Dataset and Its Application on Permafrost Region of Qinghai-Tibetan Plateau. In Proceedings of the 2013 IEEE International Geoscience and Remote Sensing Symposium—IGARSS, Melbourne, Australia, 21–26 July 2013; IEEE: Piscataway, NJ, USA; pp. 3610–3613. [Google Scholar]
- Du, J.; Wen, L.; Su, D. Reliability of Three Reanalysis Datasets in Simulation of Three Alpine Lakes on the Qinghai-Tibetan Plateau. Plateau Meteorol. 2019, 38, 101–113. [Google Scholar]
- Su, D.; Hu, X.; Wen, L.; Lyu, S.; Gao, X.; Zhao, L.; Li, Z.; Du, J.; Kirillin, G. Numerical Study on the Response of the Largest Lake in China to Climate Change. Hydrol. Earth Syst. Sci. 2019, 23, 2093–2109. [Google Scholar] [CrossRef]
- Qiu, Y.; Xie, P.; Leppäranta, M.; Wang, X.; Lemmetyinen, J.; Lin, H.; Shi, L. MODIS-Based Daily Lake Ice Extent and Coverage Dataset for Tibetan Plateau. Big Earth Data 2019, 3, 170–185. [Google Scholar] [CrossRef]
- Hu, R.; Zhang, J.; Chen, L.; Ma, Q.; Chen, Z.; Wu, S.; Li, J.; Kuang, Y.; Liu, J. Strengthened Connections Between Arctic Sea Ice and Thermal Conditions Over the Tibetan Plateau in May After the 2000s. JGR Atmos. 2023, 128, e2023JD039122. [Google Scholar] [CrossRef]
- Yang, K.; Ding, B.; Qin, J.; Tang, W.; Lu, N.; Lin, C. Can Aerosol Loading Explain the Solar Dimming over the Tibetan Plateau? Geophys. Res. Lett. 2012, 39, 2012GL053733. [Google Scholar] [CrossRef]
- Kirillin, G.; Leppäranta, M.; Terzhevik, A.; Granin, N.; Bernhardt, J.; Engelhardt, C.; Efremova, T.; Golosov, S.; Palshin, N.; Sherstyankin, P.; et al. Physics of Seasonally Ice-Covered Lakes: A Review. Aquat. Sci. 2012, 74, 659–682. [Google Scholar] [CrossRef]
- Leppäranta, M.; Wen, L. Ice Phenology in Eurasian Lakes over Spatial Location and Altitude. Water 2022, 14, 1037. [Google Scholar] [CrossRef]
- Korhonen, J. Long-Term Changes in Lake Ice Cover in Finland. Hydrol. Res. 2006, 37, 347–363. [Google Scholar] [CrossRef]
- Jakkila, J.; Leppäranta, M.; Kawamura, T.; Shirasawa, K.; Salonen, K. Radiation Transfer and Heat Budget during the Ice Season in Lake Pääjärvi, Finland. Aquat. Ecol. 2009, 43, 681–692. [Google Scholar] [CrossRef]
- Zaier, I.; Shu, C.; Ouarda, T.B.M.J.; Seidou, O.; Chebana, F. Estimation of Ice Thickness on Lakes Using Artificial Neural Network Ensembles. J. Hydrol. 2010, 383, 330–340. [Google Scholar] [CrossRef]
- Seidou, O.; Ouarda, T.B.M.J.; Bilodeau, L.; Hessami, M.; St-Hilaire, A.; Bruneau, P. Modeling Ice Growth on Canadian Lakes Using Artificial Neural Networks. Water Resour. Res. 2006, 42, 2005WR004622. [Google Scholar] [CrossRef]
- Zhang, W.; Witharana, C.; Liljedahl, A.; Kanevskiy, M. Deep Convolutional Neural Networks for Automated Characterization of Arctic Ice-Wedge Polygons in Very High Spatial Resolution Aerial Imagery. Remote Sens. 2018, 10, 1487. [Google Scholar] [CrossRef]
- Tom, M.; Aguilar, R.; Imhof, P.; Leinss, S.; Baltsavias, E.; Schindler, K. Lake Ice Detection from Sentinel-1 SAR with Deep Learning 2020. In Proceedings of the ISPRS Congress, Online, 31 August–2 September 2020. [Google Scholar]
Figure 1.
The Qinghai Lake, 15 radar observation points (dots), comprehensive observation site in the winter of 2022 (the yellow point 14), the Gangcha meteorological observation station (red circle), and the Xiashe hydrologic station (red star).
Figure 1.
The Qinghai Lake, 15 radar observation points (dots), comprehensive observation site in the winter of 2022 (the yellow point 14), the Gangcha meteorological observation station (red circle), and the Xiashe hydrologic station (red star).
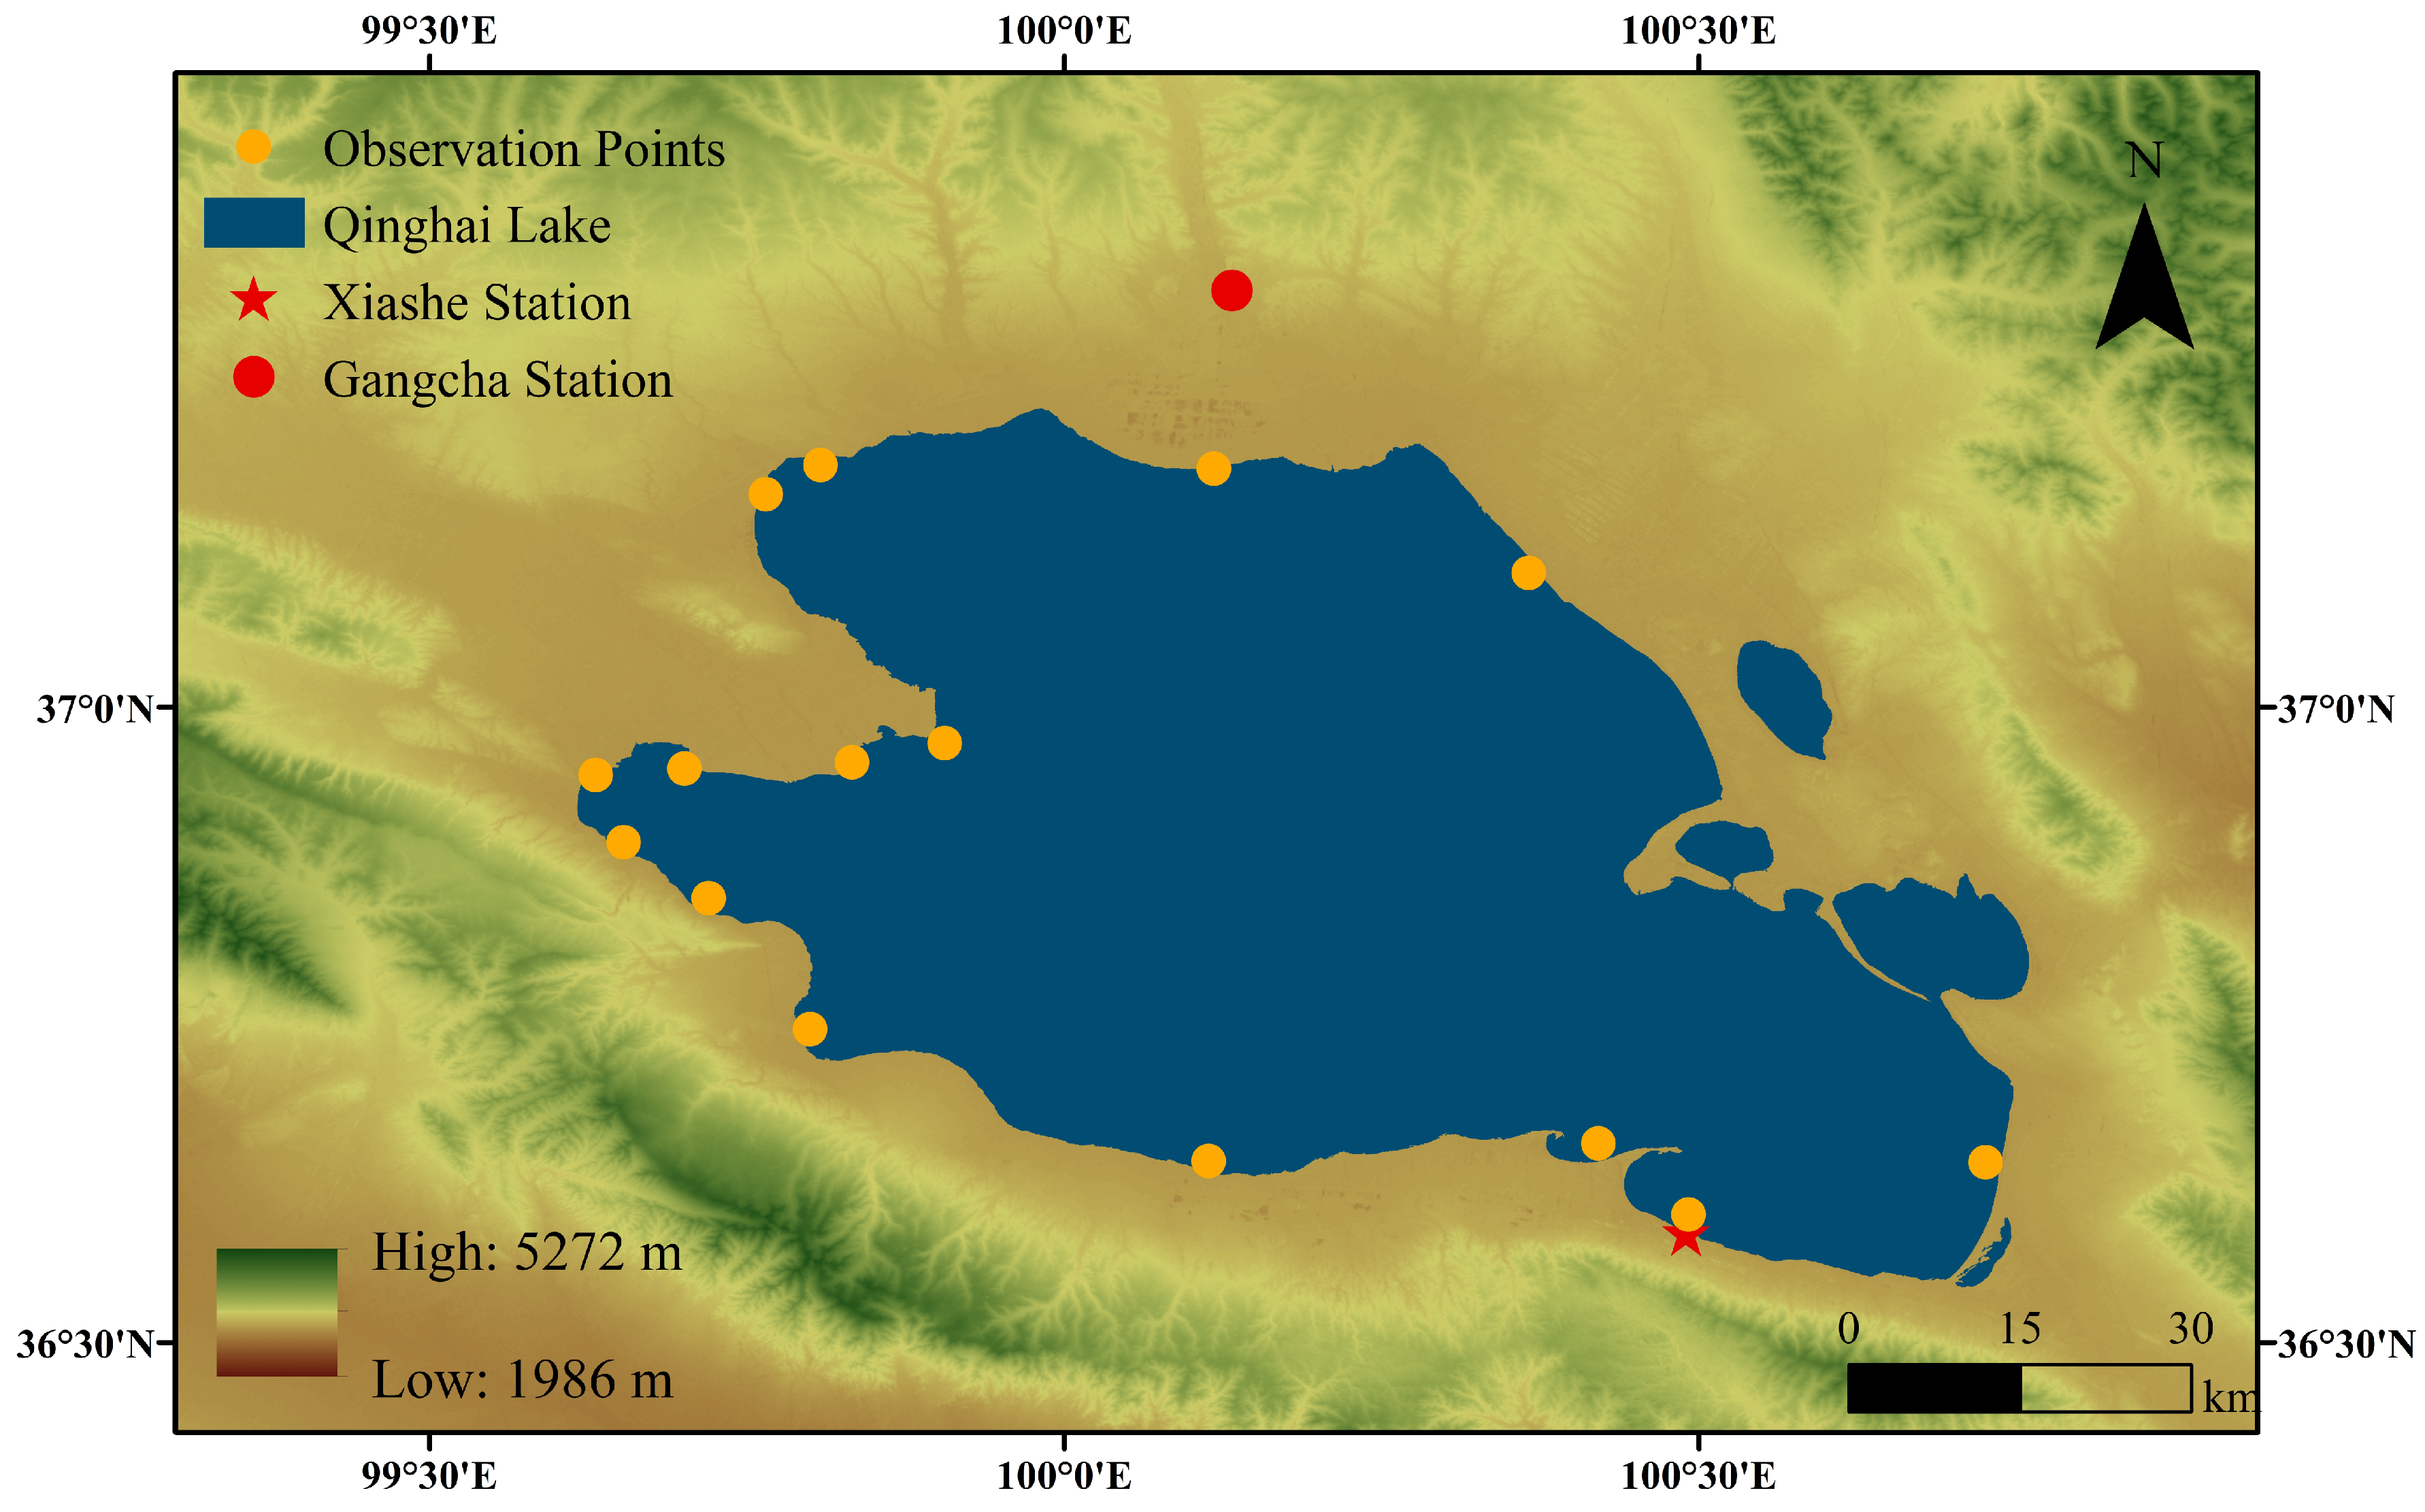
Figure 2.
The comprehensive automatic observation site on the Qinghai Lake ice surface (a), and ice heat conductivity values (purple dots) with mean value (orange line) from 16 February to 1 March in 2022 (b).
Figure 2.
The comprehensive automatic observation site on the Qinghai Lake ice surface (a), and ice heat conductivity values (purple dots) with mean value (orange line) from 16 February to 1 March in 2022 (b).
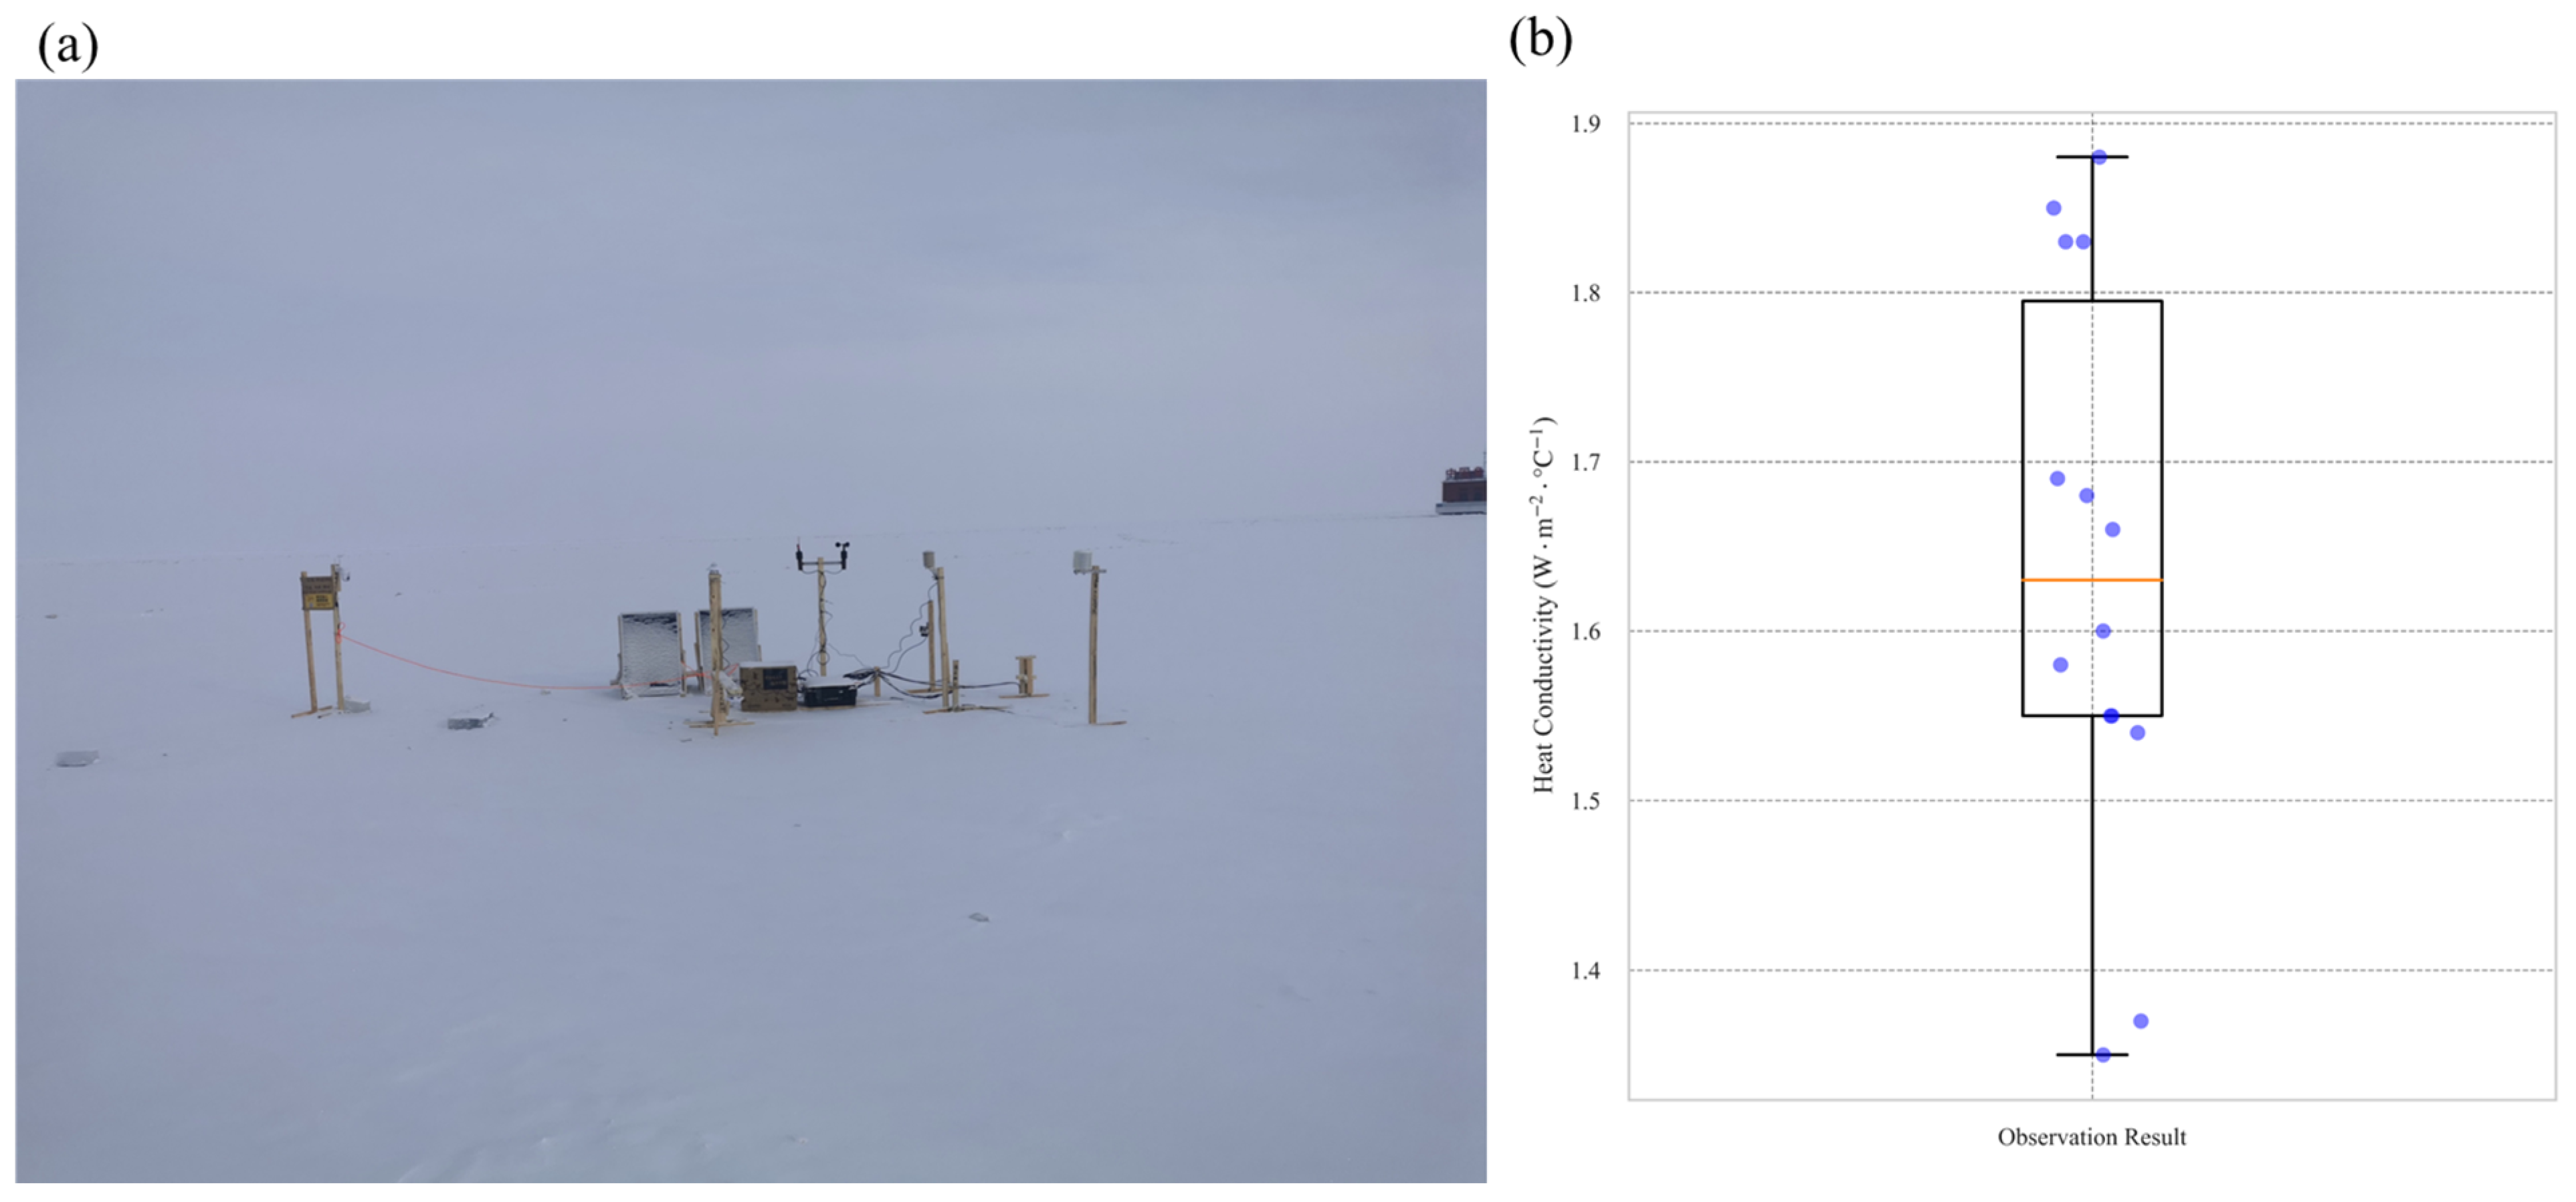
Figure 3.
The modeled Qinghai Lake ice thickness by the Leppäranta model (line), radar observation ice thickness (boxplot), and observation outliers (circles) in the freezing period in 2018–2019.
Figure 3.
The modeled Qinghai Lake ice thickness by the Leppäranta model (line), radar observation ice thickness (boxplot), and observation outliers (circles) in the freezing period in 2018–2019.
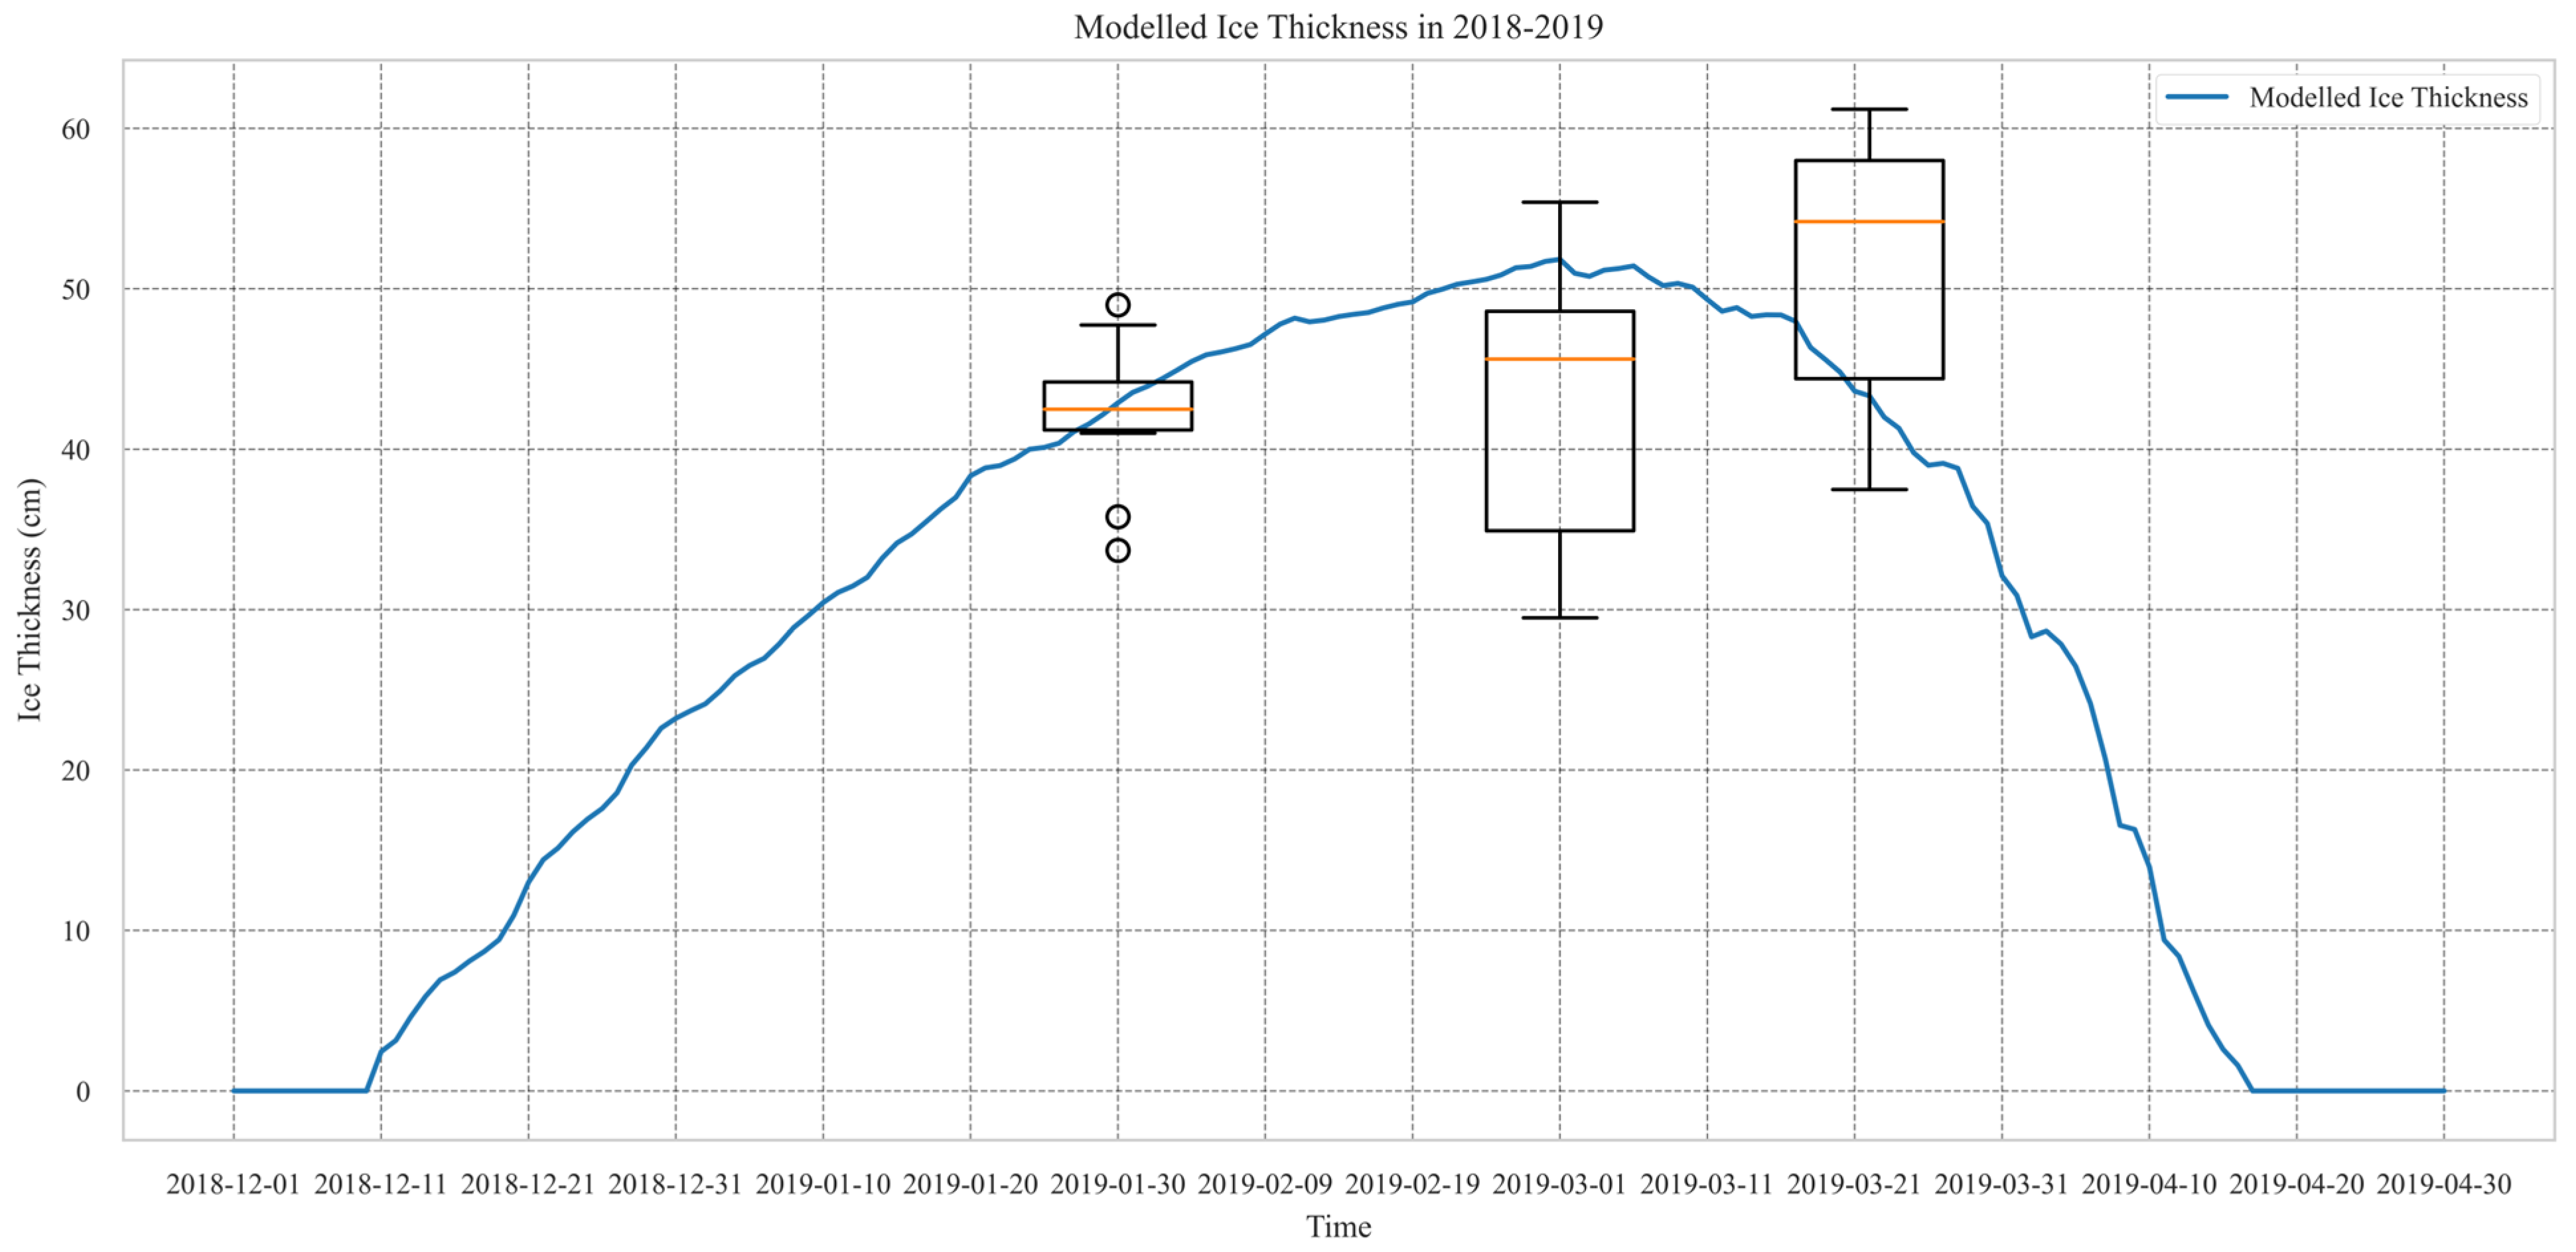
Figure 4.
Terra/MODIS images showing pre-freezing and melting processes in the Qinghai Lake during the winter of 2018–2019. The color composition is as follows: Red represents Band 3 (459–479 nm), Green represents Band 6 (1628–1652 nm), and Blue represents Band 7 (2105–2155 nm). Red indicates snow and ice, while cyan represents bare soil. Liquid water on the ground appears very dark, and white indicates small liquid water drops in the clouds.
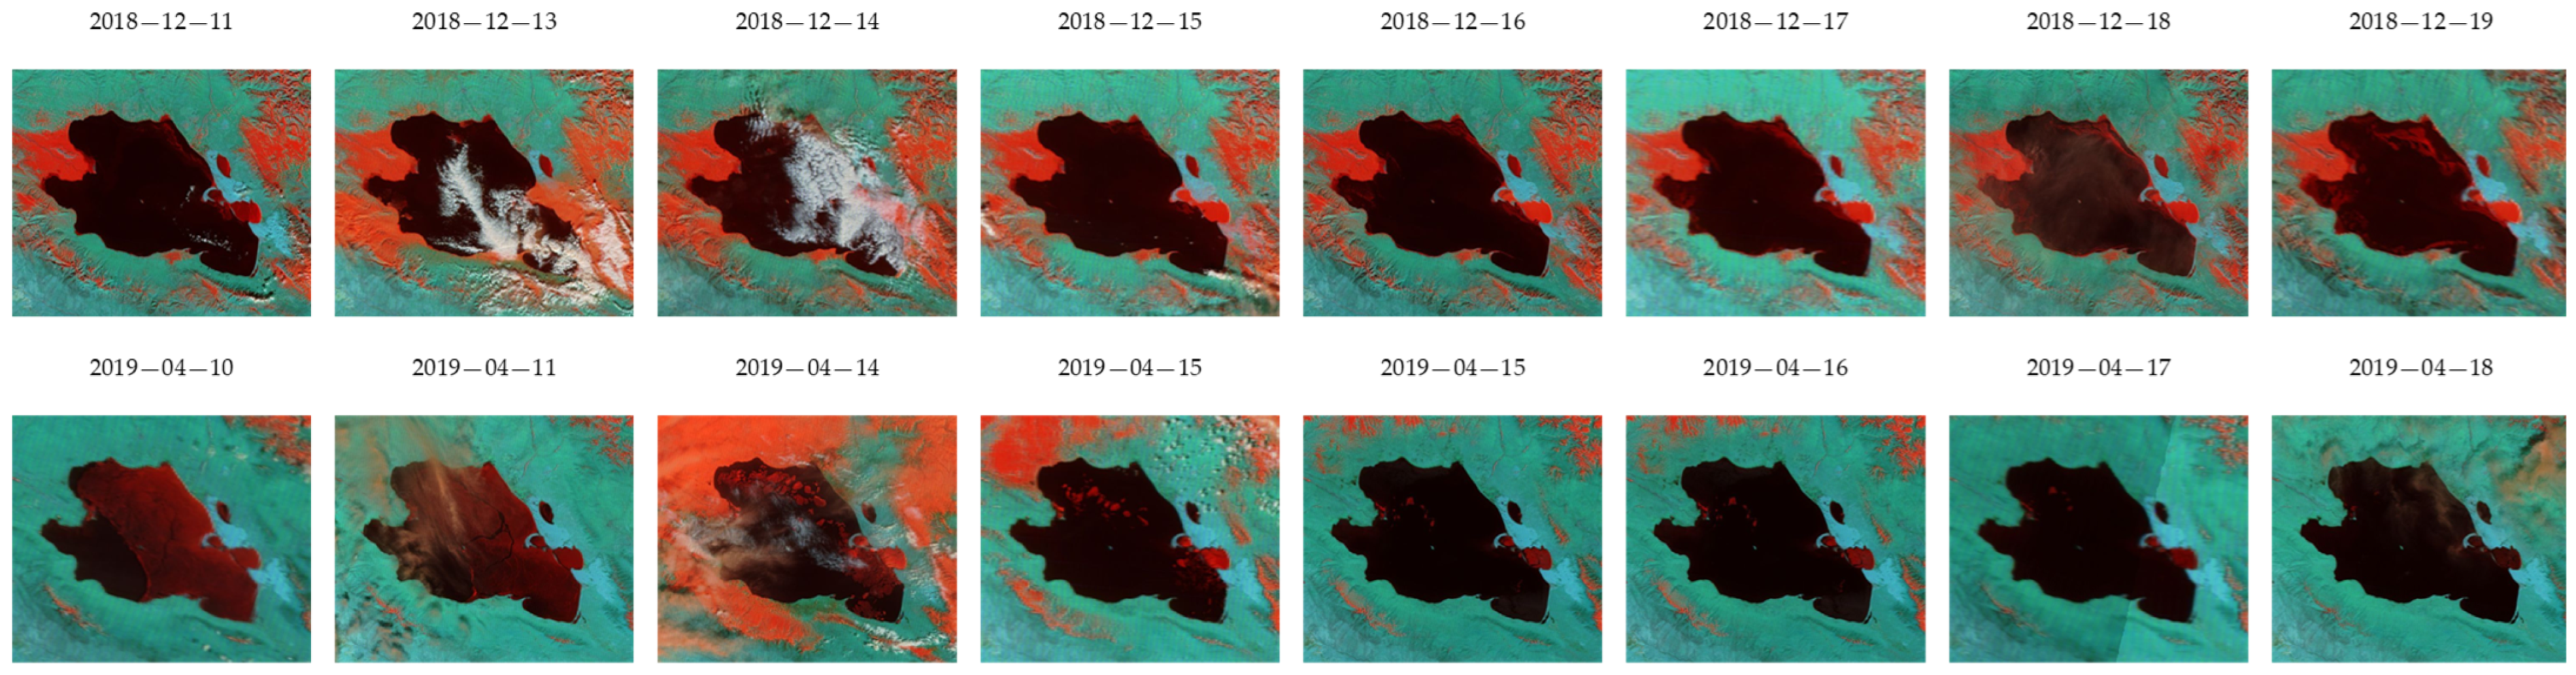
Figure 5.
Lake ice thickness observed at Xiashe Hydrologic Station (red points) and modeled by Leppäranta model (blue line) during the freezing periods at Qinghai Lake from 1979 to 2017.
Figure 5.
Lake ice thickness observed at Xiashe Hydrologic Station (red points) and modeled by Leppäranta model (blue line) during the freezing periods at Qinghai Lake from 1979 to 2017.
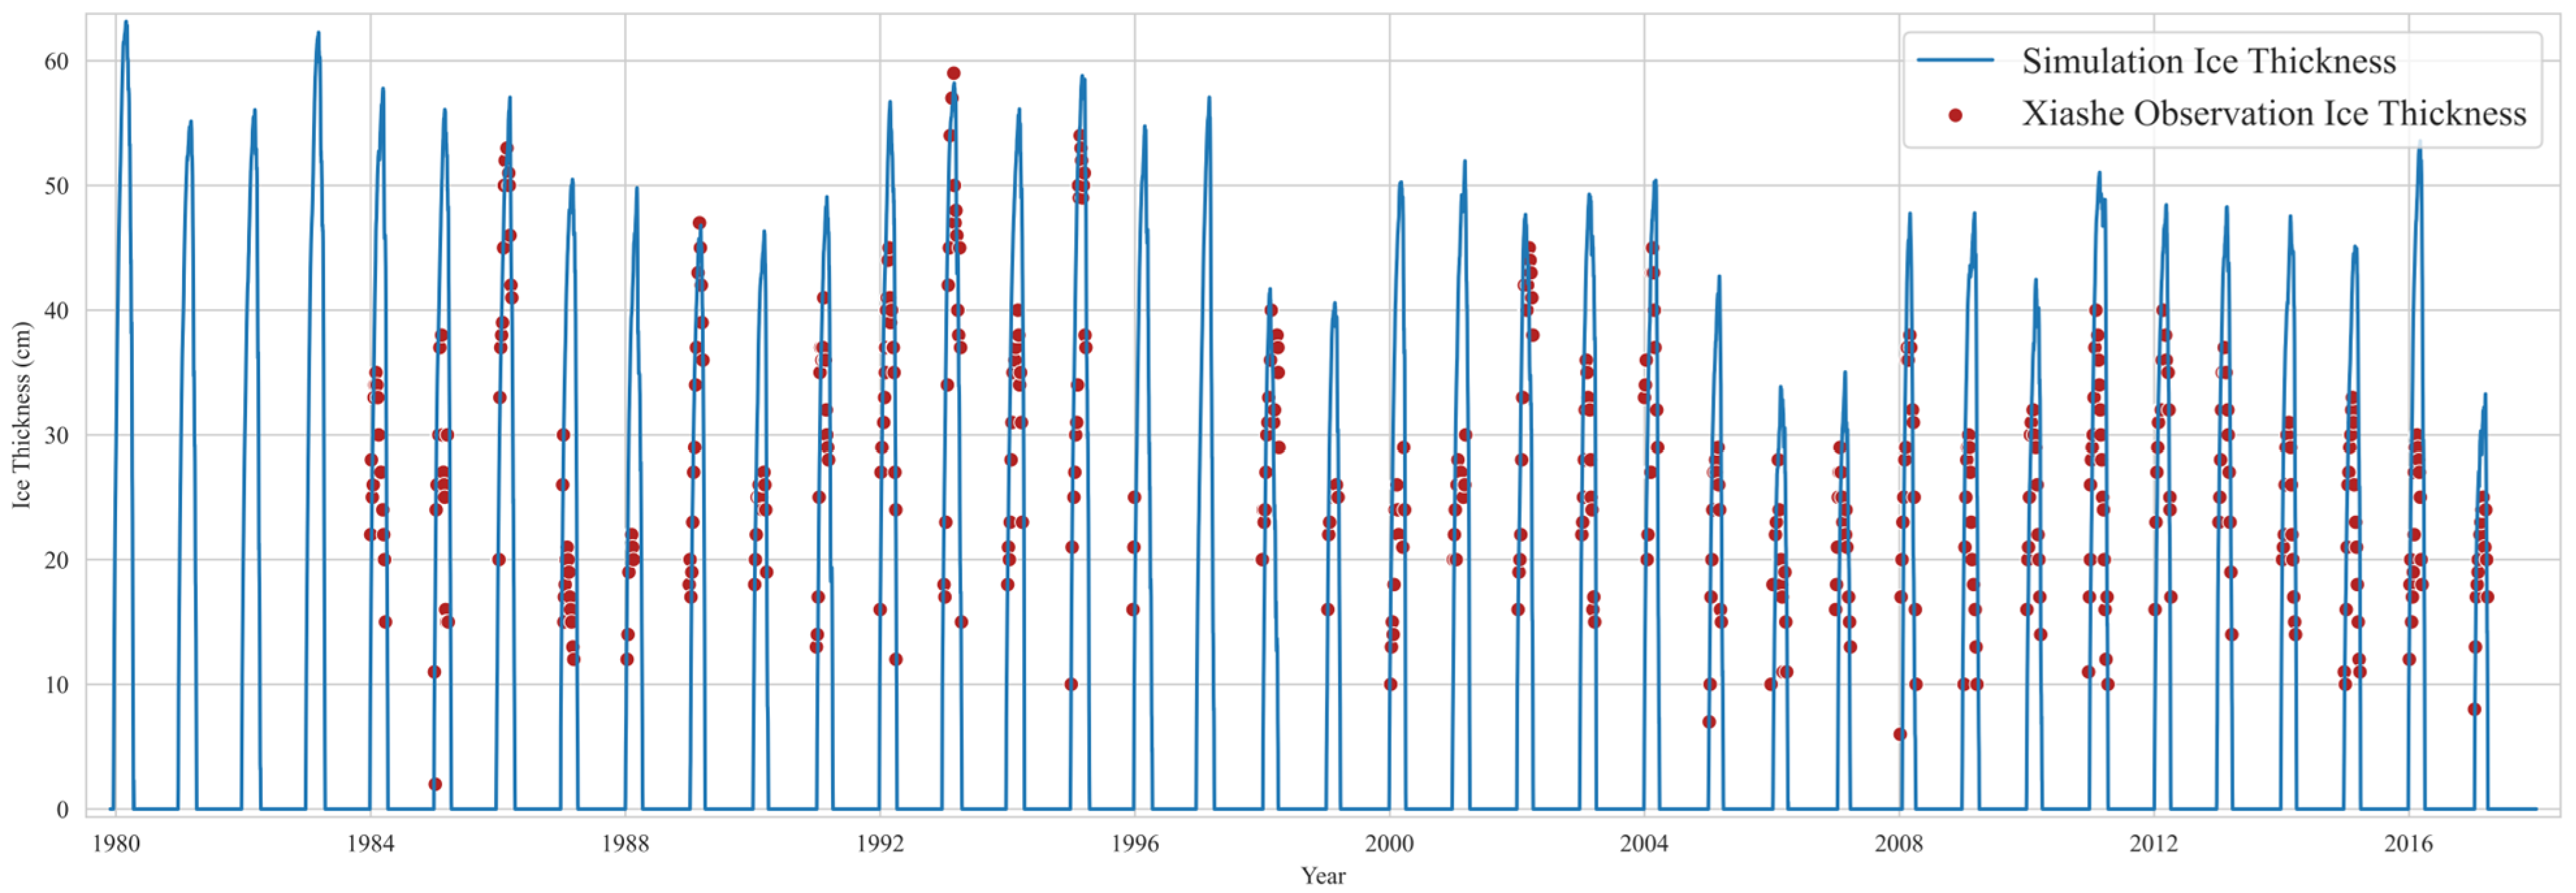
Figure 6.
FUS (a), BUE (b), ID (c), and their trends at Qinghai Lake from 1979 to 2017, accompanied by their corresponding confidence intervals at a significance level of 95%. The mean value is denoted by a red star in the two-dimensional Gaussian kernel density estimation (d).
Figure 6.
FUS (a), BUE (b), ID (c), and their trends at Qinghai Lake from 1979 to 2017, accompanied by their corresponding confidence intervals at a significance level of 95%. The mean value is denoted by a red star in the two-dimensional Gaussian kernel density estimation (d).

Figure 7.
Air temperature (a), downward longwave radiation (b), wind speed (c), solar radiation (d) during freezing periods in Qinghai Lake from 1979 to 2017. Average (blue dash line) and maximum ice thickness (orange dash line) are also shown in each subplot.
Figure 7.
Air temperature (a), downward longwave radiation (b), wind speed (c), solar radiation (d) during freezing periods in Qinghai Lake from 1979 to 2017. Average (blue dash line) and maximum ice thickness (orange dash line) are also shown in each subplot.
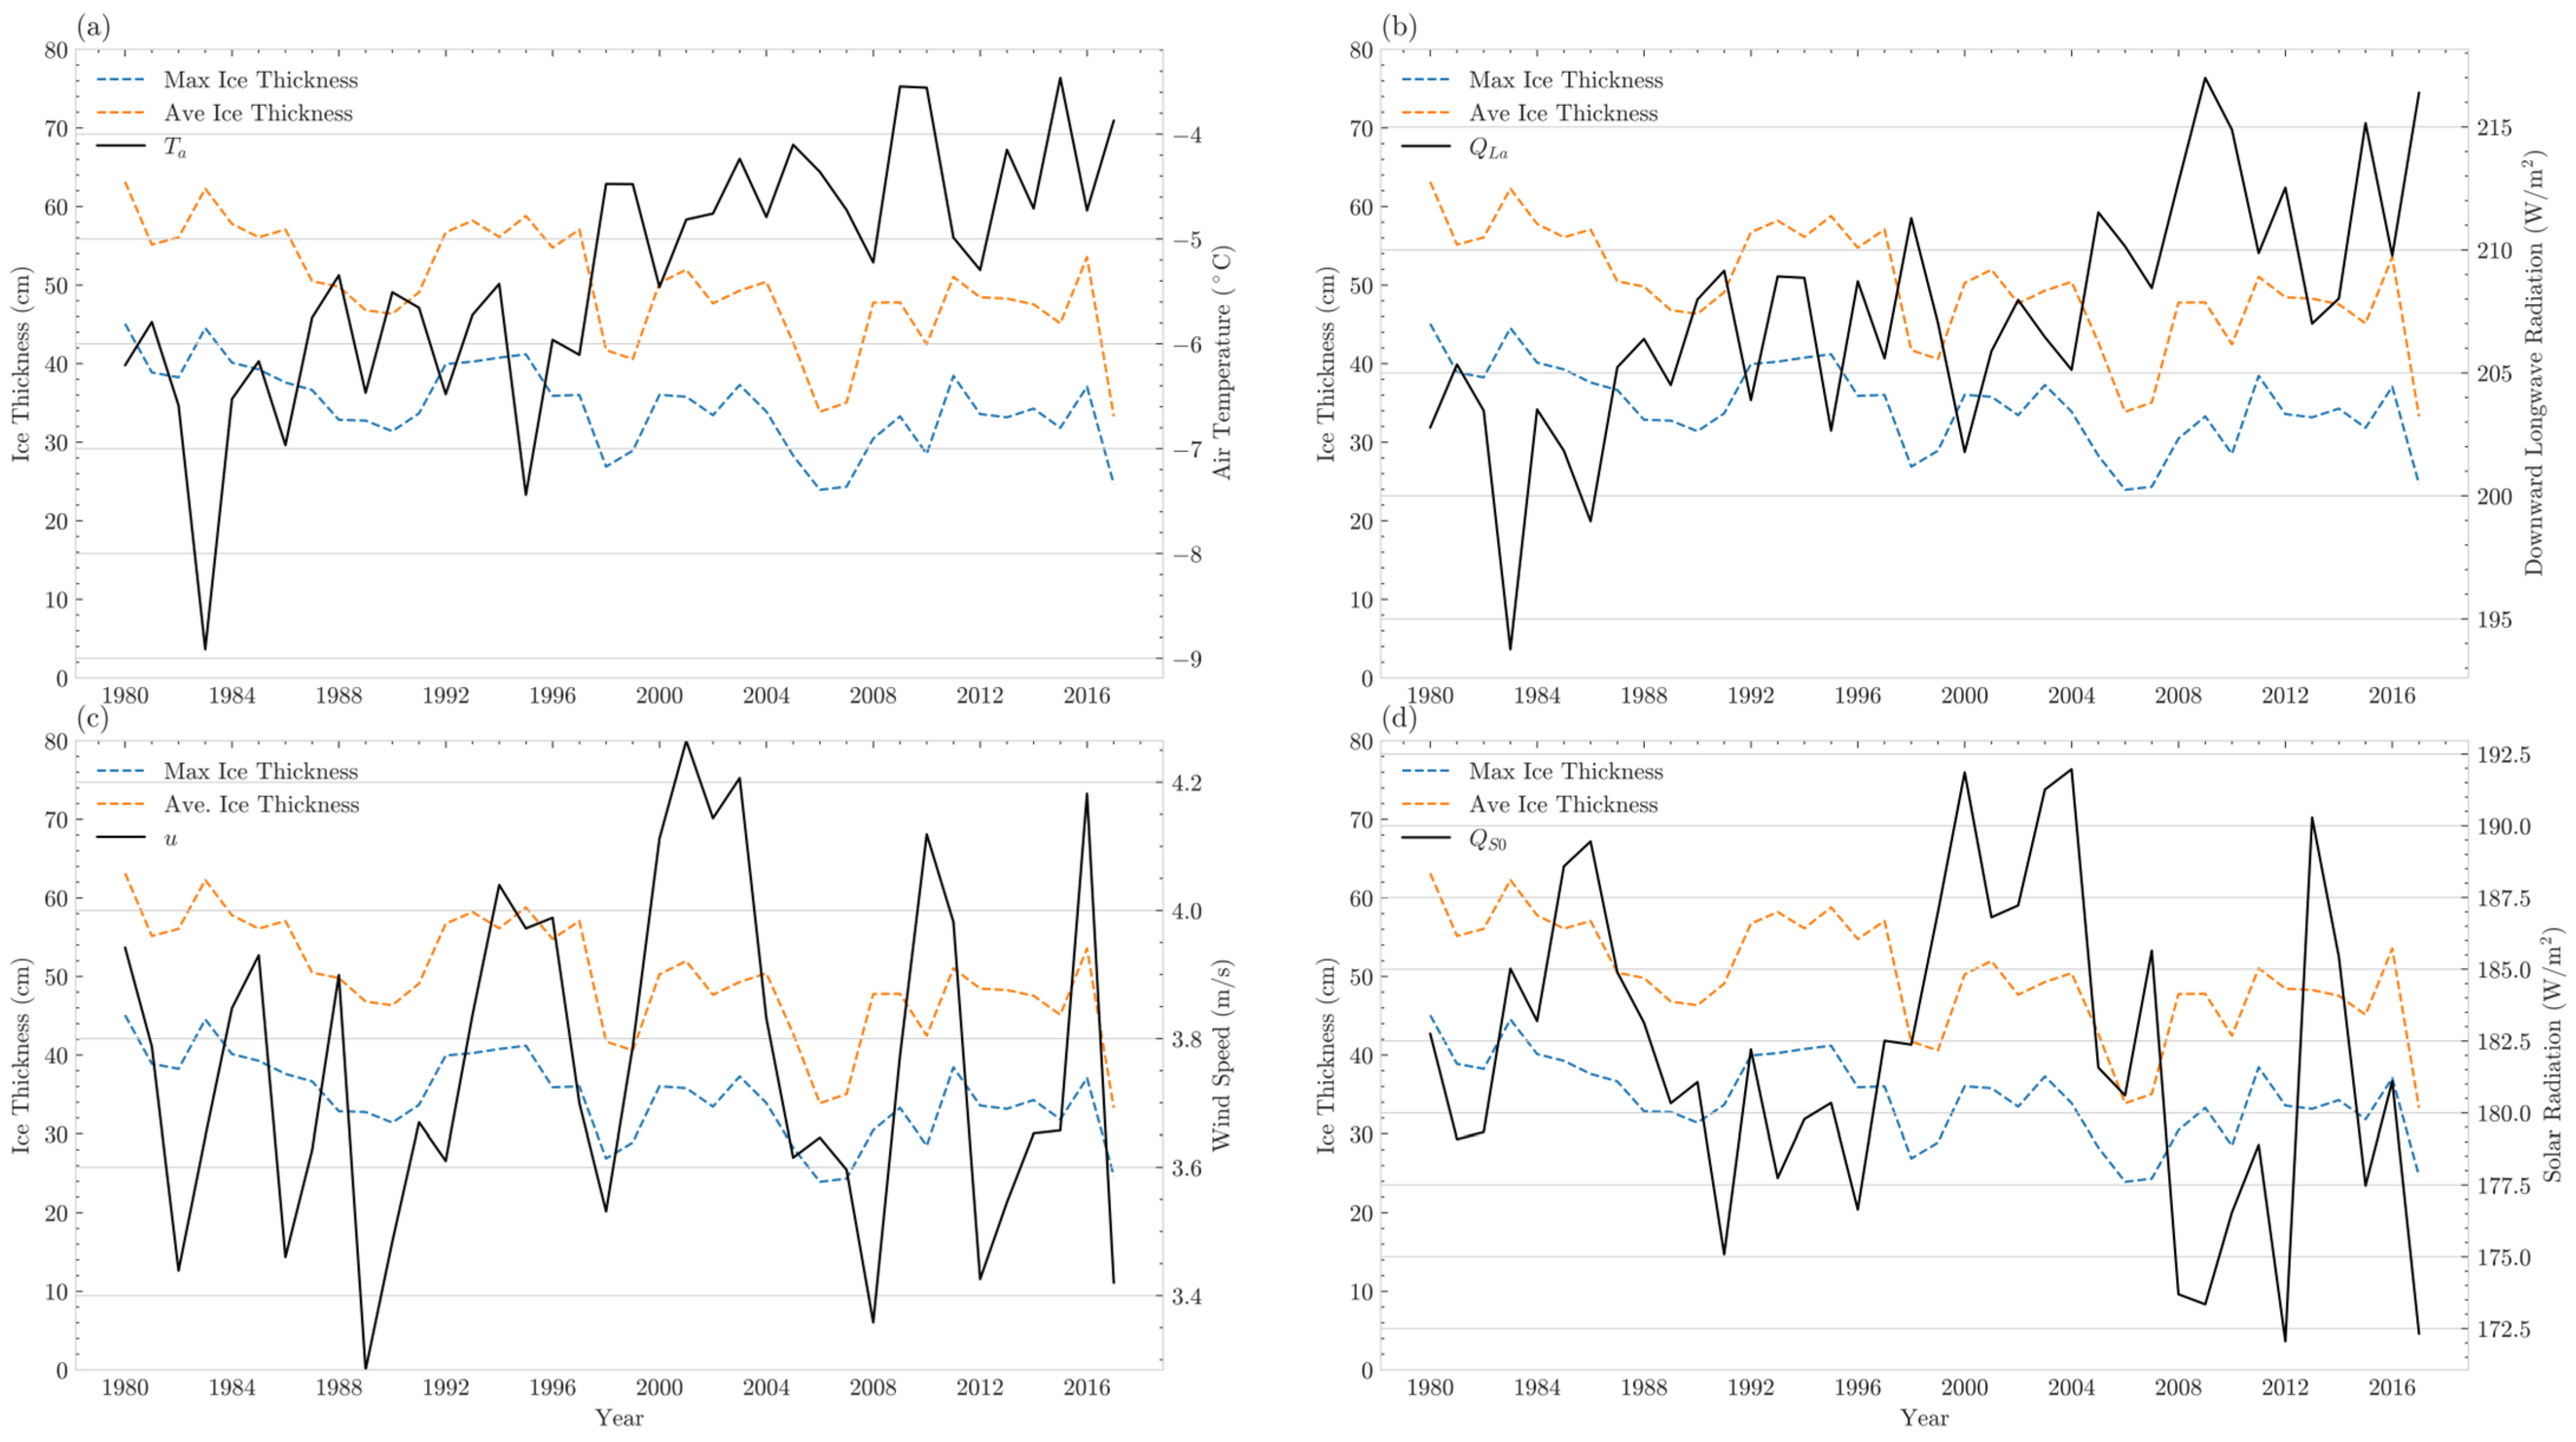
Figure 8.
Heatmap for average (a) and maximum (b) lake ice variability on Qinghai Lake influenced by the meteorological factors in 1979—2017 (Unit: %). , , , , , and are air temperature, downward longwave radiation, solar radiation, pressure, specific humidity, and wind speed, respectively. Note that values in the first column illustrate the variation in lake ice thickness influenced by individual meteorological factors; the others are mixed influence by pairs.
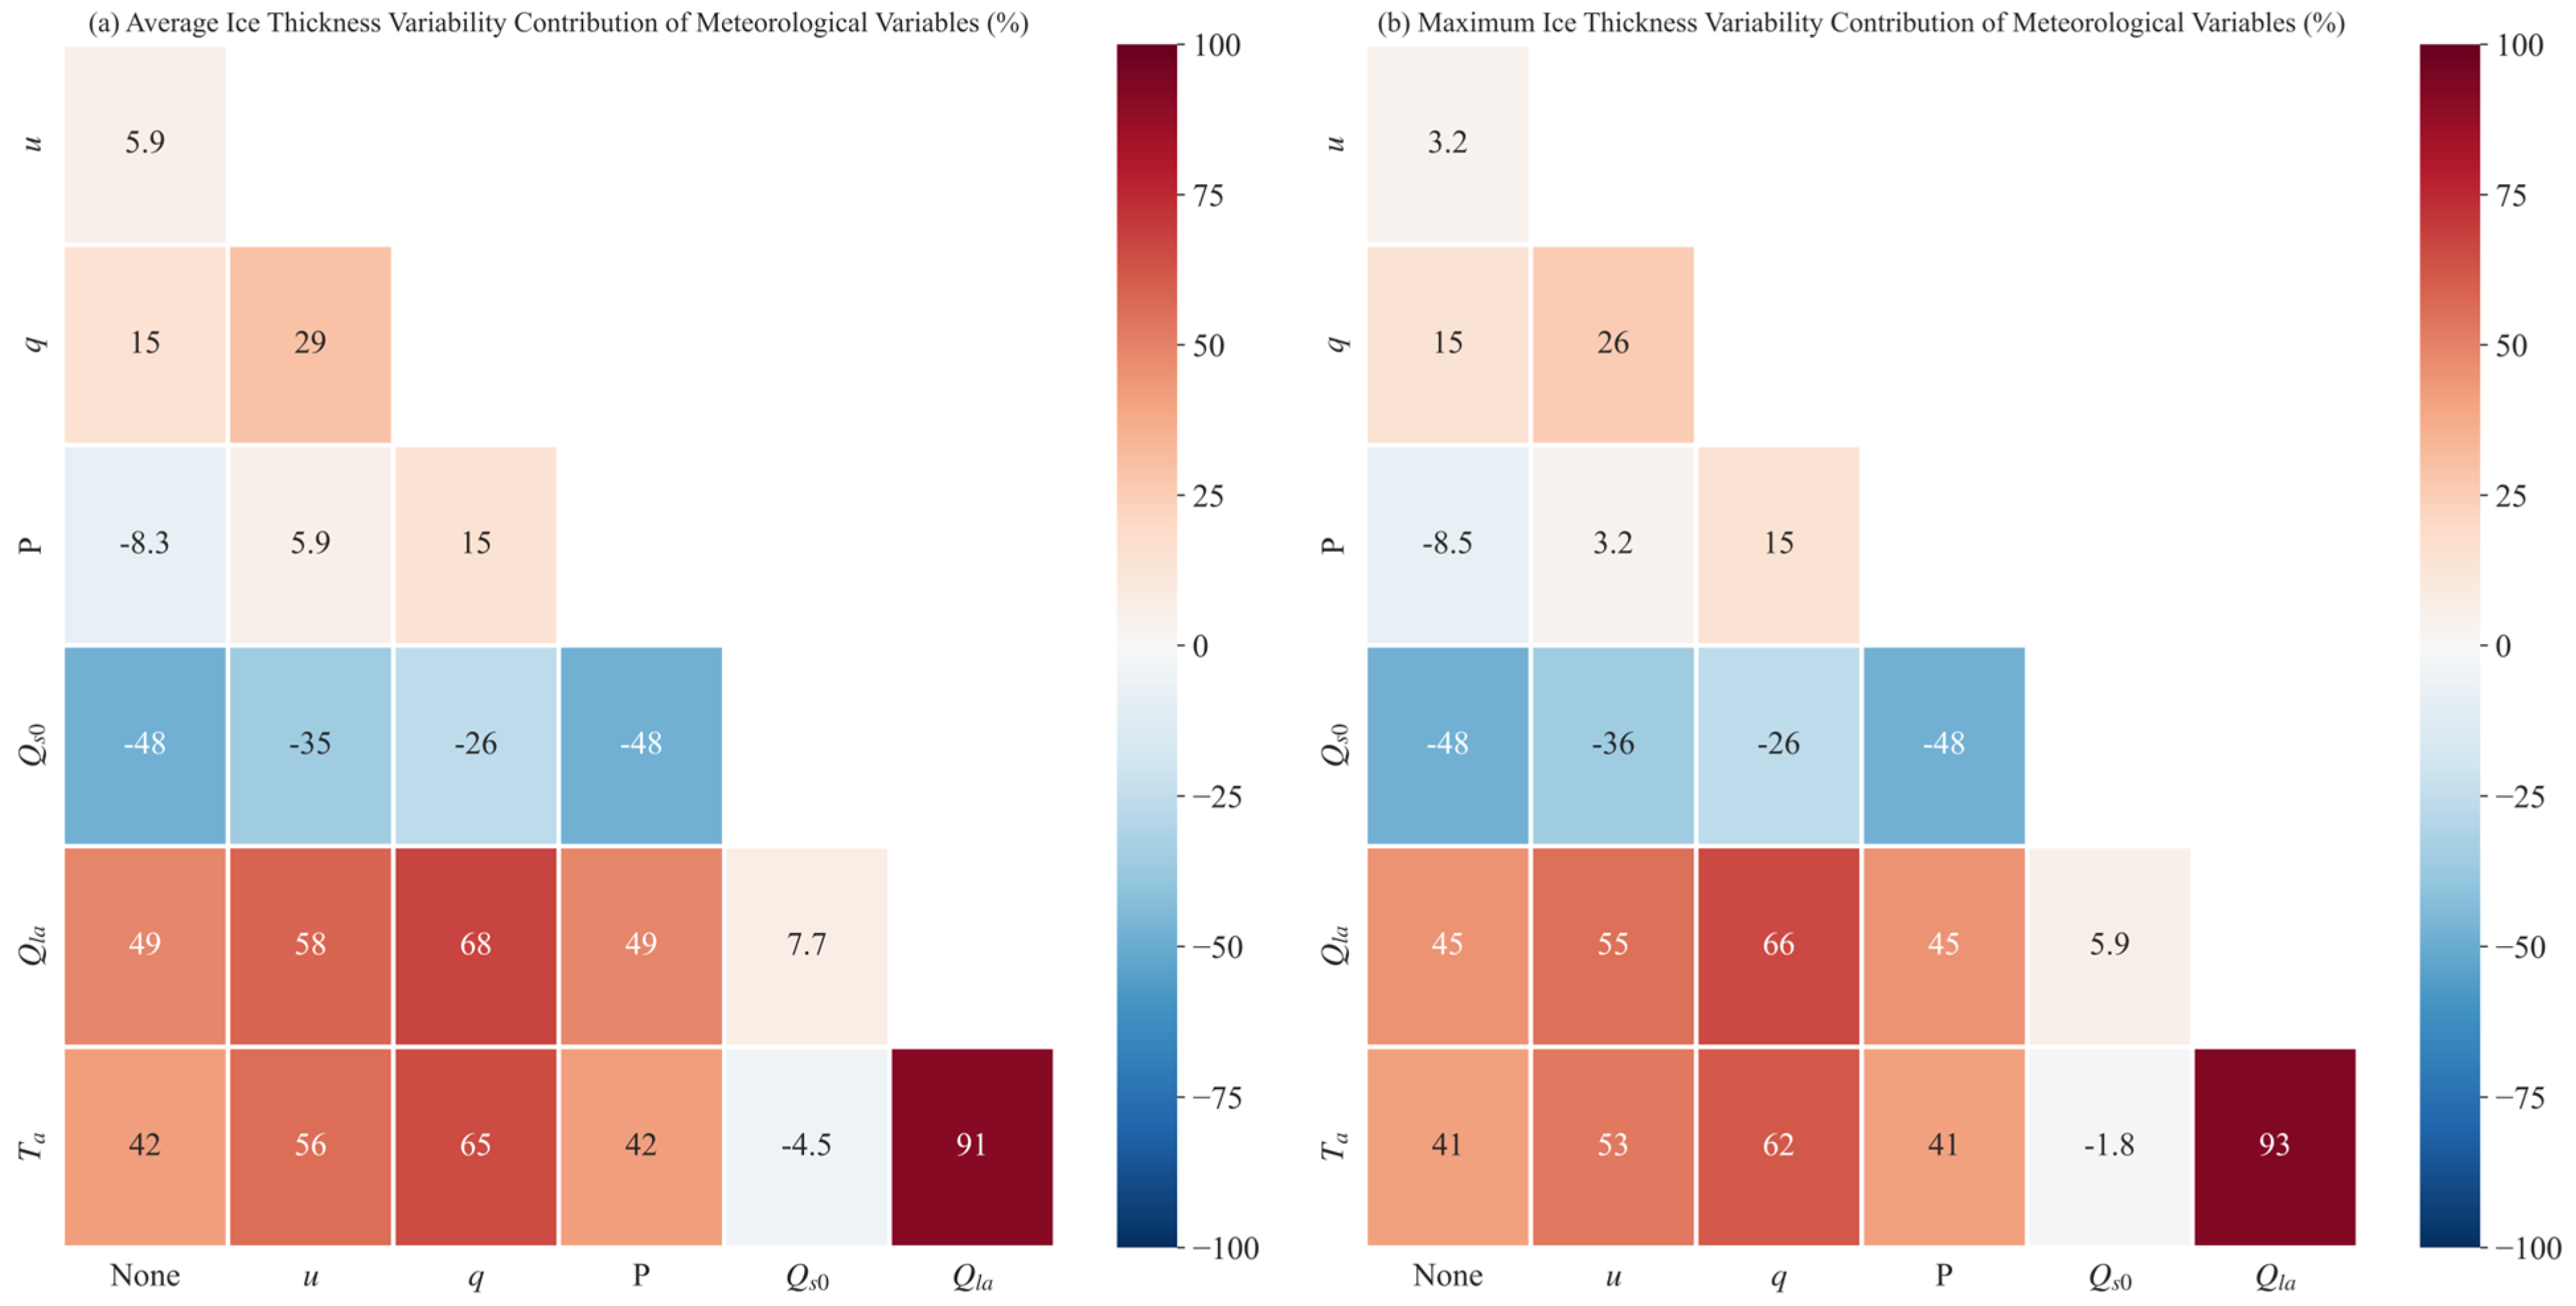
Figure 9.
Annual cycle of the linear heat flux parameters at Jokioinen (60°49′N, 23°30′E; orange line), southern Finland [3], and Qinghai Lake (bule line).
Figure 9.
Annual cycle of the linear heat flux parameters at Jokioinen (60°49′N, 23°30′E; orange line), southern Finland [3], and Qinghai Lake (bule line).

Table 1.
Bias Statistics of Simulated Annual Average Ice Thickness in 1979–2017 (unit: m).
| Count | Mean | Std | Min | 25% | 50% | 75% | Max |
|---|---|---|---|---|---|---|---|
| 31 | 0.067 | 0.060 | −0.057 | 0.021 | 0.074 | 0.110 | 0.153 |
Disclaimer/Publisher’s Note: The statements, opinions and data contained in all publications are solely those of the individual author(s) and contributor(s) and not of MDPI and/or the editor(s). MDPI and/or the editor(s) disclaim responsibility for any injury to people or property resulting from any ideas, methods, instructions or products referred to in the content. |
© 2024 by the authors. Licensee MDPI, Basel, Switzerland. This article is an open access article distributed under the terms and conditions of the Creative Commons Attribution (CC BY) license (https://creativecommons.org/licenses/by/4.0/).
Share and Cite
MDPI and ACS Style
Tang, H.; Zhao, Y.; Wen, L.; Leppäranta, M.; Niu, R.; Fu, X. Modeling Climate Characteristics of Qinghai Lake Ice in 1979–2017 by a Quasi-Steady Model. Remote Sens. 2024, 16, 1699. https://doi.org/10.3390/rs16101699
AMA Style
Tang H, Zhao Y, Wen L, Leppäranta M, Niu R, Fu X. Modeling Climate Characteristics of Qinghai Lake Ice in 1979–2017 by a Quasi-Steady Model. Remote Sensing. 2024; 16(10):1699. https://doi.org/10.3390/rs16101699
Chicago/Turabian StyleTang, Hong, Yixin Zhao, Lijuan Wen, Matti Leppäranta, Ruijia Niu, and Xiang Fu. 2024. "Modeling Climate Characteristics of Qinghai Lake Ice in 1979–2017 by a Quasi-Steady Model" Remote Sensing 16, no. 10: 1699. https://doi.org/10.3390/rs16101699
Note that from the first issue of 2016, this journal uses article numbers instead of page numbers. See further details here.