
Exploring the Impact of Public Health Emergencies on Urban Vitality Using a Difference-In-Difference Model

School of Resource and Environmental Sciences, Wuhan University, Wuhan 430072, China
*
Author to whom correspondence should be addressed.
Remote Sens. 2024, 16(10), 1697; https://doi.org/10.3390/rs16101697
Submission received: 19 April 2024
/
Revised: 30 April 2024
/
Accepted: 7 May 2024
/
Published: 10 May 2024
Abstract
:Urban vitality, a multifaceted construct, is influenced by economic conditions and urban structural characteristics, and can significantly be impacted by public health emergencies. While extensive research has been conducted on urban vitality, prevailing studies often rely on singular data sources, limiting the scope for holistic assessment. Moreover, there is a conspicuous absence of longitudinal analyses on urban vitality’s evolution and a dearth of quantitative causal evaluations of the effects of public health emergencies. Addressing these gaps, this study devises a comprehensive framework for evaluating urban vitality, assessing Wuhan’s vitality from 2018 to 2020 across economic, social, spatial, and ecological dimensions. Utilizing a Difference-In-Difference (DID) model, the impact of public health emergencies is quantified. The findings indicate pronounced spatial variations in Wuhan’s urban vitality, with a gradational decline from the city center; public health emergencies exhibit differential impacts across vitality dimensions, detrimentally affecting economic, social, and spatial aspects, while bolstering ecological vitality. Moreover, high population and high public budget revenue are identified as factors enhancing urban vitality and bolstering the city’s resilience against sudden adversities. This study offers valuable insights for geographers and urban planners, contributing to the refinement of urban development strategies.
1. Introduction
Urban vitality encompasses the dynamic interplay between human activities and urban spaces [1]. Enhancing urban vitality is a critical aspect of urban development, as it serves to attract highly skilled talent, foster innovation, increase residents’ well-being, and promote social sustainability [2]. Conversely, the lack of urban vitality gives rise to a multitude of challenges, including stagnant economic growth, inefficient land utilization, urban decay, compromised public safety, and weakened community cohesion. Moreover, it elevates the risk of ghost towns and abandoned cities [3].
High urban vitality can propel rapid urban development, while a lack of urban vitality can lead to a series of urban challenges such as traffic congestion, environmental pollution, and ecological degradation [4]. The topics of urban vitality have lately been the subject of considerable attention in China. Numerous scholarly investigations have explored the concept of urban vitality, encompassing diverse aspects such as the impact of street morphology on urban form [5], the utilization of land-use data to discern disparities in urban vitality [6], and the application of diverse analytical methodologies to unravel the multifaceted influences contributing to urban vitality. Exploring the components and influences of urban vitality can help policymakers plan for the subsequent development of cities [7]. As the unprecedented outbreak of the COVID-19 pandemic has greatly disrupted the lives and work of urban residents [8], several studies have explored the relationship between COVID-19 and urban vitality, such as air pollution [9], economic growth [10], tourism [11], and human activities [12].
There are two primary limitations in existing research about urban vitality. Firstly, many studies employ cross-sectional data and lack assessments of the dynamic process of urban vitality. Secondly, investigations examining the repercussions of public health emergencies have predominantly focused on specific aspects, neglecting to assess the overall impact on urban vitality comprehensively. Addressing these deficiencies, this study quantitatively calculates urban vitality through a variety of data, thereby constructing a two-year continuous urban vitality change curve. Subsequently, employing a Difference-In-Difference (DID) model, this research investigates variations in urban vitality and comprehensively analyzes the effects of public health emergencies on various dimensions of urban life.
The remainder of this paper is organized as follows. A short review of the urban vitality and the impact of COVID-19 is presented in Section 2. Section 3 describes the study area and the data used in the study and processing. Section 4 describes the main methodology of this study. Section 5 describes the experimental steps and analyzes the results. Section 6 provides a comprehensive summary of the experiments conducted in this study.
2. Literature Review
2.1. Urban Vitality Measurement
Urban vitality, a multifaceted and dynamic attribute, significantly influences a city’s overall competitiveness by integrating economic, social, and cultural factors [13]. Key drivers of urban vitality include the availability of public spaces [14], the quality of the natural environment [15], socioeconomic conditions [16], and the accessibility and convenience of transportation [17]. Existing evaluations of urban vitality often focus on a single point in time, employing limited indicators, which fails to capture its long-term evolution. To address this, our study adopts a holistic approach, examining urban vitality across four key dimensions: economic, social, spatial, and ecological.
Economic vitality embodies a city’s capacity and potential to attain economic growth, typically assessed through nighttime light (NTL) remote sensing data [18] and Gross Domestic Product (GDP) data [19]. NTL data can reveal a city’s nocturnal luminosity, indicative of economic activity, and facilitate the spatial mapping of human settlements via satellite imagery [10]. Regions with vital economic activities, such as business districts and industrial areas, exhibit higher levels of nighttime brightness, contrasting with the dimmer illumination of suburban zones where commercial activities are sparse. GDP, the predominant metric for gauging a region’s economic magnitude and vitality, measures the market value of all produced goods and services within a specific timeframe, serving as a direct gauge of economic health.
Social vitality captures the essence of people’s social behaviors and needs, observable through assessing the land-use intensity and diversity [20]. It encompasses a range of urban activities, including residential life, employment, social interaction, and leisure pursuits. Point of Interest (POI) data shed light on the quantity and spatial arrangement of various facilities, serving as a proxy for social engagements and community spaces [21]. POIs encompass an array of cultural, recreational, educational, and health facilities, alongside public services, thereby providing information on the mix of land uses [22]. Furthermore, urban land uses encompass constructions, green areas, agricultural lands, etc., with different zones reflecting varying degrees of human activity [23]. Thus, assessing the land-use intensity across varied land types offers insights into a city’s social vitality.
Spatial vitality, a key metric for gauging urban connectivity and accessibility, is intrinsically linked to residents’ movements and activities. To accurately assess this, we selected transportation-related Points of Interest (POIs) and road density as reliable and stable data sources. Transportation-related POIs, encompassing the presence and arrangement of parking lots, bus stops, and subway stations, serve as indicators of urban traffic dynamics and public transit network development [24]. Specifically, parking lot distribution offers insights into traffic flow and congestion, whereas the extent of public transportation facilities reflects the sophistication of the city’s transit system. Road density, meanwhile, indicates an area’s accessibility and network connectivity [25], with higher road densities typically correlating with increased movement and spatial activities. Thus, analyzing transportation-related POIs alongside road density allows for a comprehensive evaluation of urban spatial vitality.
Ecological vitality gauges a city’s natural ecological state, commonly assessed through the NDVI (Normalized Difference Vegetation Index) and AQI (Air Quality Index) metrics. A vibrant environment encourages public engagement in social activities and outdoor movements, thus benefiting the city’s economic and social spheres [26]. The Vegetation Index frequently serves as an ecological vitality indicator, with higher values suggesting healthier ecosystems crucial for maintaining ecological balance. Meanwhile, the Air Quality Index offers a snapshot of the urban environmental quality [27], encompassing green spaces, water bodies, and soil conditions. Hence, leveraging both NDVI and AQI data provides a comprehensive measure of a city’s ecological vitality.
2.2. The Influence of COVID-19 on Urban Vitality
Since its emergence in December 2019, COVID-19 has profoundly impacted Wuhan, with the city being marked as the epicenter and experiencing rapidly spreading and escalating case counts [28]. The ramifications extended beyond health, significantly affecting the city’s economy, societal fabric, and overall quality of life. Key sectors such as transportation, education, and tourism faced abrupt halts; medical resources were overstretched, and the community underwent severe challenges [29]. In response, the Wuhan government enacted stringent measures, including the closure of commercial and leisure venues, mandatory home isolation for residents, and the suspension of public transportation, aiming to curb the virus’s spread. With the pandemic’s abatement, restrictions were lifted on 8 April 2020, allowing for the gradual reopening of businesses, dining establishments, and tourist sites, and marking the beginning of the return to normalcy for the city’s residents.
The repercussions of COVID-19 on society are extensive and enduring, touching on epidemiology [30], psychology [31], environmental concerns [32], and transportation [33]. In the aftermath of the outbreak, Geographic Information Systems (GISs) and remote sensing (RS) technologies have become pivotal in outbreak management, facilitating the monitoring and visualization of outbreak data [34], simulating virus transmission [35], and optimizing the distribution of medical resources [36]. Furthermore, GISs have been instrumental in analyzing the interplay between social behavior, the environment, and virus spread.
Despite the extensive application of GISs to study urban vitality, most existing research is hampered by a reliance on short-term data and lacks both a comparison of urban vitality pre and post COVID-19 pandemic and an examination of epidemics’ long-term impacts on urban vitality. Moreover, many studies fall short in their causal analyses, statistical validation, and consideration of cities’ socioeconomic dynamics. A thorough examination of COVID-19′s effects is crucial for comprehending how public health crises influence urban vitality and formulating strategies for sustainable urban growth. This study aims to overcome these gaps, offering critical insights for urban planning and management in the face of pandemics.
3. Study Area and Dataset
3.1. Study Area
Wuhan (Figure 1a), located in central China, is the capital of Hubei Province and the economic center of central China, covering an area of 8949 square kilometers with 13 administrative districts. The COVID-19 outbreak in Wuhan gained global attention. To minimize its impact, Wuhan implemented a lockdown from 23 January to 8 April 2020 [37]. The epidemic has continuously affected Wuhan’s environment, economy, and healthcare, all essential components of a vibrant city. As the city that suffered the largest impact and longest duration of the epidemic, Wuhan is a representative study area for examining the impact of public health emergencies. Changes in Wuhan’s urban vitality can provide insights into the impact of public health emergencies on cities.
3.2. Data and Processing
3.2.1. Nighttime Light Remote Sensing Data
The ability of nighttime light (NTL) remote sensing data to identify weak areas of illumination has led to research in a variety of fields. Mapping economic activity and the GDP at the national, international, and local levels is one of these data’s main uses. The evolution of public lighting, which can be an important indicator of a nation’s economic health, is directly reflected in nighttime light [38]. NPP/VIIRS (https://ngdc.noaa.gov/eog/viirs/download_ut_mos.html (accessed on 18 April 2024)) has improved spatial resolution and substantially resolved the issue of light saturation when compared to other data. The spatial resolution of NTL data is 1km, which can meet the experimental requirements. Therefore, this study used monthly average-transformed NPP/VIIRS NTL data (Figure 1b). In this study, the average nighttime light index (ANLI) was used to indicate the strength of economic vitality. The calculation formula for this is as follows:
where ANLI is the average nighttime light index in the region and is the nighttime light radiation value of the image element in each subdistrict, and is the total area of the region.
3.2.2. Points of Interest
Point of Interest (POI) data represent an innovative spatial data source, offering benefits such as detailed attribute and spatial information, high precision, extensive coverage, rapid updates, and voluminous datasets. The density and variety of POIs enable them to serve as effective indicators of a city’s social and spatial vitality. In this research, we accessed POI data for Wuhan spanning 2018 to 2020 via Baidu Map’s API interface. This study categorized the POI data into six principal groups (Table 1), adhering to pertinent standards.
The Shannon’s Diversity Index (SHDI) can reflect the diversity of land use, and to calculate this index it was necessary to select the data explicitly containing land-use information; so, the five relevant categories of POI data, including industry, residential areas, green spaces, municipal utilities, and service land, were selected.
where SHDI denotes the Shannon’s Diversity Index, and denotes the rate of the number of total POIs occupied by type . A higher value of SHDI indicates that the type of land use in the unit is diverse.
As research in public transportation increasingly centers on resident needs, examining how transportation hubs influence urban life has emerged as a key area of focus. Given the constraints of existing research and data availability, the density of POIs for transportation utilities was selected as the metric for analyzing spatial vitality, addressing the difficulty of quantifying population flow at urban transport sites. Transportation utilities encompass various categories, including subway stations, train stations, gasoline stations, bus stations, and terminal stations. In response to transportation challenges in Wuhan during public health emergencies, certain POIs were removed based on specific directives issued by the municipal government. For instance, in a January 2020 announcement, the government indicated the suspension of subway lines 1, 2, and 4, leading to the deletion of their corresponding POIs from our analysis.
where is the kernel density value of the spatial position, is the distance between the spatial point and study object j, n is the distance less than or equal to the spatial position of , is the spatial weight, and R is the search radius.
3.2.3. Landsat 8 Imagery
Landsat 8, a widely accessible satellite sensor offering medium-resolution imagery, plays a crucial role in regional land-use studies due to the high temporal resolution (30 m) of its images. Monthly images of the city were acquired from Landsat 8 imagery (Https://earthexplorer.usgs.gov (accessed on 18 April 2024)), as shown in Figure 1c, and supervised classification methods were applied to delineate the urban land uses. According to the Resource Environment and Data Center grading standard (https://www.resdc.cn/Default.aspx (accessed on 18 April 2024)), the land-use weights were divided into five levels (Table 2). A confusion matrix test was then performed for the supervised classification results: as can be seen from Table 3, the overall accuracy reached 95.6778%, so the classification results are accurate.
The intensity of land use captures the extent of human activity’s impact on a specific region at a given time, reflecting the depth and scope of human exploitation of the land and elucidating the vigor of human social activities. Land-use intensity is expressed as follows:
where LUI represents the intensity of land use, while A signifies the total area utilized for land use within the sample region. refers to the area allocated to the i type of land use, and n is the count of different land-use types present in the sample region. denotes the intensity level attributed to the i land-use type within the area.
3.2.4. OpenStreetMap Dataset
We retrieved OpenStreetMap (OSM) data from Geofabrik for the years 2018 to 2020 (http://www.openstreetmap.org/ (accessed on 18 April 2024)) and aligned these data with the remote sensing imagery for each month. To calculate the road density in Wuhan, we focused on four types of roads (Figure 1d): primary roads, secondary roads, tertiary roads, and main roads. Road density is defined as the ratio of the total length of roads within a specified area to the overall area of that region. A higher road density indicates a more extensive road network, encompassing greater spatial activities. Given that the contribution of different road classes to the road density metric was uniformly consistent, each road class was assigned an equal weight for this calculation. The road density index formula is expressed as follows:
where RD is the road density index for the study area; is the length of roads of different classes; and S is the total area of the study area.
3.2.5. Vegetation Index Data
Ground vegetation can quickly reflect the effects of anthropogenic activity and climate change since it is very sensitive to a wide range of both natural and artificial influences [39]. The advancement of technology for observing the Earth has created a significant opportunity to examine changes in vegetation cover at the global and regional scale using low-cost MODIS data (https://ladsweb.modaps.eosdis.nasa.gov/ (accessed on 18 April 2024)), which have a spatial resolution of 1 km [40]. The Normalized Difference Vegetation Index (NDVI), which has a strong correlation with the ground biomass, can accurately depict the ideal state of vegetation growth [41].
To measure the urban ecological environment at the micro level, the NDVI was selected as the representation of urban ecological vitality. The ecological vitality of each research module was determined by calculating the Normalized Difference Vegetation Index. Stronger ecological vitality was indicated by higher NDVI values, whereas poorer ecological vitality was indicated by lower NDVI values. The NDVI data used in this study were obtained from the Resource Environment and Data Center, Institute of Geographical Sciences and Natural Resources, Chinese Academy of Sciences (https://www.resdc.cn/Default.aspx (accessed on 18 April 2024)). The calculation formula is as follows:
where EV is the average Standardized Vegetation Index, NDVI represents the Normalized Difference Vegetation Index, and S represents the area.
3.2.6. Other Data
To enhance the objectivity in our quantification of urban vitality, GDP data, which are published by regional government websites, were selected as an indicator for assessing economic vitality. AQI (Air Quality Index) (https://hbj.wuhan.gov.cn/hjsj/ (accessed on 18 April 2024)) data with a spatial resolution of 1 km were utilized to gauge the ecological vitality. Additionally, for further research into urban vitality, data on population demographics, financial investments, and other relevant metrics were sourced from officially published statistical yearbooks.
4. Methods
For this experiment, a research unit of a 1 km × 1 km grid was selected due to its high precision, data availability, and comparability, which ultimately yield more accurate calculation results [36,42,43]. Four distinct elements were chosen to evaluate urban vitality based on the definition of multifunctional urban vitality: social, economic, spatial, and ecological. The distribution of urban vitality in Wuhan was then determined by weighting each factor according to the entropy weighting approach, and the spatial aggregation was computed using the Local Moran’s I index. Finally, we used a Difference-In-Difference model to examine how the distribution of urban spatial vitality is affected by public health emergencies and other control factors. A detailed flow chart of this research is shown in Figure 2.
4.1. Entropy Weight Method
When performing the calculation for the entropy weighting method, it is required that the indicators have low covariance and correlation. In previous studies, the economic, social, spatial, and ecological aspects of a city are considered to be four different aspects that have little influence on each other [44,45,46]. This study conducted a covariance test for the eight indicators, and the VIF value between them was less than 3, indicating no covariance among the eight indicators(Table 4); so, the entropy weighting method can be used for weight calculations.
Before performing the weight calculation, the data were first normalized, as follows:
Positive indicators:
Negative indicators:
where i is the number of samples, and j is the number of indicators. represents the original value of j; max() and min() represent the maximum and minimum values of j; and indicates the standardized value of j.
Secondly, we determined the proportions:
Thirdly, we used the following entropy calculation:
where is the entropy of j, and n is the number of indicators.
Finally, we calculated the weights:
where is the objective weight.
In this experiment, all positive indicators except for the AQI, which is a negative indicator, received final weights, as seen in Table 5. The other data are positive indicators, as higher values represent stronger economic and social activities, thus making a positive contribution to vitality. In contrast, the AQI is negative indicator, as higher values indicate more severe air pollution, reflecting a deteriorating ecological environment.
4.2. Local Moran’s I
The Local Moran’s I index serves as a statistical instrument for evaluating the local autocorrelation present in spatial data. It is adept at uncovering local spatial patterns, including clusters, outliers, and spatial anomalies within datasets. Utilizing the Local Moran’s I index to scrutinize the spatial vitality of Wuhan enabled us to acquire a profound comprehension of the urban vitality distribution patterns in the city. The formula for the Local Moran’s I index is presented below:
where n is the total number of spatial units in the study area; and are the variable’s observed values for spatial units i and j (i ≠ j); stands for the variable’s mean; and is the spatial weight, defined by the widely used row-standardized inverse distance method, between spatial units i and j.
4.3. Difference-In-Difference Model
The Difference-In-Difference (DID) model is a quasi-experimental approach frequently employed by researchers to explore causal links in public health environments. As experimental methodologies have evolved, the DID model has expanded across various research domains. Numerous studies in the domestic sphere have leveraged DID models to examine the impacts of diverse policies, including investigations into the nexus between policy measures and economic growth [47], as well as the dynamics of carbon emissions [48], among others. In the wake of the COVID-19 pandemic, the DID model has been instrumental in assessing how policy adjustments correlate with infection rates [49]. A DID analysis necessitates data from a control group unaffected by the policy and an experimental group that is affected by the policy, alongside data spanning multiple periods for both groups. Thus, a DID model can evaluate how public health emergencies influence urban vitality by analyzing vitality across different times. To date, the application of the DID model to study geospatial disparities is relatively uncharted, with existing research primarily focusing on city units and lacking in micro-level analyses. This study aims to fill this gap by employing a DID model to assess the effects of public health emergencies on varied regions.
The DID model can be used to assess the magnitude of an event’s or policy’s impact. After the substantial outbreak of COVID-19 occurred in January 2020, urban vitality was studied from July to December of the previous year and from January to June of the following year, with January to June of the following year being considered as the period after the event. In theory, the city’s vitality for consecutive years should show the same trend, but due to the disruption of the epidemic, the change in urban vitality shows obvious differences. The control group consisted of the monthly city vitality data from 2018 and 2019, while the experimental group consisted of the monthly city vitality data from 2019 and 2020. Both groups were numbered based on the time series, with 12 data periods in each case (Table 6).
Parallel trend assumptions need to be made first before executing a DID model. The purpose of the parallel trend test is to see whether the experimental group and the control group have the same trend if the event does not occur. If the experimental group and the control group do not meet the same trend before the policy is implemented, the DID model cannot be used to analyze the policy’s effects. Most studies in the literature use time trend plots to conduct parallel trend visualization analyses and draw conclusions based on the results [50].
In this equation, the impact of public health emergencies on urban vitality is comprehensively examined, where denotes urban vitality, i denotes the administrative district, and t is time. Areas affected by a public health emergency set process as 1; otherwise, process is set as 0. Moreover, time takes a value of 1 for the post-event period’s data, and otherwise, time is set as 0. X represents a set of control variables, such as the resident population, local income, and landscape index. is a region-fixed effect and is a year-fixed effect. is the coefficient that our study focused on observing, and if is significantly negative, it can be judged that public health emergencies have a significant negative impact on urban vitality. is an intercept term indicating the value of the expected dependent variable when the time, process, and control variables are all zero. is the control variable coefficient, which indicates the effect of the control variable on the dependent variable. represents the area-fixed effects, which are used to control for the effects of characteristics inherent to the unit of observation on the dependent variable, and represents the time-fixed effects. is the error term, which represents the random factors that the model cannot explain.
Additionally, this formula can also examine the control variables to assess their impacts on the fluctuations in urban vitality, identifying both their positive and negative contributions. Consequently, by employing the DID model, we can investigate not only the impact of public health emergencies on urban vitality but also how various urban elements are associated with changes in urban vitality.
5. Results
5.1. Urban Vitality Spatial Patterns
5.1.1. Spatial Distribution of Different Dimensions of Vitality
Initially, the four dimensions of vitality—economic, spatial, social, and ecological—were meticulously mapped and analyzed to discern the overarching distribution patterns of these vitalities across Wuhan.
Economic vitality, a critical dimension of urban growth, was meticulously evaluated using NTL and GDP data, segmented into five distinct levels by employing the natural breaks method (Figure 3). This methodological approach revealed a stark contrast in Wuhan’s economic vitality, with the central urban areas showcasing robust levels of economic activity, while the suburban peripheries lag in economic engagement. Notably, the northwestern quadrant of Wuhan’s core urban zone emerges as exceptionally dynamic, hosting bustling commercial streets and versatile business centers catering to an array of local needs spanning commerce, leisure, and culture. Despite this, other central locales, although characterized by multiple business districts, display only moderate economic vitality. This is largely attributed to their limited scope and the lack of major industries or flagship corporations. In contrast, the peripheral zones of Wuhan rely heavily on traditional manufacturing and agriculture, hindered by a lack of innovation and investment in high-tech sectors, consequently impacting their economic vitality adversely. Throughout 2018 to 2019 (Figure 3a,c), Wuhan observed a significant surge in economic vitality, particularly in zones previously identified as being vibrant. However, this upward trajectory experienced a setback between 2019 and 2020 (Figure 3e,g), as areas once teeming with economic life began to exhibit signs of declining vitality, indicating a complex interplay of factors influencing the urban economy. According to the Local Moran’s I index, the central urban area of Wuhan exhibited a significant trend of high–high clustering and diffusion before the public health emergency. In contrast, the city’s most peripheral urban areas demonstrated low–low clustering, while the economic vitality in other regions was not statistically significant. A comparative analysis across four distinct periods reveals that while economic vitality was highly concentrated in the central urban area, smaller yet notable agglomerations also emerged in some outlying urban areas.
Remote sensing imagery and Point of Interest (POI) data lay the groundwork for evaluating Wuhan’s social vitality and were subsequently divided into five categories through the natural breaks method (Figure 4). This methodology uncovered a robust link between social vitality and land use, illustrating how Wuhan’s complex land usage fosters a diverse array of social dynamics throughout the municipality. In 2018 (Figure 4a), the social structure of Wuhan was largely monocentric, with the bulk of social vitality being concentrated in the western part of the central city. This scenario evolved in 2019 and 2020 (Figure 4e,g) towards a more polycentric model, propelled by the rich variety in land uses, encompassing public services, residential communities, and business districts. The shift from a monocentric to a polycentric distribution enabled a more equitable spread of development, enhancing social vitality in various city segments. The heart of Wuhan is replete with public infrastructure, including libraries, museums, cultural venues, and administrative buildings, enriching the city’s social environment. Conversely, the outskirts display reduced social vitality, attributed to the underdeveloped nature of their land use, which is still in a phase of expansion, and the deliberate preservation of natural terrains such as agricultural land, forests, and wetlands. These areas’ social vitality is further influenced by demographic factors, economic accessibility, and the availability of social and recreational opportunities, underscoring the multifaceted determinants of social vitality in urban settings. An analysis of the spatial vitality through the Local Moran’s I index (Figure 4b) reveals an extensive high–high cluster in Wuhan’s central city, with an anomalous low–high outlier noted along the Yangtze River. From July to December 2018 (Figure 4b), a distinct low–low cluster was observed in the northern and southern expanses, which diminished as the city developed. Throughout the four time periods studied, social vitality distributions were marked by low–high and high–low outliers, primarily in remote urban areas. The prevalence of these outliers can be attributed to the significant areas of low-social-vitality land, predominantly used for forestry and agriculture, in these remote locations.
Spatial vitality in Wuhan was meticulously evaluated using traffic-related Points of Interest (POIs) alongside road density metrics and divided into five categories through the natural breaks method (Figure 5). Our analysis revealed a spatial vitality average of approximately 0.03 across the various study units, with notable disparities being observed between central locales and more peripheral areas. Significantly, the zenith of spatial vitality was identified in areas adjacent to the Yangtze River, Wuhan’s vital artery, serving as essential nodes for both intracity and regional connectivity. These pivotal areas host a rich array of transport facilities, including railway and bus stations, underpinned by an extensive subway system designed to meet the city’s robust parking demand. Moreover, the central zones of Wuhan benefit from increased spatial vitality, attributed to the widespread availability of metro and bus services, thereby enhancing the city’s transportation network density. In contrast, suburban areas display markedly lower levels of spatial vitality, with occasional spikes along major thoroughfares. This discrepancy stems from the peripheral dominance of industrial and residential areas, where transportation infrastructure remains limited. A temporal analysis indicates steady spatial vitality in Wuhan’s outskirts, while central urban areas witnessed a notable increase from 2018 to 2019 (Figure 5a,c), followed by a subsequent decline through to 2020 (Figure 5g). This fluctuation underscores the dynamic nature of spatial vitality, influenced by urban development, transportation infrastructure enhancements, and changing public health contexts. The Local Moran’s I index results reveal that high–high clustering of the spatial vitality in Wuhan is confined to a small central area, while extensive low–low clustering occurs in peripheral regions. This pattern reflects a clear correlation with Wuhan’s subway line infrastructure. Despite substantial government investments in subway construction, full subway line coverage is limited to the central city. In contrast, remote areas typically feature only a single subway line, influencing the spatial distribution of the city’s vitality.
By analyzing NDVI and AQI data, the ecological vitality of the study area was quantified and categorized into five levels from low to high using the natural breaks method (Figure 6). The findings indicate that ecological vitality in Wuhan predominantly oscillates between medium and weak, with a tendency towards the latter. The central urban areas of Wuhan, characterized by a scarcity of green spaces amid dense residential and commercial development, recorded ecological vitality values below 0.02 (Figure 6a). In contrast, Wuhan’s eastern region exhibits a broader spectrum of ecological vitality due to its expansive geography and varied land usage, reflecting a more diverse ecological state. The city’s outskirts showcase a sustained medium level of ecological vitality, attributed to restrained urban development and the conservation of natural landscapes, including numerous wetland parks and lakes. These areas, with their development curtailed to protect tourism and ecological resources, exemplify the positive impact of environmental preservation on ecological vitality. Over time, the ecological vitality of these peripheral areas remains relatively stable, with some achieving consistent medium levels, while others experience variations between weak and medium. This analysis underscores the complex interplay between urban development, land use, and ecological preservation in shaping the ecological vitality of Wuhan. Utilizing the Local Moran’s I index, the results shown reveal that significant clustering is generally absent across the city, attributed to the low overall ecological vitality. In the northern and southern regions, however, the presence of wetlands and large parks correlates with relatively high ecological vitality, resulting in several high–high clusters. Conversely, the central city exhibits low–low clustering as a consequence of its saturated land use and scarcity of green spaces.
When analyzing the spatial distribution of vitality, it is observed that both the economic vitality and spatial vitality are more pronounced in the central urban zones. The economic vitality exhibits a polycentric formation, whereas the spatial vitality demonstrates a monocentric pattern. On the contrary, the distribution of social vitality lacks a discernible spatial structure, and ecological vitality is notably greater in the more remote urban regions.
5.1.2. Spatial Distribution of Comprehensive Urban Vitality
Different types of vitality in Wuhan were evaluated using the entropy weighting method, resulting in a measure of the city’s comprehensive vitality. This comprehensive vitality was then classified into five levels through the natural breaks method, producing a detailed distribution map of Wuhan’s comprehensive vitality (Figure 7).
Wuhan’s overall vitality exhibits significant regional variation, with the most vibrant areas being concentrated in the city center and the vitality diminishing towards the city’s outskirts. This pattern mirrors the distributions of the economic and spatial vitality, which are particularly pronounced in regions adjacent to the Yangtze River. These areas enjoy elevated urban vitality, attributed to their accessible public transportation, thriving commercial zones, abundant cultural and tourist sites, and comprehensive social institutions, as well as their residents’ active participation in social activities. In contrast, while other central urban areas also boast diverse land use and a wealth of parks, shops, and residences, their urban vitality is considered medium. This is primarily due to underdeveloped economic structures and less effective urban planning. The vitality landscape of Wuhan’s outlying urban areas shows marked variability. Zones close to the central city demonstrate enhanced vitality, in contrast to peripheral regions, where urban vitality falls below 0.04. Notably, the northern and northeastern outskirts show an evolution into distinct nodes of vitality. The pattern of urban vitality in these areas parallels that of the social vitality, albeit with variance in intensity. Predominantly industrial and manufacturing in nature, these sectors struggle with challenges like scarce employment options and a lower appeal for living and working, diminishing their impact on the city’s aggregate urban vitality. On the other hand, the city’s outskirts are distinguished by robust ecological vitality, benefiting from vast undeveloped natural terrains. This is further amplified by local government efforts to foster eco-development.
An analysis of the data across the four periods with the Local Moran’s I index reveals distinct clustering patterns of comprehensive vitality within Wuhan, persisting throughout all four periods. The central city exhibits consistent high–high clustering, with both the intensity and clustering of vitality dispersing outward from 2018 to 2019. Transitional zones between the central and outlying urban areas display unique low–high outliers, attributed to stark contrasts in their urban vitality values. Conversely, the distant urban regions are characterized by a mix of non-significant and low–low clustering, alongside occasional high–high clusters. Throughout all four periods, the urban vitality in the northern and southern sectors consistently ranks the lowest, resulting in a predominance of low–low clustering compared to other areas.
Employing a 1 km × 1 km grid as the study unit enables us to visualize the urban vitality distribution, whereas utilizing administrative districts as the study unit enhances our understanding of policy impacts. Given that administrative districts are central to daily life, employment, and governance, vitality statistics at this level more precisely capture the economic, social, and cultural characteristics of different areas. Furthermore, these statistics provide insights into each district’s governmental policy decisions during the epidemic.
The average urban vitality of each administrative district was determined using an area-based weighted summation approach (Figure 8). The three central districts on the western side of the Yangtze River maintained the highest vitality levels throughout the four periods analyzed, as illustrated in the figure. Their superior urban vitality can be attributed to rich resources and significant investments. Conversely, the outer suburban districts exhibit low urban vitality, compounded by their distance from central areas, poor connectivity, and inadequate infrastructure. These peripheral districts, being on the outskirts of Wuhan, also face a scarcity of public amenities (such as healthcare, education, and transportation) and a dearth of commercial hubs and industrial clusters, which are factors that significantly diminish their low vitality.
Changes in the four studied dimensions of vitality in different regions of Wuhan are shown in Figure 9. For instance, the districts of Hannan and Jiangxia consistently show higher levels of spatial vitality compared to other forms of vitality, whereas in the districts of Qingshan and Hanyang, social vitality predominates. Assessing the impact of public health emergencies on these vitality dimensions solely through time-series analysis proves challenging. Therefore, we propose a Difference-In-Difference model for more comprehensive future studies.
5.2. The Influence of COVID-19
5.2.1. Parallel Trend Assumptions
Before further analysis, the Difference-In-Difference model required the control group and experimental group to pass the parallel trend assumption. This test, shown in Figure 10, is intended to ensure the objectivity of the results.
Trends in both the experimental and control groups were analyzed using Stata, with the monthly average vitality being calculated and depicted as a time series. Before the public health emergency of the COVID-19 outbreak, the urban vitality of these groups followed a similar trajectory, exhibiting fluctuations within a defined range before ultimately trending downward. This consistency in trends before the outbreak satisfies the parallel trend assumption required for the DID analysis. Thus, it can be concluded that the DID analysis is suitable for isolating the net effect of the COVID-19 outbreak on urban vitality.
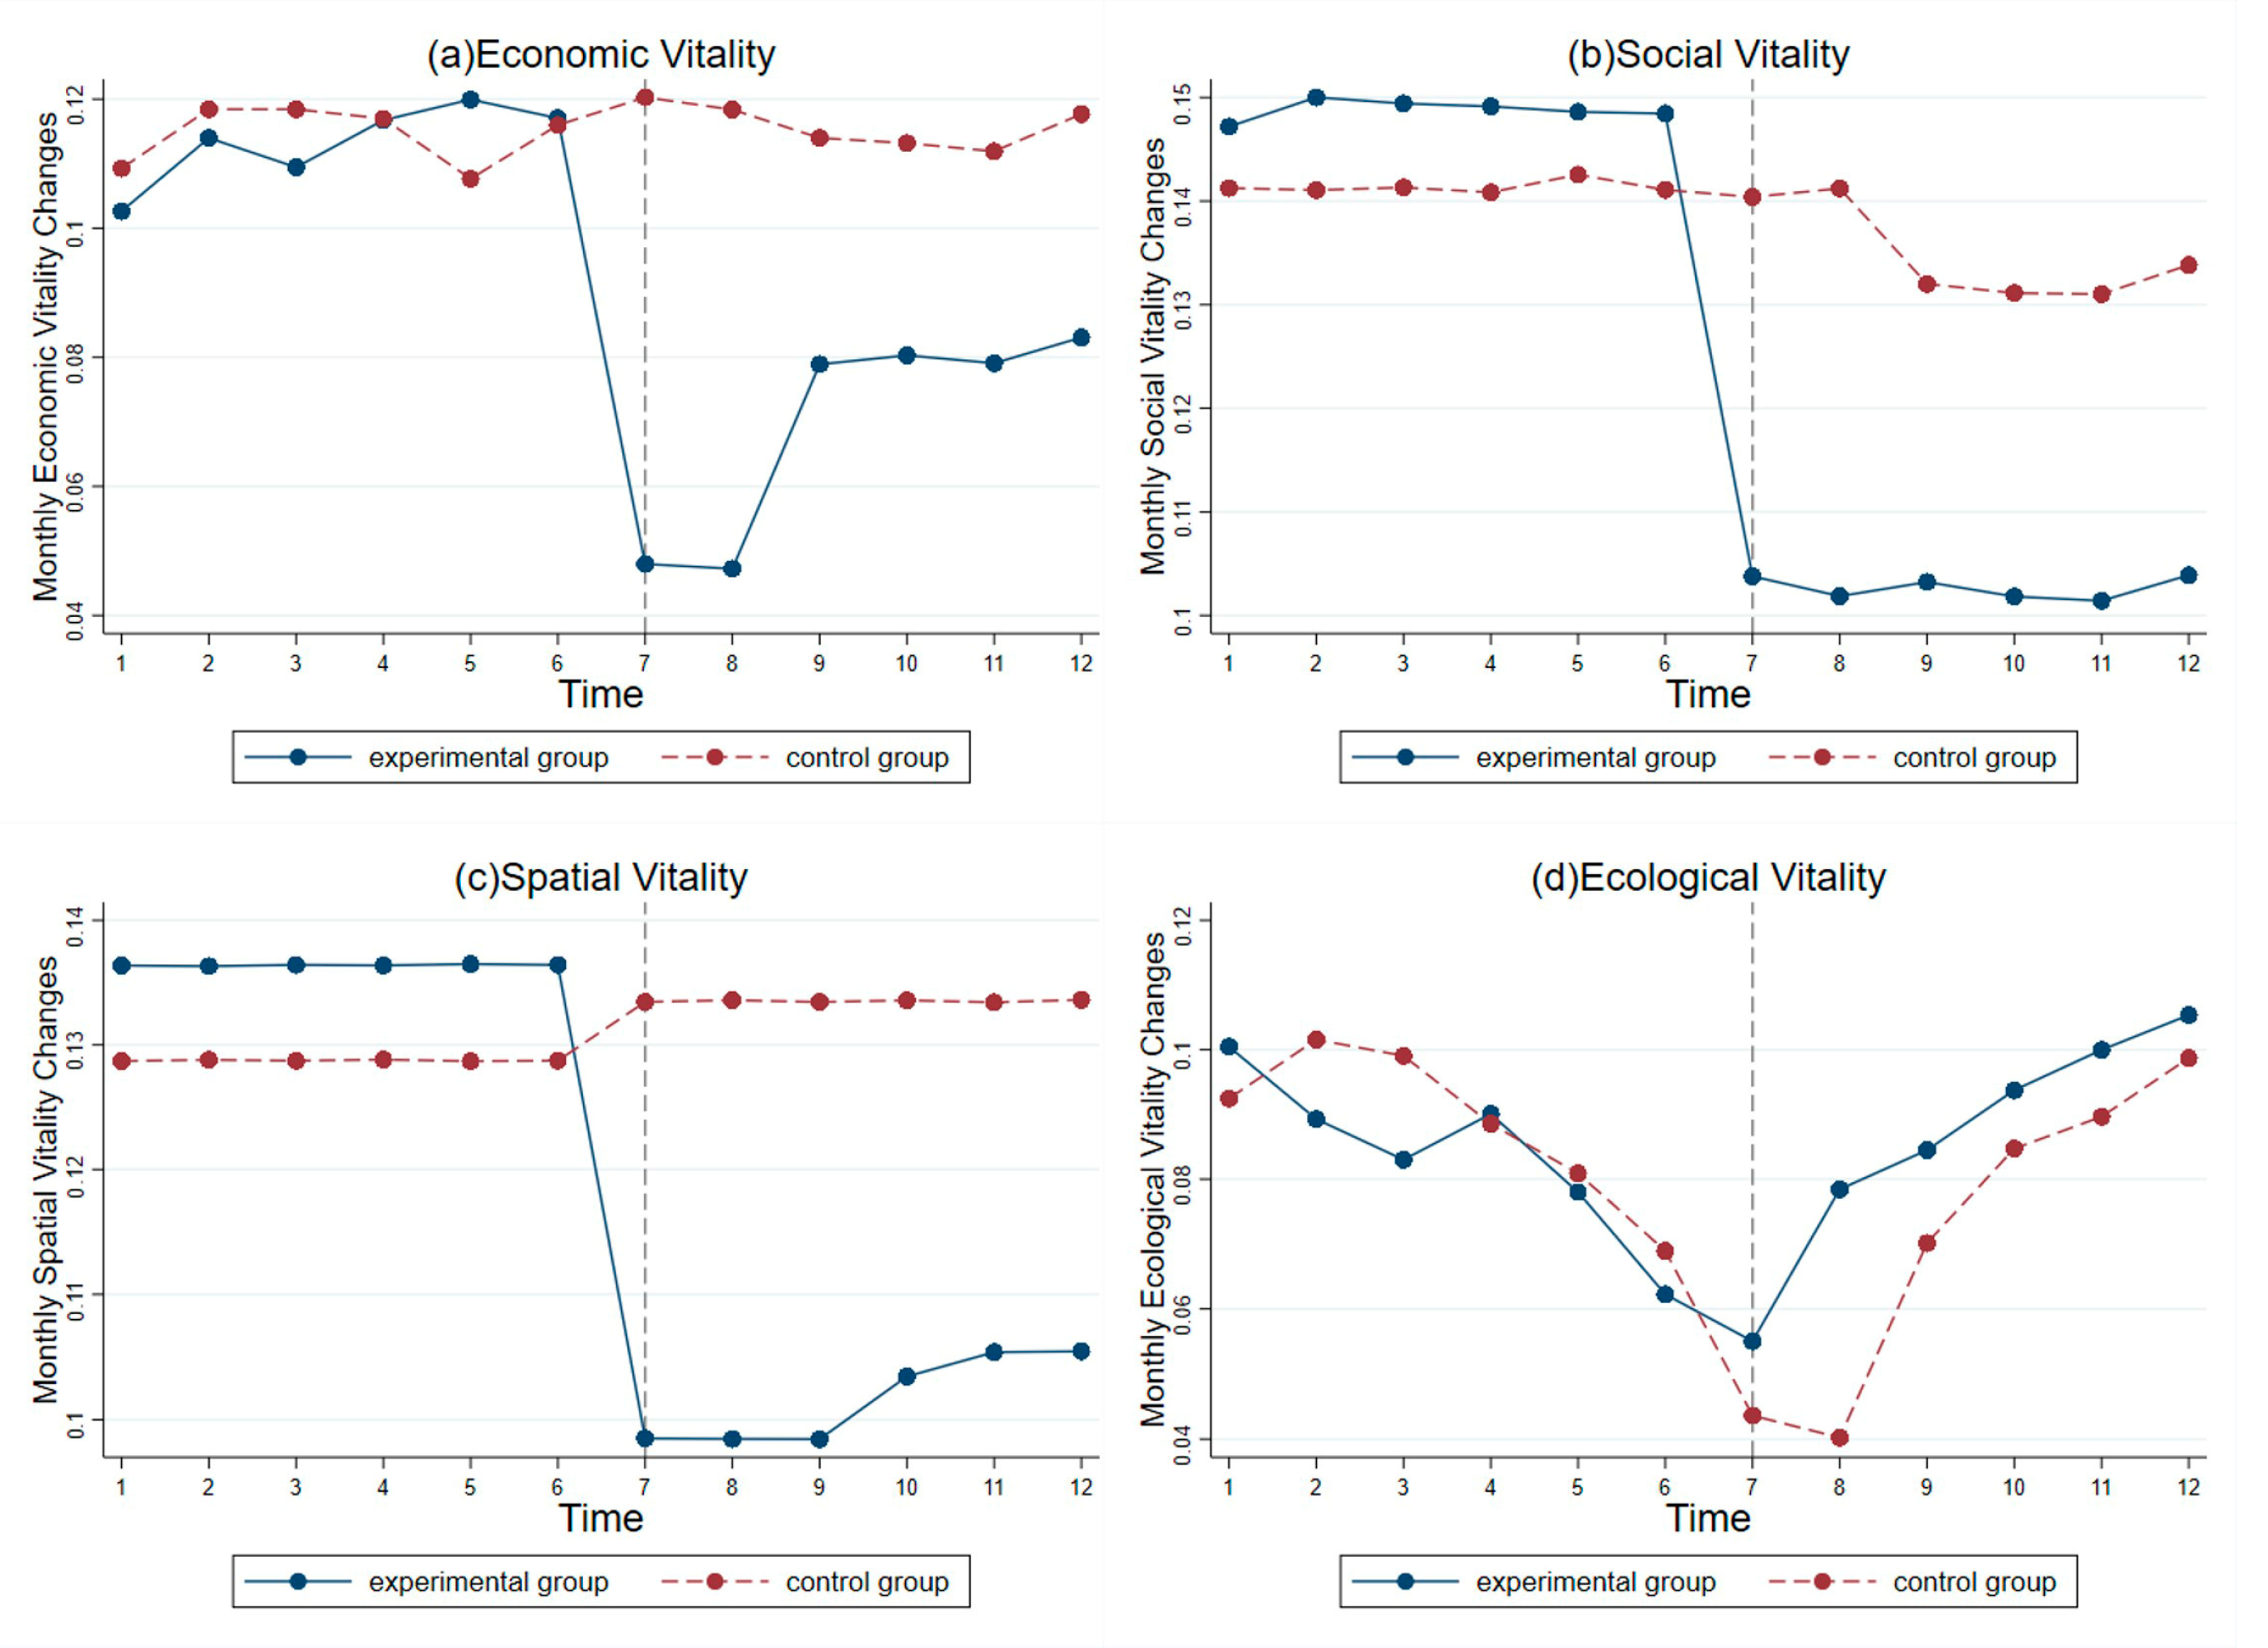
Furthermore, parallel trend tests were applied to the various dimensions of urban vitality, including ecological, social, economic, and spatial aspects, to assess the impact of public health emergencies. The results (Figure 11) illustrate the parallel trends across spatial, economic, social, and ecological vitalities. Before the event, economic, social, and spatial vitality levels exhibited stability in both the experimental and control groups, with minor fluctuations. Conversely, ecological vitality consistently showed a declining trend in both groups before the event. Consequently, all four vitality dimensions successfully met the criteria of the parallel trend test, paving the way for a subsequent Difference-In-Difference analysis.
5.2.2. Control Variables
Since urban resources and urban infrastructure have an important impact on urban vitality, it is important to include control factors to accurately assess the impact of public health emergencies on urban vitality [51]. We selected 13 control variables considering aspects of the population, economy, and urban infrastructure (Table 7).
5.2.3. Impact of COVID-19 on Different Dimensions
In this study, we employ a Difference-In-Difference model to analyze the impact of public health emergencies on urban vitality. The initial findings, presented in the first column of Table 8, indicate a significant negative effect of public health emergencies on urban vitality at the 5% significance level, considering only area- and time-fixed effects. In the analysis depicted in the second column, we introduce additional controls such as the road density, the population density, and economic development indicators to fully account for the impacts of public health emergencies. Despite these additional controls, public health emergencies consistently exhibit a significant negative influence on urban vitality. These results underscore the profound and detrimental effects of public health emergencies on urban vitality, suggesting that such emergencies can impede urban development irrespective of other factors.
The COVID-19 public health emergency has profoundly impacted the restaurant and tourism sectors, leading to job losses. The lockdowns and quarantines that the government implemented to control the spread have resulted in business closures, limited social interactions, and the cancellation of sporting events [52]. Moreover, this emergency has exacerbated individuals’ mental stress, further hindering socialization [53]. The prevailing uncertainty affects individuals’ investment and consumption decisions. Addressing this epidemic has required substantial governmental resources, depleting urban finances and influencing future city operations. Consequently, public health emergencies affect all aspects of urban life, diminishing the city’s overall vitality.
Given that spatial, social, economic, and ecological vitality all satisfied the parallel trend assumption, a Difference-In-Difference analysis was warranted (Table 9). Initially, this analysis focused solely on the public health emergency’s impact on vitality without incorporating various control variables. The findings indicate a significant negative impact on social vitality at the 1% level and on spatial vitality at the 5% level, with economic vitality also experiencing a significant negative effect at the 1% level. Conversely, ecological vitality appears to benefit from public health emergencies, showing a significant positive impact at the 1% level. These results highlight the nuanced effects of public health emergencies on different facets of urban vitality. During the COVID-19 public health emergency, lockdown measures and concerns for future livelihoods significantly reduced consumer spending on food, beverages, tourism, and offline shopping, directly impacting sector revenues. Additionally, such events can severely disrupt globalized supply chains, leading to factory closures and supply chain interruptions, which negatively affect economic vitality. Government-imposed restrictions on certain areas and on public transportation reduced the need for public outings, diminishing the social and spatial vitality. Conversely, decreased human activity lessened the environmental stress, leading to improved air quality and allowing ecosystems to recuperate during factory shutdowns, thereby enhancing the city’s ecological vitality.
These findings underscore that public health emergencies significantly diminish urban vitality, exerting varying levels of influence across different vitality dimensions due to the restrictions that these emergencies place on human activities.
5.3. Factors Influencing Different Aspects of Urban Vitality
Urban vitality encompasses economic, social, spatial, and ecological dimensions. Investigating how various factors differently affect these dimensions constitutes a crucial aspect of this study. To precisely evaluate these influences, we performed a differential modeling analysis on the four facets of urban vitality, incorporating 13 control variables. The findings (Table 10) reveal that, even after adjusting for these controls, public health emergencies significantly reduce spatial, social, and economic vitality while enhancing ecological vitality.
Economic dynamism is positively influenced by factors such as UR, INS, and PBR, whereas COHESION negatively impacts it. Urbanization accelerates the pooling of the population, resources, and services, which in turn increases the availability of services and the demand for goods as the urban population grows [54]. A robust industrial structure fosters economic diversification and mitigates the economy’s vulnerability to external shocks by minimizing its reliance on single industries. Through effective fiscal policies and budgetary allocations, governments can steer economic activity, utilizing fiscal resources to diminish poverty and inequality and enhance the living standards of urban dwellers, thus spurring economic growth. On the contrary, excessive agglomeration detracts from economic dynamism by concentrating resources, facilities, or activities in specific areas, causing a relative scarcity elsewhere and posing challenges for small firms and entrepreneurs in accessing vital resources and growth opportunities.
Social vitality is positively affected by factors such as INS, PBR, and PD, whereas high aging rates (AGE) dampen social vitality. The connection between social vitality and land usage suggests that a diverse industrial structure and substantial building density indicate an area’s varied industries and commercial establishments, thereby reflecting extensive land utilization and a broad spectrum of land-use types [55]. Government budgets that facilitate investments in infrastructure and public services further enhance social dynamism. Conversely, areas characterized by higher aging rates may experience reduced consumption levels, making them less attractive for investments from businesses and retail centers, which in turn can diminish these areas’ social vitality.
Spatial vitality is influenced by a select few factors, notably POP and PD, both of which significantly enhance spatial vitality at the 10% significance level. Higher population densities increase the likelihood of encounters and interactions among individuals, which are foundational to the essence of spatial vitality. Furthermore, areas with dense populations generate a sufficient demand for public services, prompting governments to improve access by expanding public transportation networks in these locales. Similarly, regions with high building densities, encompassing a mix of residential, commercial, and office spaces, necessitate the development of superior public transportation systems to facilitate easy access to these buildings, thereby improving their spatial vitality [56].
INS and HOU negatively affect ecological vitality, with statistical significance at the 10% level, while PBR positively influences it at the 10% significance level. The expansion driven by increased industrial diversity and higher housing prices often leads to a significant consumption and development of natural resources, thus diminishing green spaces and proliferating commercial structures such as factories and office complexes. Conversely, government investments reflect a committed approach to ecological preservation. Through directing funds towards environmental conservation initiatives, including reforestation, wetland restoration, and pollution control, and by endorsing sustainable infrastructure and the progression towards a low-carbon economy, government actions are instrumental in bolstering ecosystem health and vitality.
Population density and government budgets significantly influence various aspects of vitality, thereby impacting the comprehensive vitality of the city. The proper allocation and management of these factors are crucial for the city’s long-term development.
6. Discussion and Conclusions
Urban life intricately weaves together economic activity, social interactions, spatial dynamics, and ecological processes. Thus, a holistic assessment of urban vitality necessitates the integration of economic, social, spatial, and ecological dimensions. NTL data, POT data, and roadway data have become instrumental in evaluating urban vitality. We believe that NTL and GDP data can capture economic vitality; the land-use index mirrors social vitality; transportation-related POIs, alongside road density, can depict spatial vitality; and the Normalized Difference Vegetation Index coupled with the Air Quality Index can delineate ecological vitality. Employing the entropy weight method to amalgamate these four dimensions of urban vitality enabled us to discern the distribution of spatial vitality within Wuhan and observe the evolving trends in vitality across different areas. The central city of Wuhan is the center of business and finance, with dense land usage and good road transportation, and areas distant from the city center are less intensively developed, with a large amount of farmland and public transportation still being under construction [54,57]. Therefore, the distribution of spatial vitality in Wuhan roughly follows this pattern: the central city exhibits higher economic, social, spatial vitality than the remote city, while the far city exhibits more ecological vitality.
Our statistical charts reveal the complexity of changes in urban vitality, with diverse trends across the four dimensions of vitality in various regions. This complexity makes it challenging to grasp the nuances of urban vitality shifts through traditional time-series analysis alone.
This study employed a Difference-In-Difference (DID) model to investigate the impact of public health emergencies on urban vitality. It revealed that Wuhan’s urban development has been progressively improving, allowing its urban vitality to remain generally stable in the absence of emergencies. However, public health emergencies can significantly undermine city-wide vitality. In response to early stages of the COVID-19 outbreak, government actions, including restaurant closures, transportation restrictions, and resident movement limitations, precipitated a decline in the economic, social, and spatial vitality. Concurrently, decreased human activity during these periods inadvertently benefited the environment, thereby boosting the ecological vitality. To inform future urban development strategies and the creation of resilient, dynamic cities, our analysis incorporated control variables. The findings indicate that the population density and public revenue significantly influence urban vitality. Based on these insights, urban planners are advised to enhance healthcare and public services, particularly in areas with greater elderly populations.
This study extends previous research by assessing urban vitality across multiple dimensions and applying the entropy weighting method to assign precise weights. Unlike previous studies that depend on a single snapshot in time, this research captures the ongoing dynamic shifts in urban vitality. Furthermore, it utilizes a Difference-In-Difference model to quantitatively evaluate changes in urban vitality. Investigating the spatial distribution of urban vitality and identifying its key drivers will aid urban planners in selecting indicators for a holistic evaluation of urban vitality, thereby facilitating enhanced urban development.
Despite its contributions, this study has areas that could benefit from further refinement in future research. First, integrating more comprehensive data sources, such as GPS data, could significantly improve the precision of spatial vitality assessments and, by extension, urban vitality measurements. Secondly, expanding the timeframe to include data following the COVID-19 public health emergency would offer deeper insights into its prolonged effects on urban vitality. Thirdly, there are other methods involved in policy discussions, such as the instrumental variable method and regression discontinuity design, and we plan to utilize a variety of methods in subsequent experiments to compare the effects of public health emergencies on urban vitality.
Author Contributions
Y.C.: conceptualization; methodology; software; validation; formal analysis; investigation; writing—original draft preparation. B.L.: conceptualization; validation; resources; data curation. S.L.: validation; resources; data curation. Z.C.: writing—review and editing. All authors have read and agreed to the published version of the manuscript.
Funding
This work was supported by the National Natural Science Foundation of China (No. 42301532) and the China Postdoctoral Science Foundation (No. 2022M722442).
Data Availability Statement
Dataset available on request from the authors.
Acknowledgments
Our deepest gratitude goes to the anonymous reviewers and editors for their careful work and thoughtful suggestions that have greatly improved this paper.
Conflicts of Interest
The authors declare no conflicts of interest.
References
- Jane, J. The Death and Life of Great American Cities: The Failure of Town Planning; Random House: New York, NY, USA, 1984. [Google Scholar]
- Stead, D. Promoting an urban renaissance in England and the Netherlands. Cities 2004, 21, 119–136. [Google Scholar] [CrossRef]
- Woodworth, M.D.; Wallace, J.L. Seeing ghosts: Parsing China’s “ghost city” controversy. Urban Geogr. 2017, 38, 1270–1281. [Google Scholar] [CrossRef]
- Batty, M. Empty buildings, shrinking cities and ghost towns. Environ. Plan. B-Plan. Des. 2016, 43, 3–6. [Google Scholar] [CrossRef]
- Li, Q.; Cui, C.H.; Liu, F.; Wu, Q.R.; Run, Y.D.; Han, Z.G. Multidimensional Urban Vitality on Streets: Spatial Patterns and Influence Factor Identification Using Multisource Urban Data. ISPRS Int. J. Geo-Inf. 2022, 11, 2. [Google Scholar] [CrossRef]
- Ye, Y.; Li, D.; Liu, X.J. How block density and typology affect urban vitality: An exploratory analysis in Shenzhen, China. Urban Geogr. 2018, 39, 631–652. [Google Scholar] [CrossRef]
- Li, X.; Li, Y.; Jia, T.; Zhou, L.; Hijazi, I.H. The six dimensions of built environment on urban vitality: Fusion evidence from multi-source data. Cities 2022, 121, 20. [Google Scholar] [CrossRef]
- Yang, C.W.; Sha, D.X.; Liu, Q.; Li, Y.; Lan, H.; Guan, W.W.; Hu, T.; Li, Z.L.; Zhang, Z.R.; Thompson, J.H.; et al. Taking the pulse of COVID-19: A spatiotemporal perspective. Int. J. Digit. Earth 2020, 13, 1186–1211. [Google Scholar] [CrossRef]
- Liu, Q.; Harris, J.T.; Chiu, L.S.; Sun, D.L.; Houser, P.R.; Yu, M.Z.; Duffy, D.Q.; Little, M.M.; Yang, C.W. Spatiotemporal impacts of COVID-19 on air pollution in California, USA. Sci. Total Environ. 2021, 750, 9. [Google Scholar] [CrossRef] [PubMed]
- Beyer, R.C.M.; Franco-Bedoya, S.; Galdo, V. Examining the economic impact of COVID-19 in India through daily electricity consumption and nighttime light intensity. World Dev. 2021, 140, 105287. [Google Scholar] [CrossRef]
- Vaishar, A.; Stastná, M. Impact of the COVID-19 pandemic on rural tourism in Czechia Preliminary considerations. Curr. Issues Tour. 2022, 25, 187–191. [Google Scholar] [CrossRef]
- Ghosh, T.; Elvidge, C.D.; Hsu, F.C.; Zhizhin, M.; Bazilian, M. The Dimming of Lights in India during the COVID-19 Pandemic. Remote Sens. 2020, 12, 3289. [Google Scholar] [CrossRef]
- Jiang, Y.H.; Chen, Z.J.; Sun, P.J. Urban Shrinkage and Urban Vitality Correlation Research in the Three Northeastern Provinces of China. Int. J. Environ. Res. Public Health 2022, 19, 10650. [Google Scholar] [CrossRef] [PubMed]
- Jalaladdini, S.; Oktay, D. Urban Public Spaces and Vitality: A Socio-Spatial Analysis in the Streets of Cypriot Towns. In Proceedings of the Asia Pacific International Conference on Environment-Behaviour Studies (AicE-Bs), Famagusta, Cyprus, 7–9 December 2011; pp. 664–674. [Google Scholar]
- Colwell, P.F.; Dehring, C.A.; Turnbull, G.K. Recreation demand and residential location. J. Urban Econ. 2002, 51, 418–428. [Google Scholar] [CrossRef]
- Pohan, A.F.; Ginting, N.; Zahrah, W. Environmental Vitality Study on Shophouse Area. Case study: Asia Mega Mas Shophouse Area, Medan. In Proceedings of the 1st International Conference on Industrial and Manufacturing Engineering (ICI and ME), Medan, Indonesia, 16–17 October 2018. [Google Scholar]
- Wu, J.Y.; Ta, N.; Song, Y.; Lin, J.; Chai, Y.W. Urban form breeds neighborhood vibrancy: A case study using a GPS-based activity survey in suburban Beijing. Cities 2018, 74, 100–108. [Google Scholar] [CrossRef]
- Zhang, J.W.; Liu, X.T.; Tan, X.Y.; Jia, T.; Senousi, A.M.; Huang, J.W.; Yin, L.; Zhang, F. Nighttime Vitality and Its Relationship to Urban Diversity: An Exploratory Analysis in Shenzhen, China. IEEE J. Sel. Top. Appl. Earth Obs. Remote Sens. 2022, 15, 309–322. [Google Scholar] [CrossRef]
- Chen, Z.X.; He, D.; Qin, Z.H.; Zhou, J.; Yang, T. The Influence of High-speed Rail on the Level and Structure of Urban Economic Vitality: An Empirical Study Based on Real GDP Data. Appl. Spat. Anal. Policy 2023. [Google Scholar] [CrossRef]
- Guo, X.; Chen, H.F.; Yang, X.P. An Evaluation of Street Dynamic Vitality and Its Influential Factors Based on Multi-Source Big Data. ISPRS Int. J. Geo-Inf. 2021, 10, 143. [Google Scholar] [CrossRef]
- Zhou, Y.Q.; He, X.; Zikirya, B. Boba Shop, Coffee Shop, and Urban Vitality and Development-A Spatial Association and Temporal Analysis of Major Cities in China from the Standpoint of Nighttime Light. Remote Sens. 2023, 15, 903. [Google Scholar] [CrossRef]
- Yue, Y.; Zhuang, Y.; Yeh, A.G.O.; Xie, J.Y.; Ma, C.L.; Li, Q.Q. Measurements of POI-based mixed use and their relationships with neighbourhood vibrancy. Int. J. Geogr. Inf. Sci. 2017, 31, 658–675. [Google Scholar] [CrossRef]
- Song, Y.; Merlin, L.; Rodriguez, D. Comparing measures of urban land use mix. Comput. Environ. Urban Syst. 2013, 42, 1–13. [Google Scholar] [CrossRef]
- Ming, Y.; Liu, Y.; Zhou, J. Vitality assessment of mountainous cities based on multi-source data:A case of Chongqing Municipality, China. Resour. Sci. 2020, 42, 710–722. [Google Scholar]
- Cai, X.J.; Wu, Z.F.; Cheng, J. Using kernel density estimation to assess the spatial pattern of road density and its impact on landscape fragmentation. Int. J. Geogr. Inf. Sci. 2013, 27, 222–230. [Google Scholar] [CrossRef]
- Van den Berg, A.E.; Jorgensen, A.; Wilson, E.R. Evaluating restoration in urban green spaces: Does setting type make a difference? Landsc. Urban Plan. 2014, 127, 173–181. [Google Scholar] [CrossRef]
- Sarmadi, M.; Rahimi, S.; Rezaei, M.; Sanaei, D.; Dianatinasab, M. Air quality index variation before and after the onset of COVID-19 pandemic: A comprehensive study on 87 capital, industrial and polluted cities of the world. Environ. Sci. Eur. 2021, 33, 134. [Google Scholar] [CrossRef] [PubMed]
- Sohrabi, C.; Alsafi, Z.; O’Neill, N.; Khan, M.; Kerwan, A.; Al-Jabir, A.; Iosifidis, C.; Agha, R. World Health Organization declares global emergency: A review of the 2019 novel coronavirus (COVID-19). Int. J. Surg. 2020, 76, 71–76. [Google Scholar] [CrossRef] [PubMed]
- English, A.S.; Yang, Y.; Marshall, R.C.; Nam, B.H. Social support for international students who faced emotional challenges midst Wuhan’s 76-day lockdown during early stage of the COVID-19 pandemic. Int. J. Intercult. Relat. 2022, 87, 1–12. [Google Scholar] [CrossRef] [PubMed]
- Nikolopoulos, K.; Punia, S.; Schäfers, A.; Tsinopoulos, C.; Vasilakis, C. Forecasting and planning during a pandemic: COVID-19 growth rates, supply chain disruptions, and governmental decisions. Eur. J. Oper. Res. 2021, 290, 99–115. [Google Scholar] [CrossRef] [PubMed]
- Azevedo, F.; Pavlovic, T.; Rêgo, G.G.; Ay, F.C.; Gjoneska, B.; Etienne, T.W.; Ross, R.M.; Schönegger, P.; Riaño-Moreno, J.C.; Cichocka, A.; et al. Social and moral psychology of COVID-19 across 69 countries. Sci. Data 2023, 10, 272. [Google Scholar] [CrossRef] [PubMed]
- Rousseau, S.; Deschacht, N. Public Awareness of Nature and the Environment During the COVID-19 Crisis. Environ. Resour. Econ. 2020, 76, 1149–1159. [Google Scholar] [CrossRef]
- Gray, R.S. Agriculture, transportation, and the COVID-19 crisis. Can. J. Agric. Econ.-Rev. Can. D Agroecon. 2020, 68, 239–243. [Google Scholar] [CrossRef]
- Hu, T.; Shao, W.Q. Spatiotemporal Analysis of Urban Nighttime Light After China Lifted 3-Year-Old COVID-19 Restrictions. IEEE J. Sel. Top. Appl. Earth Obs. Remote Sens. 2023, 16, 9038–9050. [Google Scholar] [CrossRef]
- Mollalo, A.; Vahedi, B.; Rivera, K.M. GIS-based spatial modeling of COVID-19 incidence rate in the continental United States. Sci. Total Environ. 2020, 728, 138884. [Google Scholar] [CrossRef] [PubMed]
- Supriatna, S.; Zulkarnain, F.; Ardiansyah, A.; Rizqihandari, N.; Semedi, J.M.; Indratmoko, S.; Rahatiningtyas, N.S.; Nurlambang, T.; Dimyati, M. Communicating the High Susceptible Zone of COVID-19 and its Exposure to Population Number through a Web-GIS Dashboard for Indonesia Cases. Int. J. Technol. 2022, 13, 706–716. [Google Scholar] [CrossRef]
- Lau, H.; Khosrawipour, V.; Kocbach, P.; Mikolajczyk, A.; Schubert, J.; Bania, J.; Khosrawipour, T. The positive impact of lockdown in Wuhan on containing the COVID-19 outbreak in China. J. Travel Med. 2020, 27, 7. [Google Scholar] [CrossRef] [PubMed]
- Keola, S.; Andersson, M.; Hall, O. Monitoring Economic Development from Space: Using Nighttime Light and Land Cover Data to Measure Economic Growth. World Dev. 2015, 66, 322–334. [Google Scholar] [CrossRef]
- Zhao, J.; Du, Z.; Wu, Z.; Zhang, H.; Guo, N.; Ma, Z.; Liu, X. Seasonal variations of day- and nighttime warming and their effects on vegetation dynamics in China’s temperate zone. Acta Geogr. Sin. 2018, 73, 395–404. [Google Scholar]
- Ma, N.; Szilagyi, J.; Zhang, Y.S.; Liu, W.B. Complementary-Relationship-Based Modeling of Terrestrial Evapotranspiration Across China During 1982-2012: Validations and Spatiotemporal Analyses. J. Geophys. Res.-Atmos. 2019, 124, 4326–4351. [Google Scholar] [CrossRef]
- Huang, S.; Tang, L.N.; Hupy, J.P.; Wang, Y.; Shao, G.F. A commentary review on the use of normalized difference vegetation index (NDVI) in the era of popular remote sensing. J. For. Res. 2021, 32, 1–6. [Google Scholar] [CrossRef]
- Yang, H.; He, Q.P.; Cui, L.; Taha, A.M. Exploring the Spatial Relationship between Urban Vitality and Urban Carbon Emissions. Remote Sens. 2023, 15, 2173. [Google Scholar] [CrossRef]
- Hai, X.; Liu, Y.; Zhao, P.; Zhang, H. Using Mobile Phone Data to Estimate the Temporal-Spatial Distribution and Socioeconomic Attributes of Population in Megacities: A Case Study of Beijing. Acta Sci. Nat. Univ. Pekin. 2020, 56, 518–530. [Google Scholar]
- Mouratidis, K.; Poortinga, W. Built environment, urban vitality and social cohesion: Do vibrant neighborhoods foster strong communities? Landsc. Urban Plan. 2020, 204, 103951. [Google Scholar] [CrossRef]
- Sun, Y.A.; You, X.T. Do digital inclusive finance, innovation, and entrepreneurship activities stimulate vitality of the urban economy? Empirical evidence from the Yangtze River Delta, China. Technol. Soc. 2023, 72, 102200. [Google Scholar] [CrossRef]
- Zhang, A.Q.; Li, W.F.; Wu, J.Y.; Lin, J.; Chu, J.Q.; Xia, C. How can the urban landscape affect urban vitality at the street block level? A case study of 15 metropolises in China. Environ. Plan. B-Urban Anal. CIty Sci. 2021, 48, 1245–1262. [Google Scholar] [CrossRef]
- Yu, Y.T.; Chen, X.D.; Zhang, N. Innovation and energy productivity: An empirical study of the innovative city pilot policy in China. Technol. Forecast. Soc. Chang. 2022, 176, 14. [Google Scholar] [CrossRef]
- Gao, Y.N.; Li, M.; Xue, J.J.; Liu, Y. Evaluation of effectiveness of China’s carbon emissions trading scheme in carbon mitigation. Energy Econ. 2020, 90, 15. [Google Scholar] [CrossRef]
- Goodman-Bacon, A.; Marcus, J. Using Difference-in-Differences to Identify Causal Effects of COVID-19 Policies. Surv. Res. Methods 2020, 14, 153–157. [Google Scholar] [CrossRef]
- Li, B.; Han, Y.K.; Wang, C.S.; Sun, W. Did civilized city policy improve energy efficiency of resource-based cities? Prefecture-level evidence from China. Energy Policy 2022, 167, 113081. [Google Scholar] [CrossRef]
- Jiang, Y.; Zhang, Y.; Liu, Y.; Huang, Z. A review of urban vitality research in the Chinese world. Trans. Urban Data Sci. Technol. 2023, 2, 81–99. [Google Scholar] [CrossRef]
- Wilson, J.M.; Lee, J.; Fitzgerald, H.N.; Oosterhoff, B.; Sevi, B.; Shook, N.J. Job Insecurity and Financial Concern During the COVID-19 Pandemic Are Associated With Worse Mental Health. J. Occup. Environ. Med. 2020, 62, 686–691. [Google Scholar] [CrossRef]
- Zhong, B.; Huang, Y.K.; Liu, Q. Mental health toll from the coronavirus: Social media usage reveals Wuhan residents’ depression and secondary trauma in the COVID-19 outbreak. Comput. Hum. Behav. 2021, 114, 106524. [Google Scholar] [CrossRef]
- Zhai, H.; Lv, C.Q.; Liu, W.Z.; Yang, C.; Fan, D.S.; Wang, Z.K.; Guan, Q.F. Understanding Spatio-Temporal Patterns of Land Use/Land Cover Change under Urbanization in Wuhan, China, 2000–2019. Remote Sens. 2021, 13, 3331. [Google Scholar] [CrossRef]
- Su, J.Q.; Su, K.; Wang, S.B. Does the Digital Economy Promote Industrial Structural Upgrading?-A Test of Mediating Effects Based on Heterogeneous Technological Innovation. Sustainability 2021, 13, 10105. [Google Scholar] [CrossRef]
- Chen, W.X.; Zeng, J.; Chu, Y.M.; Liang, J.L. Impacts of Landscape Patterns on Ecosystem Services Value: A Multiscale Buffer Gradient Analysis Approach. Remote Sens. 2021, 13, 2551. [Google Scholar] [CrossRef]
- Zhao, Y.Z.; Zhou, L.; Wang, C.; Li, J.H.; Qin, J.; Sheng, H.Q.; Huang, L.K.; Li, X. Analysis of the Spatial and Temporal Evolution of Land Subsidence in Wuhan, China from 2017 to 2021. Remote Sens. 2022, 14, 3142. [Google Scholar] [CrossRef]
Figure 1.
Study area and study data.
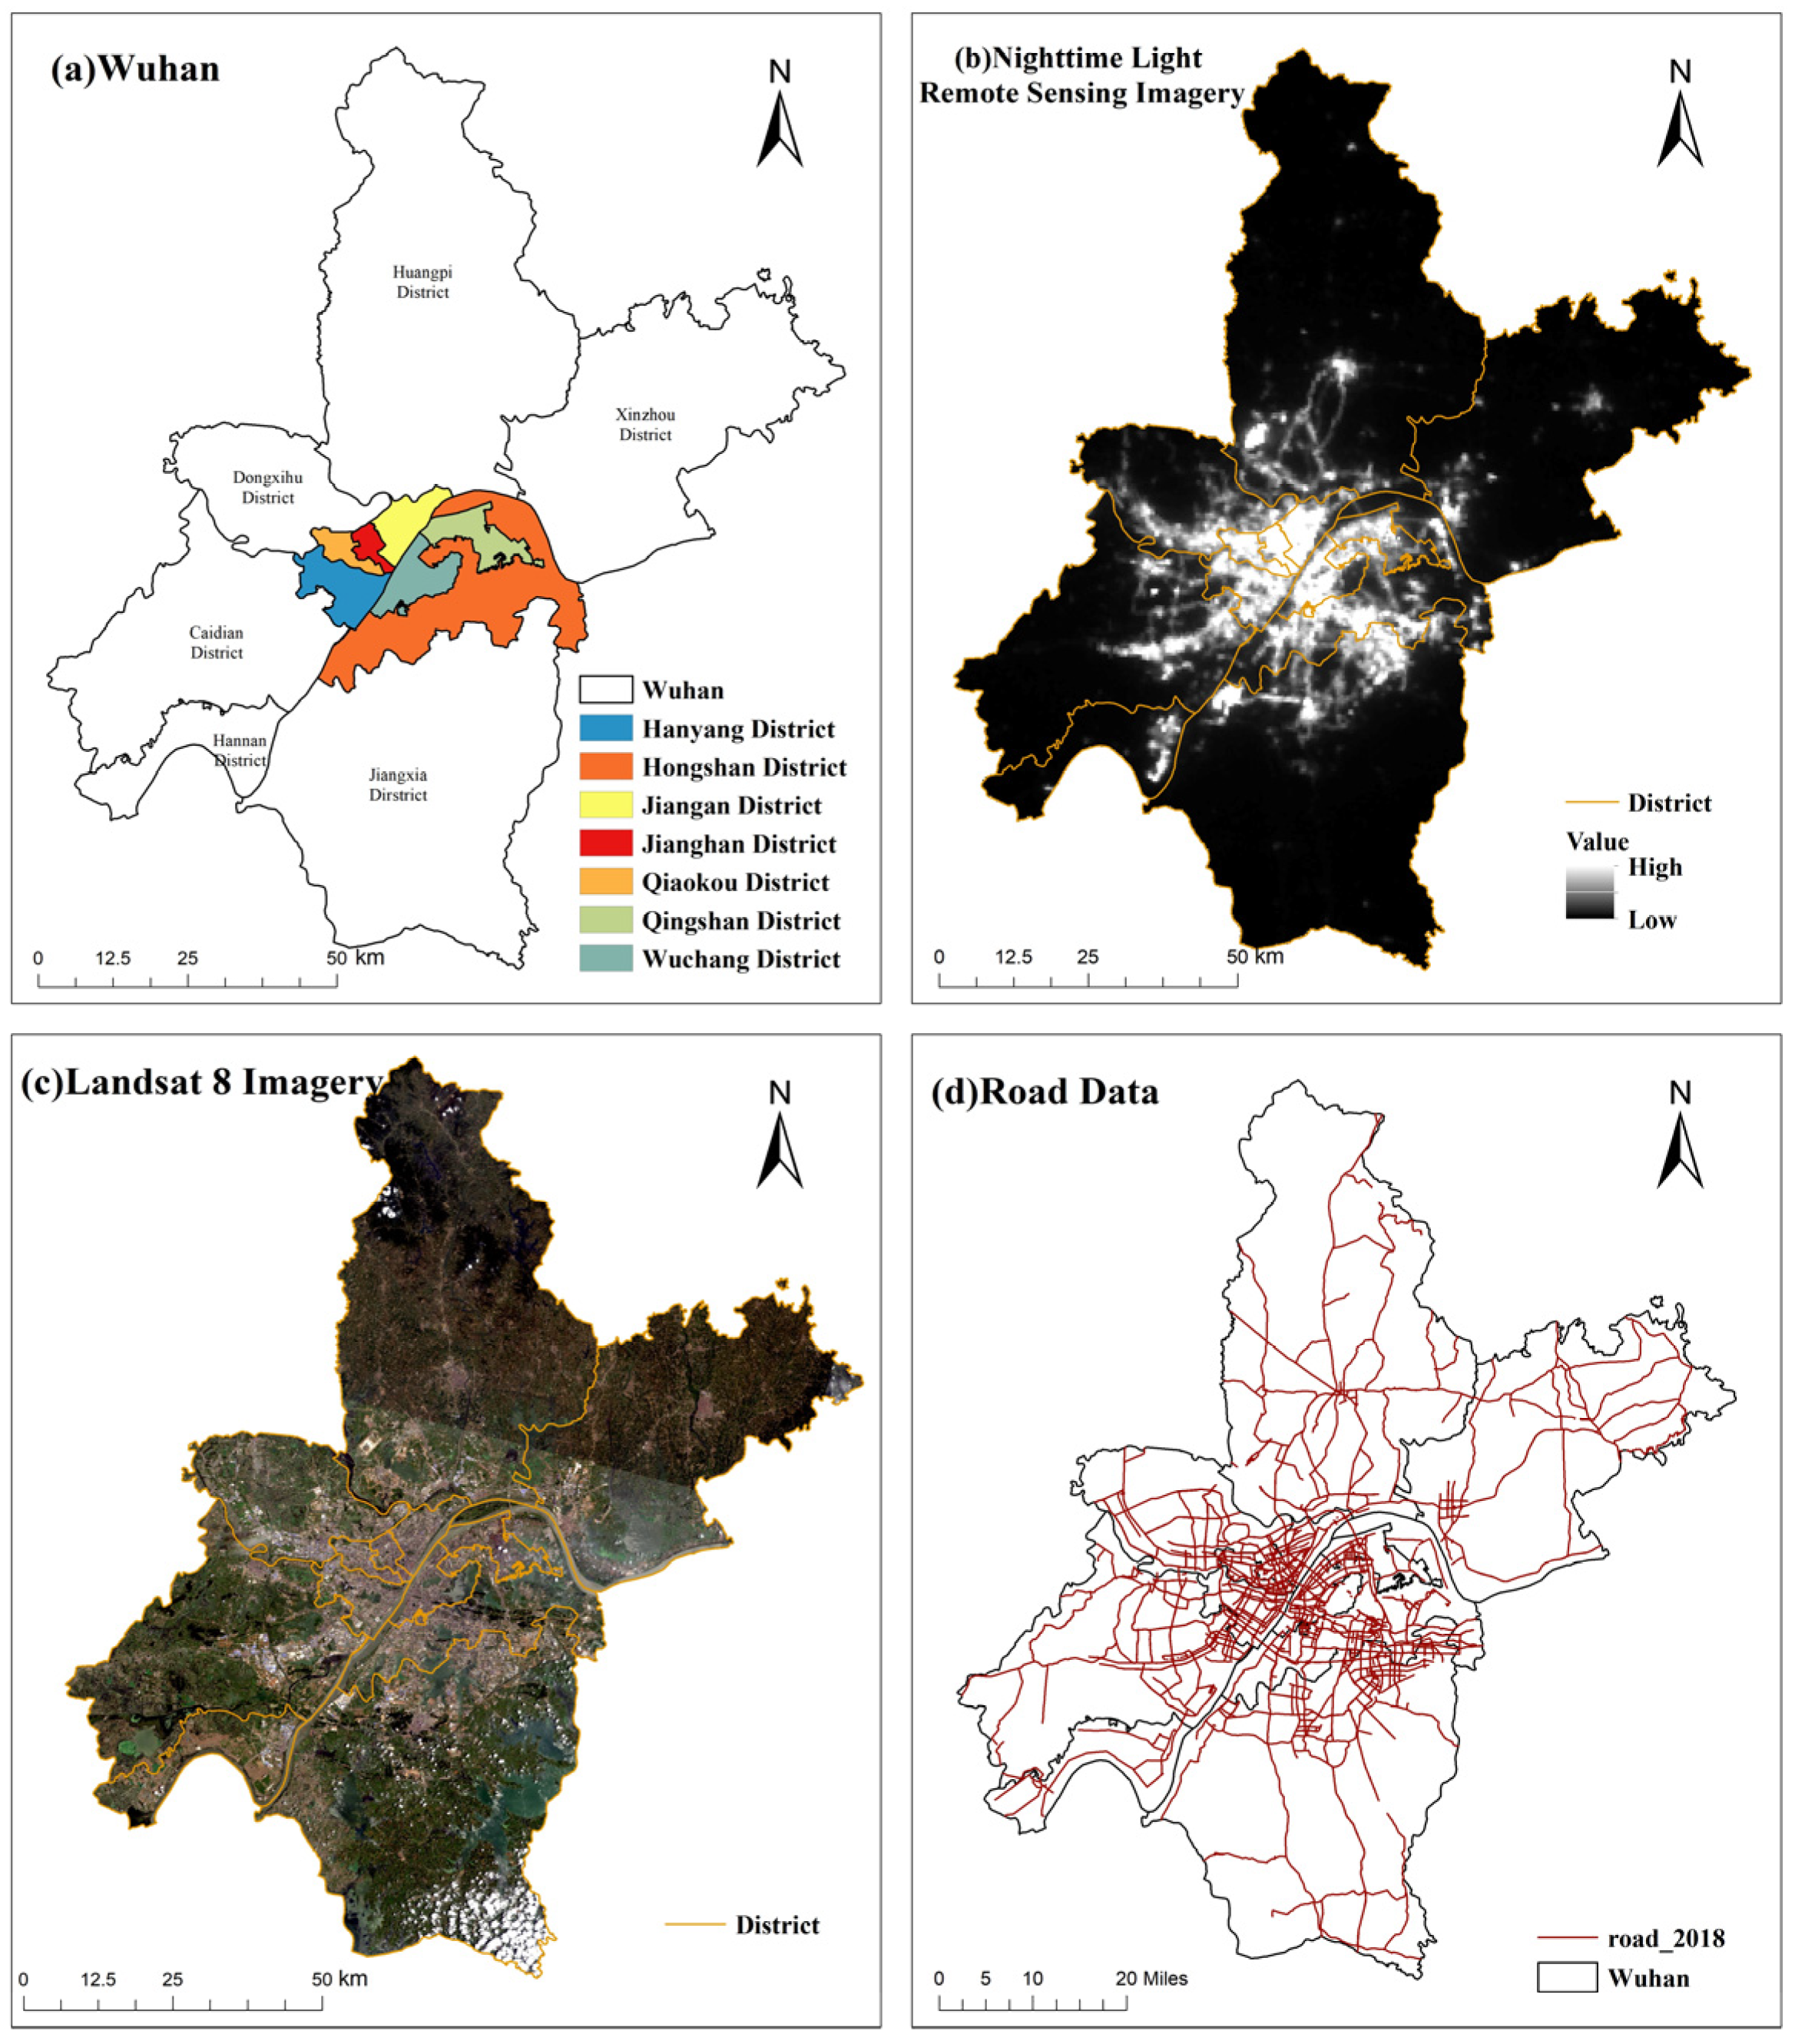
Figure 2.
Research workflow. The POIs used for calculating social vitality included industry, residential areas, green spaces, municipal utilities, and service land, while the POIs used for calculating spatial vitality only included transportation-related POIs.
Figure 2.
Research workflow. The POIs used for calculating social vitality included industry, residential areas, green spaces, municipal utilities, and service land, while the POIs used for calculating spatial vitality only included transportation-related POIs.
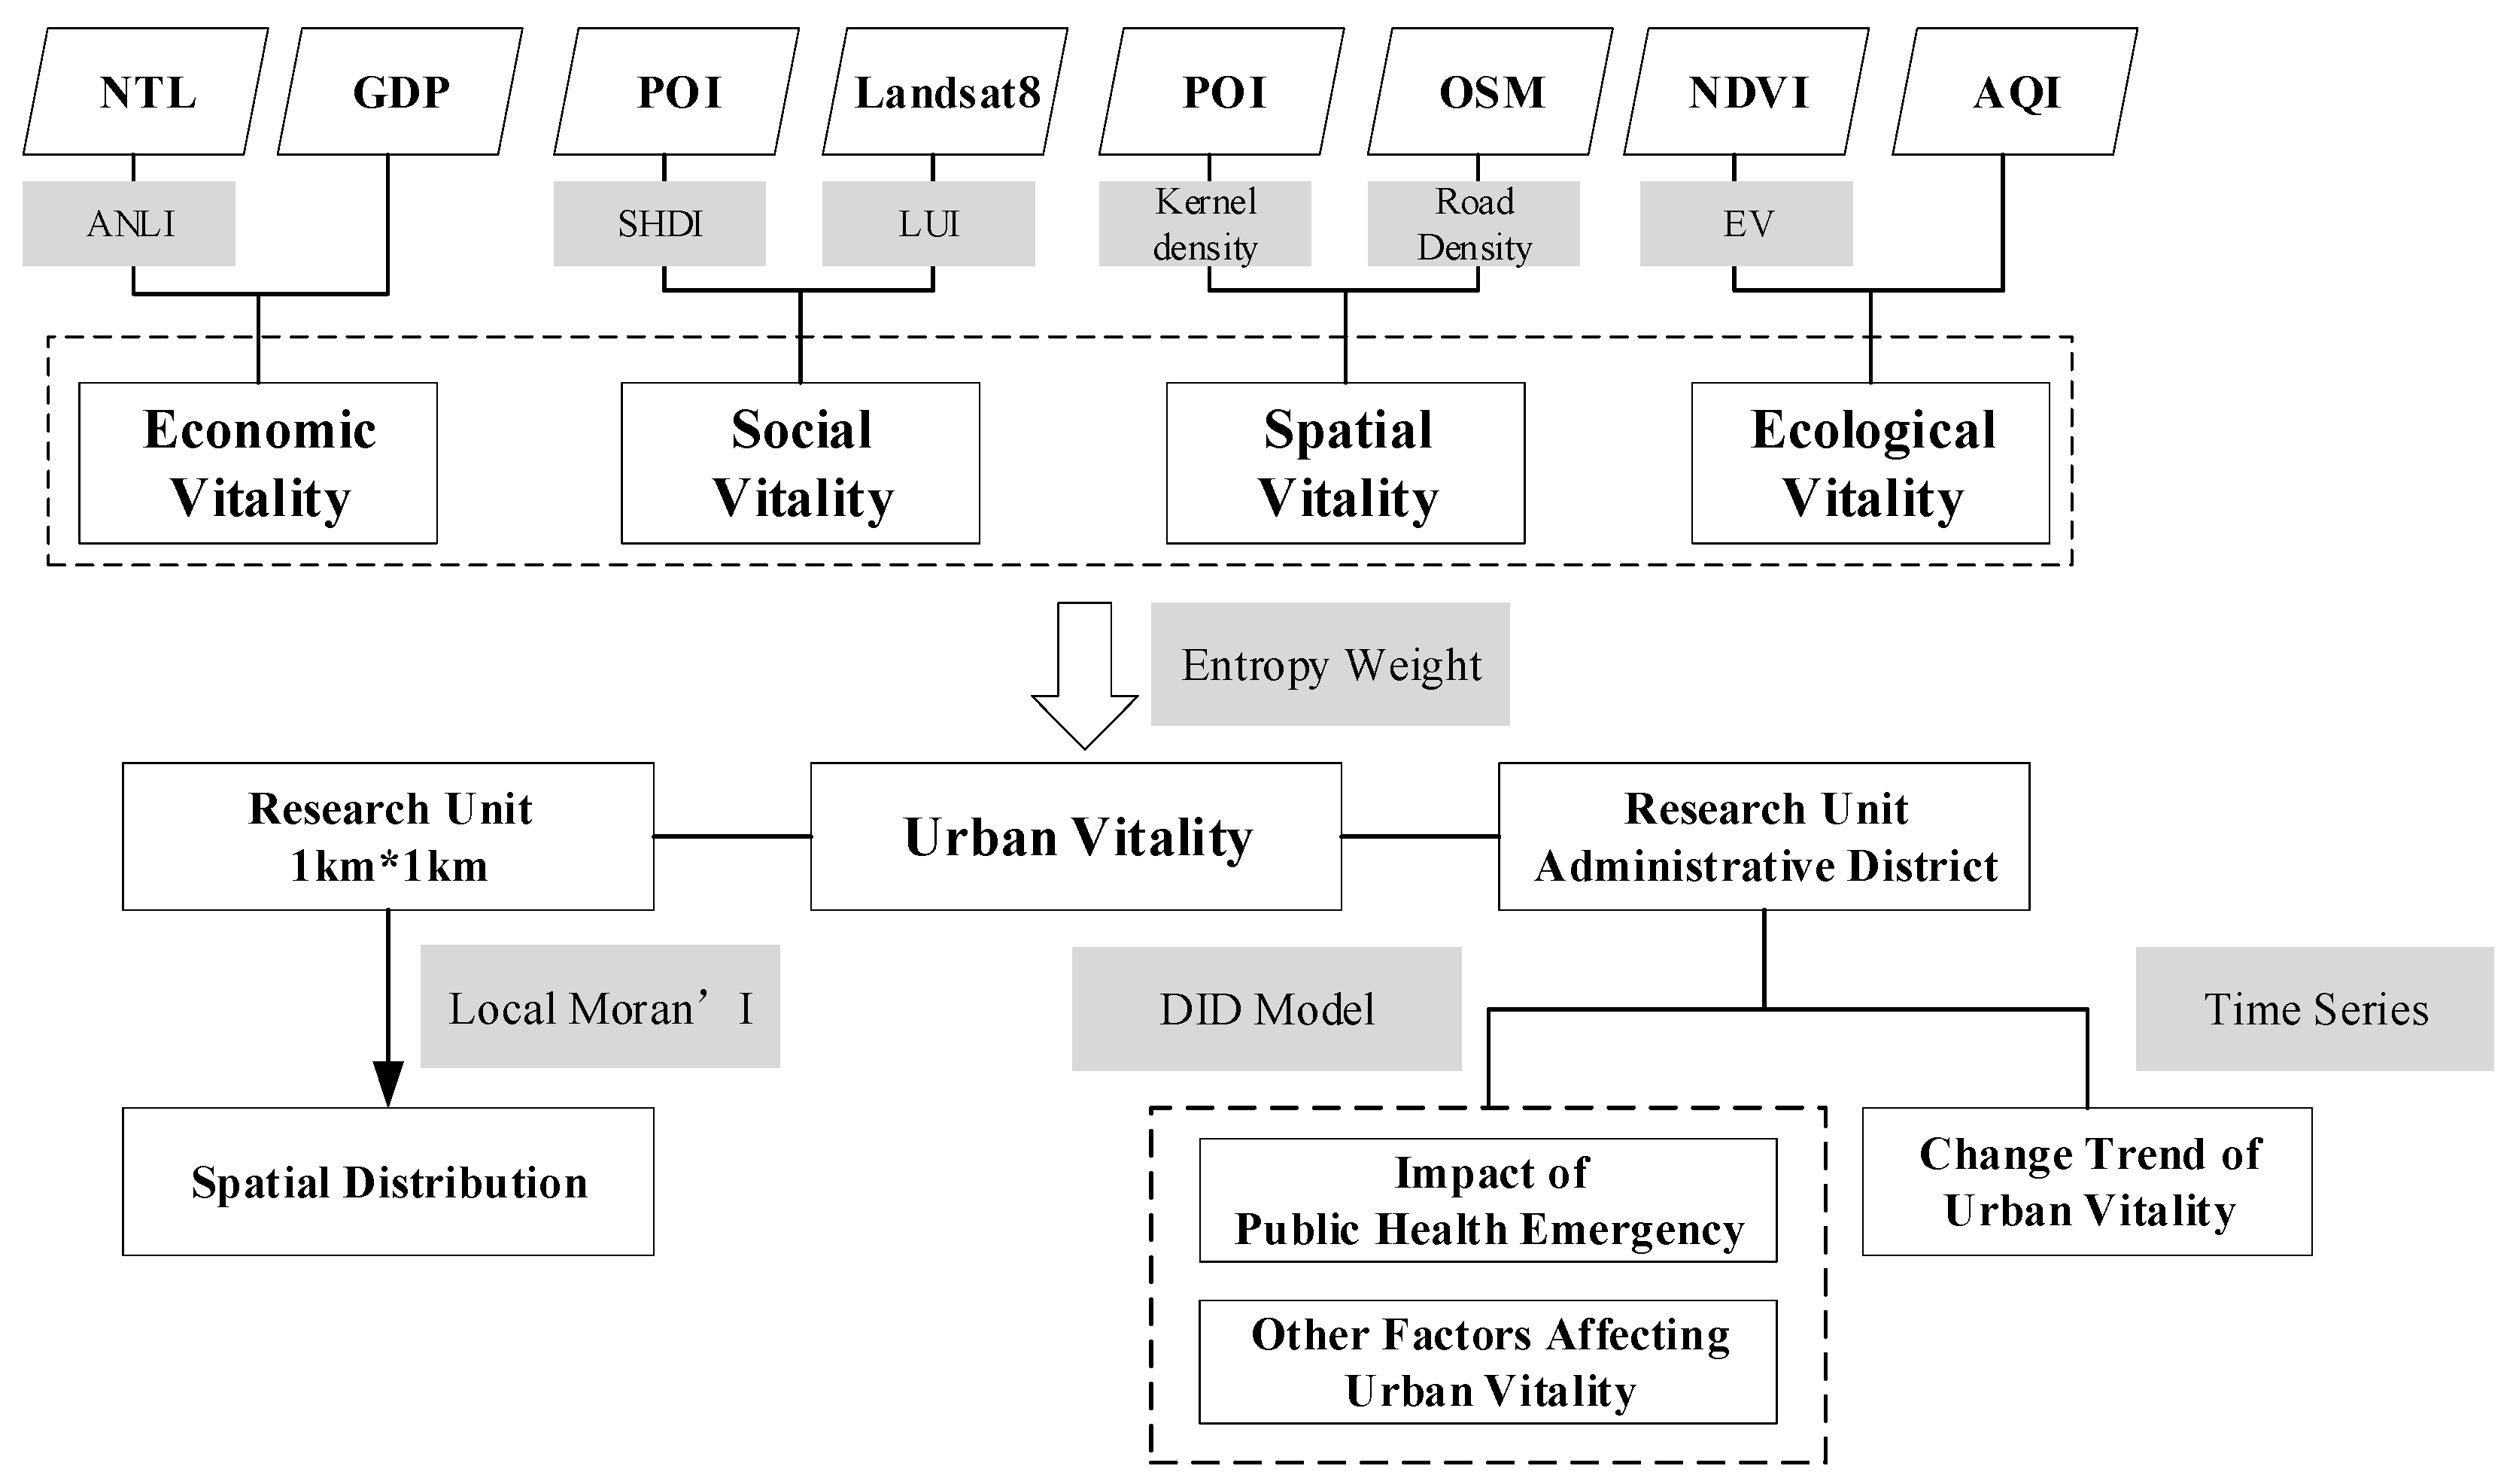
Figure 3.
Spatial distribution of economic vitality.
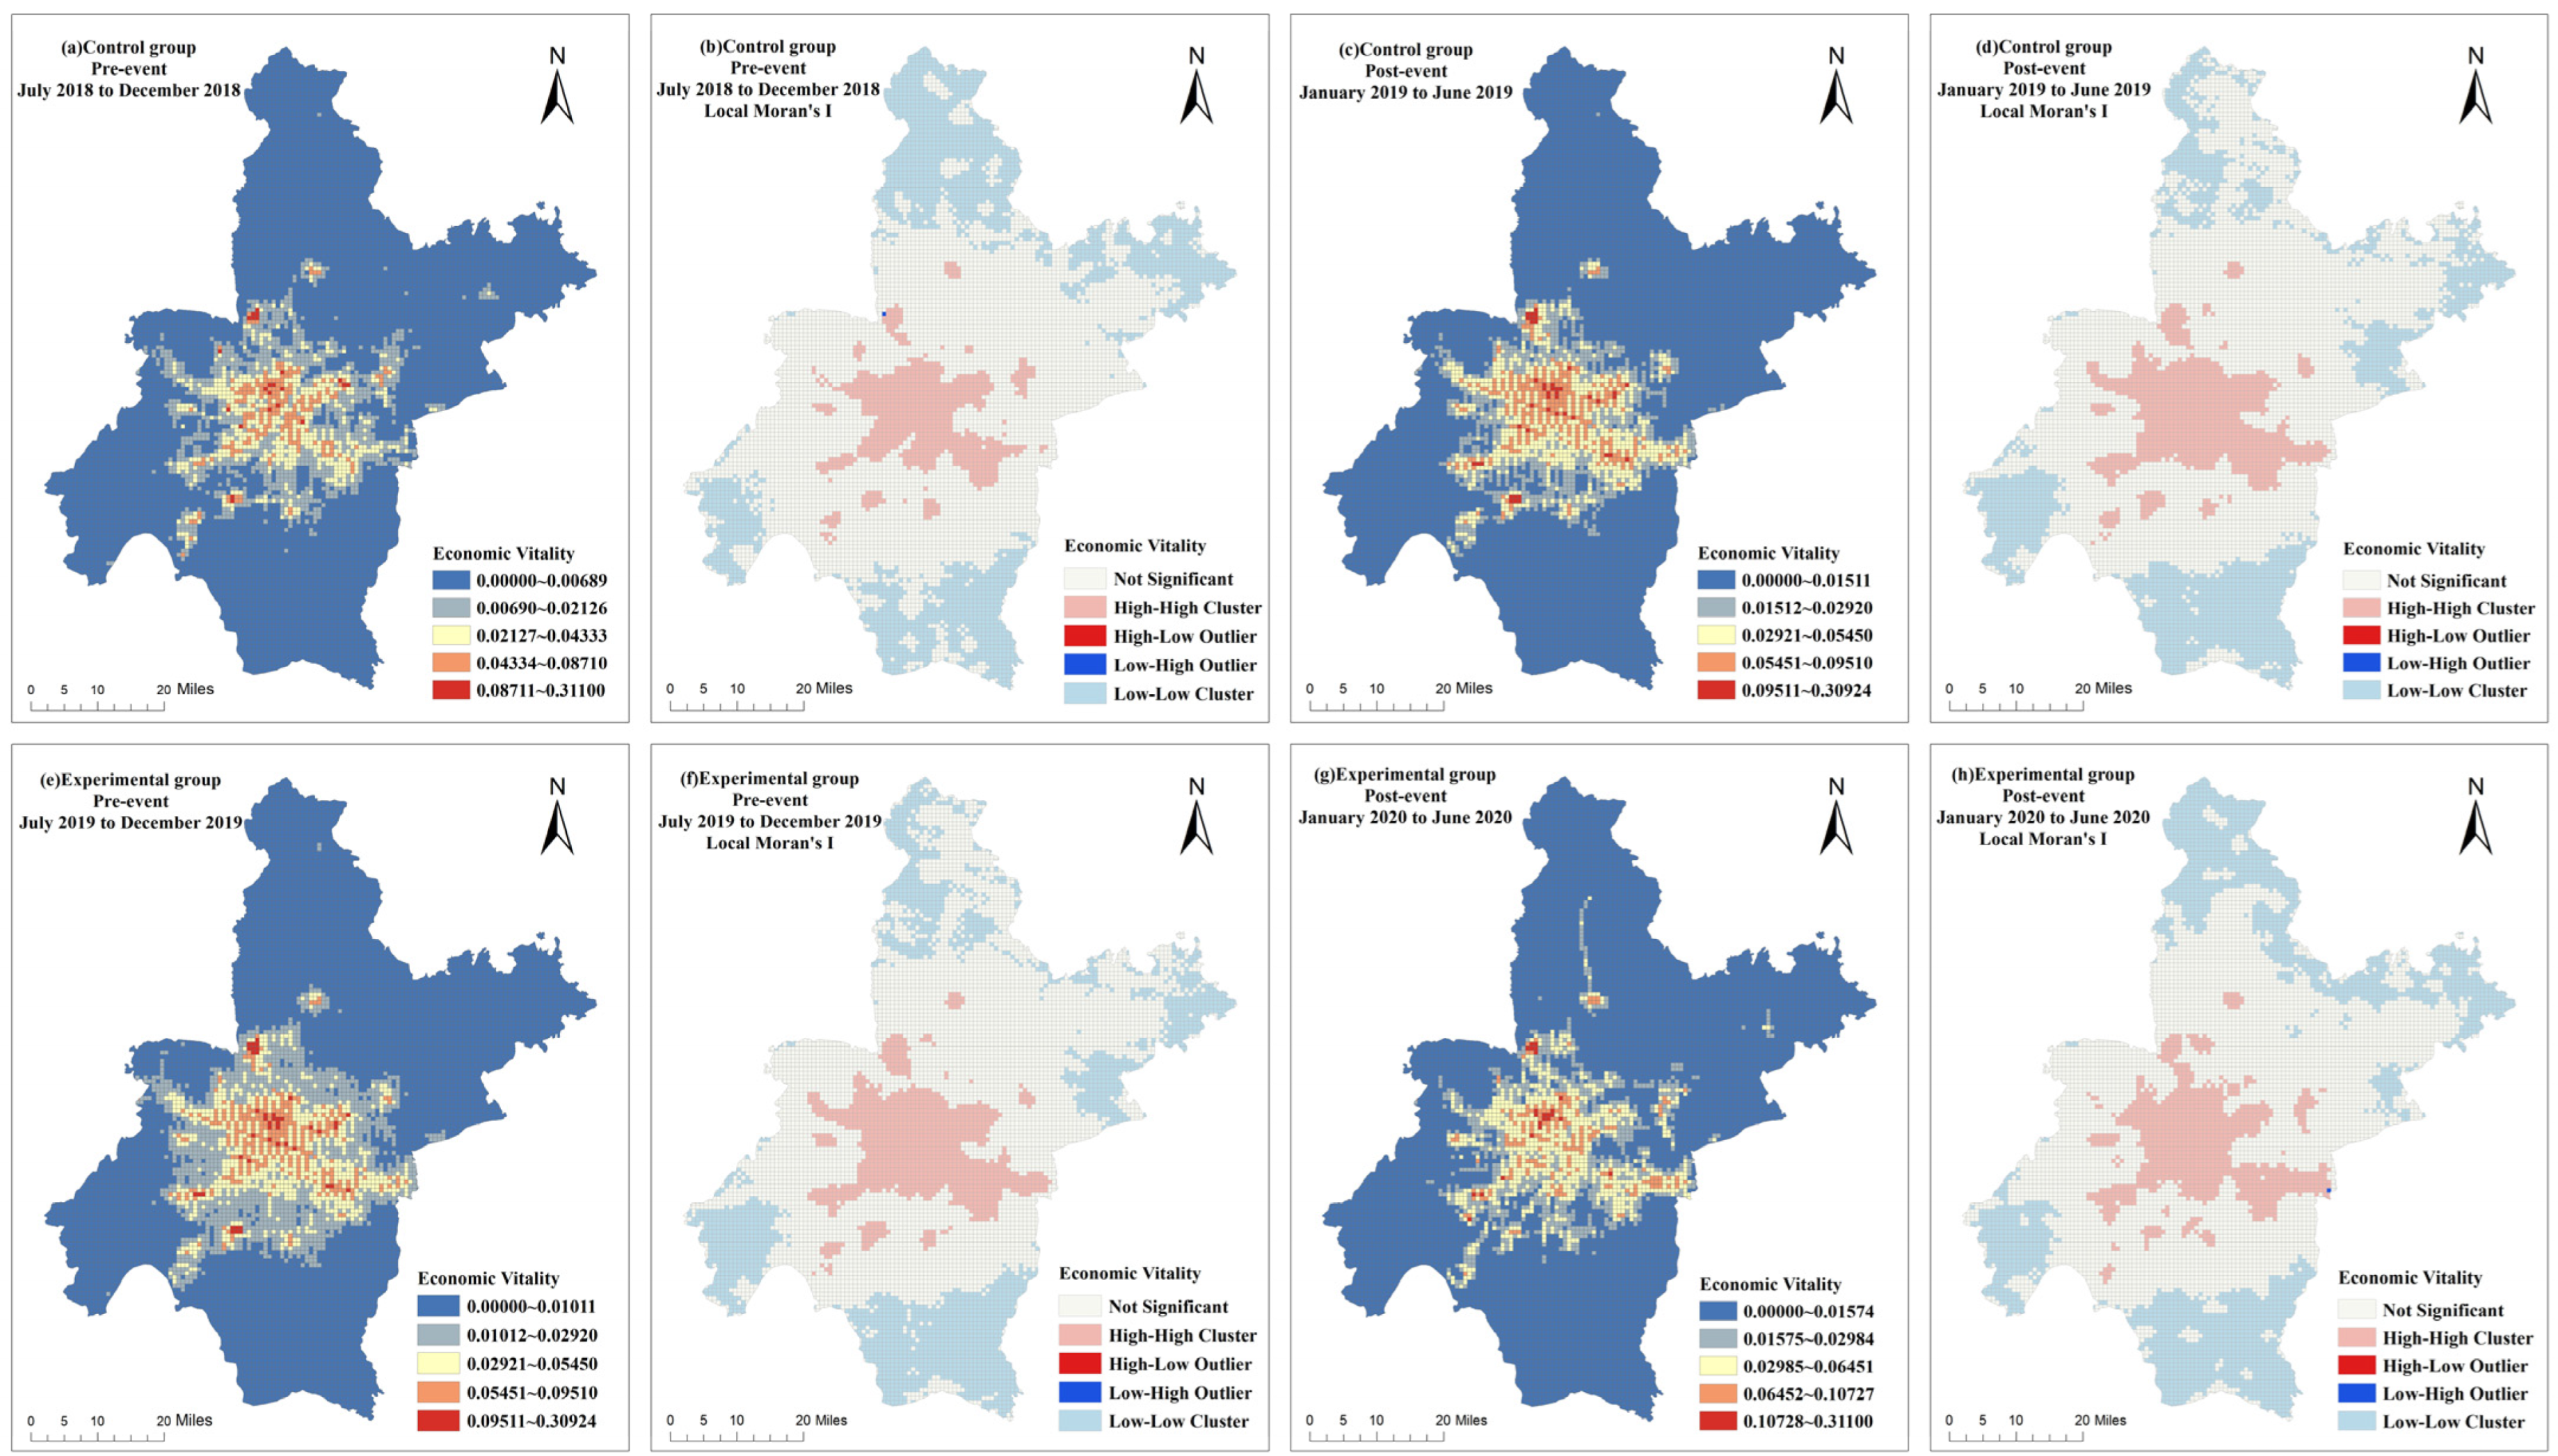
Figure 4.
Spatial distribution of social vitality.
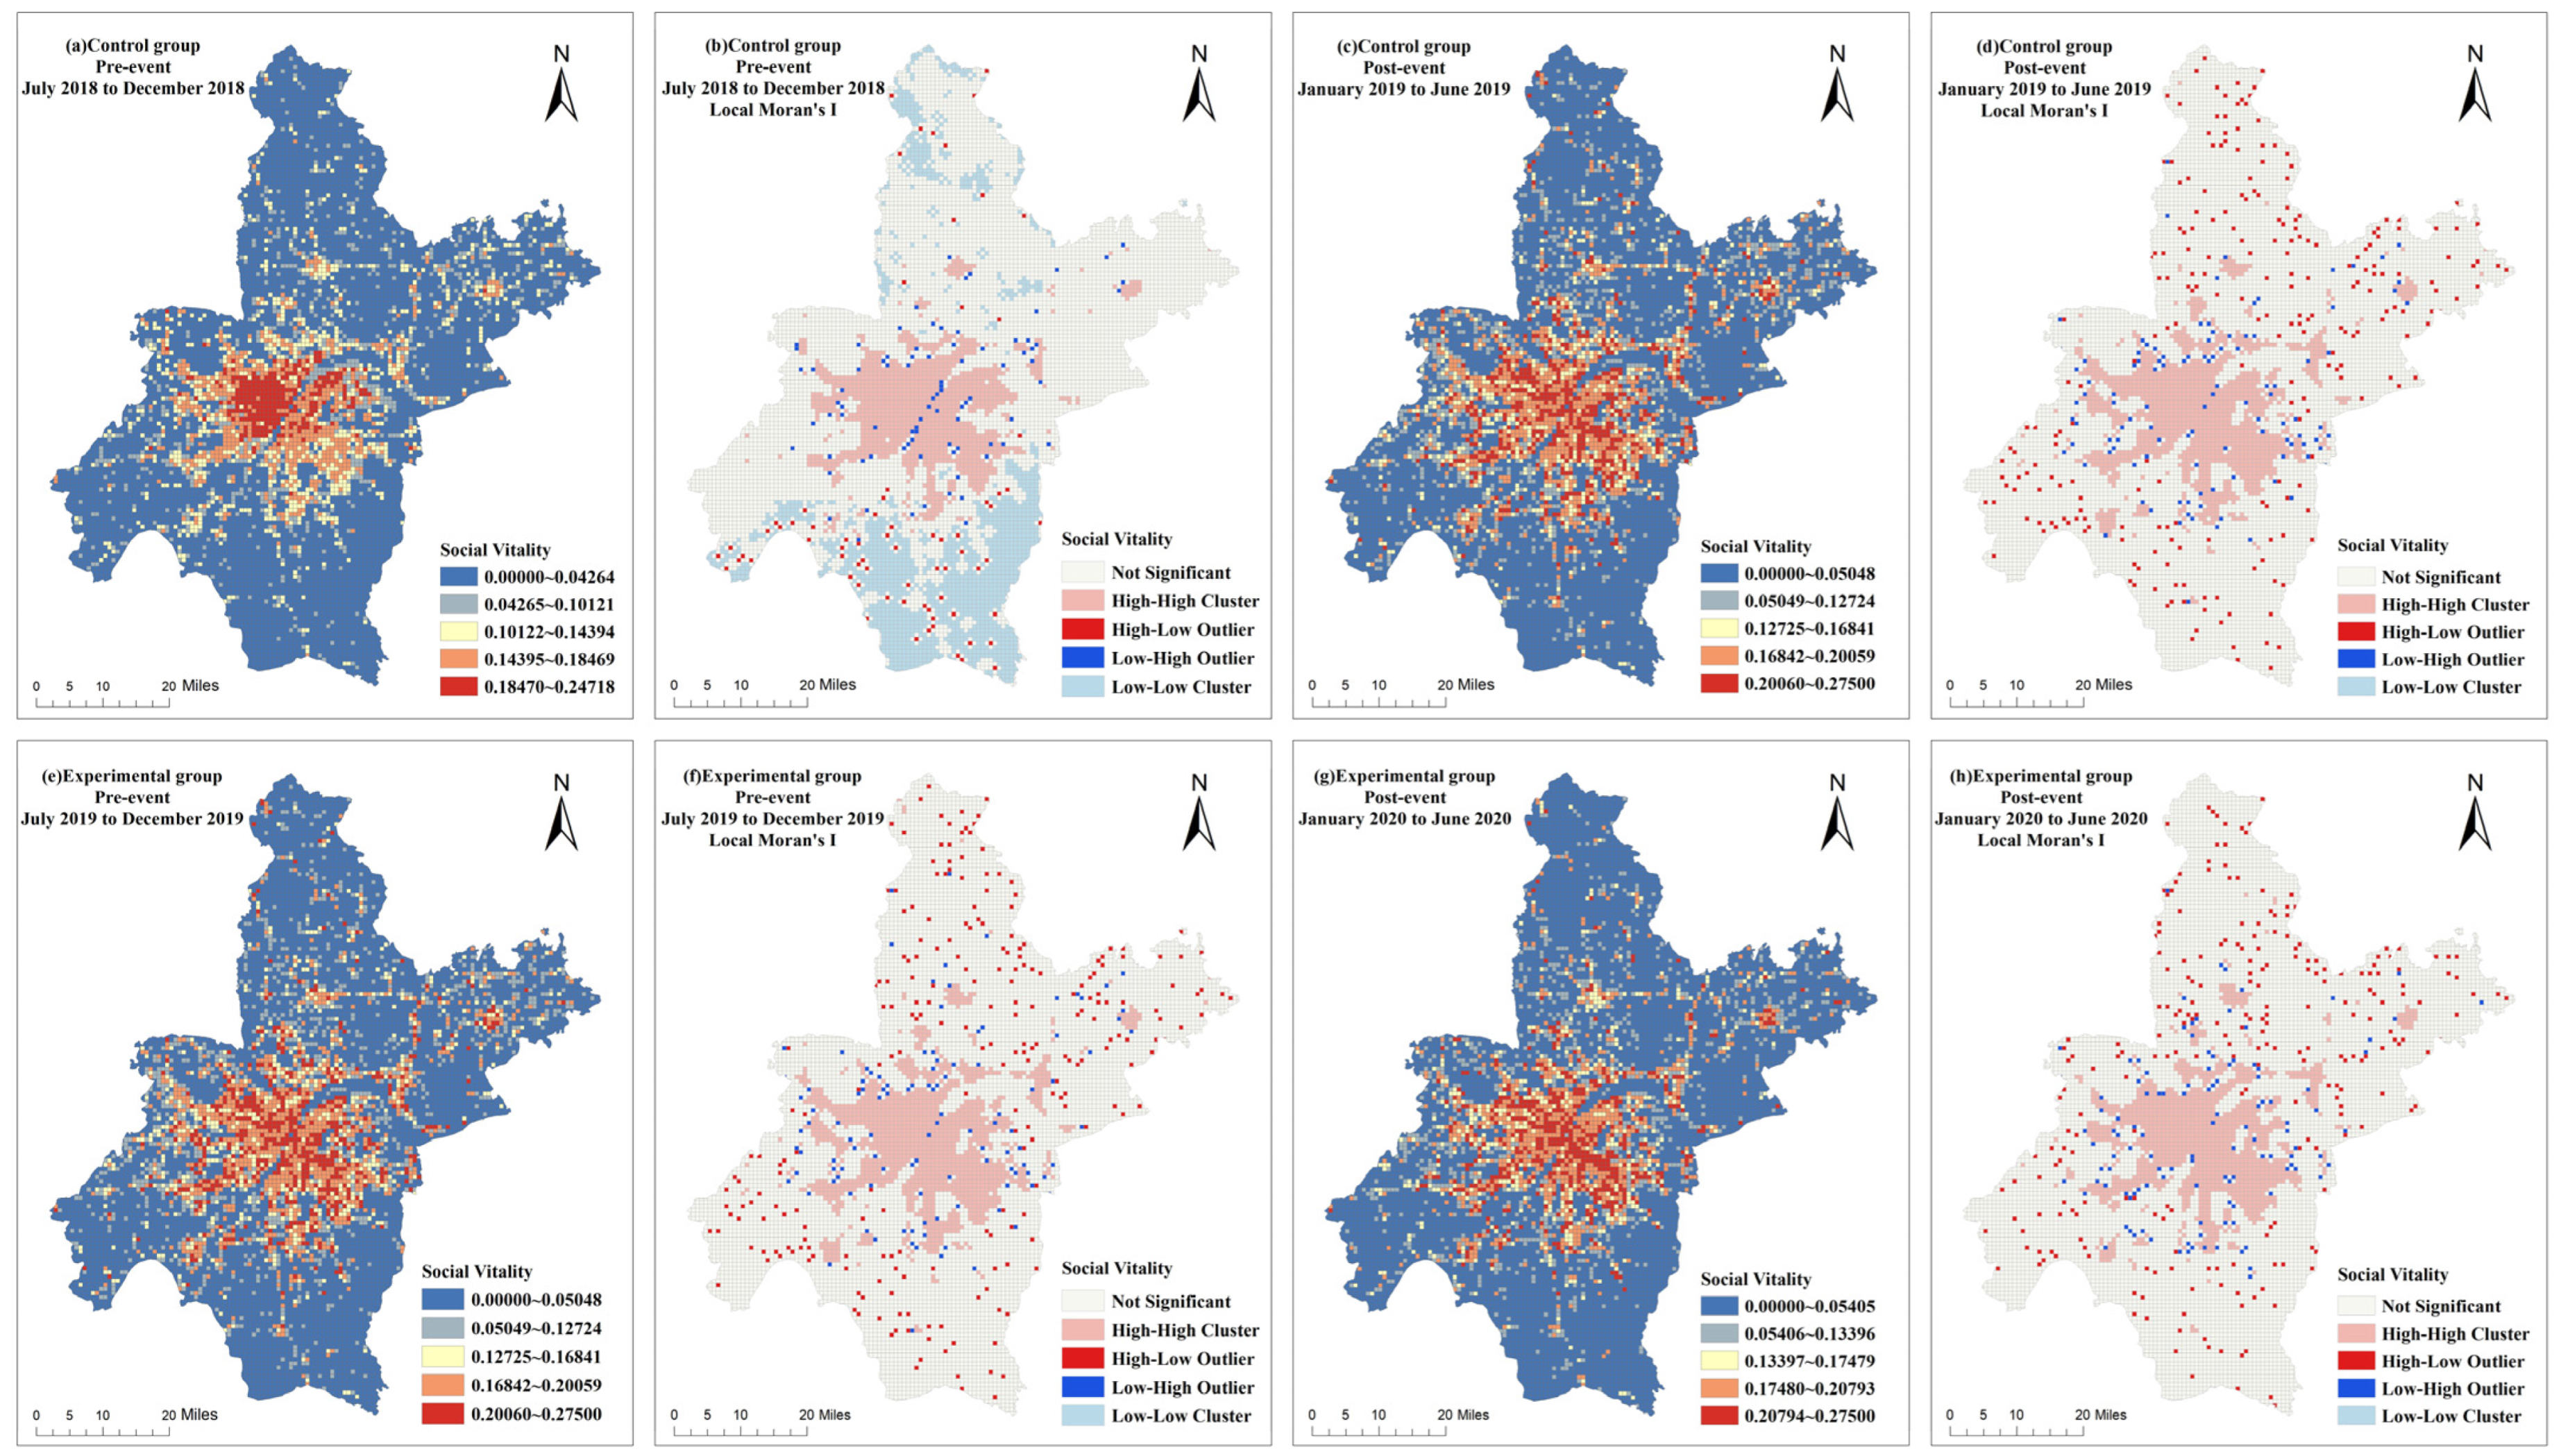
Figure 5.
Spatial distribution of spatial vitality.
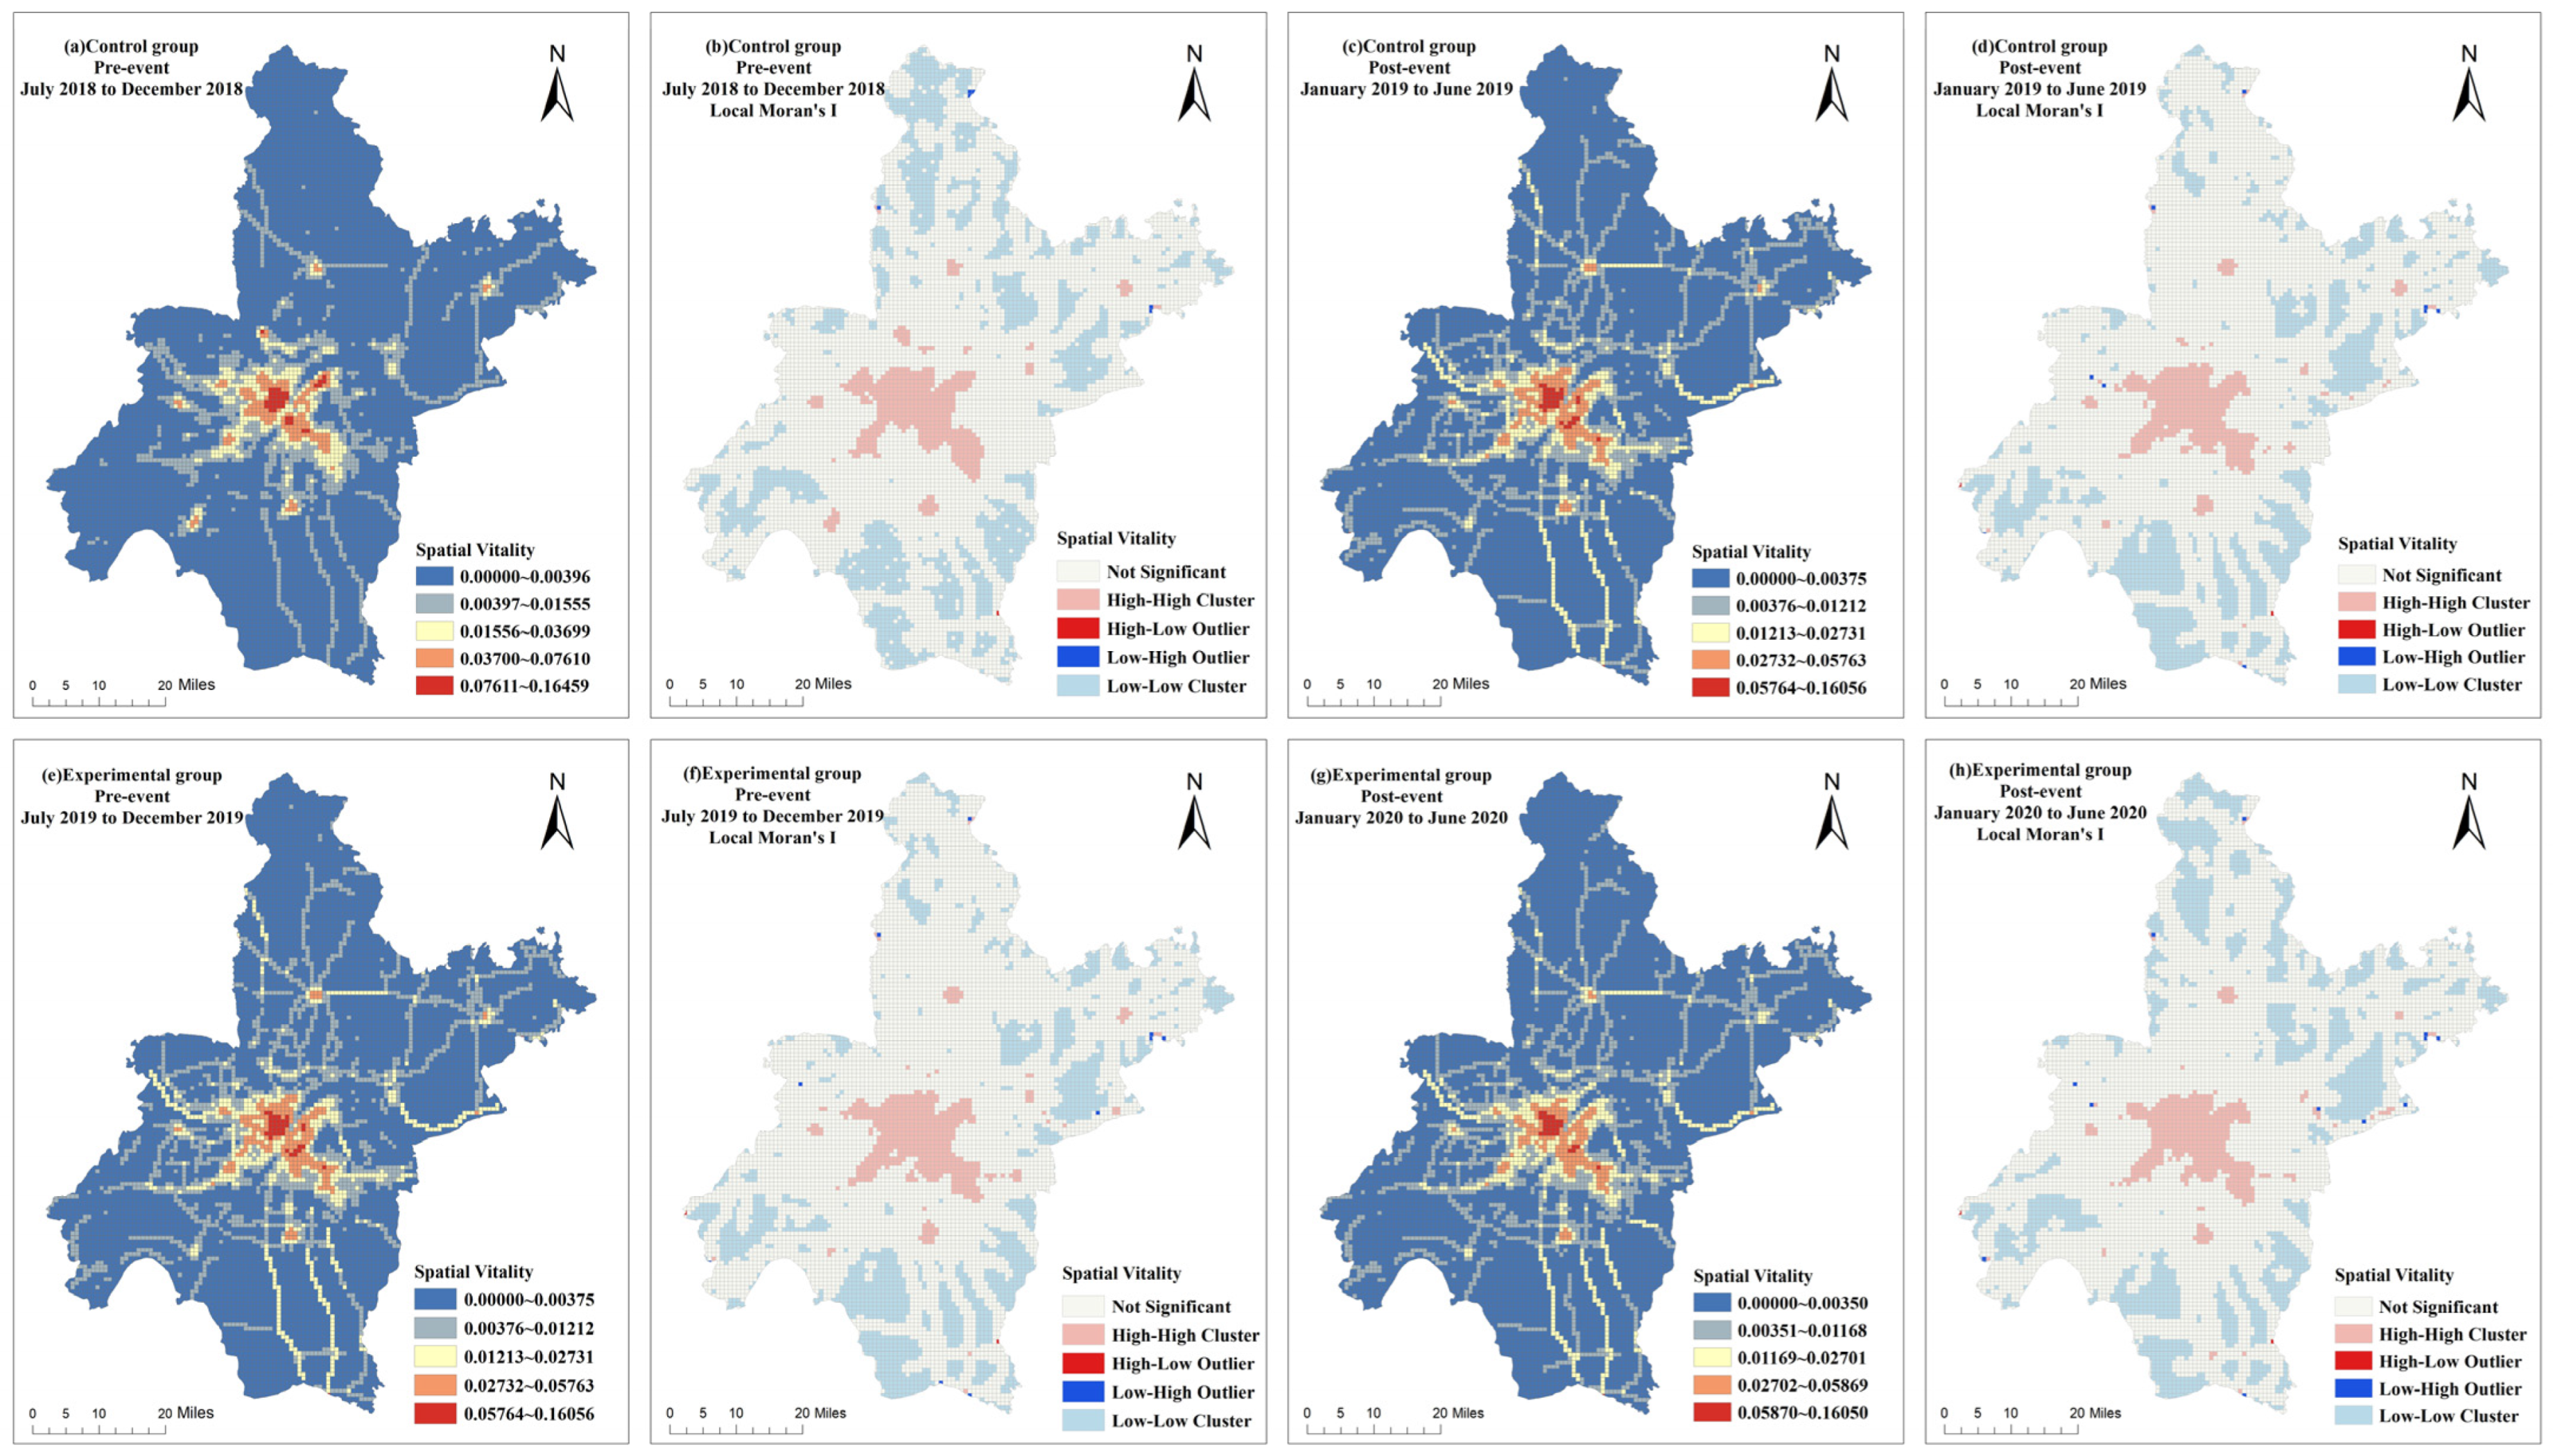
Figure 6.
Spatial distribution of ecological vitality.

Figure 7.
Spatial distribution of urban vitality.

Figure 8.
Urban vitality of each administrative district.

Figure 9.
Monthly vitality changes in different regions of Wuhan.

Figure 10.
Parallel trend assumptions for urban vitality.
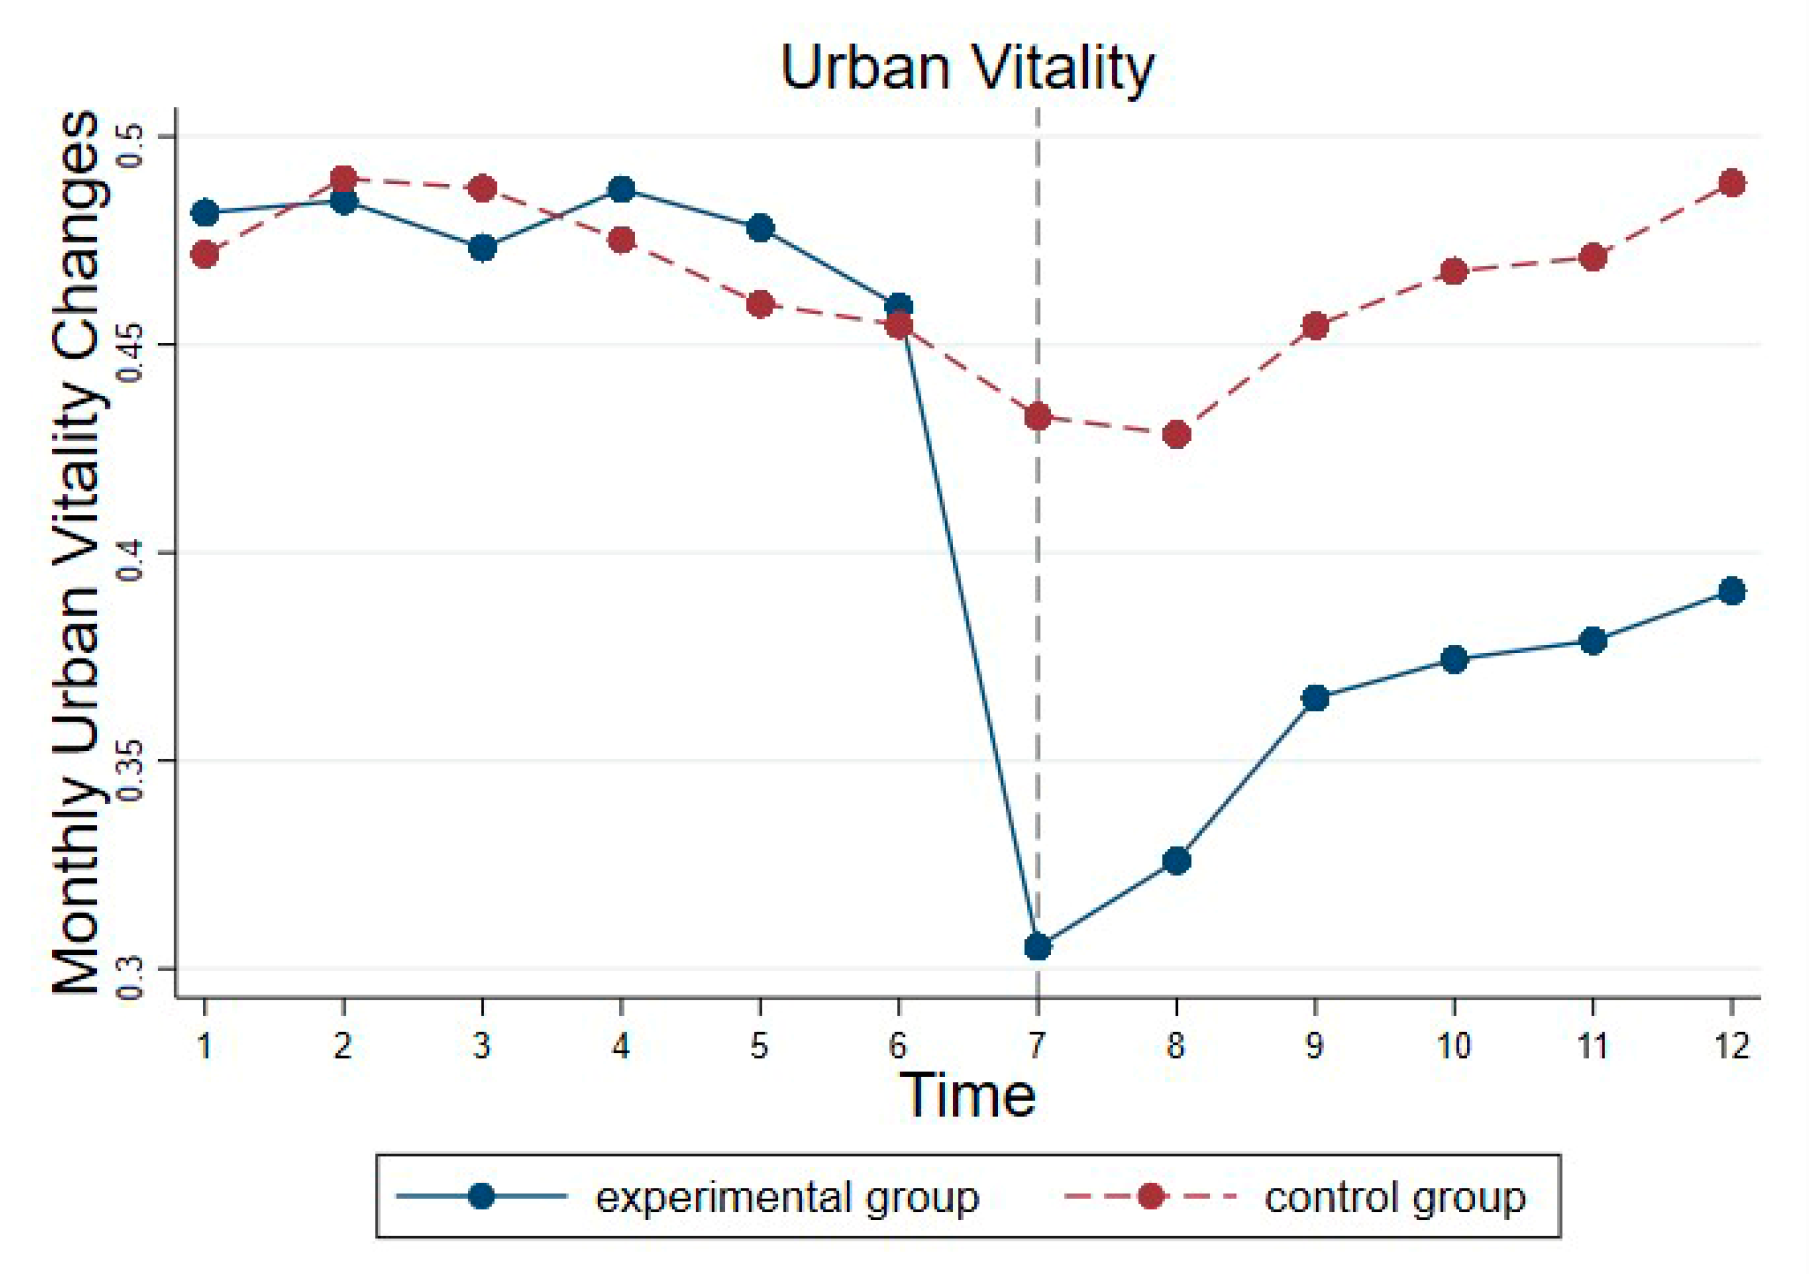
Figure 11.
Parallel trend assumptions for the four dimensions of vitality.

Table 1.
Classifications of the Point of Interest data.
| Category | Classification |
|---|---|
| Industry | Company buildings, industrial parks, etc. |
| Residential areas | Residential buildings, commercial residential buildings, etc. |
| Green spaces | Park squares, scenic spots, etc. |
| Municipal utilities | Scientific services, health services, sport services, etc. |
| Transportation | Transportation service facilities |
| Service land | Catering services, shopping services, financial services, etc. |
Table 2.
Land-use weights.
| Level | Land Use | Weight |
|---|---|---|
| 1 | Unutilized land | 1 |
| 2 | Woodland | 2 |
| Grassland | 2 | |
| 3 | Water | 3 |
| 4 | Plowland | 4 |
| 5 | Building land | 5 |
Table 3.
Confusion matrix test results.
| Class | Commission | Omission | Prod. Acc. | User. Acc. |
|---|---|---|---|---|
| Unutilized land | 0 | 3.56 | 96.44 | 100 |
| Woodland | 0.02 | 1.61 | 98.39 | 99.98 |
| Grassland | 6.51 | 5.61 | 94.39 | 93.49 |
| Water | 3.65 | 9.67 | 90.33 | 96.35 |
| Plowland | 10.76 | 1.65 | 89.24 | 98.35 |
| Building land | 2.12 | 0.12 | 99.88 | 97.88 |
| Overall Accuracy = (21976531/22969314) 95.6778% | ||||
| Kappa Coefficient = 0.9090 | ||||
Table 4.
Covariance test results.
| ANLI | GDP | SHDI | LUI | Transport | RD | NDVI | AQI | |
|---|---|---|---|---|---|---|---|---|
| ANLI | 2.246 | 2.645 | 1.425 | 2.425 | 1.349 | 2.683 | 2.452 | |
| GDP | 1.262 | 1.227 | 1.223 | 1.255 | 1.146 | 1.262 | 1.288 | |
| SHDI | 1.608 | 1.563 | 1.632 | 1.274 | 1.595 | 1.608 | 1.623 | |
| LUI | 1.383 | 2.397 | 2.557 | 2.421 | 2.511 | 2.328 | 1.383 | |
| Transport | 1.335 | 1.399 | 1.115 | 1.374 | 1.436 | 1.404 | 1.39 | |
| RD | 1.259 | 1.12 | 1.223 | 1.236 | 1.259 | 1.259 | 1.144 | |
| NDVI | 1.3 | 1.275 | 1.274 | 1.21 | 1.272 | 1.301 | 1.288 | |
| AQI | 1.118 | 1.193 | 1.111 | 1.155 | 1.155 | 1.192 | 1.181 |
Table 5.
Vitality evaluation indicators and weights.
| Criterion | Indicator | Formula | Direction | Weight |
|---|---|---|---|---|
| Economic | X11:ANLI | positive | 0.2247 | |
| X12:GDP | positive | 0.0863 | ||
| Social | X21:SHDI | positive | 0.0872 | |
| X22:LUI | positive | 0.1878 | ||
| Spatial | X31:Transport | positive | 0.2205 | |
| X32:RD | positive | 0.0982 | ||
| Ecological | X41:NDVI | positive | 0.0716 | |
| X42:AQI | negative | 0.0237 |
Table 6.
Data groups based on the DID model.
| Data | Pre-Event Period | Post-Event Period |
|---|---|---|
| Control group | July 2018–December 2018 | January 2019–June 2019 |
| Experimental group | July 2019–December 2019 | January 2020–June 2020 |
Table 7.
Control variables.
| Control Variable | Description | Influence |
|---|---|---|
| POP | Number of people per unit of land area | Impacts land use and urban planning |
| UR | Urbanization rate | Impacts the economy and destroys the environment |
| AGE | The ratio of the number of persons aged 60 | Causes a reduction in the labor force |
| INS | Share of service industries | Causes structural changes in the industry |
| PBR | Tax-based revenue | Reflects the government’s financial situation |
| SCG | Retail sales of consumer goods | Reflects the living standards of the population |
| INV | Amount of foreign investments | Impacts the market development potential |
| HOU | Average house price per square | Impacts the cost of living |
| HPD | Average distance from neighborhoods to hospitals | Reflects the abundance of medical resources |
| PD | Patch density | Reflects the density of buildings |
| LPI | Largest patch index | Reflects the living conditions |
| SHAPE_MN | Mean shape index | Reflects the complexity of buildings’ shapes |
| COHESION | Patch cohesion | Reflects spatial agglomeration or patch separation |
Table 8.
The results of the DID model analysis of urban vitality.
| Variable | Urban Vitality (No Control Variables) | Urban Vitality (With Control Variables) |
|---|---|---|
| DID | −0.105 ** | −0.0687 * |
| POP | 0.402 * | |
| UR | 0.237 | |
| AGE | −0.136 | |
| INS | 0.109 | |
| PBR | 5.58 × 10⁻⁷ * | |
| SCG | 0.000123 | |
| INV | −0.518 | |
| HOU | 3.21 × 10⁻⁶ | |
| HPD | −7.91 × 10⁻⁵ | |
| PD | 0.0749 | |
| LPI | 0.00678 | |
| AREA_MN | −0.000348 | |
| COHESION | −0.0408 | |
| R-squared | 0.360 | 0.464 |
Robust standard errors are shown in parentheses. ** p < 0.05, * p < 0.1.
Table 9.
The results of the DID model analysis for different dimensions of vitality.
| Variable | Economic | Social | Spatial | Ecological |
|---|---|---|---|---|
| DID | −0.0453 *** | −0.0397 *** | −0.0396 ** | 0.0197 *** |
| R-squared | 0.589 | 0.551 | 0.476 | 0.776 |
Robust standard errors are shown in parentheses. *** p < 0.01, ** p < 0.05.
Table 10.
The COVID-19 public health emergency’s influence on difference dimensions of vitality after adding the control variables.
Table 10.
The COVID-19 public health emergency’s influence on difference dimensions of vitality after adding the control variables.
| Variable | Economic | Social | Spatial | Ecological |
|---|---|---|---|---|
| DID | −0.0430 *** | −0.0484 *** | 0.00294 ** | 0.0198 *** |
| POP | 0.0109 | 0.0139 | 0.407 * | −0.00153 |
| UR | 0.104 ** | 0.0265 | 0.177 | 0.0171 |
| AGE | 0.0870 | −0.0785 * | −0.134 | −0.0109 |
| INS | 0.229 ** | 0.905 *** | 0.875 | −0.0898 * |
| PBR | 1.64 × 10⁻⁶ ** | 1.87 × 10⁻⁶ * | 5.75 × 10⁻⁷ | 2.12 × 10⁻⁷ * |
| SCG | 2.62 × 10⁻⁶ | 1.21 × 10⁻⁵ | 0.000120 | 1.25 × 10⁻⁵ |
| INV | 0.197 | 0.0457 | −0.776 | 0.0155 |
| HOU | 8.89 × 10⁻⁷ | 2.42 × 10⁻⁶ | −2.69 × 10⁻⁶ | −2.60 × 10⁻⁶ * |
| HPD | −3.63 × 10⁻⁵ | −4.90 × 10⁻⁵ | 1.20 × 10⁻⁵ | −5.80 × 10⁻⁶ |
| PD | −0.00451 | 0.0206 ** | 0.0763 * | −0.0147 |
| LPI | 0.00117 | −0.000936 | 0.00753 | 0.000517 |
| AREA_MN | −3.48 × 10⁻⁵ | 2.17 × 10⁻⁵ | 0.000327 | −7.68 × 10⁻⁶ |
| COHESION | −0.0275 * | −0.00767 | −0.00612 | 0.000472 |
| R-squared | 0.660 | 0.837 | 0.546 | 0.788 |
Robust standard errors are shown in parentheses. *** p < 0.01, ** p < 0.05, * p < 0.1.
Disclaimer/Publisher’s Note: The statements, opinions and data contained in all publications are solely those of the individual author(s) and contributor(s) and not of MDPI and/or the editor(s). MDPI and/or the editor(s) disclaim responsibility for any injury to people or property resulting from any ideas, methods, instructions or products referred to in the content. |
© 2024 by the authors. Licensee MDPI, Basel, Switzerland. This article is an open access article distributed under the terms and conditions of the Creative Commons Attribution (CC BY) license (https://creativecommons.org/licenses/by/4.0/).
Share and Cite
MDPI and ACS Style
Chen, Y.; Li, B.; Liu, S.; Cai, Z. Exploring the Impact of Public Health Emergencies on Urban Vitality Using a Difference-In-Difference Model. Remote Sens. 2024, 16, 1697. https://doi.org/10.3390/rs16101697
AMA Style
Chen Y, Li B, Liu S, Cai Z. Exploring the Impact of Public Health Emergencies on Urban Vitality Using a Difference-In-Difference Model. Remote Sensing. 2024; 16(10):1697. https://doi.org/10.3390/rs16101697
Chicago/Turabian StyleChen, Yuqiao, Bozhao Li, Songcao Liu, and Zhongliang Cai. 2024. "Exploring the Impact of Public Health Emergencies on Urban Vitality Using a Difference-In-Difference Model" Remote Sensing 16, no. 10: 1697. https://doi.org/10.3390/rs16101697
Note that from the first issue of 2016, this journal uses article numbers instead of page numbers. See further details here.