Article

The Dolan Fire of Central Coastal California: Burn Severity Estimates from Remote Sensing and Associations with Environmental Factors

by
Iyare Oseghae
1,*,
Kiran Bhaganagar
2 and
Alberto M. Mestas-Nuñez
1
1
Department of Earth and Planetary Sciences, University of Texas at San Antonio, San Antonio, TX 78249, USA
2
Department of Mechanical Engineering, University of Texas at San Antonio, San Antonio, TX 78249, USA
*
Author to whom correspondence should be addressed.
Remote Sens. 2024, 16(10), 1693; https://doi.org/10.3390/rs16101693
Submission received: 28 February 2024 / Revised: 14 April 2024 / Accepted: 1 May 2024 / Published: 10 May 2024
(This article belongs to the Topic Application of Remote Sensing in Forest Fire)

Abstract

:
In 2020, wildfires scarred over 4,000,000 hectares in the western United States, devastating urban populations and ecosystems alike. The significant impact that wildfires have on plants, animals, and human environments makes wildfire adaptation, management, and mitigation strategies a critical task. This study uses satellite imagery from Landsat to calculate burn severity and map the fire progression for the Dolan Fire of central Coastal California which occurred in August 2020. Several environmental factors, such as temperature, humidity, fuel type, topography, surface conditions, and wind velocity, are known to affect wildfire spread and burn severity. The aim of this study is the investigation of the relationship between these environmental factors, estimates of burn severity, and fire spread patterns. Burn severity is calculated and classified using the Difference in Normalized Burn Ratio (dNBR) before being displayed as a time series of maps. The Dolan Fire had a moderate severity burn with an average dNBR of 0.292. The ignition site location, when paired with the patterns of fire spread, is consistent with wind speed and direction data, suggesting fire movement to the southeast of the fire ignition site. Patterns of increased burn severity are compared with both topography (slope and aspect) and fuel type. Locations that were found to be more susceptible to high burn severity featured Long Needle Timber Litter and Mature Timber fuels, intermediate slope angles between 15 and 35°, and north- and east-facing slopes. This study has implications for the future predictive modeling of wildfires that may serve to develop wildfire mitigation strategies, manage climate change impacts, and protect human lives.

1. Introduction

Wildfires can produce damaging effects on human health, ecosystems not adapted to fire, and infrastructure. In the western United States, the last decades have seen a dramatic increase in wildfire numbers. Since 1983, the area burned per year due to wildfire in the United States has surpassed 40,000 km2 three times in 2015, 2017, and 2020, all within a five-year time span [1]. In California, a record for wildfire occurrences was reached in 2020, with 10,000 incidents burning over 17,400 km2 of the landscape. The extraordinary increase in wildfires in California is widely considered to be attributed to rising temperatures and declining precipitation due to climate change [2,3]. Observations indicate that the impacts of wildfires are felt on short-term regional scales as well as on long-term global scales [4,5]. The significant impact that wildfires have on society and the environment underscores the importance of their scientific study. An improved understanding of wildfire spread rates, spread patterns, and burn severity is imperative for informing landscape management and for developing planning practices designed to reduce wildfire risk and mitigate the effects of active fires. The causes of wildfire ignition are multiple, ranging from natural phenomena like a lightning strike in a dense forest to human-caused fires due to human negligence. Population growth and the desire of people to live near wildland areas have increased the number of humans and infrastructure in the wildland–urban interface. With a warm and drying climate in addition to an increased likelihood of anthropogenically ignited fires, which are the leading cause of wildfire ignition, California has experienced an increased prevalence of wildfire events (e.g., [6]). In general, however, several environmental factors often contribute to how a particular fire spreads and intensifies. These factors include vegetation type, temperature, wind velocity, and surface topography.
Vegetation acts as fuel for fire, and thus, a region’s vegetation type can significantly impact a wildfire’s severity. These fuels possess several characteristics that contribute to the flammability and spread rate of wildfire, such as moisture content, bed depth (fuel height), and live/dead fuel load (kg km−2) [7]. A temperature increase with a lack of precipitation leads to vegetation moisture loss. This loss of moisture causes vegetation to become progressively flammable. Such processes are familiar to the Mediterranean climate type, where there is a strongly seasonal climate with cool, wet winters that promote fuel growth and hot, dry summers that increase fuel flammability. Mediterranean climate characteristics, in conjunction with human-caused changes to climate and landscape, have led to alterations in wildfire characteristics [8]. A recent study of the Sierra Nevada daily meteorological conditions during the years from 2001 to 2020 showed that a 1 °C increase in temperature yielded a 19 to 22% increase in wildfire risk and a 20 to 25% increase in area burned [9]. Temperature anomalies and summer droughts are essential in explaining wildfire occurrences in Mediterranean climates [10]. A study in the northern California Mediterranean climate found that during low-precipitation years, areas that burned had low fuel moisture and high climatic water deficits, and the percentage of high-severity areas doubled, especially during the 2012–2016 drought [11]. The rate of spread and direction of fire are critical factors controlled by wind. Wind can affect the behavior of a wildfire by bringing in a constant supply of oxygen, moving moist air away from fire fuels, and transporting burning hot embers that have risen into the air outside of the containment perimeter, igniting new fires. Wind speed and direction can vary and be unpredictable, making the task of wildfire suppression more difficult than it already is. Fires travel in the direction of the ambient wind, so the stronger the winds, the faster the spread. Crown fire initiation is dependent on canopy base height and canopy bulk density [12], and tree canopy fires are linked to higher severity burns. High-resolution numerical studies have demonstrated the capability to obtain the local micro-scale wind conditions and predict the wildland fire plume (thermal plume and smoke plume) accurately [13]. Additionally, studies of wind modeling for fire behavior have displayed the capacity to use computational fluid dynamics models to accurately simulate wind [14,15].
Fires usually travel uphill much faster than downhill because warm air rises, thus preheating fuels at higher elevations, making them more likely to ignite and contribute to the spread. Once the fire has reached the top of a hill, it struggles to come back down because it is not able to preheat the downhill fuel [16]. Wind patterns are influenced by the topography of the terrain during a fire. Patterns of upslope and upvalley winds can accelerate fire spread and drive burn severity patterns. The funneling of wind flow into canyons and other natural chimneys can cause a noticeable increase in the spread rate and severity of fires [17]. In addition to wind speed and direction, topography directly affects the behavior of a wildfire by controlling radiant energy transfer from the fire line to the direction of steeper slopes [18]. Additionally, topography can create microclimates that lead to larger fire regimes influenced by alterations in air temperatures, fuel moisture content, and plant distribution. Topography and land cover are typically linked; for example, some vegetation types tend to be more abundant in areas of specific elevation and/or soil moisture [19].
Field evaluations of fire damage can be time-consuming and expensive to obtain, and therefore, alternative indirect fire severity estimations have been developed based on remote sensing imagery. Normalized Burn Ratio (NBR) is a commonly used fire severity index for locations where multispectral imagery from Landsat or other earth observation satellites is available [20,21]. NBR estimates photosynthetic activity indirectly through the characteristic reflectance difference between the near-infrared and short-wave infrared bands. The burning and scaring effects of wildfire on vegetation reduce this photosynthetic activity estimate of unburnt plants. Thus, fire severity is estimated by calculating the difference between NBR pre- and post-fire (dNBR) [20].
Previous studies that used vegetation and land cover data to study wildfire burn severity were limited by both a lack of consistency in developing vegetation class thresholds and empirical relationships with ecological metrics [22]. As a result, some studies attempted to compare burn severity calculation methods using an inadequate number of vegetation classes [23]. Furthermore, other studies have been successful in using machine learning methods for burn severity classification (e.g., [20] in Spain; [
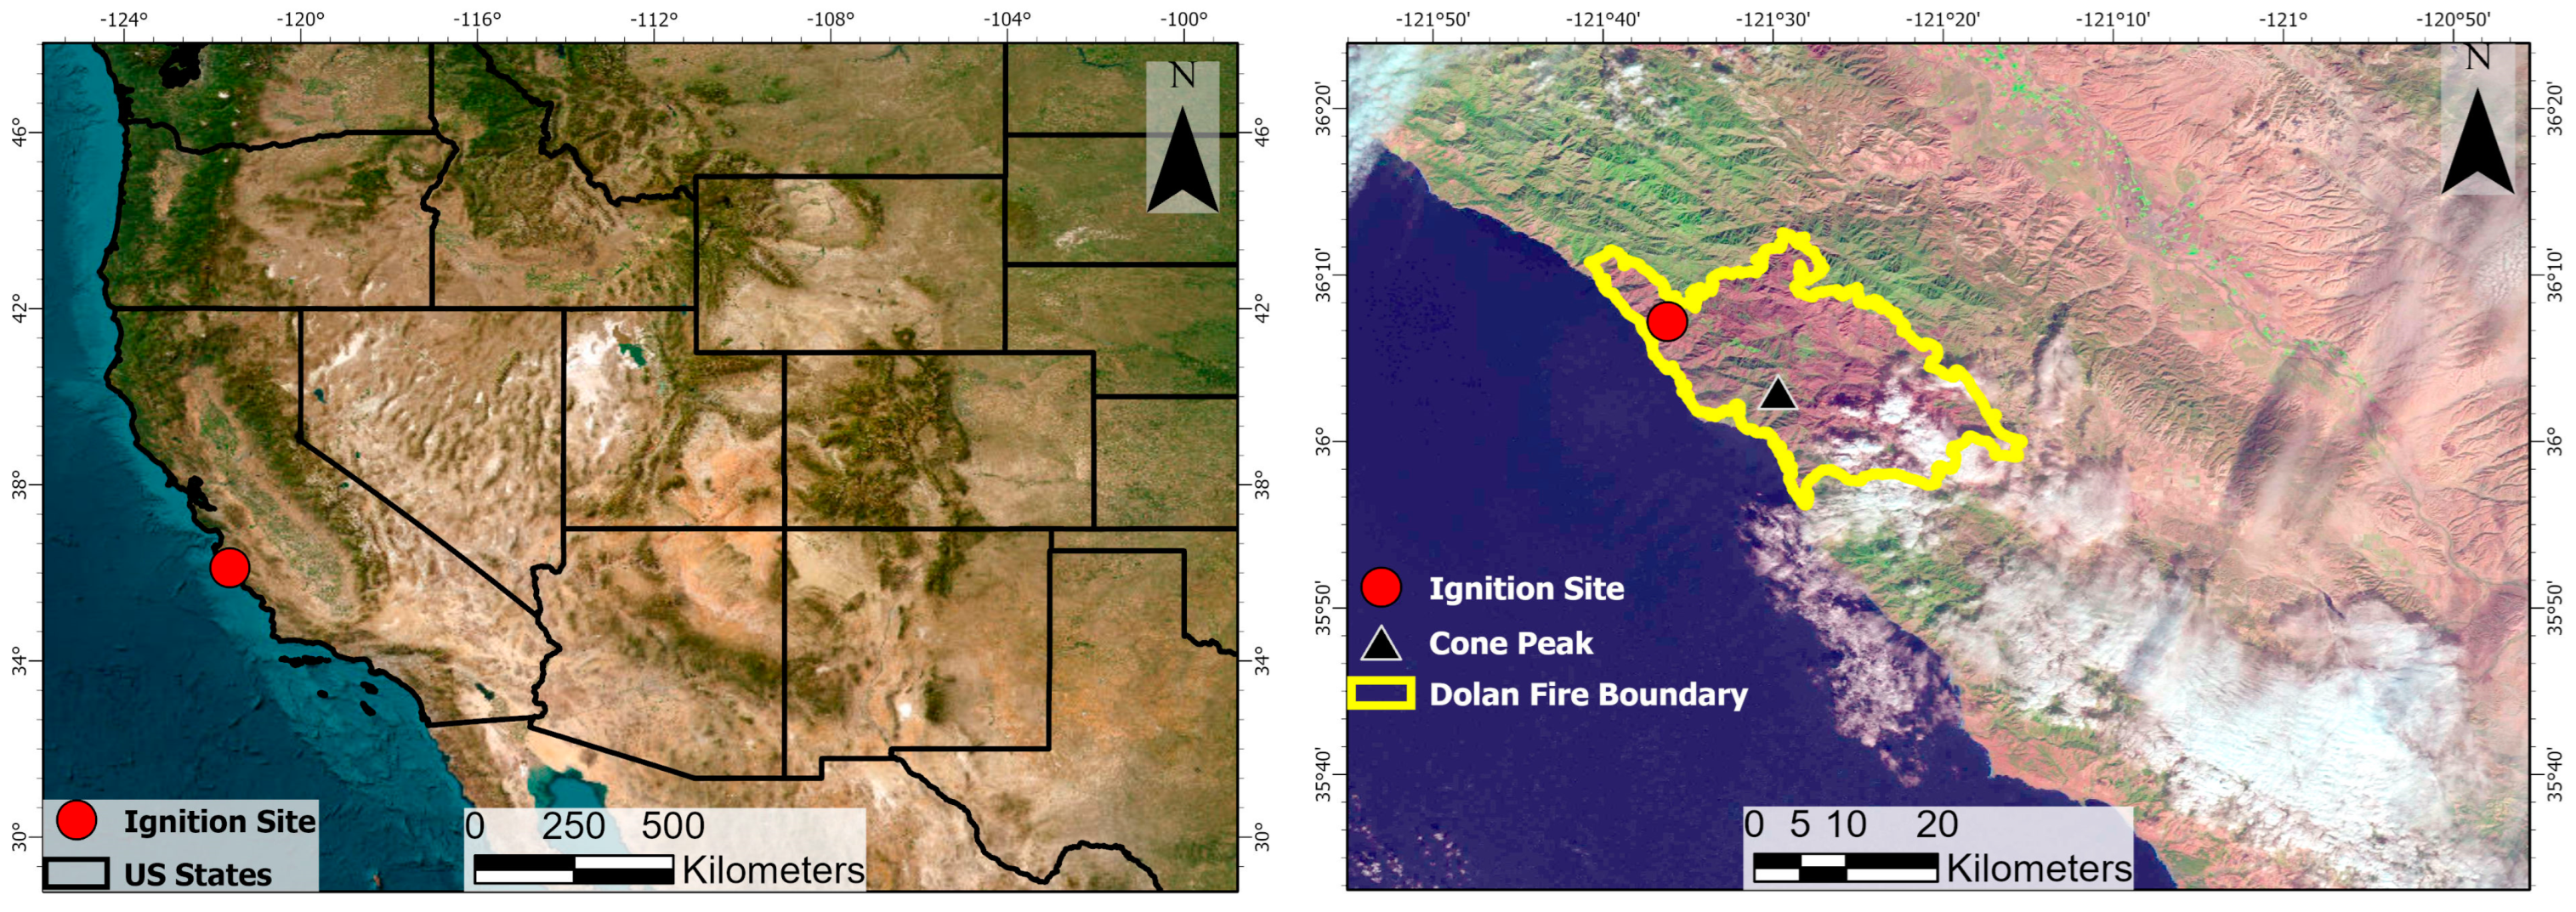
24] in Alaska). Many studies in the literature look at the before-and-after conditions to evaluate the impact of the fires. What seems to be less common, however, are investigations of the environmental factors that affect wildfire propagation and the temporal evolution of patterns of burn severity. In this study, we use remote sensing estimates of burn severity from Landsat to study the propagation and associations with environmental factors of the Dolan Fire, focusing on fire fuels and surface topography. The Dolan Fire occurred in the Santa Lucia Wilderness area of the Los Padres National Forest, California, from August to December 2020. The burn severity estimates from remote sensing are combined with the results of fuel models and with surface topography data to address the following research questions: (a) What was the temporal evolution of burn severity patterns during the fire? (b) Which fuel types in the region are more prone to low-, moderate-, and/or high-severity burns? (c) How does topography (slope and aspect) interact with wind and fuels to influence burn severity in this region?

2. Materials and Methods

In this section, we describe the location of the study, the burn severity index, the datasets used, and the fuel models. Details on the methodologies used in the data analysis are also included. An overview of the datasets used with a brief description and their respective resolutions is given in Table 1.

2.1. Location and Climate of the Study Area

The Dolan Fire started in the Big Sur region of the rugged Santa Lucia Mountain range of coastal Central California near 36.12°N, 121.60°W (Figure 1) on 18 August 2020. Precipitation data were acquired daily at the Big Sur, CA, weather station through the duration of the fire [32]. The region received an insignificant amount of precipitation during that summer (less than 2 cm of precipitation from June to October), but natural causes were not to blame for igniting the fire. Indeed, the fire began as an act of arson, and after burning for 135 consecutive days, scarring about 505 km2, burning 14 buildings, and producing 15 non-fatal injuries, it was 100% contained on 31 December 2020 [33].
The climate in the Santa Lucia Mountain range region is classified as subtropical or Mediterranean. This climate consists of warm, dry summers and cool, wet winters, with localized summer fog near the coast. Average high temperatures are 21 °C in summer and 14 °C in winter. Annual rainfall is highly variable and ranges from 40 to 152 cm throughout the range; however, the precipitation falls during the winter on the higher mountains in the north [34]. Average annual wind speeds in this region are 6.44 m/s [35]. The fuel types include Grass, chaparral brush and shrubs, and Timber Litter [7,33,36]. Additionally, the Santa Lucia Mountains are home to Cone Peak. Cone Peak has an elevation of 1572 m and is just 5 km from the coastline, making Cone Peak the highest peak in proximity to the ocean in the contiguous United States. Cone Peak is pictured in Figure 1.

2.2. Burn Severity

Fire officials and land resource managers use burn severity maps created using remotely sensed data to map wildfire perimeters, predict locations of potential wildfire hazards, and study areas of vegetation regrowth post-wildfire. Landsat imagery has traditionally been used to create indices that indicate burn severity because of its repeated coverage, temporal resolution, accessibility, and spectral wavelengths featured [4]. In this study, we use multispectral imagery to calculate and map during-fire and post-fire burn severity using a burn severity index. The associations between the estimated burn severity index and temperature, wind velocity, topography, and fire fuel data are analyzed to help understand the effects of environmental risk factors on burn severity.
For this study, burn severity is classified into four classes: unburnt/unchanged, low severity, moderate severity, and high severity [14] (Figure 2). Low-severity wildfire burns typically occur where the height of the flames is low, typically only scarring the surface, which leads to a very minimal effect on the tree canopy. Moderate-severity burns display scarring of the tree trunks with minimal effects on the tree canopy. Conversely, high-severity fires occur where there is significant burning of the tree canopy [15]. The method of classification used in this study is like that of Eidenshink et al. [37] for the Cerro Grande Fire of New Mexico, who used a threshold classification by analyst evaluation of the Difference in Normalized Burn Ratio (dNBR).

2.3. Fire Severity Indices

Normalized Burn Ratio (NBR) is one of the most widely used burn severity indices (Equation (1)). It uses the near-infrared (NIR) and shortwave-infrared (SWIR) portions of the electromagnetic spectrum to distinguish between unburnt and burnt vegetation [39] (Table 2).
NBR = (NIR − SWIR)/(NIR + SWIR)
dNBR = PreNBR − PostNBR
The burn severity is separated into four classes using analytically established values based on Landsat recommendations (USGS) and the Jenks natural breaks method: unburnt/unchanged, low burn severity, moderate burn severity, and high burn severity according to the pixel value of dNBR. The four value ranges for each class are <0.1, 0.1–0.27, 0.27–0.50, and >0.50, respectively [40]. Landsat 8 near-infrared (band 5) and shortwave infrared (band 7) bands are acquired pre-fire and at various post-fire dates. MTBS provides fire boundary polygons used to mask the study area to prevent pixels outside the fire boundary. NBR has been used heavily due to the SWIR band’s sensitivity in detecting changes within fire burn and its effect on vegetation [24,41]. PreNBR is the NBR of the pre-fire imagery, and PostNBR is the NBR of the post-fire imagery; the difference between them is calculated, resulting in dNBR (Equation (2)) [42]. Hereafter, dNBR and burn severity are used interchangeably, having the same meaning.

2.4. Satellite Imagery

Landsat 8 data collect data in several bands from the visible (~0.4 μm) to the longwave infrared (~12 μm) of the light spectrum [43]. Vegetation and burned areas can be accurately differentiated using near-infrared (NIR) and short-wave (SWIR) bands [44]. Landsat-8 Level 1 satellite imagery is used and is publicly available on the USGS EarthExplorer portal. The Landsat-8 NIR band 5 (0.845 to 0.885 µm) and SWIR band 7 (2.10 to 2.30 µm) of 30 m resolution are used in this study (Table 2). The pre-fire image collected on 2 August 2020 and the post-fire images collected on 18 August, 3 September, 19 September, and 5 October are used as input data. We note that the statistical analysis presented in this paper is based on the post-fire image of 5 October.
Figure 1 displays smoke clouds generated by the Dolan wildfire migrating to the southeast in the direction of wind propagation. The smoke clouds are distinct from the cirrus clouds on the eastern portion of the figure panel; the cirrus clouds are much less dense and reside higher in the atmosphere compared to the smoke clouds. Being in close proximity to the coast, there was an abundance of water vapor in the atmosphere. Furthermore, the smoke from the forest fire acts as cloud condensation nuclei onto which water vapor condenses, forming the thick, bright-colored clouds in the image [45].
To model the spread of the Dolan Fire, images collected on an average temporal resolution of ~16 days are used throughout the life of the fire. The temporal resolution of the model is based on the availability and quality of Landsat-8 imagery; the imagery must have spatial coverage to include the study area while having <10% cloud cover. The resulting image collection includes eight timestamps for the Dolan Fire.

2.5. Fuel Models

The Anderson 13 Fire Behavior Fuel Models are acquired from LANDFIRE for the year 2019; these fuel models provide field data in the form of raster maps of the fuels and data tables detailing their wildfire-specific metrics [29]. Monitoring Trends in Burn Severity (MTBS) is used to acquire an accurate burn boundary polygon for the Dolan Fire [30].
Fire fuel data are acquired from the Anderson 13 Fire Behavior Fuel Models (FBFM13) [7]. The Anderson fuel models include the original 13 standard fuel models used in the 2020 LANDFIRE remap [36] of the contiguous United States at 30 m resolution. The fuel models represent the distributions of fuel loading found among surface fuel components (live and dead), size classes, and fuel types. The fuel models are described by the most common fire-carrying fuel type in each pixel. Each fuel type has corresponding fuel metrics, which account for dead fuel load, flame height, rate of spread, fuel bed depth, and moisture of extinction (Table 3). The models of Table 3 were made based on the following testing conditions: wind speeds of 2.24 m per second, dead fuel moisture content of 8%, and live fuel moisture content of 100%. Of the 13 fuel types [7,36], 10 are present within the Dolan Fire study area, and of those 10, 5 fuel types meet the criteria for pixel abundance, which is set at >40,000 pixels within the region of interest (Table 4). The top five most abundant and relevant fuel types in the study area account for 93.81% of the pixels (Figure 3). The Anderson FBFM13 provides descriptions of the fire characteristics given by each fuel type during testing. For example, Long Needle Timber Litter (FBFM9) and Mature Timber (FBFM10) were more prone to high-severity burns than other fuels. These fuels are highlighted for their fast-moving surface fires and high flame heights which often lead to canopy fires, which are linked to high-severity burns [15].

2.6. Weather Data

Cli-MATE tools by the Midwestern Regional Climate Center of Purdue University provided historical wind speed and direction, temperature, and precipitation data [44]. Wind data were acquired from the Monterrey Peninsula Airport weather station (36.58°N, 121.85°W). Wind data were collected from 18 August 2020 to 5 October 2020 for both the wind rose plots and wind speed rasters used in analysis. The wind speed raster was sourced from GridMET at daily 4 km resolution [31]. Wind rose plots were used to visualize wind data hourly by displaying the average speed and direction the wind was coming from as a function of frequency percentage during the chosen time period. Air temperature and precipitation data were collected for one week leading up to the fire on 11 August 2020 to representative end of fire spread date on 5 October 2020. They came from the Big Sur weather station located 15 km northwest of the study area in Big Sur, CA (36.27°N, 121.81°W). Note that the exact end of fire spread date is not known due to relatively low temporal resolution between the pre-fire and post-fire images. The air temperature time series at Big Sur for daily high, low, and mean temperatures during this period are shown in Figure 4; precipitation is not displayed because it did not occur during this time.
Drought data were acquired from the National Integrated Drought Information System (NIDIS). NIDIS uses the Evaporative Demand Drought Index (EDDI) to offer early warning of agricultural drought, hydrologic drought, and fire-weather risk in the United States. EDDI examines how anomalous the atmospheric evaporative demand is for a location and across a period of interest, the data were generated weekly throughout the year. The EDDI drought categories in increasing order are D0, D1, D2, D3, and D4, which represent abnormally dry, moderate, severe, extreme, and exceptional droughts. EDDI drought information is given for the county where the Dolan Fire took place: Monterrey County, CA [46].

2.7. Topography

Topography is sourced from a Digital Elevation Model (DEM) of the study area. These data are 30 m resolution rasters sourced from the Advanced Spaceborne Thermal Emission and Reflection Radiometer (ASTER) Global DEM, available via NASA EarthData [28]. DEMs are used to help visualize and understand how wildfire spread and burn severity are affected by the surface topography. Heat rises due to the low density of warm air relative to cool air; thus, fires in lower elevations warm the air that then rises to higher elevations. Radiation that travels upward reaches unburnt vegetation ahead of the flames, further reducing the moisture in the vegetation prior to first contact with the fire, making fire fuels more likely to ignite and spread [47].To quantify the relationship between topography and burn severity, the Dolan Fire area DEM is geoprocessed to create slope and aspect rasters. Slope is given in the unit of degrees and aspect is the compass direction of the slope face on the terrain (Figure A1, Figure A2 and Figure A3). Appendix A features additional visualizations of the topographic factors.

3. Results

3.1. Burn Severity

The dNBR values for the Dolan Fire range from −0.37 to 0.95 with a mean value 0.292, giving the Dolan Fire a generally low to moderate burn severity classification. The mean dNBR value of 0.292 is consistent with the burn severity map which shows that a majority of the land cover experienced a moderate (yellow) severity burn (Figure 5). Additionally, Table 5 presents the percent land cover of each burn severity class. It shows that 54% of the area within the Dolan Fire perimeter experienced moderate severity burns, which is consistent with the mean dNBR value.

3.2. Burn Severity Progression

To model the spread of the Dolan Fire, we created a burn severity time series of post-fire maps using 2 August as the pre-fire date. The first four maps of this time series (18 August, 3 September, 19 September, and 5 October) are shown in Figure 6. When analyzing the evolution of the area-averaged burn severity in this time series, we noticed a decrease after 5 October. This decrease is most likely due to an inflection point caused by vegetation regrowth that has occurred in areas of low burn severity that have not seen active fire for over a month leading up to 5 October. For this reason, the associations of burn severity with environmental factors will be based on the post-fire map of 5 October shown in Figure 5.

3.3. Fire Fuels

Vegetation data within the Dolan Fire perimeter is given by The Anderson 13 Fire Behavior Fuel Models (FBFM13) (Figure 3). The FBFM13 provides data on the fuel bed depth, flame height, and rate of spread of each of the fuel types (Table 4). Data and fuel type descriptions from each of the selected fuels are used to make connections between fuel type and burn severity. The five selected fuel types are of the most abundance within the study area, they are as follows: Young Brush (FBFM5), Grass with Timber/Shrub (FBFM2), Short Needle Timber Litter (FBFM8), Long Needle Timber Litter (FBFM9), and Mature Timber (FBFM10). Of the selected fuel types, Young Brush has the highest percentage of cover with a total of 37.3% cover, more than twice as much as the next closest fuel type (Table 6). Other than Young Brush, the rest of the fuel types have a similar percentage of cover of 11.3%, 11.6%, 16.9%, and 12.0%, respectively.
In Figure 7, patterns in percent cover can be seen when comparing the burn severity to each of the fuel models. For Figure 7, each of the four burn severity classes should be treated as its own map or dataset showing only areas of its respective burn severity. This means that the sum of the percent land cover of each of the five fuel types total 100% for each of the four burn severity classes. For example, the percentages of land cover for unburnt vegetation for each of the five fuel types are 21%, 58%, 15%, 3%, and 3%, totaling 100%. The Young Brush fuel type accounts for ~60% of all unburnt vegetation, and as burn severity increases to low-, moderate-, and high-severity burns, the abundance of Young Brush was ~40%, ~45%, and ~15%, respectively. Grass with Timber/Shrub remained the most consistent of the fuel types, having no significant trends in the percent of land cover as burn severity increases. It accounted for ~21%, ~12%, ~11%, and ~20% of land cover of the four burn severity classes, respectively. Short Needle Timber Litter experienced a decreasing trend in percent cover with burn severity increase. Additionally, Short Needle Timber Litter was not prone to increased burn severity areas, as the fuel type had the lowest percent cover for areas which experienced burns of moderate and high severity, having a percent cover of ~10% and ~5%, respectively. Contrary to Young Brush, as burn severity increases, Long Needle Timber Litter and Mature Timber fuel types experience a steady increase in the percentage of land cover; combined, they account for over ~60% of fuels that burned at high severity. The fuel type metrics presented in Table 4 are correlated with the burn severity of 5 October; the dead fuel load had a significant positive correlation coefficient(r) of 0.922 (p-value = 0.02) (Figure A5, Table A1).
To quantify the relationship between burn severity and fuel type, we employed a Kruskal–Wallis (KW) test. The null hypothesis that the medians of dNBR are equal across all fuel types was rejected, meaning that medians were all different across all fuel types (p < 0.01). To investigate which medians are statistically different, we conducted Dunn’s post hoc multiple comparison test. The result of the post hoc test was that each group combination was statistically different (p < 0.01). A boxplot of dNBR for each fuel type is pictured in Figure A6. These results suggest that fuel type has a significant impact on the burn severity, and there are statistically significant differences in burn severity across the different fuel types. Appendix B features additional visualizations and statistics regarding the relationship between fuel type and burn severity

3.4. Topography

The DEM displays the many variations in elevation from the central California coast to the Santa Lucia Mountain range. The effects that topography has on burn severity are seen in differences in slope (steepness angle) and aspect (azimuth or compass direction of terrain surface). To quantify how topography may affect burn severity, geoprocessed rasters for slope and aspect are generated using the DEM raster of the Dolan Fire study area. The Dolan study area aspect directions are separated into five classes: flat terrain and the four cardinal directions by azimuth, namely north (315–45°), east (45–135°), south (135–225°), and west (225–315°). The resulting average dNBR values for each aspect class are 0.287, 0.304, 0.310, 0.285, and 0.282, respectively, for the 5 October post-fire date (Figure 8). The aspect direction with the highest average dNBR values was east and the lowest was west. North (east) facing slopes resulted in having higher average burn severity values than south (west) facing slopes. The burn severities of the south and west directions were similar to the flat terrain. A KW analysis of variance was conducted for the burn severity and aspect class variables. 5000 random samples were selected as the subset, this resulted in the removal of the relatively small number of aspect pixels that are in the “flat” direction. The result of the KW test proved to be statistically significant (p < 0.01). Dunns post hoc multiple comparison tests were conducted to see exactly which group medians were different; p values > 0.05 mean the test failed to reject the null hypothesis. The test found all comparisons to be statistically different except for east-north (p = 0.08) and west-south (p = 0.24). These results are consistent with the boxplot in Figure A4.
The Dolan Fire study area slope values are separated into five classes of degree angle: 0°–5°, 5°–15°, 15°–25°, 25°–35°, and >35°. To quantify the effect that slope had on burn severity, we calculated the average burn severity for the post-fire date of 5 October 2020 at each slope class. The result was an average burn severity of 0.210, 0.297, 0.311, 0.308, and 0.284, respectively (Figure 9). The general trend shows an increase in burn severity with an increased slope angle, where the highest average dNBR values occur between slope angles of 15–35°. This indicates that 15–35° degrees was the optimal range of slope angles for increased fire burn severity for the Dolan wildfire. To further investigate this relationship, we calculate the average burn severity for low-, moderate-, and high-severity burns. Low-severity burns saw a gradual increase in dNBR as slope angle increased. Moderate-severity burns showed their highest occurred between 5 and 25°, then a gradual decrease in dNBR as the slope angle increased >25°. High-severity burns displayed a similar trend to that of the average combined burn severity, with a general increase and larger average dNBR at angles 15–35°. A Pearson correlation coefficient (r) measures the strength and direction of the linear relationship between burn severity and slope. It ranges from −1 to 1; in our case, the r is approximately 0.111, indicating a weak positive linear relationship. The p-value, in our case, is very close to zero (p < 0.01), which is far below the common significance threshold of 0.05. While there is a statistically significant positive linear relationship between burn severity and slope, the strength of this relationship is weak.

3.5. Effect of Wind on Burn Severity and Dolan Fire Spread

Wind rose plots provide valuable hourly data and visualization of wind over a period of time. For this study, we analyze the wind rose data recorded from the Monterey Peninsula airport weather station between the dates of wildfire spread seen in Figure 6, 18 August 2020, to 5 October 2020. The spikes of a wind rose plot align with their corresponding compass direction labeled on the outside of the circle to show which direction the wind is coming from. The length of each spike gives the frequency percentage to show how often wind blew from this direction. Within each spike are sub-classes that detail the frequency that the wind blew at a certain range of wind speeds. These sub-classes are as follows: 1.5–1.8 m/s, 1.8–3.6 m/s, and 3.6–5.85 m/s. The calm winds threshold is set at 1.5 m/s, so values below this threshold are not included in the analysis. Looking at the wind rose plot in Figure 10, it can be seen that the vast majority of the winds are blown in from between the W, WNW, NW, NNW, and N (azimuth 270–360). Roughly 60% of the above threshold winds during this time blew in from these directions. The FBFM13 fuel type rate of spread data is based on winds with a speed of at least 2.24 m/s. Upon further investigation of the tabular data, winds coming from the directions between west and north are bolded because these are the only winds to register an average speed greater than the FBFM13 rate of fire spread requirements (Table 7). Daily wind speed data from the Gridded Surface Meteorological (GridMET) Dataset is collected in raster format at 4 km resolution during the same period as the wind rose data in Figure 10. The wind speed data at a height of 10 m was correlated with burn severity (decimated from the 30 m Landsat resolution to the 4 km resolution of the wind), but the correlation between these two variables was not significant. We note, however, that the quality of high-resolution winds like GridMET may be questionable because of insufficient data for validation. In addition, the interconnected nature of the many environmental factors that also influence burn severity may complicate such an analysis. An analysis of the relationship between winds and fire propagation and the direct impact of winds on burn severity is beyond this study’s scope.

4. Discussion

Previous studies of the Dolan wildfire have been centered around the hydrologic response to rainfall in the scarred area [48,49]. To date, a study of the burn severity of the Dolan Fire has not been published; however, a recent study highlighting wildfire on the northern coast of California has studied associations between burn severity and environmental factors [11].
We used a set of remote sensing data to calculate burn severity using the Difference Normalized Burn Ratio (dNBR) index over a series of time steps. The burn severity time series maps were able to capture the general pattern of fire spread and the evolution of burn severity. Burn severity classification does not have a standard for assigning value range thresholds. Different studies use different thresholds based on factors such as the sensor being used, findings of field investigations of burn severity, and the analyst’s experience working with burn severity. Thus, burn severity classification thresholds can be subjective, which is the reason there are many different styles. Studies have used machine learning to mitigate human subjectivity; however, these methods are not without fault considering that parameter selection is subjective as well. For this study, we used a combination of recommendations for dNBR thresholds for Landsat data (USGS) and the Jenks natural breaks method [40]. USGS states that dNBR values can vary from case to case, and so, if possible, interpretation in specific instances should also be carried out through field assessment in order to obtain the best results. Landsat recommendations and the Jenks methods had nearly identical threshold ranges; however, the largest discrepancy was with the high severity class where the value ranges for dNBR were >0.48 and >0.66, respectively. The Landsat-recommended high severity range of >0.66 displayed little to no high severity areas, which was inconsistent with other burn severity maps of the Dolan Fire by MTBS. So, based on this low amount of high-severity burn that was proven to have occurred, we used >0.50 as the high-severity value range. This offered results most similar to those seen in other assessments of burn severity using dNBR for the Dolan Fire.
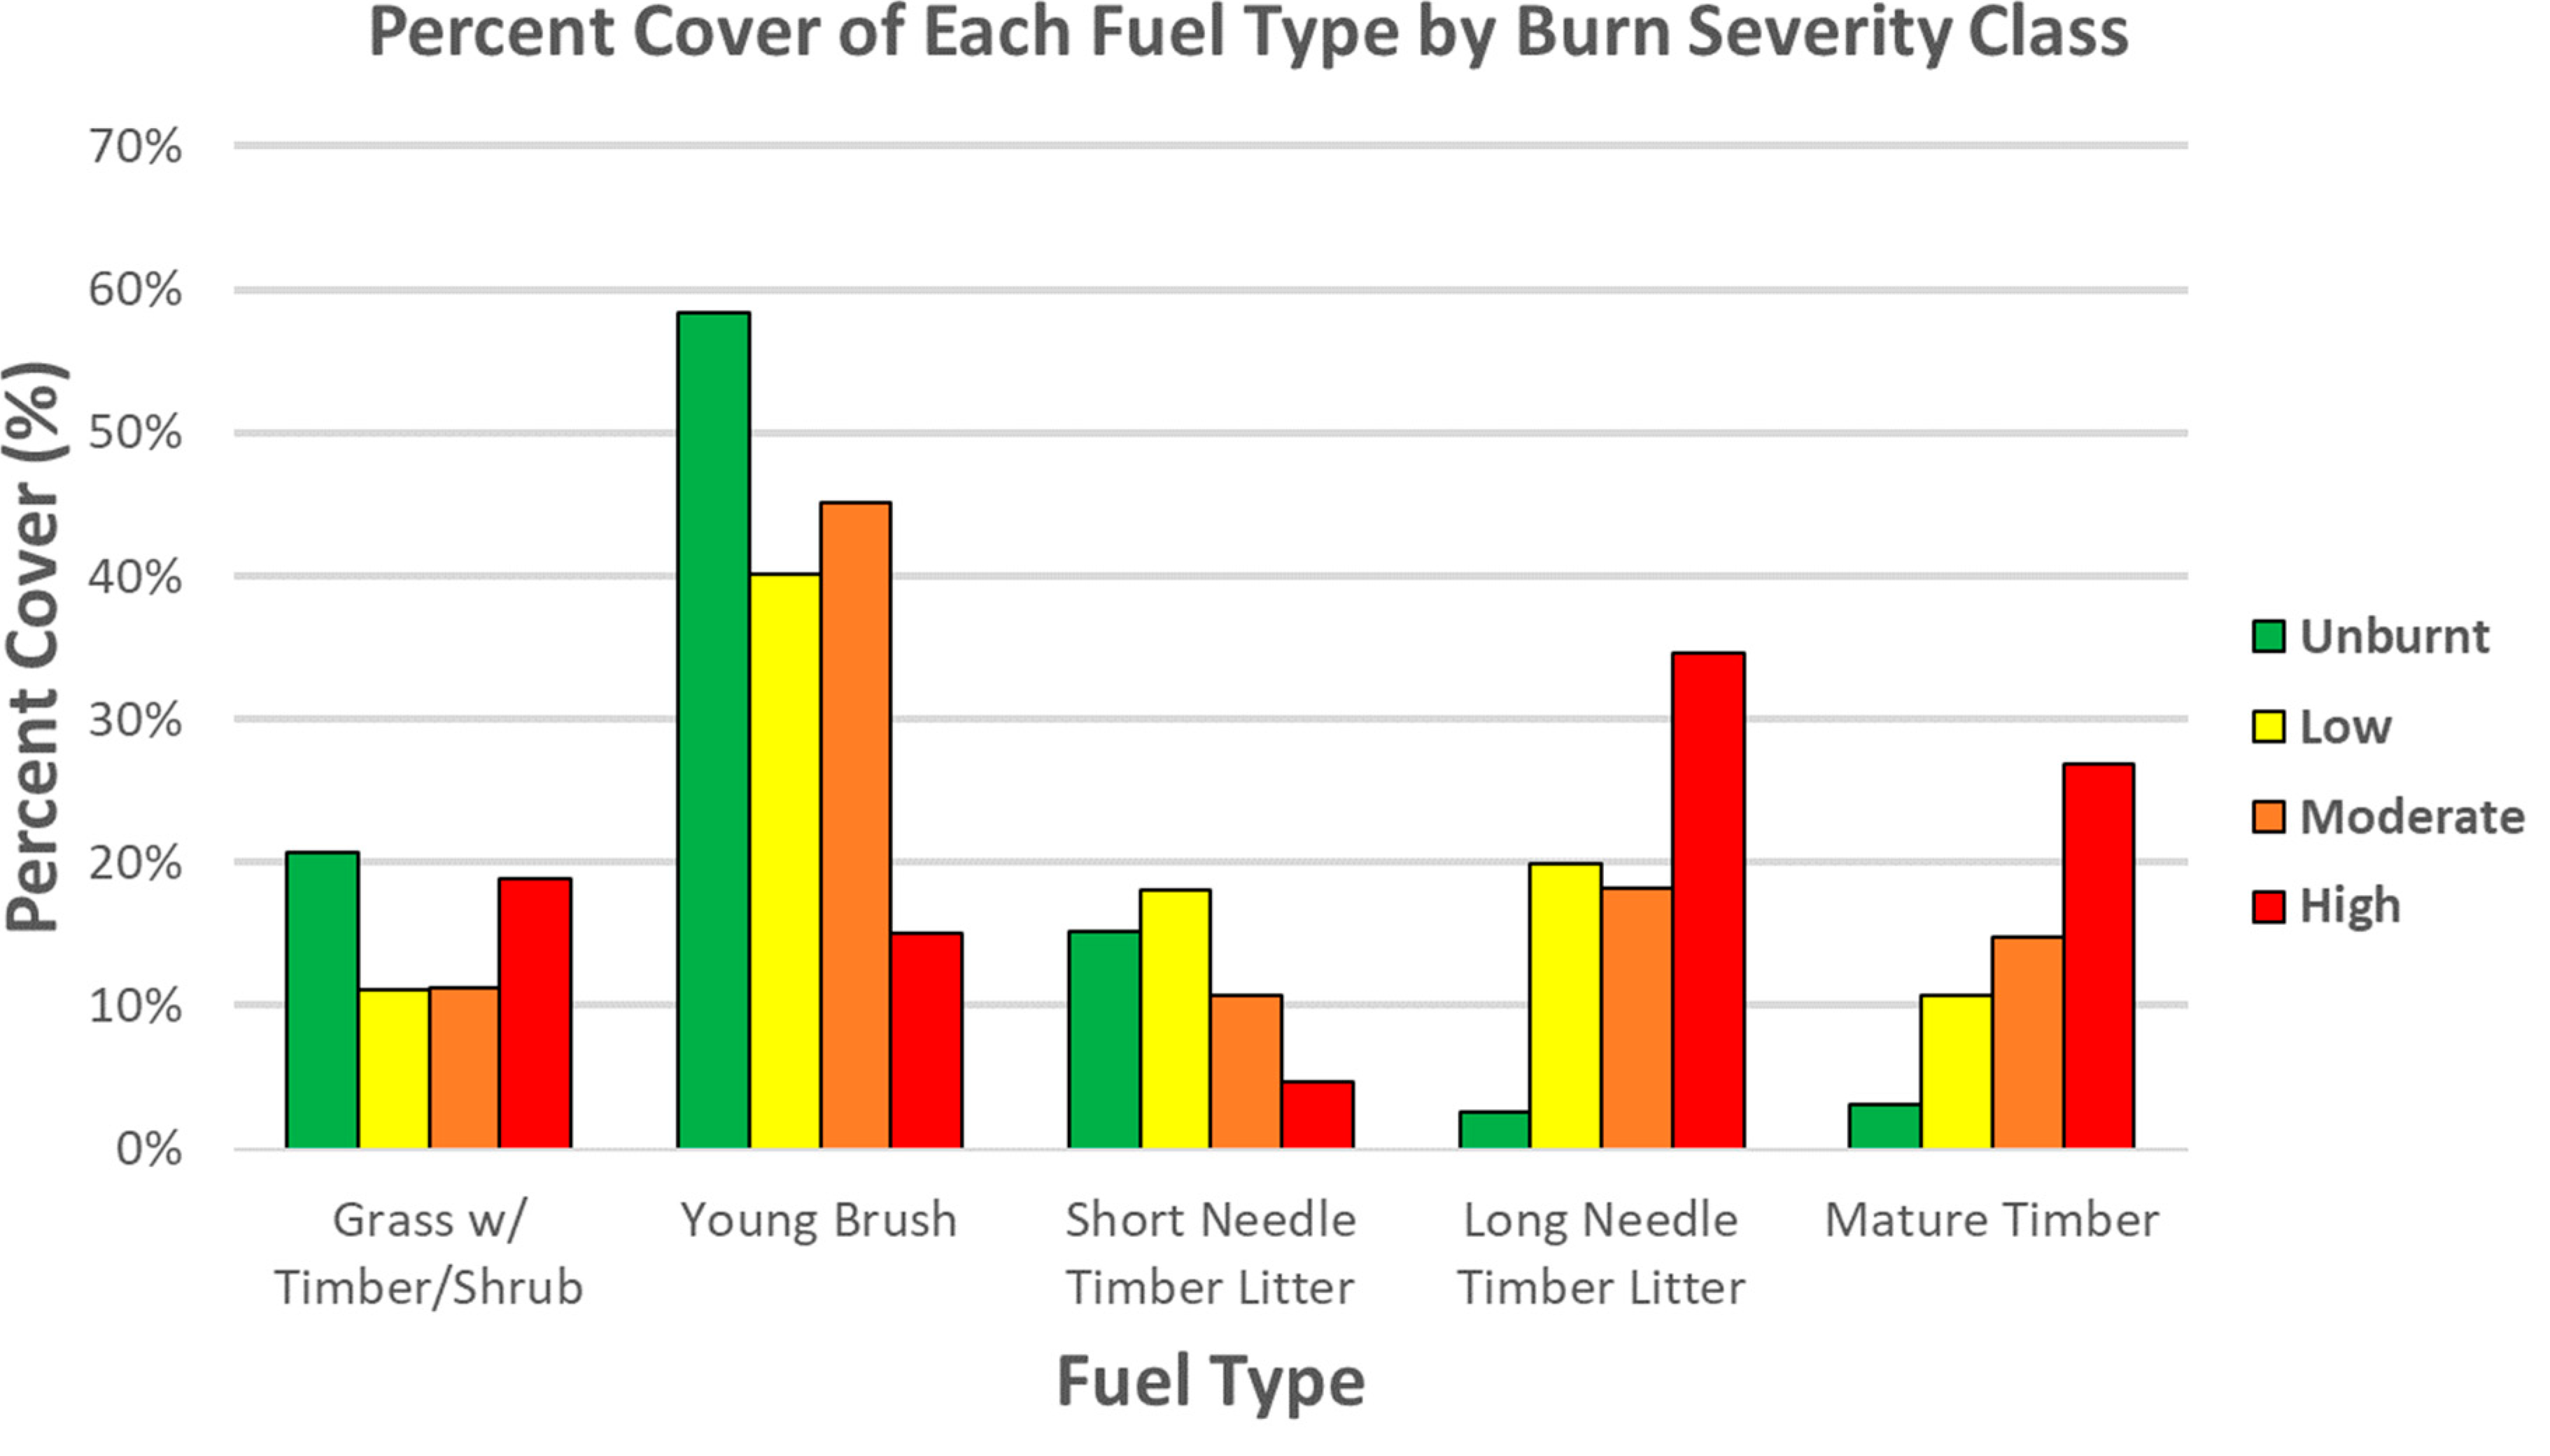
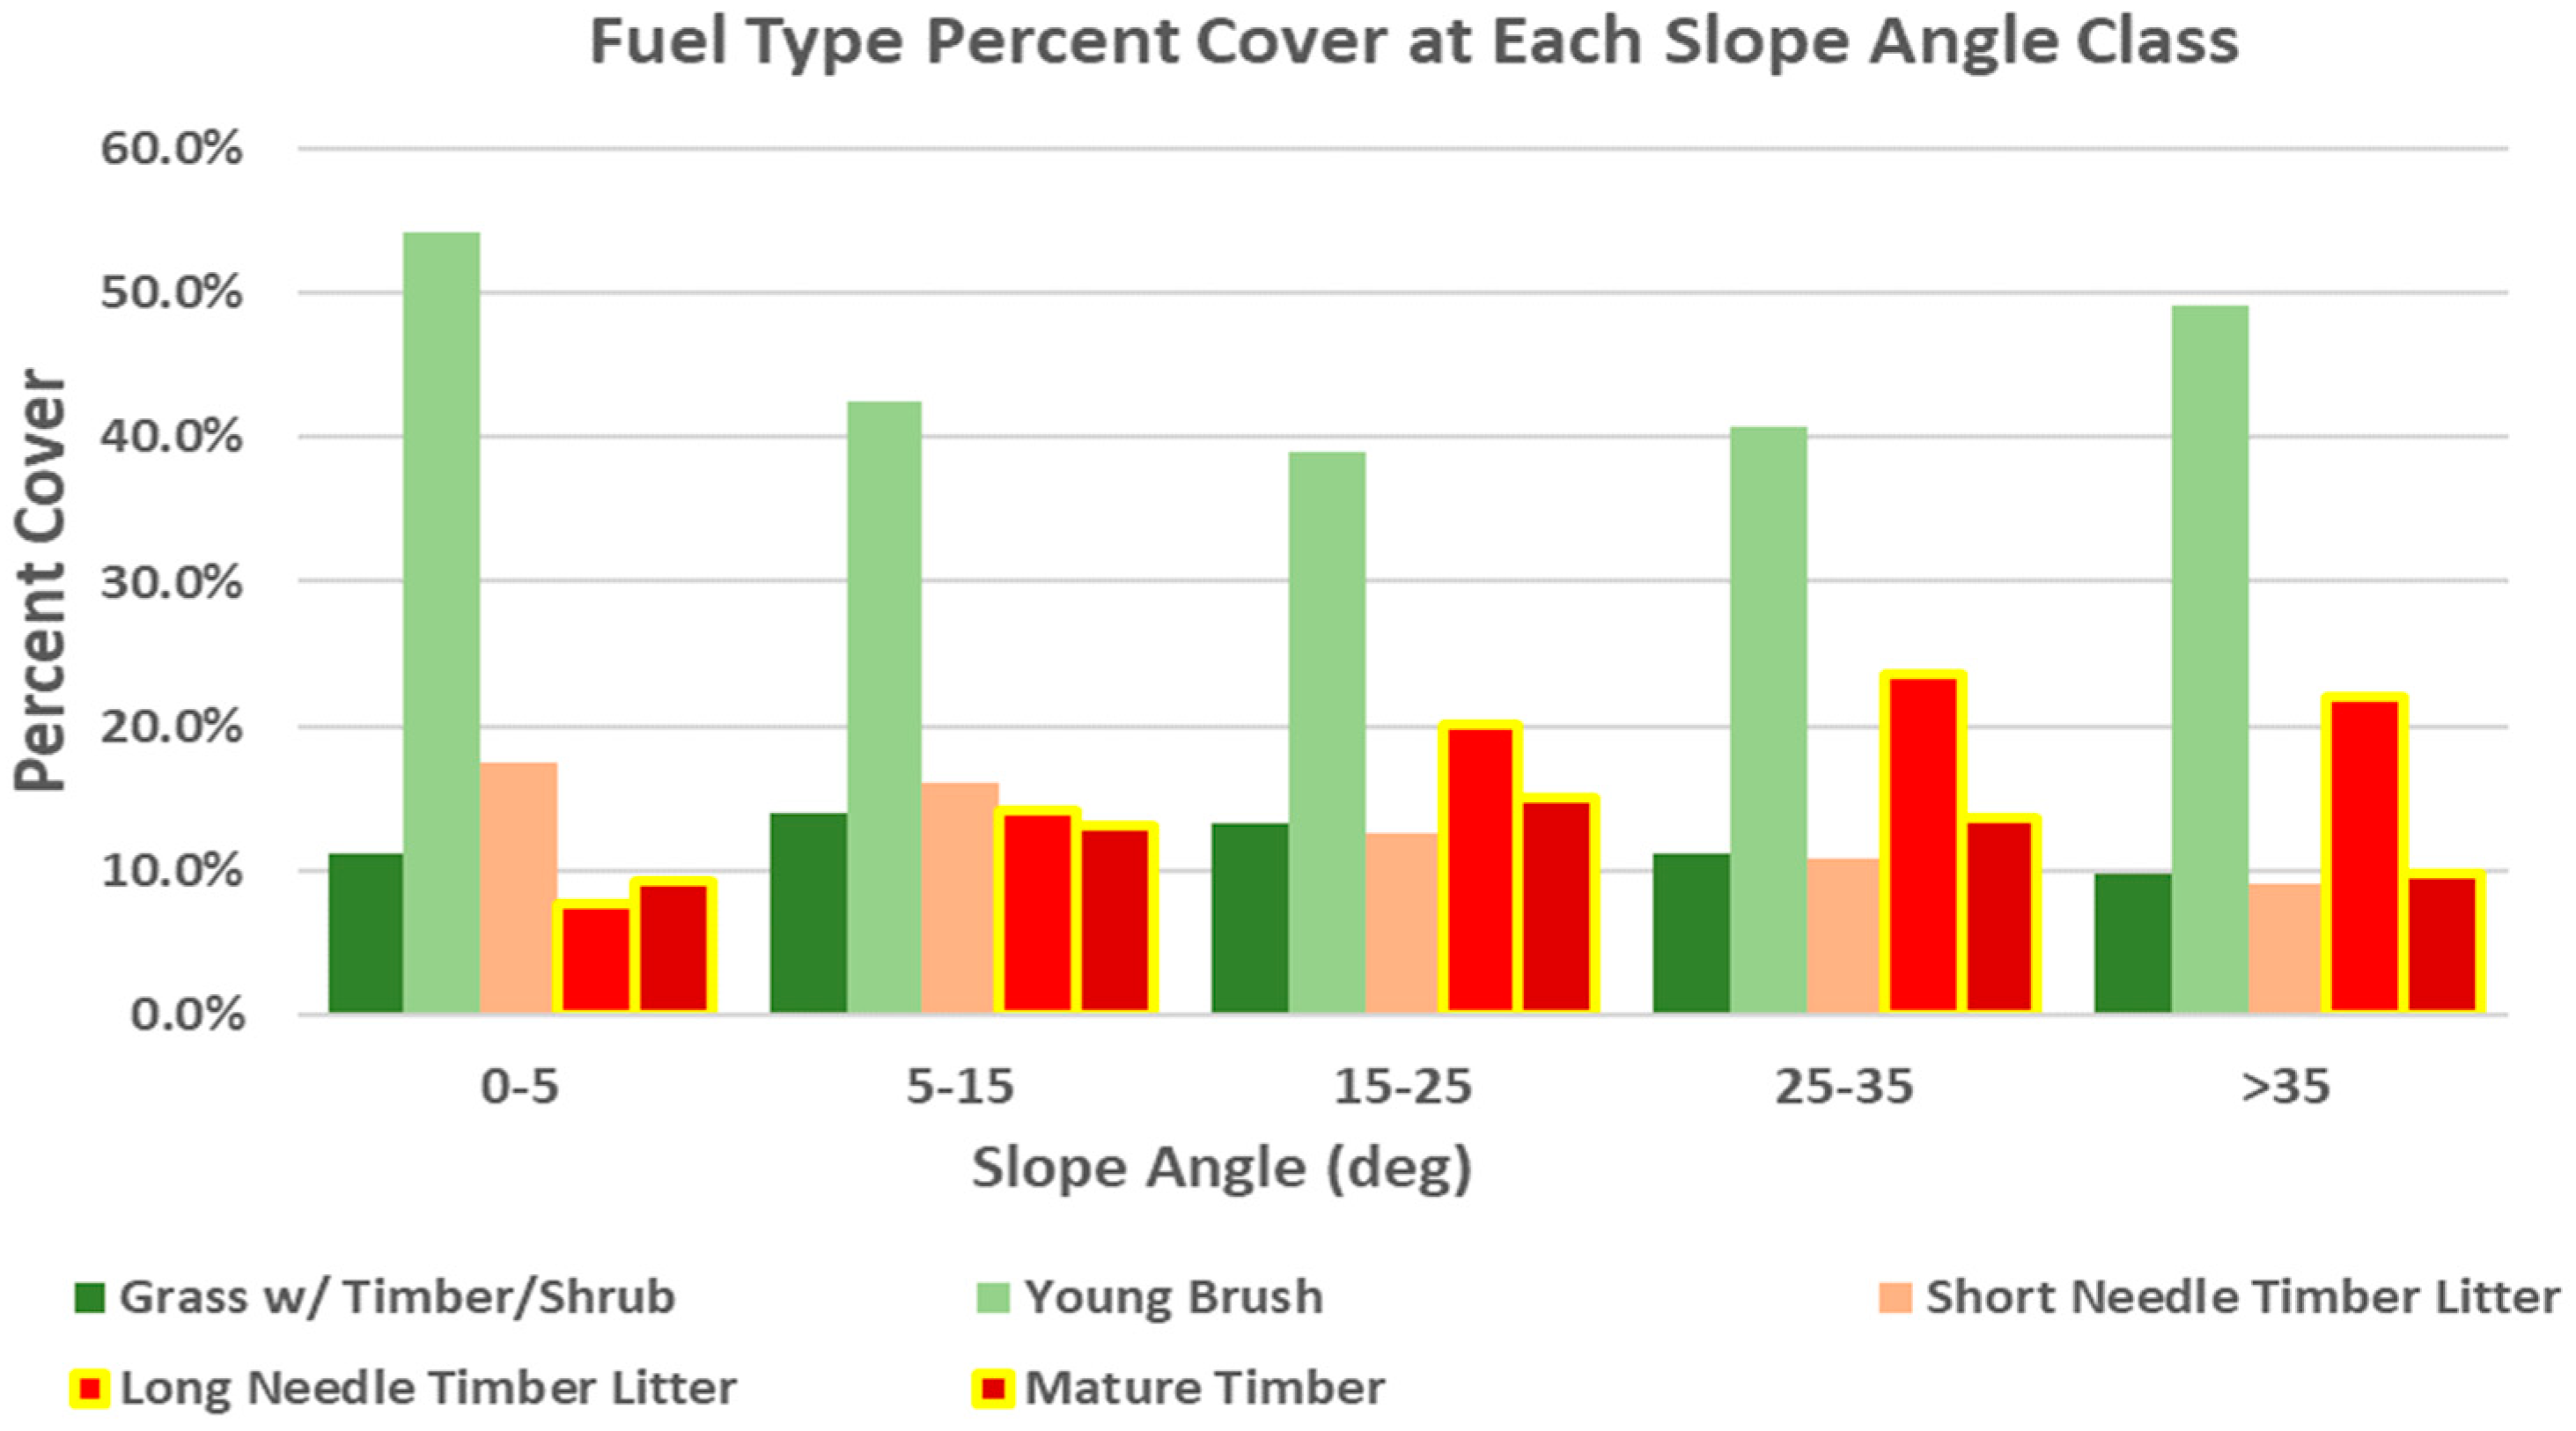
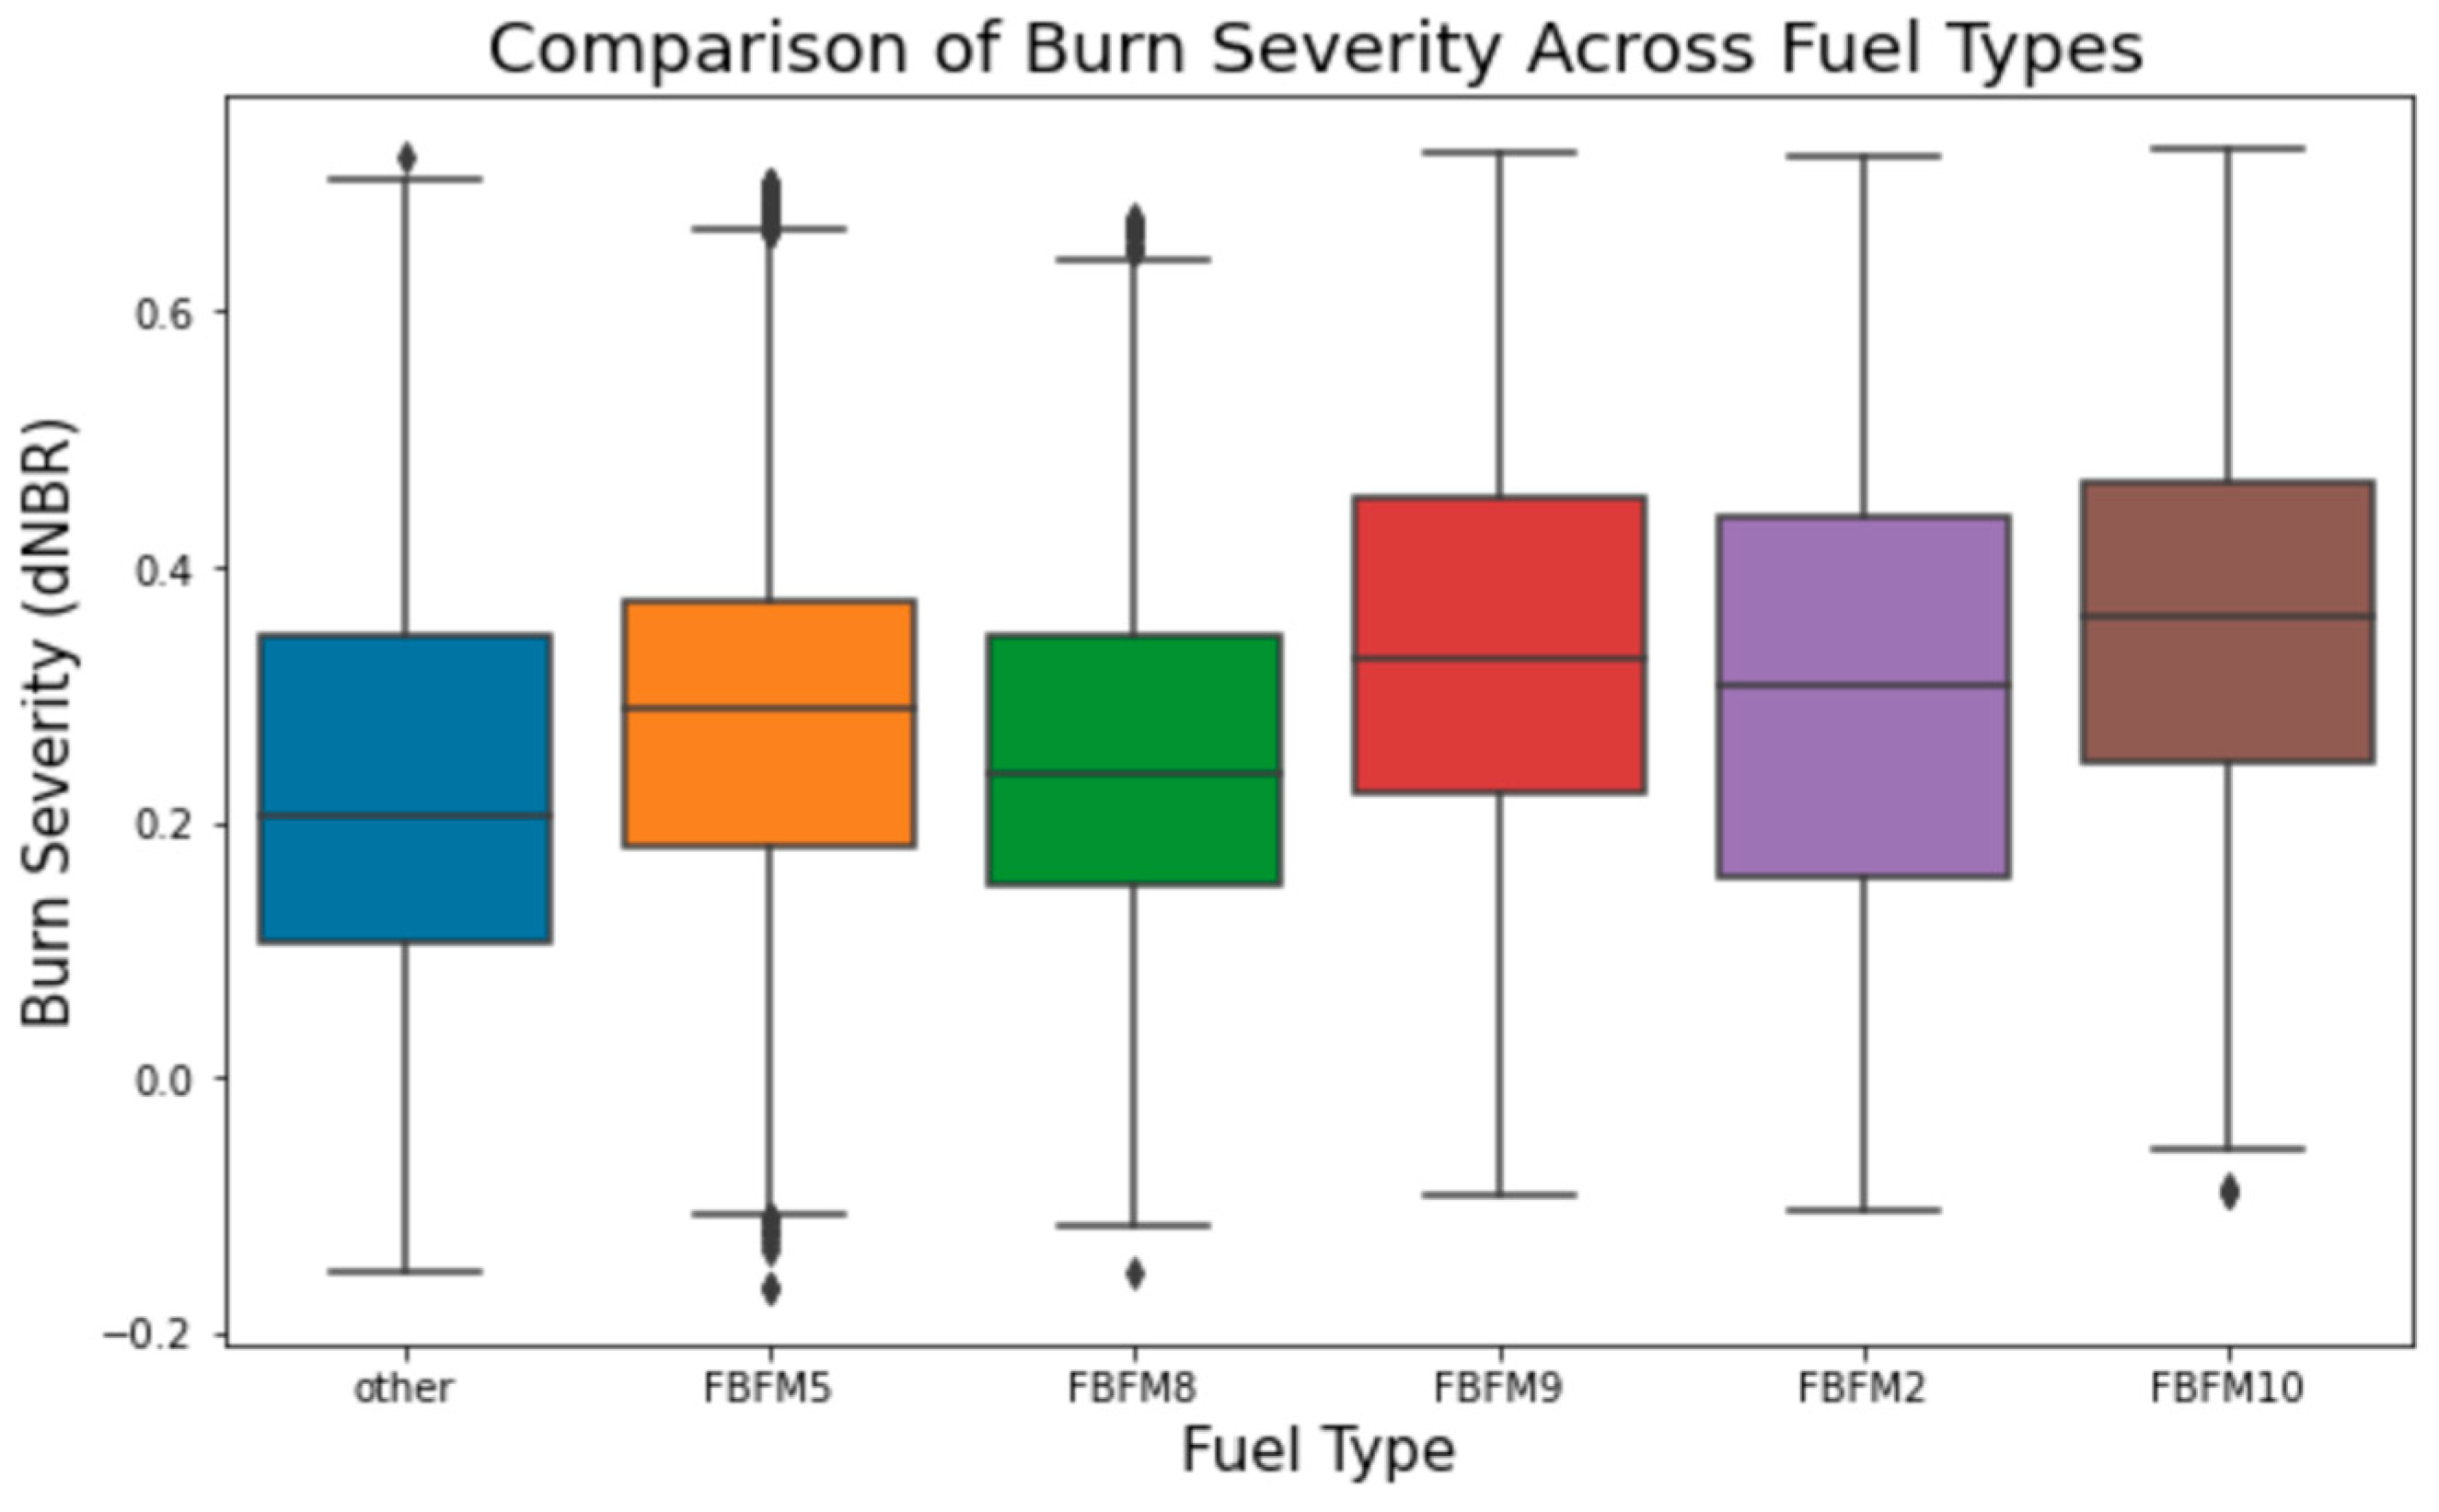
We investigated the relationship between environmental risk factors for wildfire and burn severity for the Dolan Fire of central coastal California. We quantified the relative association of fuel type and elements of topography in determining burn severity over the region’s diverse landscape. Overall, fuel type and topography (slope and aspect) influenced burn severity in the Dolan Fire. More Timber and Timber Litter burned at high severity compared to the other fuels, while Young Brush was most of the unburnt vegetation. Steeper slopes were more favorable to higher severity burns, and north- and east-facing slopes were more susceptible to increased burn severity. Furthermore, we found that topography’s influence on burn severity may also be explained by the effect that slope may have on the type of vegetation that populates at slope classes that saw increased burn severity. 
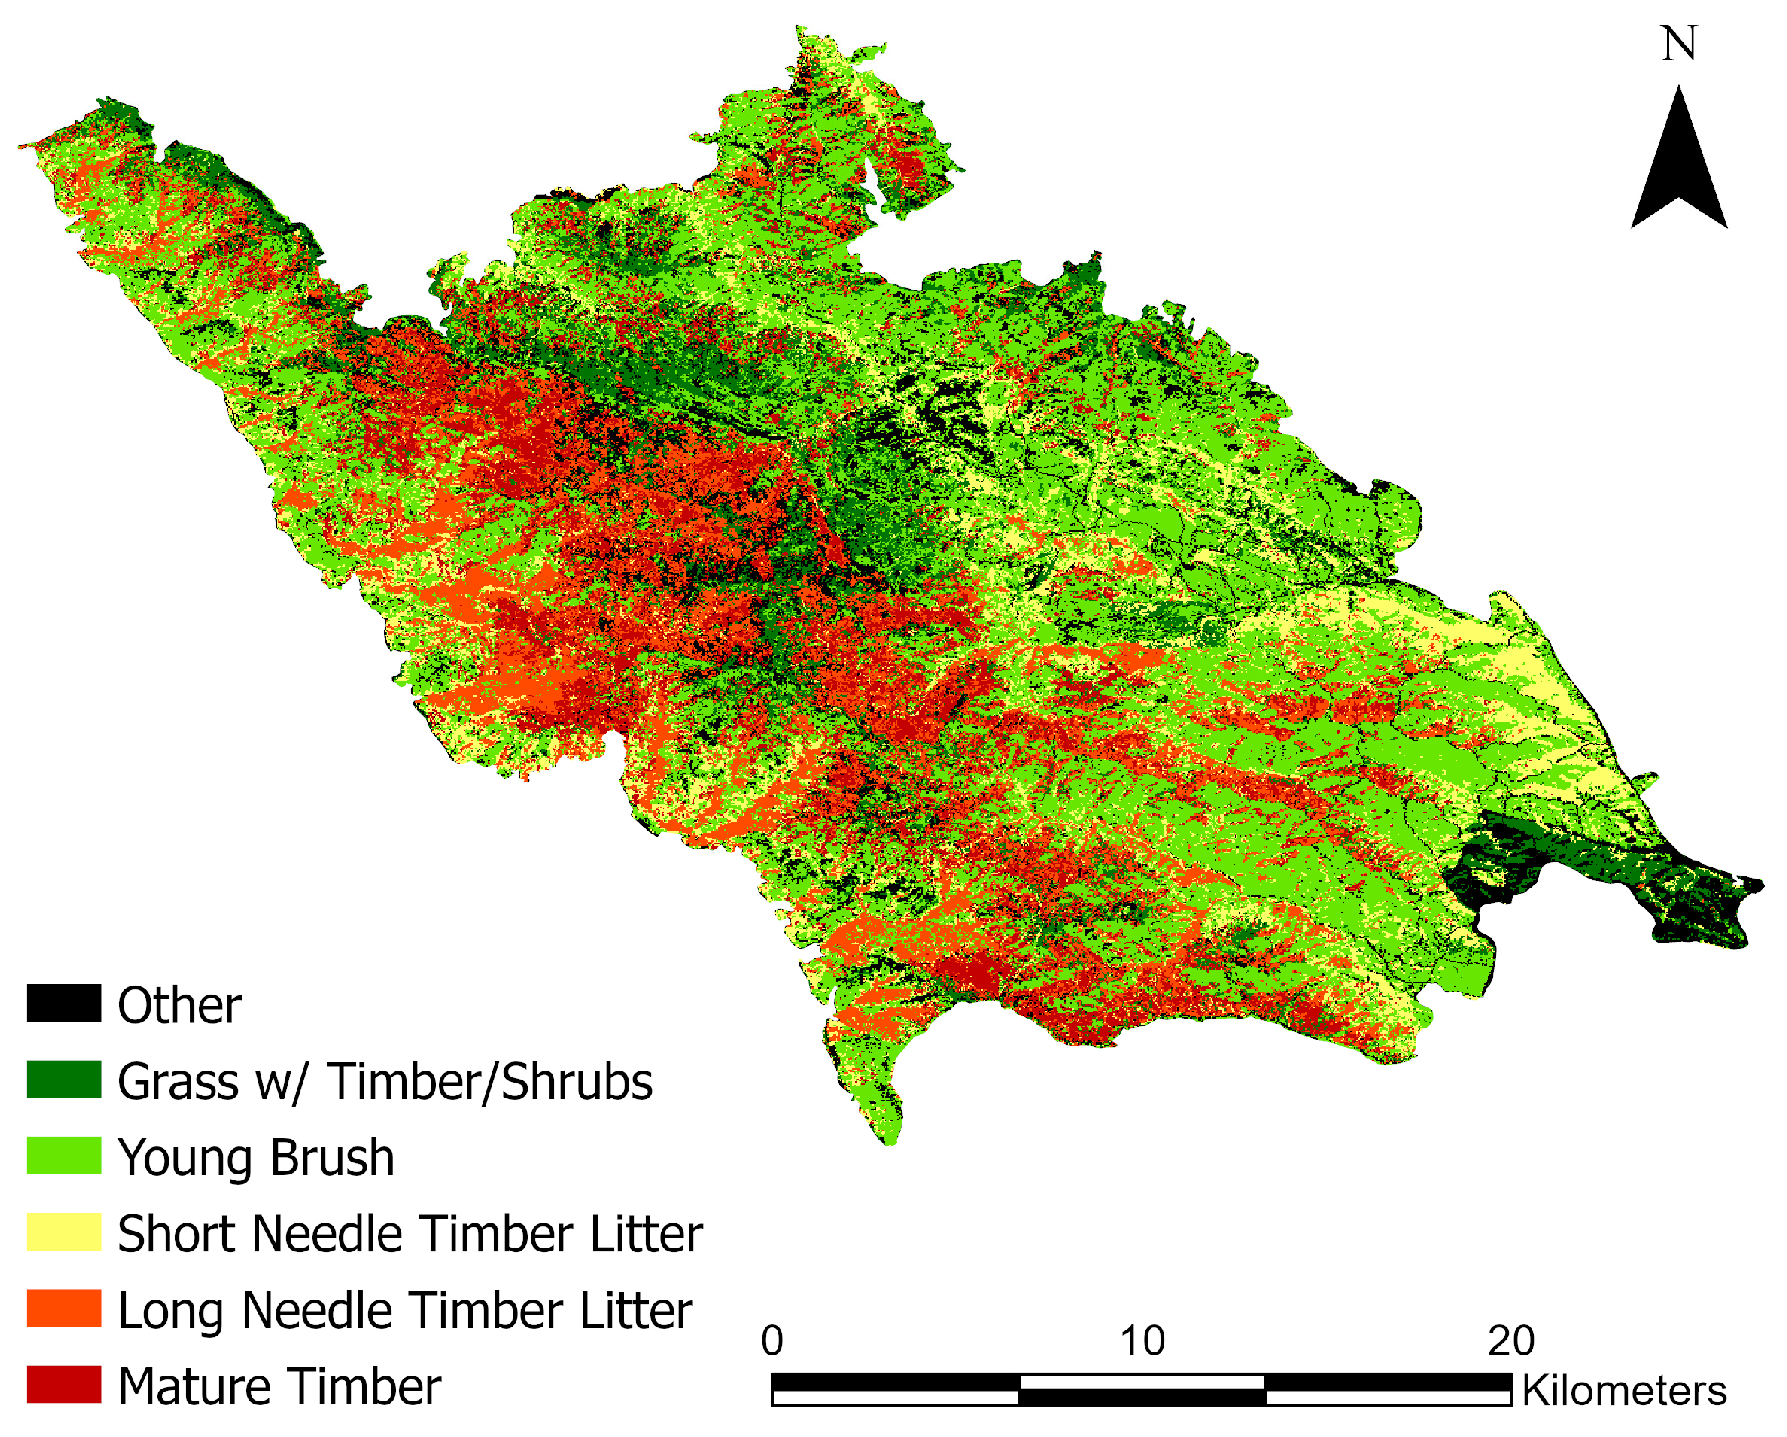
Figure 11 highlights Long Needle Timber Litter and Mature Timber for their increasing percent land cover as slope increases, especially at intermediate slopes between 15° and 35°.

4.1. Fuel Models

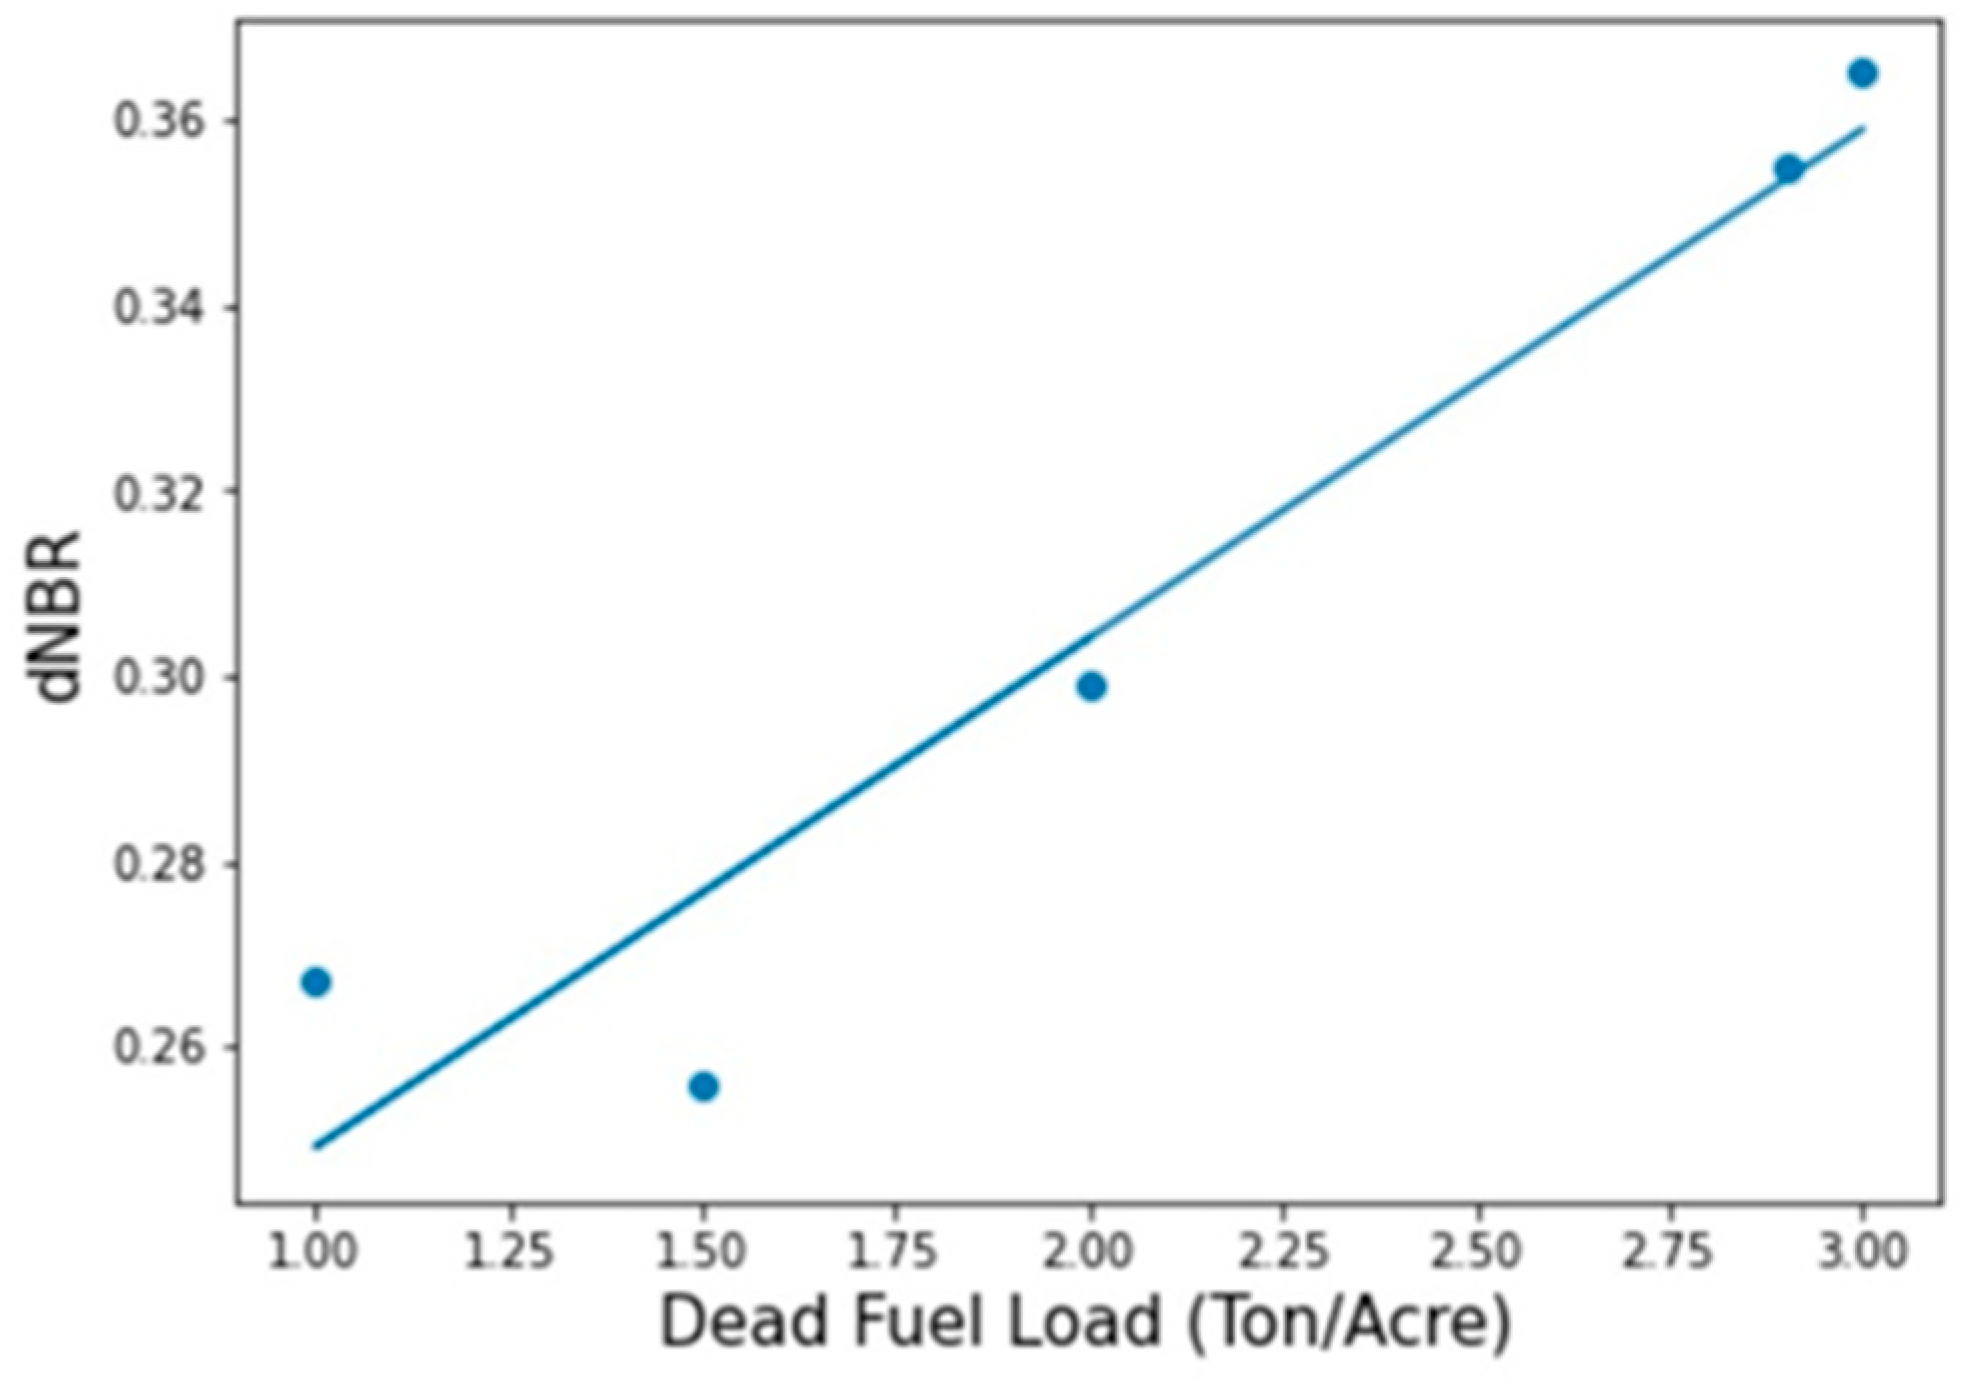
Fuel type in conjunction with the other environmental metrics, despite a decrease in overall temperature, may have also been a catalyst for the fire spread seen between timestamps of burn severity maps from 18 August to 3 September 2020 (Figure 6). FBFM9 and FBFM10 were in greater density in this area of the map (Figure 3). Fire fuel metrics of the Anderson FBFM13, such as dead fuel loading, were an important variable in the resulting burn severity for the Dolan Fire. Burn severity correlation statistics for dead fuel load gave a correlation (r) of 0.922 and a p-value of 0.02, signifying a strong correlation between the variables. However, there was no evidence of a correlation between mean burn severity and the fire fuel metrics of flame height, spread rate, and bed depth. Mature Timber and Long Needle Timber Litter experienced more high severity burns by a large margin, partly due to high values of dead fuel tons per acre. However, not every fuel metric, such as flame height and rate of spread, showed a strong correlation. This may be due to several other risk factors affecting wildfire burn severity, such as temperature, topography, and wind speed and direction, similar to caveats found in studies of northern California wildfires by Huang et al. [11].

4.2. Topography

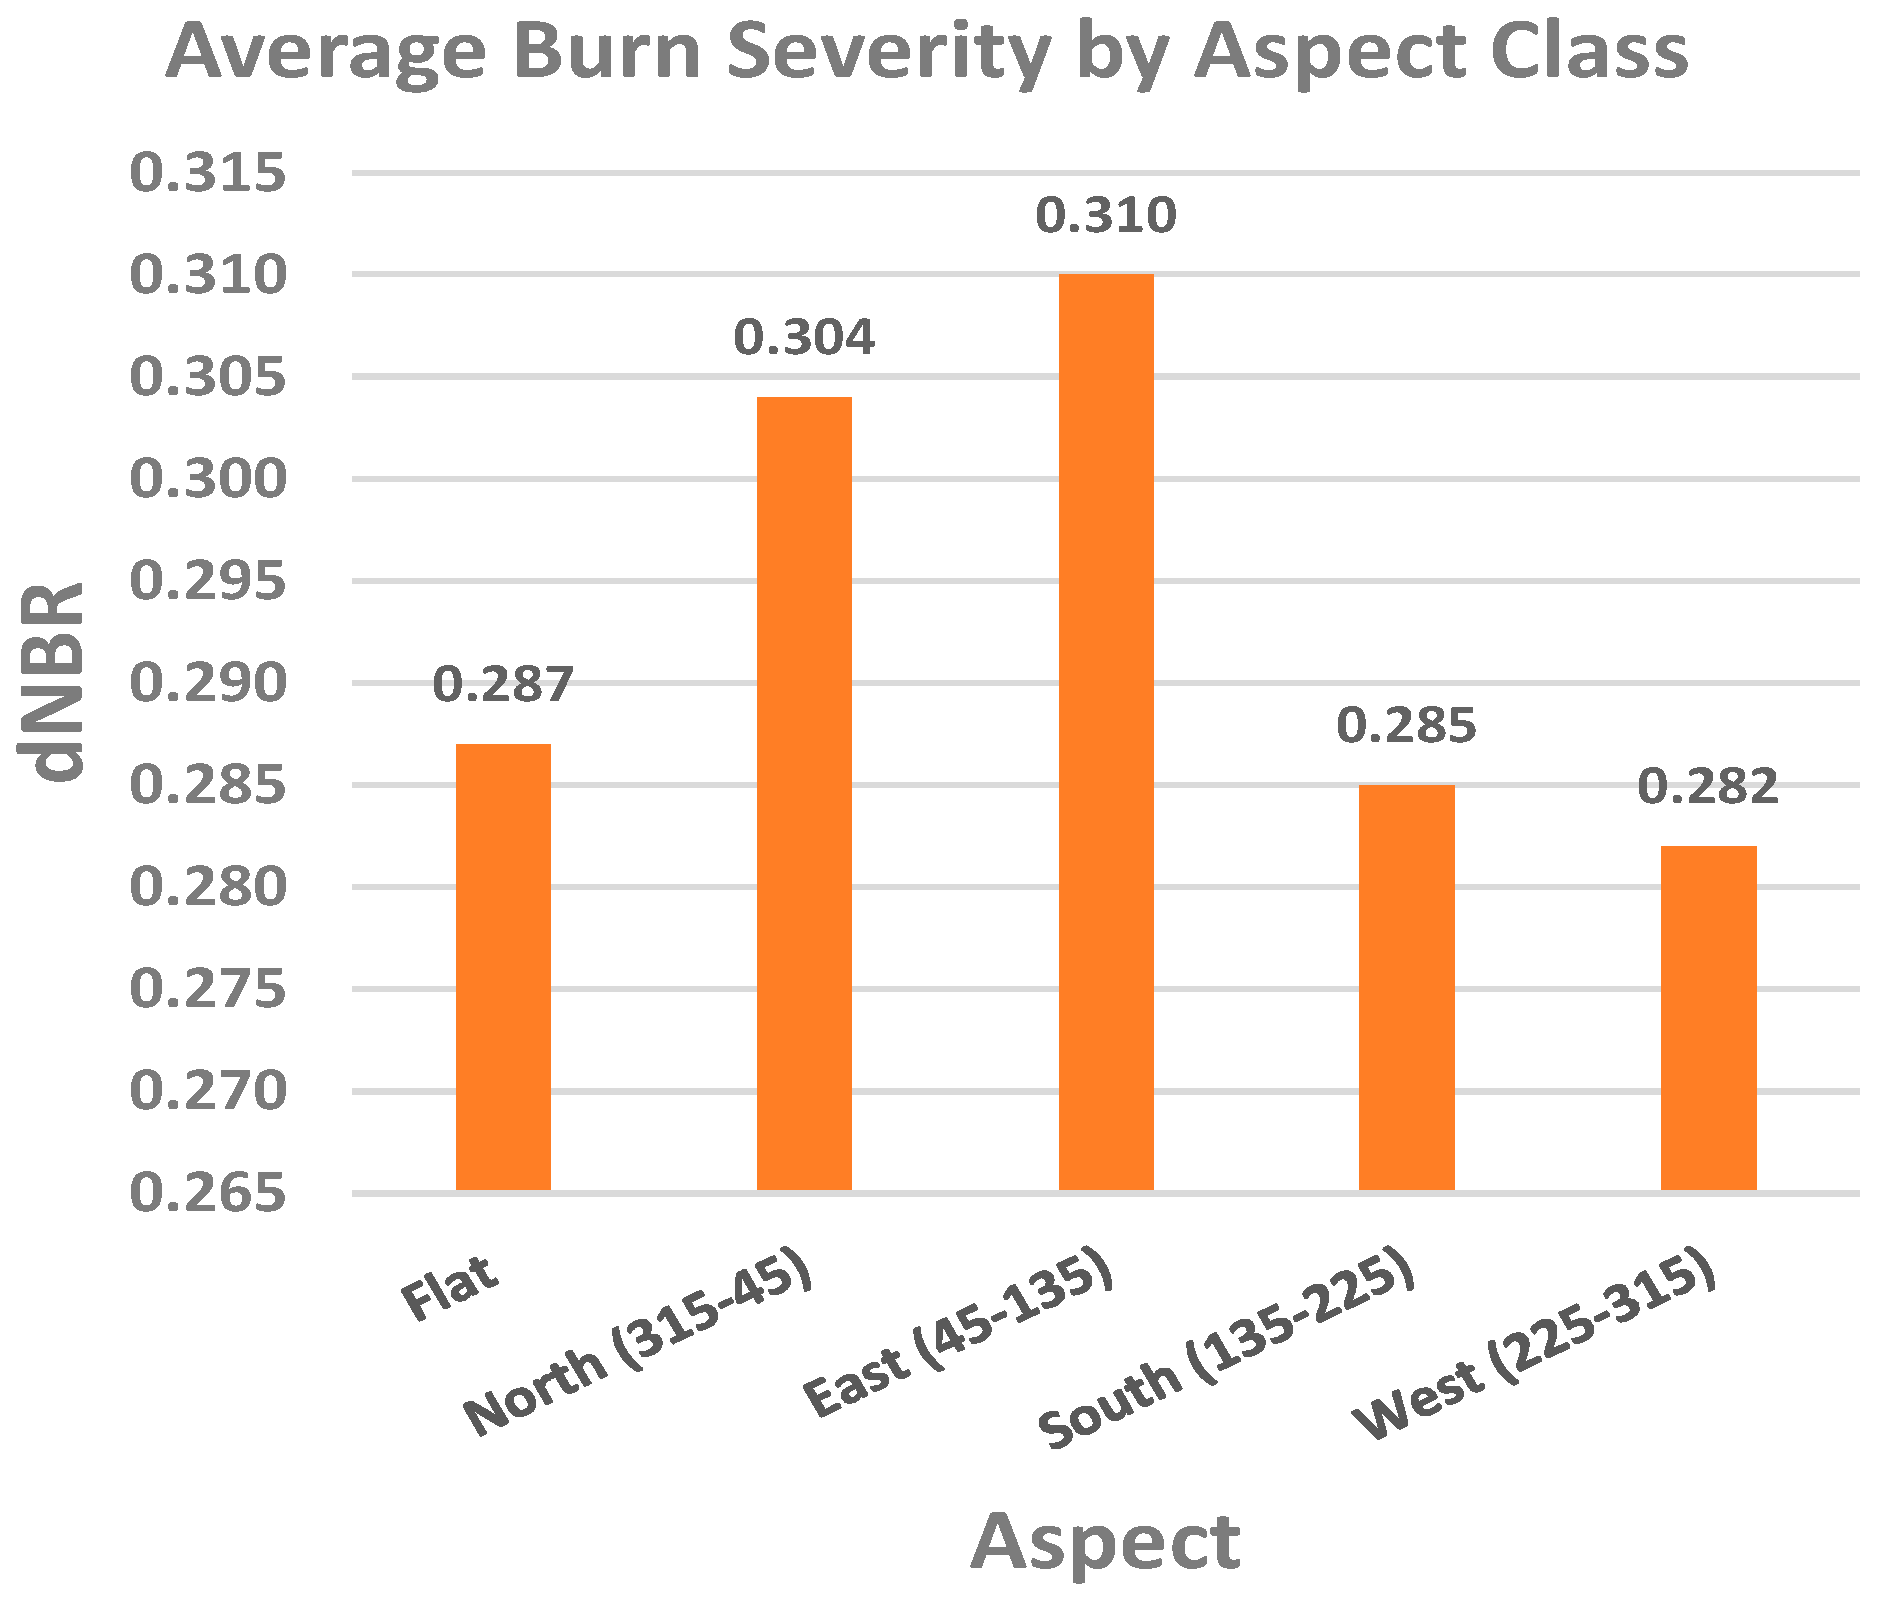
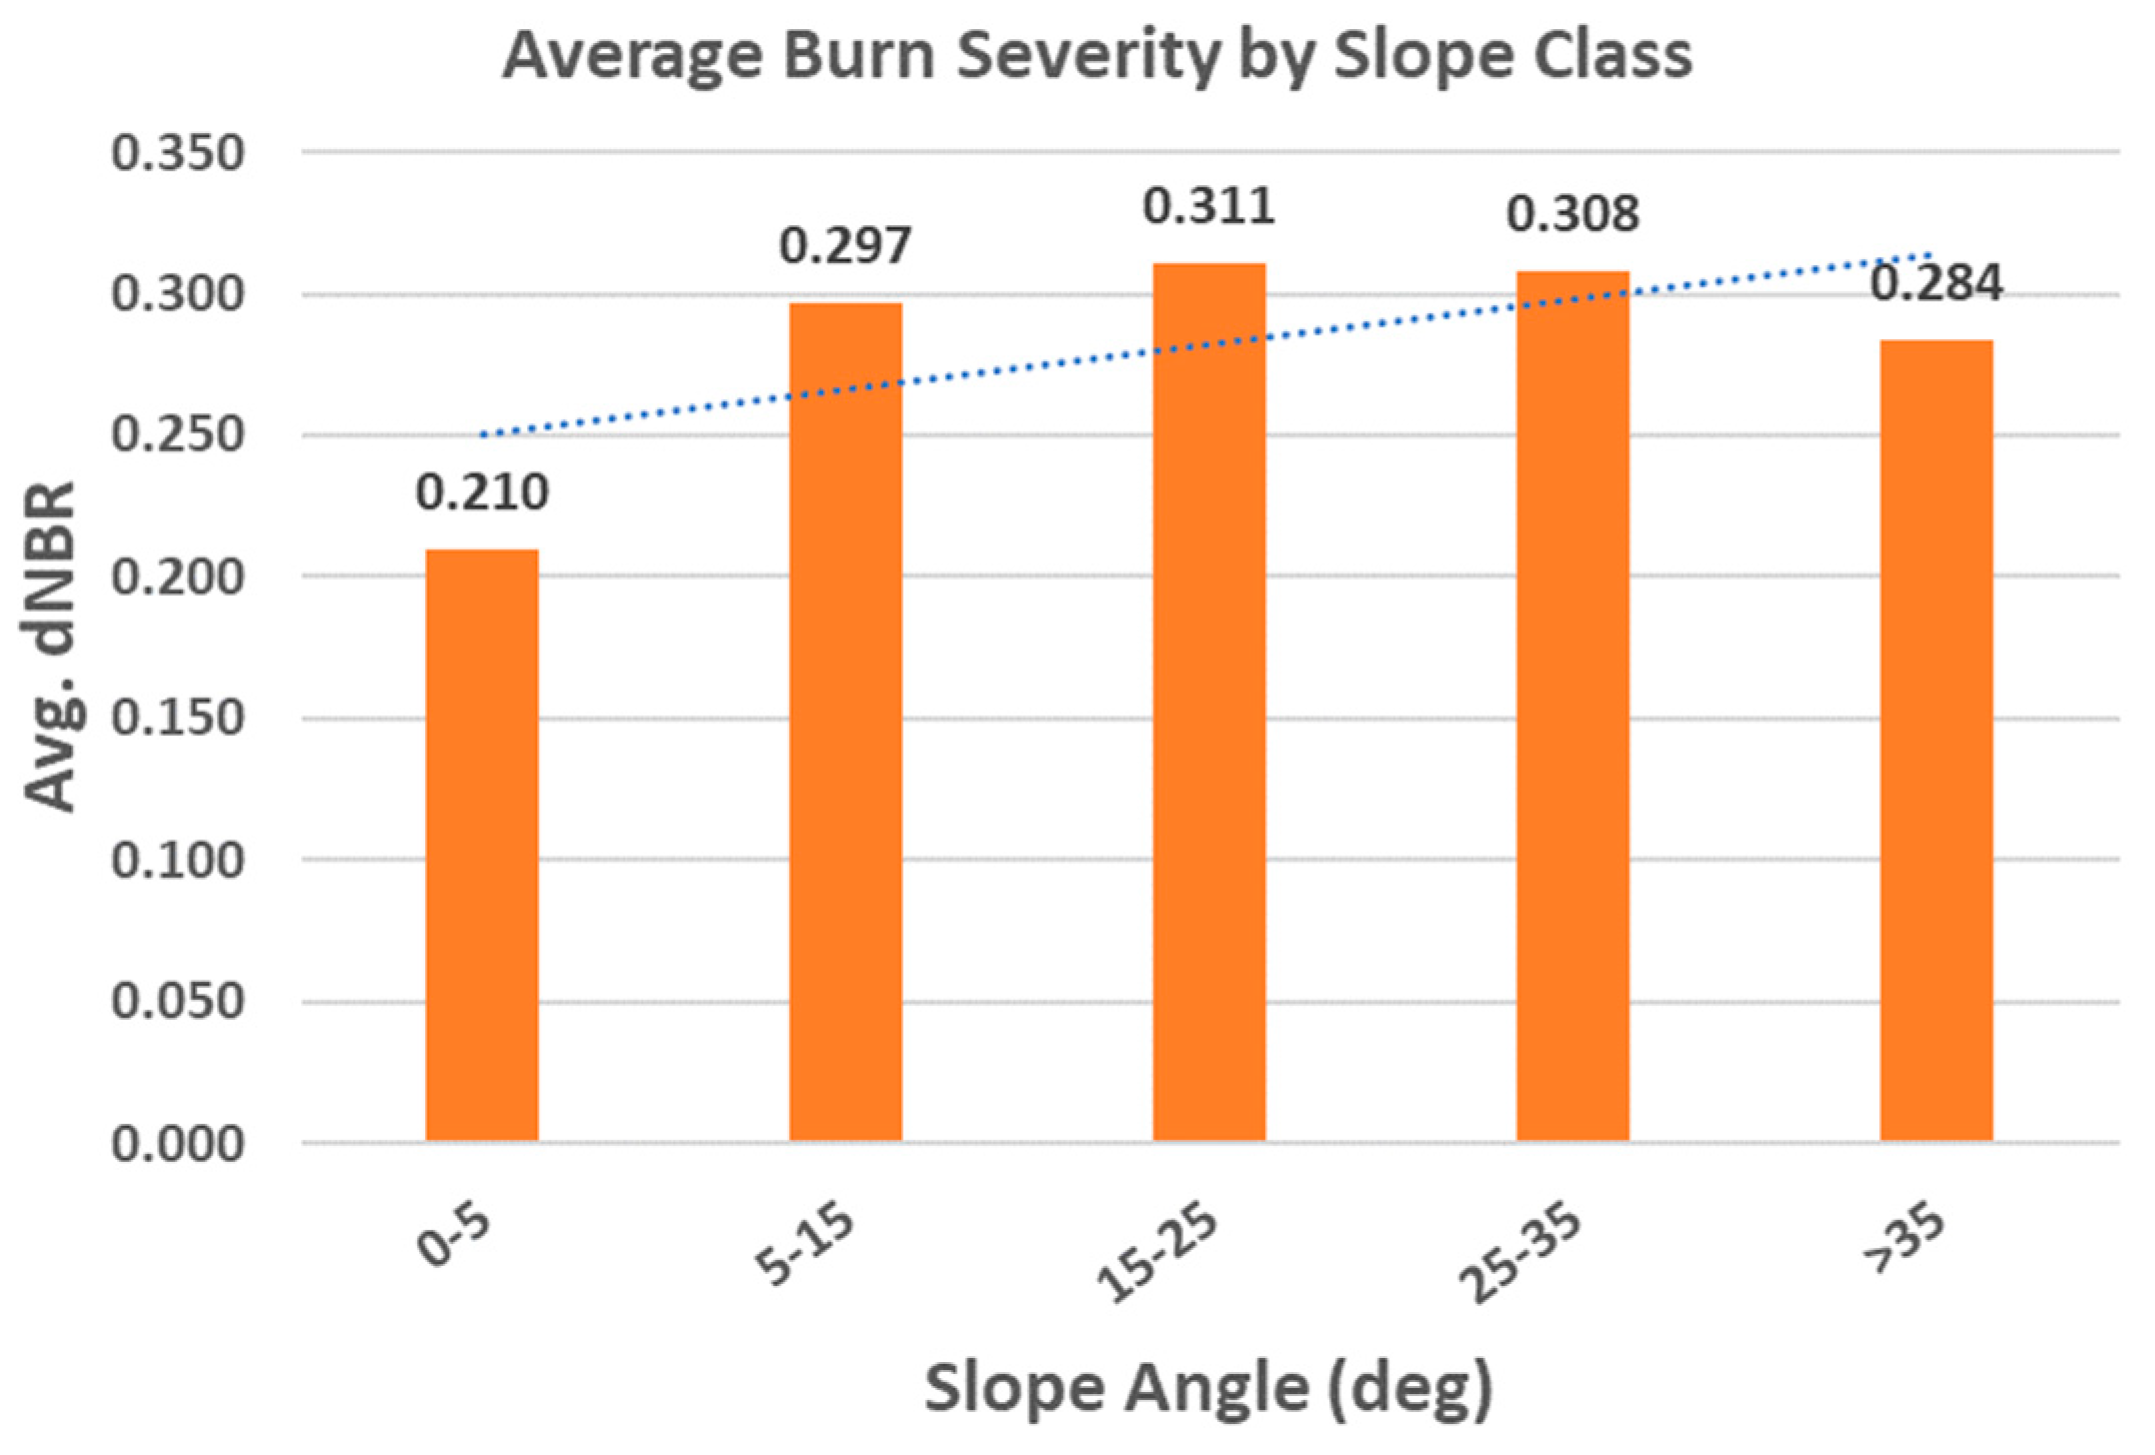
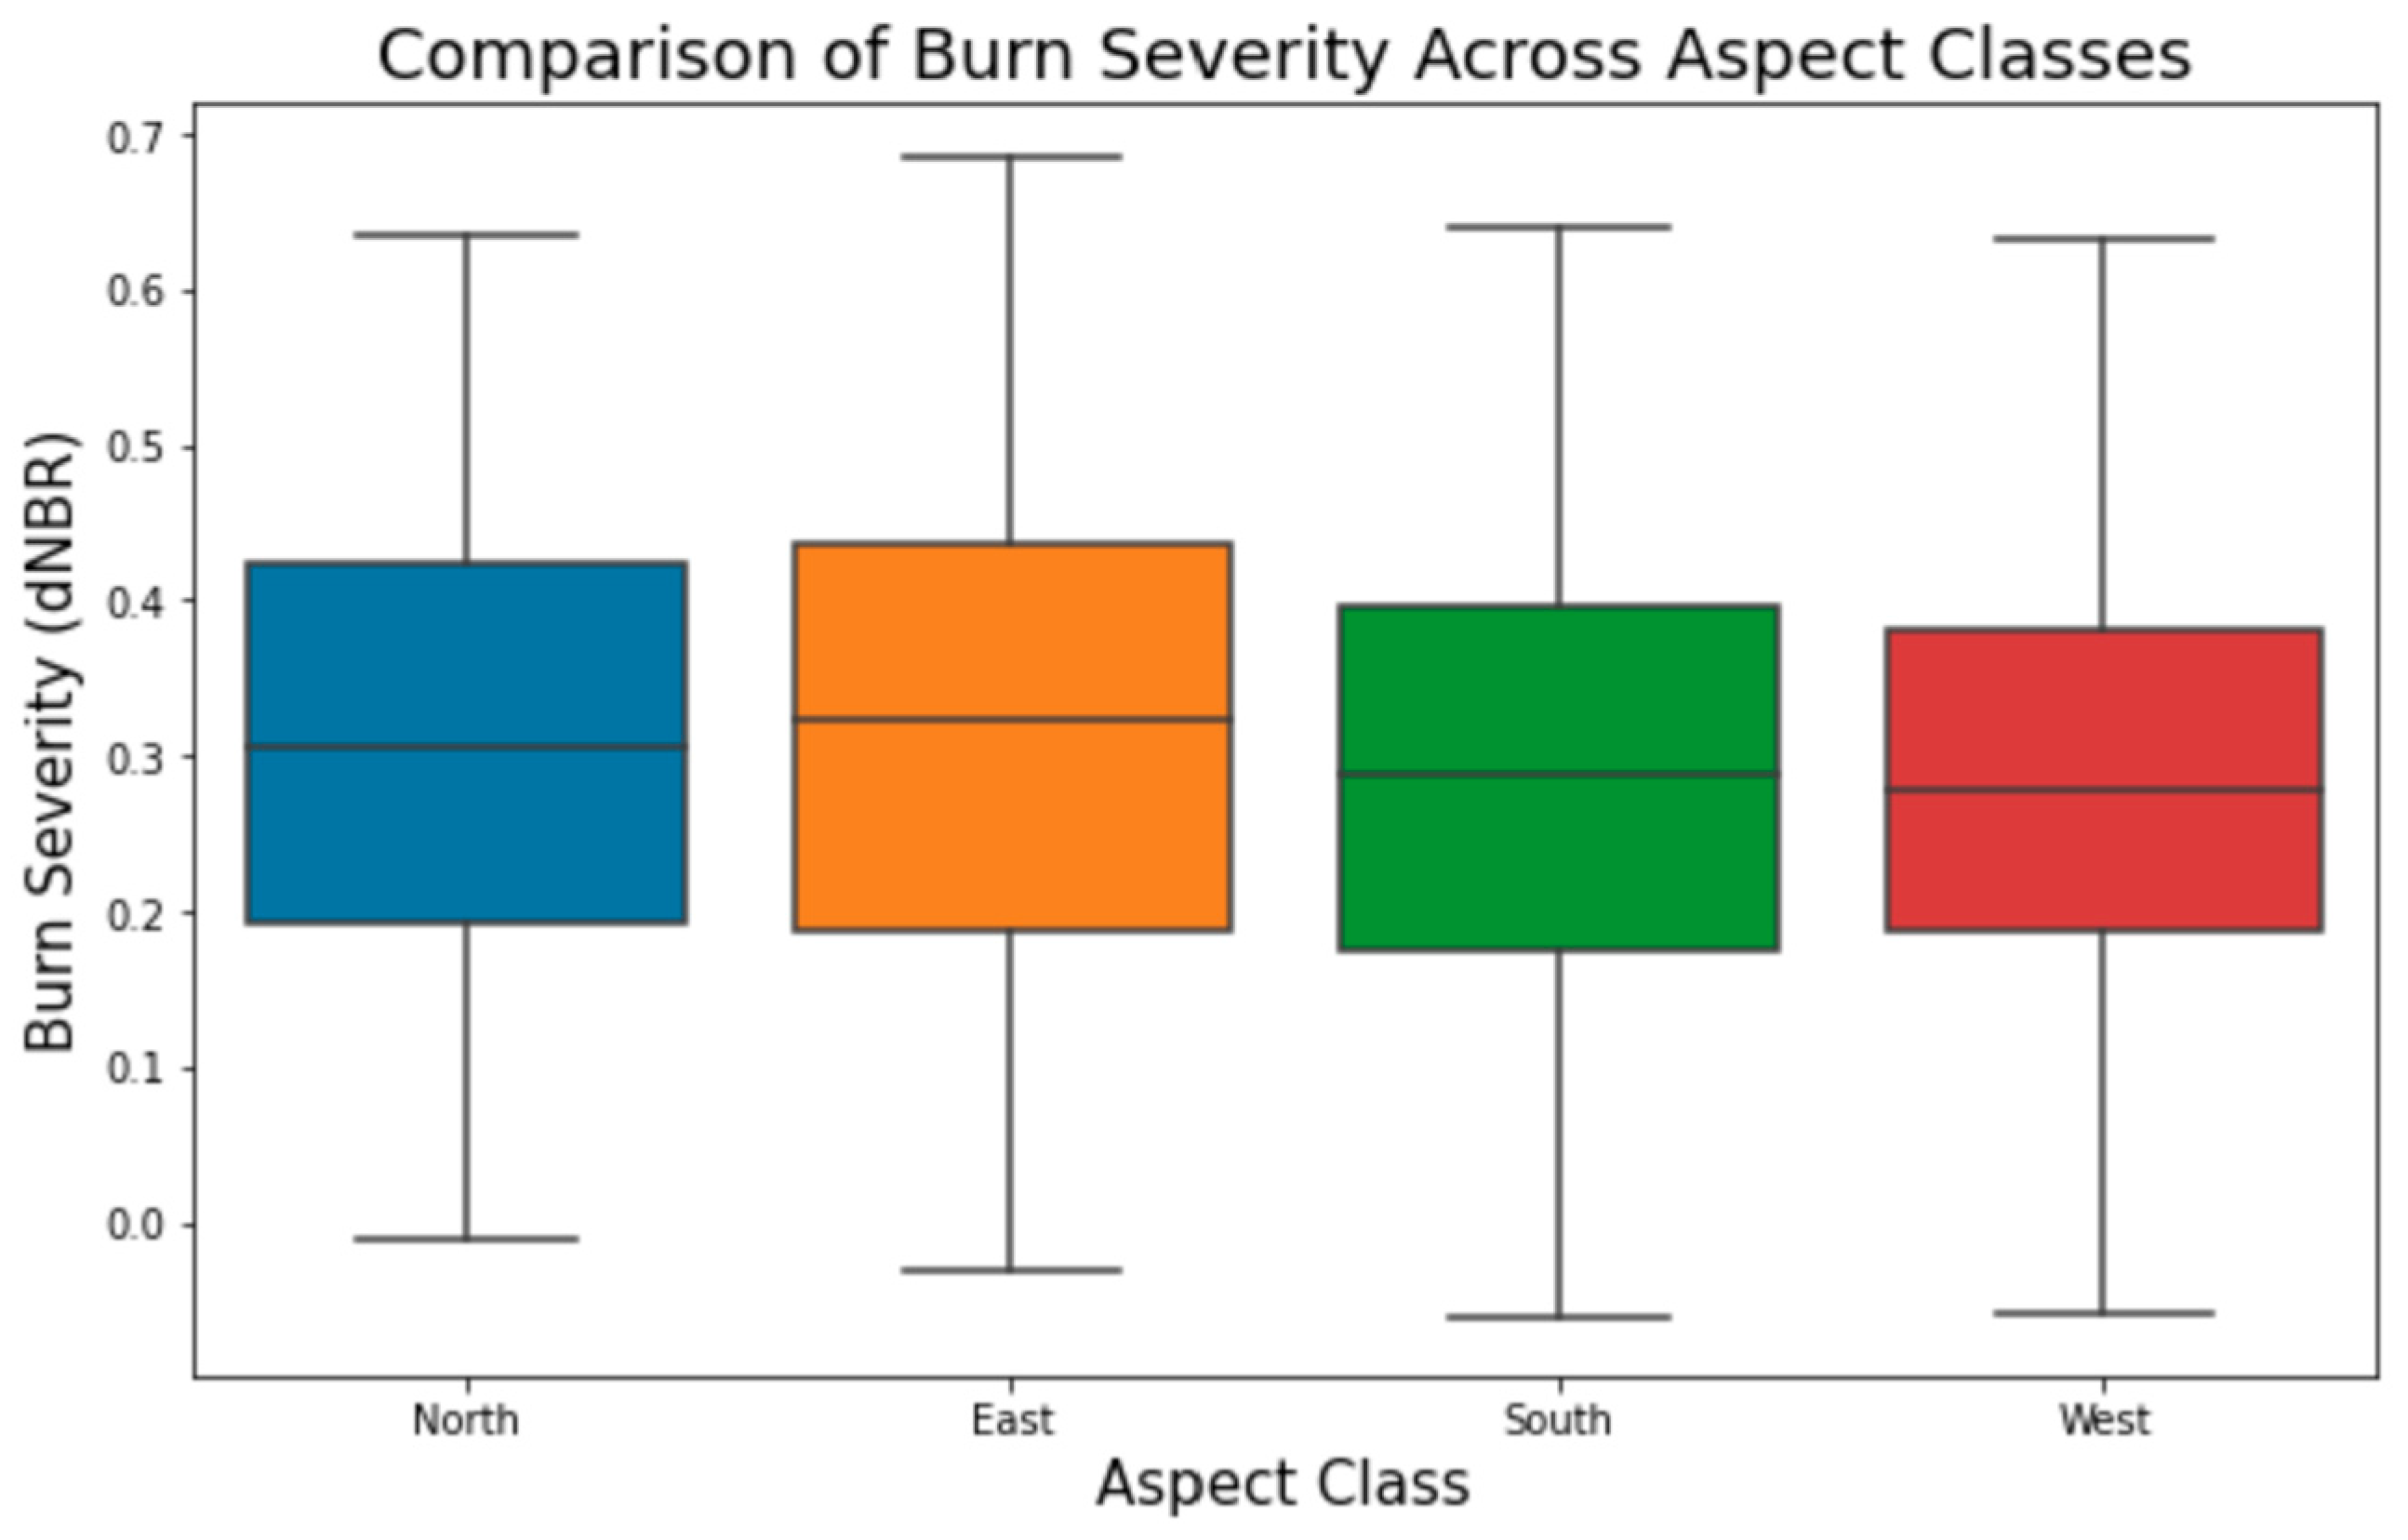
The effects of topography, slope, and aspect in the Dolan Fire region on the coast of the Santa Lucia Mountains were investigated in this study. A correlation between burn severity and slope found that while there is a statistically significant positive linear relationship between the variables, the strength of this relationship is weak (r = 0.111, p < 0.01). We quantified the relationship between burn severity and aspect and found that north- and east-facing slopes had the highest burn severity with an average dNBR of 0.304 and 0.310, respectively. This is similar to the findings of Carmo et al. [19] in the mountainous regions of northern Portugal. This finding is consistent with the fact that the fire originated in the northwestern area of the fire perimeter and winds drove the fire progression in the southeast direction. Additionally, the presence of intermediate slopes and types of vegetation which populate these locations played a role in the resulting burn severity values.
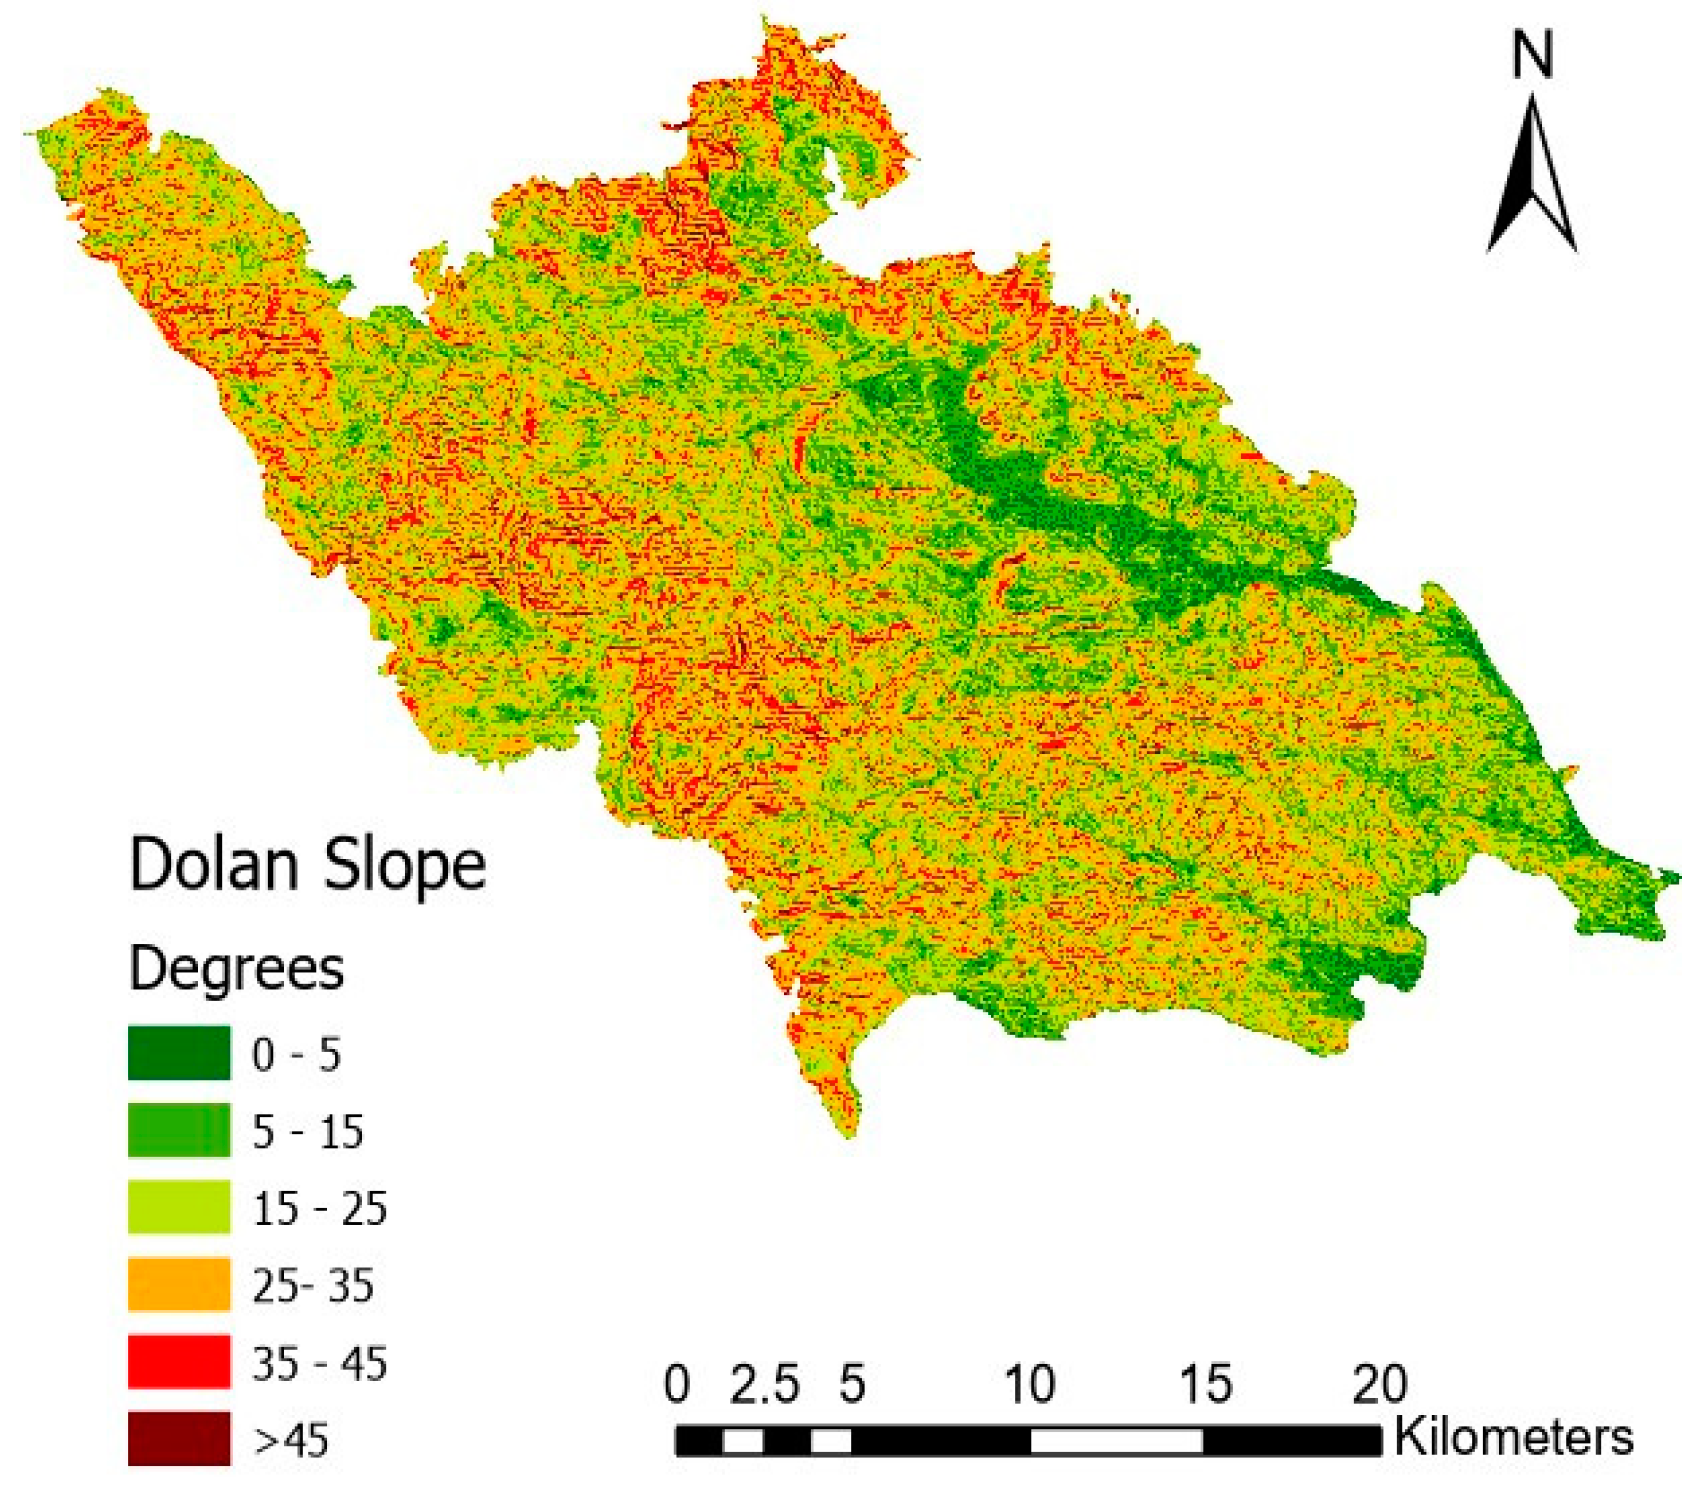
According to the Unites States Department of Agriculture’s Area Terrain Ruggedness Index, the Dolan Fire region is classified in highest class named “Extremely rugged” [50]. In an area of such abnormal terrain, we begin to question its effect on the results of this study. The wide variation in elevation, coupled with its resulting effects on other environmental factors, may play a bigger role in burn severity and wildfire spread, perhaps a bigger role than what can be drawn out in statistics of currently available data.

4.3. Weather and Climate

The dry, warm summers found in Mediterranean climates have been a catalyst for wildfire throughout the history of California. The Dolan Fire was an anthropogenically ignited fire, thus limiting the impact of temperature data for fire ignition risk purposes. However, based on previous studies performed by Gutierrez et al. [9] and Crockett and Westerling, [51], changes in temperature can strongly influence the occurrence and spread of wildfire. The temperature changes seen in 
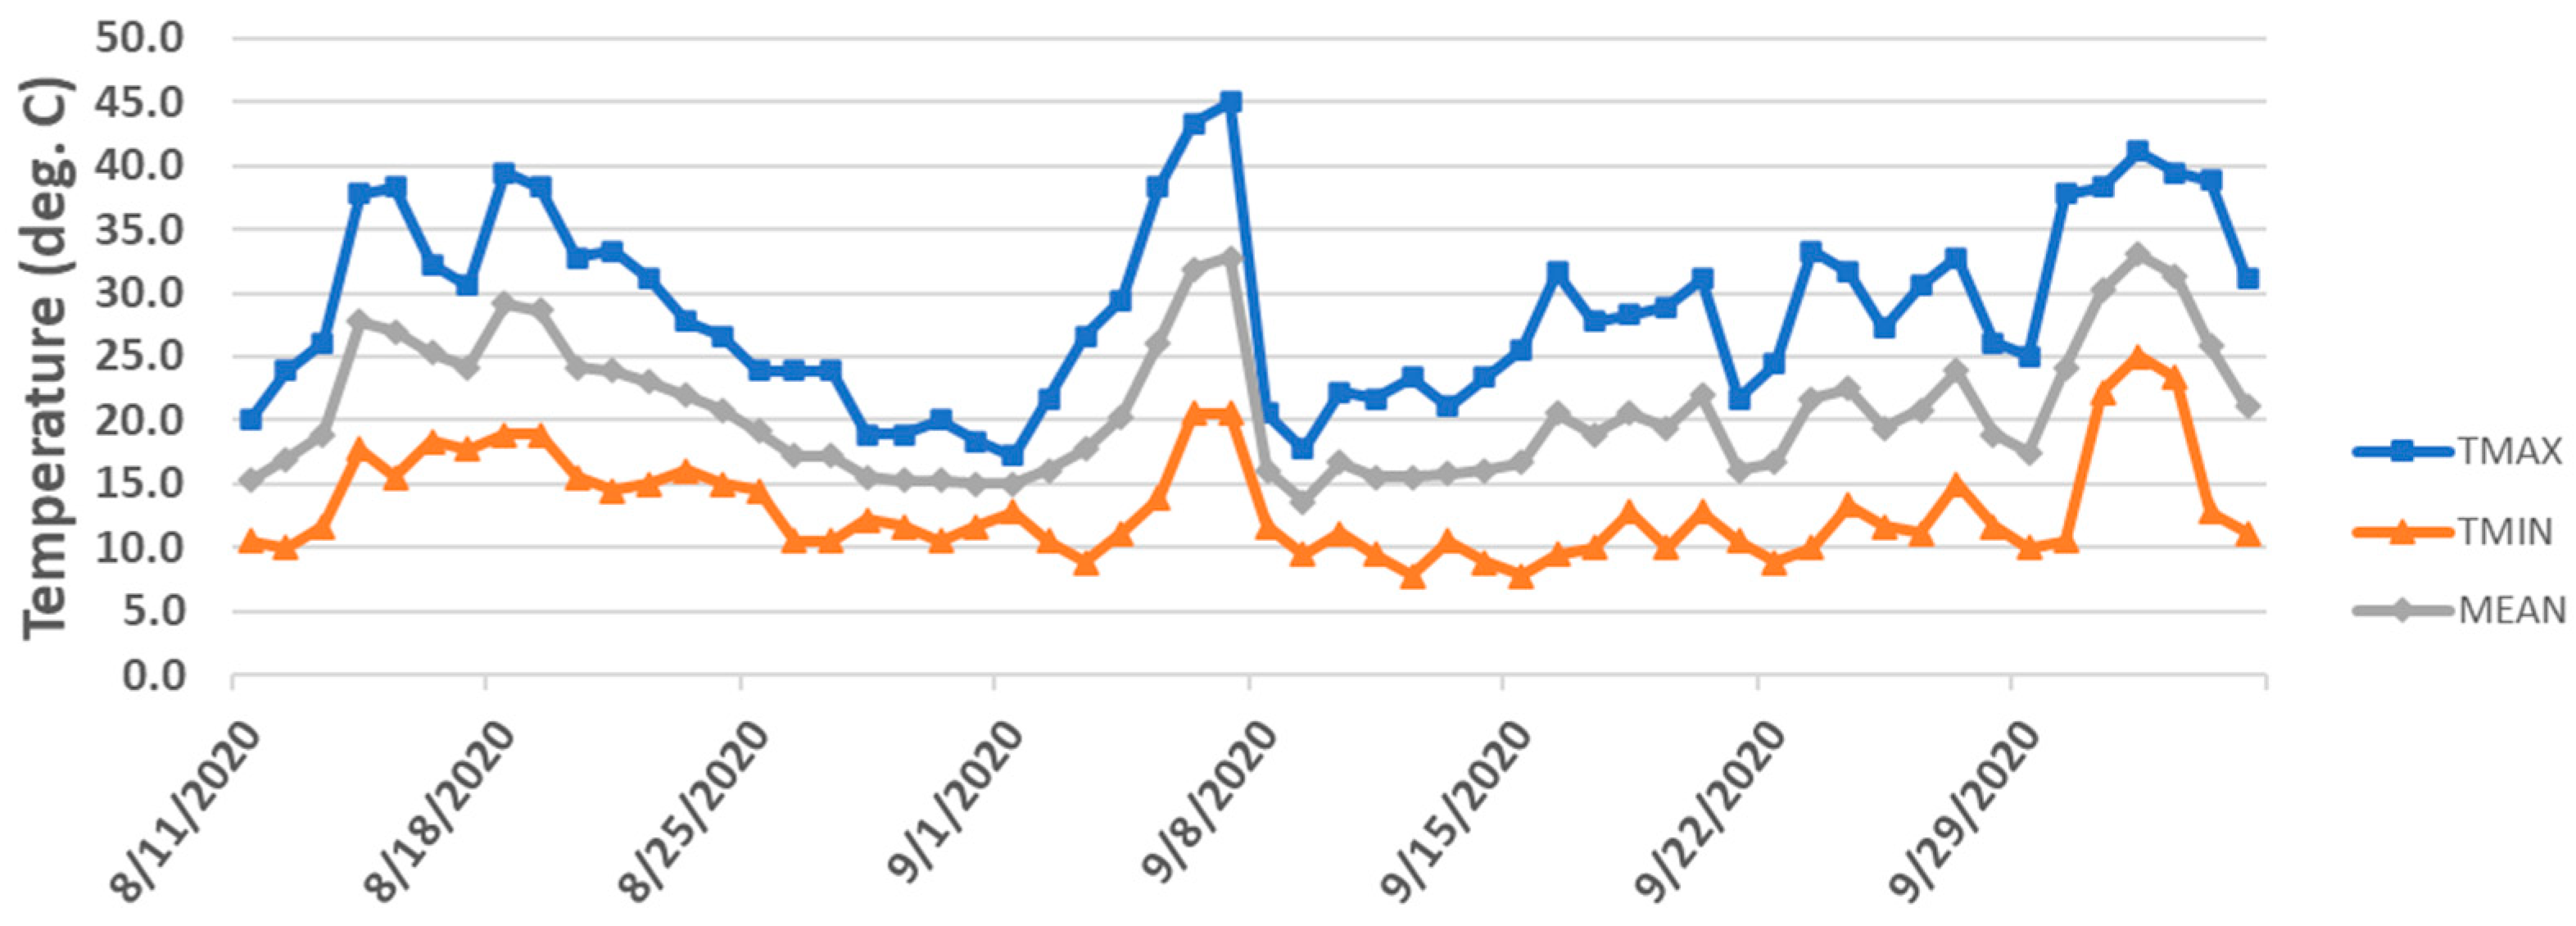
Figure 4 indicate a remarkable increase in temperature. Over the week leading up to the fire ignition on 18 August 2020, daily mean temperatures rose by 15 °C, reaching a daily maximum temperature of 40 °C (104 °F) on the day of ignition. There was a remarkable increase in the area burned and dNBR between the timestamps of 3 September to 19 September 2020. At the 16-day temporal resolution of Landsat, it is difficult to be conclusive about when rate of spread increased; however, we can use the evidence available to create plausible implications on what may have driven such a change in wildfire spread. During the week from 1 September to 8 September 2020, daily mean temperatures increased by 18 °C, reaching a blistering maximum daily temperature of 45 °C (113 °F) on 8 September. Based on the previous studies by Gutierrez et al. [9] and massive increases in temperate seen in the data, we have come to believe that temperature played a key role in fire spread rates and burn severity.
With the fire being ignited anthropogenically, we cannot say that drought had an impact on fire ignition. Furthermore, drought is not believed to have had any impact on fire spread and burn severity considering that the Dolan Fire region did not experience any level of drought from 14 April 2020 to 24 November 2020. Even when there was a recordable drought event in the study area, the EDDI rarely exceeded the abnormally dry (D0) category. Although there was very little precipitation, less than 1 cm, from August to October 2020, the drought index remains in a state of no drought. This may be due to water storage from previous months of precipitation and/or proximity to the coastline.
Wind speed and direction data seen in Figure 10 were consistent with the general direction of spread seen in the burn severity time series maps (Figure 6). The Anderson FBFM13 test conditions for the flame height and rate of spread were met; all five compass directions (including flat) between the north and west (azimuth 270 to 360) had average wind speeds greater than 2.24 m/s. However, previous studies in northern coastal California by Huang et al. [11] showed that wind speed is of great importance in wet climates relative to other climate conditions, such as warm, cool, and dry. With that said, while the wind speed and direction are important to wildfire spread, we do not have conclusive evidence to suggest it is of great importance in the determination of burn severity for the dry climate found during the time of the Dolan Fire. Additionally, correlation analysis was unsuccessful in determining a significant correlation between wind speed and burn severity.

4.4. Broader Impacts

Carbon emissions caused by wildfires experienced a sharp increase in 2020. The impact that such fires have on global warming sustained by the resulting increase in carbon dioxide emissions cannot be ignored [52]. Carbon emission models in California estimate that 106.7 million metric tons of carbon dioxide was emitted into the atmosphere solely due to wildfire in 2020. This was by far the most carbon emitted by wildfire on record for the state and more than a 2200% increase from the year prior [53]. The CARB emissions model uses GIS format data on fire perimeters, alarm and containment dates, natural vegetation fuel type (fuel component size class), fuel loads (tons/acre), fuel moisture, and burn severity. Burn severity is a key factor in estimating carbon emissions due to wildfire. A study of the Black Dragon Fire in the Boreal Forest of China estimated that nearly 1.3 million hectares burned and 52% of that area burned with high severity. The emitted carbon dioxide equivalents (CO2e), accounted for approximately 10% of the total fossil fuel emissions from China in 1987 and released 160% of China’s annual CO2e [54]. Upon further calculation of the data acquired from this study, it was found that fuels that resulted in high-severity burns released over 150% more carbon per acre than fuels that burned at moderate severity. More accurate and available wildfire emissions models can be used to improve future climate models and increase the understanding of global climate change. These estimates further stress the importance of burn severity classifications in carbon emission estimations.
The undeniable situation of global warming and the increase in extreme weather events has left many areas of the world facing the challenge of wildfires. They are dangerous in several ways to plants, animals, humans, and the environment they live in. For these reasons, wildfire burn severity mitigation strategies, management, and adaptation are imperative to help local communities reduce the negative impact that wildfires have on their lives. This study can help communities identify areas that are at risk of increased burn severity and aid in the development of mitigation strategies and policies to reduce the effect of future wildland fire events. Furthermore, the predictive capabilities that burn severity data could add to fuel models may be used in a simulated environment similar to the one used in Sakellariou et al. [55] to improve model accuracy. This study highlighted that weather, topographic, and fuel conditions have an association with burn severity and wildfire spread patterns. For instance, construction planners could avoid placing structures uphill from vegetation prone to high dead fuel load or utilize important proactive measures such as fuel breaks to impede the progress of fire in areas with increased risk of high fire severity [56].

5. Conclusions

Burn severity can be mapped over time to provide valuable insight into risk factors leading to wildfire spread. However, the limited temporal resolution of the Landsat satellite imagery used in this study (16 days) does not allow making accurate conclusions. Ideally, we would have liked to count with twice daily or better resolution dNBR data to better analyze the spread patterns of wildfire and how different environmental factors impact fire progression. Nevertheless, wind rose plots show that the general wind speed and direction in the region were consistent with the general direction of fire spread. While the date of 5 October 2020 has the highest average dNBR of all the dates available with a value of 0.323, it may not necessarily be an inflection point. Instead, it may be the time in which the burn severity has reached an equilibrium, where the fire is no longer spreading and beginning to calm down after it has been two months since ignition. Unfortunately, a lack in the literature on this subject does not allow for confirmation or rejection of these suspicions.
We found that intermediate slopes (15–35°) were more prone to high-severity burns. We believe the cause for this may be the preheating of fire fuels at higher elevations on a slope and the population of fire-prone fuel types in these intermediate slope areas. Burn severity was higher on the north- and east-facing slopes while being lower on south- and west-facing slopes. With at least twice-daily temporal resolution, spread patterns could be analyzed to show in which direction the fire is progressing at different times, giving more explanation as to why certain aspects burned at higher severity than others.
This study provides useful information that can be used to create mitigation strategies related to environmental factors to reduce wildfire risk, spread, and burn severity. Factors such as temperature, topography, and others influence not only burn severity but also flame height and spread rate. The Anderson system appears to define the flame height and spread rate without considering these variables, indicating a notable weakness in the system. The findings of this study could serve to add value to the Anderson FBFM13 and similar models, such as the Scott and Burgan 40 Fire Behavior Fuel Models, by being used as a metric to analyze post-fire characteristics for different fuel types [57]. In conclusion, the interconnected factors (wind speed, fuel type, slope, aspect, and others not investigated in this study) would need to be considered together rather than individually to better understand their effects on burn severity. Future studies can utilize this method along with higher temporal resolution imagery (e.g., Sentinel-2 has 10-day resolution) in similar Mediterranean coastal mountain regions to better understand the mechanisms driving burn severity. Additionally, future work could investigate burn severity in areas of different ruggedness index scores to see how wildfire characteristics are affected by terrain variability.

Author Contributions

Conceptualization, I.O. and K.B.; methodology, I.O., A.M.M.-N., and K.B.; software, I.O.; validation, I.O., A.M.M.-N., and K.B.; formal analysis, I.O.; investigation, I.O.; resources, I.O.; data curation, I.O.; writing—original draft preparation, I.O.; writing—review and editing, I.O., A.M.M.-N., and K.B.; visualization, I.O.; supervision, A.M.M.-N. and K.B.; project administration, A.M.M.-N. and K.B.; funding acquisition, A.M.M.-N. and K.B. All authors have read and agreed to the published version of the manuscript.

Funding

This work was sponsored by NASA grants 80NSSC19M0194 and 80NSSC22K1797. The views and conclusions contained herein are those of the authors and should not be interpreted as necessarily the official policies or endorsements, either expressed or implied, of NASA or the U.S. Government.

Data Availability Statement

The satellite imagery was accessed from the USGS Earth Explorer data repository on 23 October 2021, which can be found at https://earthexplorer.usgs.gov/. LANDFIRE fuel map data was accessed on 28 October 2021 from https://www.landfire.gov/viewer/. Weather data was accessed on 10 July 2022, which can be found at https://www.wunderground.com/, https://mrcc.purdue.edu/CLIMATE/, and www.loc.gov/item/lcwaN0014288/. ASTER Digital Elevation Model data was accsed on 19 September 2022 from the NASA EathData repository and can be found at https://www.earthdata.nasa.gov/sensors/aster.

Acknowledgments

We, the authors, would like to express our sincere gratitude to the University of Texas at San Antonio (UTSA) and the NASA Center for Advanced Measurements in Extreme Environments for their support, which made this research possible. We thank two anonymous reviewers for their comments that helped improve the paper.

Conflicts of Interest

The authors declare there are no conflicts of interest.

Appendix A. Topography and Associated Parameters

Figure A1. Topography of the surface of the Dolan Fire region sourced from the ASTER Digital Elevation Model (DEM) Product [28]. The grey colored portions indicate areas at or near maximum elevation of 1781 m.
Remotesensing 16 01693 g0a1
Figure A2. Slope raster depicting areas within the Dolan Fire perimeter characterized by slopes ranging from 0 to 45 degrees or higher.
Remotesensing 16 01693 g0a2
Figure A3. Aspect raster illustrating the flat areas and four cardinal directions in which the slopes are facing within the perimeter of the Dolan Fire.
Remotesensing 16 01693 g0a3
Figure A4. Boxplot showing the distribution of burn severity values among the aspect classes. Note that the “flat” aspect class was removed during the random sampling due to the small count of “flat” pixels in the aspect raster.
Remotesensing 16 01693 g0a4

Appendix B. Burn Severity and Fuel Model Statistics

Figure A5. Correlation plot depicting the relationship between average burn severity and the dead fuel load metric derived from the 13 Anderson Fire Behavior Fuel Models within the Dolan Fire region.
Remotesensing 16 01693 g0a5
Figure A6. Boxplot detailing the data distribution of the dNBR values of each fuel type class. The diamond symbols are indications of outliers in the data.
Remotesensing 16 01693 g0a6
Table A1. Pearson correlation coefficients (r) and corresponding p-values for each fuel model metric within the Dolan Fire region, indicating their correlation with burn severity values.
Fuel MetricCorrelation Coefficient (r)p-Value
Dead Fuel Load0.9220.03
Flame Height0.4070.49
Spread rate−0.0470.93
Bed Depth−0.1320.83

References

  1. National Interagency Fire Center. Total Wildland Fires and Acres (1983–2022). Available online: https://www.nifc.gov/fire-information/statistics/wildfires (accessed on 17 November 2023).
  2. Westerling, A.L.; Hidalgo, H.G.; Cayan, D.R.; Swetnam, T.W. Warming and earlier spring increase western US forest wildfire activity. Science 2006, 313, 940–943. [Google Scholar] [CrossRef] [PubMed]
  3. Abatzoglou, J.T.; Williams, A.P. Impact of anthropogenic climate change on wildfire across western US forests. Proc. Natl. Acad. Sci. USA 2016, 113, 11770–11775. [Google Scholar] [CrossRef] [PubMed]
  4. Junghenn Noyes, K.T.; Kahn, R.A.; Limbacher, J.A.; Li, Z.; Fenn, M.A.; Giles, D.M.; Hair, J.W.; Katich, J.M.; Moore, R.H.; Robinson, C.E. Wildfire smoke particle properties and evolution, from space-based multi-angle imaging II: The Williams Flats Fire during the FIREX-AQ Campaign. Remote Sens. 2020, 12, 3823. [Google Scholar] [CrossRef]
  5. Cho, C.; Kim, S.-W.; Choi, W.; Kim, M.-H. Significant light absorption of brown carbon during the 2020 California wildfires. Sci. Total Environ. 2022, 813, 152453. [Google Scholar] [CrossRef] [PubMed]
  6. Moreira, F.; Ascoli, D.; Safford, H.; Adams, M.A.; Moreno, J.M.; Pereira, J.M.; Catry, F.X.; Armesto, J.; Bond, W.; González, M.E. Wildfire management in Mediterranean-type regions: Paradigm change needed. Environ. Res. Lett. 2020, 15, 011001. [Google Scholar] [CrossRef]
  7. Anderson, H.E. Aids to Determining Fuel Models for Estimating Fire Behavior; US Department of Agriculture, Forest Service, Intermountain Forest and Range: US Department of Agriculture, Forest Service, Intermountain Forest and Range Experiment Station: Ogden, UT, USA, 1981; Volume 122.
  8. Moreno, M.; Malamud, B.; Chuvieco, E. Wildfire frequency-area statistics in Spain. Procedia Environ. Sci. 2011, 7, 182–187. [Google Scholar] [CrossRef]
  9. Gutierrez, A.A.; Hantson, S.; Langenbrunner, B.; Chen, B.; Jin, Y.; Goulden, M.L.; Randerson, J.T. Wildfire response to changing daily temperature extremes in California’s Sierra Nevada. Sci. Adv. 2021, 7, eabe6417. [Google Scholar] [CrossRef] [PubMed]
  10. Malandra, F.; Vitali, A.; Morresi, D.; Garbarino, M.; Foster, D.E.; Stephens, S.L.; Urbinati, C. Burn Severity Drivers in Italian Large Wildfires. Fire 2022, 5, 180. [Google Scholar] [CrossRef]
  11. Huang, Y.; Jin, Y.; Schwartz, M.W.; Thorne, J.H. Intensified burn severity in California’s northern coastal mountains by drier climatic condition. Environ. Res. Lett. 2020, 15, 104033. [Google Scholar] [CrossRef]
  12. Xanthopoulos, G.; Athanasiou, M. Crown fire. In Encyclopedia of Wildfires and Wildland-Urban Interface (Wui) Fires; Springer: Berlin/Heidelberg, Germany, 2020; pp. 183–197. [Google Scholar]
  13. Bhaganagar, K.; Bhimireddy, S.R. Numerical investigation of starting turbulent buoyant plumes released in neutral atmosphere. J. Fluid Mech. 2020, 900, A32. [Google Scholar] [CrossRef]
  14. Forthofer, J.M. Modeling Wind in Complex Terrain for Use in Fire Spread Prediction. Master’s Thesis, Colorado State University, Fort Collins, CO, USA, 2007. [Google Scholar]
  15. Bhimireddy, S.R.; Bhaganagar, K. Implementing a new formulation in WRF-LES for Buoyant Plume Simulations: bPlume-WRF-LES model. Mon. Weather. Rev. 2021, 149, 2299–2319. [Google Scholar] [CrossRef]
  16. Bonsor, K. How Wildfires Work. Available online: https://science.howstuffworks.com/nature/natural-disasters/wildfire.htm (accessed on 12 November 2023).
  17. Povak, N.A.; Hessburg, P.F.; Salter, R.B. Evidence for scale-dependent topographic controls on wildfire spread. Ecosphere 2018, 9, e02443. [Google Scholar] [CrossRef]
  18. Rothermel, R.C. How to Predict the Spread and Intensity of Forest and Range Fires; US Department of Agriculture, Forest Service, Intermountain Forest and Range; US Department of Agriculture, Forest Service, Intermountain Forest and Range Experiment Station: Ogden, UT, USA, 1983; Volume 143.
  19. Carmo, M.; Moreira, F.; Casimiro, P.; Vaz, P. Land use and topography influences on wildfire occurrence in northern Portugal. Landsc. Urban Plan. 2011, 100, 169–176. [Google Scholar] [CrossRef]
  20. Carvajal-Ramírez, F.; Marques da Silva, J.R.; Agüera-Vega, F.; Martínez-Carricondo, P.; Serrano, J.; Moral, F.J. Evaluation of fire severity indices based on pre-and post-fire multispectral imagery sensed from UAV. Remote Sens. 2019, 11, 993. [Google Scholar] [CrossRef]
  21. Finco, M.; Quayle, B.; Zhang, Y.; Lecker, J.; Megown, K.A.; Brewer, C.K. Monitoring trends and burn severity (MTBS): Monitoring wildfire activity for the past quarter century using Landsat data. In Proceedings of the Moving from Status to Trends: Forest Inventory and Analysis (FIA) Symposium 2012, Baltimore, MD, USA, 4–6 December 2012; pp. 4–6. [Google Scholar]
  22. Kolden, C.A.; Smith, A.M.; Abatzoglou, J.T. Limitations and utilisation of Monitoring Trends in Burn Severity products for assessing wildfire severity in the USA. Int. J. Wildland Fire 2015, 24, 1023–1028. [Google Scholar] [CrossRef]
  23. Cai, L.; Wang, M. Is the RdNBR a better estimator of wildfire burn severity than the dNBR? A discussion and case study in southeast China. Geocarto Int. 2022, 37, 758–772. [Google Scholar] [CrossRef]
  24. Smith, C.W.; Panda, S.K.; Bhatt, U.S.; Meyer, F.J.; Badola, A.; Hrobak, J.L. Assessing wildfire burn severity and its relationship with environmental factors: A case study in interior Alaska Boreal Forest. Remote Sens. 2021, 13, 1966. [Google Scholar] [CrossRef]
  25. Pasquini, C. Near infrared spectroscopy: Fundamentals, practical aspects and analytical applications. J. Braz. Chem. Soc. 2003, 14, 198–219. [Google Scholar] [CrossRef]
  26. Lang, J.; Wang, Y.; Xiao, X.; Zhuang, X.; Wang, S.; Liu, J.; Wang, J. Study on shortwave infrared long-distance imaging performance based on multiband imaging experiments. Opt. Eng. 2013, 52, 045008. [Google Scholar]
  27. Landsat-8 Images Courtesy of the, U.S. Geological Survey. Available online: https://earthexplorer.usgs.gov/ (accessed on 23 October 2021).
  28. Advanced Spaceborne Thermal Emission and Reflection Radiometer Global Digital Elevation Map (ASTER GDEM). 1999; ASTER. Available online: https://www.earthdata.nasa.gov/sensors/aster (accessed on 19 September 2022).
  29. Transition to Annual Updates—LANDFIRE Update Version 2019 Limited (LF 2.1.0). 2020. Available online: https://landfire.gov/lf_limited.php (accessed on 28 October 2021).
  30. Monitoring Trends in Burn Severity (MTBS) MTBS Project, USDA Forest Service and US Geological Survey. Available online: http://mtbs.gov/ (accessed on 12 January 2022).
  31. Gridded Surface Meteorological (gridMET) Dataset. Lab, C., Ed. Available online: https://www.climatologylab.org/gridmet.html (accessed on 1 February 2024).
  32. The Weather Company. Weather Underground; The Weather Company: San Francisco, CA, USA, 1995. [Google Scholar]
  33. InciWeb. Dolan Fire Information. Available online: https://inciweb.nwcg.gov/incident/7018/ (accessed on 1 August 2022).
  34. Hiatt, C.; Fernandez, D.; Potter, C. Measurements of fog water deposition on the California Central Coast. Atmos. Clim. Sci. 2012, 2, 525. [Google Scholar] [CrossRef]
  35. U.S. Climate Data. Climate Big Sur—California. Available online: https://www.usclimatedata.com/climate/big-sur/california/united-states/usca2017 (accessed on 12 November 2023).
  36. LANDFIRE 2020 Update. Available online: https://landfire.gov/lf_220.php (accessed on 28 October 2021).
  37. Eidenshink, J.; Schwind, B.; Brewer, K.; Zhu, Z.-L.; Quayle, B.; Howard, S. A project for monitoring trends in burn severity. Fire Ecol. 2007, 3, 3–21. [Google Scholar] [CrossRef]
  38. Franco, M.G.; Mundo, I.A.; Veblen, T.T. Field-validated burn-severity mapping in North Patagonian forests. Remote Sens. 2020, 12, 214. [Google Scholar] [CrossRef]
  39. Key, C.H.; Benson, N.C. Measuring and remote sensing of burn severity. In Proceedings of the Joint Fire Science Conference and Workshop, Boise, ID, USA, 15–17 June 1999; p. 284. [Google Scholar]
  40. Beverly, J.L.; McLoughlin, N. Burn probability simulation and subsequent wildland fire activity in Alberta, Canada—Implications for risk assessment and strategic planning. For. Ecol. Manag. 2019, 451, 117490. [Google Scholar] [CrossRef]
  41. Amos, C.; Petropoulos, G.P.; Ferentinos, K.P. Determining the use of Sentinel-2A MSI for wildfire burning & severity detection. Int. J. Remote Sens. 2019, 40, 905–930. [Google Scholar]
  42. Wasser, L.; Cattau, M. Lesson 4. Work with the Difference Normalized Burn Index-Using Spectral Remote Sensing to Understand the Impacts of Fire on the Landscape. 2017. Available online: https://www.earthdatascience.org/courses/earth-analytics/multispectral-remote-sensing-modis/normalized-burn-index-dNBR/ (accessed on 27 February 2024).
  43. Acharya, T.D.; Yang, I. Exploring landsat 8. Int. J. IT Eng. Appl. Sci. Res. (IJIEASR) 2015, 4, 4–10. [Google Scholar]
  44. Escuin, S.; Navarro, R.; Fernández, P. Fire severity assessment by using NBR (Normalized Burn Ratio) and NDVI (Normalized Difference Vegetation Index) derived from LANDSAT TM/ETM images. Int. J. Remote Sens. 2008, 29, 1053–1073. [Google Scholar] [CrossRef]
  45. Rogers, C.F.; Hudson, J.G.; Zielinska, B.; Tanner, R.L.; Hallett, J.; Watson, J.G. Cloud condensation nuclei from biomass burning. In Global Biomass Burning: Atmospheric, Climatic, and Biospheric Implications; Levine, J.S., Ed.; The MIT Press: Cambridge, MA, USA, 1991; pp. 431–438. [Google Scholar]
  46. National Integrated Drought Information System (NIDIS). Available online: www.loc.gov/item/lcwaN0014288/ (accessed on 12 November 2023).
  47. Research Communications, University of Arizona. 7 Things You Didn’t Know about Wildfire. Available online: https://research.arizona.edu/stories/7-things-you-didnt-know-about-wildfire (accessed on 19 September 2022).
  48. Cavagnaro, D.; Delgado, N.; East, A.; Finnegan, N.; Kostelnik, J.; Lindsay, D.; McCoy, S.; Suter, I.; Thomas, M.; Winner, A. Variability in hydrologic response to rainfall across a burn scar: Observations from the Dolan Fire, California. In Proceedings of the AGU Fall Meeting 2021, New Orleans, LA, USA, 13–17 December 2021; p. H55W-1005. [Google Scholar]
  49. Li, C.; Handwerger, A.L.; Wang, J.; Yu, W.; Li, X.; Finnegan, N.J.; Xie, Y.; Buscarnera, G.; Horton, D.E. Augmentation of WRF-Hydro to simulate overland-flow-and streamflow-generated debris flow susceptibility in burn scars. Nat. Hazards Earth Syst. Sci. 2022, 22, 2317–2345. [Google Scholar] [CrossRef]
  50. Area and Road Ruggedness Scales. 2024. Available online: https://www.ers.usda.gov/data-products/area-and-road-ruggedness-scales/descriptions-and-maps/ (accessed on 15 January 2024).
  51. Crockett, J.L.; Westerling, A.L. Greater temperature and precipitation extremes intensify Western US droughts, wildfire severity, and Sierra Nevada tree mortality. J. Clim. 2018, 31, 341–354. [Google Scholar] [CrossRef]
  52. Nolde, M.; Plank, S.; Riedlinger, T. Utilization of hyperspectral remote sensing imagery for improving burnt area mapping accuracy. Remote Sens. 2021, 13, 5029. [Google Scholar] [CrossRef]
  53. California Air Resources Board. California Wildfire Emission Estimates. Available online: https://ww2.arb.ca.gov/wildfire-emissions (accessed on 16 April 2022).
  54. Xu, W.; He, H.S.; Hawbaker, T.J.; Zhu, Z.; Henne, P.D. Estimating burn severity and carbon emissions from a historic megafire in boreal forests of China. Sci. Total Environ. 2020, 716, 136534. [Google Scholar] [CrossRef]
  55. Sakellariou, S.; Sfougaris, A.; Christopoulou, O.; Tampekis, S. Integrated wildfire risk assessment of natural and anthropogenic ecosystems based on simulation modeling and remotely sensed data fusion. Int. J. Disaster Risk Reduct. 2022, 78, 103129. [Google Scholar] [CrossRef]
  56. Wang, H.-H.; Finney, M.A.; Song, Z.-L.; Wang, Z.-S.; Li, X.-C. Ecological techniques for wildfire mitigation: Two distinct fuelbreak approaches and their fusion. For. Ecol. Manag. 2021, 495, 119376. [Google Scholar] [CrossRef]
  57. Scott, J.H.; Burgan, R. A new set of standard fuel models for use with Rothermel’s spread model. In Proceedings of the 2nd International Wildland Fire Ecology and Fire Management Congress, Orlando, FL, USA, 16–20 November 2003. [Google Scholar]
Figure 1. Left panel: ESRI map of the western U.S. with state boundaries showing the Dolan Fire ignition site (red dot). Right panel: Dolan Fire boundary (yellow solid line), ignition site (red dot), and location of Cone Peak (black triangle) superimposed on a Landsat 8 image from 6 November 2020, with visible smoke clouds.
Remotesensing 16 01693 g001
Figure 2. Examples of (a) low-severity, (b) moderate-severity, and (c) high-severity burns on Araucaria Araucana evergreens caused by wildfire in the Patagonian Forests of Argentina [38].
Remotesensing 16 01693 g002
Figure 3. Anderson FBFM13 2020 remap of the pre-fire Dolan fire study area.
Remotesensing 16 01693 g003
Figure 4. Daily maximum (blue squares), minimum (grey diamonds), and mean daily temperature time series at Big Sur, California, weather station.
Remotesensing 16 01693 g004
Figure 5. Map of burn severity classification of the Dolan Fire. Burn severity classes: unburnt (dark green), low burn severity (light green), moderate burn severity (yellow), high burn severity (red) for 5 October 2020, relative to the pre-fire conditions on 2 August 2020.
Remotesensing 16 01693 g005
Figure 6. Burn severity progression of the Dolan fire between 18 August 2020 and 5 October 2020. This time series maps show the progression of burn severity as time from the pre-fire image increased. The red star indicates the reported ignition site location, unburnt vegetation (dark green), low burn severity (light green), moderate burn severity (yellow), high burn severity (red).
Remotesensing 16 01693 g006
Figure 7. Bar chart showing the percentage of land cover for each fuel type each by burn severity class.
Remotesensing 16 01693 g007
Figure 8. Average burn severity for each aspect class.
Remotesensing 16 01693 g008
Figure 9. Average burn severity for each slope class.
Remotesensing 16 01693 g009
Figure 10. Wind rose plot during the Dolan Fire spread.
Remotesensing 16 01693 g010
Figure 11. Fuel type percent cover at each slope class.
Remotesensing 16 01693 g011
Table 1. Data product names, descriptions, and resolution.
Product NameDescriptionResolution
Landsat-8 Collection 1Products in the near-infrared and shortwave infrared bands of the light spectrum [25,26,27]30 m
Advanced Spaceborne Thermal Emission and Reflection Radiometer (ASTER)Global Digital Elevation Map (GDEM) [28]30 m
Anderson 13 Fire Behavior Fuel ModelsAcquired from LANDFIRE, these fuel models provide geospatial and field data of the vegetation fire fuels [7,29]30 m
Monitoring Trends in Burn Severity (MTBS)Used to acquire accurate burn boundary polygons [30]30 m
Cli-MATE ToolsProvides historical wind speed and direction, temperature, and precipitation dataDaily/Hourly
Evaporative Demand Drought Index (EDDI)Provides weekly historical drought data for the United StatesWeekly
Weather Underground
Precipitation Data
Provides daily historical precipitation dataDaily/Monthly
Gridded Surface Meteorological (GridMET)Daily surface meteorological data covering the contiguous U.S. [31]Daily/4 km
Table 2. Landsat-8 Operational Land Imager and Thermal Infrared Sensor bands 1–7.
Band NumberDescriptionWavelengthResolution
Band 1Coastal/Aerosol0.433 to 0.453 µm30 m
Band 2Visible blue0.450 to 0.515 µm30 m
Band 3Visible green0.525 to 0.600 µm30 m
Band 4Visible red0.630 to 0.680 µm30 m
Band 5Near-infrared0.845 to 0.885 µm30 m
Band 6Short wavelength infrared1.56 to 1.66 µm30 m
Band 7Short wavelength infrared2.10 to 2.30 µm30 m
Table 3. Abbreviated names of fuel type names and their corresponding fuel metrics.
Fuel TypeFBFM13Dead Fuel Load (kg/m2)Flame Height (m)Spread Rate (m/h)Fuel Bed Depth (cm)
Grass with Timber/ShrubFBFM20.4481.8370430.48
Young BrushFBFM50.2241.2236260.96
Short Needle Timber LitterFBFM80.3360.30326.096
Long Needle Timber LitterFBFM90.6500.791516.096
Mature TimberFBFM100.6721.4615930.48
Table 4. Anderson 13 fuel models attribute and behaviors.
FBFM13Display Attribute, Fire Behavior 13 Fuel Model
FBFM2Burns fine; herbaceous fuels; stand is curing or dead; may produce firebrands on oak or pine stands
FBFM5Low-intensity fires; young, green shrubs with little dead material; fuels consist of Litter from understory
FBFM8Slow, ground-burning fires; closed canopy stands with Short-Needle conifers or hardwoods; Litter consist mainly of needles and leaves, with little undergrowth; occasional flares with concentrated fuels
FBFM9Longer flames; quicker surface fires; closed canopy stands of long needles or hardwoods; rolling leaves in fall can cause spotting; dead-down material can cause occasional crowning
FBFM10Surface and ground fire more intense; dead-down fuels more abundant; frequent crowning and spotting causing fire control to be more difficult
Table 5. The percentage land cover of each burn severity classification.
Burn Severity ClassificationPercent Cover (%)
Unburnt/Unchanged10
Low Severity31
Moderate Severity54
High Severity5
Table 6. Percent cover of each fuel type in the Dolan Fire perimeter.
Fuel TypePercent Cover (%)
Young Brush (FBFM5)37.3
Grass w/Timber/Shrub (FBFM2)11.3
Short Needle Timber Litter (FBFM8)11.6
Long Needle Timber Litter (FBFM9)16.9
Mature Timber (FBFM10)12.0
Table 7. Tabular wind rose data. Bolded values indicate wind speeds above the Anderson 13 fuel models testing conditions.
Range (m/s)NNNENEENEEESESESSESSSWSWWSWWWNWNWNNWTotal
1.5–1.81.60.90.90.93.12.110.40.10.511.10.711.22.419
1.8–3.63.10.90.40.21.131.40.30.10.61.32.45.64.53.85.333.8
3.6–5.850.400.20000.2000.10.21.15.63.14.21.716.7
5.85–8.55000000000000000.200.2
Total (%)5.11.81.51.14.25.12.60.70.21.32.44.611.88.69.39.469.7
Calm (<1.5) 30.3
Ave. Speed2.321.91.71.722.21.81.82.22.12.83.433.32.51.9
Disclaimer/Publisher’s Note: The statements, opinions and data contained in all publications are solely those of the individual author(s) and contributor(s) and not of MDPI and/or the editor(s). MDPI and/or the editor(s) disclaim responsibility for any injury to people or property resulting from any ideas, methods, instructions or products referred to in the content.

